DataFed and FASTNET Tools for Agile Air Quality Analysis Husar & Poirot.
Upload
molly-blakeCategory
view
219download
1
Spatial Pattern of 1-hour and 8-hour Daily Maximum Ozone over the OTAG Region
Rudolf B. Husar
CAPITA, Center for Air Pollution Impact and Trend AnalysisWashington University
St. Louis, Missouri

Average summertime daily maximum ozone concentration over the OTAG region

Cross sectional charts of average summertime daily maximum ozone concentration. a) South Dakota-New England. b) Kansas-Maryland
c) Texas-N. Florida d) North-South cross section Texas-North Dakota and Florida-E.Ohio

Spatial pattern of 10th percentile of daily maximum ozone

Spatial pattern of 90th percentile of daily maximum ozone

Spatial pattern of 50th percentile of daily maximum ozone

Spatial pattern of 90th-10th percentile difference . The figure illustrates that the largest ozone variability is in the vicinity of
metropolitan areas

Illustration of 8-hour moving average, 1-hour moving average ozone concentration for Hammond, IN
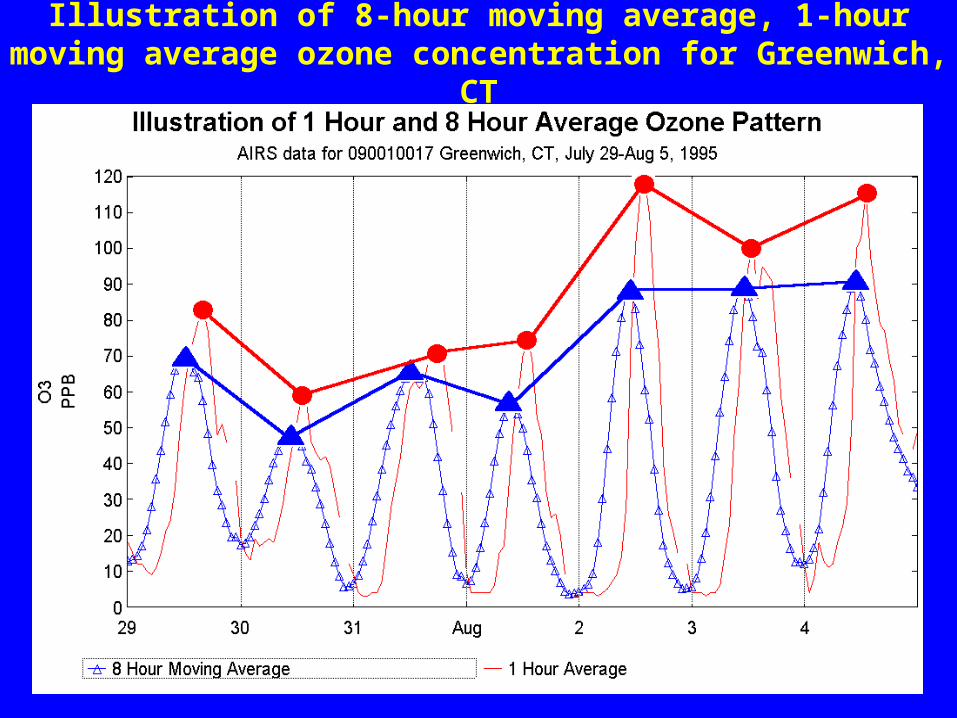
Illustration of 8-hour moving average, 1-hour moving average ozone concentration for Greenwich, CT

Illustration of 8-hour moving average, 1-hour moving average ozone concentration for Whiteface Mountain, NY
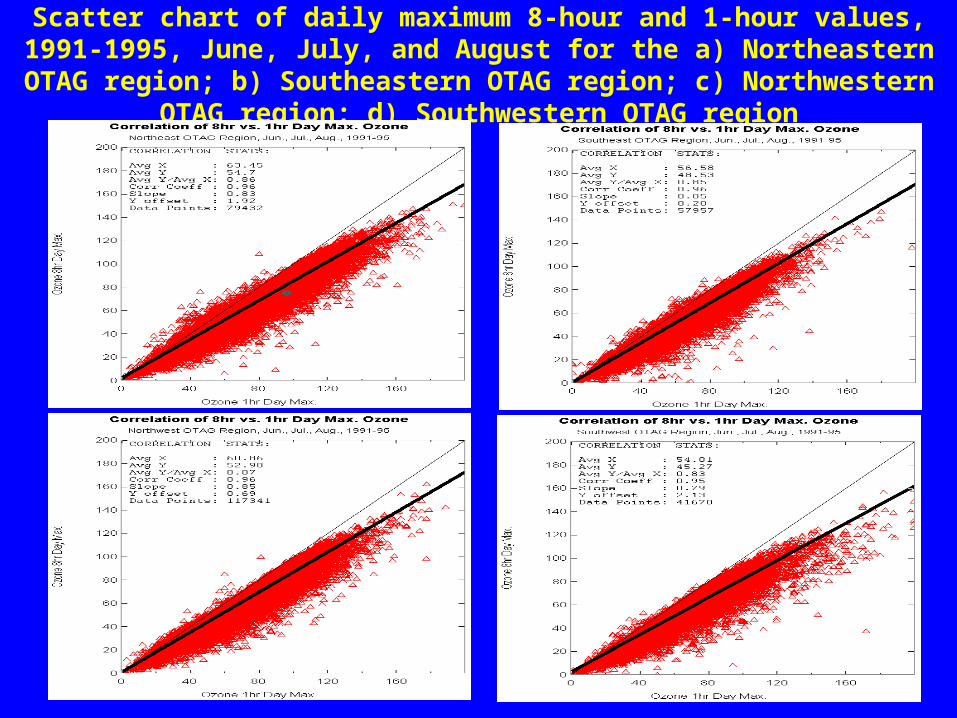
Scatter chart of daily maximum 8-hour and 1-hour values, 1991-1995, June, July, and August for the a) Northeastern OTAG region; b) Southeastern OTAG region;
c) Northwestern OTAG region; d) Southwestern OTAG region

Spatial pattern for a) 1-hour exceedances (>120 ppb) and b) 8-hour exceedances (>102 ppb) over the OTAG region
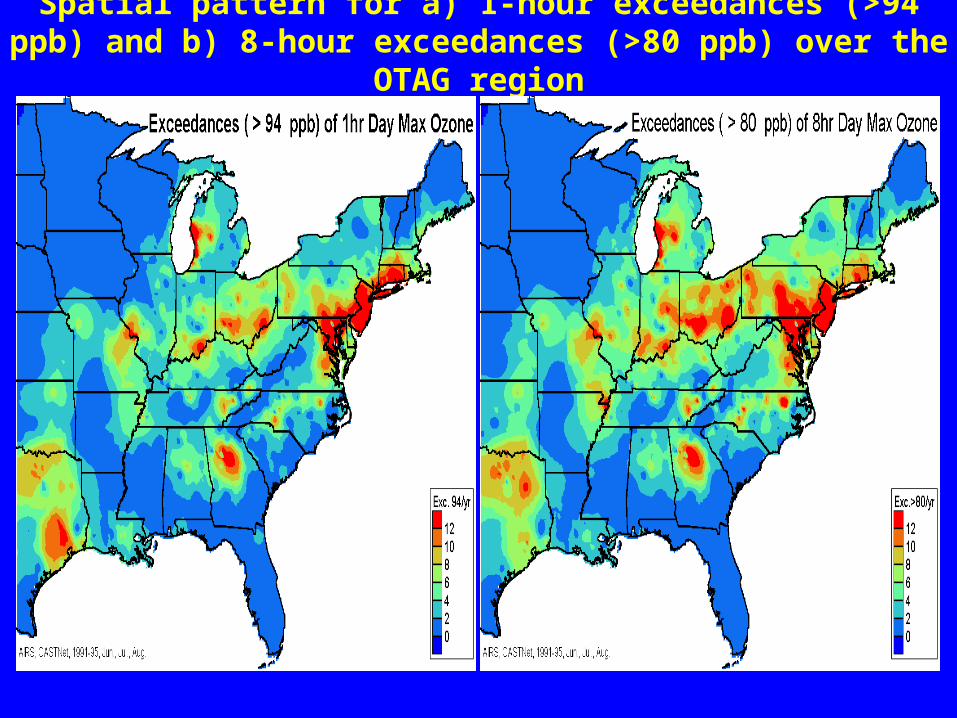
Spatial pattern for a) 1-hour exceedances (>94 ppb) and b) 8-hour exceedances (>80 ppb) over the OTAG region

Spatial pattern of exceedance difference between 8-hour (>80 ppb)
and 1-hour (>94 ppb) exceedance

Summary and Conclusions
• The spatial pattern of daily 1-hour maximum summertime ozone over the OTAG region is elevated in the vicinity of populated metropolitan centers.
• A broad area of elevated ozone is also present over the industrial states from Illinois through Pennsylvania.
• The urban impact is virtually undetectable during clean days (10 percentile of the ozone concentration). However, the urban influence during high ozone levels (90th percentiles) is very pronounced, but confined to the vicinity (few hundred miles) of metropolitan areas.
• The overall shape of the exceedance pattern for 8-hour and 1-hour metric is rather similar.
• Switching from the 1-hour to the 8-hour exceedance metric yields some increase of the relative (to 1-hour) exceedances over the industrial Midwestern states from Illinois to Pennsylvania and a decrease of relative exceedances around Houston and New York City where the concentrations are highly variable.