Spatial Localization and Multinuclear MR Spectroscopy Techniques Navin Bansal, Ph.D. Associate...
64
Spatial Localization and Multinuclear MR Spectroscopy Techniques Navin Bansal, Ph.D. Associate Professor and Director of MR Research
-
Upload
diana-norton -
Category
Documents
-
view
236 -
download
0
Transcript of Spatial Localization and Multinuclear MR Spectroscopy Techniques Navin Bansal, Ph.D. Associate...

Spatial Localization and Multinuclear MR
Spectroscopy Techniques
Navin Bansal, Ph.D.Associate Professor and Director of MR
Research

Proton MR Image
MR images contain anatomical information based on the distribution of protons and the relative proton relaxation rates in various tissues
MR images are based on proton signals from water and fat

MR Spectrum
MR spectroscopy determines the presence of certain chemical compounds
Stress, functional disorders, or diseases can cause the metabolite concentration to vary
Metabolite concentrations are low, generating ~10,000 times less signal intensity than the water signal
Chemical Shift
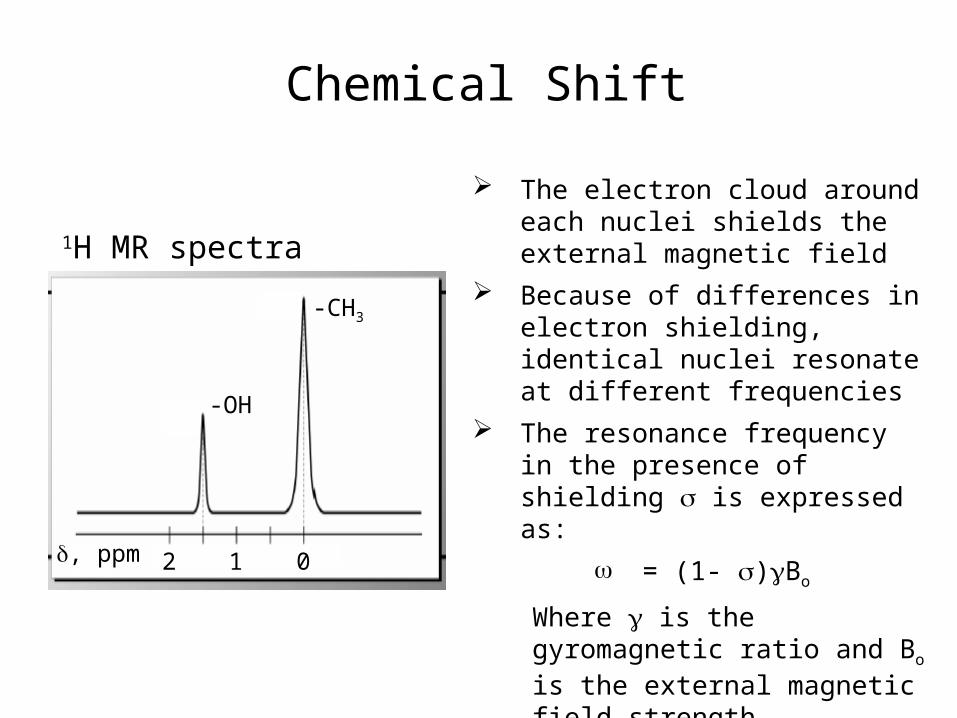
The electron cloud around each nuclei shields the external magnetic field
Because of differences in electron shielding, identical nuclei resonate at different frequencies
The resonance frequency in the presence of shielding is expressed as:
= (1- )Bo
Where is the gyromagnetic ratio and Bo is the external magnetic field strength
1H MR spectra
-CH3
-OH
012, ppm
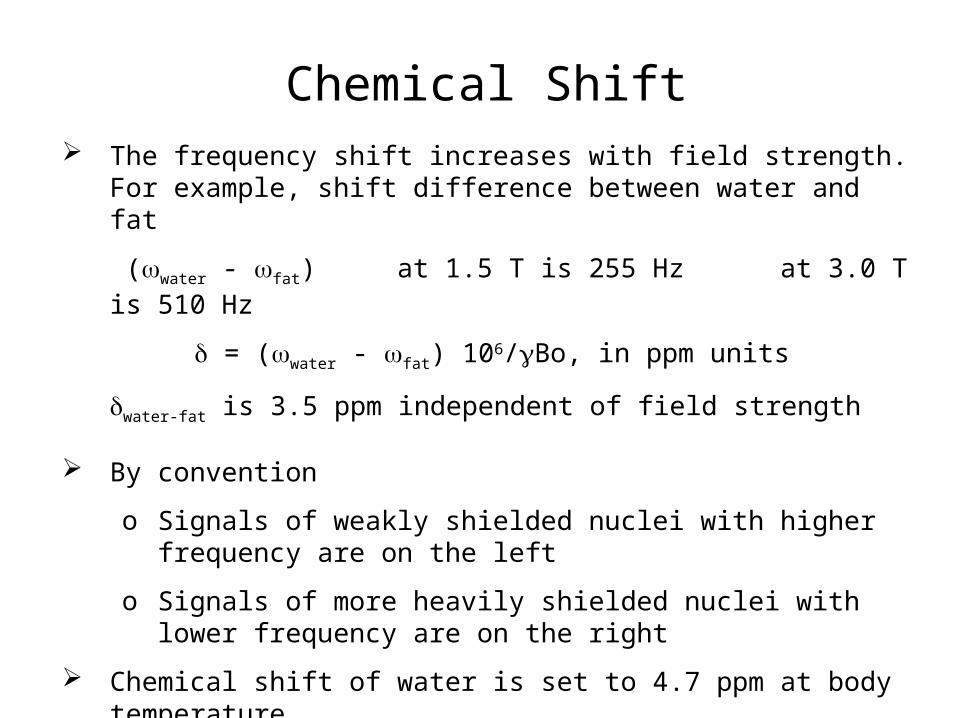
Chemical Shift The frequency shift increases with field strength. For
example, shift difference between water and fat
(water - fat) at 1.5 T is 255 Hz at 3.0 T is 510 Hz
= (water - fat) 106/Bo, in ppm units
water-fat is 3.5 ppm independent of field strength
By convention
o Signals of weakly shielded nuclei with higher frequency are on the left
o Signals of more heavily shielded nuclei with lower frequency are on the right
Chemical shift of water is set to 4.7 ppm at body temperature

MR Spectrum: Peak Characteristics

1H MR Spectrum from Brain
Water Signal Metabolite Signals

Spatial Localization
Surface Coil Localization
Simple surface coil acquisition
Depth Resolved Surface Coil Spectroscopy, DRESS
Single Volume Localization
Image Selected In Vivo Spectroscopy, ISIS
Point Resolved Spectroscopy, PRESS
Stimulated Echo Acquisition Mode, STEAM
Multiple Volume Acquisition
Chemical Shift Imaging, CSI

Surface Coil Acquisition
A surface coil
RF
Pulse-acquire sequence
A simple loop of wire and associated circuit tuned to the desired frequency are placed directly over the tissue of interest to obtain spectra
Advantages
Easy to build and does not require specialized pulse sequence
Superb SNR and filling factor
Disadvantages Must be close to region of interest
Changing ROI is difficult
Inhomogeneous RF field

180°
RF
90°
Gy
TE
Gx
Gz
TR
90°
Spin Echo Imaging Sequence

Depth Resolved Surface Coil Spectroscopy, DRESS
RF
Gslice
A disk-shaped slice is excited parallel to the surface coil with a frequency selective RF pulse in the presence of a gradient.
Advantages
Relatively simple
Suppresses signal from superficial tissue
Multi-slice acquisition, SLIT-DRESS
Disadvantages
T2 loss
Partial Localization

Single Volume Localization
RF
Gx
RF
Gy
RF
Gz
Localized spectra is obtained from a single volume of interest (VOI)
Localization is achieved by sequential selection of three orthogonal slices
The size and location of VOI can be easily controlled
Anatomic 1H images are used for localizing the VOI

Image selected in vivo spectroscopy, ISIS
Point resolved spectroscopy, PRESS
Stimulated echo acquisition mode, STEAM
Single Volume Localization
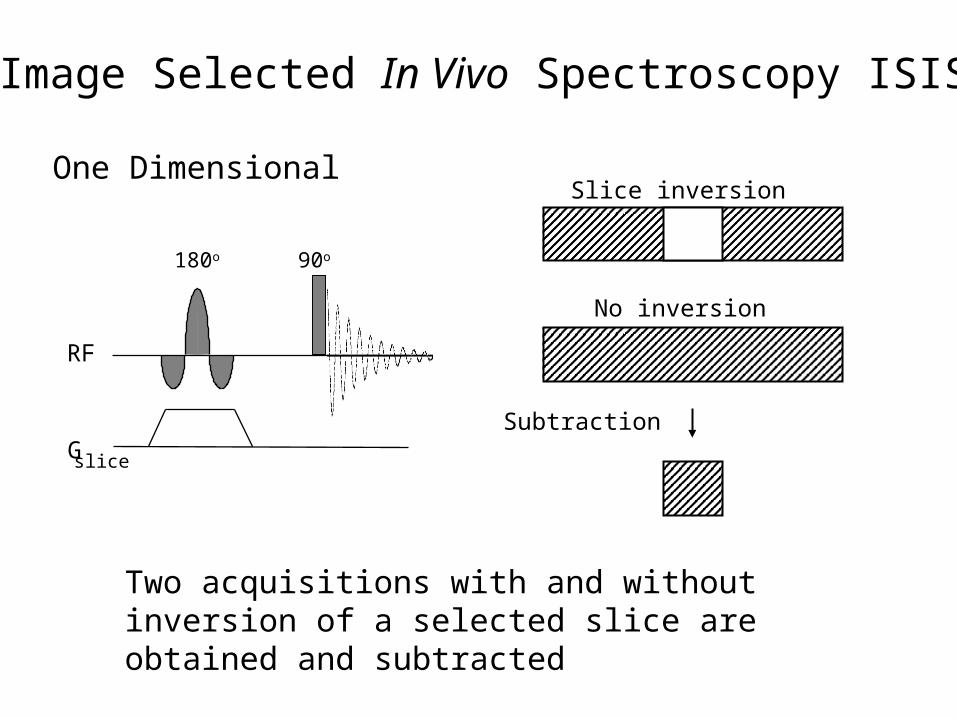
Image Selected In Vivo Spectroscopy ISIS
Two acquisitions with and without inversion of a selected slice are obtained and subtracted
RF
Gslice
180o 90o
Slice inversion
No inversion
Subtraction
One Dimensional
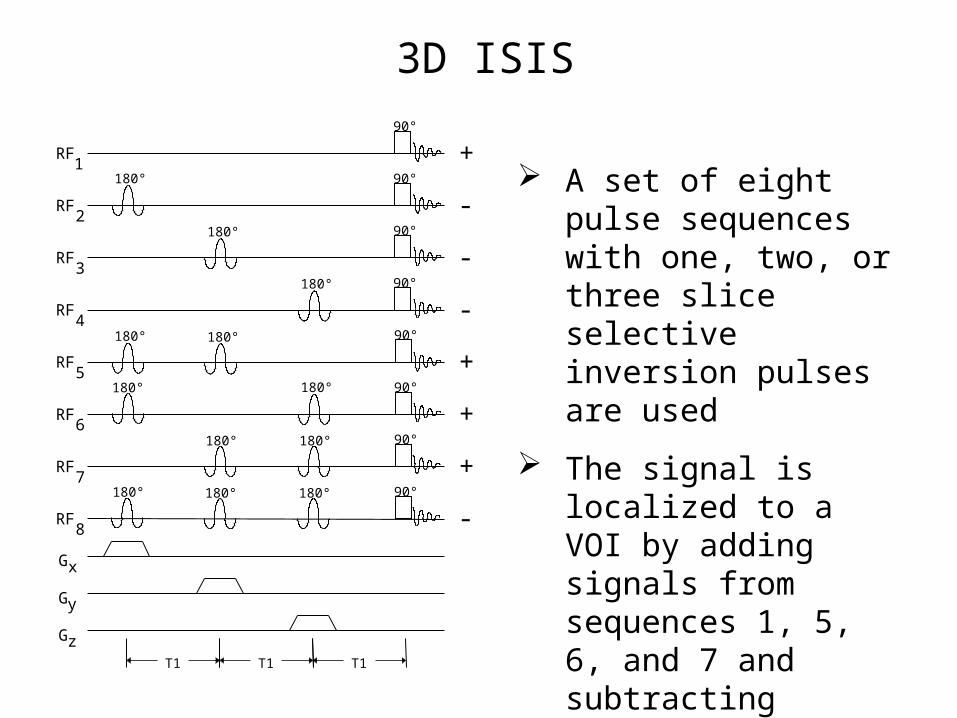
3D ISIS
T1
Gx
Gy
Gz
180°
T1T1
1
180°180°
180° 180°
180°180°
180°180°
180°
180°
180°
90°
90°
90°
90°
90°
90°
90°
90°
3
2
4
5
7
6
RF
RF
RF
RF
RF
RF
RF
RF8
+
-
-
-
+
+
+
-
A set of eight pulse sequences with one, two, or three slice selective inversion pulses are used
The signal is localized to a VOI by adding signals from sequences 1, 5, 6, and 7 and subtracting signals from 2, 3, 4, and 8.
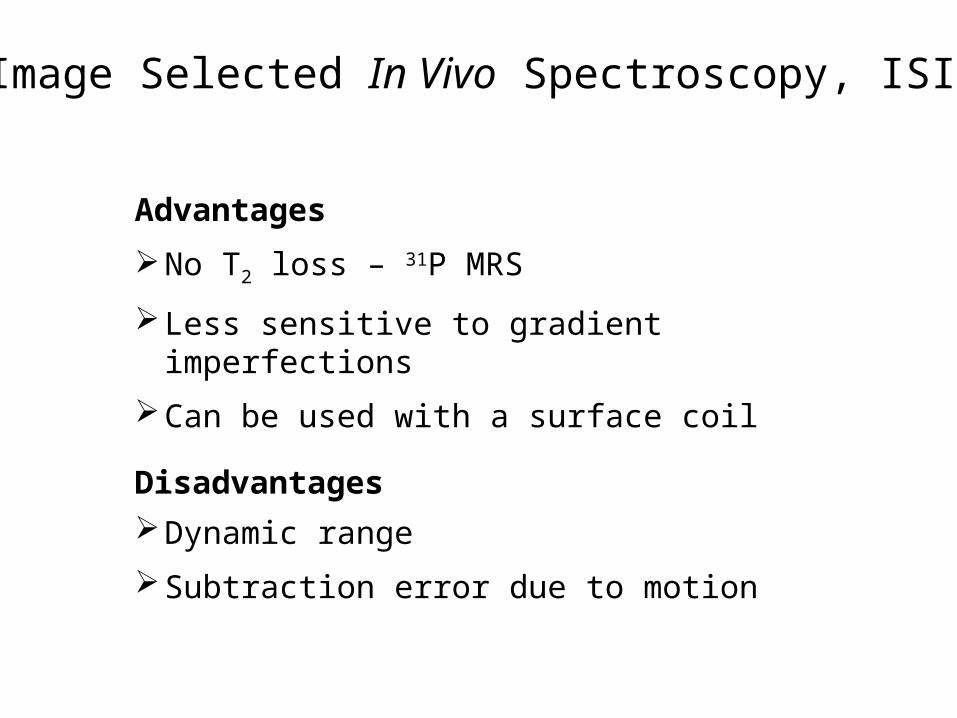
Advantages
No T2 loss – 31P MRS
Less sensitive to gradient imperfections
Can be used with a surface coil
DisadvantagesDynamic range
Subtraction error due to motion
Image Selected In Vivo Spectroscopy, ISIS
(TE1+TE2)/2
RF
TE1/2
Gx
Gy
Gz
90°180°
TE2/2
180°
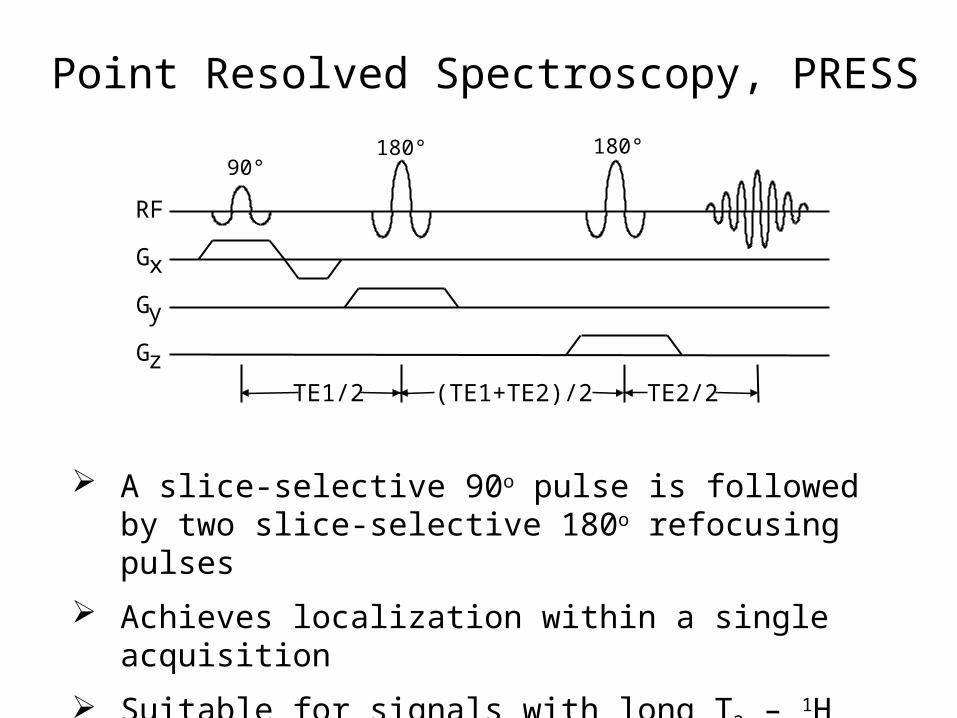
Point Resolved Spectroscopy, PRESS
A slice-selective 90o pulse is followed by two slice-selective 180o refocusing pulses
Achieves localization within a single acquisition
Suitable for signals with long T2 – 1H MRS

TE/2
90° 90° 90°
TE/2TM
RF
Gx
Gy
Gz
Stimulated Echo Acquisition Mode, STEAM
Three slice-selective 90o pulses form a stimulated echo from a single voxel.
Achieves localization within a single acquisition
Only half of the available signal is obtained
Can achieve shorter TE than PRESS
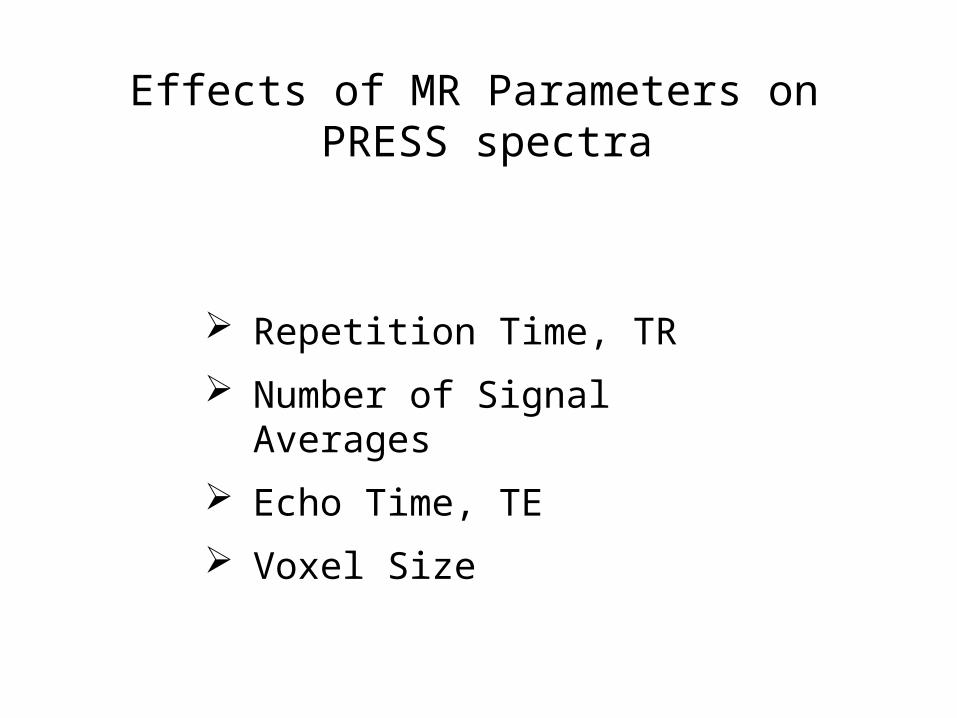
Effects of MR Parameters on PRESS spectra
Repetition Time, TR
Number of Signal Averages
Echo Time, TE
Voxel Size
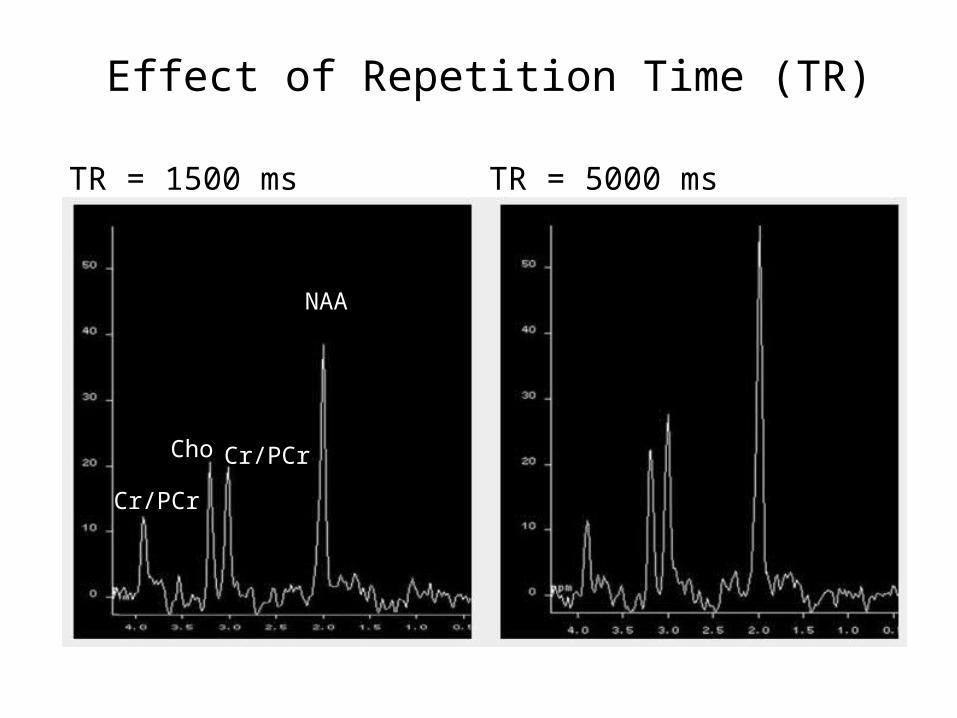
NAA
Cr/PCrCho
Cr/PCr
TR = 1500 ms TR = 5000 ms
Effect of Repetition Time (TR)

Effect of Signal Averaging
8 Averages 64 Averages 256 Averages

Effect of Voxel Size
1 cc 2 cc 4 cc 8 cc
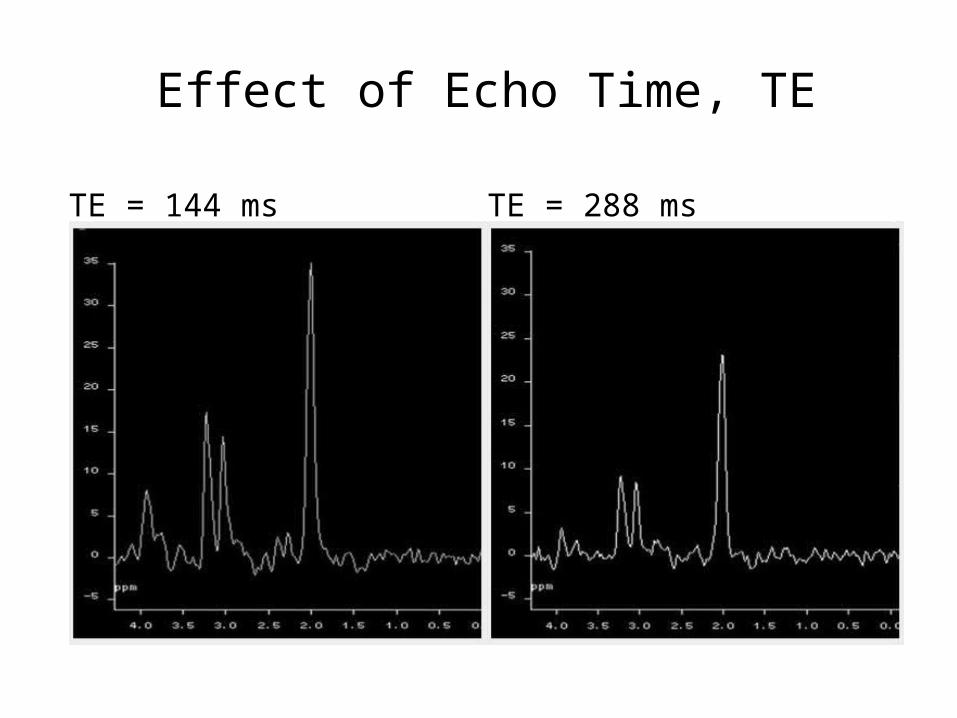
Effect of Echo Time, TE
TE = 144 ms TE = 288 ms
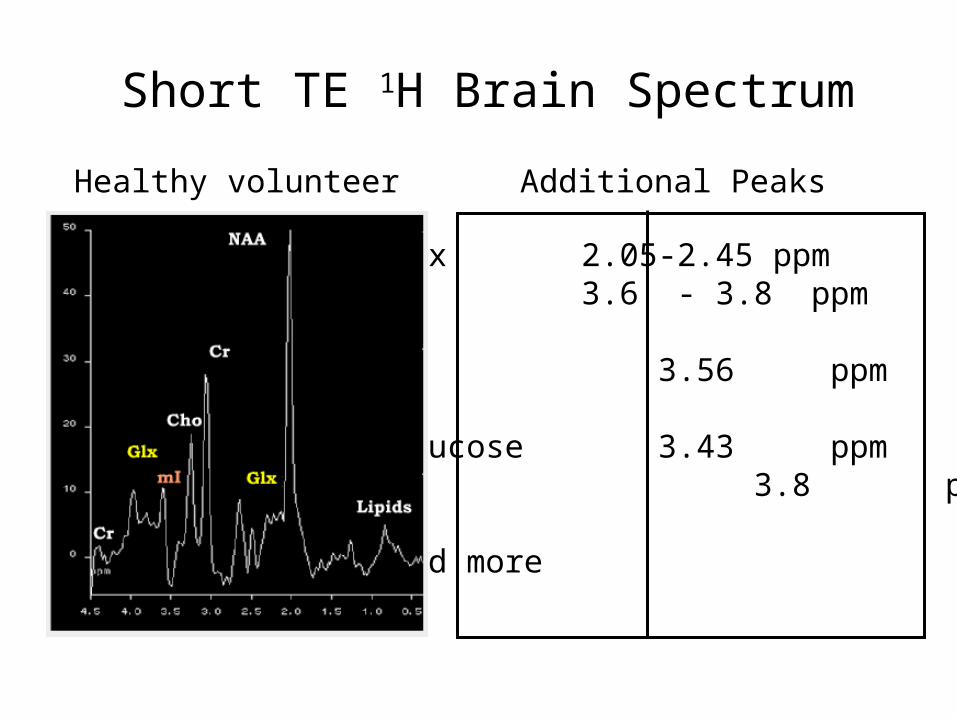
Short TE 1H Brain Spectrum
Glx 2.05-2.45 ppm3.6 - 3.8 ppm
mI 3.56 ppm
Glucose 3.43 ppm 3.8 ppm
And more
Additional PeaksHealthy volunteer
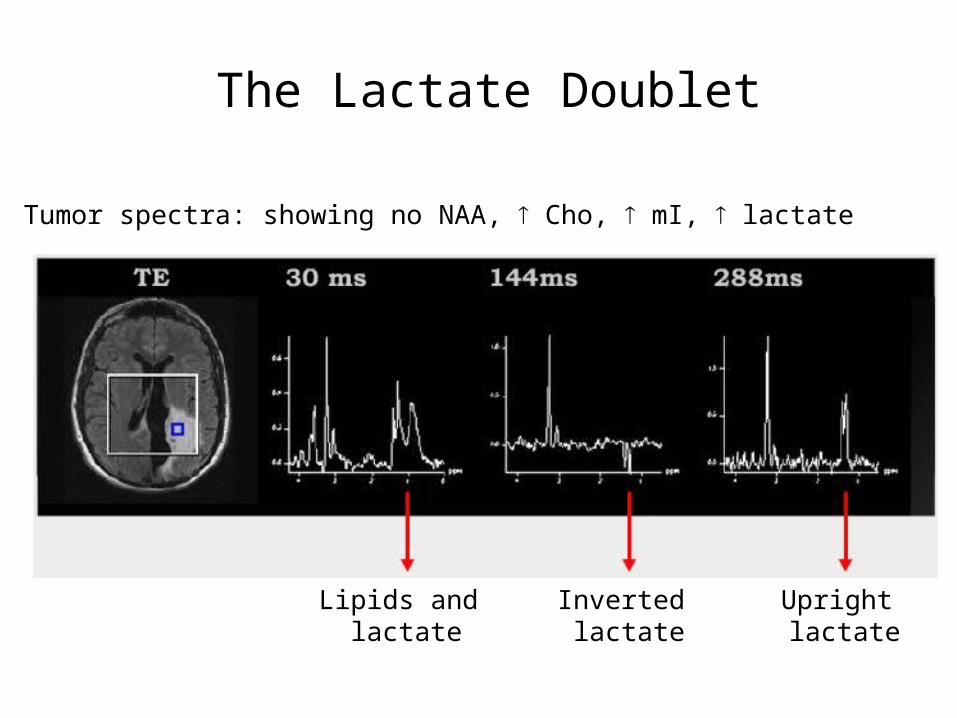
The Lactate Doublet
Tumor spectra: showing no NAA, Cho, mI, lactate
Lipids and lactate
Inverted lactate
Upright lactate

Single Voxel Spectroscopy: Overview
Simplicity
Flexibility in voxel size and position
Accurate definition of VOI
Excellent shim and spectral resolution
Many voxels within the same dataset
RF
Gslice
Gy
Gz
90°
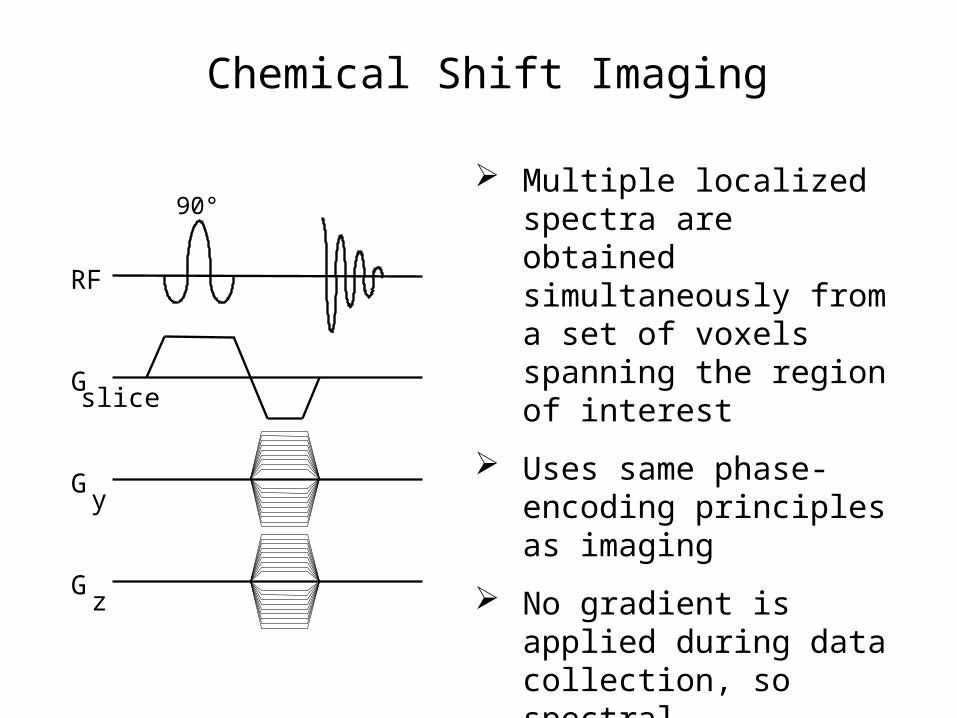
Chemical Shift Imaging
Multiple localized spectra are obtained simultaneously from a set of voxels spanning the region of interest
Uses same phase-encoding principles as imaging
No gradient is applied during data collection, so spectral information is preserved
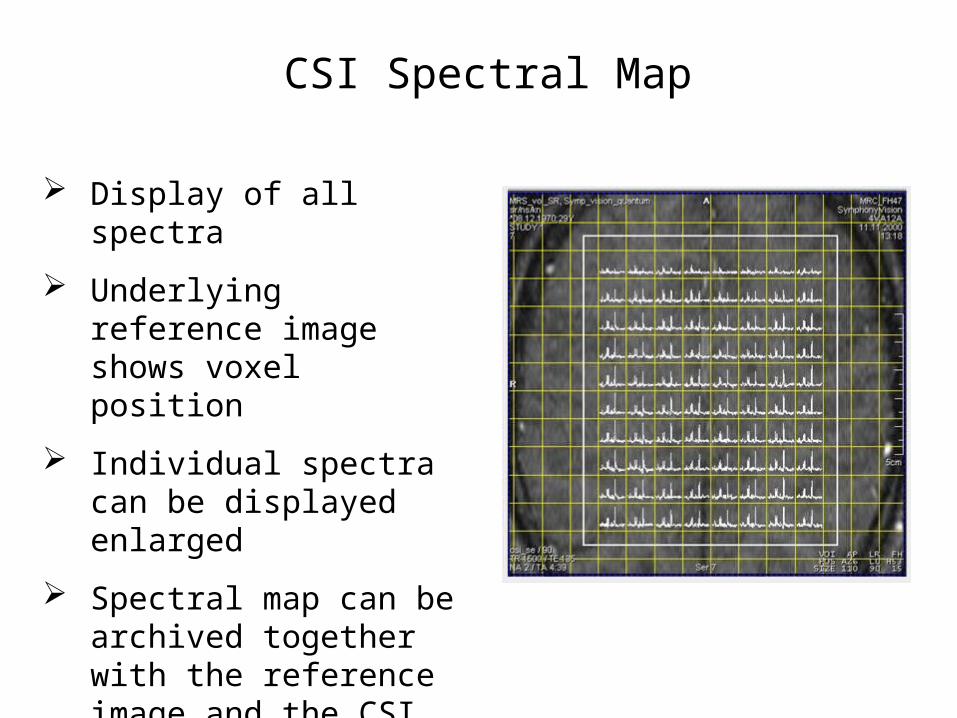
Display of all spectra
Underlying reference image shows voxel position
Individual spectra can be displayed enlarged
Spectral map can be archived together with the reference image and the CSI grid
CSI Spectral Map
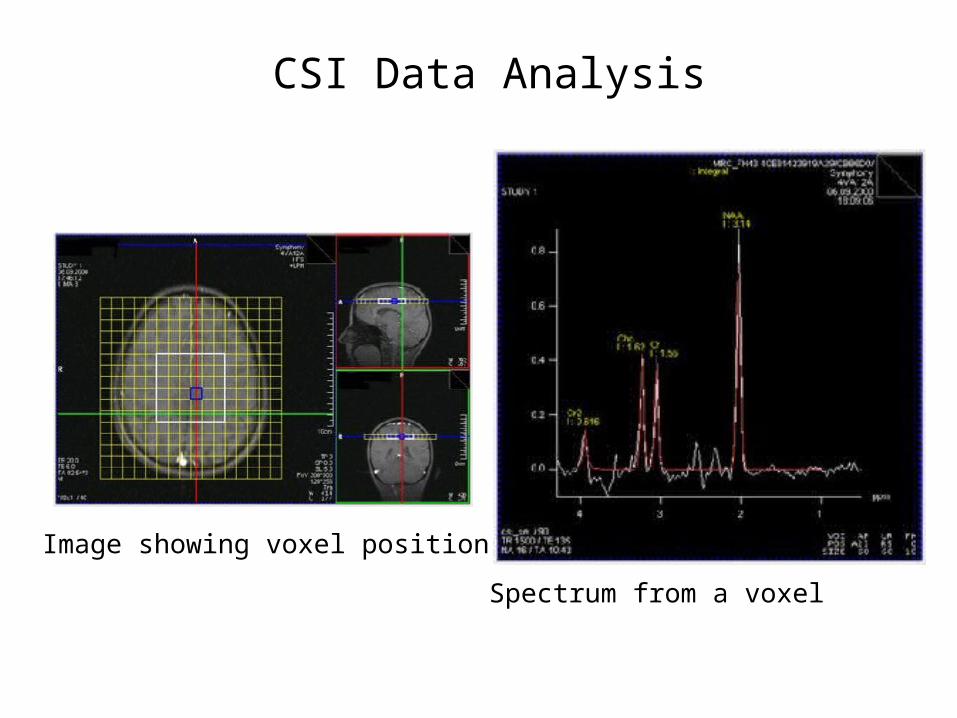
CSI Data Analysis
Image showing voxel position
Spectrum from a voxel

NAA NAA/Cho
Spectral Map and Metabolite Images

CSI: Overview
Advantages
Acquisition of multiple voxels
Metabolite images, spectral maps, peak information maps, and results table
Many voxels within the same dataset
Disadvantages
Large volume – more difficult to shim
Voxel bleeding
Large datasets

Multinuclear MR Spectroscopy

Nucleus Spin , MHz/T Natural Abundanc
e
Relative Sensitivity
1H 1/2 42.576 99.985 1002H 1 6.536 0.015 0.96
3He 1/2 32.433 .00013 4413C 1/2 10.705 1.108 1.617O 3/2 5.772 0.037 2.919F 1/2 40.055 100 83.4
23Na 3/2 11.262 100 9.331P 1/2 17.236 100 6.639K 3/2 1.987 93.08 .05
Important Nuclei for Biomedical MR

1H – Neurotransmitters, amino acids, membrane constituents
2H – Perfusion, drug metabolism, tissue and cartilage structure.
13C – Glycogen, metabolic rates, substrate preference, drug metabolism, etc.
19F – Drug metabolism, pH, Ca2+ and other metal ion concentration, pO2, temperature, etc
23Na – Transmembrane Na+ gradient, tissue and cartilage structure.
31P – Cellular energetics, membrane constituents, pHi, [Mg2+], kinetics of creatine kinase and ATP hydrolysis.
Important Nuclei for Biomedical MR

1H MR Spectroscopy

NAA
Glx
Cr
ChoInsGlx
CrLipids
1.04.5 2.53.0 2.0 1.53.5 0.5ppm
1H MR Spectra of the BrainShort TE

•NAA is a neuronal marker and indicates density and viability of neurons.
•It is decreased in glioma, ischemia and degenerative diseases.
N-Acetyl aspartate (NAA)
CH3-C-NH-CH-CH2-COOH
O
CH2-COOH
2.02, CH3
2.52, CH2
2.70, CH2
4.40, CH
Creatine (Cr), phosphocreatine (PCr)
NH2-C-N-CH2-COOH
CH3
NH3.04, CH3
3.93, CH2
•Cr is a marker of aerobic energy metabolism
•Cr signal is constant even with pathologic changes and may be used as a control value
• However, isolated cases of Cr deficiency may occur in children
Important 1H Signals
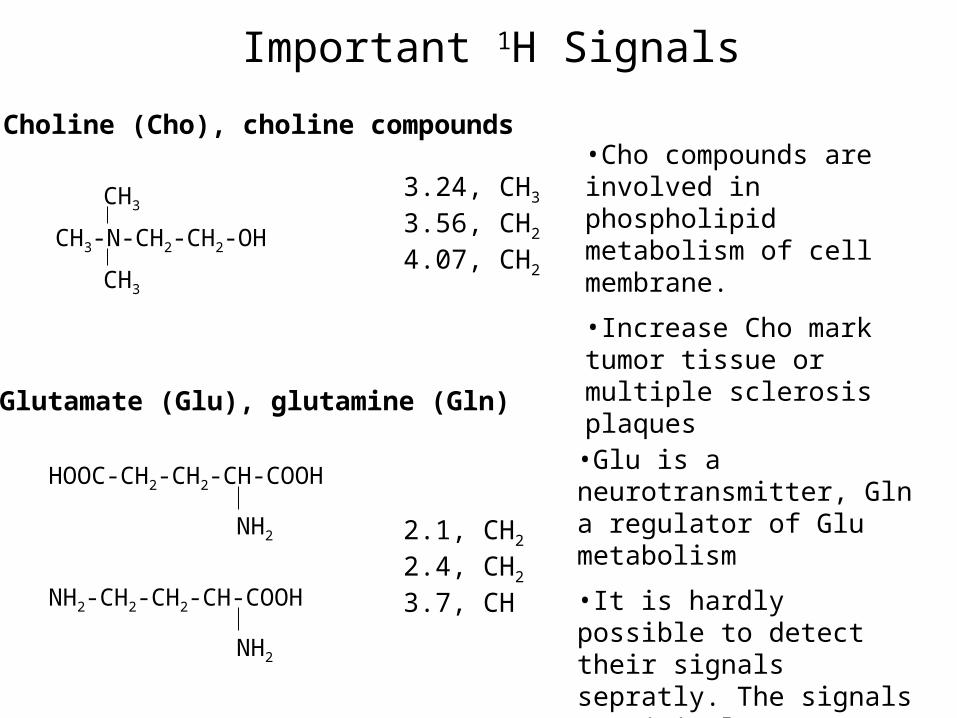
•Cho compounds are involved in phospholipid metabolism of cell membrane.
•Increase Cho mark tumor tissue or multiple sclerosis plaques
Choline (Cho), choline compounds
3.24, CH3
3.56, CH2
4.07, CH2
Glutamate (Glu), glutamine (Gln)
2.1, CH2
2.4, CH2
3.7, CH
•Glu is a neurotransmitter, Gln a regulator of Glu metabolism
•It is hardly possible to detect their signals sepratly. The signals are jointly designated “Glx”.
CH3-N-CH2-CH2-OH
CH3
CH3
HOOC-CH2-CH2-CH-COOH
NH2
NH2-CH2-CH2-CH-COOH
NH2
Important 1H Signals

•Lactate is the final product of glycolysis
•It can be detected in ischemic/hypoxic tissue and tumors indicating lack of oxygen
Lactate (Lac)
1.33, CH3
4.12, CH
Taurine (Tau)
3.27, NCH2
3.44, SCH2
•Cells examination indicates taurine synthesis in astrocytes
CH3-CH-COOH
OH
NH2-CH2-CH2-S-OH
PO4-
PO4-
PO4- PO4
-
PO4-
PO4-
Myo-inositol (Ins)
3.56, CH
•Ins marks glia cells in brain
•It is decreased in hepatic encephalopathy and elevated in Alzheimer’s disease.
Important 1H Signals

31P MR Spectroscopy
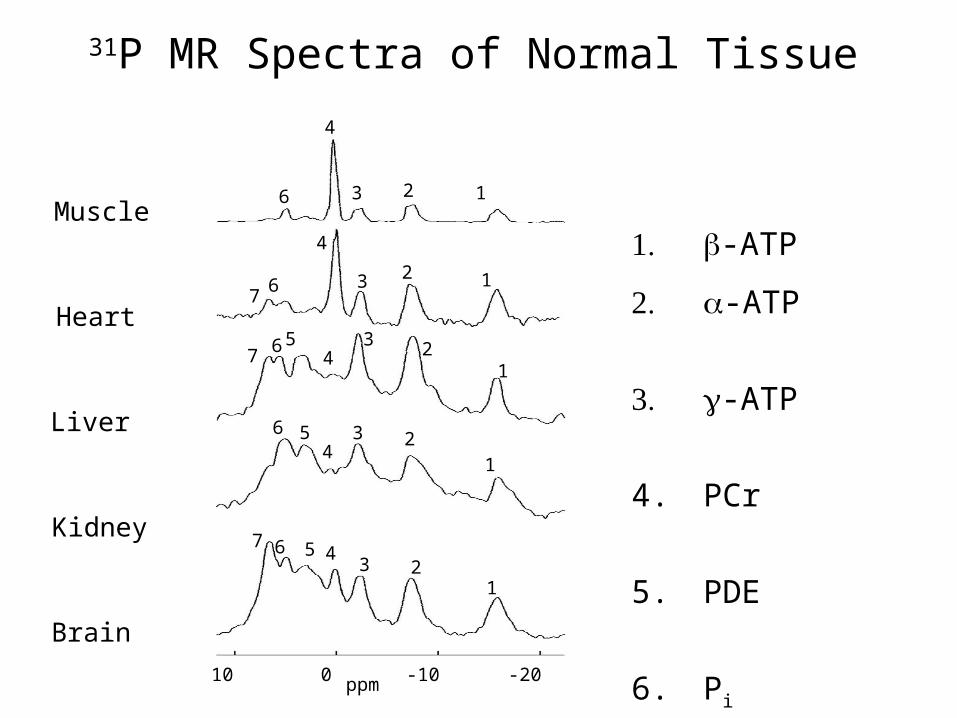
31P MR Spectra of Normal Tissue
7 6
5
4
17
6
4
3 2 1
6
3 2 1
6 54
3 21
5
4
21
7 63
4
3 2
10 0 -10 -20ppm
Muscle
Heart
Liver
Kidney
Brain
1. -ATP
2. -ATP
3. -ATP
4. PCr
5. PDE
6. Pi
7. PME

Adenosine triphosphate (ATP)
-16.5 -ATP-7.8 -ATP-2.7 -ATP
ATP is the energy currency in living systems- and -ATP have contributions from ADP, NAD and NADH-ATP is uncontaminated and used for quantification
Phosphocreatine (PCr)
0 PCr
PCr is used for storing energy and converting ADP to ATPIt is absent in liver, kideny and red cellsIt is used as an internal reference for chemical shift
Important 31P Signals

Phosphomonoester (PME)
5.6 to 8.1 PME
•PME signal contains contribution from membrane constituents and glucose-6-phosphate and glycerol-3 phosphate.
•It is elevated in tumors
Phosphodiester (PDE)
0.6 to 3.7 PDE•PME signal contains contribution from membrane constituents
Important 31P Signals
Inorganic Phosphate (Pi)
3.7 to 5.7 Pi
•Pi is generated from hydrolysis of ATP and increased in compromised tissue
•Its chemical shift is sensitive to pH
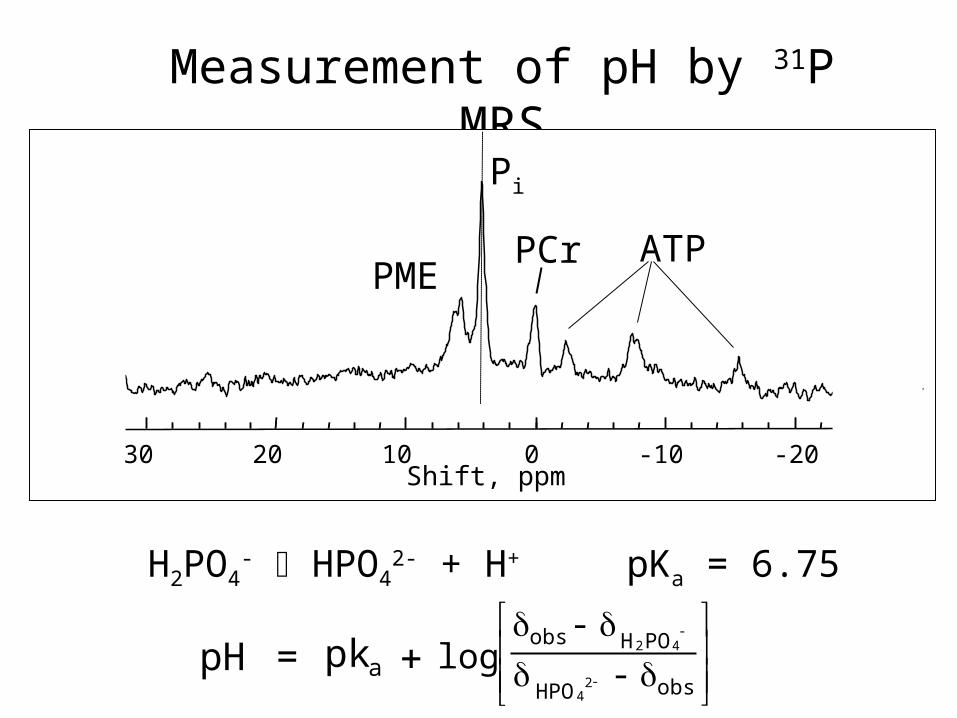
Measurement of pH by 31P MRS
Shift, ppm30 20 10 0 -10 -20
PCr ATP
Pi
PME
H2PO4- HPO4
2- + H+ pKa = 6.75
-
--
-
obsHPO
POHobs
24
42log= apkpH

Effect of Exercise on 31P MRS

Beer et al., J Magn Reson Imaging. 2004;20:798-802.
Detection of myocardial infarctions by 31P-MR spectroscopy

Aerobic Glycolysis
Poor Vascularization and Perfusion
Hypoxia
Anaerobic Glycolysis
Increased Acid Production
Tumors are expected
to be acidic
A Lesson from 31P MRSTumor Microenvironment

GlioblastomasAstrocytomasMeningiomasBrain Metastases
Malignant MelanomasSarcomasMammary Ca.AdenocarcenomasSquamous Cell Ca.
A: pHPOT
Skeletal MuscleBrain
pH 5.6 6.0 6.4 6.8 7.2 7.6
Skin
NormalTissue
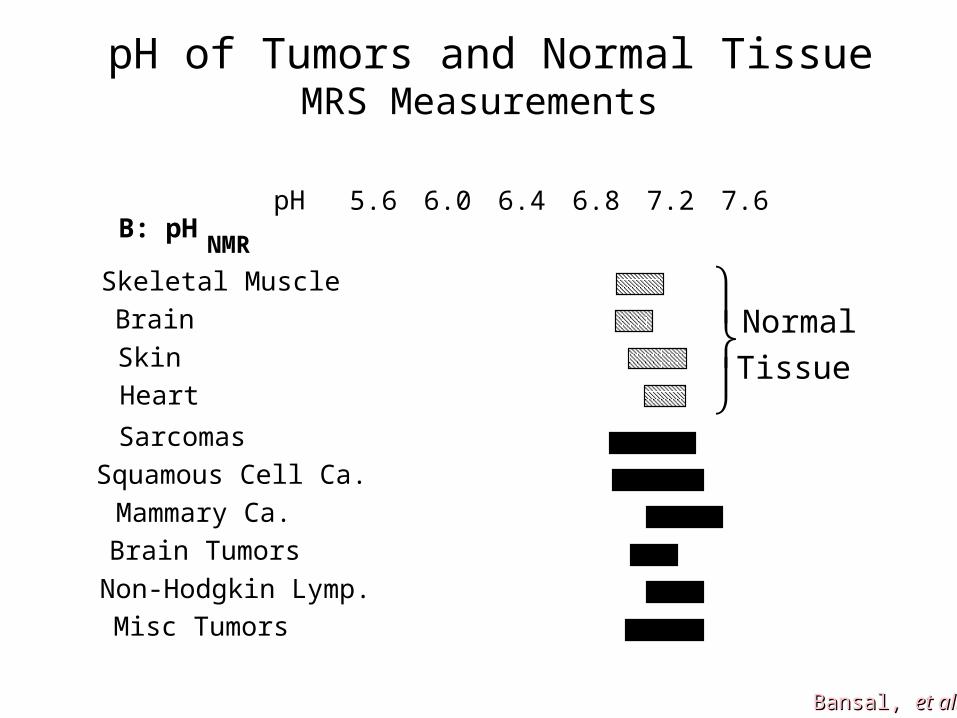
pH of Tumors and Normal TissueElectrode Measurements
Bansal, Bansal, et al.et al.
B: pHNMR
Sarcomas
Non-Hodgkin Lymp.
Squamous Cell Ca.Mammary Ca.Brain Tumors
Misc Tumors
pH 5.6 6.0 6.4 6.8 7.2 7.6
Skeletal MuscleBrainSkinHeart
NormalTissue
pH of Tumors and Normal TissueMRS Measurements

23Na MR Spectroscopy and Imaging

Biological Importance of Sodium
Sodium and other ions are inhomogeneously distributed across the cell membrane.
A transmembrane sodium gradient reflects a dynamic equilibrium between Na+-K+ ATPase versus passive or mediated flux.
The sodium gradient may be altered in certain diseased states.
Bansal, Bansal, et al.et al.
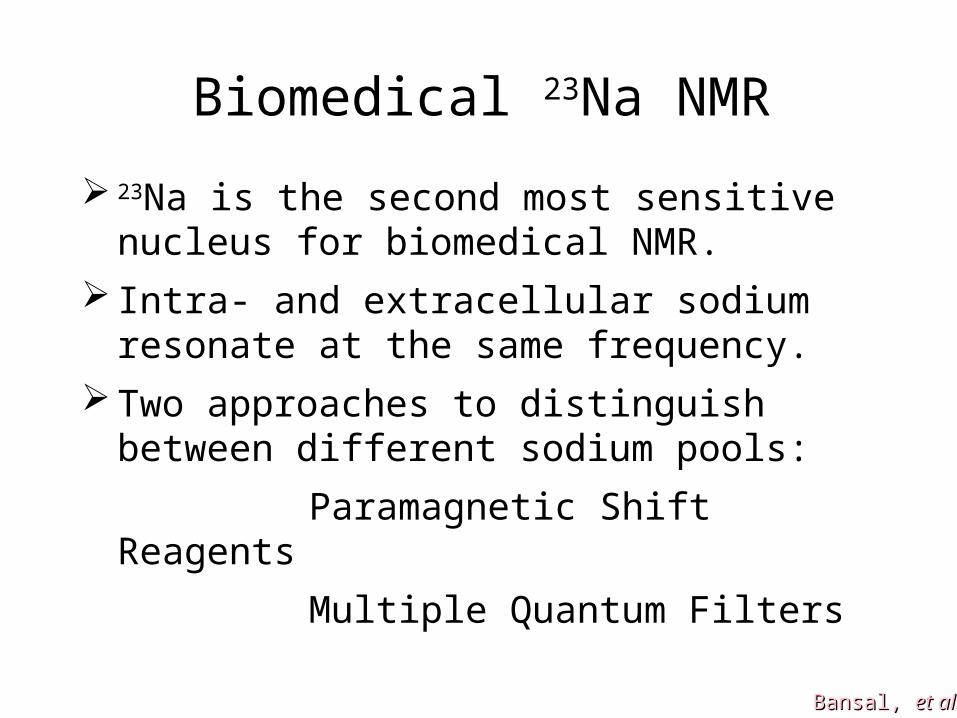
Biomedical 23Na NMR
23Na is the second most sensitive nucleus for biomedical NMR.
Intra- and extracellular sodium resonate at the same frequency.
Two approaches to distinguish between different sodium pools:
Paramagnetic Shift Reagents
Multiple Quantum Filters
Bansal, Bansal, et al.et al.
SRSR SRSR SRSR
NaNa++ee
NaNa++ee
NaNa++ee
NaNa++ee
NaNa++ee
NaNa++eeNaNa++
ee
NaNa++ii
NaNa++ii
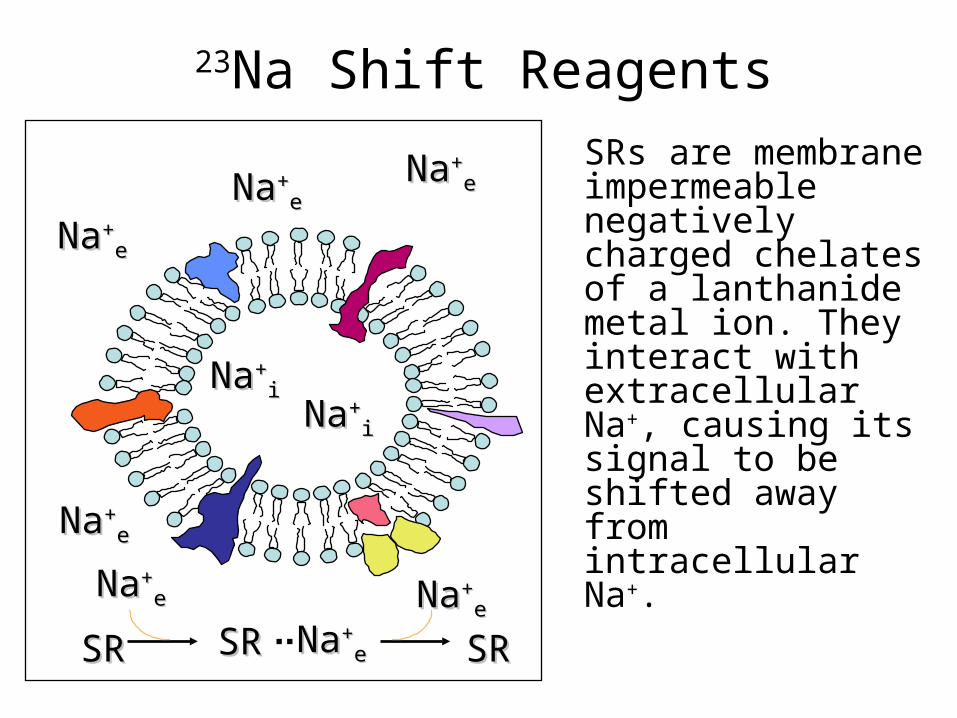
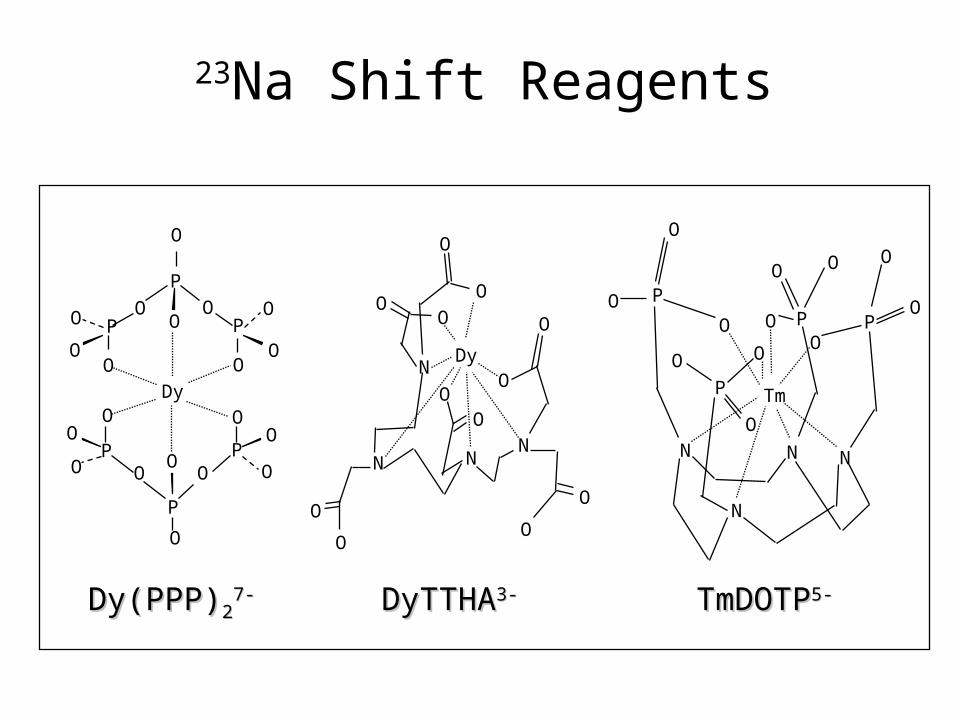
SRs are membrane impermeable negatively charged chelates of a lanthanide metal ion. They interact with extracellular Na+, causing its signal to be shifted away from intracellular Na+.
23Na Shift Reagents

Action of a Typical Shift Reagent
Bansal, Bansal, et al.et al.
With SRWith SR
Without SRWithout SRNaNaii + Na + Naee
001010 ppmppm
NaNaii
NaNaee
001010 ppmppm
23Na Shift Reagents
O
N N
O
OO
N
O
N
O
O
OO
O
O
O
Dy
P
O
O
OP
OO
OOP
OO
O
Dy
P
O
O
O P
OO
OOP
OO
O
N
N N N
PPP
P Tm
O
O
OO
O
O
O
O
O
O
O
O
Dy(PPP)Dy(PPP)227-7- DyTTHADyTTHA3-3- TmDOTPTmDOTP5-5-

Muscle
Heart
Liver
Brain
Kidney
Ext
Int
x 5Urine
9L Glioma
40 30 20 10 0 -10ppm
In VivoIn Vivo 2323Na Spectra after TmDOTPNa Spectra after TmDOTP5- 5-
InfusionInfusion
Bansal, Bansal, et al.et al.
80
100
120
140
160
180
200
EIPA
****
** 37 oC 37 oC 45 oC
Time, min
10 20 30 40 50 60 70 80-20 -10 0-10
Rela
tive N
ai S
ignal In
tensi
ty
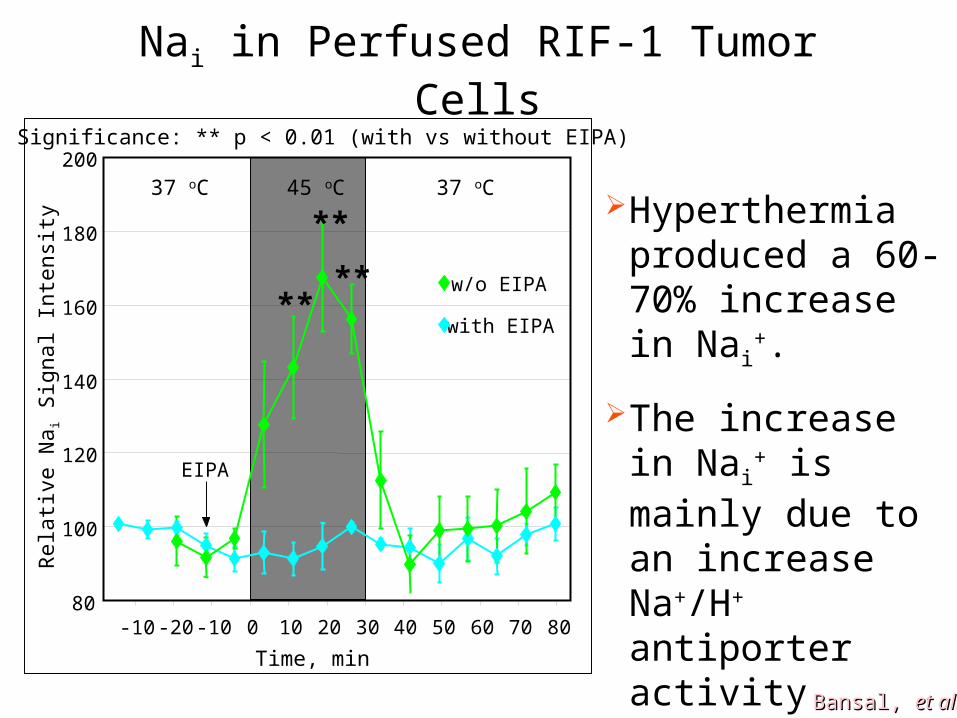
Significance: ** p < 0.01 (with vs without EIPA)
with EIPA
w/o EIPA
Nai in Perfused RIF-1 Tumor Cells
Hyperthermia produced a 60-70% increase in Nai
+.
The increase in Nai
+ is mainly due to an increase Na+/H+ antiporter activity
Bansal, Bansal, et al.et al.
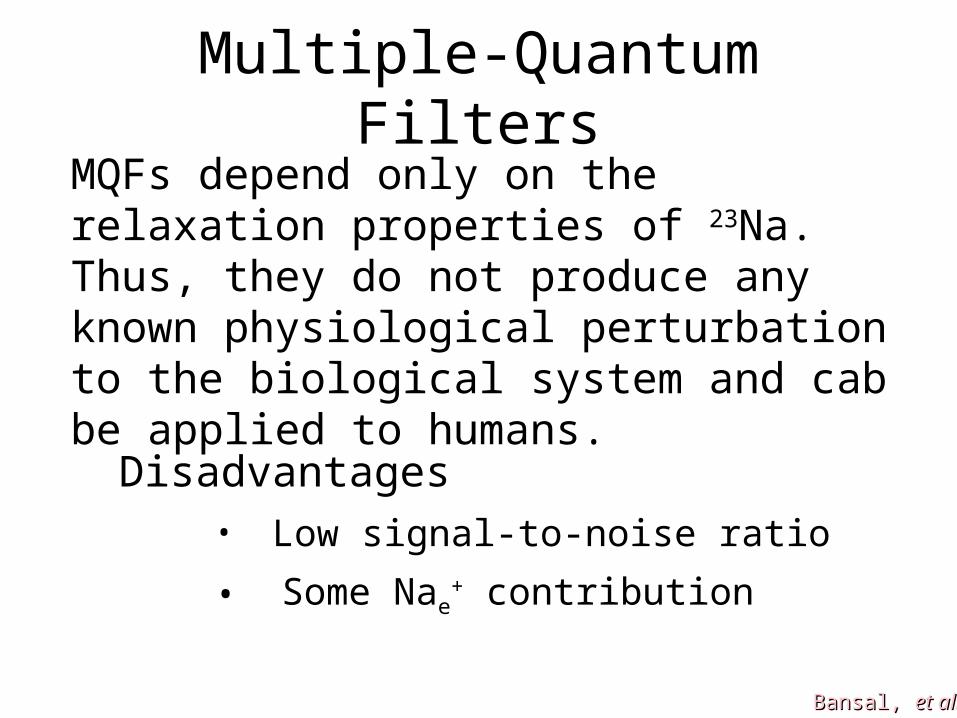
Multiple-Quantum FiltersMQFs depend only on the relaxation properties of 23Na. Thus, they do not produce any known physiological perturbation to the biological system and cab be applied to humans.
Disadvantages• Low signal-to-noise ratio
• Some Nae+ contribution
Bansal, Bansal, et al.et al.

MQ Filtered 23Na NMR “Transiently bound” Na+ can pass through a MQ filter.
|3/2>
|1/2>
|-1/2>
|-3/2>
SQ outer
SQ inner
SQ outer
DQ
DQ TQ
“Free” Na+ “Transiently Bound” Na+
Concentration of macromolecules within the cytoplasm is relatively high while the extracellular milieu is largely aqueous.

SQ and TQ Filtered 23Na Spectraof a Phantom
00 -50-505050ppmppm 00 -50-505050ppmppm
SQSQ TQTQ
Agarose
Agarose
Aqueous
40 mMTmDOTP5-
10%Agarose
Bansal, Bansal, et al.et al.

200
180
160
140
120
100
80
60
40
20
0
NonelectrolytesH2CO3
Na+
K+
Ca+2Mg+2
Organicacids
SO4-2
HPO4-2
HCO3-
Cl -
Protein
H2CO3
HCO3-
Cl -
HPO4-2
Na+
K+
SO4-2
Protein
Intracellularfluid
OrganicacidsCa+2
Mg+2
K+
Protein
SO4-2
HPO4-2
Na+
Cl -
HCO3-
H2CO3
Nonelectrolytes
Interstitialfluid
Bloodplasma
m Eq/L H2O
Mg+2
Composition of Tissue Compartments

3D MQF 23Na Imaging Pulse Sequence
PD(100 ms)
DELTA ()(3 µs)
TAU ()(3 ms)
TE(4 ms)
RF
Readout
PhaseEncoding 1
PhaseEncoding 2

3D SQ and TQF 3D SQ and TQF 2323Na MRI of a Live RatNa MRI of a Live RatCaronal Sections
TQFTQF
SQSQ
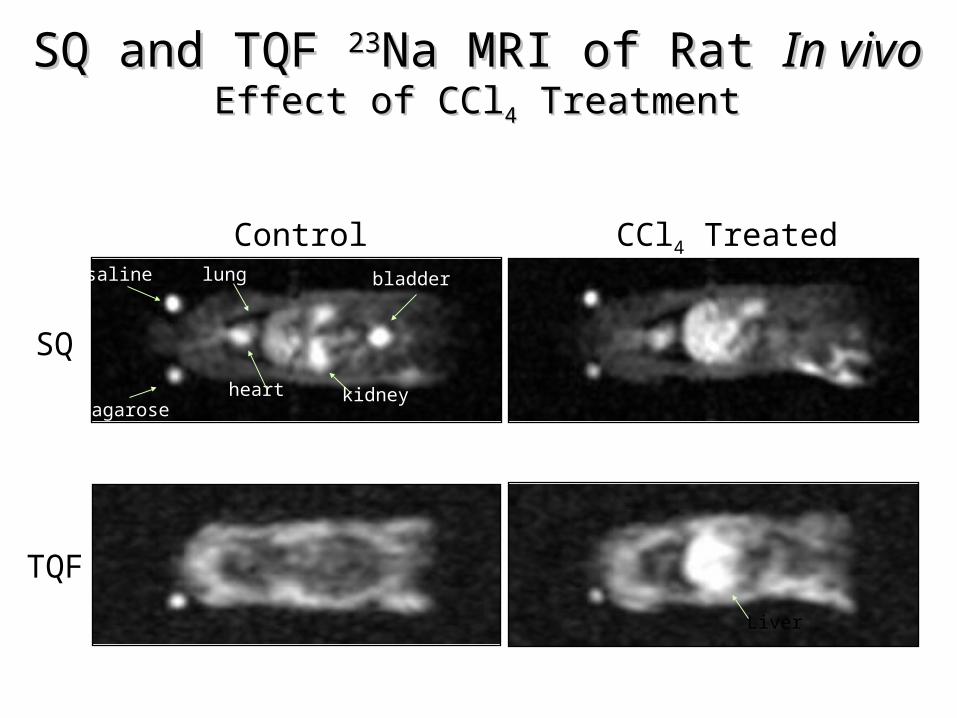
SQ
TQF
Control CCl4 Treated
Liver
bladder
kidneyheart
lungsaline
agarose
SQ and TQF SQ and TQF 2323Na MRI of Rat Na MRI of Rat In vivoIn vivoEffect of CClEffect of CCl44 Treatment Treatment


![Haemophilus [NavIn]](https://static.fdocuments.in/doc/165x107/577d27191a28ab4e1ea30e7f/haemophilus-navin.jpg)