SPATIAL GOVERNANCE
68
SPATIAL GOVERNANCE Trento, ERSA Winter School 2019 Rudiger Ahrend Head of Economic Analysis, Statistics and Multi-level Governance OECD Centre for Entrepreneurship, SMEs, Regions and Cities
Transcript of SPATIAL GOVERNANCE

SPATIAL GOVERNANCE
Trento, ERSA Winter School 2019
Rudiger Ahrend
Head of Economic Analysis, Statistics and Multi-level Governance
OECD Centre for Entrepreneurship, SMEs, Regions and Cities

• Cities & Metropolitan Governance
• Governance of Land use
• MLG Indicators
OUTLINE
2

PRODUCTIVE CITIES
3

Administrative boundaries are not the
answer
4

• Definition of Functional Urban Areas based on population density in 1km2 cells that are matched to municipal boundaries and connected via commuting patterns.
• Urban centres are identified by aggregating densely populated 1km2 cells. Urban centres with at least 50,000 inhabitants are kept.
• They are matched with the boundaries of the lowest administrative level for which statistical data is typically available (NUTS5/LAU2)
• Urban centres and the less densely populated municipalities in the commuting zone are combined into Functional Urban Areas based on commuting flows (>15%).
• More info: OECD (2012) Redefining Urban
• http://measuringurban.oecd.org
A functional definition for cities
(EU/OECD)
5

6
Why do we care about productivity
in cities?
• A country’s productivity is, in large part, determined by the productivity of its cities.
• Large urban agglomerations account for over 50% of total GDP while taking up less than 5% of total surface area.
• GDP per capita increases with city size: for a doubling of city size by roughly 10%.
• This may in part be a result of higher participation rates in cities. A large part comes from sorting, as better educated individuals have a tendency to live and work in larger cities.
• However, productivity also increases even when controlling for sorting.

7
Bigger cities are more productive

• Sources of agglomeration from Marshall (1890); reviews by Rosenthal and Strange (2004), Puga (2010); concepts already present in Marshall (1890).
• Thicker labour markets: labour market pooling; better matching
• gain from reduced labour acquisition and training costs in thick local labour markets with abundant specialised labour force
• Sharing facilities, inputs, gains from specialisation
• firms may face lower costs for specialised non-traded inputs that are shared locally in a geographical cluster.
• Knowledge spillovers
• face-to-face contact can enable tacit knowledge spillovers through increases in the intensity of the interactions with other firms or individuals
• Probably also : Connectivity, Knowledge based capital 8
Sources of agglomeration benefits

City productivity increases with city size
even after controlling for sorting
9

Heterogeneity: bigger is better
10
Spain
United States

Heterogeneity: borders matter(ed)
11
Germany
Mexico

Heterogeneity: distance matters
12
Netherlands
United Kingdom

Netherlands
Heterogeneity: distance matters
13excluding FUAs that border a metropolitan area (light blue)
United Kingdom

Distance matters - Productivity differentials and distance to London
14

• The productivity increase associated with increasing a city’s population are in the order of 2-5.0% for a doubling in population size.
– This implies, e.g., that moving from a city of roughly 50000 inhabitants to the Paris agglomeration – on average - increases productivity by an order of magnitude of 20%.
• Smaller cities can “borrow” agglomeration benefits
• Human capital (spill-overs)
– 10 percentage point increase in university graduates increases productivity by 3% through human capital externality
– Direct effects are even a lot larger
15
What makes cities rich?

• Adequate governance structures with administrative functions carried out at the “right” level– Low fragmentation at metropolitan level; governance bodies
• Position of hub for trade or financial flows or status as national capital can facilitate rent extraction– Port cities 3% more productive
• Specialization in certain types of activities– Cities with higher share of manufacturing, finance and business
services have higher levels of productivity.
– Cities with a higher share of high-tech activities have larger city productivity premiums
– Potential trade-off specialisation vs. resilience (especially for smaller cities)
16
What makes cities rich?

Higher productivity comes with higher prices
17
– Overall, gains from agglomeration, but local purchasing power does (on average) not increase with city size
Agglomeration benefits and local price levels in Germany

• Local purchasing power varies widely around theaverage, and amenities can explain a significant share ofthe variation
• Residents are willing to pay for local amenities– Proximity to large bodies of water (coast or lake), cultural attractions
(theatres/operas/etc.) and UNESCO World heritage sites make citiesrelatively more expensive
• Disamenities require compensation– PM10 air pollution reduces local price level relative to productivity
benefits
• More educated individuals appear to be willing to paymore for amenities; also, the share of university educatedworkers seems to be a local amenity in itself.
Differences in local purchasing power are partly driven by amenities
18

METROPOLITAN GOVERNANCE
19

Metro governance reforms in the OECD
have accelerated in recent decades
Number of metropolitan governance structures created or
reformed in the OECD, by decade
0
5
10
15
20
25
30
35
40
45
50
1951-1960 1961-1970 1971-1980 1981-1990 1991-2000 2001-2010

Recent country-wide metro governance
reforms across the OECD
Turkey: creation of metropolitan provinces
Australia: regional-led initiatives to create metro governance bodies
France: new governance structures for the 14 biggest urban areas
United Kingdom: “city deals” incentivise cities to improve metro cooperation
Italy: 10 provinces become metropolitan cities (cittàmetropolitane)

• Growing recognition that administrative boundaries are often outdated and don’t match the functional realities in Metropolitan areas
• Evidence that excessive municipal fragmentation hampers metropolitan economic performance and wellbeing
What are the drivers of metropolitan
governance reforms?
22

Why do we care about Metropolitan governance?

Horizontal administrative fragmentation is common as cities outgrow their historic boundaries (more than 10 local governments in 75% of OECD Metropolitan Areas; more than 100 in 22%).
This may lead to undesirable outcomes due to lack of cooperation and negative externalities.
Evidence from case studies points to administrative fragmentation indeed having negative effects.
This is confirmed by more systematic econometric evidence:
Ahrend, Farchy, Kaplanis and Lembcke (2014), “What Makes Cities More Productive? Agglomeration Economies & the Role of Urban Governance: Evidence from 5 OECD Countries”, forthcoming in Journal of Regional Science
Urban areas are highly fragmented
24

Degree of administrative fragmentation
in large OECD Metropolitan areas
25

City productivity & administrative
fragmentation
26
• Productivity increases by 2-5% for a doubling in population size
• Productivity falls by 6% for a doubling in number of municipalities
(for given population size)

27
Less fragmented urban agglomerations have experienced higher economic growth

Higher administrative fragmentation is associated with higher
segregation of people in different municipalities
28
Hypothesis: Fragmented metropolitan governance can facilitate segregation at the level of local units.
-.05
0
.05
.1.1
5
Ine
qu
alit
y b
etw
een
loca
l ju
risd
ictio
ns,
(C
om
po
ne
nt p
lus
resi
dua
l)
0 .2 .4 .6 .8 1
Administrative fragmentation
Controlling for country fixed effects and other city characteristics (i.e. income , population, spatial structure), higher administrative fragmentation is associated to higher spatial segregation by income in different municipalities

What do we know about Metropolitan governance?

• Approximately 280 metropolitan areas with more than 500,000 inhabitants exist in OECD countries
• Two-thirds of them have some form of metropolitan authority
• Great variety in tasks and competencies
Metropolitan authorities
No metropolitan authority
31%
Metropolitan authority without
regulatory powers
51%
Metropolitan authority with
regulatory powers
18%

21.2
78
1.5
15.5
0
10
20
30
40
50
60
70
80
90
Median Budget, USD per capita Median Staff
Legislative/Regulatory Powers No Legislative/Regulatory Powers
Source: 2nd Metropolitan Governance Survey, n = 56
MGBs with regulatory powers have larger
staff and higher per capita budgets
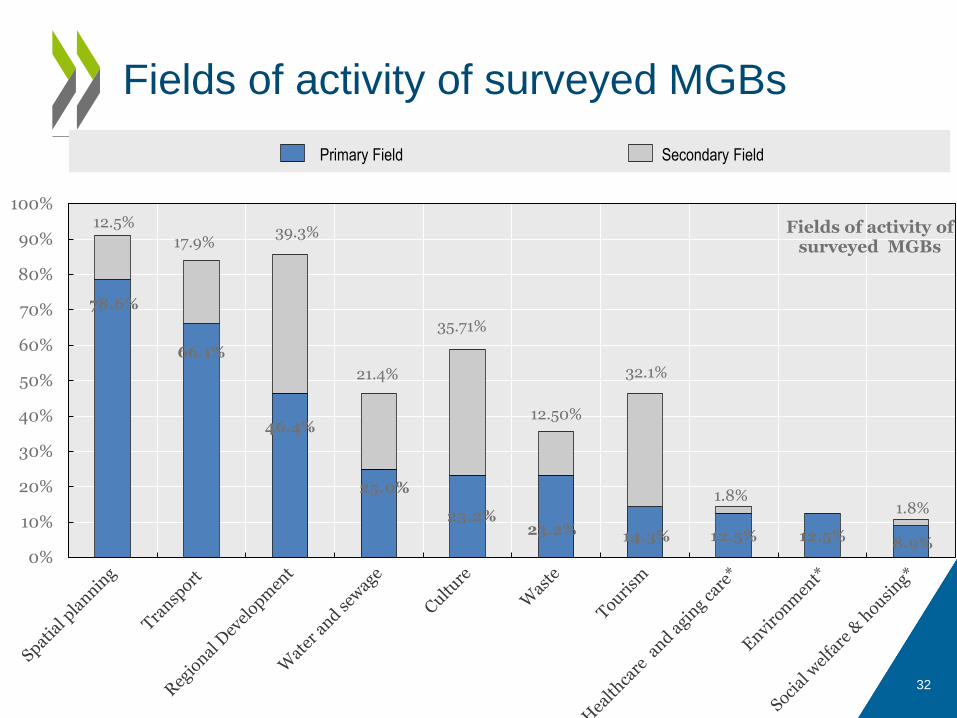
Fields of activity of surveyed MGBs
32
78.6%
66.1%
46.4%
25.0%
23.2%23.2% 14.3% 12.5% 12.5% 8.9%
12.5%
17.9%39.3%
21.4%
35.71%
12.50%
32.1%
1.8%1.8%
0%
10%
20%
30%
40%
50%
60%
70%
80%
90%
100%
Fields of activity of surveyed MGBs
Primary Field Secondary Field

3.9
12.0
3.4
25.4
6.4
21.2
373
0
5
10
15
20
25
30
35
40
45
50
Transfers -Subnational
level
Transfers -Government
Transfers -Municipalities
Serviceprovision fees
Chargemember fees
Othersources**
MGB can levytaxes
Source: 2nd Metropolitan Governance Survey, n = 56
Median per capita budget (USD) by source
of funding

62.5% 64.3% 42.9%
30.4% 16.1%
25%
0%
10%
20%
30%
40%
50%
60%
70%
80%
90%
100%
Local Governments(Municipalities)
Subnational Governments National Governments
A leading role A minor role
Source: 2nd Metropolitan Governance Survey, n = 56
Role of different levels of governments
in establishing MGBs

44.6%
23.2%
23.2%
7.1%
1.8%
Mandated by national/state law
National or State law, non mandatory
Voluntary but enforceable agreement
Entirely informal agreement
Home rule charter
Source: 2nd Metropolitan Governance Survey, n = 56
Legal basis of surveyed MGBs

What are the effects of Metropolitan governance?

• Urban sprawl creates negative externalities in Metropolitan areas (MAs)
• Cooperation is a way to internalize the externalities when making policy decisions
• -> Sprawl decreased in MAs with governance body, but increased in those without!
Governance bodies can reduce sprawl
Difference significant at the 99%-level after controlling for log-population levels and country specific trends.
-0.8
-0.6
-0.4
-0.2
0
0.2
0.4
0.6
0.8
1
1.2
1.4
With GovernanceBody
Without GovernanceBody
Change in Urban Sprawl

Governance bodies can increase well-being
55%
60%
65%
70%
75%
80%
With TransportAuthorities
Without TransportAuthorities
Share of Citizens Satisfied with Public Transport• Citizens are more
satisfied in MAs that have sectoral authorities for public transport
• Those MAs have also lower pollution levels (PM)
Based on European Urban Audit perception survey. Difference significant at 95% level.

• Within countries, cities with fragmented governance structures have lower levels of productivity.
– For a given population size, a metropolitan area with twice the number of municipalities is associated with 5-6% lower productivity.
• Effect mitigated by almost half when a governance body at the metropolitan level exists.
39
Governance bodies positively affect economic productivity

0
5000
10000
15000
20000
25000
30000
35000
Property(buildings,
infrastructure)
Land Machinery &Equipment
Inventories Other naturalresources
Intellectualproperty
Other nonfinancialassests
Cultivatedbiologicalresources
Land and property are by far the most
important forms of capital
Disaggregated capital stock (six-country sample)U$ billion PPP
Note: Data includes Australia, Canada, Czech Republic, France, Japan and Korea.Source: OECD National Accounts Table 9B

The amount of developed land per capita in
urban areas differs across the OECD
0
200
400
600
800
1000
1200
1400
1600
1800
2000
Developed land per capita in urban cores (in m²) Developed land per capita in commuting zones (in m²)
Source: OECD calculations based on Corine Land Cover and National Land Cover Database
Developed land per capita in urban areas
*All data is based on the OECD definition of Functional Urban Areas (FUAs)

Land use in urban cores and commuting
zones in Europe
Urban Cores
010
20
30
0 200 600400 800 10000
10
20
30
0 200 600400 800 1000Nu
mb
er
of
metr
op
olita
n a
rea
s
Developed land per capita in m² Developed land per capita in m²
Commuting zones
Source: OECD calculations based on Corine Land Cover data

Developed land is growing everywhere…
0.0%
0.5%
1.0%
1.5%
2.0%
2.5%
Annual % growth of developed land in commuting zone Annual % growth of developed land in core
Annual growth rates of developed land between 2000 and 2012
Source: OECD calculations based on Corine Land Cover and National Land Cover Database

-1.0%
-0.8%
-0.6%
-0.4%
-0.2%
0.0%
0.2%
0.4%
0.6%
0.8%
1.0%
1.2%
Annual percentage change in developed land per capita 2000 - 2012
…but per capita land use is declining in
many countries
Per capita growth of developed land in functional urban areas (cores and commuting zones combined)

Restrictive land use policies can lead to
rising housing costs
An
nu
al
ch
an
ge
ho
us
e p
ric
es
(2
00
0-2
012
)
Annual change in developed land per capita (2000-2012)
• Land use regulations should aim to prevent sprawl…
• …but have to provide sufficient space to construct housing for growing populations
• Otherwise, housing costs rise
-4%
-3%
-2%
-1%
0%
1%
2%
3%
4%
5%
6%
-1.0% -0.5% 0.0% 0.5% 1.0%

Very little densification is taking place
• Very little densification of building stock on-going since 2000
• Less than 0.01% of developed land in data has changed to a higher density class in Europe; less than 1% has changed in the U.S.
• Caveat: existing data not ideal to measure density; only two density classes for Europe; four density classes for the U.S.
Europe United States
Densified land since 2000/01
Land with constant density since 2000/01
Source: OECD calculations based on Corine Land Cover and National Land Cover Database

• Many cities have densities similar to when they were much smallerLow density neighbourhoods that were once at the urban fringe are now within urban cores without having densified
• Greater densities are needed to adapt urban form and build housing for greater populations
• Public spaces need to be of high quality in denser environments to ensure well-being
High quality density is needed

How to make planning more flexible and
foster good land use?
How land is used
Public policies aimed at steering land use
• Spatial planning• Transport planning• Land use planning• Environmental regulations • Building code regulations
Public policies not targeted at land use
• Tax policies • Transport taxes and subsidies• Fiscal systems and inter-
governmental transfers • Agricultural policies • Energy policies
How land is permitted to be used How individuals and businesses want to use land

Fiscal and tax systems incentivise:
i. local governments’ planning policies
ii. land use decisions by firms and individuals
Incentives need to be better aligned with land use objectives
Aligning fiscal and tax incentives to land
use objectives

Examples: How fiscal and tax systems
influence land use
In some countries, local governments obtain a large share of revenues from business taxes
Local governments have incentives to allocate as much land as possible to commercial uses to maximise tax revenues.
In some countries, ownership of single-family homes receives
preferential tax treatment
Residents have incentives to live in low-density neighbourhoods in
sub-urban areas

Examples: How fiscal and tax systems
influence land use
Agriculture is heavily subsidised across most of the OECD
Without subsidies, agricultural land uses would change
Many countries make expenses for commuting by car tax
deductible
Lower costs of commuting provide incentives to live further from the place of work (often in peri-urban areas) and increase
car reliance

Key message: Need to pay greater attention
to incentives
• By paying greater attention to the incentives that public policy provides for land use, planning can become less restrictive and more effective
• Taxes and fiscal systems matter most
• Regulatory and economic instruments need to be combined
Effective governance mechanisms are a prerequisite for a successful implementation

Incentive-based land use policies
require monitoring and evaluation
• The use of fiscal instruments to steer land use can result in land patterns that are more desirable but at the same time less predictable
• Systematic evaluations of land use policies are lacking
• Knowledge about evaluation practices is rare
– data on land use and land use regulations is scarce

MLG INDICATORS
55

Co-ordination across sectors seems to have improved at the national level butremains a big challenge at the subnational level:
Implementation: sectoral coordination
in action
1
10
16
14
18
16
21
2
13
13
14
17
22
18
4
1
2
1
0
1
0 5 10 15 20 25 30 35 40 45
Other
Regional development agencies design andimplement programmes under the national…
Formalised agreements among levels ofgovernment (e.g. contracts, partnerships, etc.)
Formal consultation of subnationalgovernments when developing national…
Regular inter-governmental dialogue
Regional development strategies/programmesaligned with the national framework/objectives
Co-financing arrangements among levels ofgovernment (e.g., matching grants)
Yes, before 2014 Yes, after 2014
• At the national level, 22 Adherents have adoptedintegrated investment strategies with aterritorial dimension. Notably, progress seems tobe made on data collection by Adherents: 17Respondents release consolidated data on PI by region(TL2 or TL3)
• A majority of Adherents have implementedmechanisms to co-ordinate public investmentsacross sectors (Czech Republic, Italy, Poland,Portugal, Netherlands, UK, among others).
• Still, cross-sectoral co-ordination for investmentplanning represents a significant challenge at theSN level: 80% of European SNGs consider the lack ofco-ordination across sectors is a major challenge
• Adherents are increasingly aligning regionaldevelopment strategies with national objectives
Across national and subnational governments, has your country developed or
strengthened any of the mechanisms listed below to co-ordinate public investment for
regional development?

Adherents are increasingly co-ordinating public investment policies vertically:
Implementation: vertical coordination
in action
• Co-financing arrangements aswell as platforms for regularinter-governmental dialogueare two of the most populargovernance instruments usedby Adherents to co-ordinateinterests vertically (Australia,Luxembourg, Sweden, amongothers)
• Co-ordination platforms, ingeneral, do not have decision-making authority
• Still, from the subnationalperspective, co-ordinationwith the national level isstrongly challenging: for 84% of
1
10
16
14
18
16
21
2
13
13
14
17
22
18
4
1
2
1
0
1
0 5 10 15 20 25 30 35 40 45
Other
Regional development agencies design andimplement programmes under the national…
Formalised agreements among levels ofgovernment (e.g. contracts, partnerships, etc.)
Formal consultation of subnationalgovernments when developing national…
Regular inter-governmental dialogue
Regional development strategies/programmesaligned with the national framework/objectives
Co-financing arrangements among levels ofgovernment (e.g., matching grants)
Yes, before 2014 Yes, after 2014
Across national and subnational governments, has your country developed or
strengthened any of the mechanisms listed below to co-ordinate public investment for
regional development?
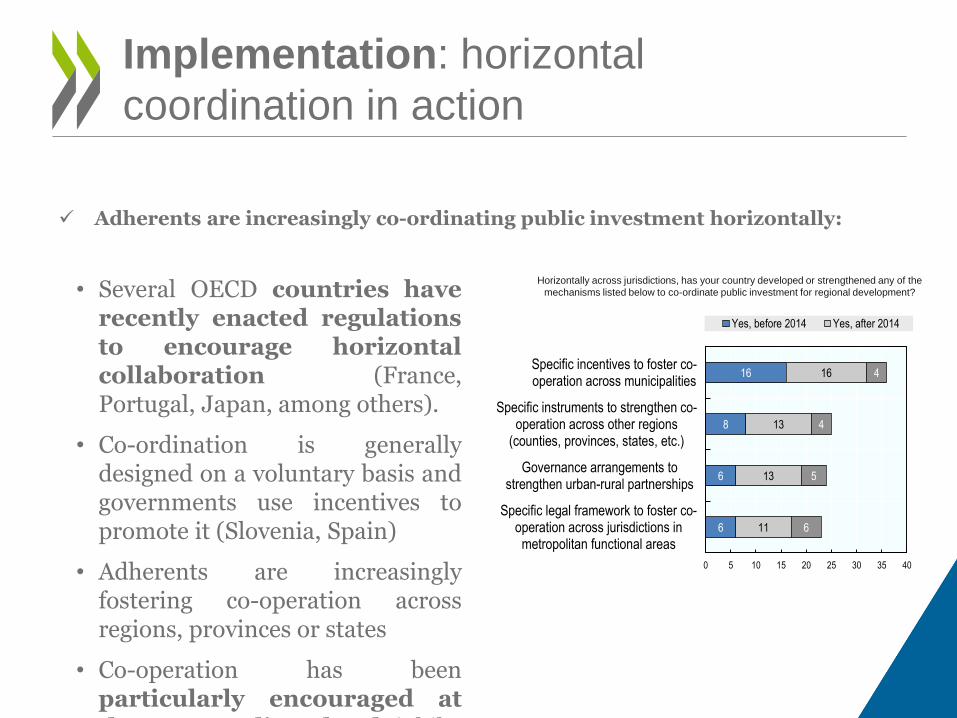
Adherents are increasingly co-ordinating public investment horizontally:
Implementation: horizontal
coordination in action
6
6
8
16
11
13
13
16
6
5
4
4
0 5 10 15 20 25 30 35 40
Specific legal framework to foster co-operation across jurisdictions inmetropolitan functional areas
Governance arrangements tostrengthen urban-rural partnerships
Specific instruments to strengthen co-operation across other regions
(counties, provinces, states, etc.)
Specific incentives to foster co-operation across municipalities
Yes, before 2014 Yes, after 2014
Horizontally across jurisdictions, has your country developed or strengthened any of the
mechanisms listed below to co-ordinate public investment for regional development? • Several OECD countries haverecently enacted regulationsto encourage horizontalcollaboration (France,Portugal, Japan, among others).
• Co-ordination is generallydesigned on a voluntary basis andgovernments use incentives topromote it (Slovenia, Spain)
• Adherents are increasinglyfostering co-operation acrossregions, provinces or states
• Co-operation has beenparticularly encouraged atthe metropolitan level (Chile,

The capacity challenge remains the most important bottleneck:
Implementation: the capacity
bottleneck
• Ex ante assessment of the long-term impact and risks ofpublic investments is one of the weakest aspects ofgovernment capacity
• At the SN level the impact of ex-ante evaluationsremains limited: 2/3 of EU SNGs EU believe that ex-anteanalyses are performed, but that their results are notconsistently used in decision-making.
• Stakeholder involvement in the design phase hasimproved: 15 Respondents have mechanisms to engageprivate sector representative in defining priorities for PI(Australia, Austria, Czech Republic, Denmark, Italy, Mexico,Netherlands, the UK, among others)
• At the SN level, stakeholder engagement representsan important challenge: 65% of SNGs reportedinsufficient involvement of civil society, citizens or NGOs inthe choice of infrastructure projects
1
7
8
8
9
11
11
12
15
18
0 2 4 6 8 10 12 14 16 18 20
Other
Requirement to involve the private sector in thedesign or/and financing of public investment
Matching requirements
Requirements that a portion of funds are allocated toprojects which require co-operation across…
Implementation of certain legislation or regulationsreforms
Use of environmental impact assessment (e.g. onclimate change)
Timeframe of spending
Use of ex ante economic evaluation tools (cost-benefit, cost effectiveness, or multi-criteria…
Earmarking all or parts of grants to specific thematicpriorities
Reporting requirements
Has your country developed or strengthened any of the mechanisms listed below
to encourage the effective performance of public investment for regional
development?

Adherents need to strengthen capacities to leverage private investment:
Implementation: leveraging public
investment
2%
2%
1%
4%
12%
7%
7%
10%
9%
6%
23%
20%
19%
21%
20%
43%
51%
44%
43%
35%
25%
20%
26%
24%
27%
0% 10% 20% 30% 40% 50% 60%
Capacity to design and manage public investment& PPPs funded by the EU
Structural Funds and other EU programmes
Capacity to get involved in public-privatepartnerships
Capacity to manage complex public procurementprocedures
Capacity to use financial instruments/innovativefinancial tools
Capacity to submit projects to the EuropeanInvestment Bank and/or national promotional
banks
Regarding the quality of public administration, for which of the following aspects of the public administration in your city/region do you see
potential challenges to public investment?- CAPACITY aspects -
No opinion Not a challenge Minor challenge
Challenge Major challenge
5%
18%
24%
28%
31%
0% 10% 20% 30% 40%
Other
Easier for firms and localadministration to borrow from
traditional channels
Burdensome administrativeprocedures
Difficult to find other investmentpartners
Constraints of capacity within thepublic administration at local level
What challenges do you see in setting up an investment platform under the EFSI? (answered only by
those informed about investment platforms; as % of approximately one third of respondents; n=114)
• Private involvement to finance investments at theSN level remains one of the most importantchallenges
• SNGs make little use of external financingoptions for public investment:
o Limited capacity to use innovative financial tools,manage complex public procurement procedures,combine different streams of financing andfunding, lack of appropriate skills to manage PPPs
• At the SN level, access to financing is oftenlimited to the credit market (loans), eliminatingaccess to capital markets (bonds).
• PPPs at the SN level need to be furtherdeveloped and be accompanied by adequatecapacity-building to use these tools: only 8Respondents have particular legislation onsubnational PPPs

How Adherents are addressing the capacity challenge:
Implementation: enhancing capacities
• The lack of appropriate skills andexpertise to plan, manage andevaluate public investment is a mainbarrier for effective publicinvestments, especially at the SN level
• A majority of Adherents have in placesome mechanism to strengthentechnical skills of policy-makers
• Some Adherents have also adoptednew IT tools or joint e-governmentplatforms to narrow the capacity gap(Australia, Colombia, the EU)
• The responsibilities for capacitybuilding at the national level are oftenunclear
7
14
14
16
17
0 5 10 15 20
Incentives to pool expertiseacross subnational…
Public investment managementtraining at the…
New IT tools to facilitate publicinvestment…
Specific government strategy tostrengthen their capabilities to…
Technical assistance for contractmanagement capacity (e.g.…
Has your country introduced the policies/mechanisms listed below to reinforce the
skills and capacities of national and subnational public officials and institutions to
better support public investment for regional development?

Ensuring sound framework conditions to make the most of public investmentsremains challenging:
Implementation: enhancing
frameworks
• Adherents have made important advances inincreasing budgeting transparency at thenational level (transparency portals): since 2014, 13countries have make budgetary information of PIpublicly available
• Adherents need to better develop multi-yearapproach to investment by connecting planningand budgeting frameworks
• Excessive administrative procedures and redtape is a major challenge, especially at the SN level.
• A high number of Adherents recognize the need tominimise the administrative burdenassociated with PI projects: 15 countries areplanning to adopt policies for the simplification ofregulatory processes.
19%
21%
25%
24%
25%
25%
24%
26%
32%
35%
34%
36%
33%
33%
37%
42%
50%
53%
34%
35%
40%
42%
40%
42%
45%
44%
40%
40%
42%
41%
45%
46%
41%
42%
36%
37%
No relevant up-to-date data available…
Lack of adequate own expertise to…
Lack of long-term/strategic planning…
Ex-ante analyses/appraisals not…
Insufficient involvement of civil…
Monitoring not used as a tool for…
Ex-ante analyses not adequately…
Lack of (ex-post) impact evaluations
Multiple contact points (absence of a…
Lack of joint investment strategy with…
Lack of incentive to cooperate across…
Lack of political will to work across…
Lack of coordination across sectors
Co-financing requirements for central…
Lack of long-term strategy at central…
Local needs are different from those…
Lenghty procurement procedures
Excessive administrative procedures…
Major challenge Somewhat of a challenge
The presentation draws from:
Ahrend, Farchy, Kaplanis and Lembcke (2014), “What Makes Cities More Productive? Agglomeration economies & the role of urban governance: Evidence from 5 OECD Countries”
Ahrend and Schumann (2014) “Does regional economic growth depend on proximity to urban centres?”
Ahrend, Gamper and Schumann (2014) “The OECD Metropolitan Governance Database: A Quantitative Description of Governance Structures in Large Urban Areas”
Ahrend and Lembcke (2016) ”Does It Pay to Live in Big(ger) Cities?”
OECD (2017), The Governance of Land Use in OECD Countries
OECD (2015) The Metropolitan Century: Understanding Urbanisation and its Consequences
OECD (2015) Governing the City
OECD (2012) Redefining Urban: a new way to measure metropolitan areas
Thank you
63

RURAL URBAN LINKAGES
64

Space matters: proximity to cities benefits
surrounding rural & intermediate regions
65

Sources of catching-up: proximity to
cities
66
Rural remote regions present a higher variation in productivity growth rates than other types of regions
Annual average labour productivity
growth, 2000-12 Standard deviation
Coefficient of variation
Predominantly urban
1.01% 1.02% 1.019
Intermediate 1.07% 1.09% 1.024
Predominantly rural close to
cities 1.36% 1.32%
0.972
Predominantly rural remote
0.70% 1.15% 1.641
Note: Labour productivity is defined as real GDP per employee. GDP is measured at PPP constant 2010 US Dollars, using SNA2008 classification; employment is measured at place of work. The coefficient of variation represents the ratio of the standard deviation over the mean.
Source: OECD Regional Outlook 2016

Why are we interested in urban-rural partnerships?
Rural and urban areas are interconnected through different linkages (commuting, provision of amenities, transportation, economic transactions etc.)
The way these linkages are governed has an impact on the economic development and people’s wellbeing both in urban and rural communities
Better understanding of interdependencies (unit of analysis = self-contained space of relationship, functional region)
Design governance solutions to facilitate an integrated approach that improves the outcome of the rural-urban partnerships
67

The policy use of functional regions: challenges and experiences
•High heterogeneity in forms of cooperation
•The governance model of Rurban partnerships varies on the basis of different issues
a) Management oriented vs. project oriented
b) Flexibility of the boundaries
c) Main objectives and domains of intervention
d) Single purpose vs. holistic approach
e) Top down vs. bottom-up processes
f) National framework (degree of formal acknowledgment)
68