Spatial Distribution of the Risk of Dengue and the Entomological ...
9
Spatial Distribution of the Risk of Dengue and the Entomological Indicators in Sumare ´, State of Sa ˜o Paulo, Brazil Gerson Laurindo Barbosa 1 *, Maria Rita Donalı´sio 2 , Celso Stephan 2 , Roberto Wagner Lourenc ¸o 3 , Valmir Roberto Andrade 1 , Marylene de Brito Arduino 1 , Virgilia Luna Castor de Lima 1 1 Superintendence for Control of Endemic Diseases, State Health Department, Sa ˜o Paulo, Sa ˜o Paulo, Brazil, 2 Department of Public Health, Faculty of Medical Sciences, State University of Campinas, Campinas, Sa ˜o Paulo, Brazil, 3 Department of Environmental Engineering, State University of Sa ˜o Paulo, Sorocaba, Sa ˜o Paulo, Brazil Abstract Dengue fever is a major public health problem worldwide, caused by any of four virus (DENV-1, DENV-2, DENV-3 and DENV- 4; Flaviviridae: Flavivirus), transmitted by Aedes aegypti mosquito. Reducing the levels of infestation by A. aegypti is one of the few current strategies to control dengue fever. Entomological indicators are used by dengue national control program to measure the infestation of A. aegypti, but little is known about predictive power of these indicators to measure dengue risk. In this spatial case-control study, we analyzed the spatial distribution of the risk of dengue and the influence of entomological indicators of A. aegypti in its egg, larva-pupa and adult stages occurring in a mid-size city in the state of Sa ˜o Paulo. The dengue cases were those confirmed by the city’s epidemiological surveillance system and the controls were obtained through random selection of points within the perimeter of the inhabited area. The values of the entomological indicators were extrapolated for the entire study area through the geostatistical ordinary kriging technique. For each case and control, the respective indicator values were obtained, according with its geographical coordinates and analyzed by using a generalized additive model. Dengue incidence demonstrated a seasonal behavior, as well as the entomological indicators of all mosquito’s evolutionary stages. The infestation did not present a significant variation in intensity and was not a limiting or determining factor of the occurrence of cases in the municipality. The risk maps of the disease from crude and adjusted generalized additive models did not present differences, suggesting that areas with the highest values of entomological indicators were not associated with the incidence of dengue. The inclusion of other variables in the generalized additive models may reveal the modulatory effect for the risk of the disease, which is not found in this study. Citation: Barbosa GL, Donalı ´sio MR, Stephan C, Lourenc ¸o RW, Andrade VR, et al. (2014) Spatial Distribution of the Risk of Dengue and the Entomological Indicators in Sumare ´, State of Sa ˜o Paulo, Brazil. PLoS Negl Trop Dis 8(5): e2873. doi:10.1371/journal.pntd.0002873 Editor: Roberto Barrera, Centers for Disease Control and Prevention, Puerto Rico, United States of America Received June 10, 2013; Accepted April 7, 2014; Published May 15, 2014 Copyright: ß 2014 Barbosa et al. This is an open-access article distributed under the terms of the Creative Commons Attribution License, which permits unrestricted use, distribution, and reproduction in any medium, provided the original author and source are credited. Funding: This study was funded by FAPESP - Foundation for Research Support of the Sa ˜o Paulo State, process No. 2009/53123-7. The funders had no role in study design, data collection and analysis, decision to publish, or preparation of the manuscript. Competing Interests: The authors have declared that no competing interests exist. * E-mail: [email protected] Introduction Dengue is a disease caused by any of four virus (DENV-1, DENV-2, DENV-3 and DENV-4; Flaviviridae: Flavivirus) and has become a major global health issue. An epidemic similar to dengue was registered in 1699 in Central America. In Philadelphia, USA, a major epidemic occurred in 1780 and epidemics became common in the early 20th century [1]. There have been references of dengue epidemics, in Brazil, since 1923 but with no laboratorial confirmation until 1986. Dengue fever outbreaks have occurred in several states since 1986, with the identification of the DENV-1 virus in 1986 [2], DENV-2 in 1990 [3], DENV-3 in 2001 [4] and DENV-4, isolated in Manaus from 2005 to 2007 [5] and in Sa ˜o Paulo in 2011 [6]. All four serotypes are currently circulating in Brazil [6]. In 2010, with over one million cases of the disease, the highest reported incidence occurred in the Northern and Central-Western regions, with 621.7 and 1,536.8 cases per 100,000 inhabitants, respectively. In these regions, the majority of municipalities presented rates higher than 300 per 100,000 inhabitants [7,8]. In the state of Sa ˜o Paulo, the incidence in 2010 was of 503 cases per 100,000 inhabitants [8]. A. aegypti is still the only vector of epidemiological importance as the transmitter of the dengue virus (DENV) in the Americas [9,10]. Reducing levels of A. aegypti infestation is one of just a few strategies for disease control, since there is no vaccine available yet. Other undirected strategies refer to basic sanitation, garbage collection and proper water supply, which would eliminate the need for water storage. Besides, we have education activities to improve population commitment in order to eliminate breeding sites. The dengue national control program uses sampling methods to collect data in the field and to build indicators of A. aegypti presence, in the various stages of the vector life cycle, mainly traditional Breteau index and House index [11]. Although adult forms have a direct impact on virus transmission, the most used indicators to measure vector infestation are based on larvae, pupae and eggs [12]. Some studies demonstrate the direct relationship among infestation levels with the risk of epidemics in various regions of PLOS Neglected Tropical Diseases | www.plosntds.org 1 May 2014 | Volume 8 | Issue 5 | e2873
Transcript of Spatial Distribution of the Risk of Dengue and the Entomological ...

Spatial Distribution of the Risk of Dengue and theEntomological Indicators in Sumare, State of Sao Paulo,BrazilGerson Laurindo Barbosa1*, Maria Rita Donalısio2, Celso Stephan2, Roberto Wagner Lourenco3, Valmir
Roberto Andrade1, Marylene de Brito Arduino1, Virgilia Luna Castor de Lima1
1 Superintendence for Control of Endemic Diseases, State Health Department, Sao Paulo, Sao Paulo, Brazil, 2 Department of Public Health, Faculty of Medical Sciences,
State University of Campinas, Campinas, Sao Paulo, Brazil, 3 Department of Environmental Engineering, State University of Sao Paulo, Sorocaba, Sao Paulo, Brazil
Abstract
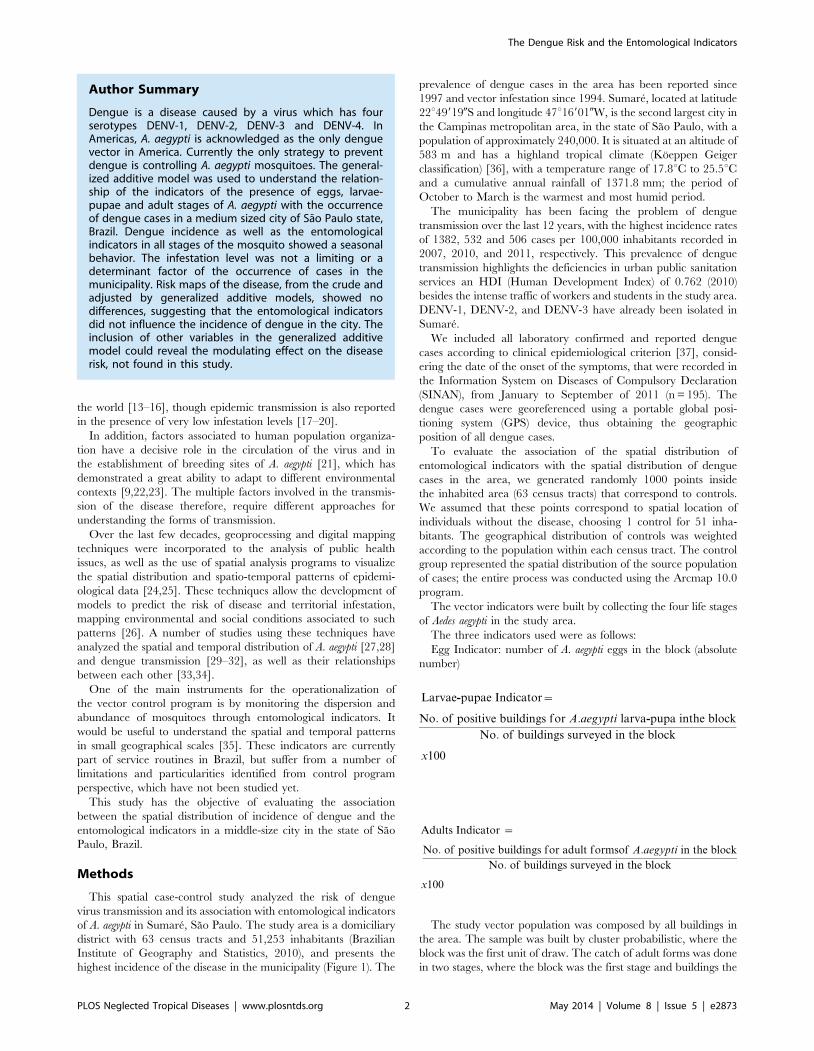
Dengue fever is a major public health problem worldwide, caused by any of four virus (DENV-1, DENV-2, DENV-3 and DENV-4; Flaviviridae: Flavivirus), transmitted by Aedes aegypti mosquito. Reducing the levels of infestation by A. aegypti is one ofthe few current strategies to control dengue fever. Entomological indicators are used by dengue national control programto measure the infestation of A. aegypti, but little is known about predictive power of these indicators to measure denguerisk. In this spatial case-control study, we analyzed the spatial distribution of the risk of dengue and the influence ofentomological indicators of A. aegypti in its egg, larva-pupa and adult stages occurring in a mid-size city in the state of SaoPaulo. The dengue cases were those confirmed by the city’s epidemiological surveillance system and the controls wereobtained through random selection of points within the perimeter of the inhabited area. The values of the entomologicalindicators were extrapolated for the entire study area through the geostatistical ordinary kriging technique. For each caseand control, the respective indicator values were obtained, according with its geographical coordinates and analyzed byusing a generalized additive model. Dengue incidence demonstrated a seasonal behavior, as well as the entomologicalindicators of all mosquito’s evolutionary stages. The infestation did not present a significant variation in intensity and wasnot a limiting or determining factor of the occurrence of cases in the municipality. The risk maps of the disease from crudeand adjusted generalized additive models did not present differences, suggesting that areas with the highest values ofentomological indicators were not associated with the incidence of dengue. The inclusion of other variables in thegeneralized additive models may reveal the modulatory effect for the risk of the disease, which is not found in this study.
Citation: Barbosa GL, Donalısio MR, Stephan C, Lourenco RW, Andrade VR, et al. (2014) Spatial Distribution of the Risk of Dengue and the EntomologicalIndicators in Sumare, State of Sao Paulo, Brazil. PLoS Negl Trop Dis 8(5): e2873. doi:10.1371/journal.pntd.0002873
Editor: Roberto Barrera, Centers for Disease Control and Prevention, Puerto Rico, United States of America
Received June 10, 2013; Accepted April 7, 2014; Published May 15, 2014
Copyright: � 2014 Barbosa et al. This is an open-access article distributed under the terms of the Creative Commons Attribution License, which permitsunrestricted use, distribution, and reproduction in any medium, provided the original author and source are credited.
Funding: This study was funded by FAPESP - Foundation for Research Support of the Sao Paulo State, process No. 2009/53123-7. The funders had no role instudy design, data collection and analysis, decision to publish, or preparation of the manuscript.
Competing Interests: The authors have declared that no competing interests exist.
* E-mail: [email protected]
Introduction
Dengue is a disease caused by any of four virus (DENV-1,
DENV-2, DENV-3 and DENV-4; Flaviviridae: Flavivirus) and has
become a major global health issue. An epidemic similar to dengue
was registered in 1699 in Central America. In Philadelphia, USA,
a major epidemic occurred in 1780 and epidemics became
common in the early 20th century [1].
There have been references of dengue epidemics, in Brazil,
since 1923 but with no laboratorial confirmation until 1986.
Dengue fever outbreaks have occurred in several states since 1986,
with the identification of the DENV-1 virus in 1986 [2], DENV-2
in 1990 [3], DENV-3 in 2001 [4] and DENV-4, isolated in
Manaus from 2005 to 2007 [5] and in Sao Paulo in 2011 [6]. All
four serotypes are currently circulating in Brazil [6]. In 2010,
with over one million cases of the disease, the highest reported
incidence occurred in the Northern and Central-Western regions,
with 621.7 and 1,536.8 cases per 100,000 inhabitants, respectively.
In these regions, the majority of municipalities presented rates
higher than 300 per 100,000 inhabitants [7,8]. In the state of Sao
Paulo, the incidence in 2010 was of 503 cases per 100,000
inhabitants [8].
A. aegypti is still the only vector of epidemiological importance as
the transmitter of the dengue virus (DENV) in the Americas
[9,10]. Reducing levels of A. aegypti infestation is one of just a few
strategies for disease control, since there is no vaccine available
yet. Other undirected strategies refer to basic sanitation, garbage
collection and proper water supply, which would eliminate the
need for water storage. Besides, we have education activities to
improve population commitment in order to eliminate breeding
sites.
The dengue national control program uses sampling methods
to collect data in the field and to build indicators of A. aegypti
presence, in the various stages of the vector life cycle, mainly
traditional Breteau index and House index [11]. Although adult
forms have a direct impact on virus transmission, the most used
indicators to measure vector infestation are based on larvae, pupae
and eggs [12].
Some studies demonstrate the direct relationship among
infestation levels with the risk of epidemics in various regions of
PLOS Neglected Tropical Diseases | www.plosntds.org 1 May 2014 | Volume 8 | Issue 5 | e2873
the world [13–16], though epidemic transmission is also reported
in the presence of very low infestation levels [17–20].
In addition, factors associated to human population organiza-
tion have a decisive role in the circulation of the virus and in
the establishment of breeding sites of A. aegypti [21], which has
demonstrated a great ability to adapt to different environmental
contexts [9,22,23]. The multiple factors involved in the transmis-
sion of the disease therefore, require different approaches for
understanding the forms of transmission.
Over the last few decades, geoprocessing and digital mapping
techniques were incorporated to the analysis of public health
issues, as well as the use of spatial analysis programs to visualize
the spatial distribution and spatio-temporal patterns of epidemi-
ological data [24,25]. These techniques allow the development of
models to predict the risk of disease and territorial infestation,
mapping environmental and social conditions associated to such
patterns [26]. A number of studies using these techniques have
analyzed the spatial and temporal distribution of A. aegypti [27,28]
and dengue transmission [29–32], as well as their relationships
between each other [33,34].
One of the main instruments for the operationalization of
the vector control program is by monitoring the dispersion and
abundance of mosquitoes through entomological indicators. It
would be useful to understand the spatial and temporal patterns
in small geographical scales [35]. These indicators are currently
part of service routines in Brazil, but suffer from a number of
limitations and particularities identified from control program
perspective, which have not been studied yet.
This study has the objective of evaluating the association
between the spatial distribution of incidence of dengue and the
entomological indicators in a middle-size city in the state of Sao
Paulo, Brazil.
Methods
This spatial case-control study analyzed the risk of dengue
virus transmission and its association with entomological indicators
of A. aegypti in Sumare, Sao Paulo. The study area is a domiciliary
district with 63 census tracts and 51,253 inhabitants (Brazilian
Institute of Geography and Statistics, 2010), and presents the
highest incidence of the disease in the municipality (Figure 1). The
prevalence of dengue cases in the area has been reported since
1997 and vector infestation since 1994. Sumare, located at latitude
22u499190S and longitude 47u169010W, is the second largest city in
the Campinas metropolitan area, in the state of Sao Paulo, with a
population of approximately 240,000. It is situated at an altitude of
583 m and has a highland tropical climate (Koeppen Geiger
classification) [36], with a temperature range of 17.8uC to 25.5uCand a cumulative annual rainfall of 1371.8 mm; the period of
October to March is the warmest and most humid period.
The municipality has been facing the problem of dengue
transmission over the last 12 years, with the highest incidence rates
of 1382, 532 and 506 cases per 100,000 inhabitants recorded in
2007, 2010, and 2011, respectively. This prevalence of dengue
transmission highlights the deficiencies in urban public sanitation
services an HDI (Human Development Index) of 0.762 (2010)
besides the intense traffic of workers and students in the study area.
DENV-1, DENV-2, and DENV-3 have already been isolated in
Sumare.
We included all laboratory confirmed and reported dengue
cases according to clinical epidemiological criterion [37], consid-
ering the date of the onset of the symptoms, that were recorded in
the Information System on Diseases of Compulsory Declaration
(SINAN), from January to September of 2011 (n = 195). The
dengue cases were georeferenced using a portable global posi-
tioning system (GPS) device, thus obtaining the geographic
position of all dengue cases.
To evaluate the association of the spatial distribution of
entomological indicators with the spatial distribution of dengue
cases in the area, we generated randomly 1000 points inside
the inhabited area (63 census tracts) that correspond to controls.
We assumed that these points correspond to spatial location of
individuals without the disease, choosing 1 control for 51 inha-
bitants. The geographical distribution of controls was weighted
according to the population within each census tract. The control
group represented the spatial distribution of the source population
of cases; the entire process was conducted using the Arcmap 10.0
program.
The vector indicators were built by collecting the four life stages
of Aedes aegypti in the study area.
The three indicators used were as follows:
Egg Indicator: number of A. aegypti eggs in the block (absolute
number)
Larvae-pupae Indicator~
No: of positive buildings for A:aegypti larva-pupa inthe block
No: of buildings surveyed in the block
x100
Adults Indicator ~
No: of positive buildings for adult formsof A:aegypti in the block
No: of buildings surveyed in the block
x100
The study vector population was composed by all buildings in
the area. The sample was built by cluster probabilistic, where the
block was the first unit of draw. The catch of adult forms was done
in two stages, where the block was the first stage and buildings the
Author Summary
Dengue is a disease caused by a virus which has fourserotypes DENV-1, DENV-2, DENV-3 and DENV-4. InAmericas, A. aegypti is acknowledged as the only denguevector in America. Currently the only strategy to preventdengue is controlling A. aegypti mosquitoes. The general-ized additive model was used to understand the relation-ship of the indicators of the presence of eggs, larvae-pupae and adult stages of A. aegypti with the occurrenceof dengue cases in a medium sized city of Sao Paulo state,Brazil. Dengue incidence as well as the entomologicalindicators in all stages of the mosquito showed a seasonalbehavior. The infestation level was not a limiting or adeterminant factor of the occurrence of cases in themunicipality. Risk maps of the disease, from the crude andadjusted by generalized additive models, showed nodifferences, suggesting that the entomological indicatorsdid not influence the incidence of dengue in the city. Theinclusion of other variables in the generalized additivemodel could reveal the modulating effect on the diseaserisk, not found in this study.
The Dengue Risk and the Entomological Indicators
PLOS Neglected Tropical Diseases | www.plosntds.org 2 May 2014 | Volume 8 | Issue 5 | e2873

second [38,39]. The catch of larvae-pupae draw was done in one
stage, where all buildings in the block were visited. The catch of
eggs was done in one stage but the buildings where the trap was
placed were selected in a non-probabilistic way.
The first block of the sample was randomly selected and the
others were systematically selected by adding the sample interval
in order to complete the sample number [39].
In each activity we worked monthly in 14 blocks. A total of 400
buildings were visited in the larvae-pupae catch and one in every
three (1/3) buildings were visited to perform the adult forms catch.
To collect the eggs four traps were placed in two buildings in every
block one inside and the other outside the house. All the traps were
surveyed every five days in accordance with the minimum
development time of the biological cycle of the mosquito and
thus avoiding them to configure breeding sites [38,39].
In the catch of larvae-pupae the presence of larvae or pupae of
Aedes aegypti was investigated in all containers with water in
households [40]. The collection of adult forms was performed
indoors and outdoors through dip nets and Nasci aspirators [41].
We used oviposition traps for egg collection consisting of a black
plastic material filled with tap water and hay infusion, with fiber
chipboard for oviposition [42]. The collected eggs were placed for
hatching for species identification.
In order to reduce the interference in the infestation area with
periodic collection of various stages of the mosquito in the same
block away and to avoid distortion in the evaluation of the infes-
tation area, for each month and activity, it was made independent
draw with replacement, i.e., all blocks were included in every draw.
All worked properties were georeferenced using GPS and the
indicators were calculated for each block and the values have been
assigned to their centroids. All points were identified on the digital
map base.
For analysis we aggregated entomological indicators results in
quarters for analyses consistency; the first quarter was February-
March-April (Q1) and the following quarters were built by
extracting the first month (February) and inserting the following
(May) forming the quarter March-April-May (Q2) and so on to Q3
and Q4. The quarterly approach was used to give more consistency
to entomological indicators results because we had only 14
collection data points each month.
The quarterly entomological indicator values of egg, larvae-
pupae and adult forms for each point in the study area were
estimated by a geostatistical interpolation technique called ordinary
kriging, which uses local averages or local trends from sampled
values. Ordinary kriging produces an spatial distribution estimate
of a variable by taking into account adjacent values [43] and it uses
the spatial dependence amongst neighboring samples, expressed in
the semivariogram function [43,44].
For each case and control spatial position, there was a value of
each entomological indicator. Surface from where we obtained
points values were generated by the kriging process for each
quarter, using the Extract Values to Table tool, available in the
Arctoolbox (ArcMap 10.0) software.
We adjusted a generalized additive model (GAM), taking into
account the response variables, the case status (1), control (0), and the
predictive variables, i.e., the entomological indicators, and the spatial
component (geographical coordinates) according to the equation [45]:
log it(yi)~b0zP
bkxkzf (x,y)zei, where,
yi is the response variable, i.e., the case or control status
b0sare the model coefficients,
exp (bk)is the odds ratio
xkis the variable value,
f (x,y)is the geographical coordinate’s smoothing function and
contains the ‘‘band width’’ parameter, in this case, the mosquito’s
flight radius, estimated to be 200 m [46] and
eiis the model’s residue.
The advantage in use of GAM is that it describes the
relationship between outcome and predictors without imposing
Figure 1. Municipality of Sumare, Sao Paulo state, Brazil. Legend of Figure 1: Municipality located in state of Sao Paulo, southeast region ofBrazil. The area studied is shown highlighted.doi:10.1371/journal.pntd.0002873.g001
The Dengue Risk and the Entomological Indicators
PLOS Neglected Tropical Diseases | www.plosntds.org 3 May 2014 | Volume 8 | Issue 5 | e2873

specific parametric forms on the relationship. This method
provides an unified framework for mapping case-control data,
allowing spatial smoothing of binary outcome.
In order to adjust the model, the software R version 2.12.1 was
used, with the epigam and vgam libraries. The epigam library was
developed in the EpiGeo - Spatial Analysis Laboratory for
Epidemiological Data of the Department of the Public Health
from FCM/UNICAMP.
Ethics StatementThe fieldwork was carried out with the consent of the residents,
and no references were made to the names or addresses of the
residents, dengue patients, and control individuals. This project
was approved by the Research Ethics Committee - CEP/
UNITAU, declaration No. 302/12, protocol 459/09.
Results
From February to December of 2011, 4,688 buildings were
inspected and A. aegypti larvae and/or pupae were found in 186
(4%) buildings. We surveyed 1,711 households for the presence of
A. aegypti adult forms. We captured 582 specimens of A. aegypti in
17.7% of the domiciles. The percentage of adult forms was greater
than that of immature forms in the buildings. We collected 11,395
eggs; 65.4% were in the peridomicile area and 34.6% in the intra-
domicile.
Whilst a larger number of eggs were found outdoors than
indoors during the entire period, the number of eggs was larger
indoors than outdoors during the driest months (Table 1). A
similar seasonal pattern was observed for the three indicators
during the hottest and wettest period of the year (February to
April) (Figure 2). During this period, 195 dengue cases were
reported, all of which practically occurred during the first
semester, the hottest and most humid period of the year.
The dengue epidemic curve follows the larva-pupa indicator
curve, where there is an increase up to April and a decrease up to
the last case reported in September. We also observed a similarity
between the curves for the adult forms and egg indicators, i.e.,
a decreasing curve up to the end of the dengue epidemic.
Figure 3 presents the monthly dengue cases (points) and the
quarterly entomological indicators estimated by the ordinary kriging,
showing areas of different infestation intensity, with a gradient of
colors varying from green (lower values) to red (higher values). We
noticed a similarity among indices for all quarters, although some
differences among the three indicators in the quarters can be
pointed out. The Q2 quarter adult index did not agree with the
larva-pupa and egg indices; in Q3 quarter, the larva and pupae
indices did not agree with the adult and egg indices; in the last
quarter, Q4, all the three indices were discordant (Figure 3).
We observed that during Q1, the cases in March were highly
concentrated in the southern region of the map, where the three
indicators presented low values. During Q2, the cases in April
were highly concentrated in the eastern region, with low values for
eggs and adult indicators. The intensity of the epidemic was
reduced during Q3 and Q4, when dengue cases were reported all
over the city, albeit with different patterns of infestation.
We observed the incidence of dengue as well as the presence of
the vector in different stages of its biological cycle throughout the
area during the entire period of the study. However, there was
little spatial coincidence amongst the incidence of dengue and the
intensity of the entomological indicators. The exceptions were the
presence of case clusters and high adult infestation in Q2 and Q3,
and also a degree of agreement between high levels of larva-pupa
infestation and incidence of dengue in Q3 (Figure 3).
Ta
ble
1.
Ento
mo
log
ical
ind
icat
ors
of
Aed
esa
egyp
tist
age
s:e
gg
,la
rvae
-pu
pae
and
adu
ltfo
rms,
inth
em
un
icip
alit
yo
fSu
mar
e-S
P,
fro
mFe
bru
ary
toD
ece
mb
er
20
11
.
Mo
nth
De
ng
ue
Ca
ses
La
rva
e-p
up
ae
Ind
ica
tor
Ad
ult
sIn
dic
ato
rE
gg
sIn
dic
ato
r%
Eg
gs
inp
eri
do
mic
ile
%E
gg
sin
intr
ad
om
icil
e
Feb
17
6.2
38
.83
89
36
2.8
37
.2
Mar
48
6.7
37
.93
29
07
7.7
22
.3
Ap
r8
29
.33
1.2
13
45
75
.42
4.6
May
29
6.7
22
.95
63
29
.67
0.4
Jun
14
3.5
12
.34
10
41
.75
8.3
Jul
42
.01
0.6
20
82
8.1
71
.9
Au
g0
1.6
9.0
42
0.0
10
0.0
Sep
11
.76
.51
68
48
.75
1.3
Oct
01
.54
.31
29
96
.53
.5
No
v0
1.7
17
.12
40
45
.75
4.3
De
c0
3.8
20
.71
10
76
5.6
34
.4
Ove
rall
19
54
.01
7.7
11
39
56
5.4
34
.6
do
i:10
.13
71
/jo
urn
al.p
ntd
.00
02
87
3.t
00
1
The Dengue Risk and the Entomological Indicators
PLOS Neglected Tropical Diseases | www.plosntds.org 4 May 2014 | Volume 8 | Issue 5 | e2873
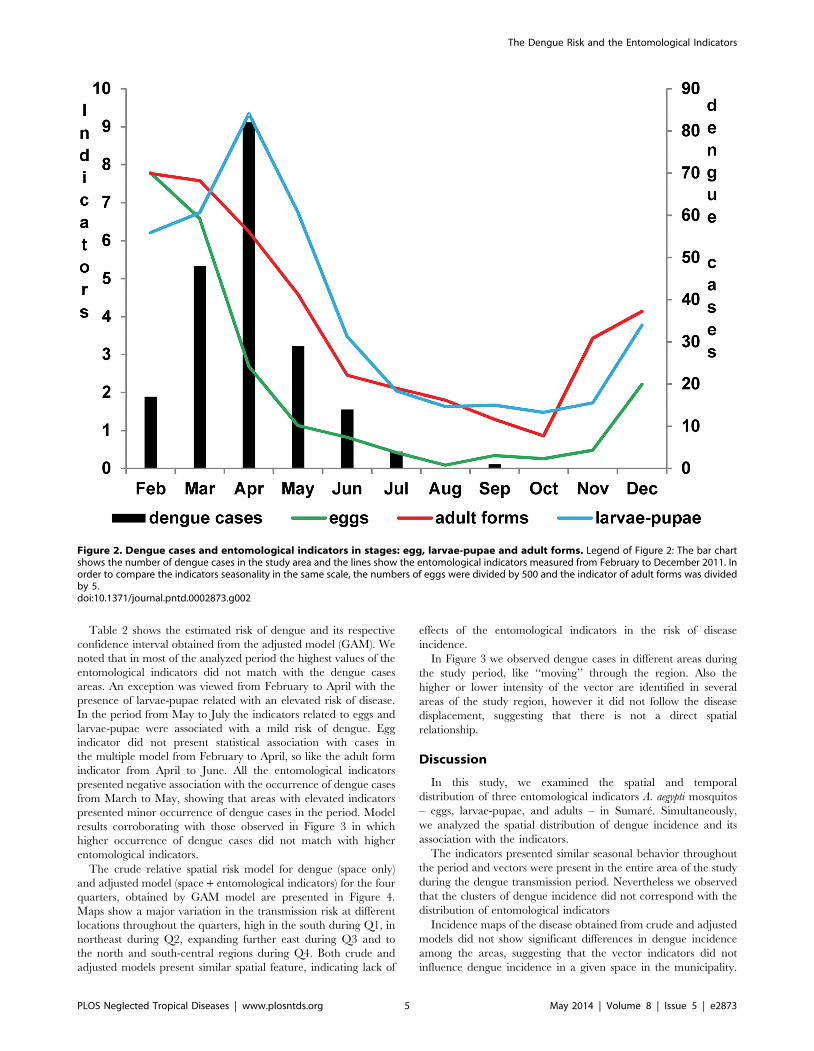
Table 2 shows the estimated risk of dengue and its respective
confidence interval obtained from the adjusted model (GAM). We
noted that in most of the analyzed period the highest values of the
entomological indicators did not match with the dengue cases
areas. An exception was viewed from February to April with the
presence of larvae-pupae related with an elevated risk of disease.
In the period from May to July the indicators related to eggs and
larvae-pupae were associated with a mild risk of dengue. Egg
indicator did not present statistical association with cases in
the multiple model from February to April, so like the adult form
indicator from April to June. All the entomological indicators
presented negative association with the occurrence of dengue cases
from March to May, showing that areas with elevated indicators
presented minor occurrence of dengue cases in the period. Model
results corroborating with those observed in Figure 3 in which
higher occurrence of dengue cases did not match with higher
entomological indicators.
The crude relative spatial risk model for dengue (space only)
and adjusted model (space + entomological indicators) for the four
quarters, obtained by GAM model are presented in Figure 4.
Maps show a major variation in the transmission risk at different
locations throughout the quarters, high in the south during Q1, in
northeast during Q2, expanding further east during Q3 and to
the north and south-central regions during Q4. Both crude and
adjusted models present similar spatial feature, indicating lack of
effects of the entomological indicators in the risk of disease
incidence.
In Figure 3 we observed dengue cases in different areas during
the study period, like ‘‘moving’’ through the region. Also the
higher or lower intensity of the vector are identified in several
areas of the study region, however it did not follow the disease
displacement, suggesting that there is not a direct spatial
relationship.
Discussion
In this study, we examined the spatial and temporal
distribution of three entomological indicators A. aegypti mosquitos
– eggs, larvae-pupae, and adults – in Sumare. Simultaneously,
we analyzed the spatial distribution of dengue incidence and its
association with the indicators.
The indicators presented similar seasonal behavior throughout
the period and vectors were present in the entire area of the study
during the dengue transmission period. Nevertheless we observed
that the clusters of dengue incidence did not correspond with the
distribution of entomological indicators
Incidence maps of the disease obtained from crude and adjusted
models did not show significant differences in dengue incidence
among the areas, suggesting that the vector indicators did not
influence dengue incidence in a given space in the municipality.
Figure 2. Dengue cases and entomological indicators in stages: egg, larvae-pupae and adult forms. Legend of Figure 2: The bar chartshows the number of dengue cases in the study area and the lines show the entomological indicators measured from February to December 2011. Inorder to compare the indicators seasonality in the same scale, the numbers of eggs were divided by 500 and the indicator of adult forms was dividedby 5.doi:10.1371/journal.pntd.0002873.g002
The Dengue Risk and the Entomological Indicators
PLOS Neglected Tropical Diseases | www.plosntds.org 5 May 2014 | Volume 8 | Issue 5 | e2873

Although we observed a few coincidences between indicators and
dengue cases in some areas, in general, the case clusters did not
correspond to the highest values of vectors indices.
However, caution is required when analyzing these results,
especially considering the environmental interventions carried out
by the health services team during epidemic periods, such as the
chemical treatment of the locations with confirmed cases, the
intensification of measures to control breeding areas, and health
education. In addition it should be noted that the response of
the population to campaign pleas and dengue control measures,
especially during an epidemic, may led to the elimination of
breeding grounds of immature forms.
It is important to consider that the study area experienced
infestation for over 15 years and deficient public services, besides
the intense traffic between neighborhoods. The circulation of
serotype DENV-1, DENV-2 and DENV-3 in the previous years
may have interfered in the transmission of the virus, once a
population portion may have acquired immunity to one or more
serotypes. These factors may be relevant in explaining the
circulation of the virus during the entire period of the study.
The longstanding A. aegypti infestation rates in the city may
have had a limited role in the circulation of the virus in Sumare in
2011.
Thus it is plausible that the spatial distribution of the disease
depends on the vector distribution, but not necessarily on its
highest concentration.
Despite the evident seasonality of vector infestation and
viral transmission (temporal association), the spatial distribution
of disease risk and high rates of entomological indicators did not
coincide in multiple models. The spatial analysis could detect risk
(incidence) on a scale of blocks and neighborhoods. In this way
we obtained local estimators of risk instead of mean values of
indicators of large areas.
The apparent temporal correlation observed in the indicators
curve over the period of transmission, was not spatially evidenced,
as seen in the results of GAM models. They showed in some
periods, negative association, in others, lack of statistical signifi-
cance, and others risk of dengue.
Furthermore, the vector adaptability to environment inhabited
by human [47] makes it difficult to control the dengue trans-
mission, because the vectors are abundant enough for triggering
and maintaining the circulation of the virus. Other variables like
population size, epidemic duration and climate variables seem to
determine the spread of the epidemic in longstanding infestation
areas, as observed by Siqueira Junior et al. [48] and Chowell et al.
[49].
Figure 3. Ordinary Kriging maps of entomological indicators of Aedes aegypti and dengue cases. Legend of Figure 3: The figure showsthe estimated ordinary kriging of entomological indicators from February to July 2011 divided in four groups quarterly. The cases that occurred in themonth corresponding to the middle of the period by each cluster are also plotted as black dots in the maps. The color gradient, corresponding to thevariation range of the estimated entomological indicators, is shown for each map. For eggs indicator the values represent to the number of eggs. Forindicators of larvae-pupae and adult mosquitoes, the values match to the percentage of positivity of blocks.doi:10.1371/journal.pntd.0002873.g003
The Dengue Risk and the Entomological Indicators
PLOS Neglected Tropical Diseases | www.plosntds.org 6 May 2014 | Volume 8 | Issue 5 | e2873

The spatial association among entomological indicators has
been the object of a few studies conducted at various locations. In
Rio de Janeiro, Honorio et al. (2009) recently reported dengue
infection among residents living in areas with a low mosquito
density, suggesting that the infection did not occur inside the
residence [31]. In Tupa, Sao Paulo, Barbosa and Lourenco (2010)
did not find a spatial relationship between dengue incidence and
larvae infestation [28]. In Bangladesh, Ali et al. (2003) found a
positive association between the dengue incidence and vector
infestation in areas close to hospitals [50]. In Campinas, Sao
Paulo, Cordeiro et al. (2011) showed a positive association between
the increase in the larvae density and the incidence of dengue [34].
Chowell et al. (2008) also recorded a major variation in the weekly
dengue incidence among the provinces of Peru, probably because
of the level of infection spread by the mosquitoes, climate
variation, circulation of different serotypes, and the population’s
immunological history [49].
Studies on the association between dengue transmission
and entomological, environmental, socio-economical, and other
indicators have presented conflicting results but reach the
consensus that the dynamics of dengue transmission are complex
and difficult to understand. Also authors agree that transmission
depends on the environmental context and on variables that
were not taken into consideration in this study, e.g., populational
immunity, circulating serotypes, and control measures [14–16,
27,47,51]. Furthermore, underreporting of cases is also assumed
because some patients were either asymptomatic or had mild
symptoms, which were not reported to the health services, as
mentioned in various studies [20,31,52,53].
According to Focks et al., in order to prevent the transmission of
the dengue, it is necessary to maintain vector infestation at
critically low levels [54]. The Pan American Health Organization
describes that a building index up to 0.1% implies low risk of
dengue transmission, between 0.1 and 5%, medium risk, and
above 5%, high risk [15]. However, some authors have reported
dengue transmission even when the indices of entomological
indicators were relatively low [14,18–20]. Currently, there is no
threshold for the suspicion of the risk of dengue. This study
Table 2. Dengue risk estimated obtained from the generalized additive model and confidence interval adjusted for the quarterlyentomological indicators studied, Sumare-SP, from February to July 2011.
stadium Q1 Q2 Q3 Q4
OR* CI** OR* CI** OR* CI** OR* CI**
eggs 0,99 0,98–1,01 0,96 0,95–0,96 1,01 0,98–1,04 1,06 1,03–1,09
larvae-pupae 3,41 2,59–4,48 0,51 0,48–0,55 0,75 0,68–0,82 1,43 1,22–1,68
adult forms 0,91 0,86–0,95 0,89 0,87–0,93 1,08 1,02–1,14 0,94 0,90–0,98
*adjusted Odds Ratio.**Confidence Interval (95%).doi:10.1371/journal.pntd.0002873.t002
Figure 4. Spatial risk maps in crude and adjusted model (GAM). Legend of Figure 4: The risk maps for the occurrence of dengue cases withthe crude and adjusted models for the four quarterly groupings are shown with the odds ratio values defining the color gradient ranging of white(minor value) to red (highest values). The isolines show the values corresponding to the estimates generated by the GAM model. The dots andcrosses plotted on maps are showing respectively controls and dengue cases for the period.doi:10.1371/journal.pntd.0002873.g004
The Dengue Risk and the Entomological Indicators
PLOS Neglected Tropical Diseases | www.plosntds.org 7 May 2014 | Volume 8 | Issue 5 | e2873
showed that the household infestation was above 5% until May,
period that occurred more than 90% of the cases.
Honorio et al. suggested that information on the patterns of
populational movement help improve the understanding about the
transmission dynamics of the disease and possible locations of its
incidence [31]. Getis states that only one or few infected A. aegypti
mosquitoes transmit the virus to several susceptible humans within
a period of a few days [55]. According to Kan, the traffic of people
and mosquitoes from neighborhoods where dengue incidences
have been reported can explain the shift in the pattern of the
epidemics [30].
This study was the first to evaluate the spatial relationship
between entomological indicators of all stages of the A. aegypti
mosquito: egg, larvae and pupae, and adult, and monthly and
concurrent measurements as well as dengue incidence.
One of the limitations of the study is the lack of data about
populational immunity and the interventions implemented
in response to the autochthonous transmission that could have
influenced the results. Besides, the population’s movement
patterns and the elements indicating the main transmission
locations are unknown [31]. By only analyzing the reported cases
during the period without considering the asymptomatic patients
and those who did not seek health services, the findings were
certainly underestimated. The other limitation was the use of data
from a surface smoothed by ordinary kriging, which despite being
a linear unbiased estimator, promotes the smoothing of results,
thereby overestimating the lowest and underestimating the highest
values [44].
Many factors are involved in the spatial spread of an epidemic.
Certain factors, e.g., vector control programs and populational
immunity to the circulating virus, may have a modulating effect
on the dengue incidence. Besides, the introduction of a virus, its
establishment and propagation, and the concomitant movement of
various serotypes, owing to the population traffic, may also be part
of the spatial dimension of the epidemic spread. In this case,
infestation was not a limiting variable for transmission [32].
In this study, we were able to simultaneously analyze the
incidence of dengue and conduct a survey on the entomological
indicators of A. aegypti; however, we did not find a spatial
correlation between the indicators and disease incidence. The
infestation did not present a major variation in intensity and was
not a limiting or determining factor of dengue incidences in a
given space in the municipality. None of the different stages
entomological indicators in the vector’s lifecycle was a predictor of
disease occurrence in areas at risk of dengue transmission. The
inclusion of other variables in generalized additive models could
eventually reveal other modulating factors that have an influence
on spatial pattern of the disease.
Supporting Information
Checklist S1 STROBE checklist.(DOC)
Acknowledgments
The authors wish to thank the field staff the Superintendence for Control of
Endemic Diseases by work of data collection and further laboratory staff by
the species identification. We also thank the support staff of the vector
control program at municipality of Sumare.
Author Contributions
Conceived and designed the experiments: GLB MRD CS RWL VRA
MBA VLCL. Performed the experiments: GLB VRA MBA VLCL.
Analyzed the data: GLB MRD CS. Contributed reagents/materials/
analysis tools: GLB MRD CS. Wrote the paper: GLB MRD CS RWL
VRA MBA VLCL.
References
1. Murray, Quam M, Wilder-Smith A (2013) Epidemiology of dengue: past,
present and future prospects. Clin Epidemiol 5: 299–309. doi:10.2147/
CLEP.S34440.
2. Schatzmayr HG, Nogueira RMR, Rosa APAT da (1986) An outbreak of dengue
virus at Rio de Janeiro - 1986. Mem Inst Oswaldo Cruz 81: 245–246.
doi:10.1590/S0074-02761986000200019.
3. Nogueira RMR, Miagostovich MP, Lampe E, Schatzmayr HG (1990) Isolation
of dengue virus type 2 in Rio de Janeiro. Mem Inst Oswaldo Cruz 85: 253.
doi:10.1590/S0074-02761990000200022.
4. Nogueira RMR, Miagostovich MP, Filippis AMB de, Pereira MAS, Schatzmayr
HG (2001) Dengue virus type 3 in Rio de Janeiro, Brazil. Mem Inst Oswaldo
Cruz 96: 925–926. doi:10.1590/S0074-02762001000700007.
5. Figueiredo RMP de, Naveca FG, Bastos M de S, Melo M do N, Viana S de S,
et al. (2008) Dengue Virus Type 4, Manaus, Brazil. Emerg Infect Dis 14: 667–
669. doi:10.3201/eid1404.071185.
6. Rocco IM, Silveira VR, Maeda AY, Silva SJ dos S, Spenassatto C, et al. (2012)
Primeiro isolamento de Dengue 4 no Estado de Sao Paulo, Brasil, 2011. Rev Inst
Med Trop Sao Paulo 54: 49–51. doi:10.1590/S0036-46652012000100009.
7. Siqueira Jr JB, Vinhal LC, Said RF . do C, Hoffman JL, Martins J, et al. (n.d.)
Dengue no Brasil: tendencias e mudancas na epidemiologia, com enfase nas
epidemias de 2008 e 2010. Ministerio da Saude. Saude Brasil 2010, uma analise
da situacao de saude e de evidencias selecionadas de impacto de acoes de
vigilancia em saude. pp. 157–171.
8. Brasil. Ministerio da Saude. Secretaria de Vigilancia em Saude. Incidencia de
dengue. Brasil, grandes regioes e unidades federadas 1990 a 2011. (2013).
Available: http://portal.saude.gov.br/portal/arquivos/pdf/dados_dengue_
classica_2012_at032013.pdf. Accessed 1 October 2013.
9. Tauil PL (2002) Critical aspects of dengue control in Brazil. Cad Saude Publica
18: 867–871. doi:10.1590/S0102-31162002000300035.
10. Wilson ME, Chen LH (2002) Dengue in the Americas. Dengue Bull 26: 44–61.
11. Focks DA (2003) A review of entomological sampling methods and indicators for
dengue vectors. Available: http://whqlibdoc.who.int/hq/2003/TDR_IDE_
DEN_03.1.pdf.
12. Gomes A de C (1998) Medidas dos nıveis de infestacao urbana para Aedes
(Stegomyia) aegypti e Aedes (Stegomyia) albopictus em programa de vigilancia
entomologica. Inf Epidemiol SUS 7: 49–57.
13. Li CF, Lim TW, Han LL, Fang R (1985) Rainfall, abundance of Aedes aegypti
and dengue infection in Selangor, Malaysia. Southeast Asian J Trop Med Public
Health 16: 560–568.
14. Correa PRL, Franca E, Bogutchi TF (2005) Infestacao pelo Aedes aegypti e
ocorrencia de dengue em Belo Horizonte, Minas Gerais. Rev Saude Publica 39:
33–40. doi:10.1590/S0034-89102005000100005.
15. Sanchez L, Vanlerberghe V, Alfonso L, Marquetti M del C, Guzman MG, et al.
(2006) Aedes aegypti Larval Indices and Risk for Dengue Epidemics. Emerg
Infect Dis 12: 800–806. doi:10.3201/eid1205.050866.
16. Souza SS de, Silva IG da, Silva HHG da (2010) Associacao entre incidencia de
dengue, pluviosidade e densidade larvaria de Aedes aegypti, no Estado de Goias.
Rev Soc Bras Med Trop 43: 152–155. doi:10.1590/S0037-86822010000200009.
17. Romero-Vivas CME, Falconar AKI (2005) Investigation of relationships
between Aedes aegypti egg, larvae, pupae, and adult density indices where
their main breeding sites were located indoors. J Am Mosq Control Assoc 21:
15–21.
18. Sulaiman S, Pawanchee ZA, Arifin Z, Wahab A (1996) Relationship between
Breteau and House indices and cases of dengue/dengue hemorrhagic fever in
Kuala Lumpur, Malaysia. J Am Mosq Control Assoc 12: 494–496.
19. Goh K (1997) Dengue a re-emerging infectious disease in Singapore. Ann Acad
Med Singapore 26: 664–670.
20. Teixeira M da G, Barreto ML, Costa M da CN, Ferreira LDA, Vasconcelos
PFC, et al. (2002) Dynamics of dengue virus circulation: a silent epidemic in a
complex urban area. Trop Med Int Health 7: 757–762. doi:10.1046/j.1365-
3156.2002.00930.x.
21. Chieffi PP (1985) Algumas questoes decorrentes da reintroducao do Aedes
aegypti no Brasil. Cad Saude Publica 1: 385–387. doi:10.1590/S0102-31161985000300011.
22. Herrera-Basto E, Prevots DR, Zarate ML, Silva JL, Sepulveda-Amor J (1992)
First reported outbreak of classical dengue fever at 1,700 meters above sea level
in Guerrero State, Mexico, June 1988. Am J Trop Med Hyg 46: 649–653.
23. Donalısio MR, Glasser CM (2002) Vigilancia entomologica e controle de vetores
do dengue. Rev Bras Epidemiol 5: 259–272.
24. Rojas LI, Barcellos C, Peiter P (1999) Utilizacao de mapas no campo da
epidemiologia no Brasil reflexoes sobre trabalhos apresentados no IV Congresso
Brasileiro de Epidemiologia. Inf Epidemiol SUS 8: 27–35.
The Dengue Risk and the Entomological Indicators
PLOS Neglected Tropical Diseases | www.plosntds.org 8 May 2014 | Volume 8 | Issue 5 | e2873
25. Carvalho MS, Souza-Santos R (2005) Analise de dados espaciais em saude
publica: metodos, problemas, perspectivas. Cad Saude Publica 21: 361–378.
26. Eisen L, Lozano-Fuentes S (2009) Use of Mapping and Spatial and Space-Time
Modeling Approaches in Operational Control of Aedes aegypti and Dengue.
PLoS Negl Trop Dis 3: e411. doi:10.1371/journal.pntd.0000411.
27. Galli B, Chiaravalloti-Neto F (2008) Modelo de risco tempo-espacial para
identificacao de areas de risco para ocorrencia de dengue. Rev Saude Publica
42: 656–663. doi:10.1590/S0034-89102008005000032.
28. Barbosa GL, Lourenco RW (2010) Analise da distribuicao espaco-temporal de
dengue e da infestacao larvaria no municıpio de Tupa, Estado de Sao Paulo. Rev
Soc Bras Med Trop 43: 145–151. doi:10.1590/S0037-86822010000200008.
29. Morrison AC, Getis A, Santiago M, Rigau-Perez JG, Reiter P (1998)
Exploratory space-time analysis of reported dengue cases during an outbreak
in Florida, Puerto Rico, 1991-1992. Am J Trop Med Hyg 58: 287–298.
30. Kan C-C, Lee P-F, Wen T-H, Chao D-Y, Wu M-H, et al. (2008) Two clustering
diffusion patterns identified from the 2001-2003 dengue epidemic, Kaohsiung,
Taiwan. Am J Trop Med Hyg 79: 344–352.
31. Honorio NA, Nogueira RMR, Codeco CT, Carvalho MS, Cruz OG, et al.
(2009) Spatial Evaluation and Modeling of Dengue Seroprevalence and Vector
Density in Rio de Janeiro, Brazil. PLoS Negl Trop Dis 3: e545. doi:10.1371/
journal.pntd.0000545.
32. Vazquez-Prokopec GM, Kitron U, Montgomery B, Horne P, Ritchie SA (2010)
Quantifying the Spatial Dimension of Dengue Virus Epidemic Spread within a
Tropical Urban Environment. PLoS Negl Trop Dis 4: e920. doi:10.1371/journal.
pntd.0000920.
33. Souza-Santos R, Carvalho MS (2000) Spatial analysis of Aedes aegypti larval
distribution in the Ilha do Governador neighborhood of Rio de Janeiro, Brazil.
Cad Saude Publica 16: 31–42. doi:10.1590/S0102-31162000000100004.
34. Cordeiro R, Donalisio MR, Andrade VR, Mafra AC, Nucci LB, et al. (2011)
Spatial distribution of the risk of dengue fever in southeast Brazil, 2006–2007.
BMC Public Health 11: 355. doi:10.1186/1471-2458-11-355.
35. Barrera R (2011) Spatial Stability of Adult Aedes aegypti Populations. Am J Trop
Med Hyg 85: 1087–1092. doi:10.4269/ajtmh.2011.11-0381.
36. Alvares CA, Stape JL, Sentelhas PC, Goncalves JL de M, Sparovek G (2013)
Koppen’s climate classification map for Brazil. Meteorol Z 22: 711–728.
37. Brasil. Ministurio da Sau¤de. Secretaria de VigiluAncia em Sau¤de. Guia de
VigiluAncia Epidemiolugica (2005). Available: http://www.combateadengue.pr.
gov.br/arquivos/File/profissionais/dengue_gve.pdf. Accessed 11 March 2014.
38. Alves MCGP, Silva NN da (2001) Simplificacao do metodo de estimacao de
densidade larvaria de Aedes aegypti no Estado de Sao Paulo. Rev Saude Publica
35: 467–473. doi:10.1590/S0034-89102001000500010.
39. Secretaria de Estado da Sau¤de de SuEo Paulo. Superintenduncia de Controle
de Endemias. Normas e RecomendauIuces Tucnicas para VigiluAncia e
Controle do Aedes aegypti no Estado de SuEo Paulo. (2006). Available: http://
www.saude.sp.gov.br/resources/sucen/homepage/arquivos-dengue/norte_
formatado.doc?attach = true. Accessed 10 March 2014.
40. World Health Organization (1972) A system of world-wide surveillance for
vectors. Wkly Epidemiol Rec 47: 73–84.41. Nasci RS (1981) A lightweight battery-powered aspirator for collecting resting
mosquitoes in the field. Mosq News 41: 808–811.
42. Reiter P, Amador MA, Colon N (1991) Enhancement of the CDC ovitrap withhay infusions for daily monitoring of Aedes aegypti populations. J Am Mosq
Control Assoc 7: 52–55.43. Lourenco RW, Landim PMB, Rosa AH, Roveda JAF, Martins ACG, et al.
(2010) Mapping soil pollution by spatial analysis and fuzzy classification. Environ
Earth Sci 60: 495–504. doi:10.1007/s12665-009-0190-6.44. Carvalho JRP de, Assad ED (2005) Spatial analysis of precipitation data in Sao
Paulo State: comparison of interpolation methods. Eng Agrıc 25: 377–384.doi:10.1590/S0100-69162005000200011.
45. Hastie T, Tibshirani R (1986) Generalized Additive Models. Stat Sci 1: 297–318.
46. Maciel-de-Freitas R, Lourenco-de-Oliveira R (2009) Presumed unconstrained
dispersal of Aedes aegypti in the city of Rio de Janeiro, Brazil. Rev SaudePublica 43: 8–12. doi:10.1590/S0034-89102009000100002.
47. Teixeira M da G, Barreto ML, Guerra Z (1999) Epidemiologia e medidas deprevencao do dengue. Inf Epidemiol SUS 8: 5–33.
48. Siqueira-Junior JB, Maciel IJ, Barcellos C, Souza WV, Carvalho MS, et al.
(2008) Spatial point analysis based on dengue surveys at household level incentral Brazil. BMC Public Health 8: 361. doi:10.1186/1471-2458-8-361.
49. Chowell G, Torre CA, Munayco-Escate C, Suarez-Ognio L, Lopez-Cruz R,et al. (2008) Spatial and temporal dynamics of dengue fever in Peru: 1994-2006.
Epidemiol Infect 136: 1667–1677. doi:10.1017/S0950268808000290.50. Ali M, Wagatsuma Y, Emch M, Breiman RF (2003) Use of a geographic
information system for defining spatial risk for dengue transmission in
Bangladesh: role for Aedes albopictus in an urban outbreak. Am J Trop MedHyg 69: 634–640.
51. Machado JP, Oliveira RM de, Souza-Santos R (2009) Analise espacial daocorrencia de dengue e condicoes de vida na cidade de Nova Iguacu, Estado do
Rio de Janeiro, Brasil. Cad Saude Publica 25: 1025–1034. doi:10.1590/S0102-
31162009000500009.52. Van Benthem BHBV, Van Wambeke SO, Khantikul N, Burghoorn-Maas C,
Panart K, et al. (2005) Spatial Patterns of and Risk Factors for Seropositivity forDengue Infection. Am J Trop Med Hyg 72: 201–208.
53. Lima VLC de, Figueiredo LTM, Correa F HR, Leite OF, Rangel O, et al.(1999) Dengue: inquerito sorologico pos-epidemico em zona urbana do Estado
de Sao Paulo (Brasil). Rev Saude Publica 33: 566–574. doi:10.1590/S0034-
89101999000600008.54. Focks DA, Brenner RJ, Hayes J, Daniels E (2000) Transmission thresholds for
dengue in terms of Aedes aegypti pupae per person with discussion of their utilityin source reduction efforts. Am J Trop Med Hyg 62: 11–18.
55. Getis A, Morrison AC, Gray K, Scott TW (2003) Characteristics of the spatial
pattern of the dengue vector, Aedes aegypti, in Iquitos, Peru. Am J Trop MedHyg 69: 494–505.
The Dengue Risk and the Entomological Indicators
PLOS Neglected Tropical Diseases | www.plosntds.org 9 May 2014 | Volume 8 | Issue 5 | e2873