Spatial distribution of carbon in natural and managed ...
13
Spatial distribution of carbon in natural and managed stands in an industrial forest in New Brunswick, Canada E.T. Neilson, D.A. MacLean * , F.-R. Meng, P.A. Arp Faculty of Forestry and Environmental Management, University of New Brunswick, P.O. Box 4400, Fredericton, NB, Canada E3B 6C2 Received 22 January 2006; received in revised form 13 July 2007; accepted 14 July 2007 Abstract Industrial forest could be managed to enhance carbon (C) sequestration together with other ecological and socio-economic objectives. However, this requires quantifying C dynamics of all major forest types within the management area, over the whole forest rotation. We used data from permanent sample plots and temporary forest development survey plots to generate volume yield curves and used the Carbon Budget Model of the Canadian Forest Sector (CBM-CFS3) to estimate C yield and dynamics over a rotation for major forest types in northern New Brunswick, Canada. We compared C yields of natural versus managed and hardwood versus softwood forest under different silviculture treatments over the entire rotation. Carbon in 40–80-year-old and > 80-year-old tolerant hardwood stands averaged about 115 and 130–142 t ha 1 , respectively, while softwood spruce (Picea sp.)–balsam fir (Abies balsamea (L.) Mill.) 40–80 and > 80 years old averaged 90 and 88–94 t C ha 1 . Among 10 stand types, total C ranged from 50 to 109 t ha 1 at age 50 years, 92–138 t ha 1 at age 100, and 79–145 t ha 1 at age 150 years. C in most stand types declined from age 100 to 150 years, except for eastern white cedar (Thuja occidentalis L.), sugar maple (Acer saccharum Marsh.) and yellow birch (Betula alleghaniensis Britton). At age 100 years, planted softwood stands had 94–135 t ha 1 , versus 92–117 t ha 1 for natural softwoods and 127– 138 t ha 1 for natural hardwoods. Planted white spruce (Picea glauca (Moench) Voss) and natural sugar maple and yellow birch sequestered the most C. The total C (above and belowground biomass and deadwood, excluding soil carbon) on the 428,000 ha test landbase was 35 million tonnes, or an average of 82 t ha 1 . # 2007 Elsevier B.V. All rights reserved. Keywords: Forest carbon; Sequestration; Timber supply models; Forest management; Indicators; Tolerant hardwood; Spruce; Balsam fir; Dead organic matter 1. Introduction Quantification of forest carbon (C) has recently gained in importance to forest managers, largely due to the Kyoto Protocol and global warming (Kurz and Apps, 1999; Phillips et al., 2000; Sohngen and Mendelsohn, 2003; Nelson and de Jong, 2003; Baral and Guha, 2004). Increased atmospheric carbon dioxide (CO 2 ) is considered to be responsible for global warming and climate change (Heath and Smith, 2000; Phillips et al., 2000). Forest managers are interested in quantifying forest C stocks on their landscapes and influence of manage- ment on C sequestration (Heath and Smith, 2000; Smith and Heath, 2001). Forest ecosystems act as atmospheric filters of CO 2 . Forests sequester C from the atmosphere through the process of photosynthesis and store C in woody biomass. Mortality transfers C from biomass to forest soils, coarse woody debris (CWD), litter and other forms (Lee et al., 2002). There are opportunities to increase the amount of C in forest ecosystems through intensive management or longer harvest rotations (Hoen and Solberg, 1994; Van Kooten et al., 1995; Murray, 2000; Sohngen and Mendelsohn, 2003). Should managers choose, or be obligated, to quantify C stock changes on forest landscapes, a quantifiable measure of C is needed for integration into current management planning. Several studies have quantified stand-level C in forested ecosystems (e.g., Granier et al., 2000; Law et al., 2001; Hazlett et al., 2005; McDowell et al., 2005; Smith et al., 2006), and others have done so at a larger regional or landscape scale (Dixon et al., 1994; Turner et al., 1995; Brown and Schroeder, 1999; Kurz and Apps, 1999; Bhatti et al., 2001; Banfield et al., 2002; Zheng et al., 2004; Fredeen et al., 2005; Liski et al., 2006). Scattered information regarding C dynamics for a limited number of stand types is insufficient to consider C www.elsevier.com/locate/foreco Forest Ecology and Management 253 (2007) 148–160 * Corresponding author. Tel.: +1 506 458 7552; fax: +1 506 453 3538. E-mail address: [email protected] (D.A. MacLean). 0378-1127/$ – see front matter # 2007 Elsevier B.V. All rights reserved. doi:10.1016/j.foreco.2007.07.017
Transcript of Spatial distribution of carbon in natural and managed ...

Spatial distribution of carbon in natural and managed stands
in an industrial forest in New Brunswick, Canada
E.T. Neilson, D.A. MacLean *, F.-R. Meng, P.A. Arp
Faculty of Forestry and Environmental Management, University of New Brunswick, P.O. Box 4400, Fredericton, NB, Canada E3B 6C2
Received 22 January 2006; received in revised form 13 July 2007; accepted 14 July 2007
Abstract
Industrial forest could be managed to enhance carbon (C) sequestration together with other ecological and socio-economic objectives. However,
this requires quantifying C dynamics of all major forest types within the management area, over the whole forest rotation. We used data from
permanent sample plots and temporary forest development survey plots to generate volume yield curves and used the Carbon Budget Model of the
Canadian Forest Sector (CBM-CFS3) to estimate C yield and dynamics over a rotation for major forest types in northern New Brunswick, Canada.
We compared C yields of natural versus managed and hardwood versus softwood forest under different silviculture treatments over the entire
rotation. Carbon in 40–80-year-old and > 80-year-old tolerant hardwood stands averaged about 115 and 130–142 t ha�1, respectively, while
softwood spruce (Picea sp.)–balsam fir (Abies balsamea (L.) Mill.) 40–80 and > 80 years old averaged 90 and 88–94 t C ha�1. Among 10 stand
types, total C ranged from 50 to 109 t ha�1 at age 50 years, 92–138 t ha�1 at age 100, and 79–145 t ha�1at age 150 years. C in most stand types
declined from age 100 to 150 years, except for eastern white cedar (Thuja occidentalis L.), sugar maple (Acer saccharum Marsh.) and yellow birch
(Betula alleghaniensis Britton). At age 100 years, planted softwood stands had 94–135 t ha�1, versus 92–117 t ha�1 for natural softwoods and 127–
138 t ha�1 for natural hardwoods. Planted white spruce (Picea glauca (Moench) Voss) and natural sugar maple and yellow birch sequestered the
most C. The total C (above and belowground biomass and deadwood, excluding soil carbon) on the 428,000 ha test landbase was 35 million tonnes,
or an average of 82 t ha�1.
# 2007 Elsevier B.V. All rights reserved.
Keywords: Forest carbon; Sequestration; Timber supply models; Forest management; Indicators; Tolerant hardwood; Spruce; Balsam fir; Dead organic matter
www.elsevier.com/locate/foreco
Forest Ecology and Management 253 (2007) 148–160
1. Introduction
Quantification of forest carbon (C) has recently gained in
importance to forest managers, largely due to the Kyoto
Protocol and global warming (Kurz and Apps, 1999; Phillips
et al., 2000; Sohngen and Mendelsohn, 2003; Nelson and de
Jong, 2003; Baral and Guha, 2004). Increased atmospheric
carbon dioxide (CO2) is considered to be responsible for global
warming and climate change (Heath and Smith, 2000; Phillips
et al., 2000). Forest managers are interested in quantifying
forest C stocks on their landscapes and influence of manage-
ment on C sequestration (Heath and Smith, 2000; Smith and
Heath, 2001).
Forest ecosystems act as atmospheric filters of CO2. Forests
sequester C from the atmosphere through the process of
* Corresponding author. Tel.: +1 506 458 7552; fax: +1 506 453 3538.
E-mail address: [email protected] (D.A. MacLean).
0378-1127/$ – see front matter # 2007 Elsevier B.V. All rights reserved.
doi:10.1016/j.foreco.2007.07.017
photosynthesis and store C in woody biomass. Mortality
transfers C from biomass to forest soils, coarse woody debris
(CWD), litter and other forms (Lee et al., 2002). There are
opportunities to increase the amount of C in forest ecosystems
through intensive management or longer harvest rotations
(Hoen and Solberg, 1994; Van Kooten et al., 1995; Murray,
2000; Sohngen and Mendelsohn, 2003). Should managers
choose, or be obligated, to quantify C stock changes on forest
landscapes, a quantifiable measure of C is needed for
integration into current management planning.
Several studies have quantified stand-level C in forested
ecosystems (e.g., Granier et al., 2000; Law et al., 2001; Hazlett
et al., 2005; McDowell et al., 2005; Smith et al., 2006), and
others have done so at a larger regional or landscape scale
(Dixon et al., 1994; Turner et al., 1995; Brown and Schroeder,
1999; Kurz and Apps, 1999; Bhatti et al., 2001; Banfield et al.,
2002; Zheng et al., 2004; Fredeen et al., 2005; Liski et al.,
2006). Scattered information regarding C dynamics for a
limited number of stand types is insufficient to consider C
E.T. Neilson et al. / Forest Ecology and Management 253 (2007) 148–160 149
sequestration with other management objectives in industrial
forests.
Our objective was to establish a framework to generate C
yield curves based on existing permanent sample plot and stand
development survey data for major forest types in an industrial
forest, over an entire rotation following different silviculture
treatments. In particular, C yields are compared for natural
versus managed and softwood versus hardwood forest. The C
yield curves generated with this procedure could be directly
used for C accounting under forest management scenarios, or
be used to actively manage forest to enhance onsite C
sequestration. C yield analysis of major forest types could assist
forest managers to prioritize silviculture treatments intended to
increase C sequestration, without modifying the entire forest
management plan.
In this paper, we use a C simulation model to generate stand-
level complete C temporal dynamics for all major forest stand
types within the management zones. ‘‘Complete C’’ yields can
then be used in timber supply models that can optimally time
management interventions to capture stand mortality and to
design sustainable resource management. Timber supply
models are often flexible enough to accommodate conflicting
objectives, such as managing for both timber and C through
alternative harvesting scenarios. C yield data also permit
calculation of the spatial distribution of C on the landscape, as a
function of stand age and cover type.
We used the Carbon Budget Model of the Canadian Forest
Sector (CBM-CFS3, developed from the CBM-CFS, and CBM-
CFS2—Kurz et al., 1992; Kurz and Apps, 1999), stand volume
yield curves, and forest inventory data to simulate living and
dead C dynamics for natural and managed stand types. The
objectives of this paper are to (1) develop C yield curves for
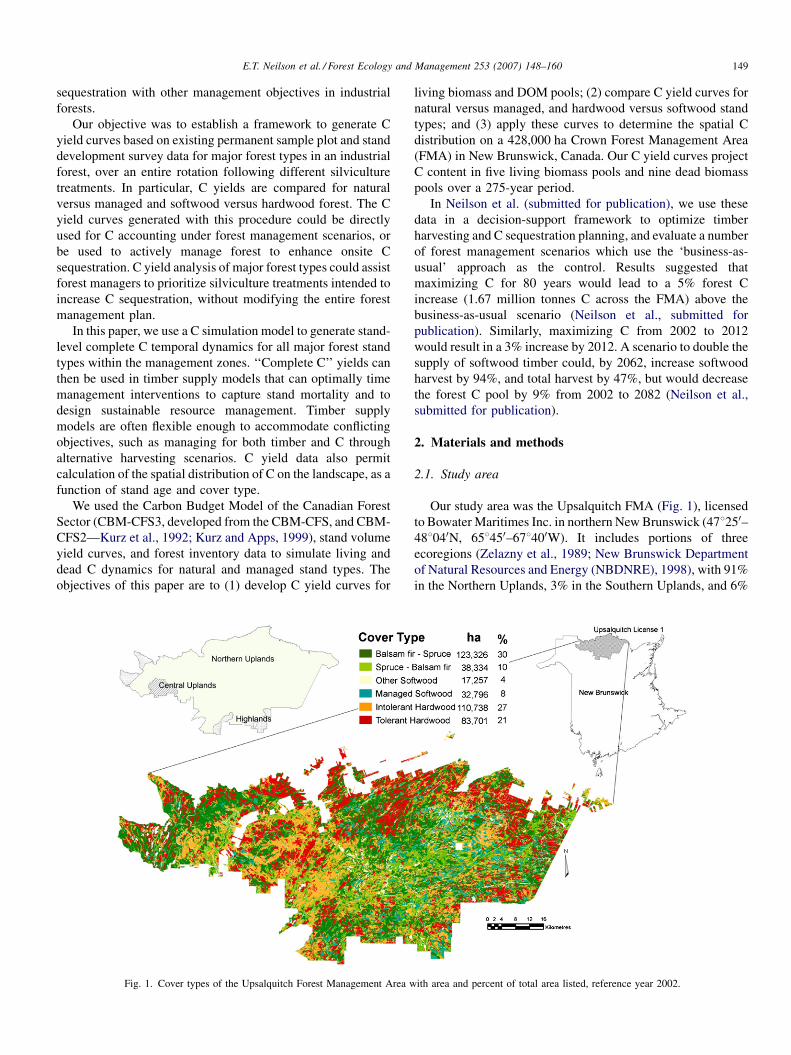
Fig. 1. Cover types of the Upsalquitch Forest Management Area w
living biomass and DOM pools; (2) compare C yield curves for
natural versus managed, and hardwood versus softwood stand
types; and (3) apply these curves to determine the spatial C
distribution on a 428,000 ha Crown Forest Management Area
(FMA) in New Brunswick, Canada. Our C yield curves project
C content in five living biomass pools and nine dead biomass
pools over a 275-year period.
In Neilson et al. (submitted for publication), we use these
data in a decision-support framework to optimize timber
harvesting and C sequestration planning, and evaluate a number
of forest management scenarios which use the ‘business-as-
usual’ approach as the control. Results suggested that
maximizing C for 80 years would lead to a 5% forest C
increase (1.67 million tonnes C across the FMA) above the
business-as-usual scenario (Neilson et al., submitted for
publication). Similarly, maximizing C from 2002 to 2012
would result in a 3% increase by 2012. A scenario to double the
supply of softwood timber could, by 2062, increase softwood
harvest by 94%, and total harvest by 47%, but would decrease
the forest C pool by 9% from 2002 to 2082 (Neilson et al.,
submitted for publication).
2. Materials and methods
2.1. Study area
Our study area was the Upsalquitch FMA (Fig. 1), licensed
to Bowater Maritimes Inc. in northern New Brunswick (478250–488040N, 658450–678400W). It includes portions of three
ecoregions (Zelazny et al., 1989; New Brunswick Department
of Natural Resources and Energy (NBDNRE), 1998), with 91%
in the Northern Uplands, 3% in the Southern Uplands, and 6%
ith area and percent of total area listed, reference year 2002.

E.T. Neilson et al. / Forest Ecology and Management 253 (2007) 148–160150
in the Highlands (Fig. 1). The forest is composed of softwoods,
black, red and white spruce (Picea mariana (Mill.) B.S.P.,
Picea rubens Sarg., Picea glauca (Moench) Voss), balsam fir
(Abies balsamea (L.) Mill.), jack pine (Pinus banksiana
Lamb.), with shade tolerant hardwood ridges of American
beech (Fagus grandifolia Ehrh.), yellow birch (Betula
alleghaniensis Britton), sugar maple (Acer saccharum Marsh.)
and large quantities of intolerant hardwoods like aspen
(Populus tremuloides Michx.) and white birch (Betula
papyrifera Marsh.). The Northern Uplands includes intolerant
hardwood stands, tolerant hardwood ridges, mixedwood areas,
and spruce–fir mixes in lowlands. Eastern white cedar (Thuja
occidentalis L.) is prevalent in the wetter zones, interspersed
with areas of black spruce and jack pine on organic soils.
The Upsalquitch forest includes 411,660 ha of productive
forest and 16,340 ha of roads, wetlands, or rock outcrops
deemed non-productive forest area. The productive forest is
divided into three management zones: (1) white-tailed deer
(Odocoileus virginianus) winter habitat, old spruce–fir habitat,
and riparian zones constituted the restricted forest
(108,580 ha); (2) inaccessible forest (29,210 ha) including a
protected area, ecological reserves, and private leases (sugaries,
etc.); and (3) the 273,450 ha regular forest with timber
production as its primary management goal. The regular forest
is managed to maximize spruce–fir-jack pine volume harvested
(Bowater Maritimes Inc., 2002); hardwood harvest is not
maximized and was represented as a constraint in the
management objective.
The forest inventory for the landbase was acquired in 1997
using 1:12,500 color aerial photography interpreted to
determine stand composition, maturity, and crown closure. A
sample plot network of 3573 plots was used to calibrate the
photo-interpreted stands with attributes such as volume, age,
and height (Bowater Maritimes Inc., 2002). The forest
inventory was then digitized and input into a GIS. The
company managers stratified the forest into 153 natural strata
(non-treated; essentially types of stands originating before
1940) and 154 managed strata; we retained these classes to
ensure compatibility of our analyses with the company
management plan. After characterization, merchantable
volume yield tables were developed using the STAMAN stand
growth model (Vanguard Forest Management Services Ltd.,
1993; Norfolk, 2005). All inventory, plot, stratification, and
volume yield data were derived by the company for forest
management purposes, and we retained this structure to ensure
that our C analysis tools would be directly compatible with
company planning databases and procedures.
2.2. Carbon Budget Model of the Canadian Forest Sector 3
(CBM-CFS3)
C was simulated using CBM-CFS3, version 1.0 (Kurz,
personal communication), an operational-level model that uses
timber volume as the independent variable for calculation of C.
Parameters in CBM-CFS3 for the Atlantic Maritime, New
Brunswick Ecozone, developed from the National Forest
Biomass Inventory data (Gillis, 2001; Wulder et al., 2004),
were used to initiate the calculation of C from volume by stand
type. Belowground biomass was simulated from regression
equations based upon above-ground biomass, similar to the
CBM-CFS2 implementation (Kurz et al., 1996; Li et al., 2002).
While documentation describing the model specifics of the
CBM-CFS3 are yet unpublished, the CBM-CFS (Kurz et al.,
1992) and CBM-CFS2 (Kurz et al., 1996; Kurz and Apps, 1999;
Li et al., 2002, 2003) represent the modeling foundation upon
which the CBM-CFS3 has been developed with many similar
parameters and algorithms.
C in biomass and DOM was simulated for each stand type
(management plan strata) throughout stand development for a
period of 275 years, the same length of time as available
volume tables. Simulations showed that soil C was stable,
varying less than 5% throughout the planning horizon and the
net change caused by forest harvest would be even less. For this
reason, we have excluded the modeling of soil C from this
study, and focused on the more dynamic live and dead organic
matter (DOM) pools of C. van Kooten et al. (2004) also noted
that soil C did not significantly change through forest
management.
CBM-CFS3 tracks C in two major pools: (1) living biomass,
calculated as a function of the growing timber volume; and (2)
DOM, dependant on the stand-replacing disturbance that
initiated stand development and mortality of living biomass.
Quantities of CWD and DOM are initially dependant on stand
history (Hely et al., 1999), with the model permitting post-
clearcut, post-wildfire or post-insect disturbance origins (Kurz,
personal communication), and later dependent upon stand
development. Biomass simulated to have died in CBM-CFS3
initiates transfers C from the living biomass to the DOM pools.
Specific parameters simulating C accumulations based on
volume growth used in the model are unpublished at the time of
print (Kurz, personal communication). Decay rates of the
CBM-CFS2, implemented similarly in CBM-CFS3, are
described by Kurz and Apps (1999) and Li et al. (2003).
In CBM-CFS3, stand growth and decline determine amounts
of biomass in proportion to amount of volume, calculated by
stand type from volume tables. Stand mortality is a function of
change in merchantable volume over time, with mortality
increasing as stands approach over-maturity (Brown and
Schroeder, 1999; Taylor and MacLean, 2005). CBM-CFS3
predicts stem wood biomass from net merchantable volume,
from volume tables, and then calculates biomass in other living
pools, as described below. Transfers from living biomass to
DOM occur based on turnover rates and upon losses in volume,
similarly to the CBM-CFS2 (Kurz and Apps, 1999).
Stand origin influences initial values in DOM pools, with
stands that had been clearcut before regeneration having less
simulated DOM than those with wildfire as the stand replacing
disturbance (Hale et al., 1999; Hely et al., 1999). Forest fires
leave standing snags, while clearcut harvesting removes nearly
all stemwood following harvest (Grenon et al., 2004). Within
CBM-CFS3, we used clearcut events as the most recent
disturbance with historical disturbance set to wildfire. This was
consistent with forests in the region that have undergone
interventions for the past 200 years (Erdle and Pollard, 2002) as

E.T. Neilson et al. / Forest Ecology and Management 253 (2007) 148–160 151
well as cyclical spruce budworm (Choristoneura fumiferana
Clem.) outbreaks (Baskerville, 1995).
2.3. Biomass and DOM pools
C in woody biomass in CBM-CFS3 is divided into six pools,
similar to the CBM-CFS2 (Kurz and Apps, 1999; Li et al.,
2002): (1) merchantable stemwood, calculated as a function of
timber volume; (2) foliage, calculated based on merchantable
stemwood; (3) other biomass (bark, branches, and stumps) of
merchantable trees; (4) other biomass of subordinate species,
calculated as a function of timber volume; (5) fine roots
(<5 mm diameter), calculated from aboveground biomass; and
(6) coarse roots, calculated from aboveground biomass.
Hardwood biomass has higher wood density, as reflected in
CBM-CFS3 volume to biomass equations (Brown, 2002; Kurz
et al., 2002).
C in CWD and DOM in CBM-CFS3 is divided into nine
pools, an increase from four pools in CBM-CFS2 (Kurz and
Apps, 1999): (1) CWD, the ‘‘medium’’ DOM pool, simulated
from stand-replacing disturbance and fall-down of snag stems;
(2) forest floor litter, the aboveground ‘‘very fast’’ pool,
calculated from turnover rates of foliage and fine roots; (3)
mineral soil detritus, the belowground ‘‘very fast’’ pool,
calculated from turnover of fine roots; (4) mineral soil detritus,
the belowground ‘‘fast’’ pool calculated from turnover of
coarse roots; (5) forest floor detritus, the aboveground ‘‘fast’’
pool, calculated from turnover of coarse roots, and fall-down of
snag branches; (6) and (7) C in hardwood and softwood snag
stems, calculated from death of merchantable stemwood; and
(8) and (9) C in hardwood and softwood snag branches,
calculated from turnover of branches. Volume tables provide
the independent variables, decay factors applied to each of the
DOM pools initiate transfers of C to the atmosphere, and
turnover rates initiate transfers from biomass and DOM pools to
other DOM pools in the CBM-CFS3, similar to the CBM-CFS2
(Kurz and Apps, 1999). Two additional DOM pools, the
aboveground and belowground slow DOM pools were omitted
from our analysis because they represented forest soil organic
matter and varied little.
2.4. Carbon yield curves
Volume yield tables from each stand type were collated into
a database delineated by hardwood and softwood volume, stand
type, and age class. One hectare of each stand type was
simulated from age 0 to 275 years. Volumes from each species
cohort within each stand type were sorted and the species with
the highest merchantable volume between 40 and 80 years old
was assigned as the dominant species or species group (e.g.,
balsam fir or balsam fir–spruce). This was used to select the
‘‘leading species’’ parameter in CBM-CFS3, which determines
parameters for use in biomass equations (presently unpub-
lished; Kurz, personal communication) used to simulate C from
volume. Mixedwood strata, defined as <75% volume as
softwood and <75% volume hardwood, were identified as
‘‘mixedwood’’. The C in the 14 biomass and DOM pools was
summed by 5-year age class to derive C yield curves by age; 5-
year classes were selected for consistency with forest
management planning for the test landbase.
2.5. Modeling and mapping forest carbon
The C yields were then input to an existing timber supply
model, in our case Woodstock (Remsoft, 1999). Neilson et al.
(2006) described application of the modeling framework using
C yields to simulate effects of forest management on C stocks.
In this paper, we used the C yield curves to derive spatial
distribution of C for the reference year 2002. The GIS shapefile
of the forest management area included cover type and age
class attributes for each stand polygon. C yields by stand type
and age class were imported into the GIS, and we did a
‘thematic join’ of stand type identifiers in the cover type
attributes table to those in the C yields table, to look up C as a
function of stand type and age class.
The advantages of this method, in comparison with using the
static current forest inventory to estimate C, is that (1) C is
projected over a full 275-year period, enabling future
projections and analyses of alternative management scenarios
(Neilson et al., submitted for publication); and (2) we
incorporate an estimate of the amount of DOM in stand types
dependant on stand initialization and past disturbance regimes.
An alternative might be to use a single biomass expansion
factor applied to generic stand types and the static current
inventory, but our method uses the functionality of CBM-CFS3
to simulate C based explicitly on the volume of specific stand
types. C yield curves permit incorporation of C stock estimation
into forest management planning.
3. Results
3.1. Living biomass pools C in natural and planted stand
types
Forty percent of the test landbase was covered in a variety of
balsam fir, fir–spruce, or spruce–fir stand types, deciduous
stand types comprised 48%, and other softwood stands (eastern
white pine, red pine, and eastern white cedar) made up 4%
(Fig. 1). Many of the 300 plus stand types used in management
planning are variants of species groups by ecosite or
silvicultural treatment. In this paper, we present C yield curves
in living biomass pools in six natural and four planted stand
types (Fig. 2). In balsam fir and black spruce–balsam fir stands,
40–50% of total C and 54–58% of the living biomass were in
merchantable stemwood, once the stand reached maturity
(Fig. 2a and b). Rate of stand decline after maturity varied
among stand types, with balsam fir showing a rapid decline in
stemwood C after year 80, as opposed to decline beginning
around age 100 in black spruce–balsam fir (Fig. 2a and b).
Cedar stands showed similar distribution of C to black spruce–
balsam fir, but with a longer period of regeneration delay and
decline in stemwood C only after 125 years (Fig. 2c).
Hardwood stands included 21% of the landbase in shade
tolerant sugar maple, yellow birch, and American beech, and

Fig. 2. C in living biomass pools in six natural and four planted stand types, as simulated by CBM-CFS3 for 250 years. These represented post-clearcut stands with a
historic disturbance regime of wildfire, and cover most of the spruce–fir and hardwood stand types on the landbase. Flat lines at the end of g, h, i, and j represent
periods where zero merchantable volume was simulated by the STAMAN stand growth model.
E.T. Neilson et al. / Forest Ecology and Management 253 (2007) 148–160152

Fig. 3. Carbon simulated in dead organic matter pools in 10 natural and planted stand types on the Upsalquitch Forest Management Area.
E.T. Neilson et al. / Forest Ecology and Management 253 (2007) 148–160 153

Fig. 4. Carbon simulated to accumulate in snags in six natural and four planted stand types on the Upsalquitch Forest Management Area.
E.T. Neilson et al. / Forest Ecology and Management 253 (2007) 148–160154
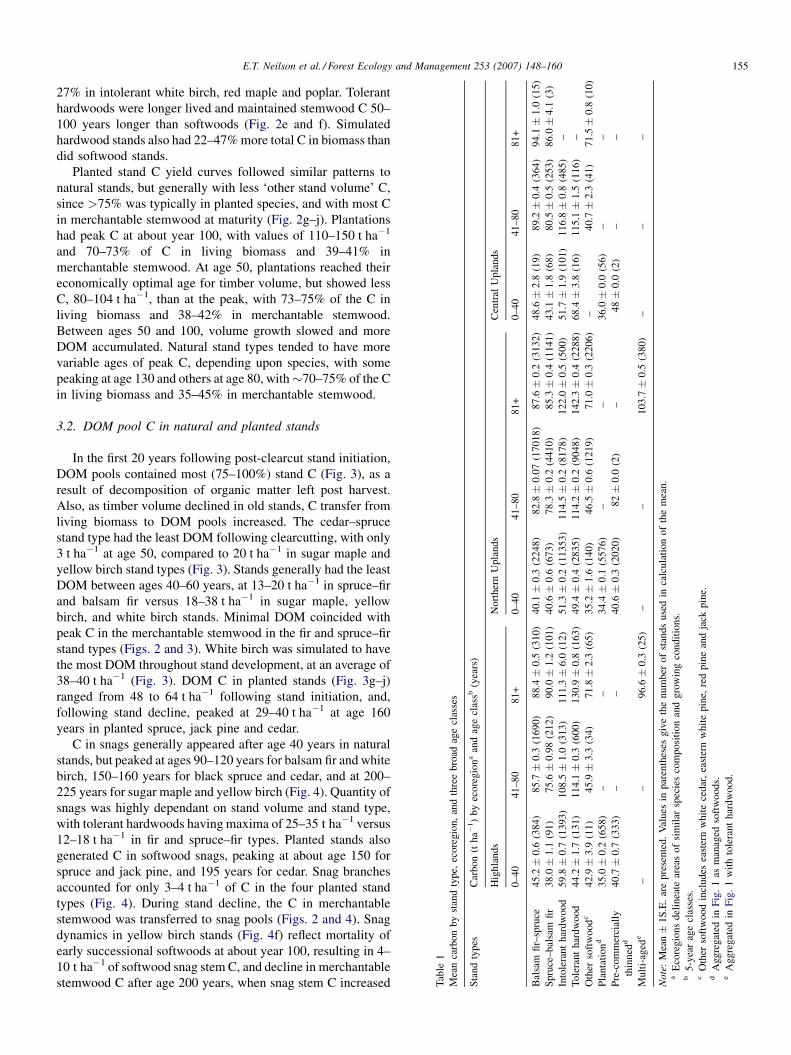
Tab
le1
Mea
nca
rbo
nb
yst
and
type,
eco
regio
n,
and
thre
eb
road
age
clas
ses
Sta
nd
typ
esC
arb
on
(th
a�1)
by
eco
regio
na
and
age
clas
sb(y
ears
)
Hig
hla
nds
No
rth
ern
Up
land
sC
entr
alU
pla
nd
s
0–
40
41
–8
08
1+
0–
40
41
–80
81
+0
–4
04
1–
80
81
+
Bal
sam
fir–
spru
ce4
5.2�
0.6
(38
4)
85
.7�
0.3
(16
90)
88
.4�
0.5
(31
0)
40
.1�
0.3
(22
48
)8
2.8�
0.0
7(1
70
18
)8
7.6�
0.2
(31
32)
48
.6�
2.8
(19
)8
9.2�
0.4
(36
4)
94
.1�
1.0
(15
)
Sp
ruce
–b
alsa
mfi
r3
8.0�
1.1
(91
)7
5.6�
0.9
8(2
12
)9
0.0�
1.2
(10
1)
40
.6�
0.6
(67
3)
78
.3�
0.2
(44
10)
85
.3�
0.4
(11
41)
43
.1�
1.8
(68
)8
0.5�
0.5
(25
3)
86
.0�
4.1
(3)
Into
lera
nt
har
dw
oo
d5
9.8�
0.7
(13
93)
10
8.5�
1.0
(31
3)
11
1.3�
6.0
(12
)5
1.3�
0.2
(11
35
3)
11
4.5�
0.2
(81
78)
12
2.0�
0.5
(50
0)
51
.7�
1.9
(10
1)
11
6.8�
0.8
(48
5)
–
To
lera
nt
har
dw
ood
44
.2�
1.7
(13
1)
11
4.1�
0.3
(60
0)
13
0.9�
0.8
(16
3)
49
.4�
0.4
(28
35
)1
14
.2�
0.2
(90
48)
14
2.3�
0.4
(22
88)
68
.4�
3.8
(16
)1
15
.1�
1.5
(11
6)
–
Oth
erso
ftw
oo
dc
42
.9�
3.9
(11
)4
5.9�
3.3
(34
)7
1.8�
2.3
(65
)3
5.2�
1.6
(14
0)
46
.5�
0.6
(12
19)
71
.0�
0.3
(22
06)
–4
0.7�
2.3
(41
)7
1.5�
0.8
(10
)
Pla
nta
tion
d3
5.0�
0.2
(65
8)
––
34
.4�
0.1
(55
76
)–
–3
6.0�
0.0
(56
)–
–
Pre
-com
mer
cial
ly
thin
ned
d
40
.7�
0.7
(33
3)
––
40
.6�
0.3
(20
20
)8
2�
0.0
(2)
–4
8�
0.0
(2)
––
Mu
lti-
aged
e–
–9
6.6�
0.3
(25
)–
–1
03
.7�
0.5
(38
0)
––
–
No
te:
Mea
n�
1S
.E.
are
pre
sente
d.
Val
ues
inpar
enth
eses
giv
eth
enum
ber
of
stan
ds
use
din
calc
ula
tion
of
the
mea
n.
aE
core
gio
ns
del
inea
tear
eas
of
sim
ilar
spec
ies
com
posi
tion
and
gro
win
gco
ndit
ions.
b5-y
ear
age
clas
ses.
cO
ther
soft
wo
od
incl
ud
esea
ster
nw
hit
ece
dar
,ea
ster
nw
hit
ep
ine,
red
pin
ean
dja
ckp
ine.
dA
gg
regat
edin
Fig
.1
asm
anag
edso
ftw
oo
ds.
eA
gg
regat
edin
Fig
.1
wit
hto
lera
nt
har
dw
ood
.
E.T. Neilson et al. / Forest Ecology and Management 253 (2007) 148–160 155
27% in intolerant white birch, red maple and poplar. Tolerant
hardwoods were longer lived and maintained stemwood C 50–
100 years longer than softwoods (Fig. 2e and f). Simulated
hardwood stands also had 22–47% more total C in biomass than
did softwood stands.
Planted stand C yield curves followed similar patterns to
natural stands, but generally with less ‘other stand volume’ C,
since >75% was typically in planted species, and with most C
in merchantable stemwood at maturity (Fig. 2g–j). Plantations
had peak C at about year 100, with values of 110–150 t ha�1
and 70–73% of C in living biomass and 39–41% in
merchantable stemwood. At age 50, plantations reached their
economically optimal age for timber volume, but showed less
C, 80–104 t ha�1, than at the peak, with 73–75% of the C in
living biomass and 38–42% in merchantable stemwood.
Between ages 50 and 100, volume growth slowed and more
DOM accumulated. Natural stand types tended to have more
variable ages of peak C, depending upon species, with some
peaking at age 130 and others at age 80, with�70–75% of the C
in living biomass and 35–45% in merchantable stemwood.
3.2. DOM pool C in natural and planted stands
In the first 20 years following post-clearcut stand initiation,
DOM pools contained most (75–100%) stand C (Fig. 3), as a
result of decomposition of organic matter left post harvest.
Also, as timber volume declined in old stands, C transfer from
living biomass to DOM pools increased. The cedar–spruce
stand type had the least DOM following clearcutting, with only
3 t ha�1 at age 50, compared to 20 t ha�1 in sugar maple and
yellow birch stand types (Fig. 3). Stands generally had the least
DOM between ages 40–60 years, at 13–20 t ha�1 in spruce–fir
and balsam fir versus 18–38 t ha�1 in sugar maple, yellow
birch, and white birch stands. Minimal DOM coincided with
peak C in the merchantable stemwood in the fir and spruce–fir
stand types (Figs. 2 and 3). White birch was simulated to have
the most DOM throughout stand development, at an average of
38–40 t ha�1 (Fig. 3). DOM C in planted stands (Fig. 3g–j)
ranged from 48 to 64 t ha�1 following stand initiation, and,
following stand decline, peaked at 29–40 t ha�1 at age 160
years in planted spruce, jack pine and cedar.
C in snags generally appeared after age 40 years in natural
stands, but peaked at ages 90–120 years for balsam fir and white
birch, 150–160 years for black spruce and cedar, and at 200–
225 years for sugar maple and yellow birch (Fig. 4). Quantity of
snags was highly dependant on stand volume and stand type,
with tolerant hardwoods having maxima of 25–35 t ha�1 versus
12–18 t ha�1 in fir and spruce–fir types. Planted stands also
generated C in softwood snags, peaking at about age 150 for
spruce and jack pine, and 195 years for cedar. Snag branches
accounted for only 3–4 t ha�1 of C in the four planted stand
types (Fig. 4). During stand decline, the C in merchantable
stemwood was transferred to snag pools (Figs. 2 and 4). Snag
dynamics in yellow birch stands (Fig. 4f) reflect mortality of
early successional softwoods at about year 100, resulting in 4–
10 t ha�1 of softwood snag stem C, and decline in merchantable
stemwood C after age 200 years, when snag stem C increased

E.T. Neilson et al. / Forest Ecology and Management 253 (2007) 148–160156
from 8 to 20 t ha�1 (Fig. 4f). Snags made up about 10% of the
total C within stands, averaging 8 t ha�1 across all ages in
planted stand types and peaking at �35 t ha�1 in 200-year-old
yellow birch and sugar maple stands.
3.3. Spatial carbon distribution
Stand age and species composition clearly influenced the
amounts of C in stands. We summarized C content within three
broad age classes, 0–40, 41–80, and 81+ years, representing
regeneration-immature, maturing, and overmature develop-
ment phases. Balsam fir–spruce stands in three different
ecoregions averaged 40–49, 83–89, and 88–94 t ha�1 at ages 0–
40, 41–80, and 81+, respectively (Table 1). Balsam fir stands
made up 30% of the area and also 30% of the total C on the
landbase (Fig. 5). Spruce–fir stands generally had less C than
balsam fir–spruce stands, averaging 38–43, 76–81, and 85–
90 t ha�1 for 0–40, 41–80, and 81+ years, respectively. Other
softwood stands consisting of mixes of eastern white cedar,
hemlock and red, white and jack pines made up 4% of the
landbase in area yet only 3% of the total C.
Intolerant hardwoods made up 27% of the landbase area and
28% of the total C. Intolerant hardwood stands generally had
higher mean C per hectare than softwoods, ranging from 51 to
60, 109 to 117, and 111 to 122 t ha�1 for ages 0–40, 41–80, and
81+ years (Table 1). Tolerant hardwoods made up 21% of the
landbase area yet 26% of the total C. Tolerant hardwoods
showed higher density of C per hectare than other stand types,
at 44–68, 114–115, and 131–142 t ha�1 for ages 0–40, 41–80,
and 81+ years.
Plantations were young (mean age of 9 years) and thus had
relatively low C, ranging from 34 to 36 t ha�1 across ecoregions
(Table 1). Precommercially thinned stands (mean age of 21
years) had higher mean C at 41–48 t ha�1 (Table 1). Managed
softwood made up 8% of the area yet only 4% of the total C, due
Fig. 5. Spatial distribution of forest C stocks on
to their young ages. Multi-aged stands, generated by selective
harvesting, included sugar maple and yellow birch aged 81+
years old, with 97–104 t ha�1 of C (Table 1). Multi-aged stands
were aggregated into the tolerant hardwood group (Fig. 1),
which contributed 26% of the total C on the landscape.
The mapped distribution of C in stands across the landbase is
shown in Fig. 5. Tolerant hardwood and old stands had the most
C. The total C (above and belowground biomass and CWD) on
the 428,000 ha landbase was 35,040,000 t, or an average of
82 t ha�1. Totals of 58,460, 115,200, 170,000, and 68,000 ha
contained 0–40, 41–80, 81–120, and 121+ t ha�1, respectively
(Fig. 5). Managed and unmanaged softwood forest concen-
trated in the central part of the landbase (Fig. 1) is evident as
relatively low C areas (Fig. 5).
4. Discussion
4.1. Species influence on C
Due to differences in wood density, the amount of C was
higher in hardwoods than in softwoods at ages 40 and greater
(Table 1). We compared our results to those of other studies in
comparable stands types, essentially as a ‘‘verification’’ of
parameters used in CBM-CFS3. Shade tolerant hardwoods
generally contain more C than softwood stand types of similar
volume and age (Jenkins et al., 2003). Yellow birch stands in
our study area had about 40 t ha�1 more C than spruce–fir
stands at age 150 years. Brown (2002) found that softwood and
hardwood forests averaged about 25–75 and 40–90 t ha�1 of C,
excluding roots; our results, excluding roots, which averaged
10–20 t ha �1of C at age 80, were similar for softwoods and
higher at 44–142 t ha�1 for hardwoods. Zhou et al. (2004)
found average above and belowground biomass of 96 t ha�1 in
spruce stands with an average of 174 m3 ha�1, similar to our
results of 86–90 t ha�1 in spruce–fir stands aged 81+ years.
the Upsalquitch Forest Management Area.

E.T. Neilson et al. / Forest Ecology and Management 253 (2007) 148–160 157
Smith et al. (2006) calculated 97 t ha�1 of biomass C at age 85
with 171 m3 ha�1 in spruce–balsam fir stand types; our average
of 87 t ha�1 was comparable.
Spruce-dominated stands in Ontario, Canada had 18–
20 t ha�1 of C in belowground biomass and 87–89 t ha�1
of C in aboveground biomass (Hazlett et al., 2005), versus
75–90 t ha�1 for similar stands in our study. C in snags, at
5–7 t ha�1 (Hazlett et al., 2005) was also similar to our results.
Snag basal area ranging from 8 to 15% of the total basal area of
live trees (Goodburn and Lorimer, 1998) was comparable to the
9–11% of the stand total C based on proportion of snags to live
tree C (stemwood, foliage and bark) in our hardwood stands.
Ecoregion had a minor influence on mean C per hectare,
which was consistently highest in the Central Uplands
ecoregion, though not a statistically significant difference.
This was most likely due to increased volume in stands within
this ecoregion. Taylor and MacLean (2005) studied decline of
balsam fir and spruce in permanent sample plots in the same
three ecoregions in our study, and also determined that volume
was highest in plots in the Central Uplands.
4.2. Age class influence on C
Among all stand types, total C in all biomass pools ranged
from 50 to 109 t ha�1 at age 50 years, 92–138 t ha�1 at age 100,
and 79–145 t ha�1at age 150 years. At age 100 years, planted
softwoods had 94–135 t ha�1, versus 92–117 t ha�1 for natural
softwoods and 127–138 t ha�1 for natural hardwoods. Planted
white spruce and natural sugar maple and yellow birch clearly
sequestered the most C. As stands age, they accumulate more C.
Stands aged >80 years had mean total C 13–25% higher than
stands aged 0–40, and 1–11% higher than stands aged 40–80
(Table 1), similar to other results (Hale et al., 1999; Means
et al., 1999; Siitonen et al., 2000). However, after stand break
up, timber volume and C began to decline. Decline in older fir–
spruce stands occurs quickly (Taylor and MacLean, 2005) and
reductions in C coincide with reductions in mean annual
volume increment. Total C in fir–spruce and spruce–fir stands
associated with volume decline (Fig. 2a and b) decreased by 8–
10% in 20 years, 19–21% in 40 years, and 47–66% in 100 years.
Other research has shown a constant rate of growth with
increasing stand age (Zhou et al., 2004) with no decline in C.
However, in New Brunswick, especially in relatively short-
lived balsam fir, stand break up seems to be a driver of
successional stand development (Taylor and MacLean, 2005).
When stands enter a steady state in which the rates of growth
and death are equal, CWD accumulates (Hagan and Grove,
1999). Our results reflect substantial snag and DOM associated
with natural spruce–fir decline.
4.3. Carbon yield curves
Our approach to developing C yields for forest stands differs
from that of previous studies that used biomass expansion
factors to convert measured static timber volume to tonnage of
C (Brown and Schroeder, 1999; Heath and Smith, 2000; Smith
and Heath, 2001; Liski et al., 2006). For example, Liski et al.
(2006) used successive amounts of volume estimated from
forest inventories collected over the past 80 years, and
converted volume to C. Whereas the ‘‘inventory’’ approach
sums C across temporal scales by comparison of total volume in
each inventory year, we used a method analogous to timber
supply projection for annual sustainable harvest calculation for
large landbases, in which plot data were used to parameterize
volume growth for all classes of stands (‘strata’) in the forest
management unit. Instead of timber volume yield curves, these
were C yield curves that simulate C growth and decline by stand
type. The CBM-CFS3 does not use biomass expansion factors,
and instead relies on volume to biomass conversion equations
developed from studies on similar sites (Kurz et al., 1992). Our
approach differs from previous studies in using CBM-CFS3 as a
tool to derive C yield curves, which then can be used as input
into a timber supply model, to provide managers with a
dynamic view of effects of silviculture and harvesting plans on
forest C. This method to generate C yields is transferable to
other areas, given stand growth and yield data. The CBM-CFS3
model can be parameterized to simulate C dynamics throughout
the forests of Canada.
C yield tables have been proposed to quantify landscape-
level C (Smith et al., 2006), but to our knowledge, not yet
incorporated into a current operational forest management plan.
Remote sensing (e.g., LIDAR) has been used to estimate
aboveground biomass (Bergen et al., 1998; Means et al., 1999;
Patenaude et al., 2004), though it requires additional data
collection and considerable data processing and analysis. Forest
inventory data presently exist in most jurisdictions, and growth
and timber yield are regularly estimated as part of forest
management planning. Our method builds upon this existing
data and timber supply analysis procedures. C yield curves for
different stand types help identify areas with high concentra-
tions of C (Fig. 5).
4.4. Application of the framework
The results presented in this paper were from a case study of
an actual forest management plan, in cooperation with forest
industry in northern New Brunswick. While the results are
specific to the landscape studied, the modeling framework is
applicable to any forest area under similar management
planning systems. Management plans beginning with sample
plot data summarized and collected in stand growth tables and
ending with sustainable harvest level calculation with a timber
supply model are compatible with the C modeling framework
presented in this paper. Simulation of C stocks using
merchantable volume as the independent variable is possible
following the methods explained above. Certainly the number
of forest strata and complexity of forest areas will differ
regionally. Our main assumption is that stand growth and yield
values per ha are adequate representations of current, past and
future productivity of the forest. C yields can then be used as
inputs to a timber supply model as essentially a crop yield of C
per stand type analogous to timber volume.
Timber supply models including C estimates can take
advantage of optimization technologies to reduce opportunity

E.T. Neilson et al. / Forest Ecology and Management 253 (2007) 148–160158
costs of timber harvesting while maintaining C stocks on the
landscape (Neilson et al., submitted for publication). This
analysis method will allow forest managers to construct
management plans that balance two objectives, timber
extraction and C storage. Methods proposed by Smith et al.
(2006) are also applicable though they do not take advantage of
methods of simulating C stocks from volume in CBM-CFS3.
4.5. Management implications
The issue of C sequestration by forests is currently receiving
much attention as a means to mitigate increasing CO2
concentration in the atmosphere. The method in this paper
has two advantages: (1) it can be implemented in an intuitive
manner into existing forest management plans, and thus is more
apt to be used by managers; and (2) it accounts for residence
time of sequestered C. Modeling C residence times is crucial,
since forests do return C to the atmosphere on time scales of
several decades to centuries, depending upon management
regimes. The economic value of planting forests depends upon
both amount of C sequestered and its residence time. It is clear
that older forest stands accumulate and store more C than
younger stands. Stand age also strongly influences harvest
scheduling, which often focuses on ‘‘oldest first’’ in spruce and
fir stands in New Brunswick. This results in a conflict when
forest C is a management objective. Obviously managers would
choose to harvest stands before decline begins to impact timber
volume, but this may sacrifice forest structures such as snags
and CWD that are needed for ecological values. Until now,
managers would only have a reference to the amount of timber
lost during the decline phase of forest stands, but with C yield
curves, they can formulate a trade-off analysis to compare
volume lost and C stored, and use timber supply model
optimization to schedule harvesting to influence both timber
and C sequestration.
Managing for more hardwood species may be an option if
managers wish to increase the amount of C on the landscape.
Pulp mills in New Brunswick, which have focused on softwood
pulpwood, are being rendered less competitive in the global
forest product market. A focus on value-added hardwood
products would mean a management focus on developing
higher-quality hardwood logs. This would mean increased
multi-aged, selective harvest hardwood management, which
leaves more C in the forest as compared to short rotation
management (Hazlett et al., 2005). More hardwood would
make for more C, in general. This may or may not be feasible,
but if hardwood management results in increased C stocks,
managers could qualify for C emissions offsets.
If guidelines for managing forest C stocks are imposed upon
forest managers, then a method to quantify C stocks is needed.
Until now, quantification of C stocks on industrial forested
landscapes was only conducted by research scientists. The
method to calculate stand-level C yields in this paper takes
advantage of existing data without having to resort to costly
alternatives such as LIDAR or rigorous field sampling. Using
LIDAR to quantify forest biomass stocks is an additional
expense in cases where field data have already been collected.
Developing estimates from volume yield curves provide a
twofold use of field data, for calculating timber volume and
extrapolating volume to forest C.
5. Conclusions
Hardwood stands contain 10–20% more C per hectare than
softwood stands with similar volume. Generally, tolerant
hardwood stands showed greater potential to act as reservoirs of
C than intolerant hardwood or softwood stands. The mean C in
tolerant hardwoods aged�80 years was 130–142 t ha�1, versus
88–94 t ha�1 in balsam fir–spruce stands. Most plantations in
New Brunswick are still too young to evaluate the effectiveness
of increased intensive management to promote more C storage.
Multi-aged hardwood management has generally high C
content (�100 t ha�1), and more of it would increase forest C.
We used growth and yield data from a forest management
timber supply model used in strategic and tactical planning. Our
method of generating C yields is transferable to other timber
supply models that use volume over age curves, and both spatial
depiction of C on a forest landscape and scenario planning of
alternative future management regimes are possible given these
stand C yields. The development of C yield curves permits
spatial C modeling using timber supply modeling tools. Since
timber supply models already use available forest inventory
data, this forms a natural progression to including C in
integrated forest management plans.
Acknowledgements
This work was supported by funding from the Sustainable
Forest Management Network Center of Excellence and
Bowater Maritimes Inc., and by an NSERC Industrial Post-
graduate Scholarship to E.N. Jason Killam from Bowater
Maritimes Inc., Chris Hennigar, Werner Kurz, and Greg
Rampley provided valuable input.
References
Banfield, G.E., Bhatti, J.S., Jiang, H., Apps, M.J., 2002. Variability in regional
scale estimates of carbon stocks in boreal forest ecosystem: results from
west-central Alberta. For. Ecol. Manage. 169, 15–27.
Baral, A., Guha, G.S., 2004. Trees for carbon sequestration or fossil fuel
substitution: the issue of cost vs. carbon benefit. Biomass Bioenerg. 27,
41–55.
Baskerville, G.L., 1995. The forestry problem: adaptive lurches of renewal. In:
Gunderson, L.H., Holling, C.S., Light, S.S. (Eds.), Barriers & Bridges to
the Renewal of Ecosystems and Institutions. Columbia University Press,
New York, pp. 38–102.
Bergen, K.M., Dobson, C.G., Pierce, L.E., Ulaby, F.T., 1998. Characterizing
carbon in a northern forest by using SIR-C/X-SAR imagery. Rem. Sens.
Environ. 63, 24–39.
Bhatti, J.S., Apps, M.J., Tarnocai, C., 2001. Estimates of soil organic carbon
stocks in central Canada using three different approaches. Can. J. For. Res.
32, 805–812.
Bowater Maritimes Inc., 2002. The Upsalquitch License #1 2002–2036 man-
agement plan. Spatial submission. Bowater Maritimes Inc., Dalhousie, NB,
Canada.
Brown, S., 2002. Measuring carbon in forests: current status and future
challenges. Environ. Pollut. 116, 363–372.

E.T. Neilson et al. / Forest Ecology and Management 253 (2007) 148–160 159
Brown, S.L., Schroeder, P.E., 1999. Spatial patterns of aboveground produc-
tion and mortality of woody biomass for eastern U.S. forest. Ecol. Appl. 9,
968–980.
Dixon, R.K., Brown, S., Houghton, R.A., Solomon, A.M., Trexler, M.C.,
Wisniewski, J., 1994. Carbon pools and flux of global forest ecosystems.
Science 263, 185–190.
Erdle, T., Pollard, J., 2002. Are plantations changing the tree species composi-
tion of New Brunswick’s forest? For. Chron. 78, 812–821.
Fredeen, A.L., Bois, C.H., Janzen, D.T., Sanborn, P.T., 2005. Comparison of
coniferous forest carbon stocks between old-growth and young second-
growth forests on two soil types in central British Columbia Canada. Can. J.
For. Res. 35, 1411–1421.
Gillis, M.D., 2001. Canada’s national forest inventory (responding to current
needs). Environ. Monitor. Assess. 67, 121–129.
Goodburn, J.M., Lorimer, C.G., 1998. Cavity trees and coarse woody debris in
old-growth and managed northern hardwood forests in Wisconsin and
Michigan. Can. J. For. Res. 28, 427–438.
Granier, A., Ceschia, E., Damesin, C., Dufrene, E., Epron, D., Gross, P.,
Lebaube, S., Le Dantec, V., Le Goff, N., Lemoine, D., Lucot, E., Ottorini,
J.M., Pontailler, J.Y., Saugier, B., 2000. The carbon balance of a young
beech forest. Funct. Ecol. 14, 312–325.
Grenon, F., Bradley, R.L., Joanisse, G., Titus, B.D., Prescott, C.E., 2004.
Mineral N availability for conifer growth following clearcutting:
responsive versus non-responsive ecosystems. For. Ecol. Manage. 188,
305–316.
Hagan, J.M., Grove, S.L., 1999. Coarse woody debris: humans and nature
competing for trees. J. For. 97, 6–11.
Hale, C.M., Pastor, J., Rusterholz, K.A., 1999. Comparison of structural and
compositional characteristics in old-growth and mature, managed hardwood
forests of Minnesota U.S.A. Can. J. For. Res. 29, 1479–1489.
Hazlett, P.W., Gordon, A.M., Sibley, P.K., Buttle, J.M., 2005. Stand carbon
stocks and soil carbon and nitrogen storage for riparian and upland forests of
boreal lakes in northeastern Ontario. For. Ecol. Manage. 219, 56–68.
Heath, L.S., Smith, J.E., 2000. An assessment of uncertainty in forest carbon
budget projections. Environ. Sci. Pollut. 3, 73–82.
Hely, C., Bergeron, Y., Flannigan, M.D., 1999. Coarse woody debris in the
southeastern Canadian boreal forest: composition and load variations in
relation to stand replacement. Can. J. For. Res. 30, 674–678.
Hoen, H.F., Solberg, B., 1994. Potential and economic efficiency of carbon
sequestration in forest biomass through silvicultural management. For. Sci.
40, 429–451.
Jenkins, J.C., Chojnacky, D.C., Heath, L.S., Birdsley, R.A., 2003. National-
scale biomass estimators for United States tree species. For. Sci. 49,
12–35.
Kurz, W.A., Apps, M.J., 1999. A 70-year retrospective analysis of carbon fluxes
in the Canadian forest sector. Ecol. Appl. 9, 526–547.
Kurz, W.A., Apps, M.J., Webb, T.M., McNamee, P.J., 1992. The carbon budget
of the Canadian forest sector: Phase I. For. Can., Northern Forestry Centre,
Edmonton, AB, Canada, Inf. Rep. NOR-X-326.
Kurz, W.A., Beukema, S.J., Apps, M.J., 1996. Estimation of root biomass and
dynamics for the carbon budget of Canadian forests. Can. J. For. Res. 26,
1973–1979.
Kurz, W.A., Apps, M., Banfield, E., Stinson, G., 2002. Forest carbon accounting
at the operational scale. For. Chron. 78, 672–679.
Law, B.E., Thornton, P.E., Irvine, J., Anthoni, P.M., Van Tuyl, S., 2001. Carbon
storage and fluxes in ponderosa pine forests at different developmental
stages. Global Change Biol. 7, 755–777.
Lee, J., Morrison, I.K., Leblanc, J.D., Dumas, M.T., Cameron, D.A., 2002.
Carbon sequestration in trees and regrowth vegetation as affected by
clearcut and partial cut harvesting in a second-growth boreal mixedwood.
For. Ecol. Manage. 169, 83–101.
Li, Z., Apps, M.J., Banfield, E., Kurz, W.A., 2002. Estimating net primary
production of forests in the Canadian Prairie Provinces using an inventory-
based carbon budget model. Can. J. For. Res. 32, 161–169.
Li, Z., Kurz, W.A., Apps, M., Beukema, S.J., 2003. Belowground biomass
dynamics in the Carbon Budget Model of the Canadian Forest Sector: recent
improvements and implications for the estimation of NPP and NEP. Can. J.
For. Res. 33, 126–136.
Liski, J., Lehtonen, A., Palusuo, T., Peltoniemi, M., Eggers, T., Muukkonen,
P., Makipaa, R., 2006. Carbon accumulation in Finland’s forests
1922–2004—an estimate obtained by combination of forest inventory
data with modelling of biomass, litter and soil. Ann. For. Sci. 63, 687–
697.
McDowell, N.G., Balster, N.J., Marshall, J.D., 2005. Belowground
carbon allocation of Rocky Mountain Douglas-fir. Can. J. For. Res. 35,
1425–1434.
Means, J.E., Acker, S.A., Harding, D.J., Blair, J.B., Lefsky, M.A., Cohen, W.B.,
Harmon, M.E., McKee, W.A., 1999. Use of large-footprint scanning air-
borne Lidar to estimate forest stand characteristics in the western Cascades
of Oregon. Rem. Sens. Environ. 67, 298–308.
Murray, B.C., 2000. Carbon values, reforestation, and ‘perverse’ incentives
under the Kyoto Protocol: an empirical analysis. Mitig. Adapt. Strat. Global
Change 5, 271–295.
New Brunswick Department of Natural Resources and Energy (NBDNRE),
1998. Ecological land classification for New Brunswick: ecoregion, eco-
district, and ecosite levels. Fredericton, NB, Canada.
Neilson, E., MacLean, D.A., Arp, P.A., Meng, F.-R., Bourque, C.P., Bhatti,
J.S., 2006. Modeling carbon sequestration with CO2Fix and a timber
supply model for use in forest management planning. Can. J. Soil Sci. 86,
219–233.
Neilson, E.T., MacLean, D.A., Meng, F.-R., Arp, P.A., submitted for publica-
tion. Optimizing forest carbon stocks on an industrial forest land in northern
New Brunswick. Can. J. For. Res.
Nelson, K.C, de Jong, B.H.J., 2003. Making global initiatives local realities:
carbon mitigation projects in Chiapas Mexico. Global Environ. Change 13,
19–30.
Norfolk, C.J., 2005. New Brunswick Growth and Yield Unit Progress Report-
2004. New Brunswick Growth and Yield Unit, Fredericton, NB, Canada.
Report. 107 pp.
Patenaude, G., Hill, R.A., Milne, R., Gaveau, D.L.A., Briggs, B.B.J., Dawson,
T.P., 2004. Quantifying forest above ground carbon content using LiDAR
remote sensing. Rem. Sens. Environ. 93, 368–380.
Phillips, D.L., Brown, S.L., Schroeder, P.E., Birdsey, R.A., 2000. Toward error
analysis of large-scale forest carbon budgets. Global Ecol. Biogeogr. 9,
305–313.
Remsoft, Inc., 1999. Woodstock Users Guide. Remsoft Inc., Fredericton, NB,
Canada.
Siitonen, J., Martikainen, P., Punttila, P., Rauh, J., 2000. Coarse woody debris
and stand characteristics in mature managed and old-growth boreal mesic
forests in southern Finland. For. Ecol. Manage. 128, 211–225.
Smith, J.E., Heath, L.S., 2001. Identifying influences on model uncertainty:
an application using a forest carbon budget model. Environ. Manage. 27,
253–267.
Smith, J.E., Heath, L.S., Skog, K.E., Birdsey, R.A., 2006. Methods for
calculating forest ecosystem and harvested carbon with standard estimates
for forest types of the United States. USDA Forest Service, General
Technical Report NE-323, 216 pp.
Sohngen, B., Mendelsohn, R., 2003. An optimal control model of forest carbon
sequestration. Amer. J. Agric. Econ. 85, 448–457.
Taylor, S.L., MacLean, D.A., 2005. Rate of decline of mature and overmature
softwood stands by ecological region in New Brunswick. Can. J. For. Res.
35, 2479–2490.
Turner, D.P., Koerpoer, G.L., Harmon, M.E., Lee, J.L., 1995. A carbon budget
for forests of the conterminous United States. Ecol. Appl. 5, 421–436.
van Kooten, G.C., Binkley, C.S., Delcourt, G., 1995. Effect of carbon taxes and
subsidies on optimal forest rotation age and supply of carbon services.
Amer. J. Agric. Econ. 77, 365–374.
van Kooten, G.C., Eagle, A.J., Manley, J., Smolak, T., 2004. How costly are
carbon offsets? A meta-analysis of carbon forest sinks. Environ. Sci. Poll. 7,
239–251.
Vanguard Forest Management Services Ltd., 1993. STAMAN stand growth
model. In Forest Protection Planning to Sustain Long-term Wood Sup-
plies. Contract Report to Can. For. Serv., Fredericton, NB, Canada, pp.
B1–B39.
Wulder, M.A., Kurz, W.A., Gillis, M., 2004. National level forest monitoring
and modeling in Canada. Progress Plan. 61, 365–381.

E.T. Neilson et al. / Forest Ecology and Management 253 (2007) 148–160160
Zelazny, V.F., Ng, T.T.M., Hayter, M.G., Bowling, C.L., Bewick, D.A.,
1989. Field guide to forest site classification in New Brunswick.
New Brunswick Department of Natural Resources and Energy,
Fredericton, NB.
Zheng, D., Rademacher, J., Chen, J., Crow, T., Bresee, M., Le Moine, J., Ryu,
S.-R., 2004. Estimating aboveground biomass using Landsat 7 ETM + data
across a managed landscape in northern Wisconsin USA. Rem. Sens.
Environ. 93, 402–411.
Zhou, X., Peng, C., Dang, Q.-L., Chen, J., Parton, S., 2004. Simulating forest
growth and carbon dynamics of the Lake Abitibi Model Forest in north-
eastern Ontario. Ontario Forest Research Institute, Ministry of Natural
Resources, Ontario, Canada. Forest Research Report No. 163.