Spatial Decision Support Systems Use in Peacekeeping and ...
274
Spatial Decision Support Systems Use in Peacekeeping and Stability Operations Analysis: Spatial Analysis for U.S. Army Civil Affairs Civil Information Management By EARNESTRHEINOLD R. LLOYD Presented to the Faculty of the Graduate School of The University of Texas at Arlington in Partial Fulfillment of the Requirements for the Degree of DOCTOR OF PHILOSOPHY THE UNIVERSITY OF TEXAS AT ARLINGTON MAY 2019 SUPERVISING COMMITTEE: ARDESHIR ANJOMANI, SUPERVISING PROFESSOR ROD HISSONG JIANLING LI
Transcript of Spatial Decision Support Systems Use in Peacekeeping and ...

Spatial Decision Support Systems Use in Peacekeeping and Stability Operations Analysis:
Spatial Analysis for U.S. Army Civil Affairs Civil Information Management
By
EARNESTRHEINOLD R. LLOYD
Presented to the Faculty of the Graduate School of The University of Texas at Arlington in Partial Fulfillment
of the Requirements for the Degree of
DOCTOR OF PHILOSOPHY
THE UNIVERSITY OF TEXAS AT ARLINGTON
MAY 2019
SUPERVISING COMMITTEE: ARDESHIR ANJOMANI, SUPERVISING PROFESSOR ROD HISSONG JIANLING LI

ACKNOWLEDGEMENTS
I wish to thank multiple individuals whose assistance was instrumental to
producing this dissertation. My paramount appreciation is to Dr. Ardeshir Anjomani, who
has been an incredibly patient, supportive and insightful professor throughout my
graduate studies at UT- Arlington. He introduced me to the subject of SDSS and is the
best mentor any student could hope to have.
I am grateful to Dr. Rod Hissong who introduced me to the New Institutional
Economic school of thought which reconciled and integrated my Economic skills with
my work in Urban Planning, Economic Development, and Civil Affairs; and who helped
me focus the theoretical foundations reflected in this dissertation. Thanks are due as
well to Dr. Jianling Li, for her instruction and counsel on the use of GIS as an analysis
tool; to Dr. Jesus Treviño for his help in illuminating spatial statistical analysis; to
administrative assistant Evelyn Lucas for always being a resourceful problem solver; to
Shatavia Thomas and Barbara Saenz for patiently helping me to enroll semester after
semester, and librarian Mitch Stepanovich for constantly helping me to acquire much of
the “hard to find” reference material supporting this research.
Finally, my utmost appreciation to God for his undeserved grace, my wife Erica
and sons Matthew and Malcom for supporting this long endeavor.
22 February 2019

ii
DEDICATION
There is an old (and now overused) African proverb stating, “It takes a village to
raise and child”. In the spirit of both that proverb, and the University of Texas at
Arlington’s College of Architecture, Planning and Public Affairs (CAPPA), I formally state
that it took a municipality for completing of this dissertation. This lengthy dedication is to
my municipality.
To God, without whose strength and grace that was provided, I would not have
completed this work.
To my father, who give me the gift of fortitude and my mother, who gave me the
gift of a love of learning; please forgive my lateness in accomplishing this task before
your departures.
To my wife Erica, and my sons Matthew and Malcom. Thank you for putting up
with a stubborn old nerd.
To my extended family, those uncles and aunts and cousins that had me to
“press on”.
To my Godparents, God sisters and everybody in the Hogues / Barber clan.
Thank you for teaching me that family is not always about blood.
To the many outstanding military leaders who encouraged this research and
taught me how to manage and lead – MG Darrell Guthrie, BG William Mason, BG
Jeffrey Coggin, COL(R) Rebecca Nielson, COL(R) Frank Earnest, and COL(R) Mike
Manty.
To Lt.Col.(R) John Adams who kept asking “What are we going to do now?”
when I could not recognize opportunity instead of defeat.
To the many military contemporaries who kept me afloat during multiple military
deployments – especially Dexter Caston, Jeff Pugh, and Paul Sanchez.
To my wordsmiths who made my attempts at writing comprehensible: Sonya
Hohlt, Jim Greenwalt, and Milton Henderson.
To Hank, Mike, Carl, Connie and Steve for teaching me to laugh.
To the soldiers of the U.S. Army Civil Affairs Regiment, especially those of
C/490, OIF 2008-2009 (WNB). This research is meant to make good use of the hard
work the teams do “down-range”. We (your leadership) owe you that much.
iii
ABSTRACT
SPATIAL DECISION SUPPORT SYSTEMS USE IN PEACEKEEPING AND STABILITY
OPERATIONS ANALYSIS: SPATIAL ANALYSIS FOR U.S. ARMY CIVIL AFFAIRS
CIVIL INFORMATION MANAGEMENT
Earnestrheinold R. Lloyd
The University of Texas at Arlington, 2019
Supervising Professor: Ardeshir Anjomani
Becoming a core U.S. military mission in 2005, Stability Operations deals with
the political, economic, social and structural resiliency of a county or region. It is
conducted to support and develop a host nation’s government, or to initiate
governmental services in a non-governed area until the host nation can do so itself.
Inherent in this is the provision of public goods, whether the military is the principal
provider or to understand the relative public good provision levels within a given area.
This understanding is known as situational awareness of the operational environment
(OE), a significant issue for any military commander and staff. An integrated
geographical representation of key socio-economic factors within the OE is required.
Known as the Stability common operational picture (Stability COP), creating it is
problematic. The general characteristics of socio-economic data are not readily practical
for meaningful presentation and integration through layers in a geographic information
system (GIS). Many of the inputs for a Stability COP are recorded in a qualitative
format, creating additional sets of analysis problems.

iv
The purpose is to develop a procedure for collating, processing and
analyzing/evaluating quantitative and qualitative socio-economic data for a Stability
COP. This study integrates the techniques of context analysis, spatial statistical
analysis, and spatial decision support systems (SDSS) within a geographic information
system (GIS) platform. Since the study centers around the theoretical foundations from
the fields of economics and public administration/urban planning, the result is a hybrid
joint Content Analysis – Conglomeration - Multicriteria Decision Analysis SDSS method.
Because of the cross-disciplinary nature of the research, the literature review references
documents ranging from military strategy texts, manuals and articles and journals/texts
discussing content analysis, spatial analysis, and SDSS. The study is a mixed methods
development case study of the Iraqi operational environment after the 2007-2008
‘Surge’ and the decision of where the U.S. Army’s main effort of Stability Operations
would be located. Finally, implementation of such a CIM procedure creates policy
implications for military force development to realize the Stability COP capability. This
study adds to the body of knowledge in the areas of military analysis,
Peacekeeping/Stability Operations and Spatial Decision Support Systems. Overall, this
research is a synthesis of many earlier unconnected techniques to achieve the goal of a
geographically integrated Stability Operations analysis.

v
TABLE OF CONTENTS
ACKNOWLEDGEMENTS .......................................................................................................................... i
DEDICATION .............................................................................................................................................. ii
ABSTRACT ................................................................................................................................................ iii
TABLE OF CONTENTS ............................................................................................................................ v
LIST OF FIGURES ................................................................................................................................... vii
LIST OF TABLES ...................................................................................................................................... ix
ACRONYMS AND ABBREVIATIONS USED ....................................................................................... xi
1. INTRODUCTION ................................................................................................................................... 1
2. STATEMENT OF PROBLEM ............................................................................................................... 3
3. THEORETICAL FOUNDATIONS AND RESULTING INFORMATION PROBLEMS ................ 14
4. RESEARCH QUESTION .................................................................................................................... 21
4.1 Research Method Overview ......................................................................................................... 22
4.2 Delphi .............................................................................................................................................. 24
4.3 Spatial Decision Support Systems (SDSS) Fundamentals ..................................................... 26
4.4 Model Management Component (MMC) Specifics .................................................................. 34
4.5 Case History ................................................................................................................................... 37
5. DATA ..................................................................................................................................................... 47
5.1 Content Analysis ............................................................................................................................ 48
5.2 Global Database of Events, Language, and Tone ................................................................... 55
6. LITERATURE REVIEW ...................................................................................................................... 59
6.1 Spatial Decision Support Systems (SDSS) Review ................................................................. 60
6.2 Civil Information Management (CIM) History ............................................................................ 73
6.3 Review Results: Intersection of SDSS, CIM, and Stability COP ............................................ 87
7. METHODOLOGY ................................................................................................................................. 88
7.1 Re-coding of the GDELT Data ..................................................................................................... 89
7.2 Conglomeration in the MMC ........................................................................................................ 91
7.2.1 Descriptive Statistics and Normality Tests ......................................................................... 92
7.2.2 Robust Statistics and Global Outlier Identification ............................................................ 99
7.2.3 Global Spatial Autocorrelation ............................................................................................ 100
7.2.4 Local Spatial Autocorrelation .............................................................................................. 106

vi
7.2.5 First Modification of Treviño’s Conglomeration ............................................................... 109
7.2.6 Second Modification of Treviño’s Conglomeration .......................................................... 117
7.3 PMESII Conglomeration Layers in the MMC .......................................................................... 119
7.4 AHP in the MMC .......................................................................................................................... 154
7.5 Final Results ................................................................................................................................. 159
8. POLICY IMPLICATIONS AND RECOMMENDATIONS .............................................................. 162
8.1 Micro Level Policy Implications.................................................................................................. 163
8.2 Macro Level Policy Implications ................................................................................................ 164
8.3 Policy Implications Beyond Stability Operations ..................................................................... 171
9. CONCLUSIONS ................................................................................................................................. 172
9.1 Overview ....................................................................................................................................... 172
9.2 Strengths and Limitations of the SDSS Method ..................................................................... 173
9.3 Further Study Recommendations ............................................................................................. 174
APPENDIX .............................................................................................................................................. 179
Delphi Questionnaires ....................................................................................................................... 179
Delphi Questionnaire Responses .................................................................................................... 182
AHP Calculations ............................................................................................................................... 196
Base and PMESII SQL Queries of the GDELT Database ........................................................... 198
Exploratory Data Analysis Statistical Charts .................................................................................. 201
Resampled Statistics (Bootstrapping) Tables ................................................................................ 224
REFERENCES ....................................................................................................................................... 236
ENDNOTES ............................................................................................................................................ 244
vii
LIST OF FIGURES
Figure 1 - Data-Information-Knowledge Transformation Diagram .............................................. 5
Figure 2 - Tacit-to-Explicit Knowledge Diagram .......................................................................... 6
Figure 3 - Civil Information Management Flow Diagram ............................................................. 8
Figure 4 - Initial MCOO Layers ................................................................................................... 9
Figure 5 - Final MCOO Example ...............................................................................................10
Figure 6 - Provincial Boundary Map of Iraq (pre March 2014) ...................................................38
Figure 7 - Pre-Surge Military Boundaries 2007..........................................................................40
Figure 8 - Provincial Stability Ratings as of 2006 ......................................................................41
Figure 9 - Iraqi Ethic and Religious Distribution .........................................................................42
Figure 10 - MAN^N Spatial Analysis Conceptual Example ........................................................86
Figure 11 - Map of Economic Operational Variables .................................................................91
Figure 12 - Economic NumArticle Histogram .............................................................................93
Figure 13 - Economic AvgTone Histogram ................................................................................93
Figure 14 - Economic NumArticle Box Plot ................................................................................94
Figure 15 - Economic AvgTone Box Plot ...................................................................................95
Figure 16 - Histogram of Natural Log of NumArticle ..................................................................96
Figure 17 - Histogram of NumArticle Square Root ....................................................................97
Figure 18 - Histogram of NumArticle Box-Cox Transformation ..................................................98
Figure 19 - Histogram of NumArticle Multiplicative Inverse Transformation ...............................98
Figure 20 - Stylized Categories for Moran’s Scatterplot ........................................................... 102
Figure 21 - Global Moran’s I – Economic NumArticle .............................................................. 104
Figure 22 - Global Moran’s I – Economic AvgTone ................................................................. 105
Figure 23 - NumArticle Local Moran’s I Economic Variable ..................................................... 107
Figure 24 - AvgTone Local Moran’s I Economic Variable ........................................................ 108
Figure 25 - Economic NumArticle Agglomeration .................................................................... 111
Figure 26 - Economic NumArticle Agglomeration and Concentration ...................................... 112
Figure 27 - Economic NumArticle Conglomerate ..................................................................... 113
Figure 28 - Economic AvgTone Concentration and Agglomeration ......................................... 114
Figure 29 - Economic AvgTone Conglomerate ........................................................................ 115
Figure 30 - Economic Magnitude and Intensity (NumArticle and AvgTone) Overlay ................ 116
Figure 31 - Map of Political Operational Variables ................................................................... 120
Figure 32 - NumArticle Local Moran’s I Political Variable ........................................................ 121
Figure 33 - Political NumArticle Conglomerate ........................................................................ 122
Figure 34 - Political AvgTone Conglomerate ........................................................................... 124
Figure 35 - Map of Military Operational Variables .................................................................... 126
Figure 36 - Military NumArticle Conglomerate ......................................................................... 128
Figure 37 - Global Moran’s I – Military AvgTone ...................................................................... 130
Figure 38 - Military AvgTone Conglomerate ............................................................................ 131
Figure 39 - Map of Social Operational Variables ..................................................................... 133
Figure 40 - Social NumArticle Conglomerate .......................................................................... 135
Figure 41 - Map of Information Operational Variables ............................................................. 137
Figure 42 - Social AvgTone Conglomerate .............................................................................. 138

viii
Figure 43 - Map of Information Operational Variables ............................................................. 140
Figure 44 - Global Moran’s I – Information NumArticle ............................................................ 141
Figure 45 - Information NumArticle Conglomerate .................................................................. 142
Figure 46 - Global Moran’s I – Information AvgTone ............................................................... 144
Figure 47 - Information AvgTone Conglomerate ...................................................................... 145
Figure 48 - Map of Infrastructure Operational Variables .......................................................... 148
Figure 49 - Infrastructure NumArticle Conglomerate ............................................................... 150
Figure 50 - Infrastructure AvgTone Conglomerate .................................................................. 152
Figure 51 - Map of Municipal Rankings for Post-Surge Stability Operations ............................ 161
Figure 52 - Political NumArticles Histogram ............................................................................ 201
Figure 53 - Political NumArticles Box Plot ............................................................................... 202
Figure 54 - Political AvgTone Histogram ................................................................................. 203
Figure 55 - Political AvgTone Box Plot .................................................................................... 204
Figure 56 - Military NumArticles Histogram ............................................................................. 205
Figure 57 - Military NumArticle Box Plot .................................................................................. 206
Figure 58 - Military AvgTone Histogram .................................................................................. 207
Figure 59 - Military AvgTone Box-Plot ..................................................................................... 208
Figure 60 - Social NumArticles Histogram ............................................................................... 211
Figure 61 - Social NumArticles Box-Plot.................................................................................. 212
Figure 62 - Social AvgTone Histogram .................................................................................... 213
Figure 63 - Social AvgTone Box-Plot ...................................................................................... 214
Figure 64 - Information NumArticle Histogram......................................................................... 216
Figure 65 - Information NumArticle Box-Plot ........................................................................... 216
Figure 66 - Information AvgTone Histogram ............................................................................ 218
Figure 67 - Information AvgTone Box-Plot .............................................................................. 218
Figure 68 - Infrastructure NumArticles Histogram .................................................................... 220
Figure 69 - Infrastructure NumArticles Box Plot ....................................................................... 220
Figure 70 - Infrastructure AvgTone Histogram ........................................................................ 222
Figure 71 - Infrastructure AvgTone Box Plot ........................................................................... 222

ix
LIST OF TABLES
Table 1 - Example of Military Data Transformed into Information and Knowledge .....................74
Table 2 - PMESII Sub-variables ................................................................................................90
Table 3 - Economic Variables ................................................................................................. 118
Table 4 - Political Variables ..................................................................................................... 125
Table 5 - Military Variables ...................................................................................................... 132
Table 6 - Social Variables ....................................................................................................... 138
Table 7 - Information Variable ................................................................................................. 146
Table 8 - Infrastructure Variable .............................................................................................. 152
Table 9 - Collective Operational Variable Ranking for post-Surge AHP ................................... 155
Table 10 - AHP Pair-Wise Comparison Scale ......................................................................... 156
Table 11 - Median AHP Weight Development Matrix............................................................... 156
Table 12 - AHP Weight Values for Operational Variables ........................................................ 157
Table 13 - Values of the Forman/Saaty Random Index (RI) .................................................... 158
Table 14 - Municipal Rankings for Post-Surge Stability Operations ......................................... 160
Table 15 - Median Average of Participants’ Rankings ............................................................. 196
Table 16 - Median Average of Participants’ Rankings in Rank Order ...................................... 196
Table 17 - Median Average of Participants’ Pairwise Comparisons ......................................... 196
Table 18 - Median Average of Participants’ Pairwise Comparisons (Fractional Format) .......... 197
Table 19 - Median Average of Participants’ Pairwise Comparisons (Rounded Format) ........... 197
Table 20 - Political NumArticles Summary Statistics ............................................................... 201
Table 21 - Political NumArticles Normality Test ....................................................................... 202
Table 22 - Political AvgTone Summary Statistics .................................................................... 203
Table 23 - Political AvgTone Normality Test ............................................................................ 204
Table 24 - Military NumArticle Summary Statistics .................................................................. 205
Table 25 - Military NumArticle Normality Test ......................................................................... 206
Table 26 - Military AvgTone Summary Statistics ..................................................................... 207
Table 27 - Military AvgTone Normality Test ............................................................................. 208
Table 28 - Economic NumArticles Summary Statistics ............................................................ 209
Table 29 - Economic NumArticles Normality Test ................................................................... 209
Table 30 - Economic AvgTone Summary Statistics ................................................................. 210
Table 31 - Economic AvgTone Normality Test ........................................................................ 210
Table 32 - Social NumArticle Summary Statistics .................................................................... 211
Table 33 - Social NumArticle Normality Test ........................................................................... 212
Table 34 - Social AvgTone Summary Statistics ....................................................................... 213
Table 35 - Social AvgTone Normality Test .............................................................................. 214
Table 36 - Information NumArticle Summary Statistics ............................................................ 215
Table 37 - Information NumArticle Normality Test ................................................................... 217
Table 38 - Information AvgTone Summary Statistics ............................................................... 217
Table 39 - Information AvgTone Normality Test ...................................................................... 219
Table 40 - Infrastructure NumArticles Summary Statistics ....................................................... 219
Table 41 - Infrastructure NumArticles Normality Test .............................................................. 221
Table 42 - Infrastructure AvgTone Summary Statistics ............................................................ 221
x
Table 43 - Infrastructure AvgTone Normality Test ................................................................... 223
Table 44 - Political NumArticles Resampled Statistics ............................................................. 224
Table 45 - Political AvgTone Resampled Statistics ................................................................. 225
Table 46 - Military NumArticles Resampled Statistics.............................................................. 226
Table 47 - Military AvgTone Resampled Statistics .................................................................. 227
Table 48 - Economic NumArticles Resampled Statistics ......................................................... 228
Table 49 - Economic AvgTone Resampled Statistics .............................................................. 229
Table 50 - Social NumArticles Resampled Statistics ............................................................... 230
Table 51 - Social AvgTone Resampled Statistics .................................................................... 231
Table 52 - Information NumArticles Resampled Statistics ....................................................... 232
Table 53 - Information AvgTone Resampled Statistics ............................................................ 233
Table 54 - Infrastructure NumArticles Resampled Statistics .................................................... 234
Table 55 - Infrastructure AvgTone Resampled Statistics ......................................................... 235

xi
ACRONYMS AND ABBREVIATIONS USED AD Armored Division ADRP Army Doctrine Reference Publication AHP Analytic hierarchy process AO Area of operations API application programming interface ARIES Army Reserve installation evaluation system ARU-DM Army Reserve unit decision model ASI Additional skill identifier ATP Army Techniques Publication BCa Bias-corrected accelerated C2C Command and Control C2C Concept-to-Code CA Civil Affairs CACOM Civil Affairs Command CAD Computer-aided drawing CAF Conflict assessment framework CAKMS Civil Affairs Knowledge Management System CAMEO Conflict and Mediation Event Observations CAO Civil Affairs operations CAPOC Civil Affairs and Psychological Operations Command (aka., USACAPOC) CARVER Criticality, accessibility, recuperability, vulnerability, effect, and recognizability CEMPS Configurable emergency management and planning simulator CI Consistency index CIFC Civil information fusion concept CIM Civil information management CISA Communication/interaction with the system and sensitivity analysis COA Course of action COO Combined obstacle overlay COP Common operational picture/common operating picture CR Consistency ratio DBMC Database management component DBMS Database management system DIME Diplomacy, Information, Military, and Economics (Elements of national power) DMC Dialog management component DoD Department of Defense DoS Department of State DOTMLPF Doctrine, organization, training, material, leadership and education,
personnel, and facilities. EDA Exploratory data analysis ESDA Exploratory spatial data analysis FAO Foreign Area Officer FM Field Manual FOB Forward Operating Base FOUO For official use only GDELT Global Database of Events, Language, and Tone GEOINT Geospatial intelligence GIS Geospatial Information Systems/Geographic Information Systems HA/DR Humanitarian Assistance and Disaster Relief HTS Human Terrain System IDC Information Dominance Center IED Improvised explosive device IKD Intelligence and Knowledge Development ILE Intermediate-Level Education
xii
IOCS Investment option comparison and selection IOE Investment option evaluation IPB Intelligence preparation of the battlefield IQR Interquartile range ISAF International Security Assistance Force IT Information technology JC Joint Command JCIDS Joint Capabilities Integration and Development System J-CIM Joint CIM JP Joint Publication KDE Kernel density estimation KM Knowledge management K–S Kolmogorov–Smirnov process LAN Local area network LISA Local indicators of spatial autocorrelation MACBETH Measuring attractiveness by categorical-based evaluation technique MAP-HT Mapping the Human Terrain MAUT Multi-attribute utility theory MCDA Multi-criteria decision analysis MCDM Multi-criteria decision-making MCOO Modified combined obstacle overlay MCPUIS Multi-criteria Planning of Urban Infrastructure Systems MDMP Military Decision-Making Process MMC Model management component MND Multi-National Division MNF Multi-National Force MOE Measure of effectiveness MOP Measure of performance MOS Military occupational specialty MPICE Measuring progress in conflict environments MPK Mission planning kit NCO Non-commissioned Officer NCOIC Non-commissioned Officer in Charge NGO Non-governmental organization NONO NOn-significant, NOt rejected NPS Naval Postgraduate School NSPD National Security Presidential Directive OE Operational environment OIF Operation Iraqi Freedom ORSA Operations research and systems analysis PCA Principal component analysis PKSOI Peacekeeping and Stability Operations Institute PME Professional Military Education PMESII Political, military, economic, social, information, and infrastructure
PMESII-PT Political, military, economic, social, information, and infrastructure – physical environment, time
POI Plan of instruction PRT Provincial Reconstruction Team PSYOP Psychological Operations RDBMS Relational database management system RI Random index SC Stakeholder component SDSS Spatial decision support systems SITREP Situation report SOIC Stability Operations Information Center SOP Standard Operating Procedure

xiii
SQL Structured query language SRDD Storage, retrieval, and display of data SSDCO Security, Stability and Development in Complex Operations SSTR Stability, Security, Transition, and Reconstruction (Operations) SWCS Special Warfare Center and School TCAPF Tactical conflict assessment and planning framework TRADOC Training and Doctrine Command TTP Tactics, Techniques and Procedures USACAPOC United States Army Civil Affairs and Psychological Operations Command USAFRICOM United States Africa Command USAID United States Agency for International Development USARC United States Army Reserve USASOC United State Army Special Operations Command USCENTCOM United States Central Command USPACOM United States Pacific Command USSOCOM United States Special Operations Command USSOUTHCOM United States Southern Command VUCA Volatile, uncertain, complex, and ambiguous (environments)

1
1. INTRODUCTION
In 2005, Stability Operations were designated as a core U.S. military mission with
priority comparable to Combat (Offensive and Defensive) Operations. National Security
Presidential Directive 44 (NSPD-44) forwarded U.S. security promotion through
coordination improvements, planning, and reconstruction and stabilization foreign aid
implementation. While the directive assigns the U.S. Department of State (DoS) as the
lead agency, the emphasis is given to the coordination of integrated activities and
efforts by multiple departments of the U.S. government to include the Department of
Defense (DoD).1 Stability can be described as “the measure of regional resistance to
political, economic, social and structural degradation or deterioration”.2 Stability
Operations are conducted by the U.S. Military to support and develop a host nation’s
government or to initiate governmental services in a non-governed area until the host
nation can do so itself. Inherent in Stability Operations is the provision of public goods.
Whether the military is the principal provider of public goods or simply needs to
understand the relative level of good provision within a given area, understanding how
public good allocation occurs is key for Stability Operations. This understanding is
known as situational awareness of the operational environment (OE), a significant issue
for any military commander and staff. The OE is defined as “…a composite of the
conditions, circumstances, and influences that affect the employment of capabilities and
bear on the decisions of the commander”.3 An integrated geographical representation of
key socio-economic factors within the OE is a requirement. This is known as the civil
common operational picture (Stability COP). For the U.S. Army, the Civil Affairs (CA)
branch is charged with helping to bring clarity on the civil OE through the use of Civil

2
Information Management (CIM); however, CIM is a component of CA that suffers from a
lack of analytical capability. That is what this research attempts to rectify.
The CIM implementation arm of a CA unit (CIM cells) supports maneuver
(combat) commanders at the tactical, operational, and theater strategic echelons. Their
mission is to collect data on the civilian aspects of the OE, collate and process the
various data sets, analyze and evaluate the combined data into a knowledge product,
and distribute both raw data and analyzed/evaluated civil information to military and
nonmilitary partners. Creating this integrated geographical representation is
problematic. The general characteristics of socio-economic data make it relatively
impractical for meaningful presentation and integration through most vector layers in a
geographic information system (GIS). Many of the inputs for a Stability COP are
recorded in a qualitative format, creating additional sets of analysis problems.
The purpose of this study is to develop a procedure for collating, processing,
analyzing, and evaluating qualitative and quantitative socio-economic data for the
creation of a Stability COP. This procedure involves combination of tools used in the
field of urban planning utilizing data synthesis and analysis. The study integrates the
techniques of context analysis, spatial statistical analysis, and spatial decision support
systems (SDSS) within a GIS platform. Since this research centers on the issues of
amalgamation, analysis, and use of information for Stability Operations, an examination
of the underlying problems with information when conducting socio-economic analysis
are discussed. Essentially, the theoretical foundations define the problems that are to
be mitigated by investigation of the research question. The research question is, ‘How
can urban spatial analysis techniques be used to implement an integrated Stability
3
COP?’ Because of the cross-disciplinary nature of the research question, the literature
review references documents ranging from military strategy text, manuals and articles
on Stability Operations and CIM, and journals/texts discussing content analysis, spatial
analysis, and SDSS. The methodology used is a development case study, outlining the
procedure and demonstrating its use. This type of research method is prevalent in
social science studies intended to produce a new curriculum, instructional method or
technique. Thus, the intended result of this study is a new CIM spatial analysis
methodology created by integrating existing social science techniques that mitigates the
current problems inherent in producing the Stability COP.
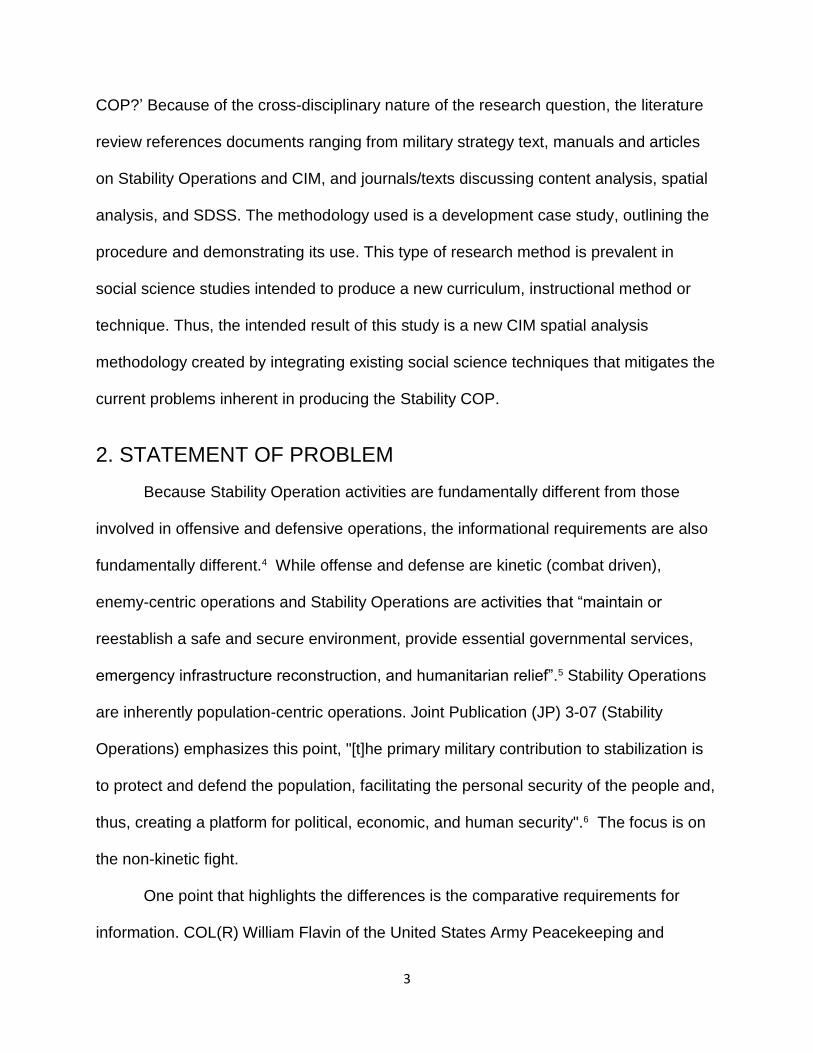
2. STATEMENT OF PROBLEM
Because Stability Operation activities are fundamentally different from those
involved in offensive and defensive operations, the informational requirements are also
fundamentally different.4 While offense and defense are kinetic (combat driven),
enemy-centric operations and Stability Operations are activities that “maintain or
reestablish a safe and secure environment, provide essential governmental services,
emergency infrastructure reconstruction, and humanitarian relief”.5 Stability Operations
are inherently population-centric operations. Joint Publication (JP) 3-07 (Stability
Operations) emphasizes this point, "[t]he primary military contribution to stabilization is
to protect and defend the population, facilitating the personal security of the people and,
thus, creating a platform for political, economic, and human security".6 The focus is on
the non-kinetic fight.
One point that highlights the differences is the comparative requirements for
information. COL(R) William Flavin of the United States Army Peacekeeping and

4
Stability Operations Institute (PKSOI) identifies the differences when addressing
Intelligence Preparation of the Battlefield (IPB). He notes that the emphasis and
foundations for a post-conflict IPB are different from those for warfare.7 Normally, the
IPB procedure creates enemy-focused products that include event templates and
matrices, a high-value target (HVT) list, and a modified combined obstacle overlay
(MCOO).8 Both products necessarily reflect the enemy-centric focus of the IPB
procedures. Flavin state that Stability Operations “IPBs” should address political,
economic, demographic, ethnic, religious, linguistic, psychological, and legal factors.
Nontraditional and open source information such as travel agencies international
organizations, commercial ventures, clergy, and nongovernmental organizations (NGO)
become the new engagement targets for the area.9 This split in information requirement
highlights the combat/stability difference.
The dichotomy between combat and stability information issues extends to the
operational assessments. Jonathon Schroden, research team leader with the Center for
Naval Analyses Strategic Studies, noted that during conventional conflicts, well-
established theories of war provide excellent identification of objectives and a
comprehension of how to pursue them. These theories also enable the development of
well demarcated progress metrics (terrain held, captured or killed enemy counts, or
enemy equipment and material destroyed totals). Yet, the theories are more complex,
the objectives and methods necessary to implement them are more complicated, and
success and victory are more elusive to define for unconventional conflicts. The result is
an environment where progress is more difficult to gauge and demonstrate.10 While any
exercise of the military instrument of power is a human endeavor subject to less

5
objective scrutiny than other actions, both Flavin and Schroden note that nonstandard
operations such as stability are exceedingly so. Stability Operations are dependent
upon the more complex theories associated with social science. Given this fact, stability
information processing and evaluation need an alternative method to the IPB.
Stability information development is different from combat IPBs and is difficult
due to the procedures that turn raw data into information, and information into
knowledge. Despite the three terms’ interchangeable usage, there is a hierarchy of
terms among data, information, and knowledge (Figure 1):
Data are individual facts, measurements, or observations, which may or may not be sufficient to make a particular decision. Information is obtained when elements of data are assembled, reconciled, fused [merged], and placed in an operational context. Knowledge is derived from being able to use information to construct and use an explanatory model based upon an understanding of the situation or phenomenon.11
Data-Information-Knowledge Transformation Diagram12
Figure 1
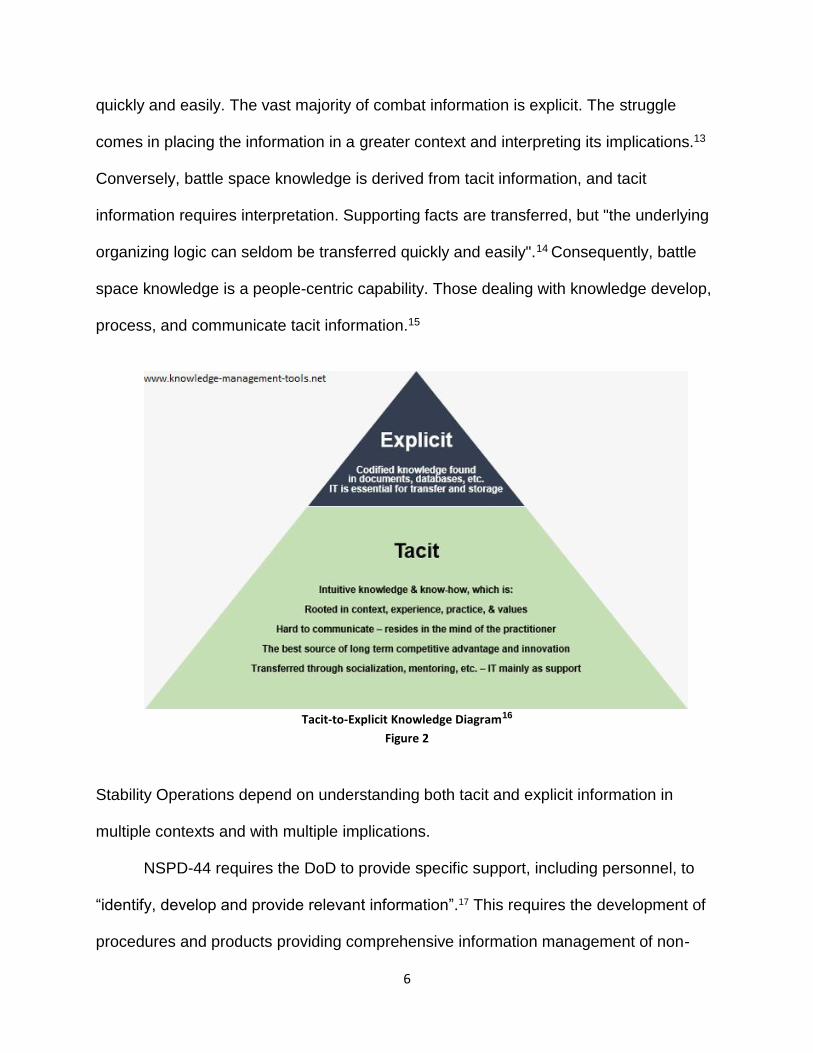
An additional differentiation of note occurs between the types of military information,
Explicit and Tacit (Figure 2). Explicit information (e.g., the position of forces, weather,
physical geography) needs minimal interpretation and can usually be communicated
6
quickly and easily. The vast majority of combat information is explicit. The struggle
comes in placing the information in a greater context and interpreting its implications.13
Conversely, battle space knowledge is derived from tacit information, and tacit
information requires interpretation. Supporting facts are transferred, but "the underlying
organizing logic can seldom be transferred quickly and easily".14 Consequently, battle
space knowledge is a people-centric capability. Those dealing with knowledge develop,
process, and communicate tacit information.15
Tacit-to-Explicit Knowledge Diagram16
Figure 2
Stability Operations depend on understanding both tacit and explicit information in
multiple contexts and with multiple implications.
NSPD-44 requires the DoD to provide specific support, including personnel, to
“identify, develop and provide relevant information”.17 This requires the development of
procedures and products providing comprehensive information management of non-

7
combatant populace issues. CIM is a procedure designed to address the information
needs of a maneuver command concerning the inhabitants of a specified area. Each
branch of the military is developing some level of CIM capability. For the U. S. Army,
CIM is defined as:
[The process] whereby data relating to the civil component of the operational environment is collected, collated, processed, analyzed [and evaluated], produced into information products, and disseminated.18
This collection – collation – processing – analysis and evaluation – production –
dissemination methodology of civil information (Figure 3) is still in a nascent stage of
development from the collation, processing and analysis/evaluation perspectives.
Collation is the compilation of collected civil data based upon factors within the OE and
the operations development.19 It consists of compiling all collected civil data into one
location, regardless of military source; it is the uniting of multiple sources of data from
every level of operation. Processing is the physical and cognitive manipulation of
separate pieces of data into information. It involves taking collated data and grouping it
into cataloged categories.20 This often requires the construct or use of an analysis
framework or heuristic. Together, collation and process can be expressed as either
“fusing” or “merging”. Analysis and evaluation refers to the transformation of managed
data into useful information and knowledge for the supported commander’s decision
making process.21 Civil information analysis products include layered spatial information
(GIS shapefiles), inputs for the Stability COP, CA Operations (CAO) estimate, maps,
CAO running estimates, social network linkage diagrams, and other reports.22 Yet,
difficulties in developing methods for processing and analysis/evaluation severely limits
the capability of CIM cells to produce the desired products. As a former Director of the

8
Defense Intelligence Agency stated, the failure in developing functional CIM results in
“senior leaders not getting the right information to make decisions”.23,24 The COP and
assessments are derived from the processing and analysis/evaluation steps of CIM and
thus suffer from those steps' lack of development which are discussed. Of the many
products that CIM contributes toward, the most important are the COP and
assessments. These provide the foundation for the other products which are discussed
below.
Civil Information Management Flow Diagram25
Figure 3
The COP is "a single identical display of relevant information shared by more
than one command ... [It] facilitates collaborative planning and assists all echelons to
achieve situational awareness".26 Alternatively stated, it is the commander’s shared,
graphically-integrated display of relevant information.27 While information is critical to
each commander's decision making ability, the term “Common Operational Picture” is
somewhat misleading. What is “common” is not the graphic but the underlying data.28 A
COP at any point in time is a stylized version of the entire OE, capable of presenting

9
more than one view that represents a subset of the total information.29 The MCOO
spatially portrays how mobility is affected by restricting obstacles, key geography,
engagement areas and defensible terrain.30 It begins with the layering of various
depictions of the physical terrain, both natural and man-made. This is the “Combined
Obstacle Overlay” or CCO (Figure 4).
Initial MCOO Layers31
Figure 4
Then, areas of the OE where the geography principally favors one course of action
(COA) as compared to others are identified and depicted spatially. The most effective
spatial technique is to add the identified restricted and severely restricted areas to the
CCO. From this military planners can develop and graphically depict critical items for
Combat Operations to include avenues of approach, mobility corridors, counter-mobility
obstacles, engagement areas, defensible terrain, and key terrain (Figure 5).32

10
Final MCOO Example33
Figure 5
This enemy-centric view of the OE is but one aspect and can be highly differentiated
from a view focused on securing and influencing a given population.34 The other key
component of COP, “picture”, is misinterpreted to mean that any portrayal of the COP
(e.g., the slides shown in an Operations Center) is the COP in its entirety. While these
pictures are COP outputs, they are not the entire COP. The entire COP is the
combination of data, information and knowledge that is resident in the entire
organization.35 What is key to COP development is that information is aggregated and
presented in a specific way to support decision making; it ensures that there is
functional reliability among the different views.36 The MCOO provides a method of

11
merging the combat operations information in a straightforward application of layering
the various physical variables and identifying the space that allows freedom of
movement. Stability Operations currently lack a comparable method for conducting the
contextual aggregation function.
Assessments are the other key product of CIM. JP 3-0 (Joint Operation) defines
assessments as "[the procedure] that evaluates changes in the environment and
measures progress of the joint force toward mission accomplishment".37 Commanders
at all levels continuously assess the OE and the progress of operations, comparing the
current situation with an initial understanding, and adjusting operations based on this
further analysis. Staff sections assist the commander through identifying and monitoring
key indicators influencing operations, providing the commander information needed for
decisions in a timely manner. The non-exclusive list of theoretical purposes and utilities
of assessment include commanders’ decision making information provision (e.g.,
resource allocation), design cycle (plans) completion, OE condition change recognition,
innovation and adaptation stimulation, operational uncertainty and risk reduction,
actions to objective achievement causal linkage discovery, and subordinate unit
performance evaluation.38 Assessment tasks are different from the continuous
situational monitoring of operational progress. They focus on the evaluation of mission,
objective, and end state attainment.39 Effective assessment entails evaluation criteria
reflecting the degree of realization toward mission accomplishment. These are
expressed as either measures of effectiveness (MOEs) or as measures of performance
(MOPs).40 MOEs "assess changes in system behavior, capability, or OE that [are] tied to
measuring the attainment of an end state, an objective, or the creation of an effect".41

12
They are normally characterized by the question, “are we doing the right things (to
achieve a desired end state)?” MOPs, or measures of performance, "assess friendly
actions that are tied to measuring task accomplishment".42 MOPs are normally
characterized by the question, “are we doing things right (correctly)?” Generally, MOP
aspects of operations are quantifiable, but not always easy to assess. Assessing the
physical aspects of an operation is straightforward. Yet, the dynamic interface among
friendly forces, adjustable adversaries, and malleable populations generally make
assessing the MOE aspects even more difficult.43 One source of difficulty is that none of
the U.S. military manuals address how to conduct effective assessments. Publications
JP 3-0 and JP 5-0 are notably vague regarding assessment.44 The old U.S. Army Field
Manual (FM) 5-0, The Operations Process, provided more detail on how to conduct
assessments with much of its guidance coming from a practitioner’s viewpoint. But the
guidance also contains contradictory instructions that detract from its overall utility.45 Its
replacement, Army Doctrine Reference Publication (ADRP) 5-0, The Operations
Process, minimally attempts to clarify the contradictions in FM 5-0. The
Counterinsurgency Manual, FM 3-24, provides a useful set of example indicators but
fails to discuss how to develop an assessment framework/product, and how to collect,
analyze, and evaluate data.46 A second source of difficulty is derived from a lack of
adequate training. Schroden identified two categories of service members tasked to
implement operational assessments: staff officers who, irrespective of their skill sets,
are placed in assessments billets, and operations research and systems analysis
(ORSA) support officers.47 The former often do not have the technical skill set to use the
computer software tools required for assessment; the latter may have the software

13
technical skills but lack the social science training required to accurately conduct
assessment in a Stability Operations environment.
Fusing (collating/processing) and analyzing/evaluating necessary data into
information and knowledge for stability purposes is more difficult because it is based
upon social variables. Stability Operations function increasingly within volatile,
uncertain, complex, and ambiguous (VUCA)48 environments, characterized by a set of
non-linear and interconnected variables. This environment is made of a system of
interacting organizations, agencies, and governments in which complete knowledge
about the factors governing strategy decisions is virtually impossible to obtain.
Decisions must be made with incomplete understanding and all the associated risk
incomplete understanding brings.49 Spatial fusing complications arise due to these
VUCA variables. Location of an entity must now share importance with other attributes.
For instance, in Operation Iraqi Freedom, a tribe’s Islamic school of thought and its
relationship with U.S. forces, the insurgents, and other adjacent tribes were just as
important as the tribe’s location on a map. Evaluation of these variables not only
requires identifying MOP and MOE, but also by examining how various factors interact.
The elements of social stability interact with one another. Stability Operations need a
methodology that accurately reflects “how well these elements are performed and the
manner in which they interact, and the commitment of key members of that society to
maintain or promote a standard acceptable to the populace”.50 Thus, the root problem is
in development of a CIM methodology that effectively integrates the various stability
factors. To resolve this deficiency, CA planners must understand why these political,

14
economic, and social inputs are difficult to identify and integrate, especially in a spatial
context.
3. THEORETICAL FOUNDATIONS AND RESULTING
INFORMATION PROBLEMS
Urban planning is an applied social science with theoretical underpinnings
applicable to stability informational difficulties. Specifically, there are three key
theoretical ideas common to urban planning and Stability Operations.51 The combination
of the three theories creates a convergence between planning and stability, allowing the
use of various planning analytical tools toward Stability Operations. Specific to this
study, these theoretical frameworks indicate the possibility of urban planning methods’
applicability to use in CIM analysis during Stability Operations.
The first theoretical foundation, Wicked Problems, argues that a "scientific" basis
for social policy formation is problematic due to the nature of social issues.52 Yet it is
often not best suited for socially structured policy analysis. Policy planning problems are
“ill-defined” and highly dependent on political choice for determination (not problem
solution).53 Wicked Problems authors Rittel and Webber listed a minimum of ten
distinguishing properties of planning-type problems (those requiring identifying and
choosing amongst a selection of policy options - hence wicked). They are:
• There is no definitive formulation of a wicked problem
• Wicked problems have no stopping rule
• Solutions to wicked problems are not true-or-false, but good-or-bad
• There is no immediate and no ultimate test of a solution to a wicked problem
• Every solution to a wicked problem is a “one-shot operation”; because there is no opportunity to learn by trial-and-error, every attempt counts significantly

15
• Wicked problems do not have an enumerable set of potential solutions, nor is there a well-described set of permissible operations that may be incorporated into the plan
• Every wicked problem is essentially unique
• Every wicked problem can be considered to be a symptom of another problem
• The existence of a wicked problem can be explained in numerous ways. The choice of explanation determines the nature of the problem’s resolution
• The strategist/planner has no right to be wrong.54
Yet, these ten properties do not operate independently. The interactive
complexity of Wicked Problems makes social issues problematic.55 Once mainly
applicable to the Western world, the overarching point of wicked problems theory is
increasing applicable to developing countries and ungoverned spaces; the plurality of
populace (if not governance) has become the trend instead of the exception. Yet in a
plurality, entities pursuing politically diverse goals make policy development and choice
extremely difficult.56 There is no theory that identifies what is thought to be societally
best state; no theory that states what distribution of the social product is best; or what is
not universally perceived as objective and non-partisan.57 It is the social context in
which the analysis is conducted that makes these conditions truly wicked. This
theoretical framework serves as the contextual setting in which Stability Operations and
the civil-COP are conducted. It is also he reason why the Stability COP are encumbered
with VUCA characteristics.
The second foundation is the economic theory of club goods - a variation of
public goods - those normally provided by the government due to the market's inability
to do so. Club goods are public goods that become excludable but not rival.58
Excludability is the capability of preventing people from using a good while rivalry is the
diminishment of one person's goods consumption due to another person's consumption
16
of them. Excludability is normally done through a pricing mechanism.59 However, other
societal factors can cause exclusion from a good or service. The club goods theoretical
framework serves as the operational setting in which Stability COPs are conducted. It is
the reason why Stability COPs are encumbered with VUCA characteristics creating the
difficulties implementing support to a host nation’s government or initiating
governmental services in a non-governed area.
The final foundation - information asymmetry - is also an economic theory. It is
defined as unequal knowledge possessed by the parties involved in a transaction.60
This situation causes difficulty in distinguishing trustworthy transaction participants. This
subsequently results in the inefficient use of scarce resources and requires government
intervention.61 A specific form of information asymmetry, adverse selection, arises from
buyers having inadequate information about sellers’ products.62 This theory can be
extended beyond the buyer-seller dynamic. In the case of goods provision, the dynamic
is between distributor and recipient. Information asymmetry/adverse selection problems
from inadequate distributor information about recipients can result in persons or
selected populations being excluded from vital goods and services. In this case the
distributor is the “buyer” of inadequate information of who needs the goods. The
information asymmetry theoretical framework serves as the knowledge setting in which
Stability Operations are conducted. It is the reason why the Stability COP are
encumbered with VUCA characteristics when attempting to understand “what is needed
where” in an operational area.
The intersection of the three theories creates a triad applicable to both urban
planning and Stability Operations’ information and knowledge difficulties. Examine first

17
the intersection of club goods and information asymmetry. As stated, club goods are
based upon excludability and non-rivalry. These "clubs" are based upon two basic
premises: club membership sizes are restricted, and both goods provision and club
membership size are interdependent.63 Excludability is based on information within the
distributor-recipient transaction, where the distributor suffers from adverse selection.
Information asymmetry can present itself through various characteristics. A
characteristic is the limitation of the human mind ability to collate, process, analyze, and
evaluate large amounts of information. Another is the improper processing of
information due to bureaucratic dysfunction. And yet another is the withholding
information or the presentation of disinformation by an elite group operating from
perceived privilege or political inequality.64 The resulting information deficit creates the
potential for one recipient’s denial of goods and services and another recipient’s gain of
an inordinate portion of the same.65 Merging this informational asymmetric induced club
goods model into a situation in which solutions are not achieved through either resource
optimization or process efficiency causes a scenario that is difficult to visualize and
comprehend, and harder still to take action to remedy (i.e., wicked).
Urban planning fits the theory triad of wicked problems, public (club) goods
provision, and information asymmetry. Methodologies from multiple paradigms justify
urban planning’s usefulness. Economics identify the requirement for governmental
action to correct market failures. There are multiple resulting implications. First,
governments must develop urban [spatial] information systems. Second, governments
must develop methods of analyzing population migration, economic growth, and land
use. Third, governments must provide for public goods and compensate for inequities in

18
the distribution of basic social goods and services.66 While economic paradigms justify
government planning, they are not sufficient reasons for taking action. Public policy
formation theories present that government action is also guided by the political
bargaining process.67 Pluralists models provide for the interaction between formal and
informal groups pursuing a divergent range of goals where government's role is limited
to the establishment and enforcement of the rules of the game, which ratifies the
political modifications produced by the various groups. Yet pluralism is limited due to the
political arena's domination by entities using governmental access for status, wealth,
and privilege. Attainment of such status, wealth, and privilege indicates the possibility, if
not the probability, of information asymmetry capabilities of these power gaining entities.
These observations on the ability to conduct information asymmetry correspond to
political aspects of Wicked Problems theory. The justifications of community interest
promotion, decisional information improvement, and analysis of distributional actions
effects segues and combines with Wicked Problems to meet the theory triad.
The characteristics of Stability Operations also meet the established theory triad.
First, aspects of Stability Operations can be viewed as public good provision. JP 3-07’s
Stability Operations definition lists a number of public good missions, for example: "to
maintain or reestablish a safe and secure environment, provide essential governmental
services, emergency infrastructure reconstruction, and humanitarian relief".68 The
context of goods provision is what is important. Because conflict and war impede daily
life functions, providing fundamental public goods and services are urgent tasks
confronting Stability Operations.69 Such conditions lead to the establishment of a club
goods condition because societies differ on what is considered a public sector service

19
provision obligation and what is an individual, family, tribe/clan, or other social grouping
obligation. The group that controls the assignment of responsibility controls choices
about public services delivery and the provision of basic services. Generally,
governments existing in fragile and post-conflict situations are usually centralized in
form and are more susceptible to elite group capture. The dominant group or coalition
controling the center also controls access to services universally. Central systems suffer
from a ‘one size fits all’ mentality, capital city biases which that services to outlying
areas, and depreciated responsiveness to local demands.70 This situation is similar to
the plurality problem in urban planning.
Second, the situation discussed above presents the potential for information
asymmetries by those in power. Remembering that Stability (in this context) is a military
operation, military strategist Clausewitz’s ‘fog of war’ theory (the initial unreliability of
any information) still applies.71 Yet, in contrast to Combat Operations where information
may become enlarged and distorted, Stability Operations’ information issues are more
likely to be hidden or misunderstood due to a lack of understanding them in a local area
and cultural context. Groups gaining power under such conditions tend to increase
control of information through the ‘mobilization of bias’. This is a devised constraint over
human interaction (either formal or informal rules of the game) that empowers some
groups and disenfranchises others. Groups in such conditions also gain power through
latent conflict (the denial of attention to potential issues often realized by averting
observable conflict).72 Both mobilization bias and latent conflict are rooted in the
exercise of information asymmetry, and that power can be extended to cover the
distribution of public goods.

20
Finally, Stability Operations are inherently wicked problems. Military strategists
Greenwood and Hammes in 2009 systematically and successfully applied the ten
characteristics of wicked problems to Stability Operations at the theater strategic, and
operational level of military planning. Specifically, these operations require a host of civil
society and public administration experts in order to adequately conduct planning.73
These experts provide assistance on the issues of social science required for situational
understanding during Stability Operations.
Urban planning and Stability Operations are united by a triad of theoretical
foundations. Public goods provision equates planning and stability as the underlying
purpose for both. Information asymmetry impacts both urban planning and Stability
Operations, creating adverse selection exclusion conditions upon the provision and
distribution of public goods. The similarity of urban planning and Stability Operations as
‘wicked problems’ are based upon socio-economic and political factors causing problem
‘resolution’ rather than ‘optimal solutions’.74 In other words, it is easier to temporarily fix
a symptom through optimization or efficiency than find and solve the root problem.
These difficulties are compounded due to the expectation that information should be
presented spatially (i.e., on a map through either – paper or computer graphics). Given
the nascent stage of development of the CIM process and analysis portions and the
triad of theoretical foundations similar to both urban planning and Stability Operations, it
is worth examining the applicability of urban planning analysis methods to Stability
Operations analysis within CIM.
21
4. RESEARCH QUESTION
Because Stability Operation informational problems are similar to those found in
urban planning, it is reasonable to assume that a potential solution can be found in the
analysis methods of applied social sciences such as urban planning. The initial
research question was ‘How can urban planning analysis techniques be used to
implement an integrated Stability COP?’ Because of the multiple issues involved with
an integrated Stability COP development, a multi-component approach is needed. This
study uses Spatial Decision Support Systems (SDSS) as that multi-component
approach that creates an integrated Stability COP. While SDSS has multiple definitions,
a capabilities oriented characterization defines SDSS as an “integrated environment
which utilize[s]… both spatial and non-spatial models, decision support tools, …
statistical packages … and enhanced graphics to offer the decision makers a new
paradigm for analysis and problem solving”.75 An effects oriented characterization
defines it as “an interactive, computer-based system designed to support a user or
group of users in achieving a higher effectiveness of decision making while solving a
semi-structured spatial decision problem”.76 In summary, SDSS has provided a
methodology to address ill-structured and ill-defined spatial problems in an interactive
and iterative procedure.77 Generally, SDSS has been used for urban planning related
purposes ranging from land use planning and impact analysis, housing accessibility
analysis, nature habitat site improvement and woodland regeneration, potential city
development, and watershed management.78 Since SDSS' definitions and
characteristics address the major current weaknesses of CIM analysis, it is useful to
examine the components of SDSS.

22
Thus, the revision needed for procedure development in CIM’s collation –
processing – analysis components leads to three questions on establishing spatial
analysis for Stability Operations:
• How can SDSS integrate qualitative political and socioeconomic factors into a singular visualization of the Stability Operational Environment (OE)?
• How can SDSS help provide a holistically spatial approach and systematic analysis adaptable to multiple situations and socioeconomic settings?
• How does SDSS facilitate cooperative planning and support all echelons in achieving situational awareness and decision making?
In summary, the research question is “ ‘How can a SDSS elevate the problems of
spatially fusing and analyzing/evaluating necessary socially based data for stability
analysis’.”
4.1 Research Method Overview
This study presents a case study using a mixed-methods approach. Case studies
involve in-depth explorations of a specific program, event, or process bounded by time
and/or location.79 The case study method proves useful in distinguishing the
effectiveness of the proposed SDSS analysis technique. The specific case presented is
the development of the Stability COP just after the Iraqi War ‘Surge’. The Surge is the
military operation intended to help the Iraqi Government to secure neighborhoods,
protect the local population, and provide security within the Baghdad and Al Anbar
provinces through the use of an increased American presence. The case study
examines how the Stability COP for this period was developed and used to determine
where a Operation Iraqi Freedom (OIF) post-Surge Stability Operations main effort was
located in comparison to the results developed by the SDSS approach.

23
This mixed-method follows a sequential exploratory strategy whereby the
collection and analysis of qualitative data leads the process and analysis of quantitative
data. This strategy is useful for developing and testing a new instrument. It allows the
development of analysis instruments by using a small group to create the instrument
and then assembling quantitative data based on the instrument.80 The qualitative portion
is the Delphi technique. Developed at the Rand Corporation by Dalkey and Helmer in
the 1950s, this is a method widely utilized and acknowledged for attaining opinion
convergence regarding real-world knowledge from experts concerning specific topic
areas.81 During the interaction sequences, participants identities are unknown to each
other. The questionnaires are conducted in an anonymous means in order to mitigate
identifying a specific opinion to a specific person, so that ideas can be considered on its
merits, regardless of the professional or social status of opinion originator by the other
members of the group. U.S. Army Civil Affairs commanders of field grade rank
(Lieutenant Colonel and Colonel) during or just post the Surge were selected to
participate in the Delphi survey. They are identified as experts on the subjects of
Stability Operations, Stability COP, and the situational conditions due to their service in
the Civil Affairs branch in general and their presence in the Iraqi OE during the time
when the decision of the post-Surge main effort location place was made.
The quantitative portion is the SDSS. As discussed above, SDSS is a multi-
component approach used to address ill-structured and ill-defined spatial problems in
an interactive manner. Component identification varies throughout the SDSS literature.
The component list used for this study is from Sugumaran and DeGroote’s 2011 text,
which is essentially an amalgam of literature reviews. Four components are identified as

24
core to SDSS. They consist of a database management component (DBMC), a dialog
management component (DMC), a model management component (MMC), and a
stakeholder component (SC).82 While the emphasis of this study is the MMC
component, an explanation of how these components function is needed for SDSS’
application for Stability COPs.
4.2 Delphi
The experts were surveyed using the Delphi technique. This method is very
helpful in certain applications because of its general characteristics, such as anonymity
and iteration with feedback. The Delphi technique is a procedure whereby experts'
opinions are polled regarding a given subject. It differs from other surveys in that it is
repeated two or more times. The responses given by the participants on the first polling
are evaluated and reported back to the participants to get their reactions to the
differences between their individual answers and the 'median' response of the entire
group. The results are used as weights to apply to scores within each criterion for the
decision methodology.
As stated, members of the group were selected to participate in the Delphi
survey based on their deployment in the Iraqi War during and just after the Surge. They
were identified as experts due to their leadership position as U.S. Army Civil Affairs
commanders during that time. Serving in these positions, those selected have in-depth
knowledge of the OE and the COP. As stated earlier, the OE is a composite analysis of
various conditions, circumstances, and influences affecting the employment of
capabilities bearing on the commanders’ decisions. The geographical representation of
the OE is known as a COP and is difficult to achieve during Stability Operations due to

25
general characteristics of socio-economic data not being readily practical for meaningful
graphical presentation. Both the OE and resulting COP presentation can and should aid
in the analysis of where Stability Operations should be conducted.
The first round of questions are open-ended ones designed to establish why and
how the main effort location was selected. The post-Surge Stability Operations theater
main effort was located in the city of Mosul, Nineveh province (northern Iraq), with
actions taking place approximately September-October 2008. This provides a historical
situational awareness from which a comparative case study is conducted. The
questions are meant to describe the procedure(s) used to identify and describe the
post-Surge composite civil OE and how this OE was used in the designation of the main
effort area.
The second round of questions gatherers input toward the establishment of an
analytic approach for a solution to the problem of where the main effort for post-Surge
Stability Operations should be designated (i.e. which Iraqi province). This involves the
ranking of criteria. The Delphi participants were a proxy for the military staff within
MDMP. Each Delphi panel participant was asked to rank-order the eight interrelated
operational variables U.S. military planners use to analyze and evaluate an OE:
political, military, economic, social, information, and infrastructure (PMESII).83 They
were transformed into an analysis framework (heuristic) and served as the criterion for
operational analysis. The full acronym is PMESII-PT with the PT standing for ‘Physical
Environment’ (terrain) and ‘Time’ respectively. Neither time nor terrain are operational
variables themselves, but are characteristics affecting the variables.84 The action of
mapping the PMESII variables places assigns the PT characteristics. The PMESII

26
criteria were selected due to its pervasive use by the American military for analyze and
evaluation aspects of the OE describing, not only the military aspects, but also the
population’s influence on it. The populace’s influence is a central factor in the
effectiveness of Stability Operations. The collective ranking is established using the
median of the individual ranks.
The third round of questions finalizes the establishment of an analytic approach.
This was a continuation of the analytic approach solution to where the main effort for
post- Surge Stability Operations should be designated (i.e., in which Iraqi province).
This involved the construction of a set of pairwise comparison matrices. Each of the
PMESII operational criterion, in the established rank order, are compared to the PMESII
criteria in the level directly beneath it with respect to its rank. These pairwise
comparisons result in weights for application to each PMESII value within each Iraqi
province. The median of each individual pairwise comparison was calculated in order to
establish the collective matrix. The combination rank and pairwise comparison values
are used to develop weights for the evaluation process.
4.3 Spatial Decision Support Systems (SDSS) Fundamentals
As stated above, there are four components to a SDSS: a database
management component (DBMC), a dialog management component (DMC), a model
management component (MMC), and a stakeholder component (SC). GIS is the base
software; it functions both as the first two components, DBMC and DMC.85 GIS can
generally be defined as a software package "designed to store, manipulate, analyze,
and output map-based, or spatial, information".86 Described as the marriage between a
relational database and computer-aided drawing (CAD) and often only thought of as a
27
map making device, GIS’ true power is its ability to jointly manage spatial and non-
spatial data. The DBMC portion of the definition refers to relational databases with the
ability to join or relate information by both attribute and spatial means. Attribute data
describes quantitative and/or qualitative characteristics of the spatial data.87 Spatial data
digitally represents the physical world and is categorized by two data types, which are
discussed below.
The first, vector data, divides the real world into clearly defined features by
geometry based on point, lines or polygons.88 Points are the simplest vector feature with
spatial representations of longitude, latitude, and possibly elevation (x, y, and z
coordinates). Lines are one dimensional features vector data defined by x and y
coordinates only. Polygons are two-dimensional features defined by a series of points
and line segments with the start and end coordinates being identical.89 Because these
polygons attempt to match physical terrain, they are often non-uniform-irregular in
shape and size. Vector data are suited to analysis requiring connectivity of topological
characteristics including proximity, overlay, network, and geocoding.90 Physical issues
concerning distance, shared space, routing or traffic flow, and location placement are
best served by this form of spatial analysis.
The second data type is raster data. Rasters are two-dimensional grids with
regular (equally-sized) individual cells; each grid cell contains a single characteristic
representing a real world phenomena.91 Natural phenomena that vary continuously
across space (elevation, climate, etc.) and social phenomena of either discrete or
continuous measure are better represented using raster data.92 These structures can be
layered and analyzed jointly per each cell . This is of great potential importance for CIM

28
analysis. Raster structures facilitate models concentrating on the information within
each gridded structure. In general, values for social, economic, political, and cultural
Stability Operations data enable raster map algebra functions to develop an integrated
and holistic CIM analysis.
The DMC portion of GIS refers to the development of effective user interface
whereby the data are entered into the system and information is readily retrieved.93
While early GIS systems were operated primarily by command-line programing, most of
today’s systems can be operated via graphical user interface (GUI), allowing for a more
intuitive usage approach.
The third SDSS component (and the core component of this research) is model
management component (MMC). Consider this as the ‘decision support system’ (DSS)
part of the SDSS acronym. MMC helps in the management, execution and integration of
various data sets and models.94 There is a multitude of modeling techniques available
for use as a MMC. One set of techniques is known as spatial analysis. It is generally
defined as “the process of examining the locations, attributes, and relationships of
features in spatial data through overlay and other analytical techniques in order to
address a question or gain useful knowledge … [it] extracts or creates new information
from spatial data”.95 An initial form of spatial analysis is the layering of vector data to find
areas of intersection. This technique of simple map overlay in GIS is a version of ‘sieve
mapping’ used to identify land use suitability by land use planners.96 Basically, overlays
depicting a single analysis criterion are created with areas deemed unsatisfactory (or
satisfactory depending on the analysis) in each criterion darkened. The overlays are
then placed over one another. Area disqualification is based upon multiple

29
unsatisfactory criteria rankings. Those areas remaining are deemed susceptible to the
desired aspects of all criteria.97 Championed by Ian McHarg, the developer of how to
breakdown a region into its appropriate uses for habitation, this form of spatial analysis
was used to conduct a land use identification process based on community social
values.98 The U.S. Army currently uses a stylized version of this technique when
conducting the discussed MCOO. Note that this is an extremely basic form of modeling
and often fails to capture the intricacies of human interaction. Yet, it often provides a
good initial reference point for further inquiry.
More advanced spatial analysis methods include a collection of techniques called
exploratory spatial data analysis (ESDA). These techniques are used for spatial
distribution description and visualization; identification of atypical locations or spatial
outliers; and spatial association pattern identification (clusters or hot-spots). ESDA is a
subset of exploratory data analysis (EDA) methods originally developed by John Tukey
(1977) that focus on the distinguishing underlying characteristics of data.99 Central to
ESDA is the determination of a variable values’ interdependence pattern over space.
This identification of geographic clustering is measured by spatial autocorrelation.100
Initially this is done using the Moran’s I global index.101 The purpose is to identify
existence of the same pattern or process occurring over an entire geographic area. The
‘Global Moran’s’ measures the correlation of a variable with itself through space.102 As
with other statistical tests, a null hypothesis is established for the purpose of falsification
or disproving. The null hypothesis in this case is that there is no (or zero)
autocorrelation of the variable values. Mathematically, the z-score for the expected
value of a random Moran’s I [E(I) = -1/(n-1)] is less than zero.103 Because ArcGIS’

30
Global Moran’s algorithm assumes a normally distributed dataset, analysis of this
dataset is conducted using GeoDa. The procedure in GeoDa utilizes a Monte Carlo
simulation process. Just as Bootstrapping enables accuracy assessment measures
(e.g. variance, confidence intervals) for an unknown non-spatial population size through
random sampling with replacement, Monte Carlo simulations conduct multiple random
samples to obtain the distribution on populations (non-spatial and spatial) that are
neither random nor normal.104 Using the Moran’s scatterplot developed by Anselin, the
spatial agglomerations are identified as either zero (the null hypothesis), positive
(similar high or low values spatial clustered together), or negative (dissimilar values in
close location).105 It classifies the autocorrelation as either spatial agglomerations or
spatial outliers. Using a quadrant diagram, the different types of spatial autocorrelation
are classified by location within the quadrant.106 As stated above, the Global Moran’s
index provides a comprehensive examination of spatial autocorrelation within a
geographic population. Spatial identification of where significant activities are needed to
fulfill CIM’s geographic display requirements. A LISA (Local Indicators of Spatial
Autocorrelation) measure provides both information on the statistical significance of
cases within the spatial agglomerations/spatial outliers and identifies non-statistically
significant cases. Simply put, local high values can exist by virtue of being greater than
others in their adjacent area and yet not be globally large. This ‘Local Moran’s index’ (Ii)
tests the statistical significance of I and Ii against an absence of spatial autocorrelation
(i.e. a spatially randomly distributed variable) null hypothesis (H0). The H0 is rejected
under the NONO principle (NOn-significant, NOt rejected).107 LISA provides a capability
31
to examine individual entities against the whole to develop a more nuanced picture of
the OE.
A third spatial analysis technique is Boolean overlay. While sieve mapping is
considered a basic form of Boolean analysis (binary or yes/no comparison), vector layer
sets are limited to sieve mapping analysis. Advanced Boolean analysis uses raster layer
sets and either mathematical or logical operations conducted between raster cells using
a process known as raster algebra or map algebra. Conducting raster algebra on two or
more data set layers is a useful analysis tool. The separate layers represent real-world
phenomenon or human constructs. Boolean combinations create a new dataset having
its own distinct meaning. Such analysis is common for urban and regional planners,
transportation planners, and municipal engineers when conducting land suitability
analysis. By setting multiple criteria and using separate land use and property parcel
data, a planning analyst can identify specific parcels that fit criteria defined through the
use of multiple Boolean operators.108 These Boolean operators (AND, OR, & NOT) allow
the combination of attributes (database fields/columns) across multiple
datasets/databases for individual observations. Similar to Boolean operations within
raster data, raster algebra is the mathematical cell-by-cell calculations of numeric
values within the raster data.109 The concept is based upon stored values in raster grids
that allows function application to a single layer or multiple layers.
Another family of models for MMC use is called multi-criteria decision analysis
(MCDA – also known as multi-criteria decision making or MCDM). These models are
systematic approaches ln support of multiple alternative analysis during complex
problems concerning multiple criteria (also making use of raster data mathematical

32
capabilities). There are three major approaches of MCDA models, Full Aggregation,
Outranking and Goal Programming (Aspiration/Reference Level).110 Full Aggregation
deals with development of a score of each selected judgment criterion and then
synthesizing these into a global score for each alternative. Constructed as a tree-like
criteria and alternatives hierarchy, the alternatives are evaluated with respect to each
criterion and each criterion is weighted according to a collective stakeholders’ or
decision makers’ importance assessment.111 The scoring system allows the ranking of
alternatives from best to worst to include equal ranking of alternatives. The most
prevalently known Full Aggregation model is Analytic Hierarchy Process (AHP). The
Outranking approach deals solely on the degree that one alternative is preferred to
another.112 A pairwise comparison is conducted on one alternative’s set of criteria to
another alternative’s set of criteria. Each alternative’s criteria set can differ. This method
makes it possible for incomparability between alternatives due to a differentiation in the
profiles. Thus, a complete ranking is not always possible.113 The Goal Programming
approach selects a target for each criterion, then identifies the alternative most closely
reaching the target level. It is essentially based upon linear programing and, while the
target may be selected subjectively, the actual criteria inputs cannot be subjective.114
One of the more sophisticated MCDA models are those using Fuzzy Logic. It
involves the incorporation of data uncertainty due to situational vagueness rather than
due to randomness alone. Unlike Boolean operations where the choice of an
operation’s use on data are binary, Fuzzy Logic uses a range of operations used on a
conditional basis,115 The logic is essentially based upon an intricate set of ‘if-then’
conditions applied to select the appropriate operation across a range of operations

33
instead of depending on binary choices. This is analogous to a ‘nested if-then’ construct
found in Microsoft Excel formula usage. For the purposes of spatial analysis, Fuzzy
Logic can be considered a hybrid of Boolean and multi-criteria analysis techniques due
to the functionality of ‘fuzzy sets’ as hierarchy of criteria used with methods like AHP.116
These nested if-then sets serve as the knowledge-base options. It is a block stores of all
of the prior knowledge (options) needed for the system to draw conclusions on an
identified issue. A store prior knowledge system normally consists of two parts: a set of
linguistic variables and terms with their membership functions and a fuzzy rules set in
the form of if-then statements. Of the many types of MCDA models, those using Fuzzy
Logic tend to be the most intricate to program and model because of the potential
permutations of options. Because of Outranking’s incomparability, Goal Programming’s
lack of subjective input use, and the overly intricate programing required for Fuzzy
Logic, this study will select from the family of Full Aggregation MCDA models for use.
It is important to note that the use of these techniques are not mutually exclusive
in conduct within the MMC. Combining techniques is useful when the initial or raw data
does not readily allow transformation into information products that serve as the
analytical base for knowledge and understanding. The socioeconomic, political, and
cultural data set used during Stability Operations are examples of such raw data.
The final core SDSS component is the stakeholder component (SC).
Stakeholders in this setting refer to the collective of individuals directly linked to the
analysis product. This includes decision-makers/information end users, analysts, and
system developers. SDSS successful application is dependent on the effective
engagement of multiple and diverse potential participants.117 It is a given that decision-

34
makers are the key stakeholders at the process’ culmination, needing meaningful
information regarding the spatial problem. The analyst selects the appropriate models,
conducts simulations, evaluates data, and interprets output products used in the
decision making process. Note that there may be more than one analyst involved (e.g.
separate modeling and GIS analysts). Developers design computer system
architectures, create operator interfaces, and programs the system functionality.
Designing the system is a crucial part of SDSS development and necessitates
contribution from the entire continuum of system stakeholders and operators.118 The
CIM cell manning structure (containing soldiers specializing in GIS and computer
information processing systems and officers trained in socio-economic, security and
Stability Operations analysis) is similar in functional duties to those of the system
developers and analysts. The decision-makers/information end-user function is
represented by the military command. These stakeholder (SC) individuals jointly use the
combined DBMC and DMC capabilities of today’s GIS programs in conjunction with the
various models and techniques of the MMC in order to transform the integrated spatial
data into information. For the purposes of this research, parts of the Delphi survey were
utilized to fulfill the SC portion of the SDSS.
4.4 Model Management Component (MMC) Specifics
Specifically for this study, and using the results of a geo-referenced analyzed text
database as the source data, SDSS was used to develop this MMC integrated
environment through EDA and ESDA on variables in the database, identification of
spatial hierarchies of absolute and relative data for selected socio-economic and
infrastructure variables, merger of individual selected variables through a geographical

35
overlay procedure, and then a joint analysis of the variables using a decision making
technique that allows subjective judgment and human interaction within the process.
The details of various methodology components follow.
The methodology of Conglomeration as presented by Jesus Treviño. It is used to
jointly conduct EDA and ESDA in identification of spatial hierarchies.119 Conglomeration
is the analysis of spatially grouped values developing from the combination of local high
values and adjacent global high values.120 The title ‘Conglomeration’ is meant to reflect
the combination of statistical concentration (from EDA) and spatial agglomeration (from
ESDA). It begins with EDA in order to identify concentration. Concentration in this
context is defined as the presence of relatively high or relatively low values compared to
other values in the population regardless of their geographic location.121 This process
will include calculations of descriptive statistics, normality tests, and development of
threshold limit values to identify global high and low values for analysis. If the dataset is
not normally distributed, it is still possible to obtain good performance statistics through
the use of robust statistical analysis.122 The process continues with an examination of
agglomeration within the data set. Agglomeration is the concentration of adjacent
spatially high local values. It involves calculation to Morans’ I and LISA statistics. It
concludes with a modified use of Treviño’s conglomeration method for merging
agglomeration and concentration analysis via a mapping overlay (sieve mapping)
procedure.123 This creates individual spatial conglomeration data sets based on
identified socio-economic and industrial variables.
In Treviño’s model, spatial conglomeration is conducted using vector data
analysis on polygon geography. In order to conduct the individual variable overlay

36
merge and joint variable decision making procedures, the vector data are transformed
into raster data. Once done, the MCDA modeling technique used to jointly analyze
separate layers is AHP. This permits consideration of both subjective and objective
factors in alternatives ranking. For this analysis, the geography used is a point data set.
While still in vector format, the specificity of the point locations allows use the statistical
and algebraic functions conducted in a raster environment. Additionally, the use of point
data for Morans’ I and LISA statistics mitigates a concern in spatial data analysis. The
concern is known as the ‘Modifiable Areal Unit Problem’ or MAUP. Spatial point data is
often aggregated to various administrative boundaries (cadastrals, districts, census
block groups and tracts, counties, etc.). While many configurations are official
government geographies, there is still some level of arbitrariness in any of these
geographies and the geographies are subject to change. Changes with these
geographies affect how data points are aggregated by location.124 This could potentially
affect the values used in the AHP. The use of point data for this research helps to
mitigate MAUP in the fact locational aggregations are conducted by matching longitude
and latitude coordinates. It is recognized that many of the longitude/latitude coordinates
are centroid locations for city geographies. Despite this fact, the research is not time-
series based and there are no changes in geography during the month of the research.
Used in many fields including urban planning, AHP’s primary usefulness comes
from permitting decision makers to arrange the criteria and alternative solutions of a
problem into a tiered and ordered decision model.125 There are three general
hierarchical steps in conducting AHP: goal identification, criteria (variable) selection,
and alternative sets determination (courses of action). While the stages of the hierarchy
37
may be expanded as necessary, the alternative solutions sets are determined at the
lowest level of the hierarchy. Comparisons of the existing alternatives are determined by
a pair-wise basis at each level of the hierarchy. These determine the weighted relative
importance of each criterion. This weighing is normally conducted utilizing a nine-point
scale. Then, a measurement of the criteria values for each of the alternatives is
conducted. The AHP procedure synthesizes the alternatives’ priorities with the criteria
measurement into an overall ranked set of values indicating the comparative importance
of each alternative.126 This essentially equates to steps three through five of the Military
Decision Making Process (MDMP), used throughout the U.S. Army for operational
planning.
4.5 Case History
As outlined above, the case study subject was the OIF post-Surge decision to
make the municipality of Mosul in the province of Nineveh the main effort. To
understand this one must first understand the geographic and situational context of the
Surge itself. The Republic of Iraq was composed of eighteen provinces or governorates
at the time of the data collection in 2008 (an eastern section of the Sulaymaniyah
province was separated in 2014 to create a 19th province, Halabja, in March 2014).
Figure 6 shows a map of the Republic of Iraq with provincial boundaries.
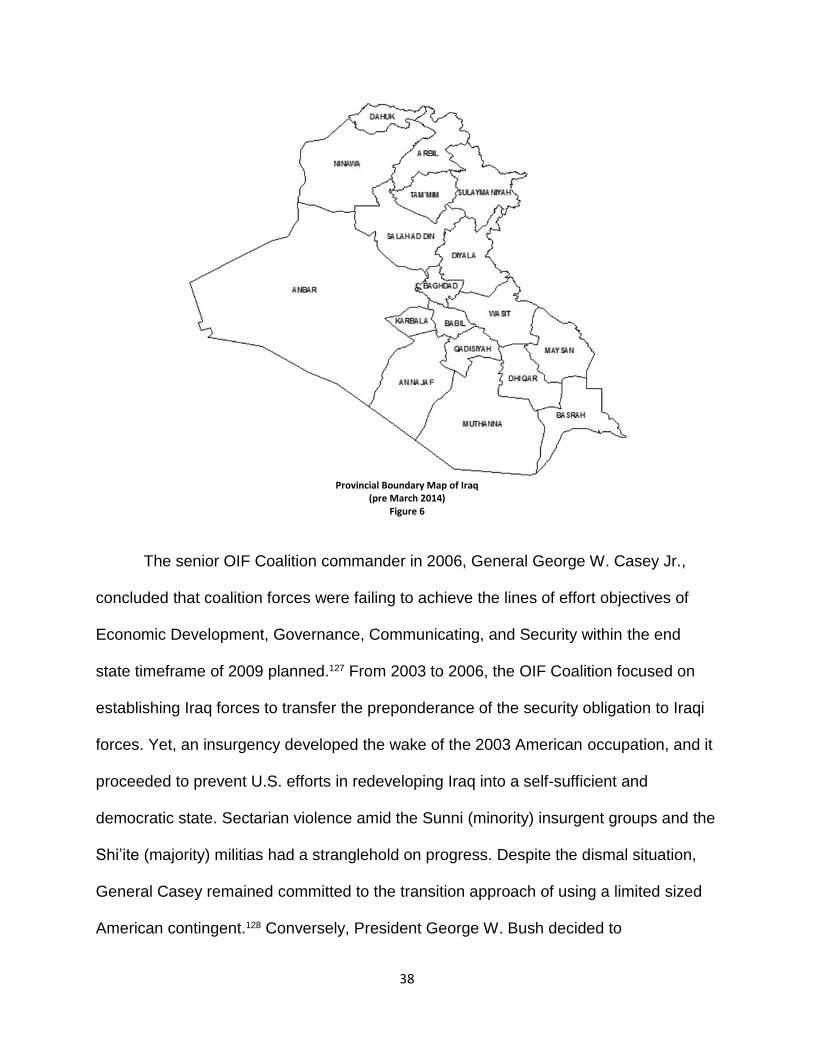
38
Provincial Boundary Map of Iraq
(pre March 2014) Figure 6
The senior OIF Coalition commander in 2006, General George W. Casey Jr.,
concluded that coalition forces were failing to achieve the lines of effort objectives of
Economic Development, Governance, Communicating, and Security within the end
state timeframe of 2009 planned.127 From 2003 to 2006, the OIF Coalition focused on
establishing Iraq forces to transfer the preponderance of the security obligation to Iraqi
forces. Yet, an insurgency developed the wake of the 2003 American occupation, and it
proceeded to prevent U.S. efforts in redeveloping Iraq into a self-sufficient and
democratic state. Sectarian violence amid the Sunni (minority) insurgent groups and the
Shi’ite (majority) militias had a stranglehold on progress. Despite the dismal situation,
General Casey remained committed to the transition approach of using a limited sized
American contingent.128 Conversely, President George W. Bush decided to

39
fundamentally alter the strategy. The ‘Surge’ was an increase of American troops in Iraq
designed to regain security in Baghdad and Anbar Province while changing military
strategy focus toward providing the conditions favorable to political and ethnic faction
reconciliation.129 Believing that more U.S. forces was the final opportunity to regain
security, he ordered the placement of five additional Army brigades in reinforcement to
Iraqi coalition forces and selected General David H. Petraeus as the new coalition
commander. His ‘marching orders’ were to provide the bourgeoning Iraqi government
with the necessary functioning opportunity to secure itself.130
Under General Petraeus, as the Multi-National Force–Iraq (MNF-I) commander,
Iraq was divided into seven different areas of operations. As shown in Figure 7, each
area was under the responsibility of brigade to division sized forces (2,000 to 15,000
personnel sized units respectively). Operations in Bagdad were under the control of the
Multi-National Division–Baghdad (MND-B).131 While the smallest of Iraq’s 18 provinces,
Baghdad accounted for twenty-five percent of the country’s population. Most of the city’s
residents were Shi’ite, but the city also included several Sunni neighborhoods. Multi-
National Division–North (MND-N) occupied the planes of northwest Mesopotamia,
including the cities of cities of Mosul and Tikrit.132 In the west, Anbar Province was
designated as Multi-National Force–West (MNF-W), under control of an U.S. Marine Corps
Expeditionary division sized unit. U.S. coalition partners’ areas of responsibility were in
southern Iraq, Multi-National Division–Center South (MND-CS).133 The area covered the
region south of Baghdad, was commanded by the Polish Army with troops from
Armenia, Bosnia, Denmark, Georgia, Lithuania, Mongolia, Romania, El Salvador,
Slovakia, and the Ukraine falling under the MND-CS command. Finally, the British
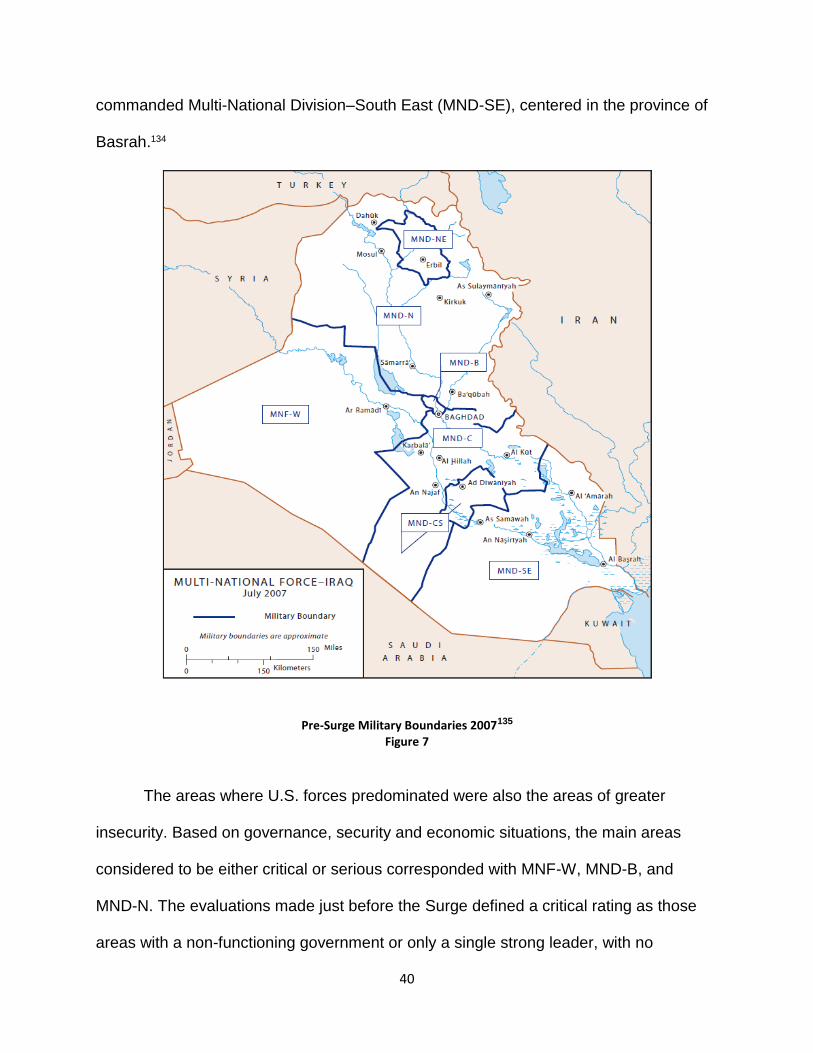
40
commanded Multi-National Division–South East (MND-SE), centered in the province of
Basrah.134
Pre-Surge Military Boundaries 2007135 Figure 7
The areas where U.S. forces predominated were also the areas of greater
insecurity. Based on governance, security and economic situations, the main areas
considered to be either critical or serious corresponded with MNF-W, MND-B, and
MND-N. The evaluations made just before the Surge defined a critical rating as those
areas with a non-functioning government or only a single strong leader, with no
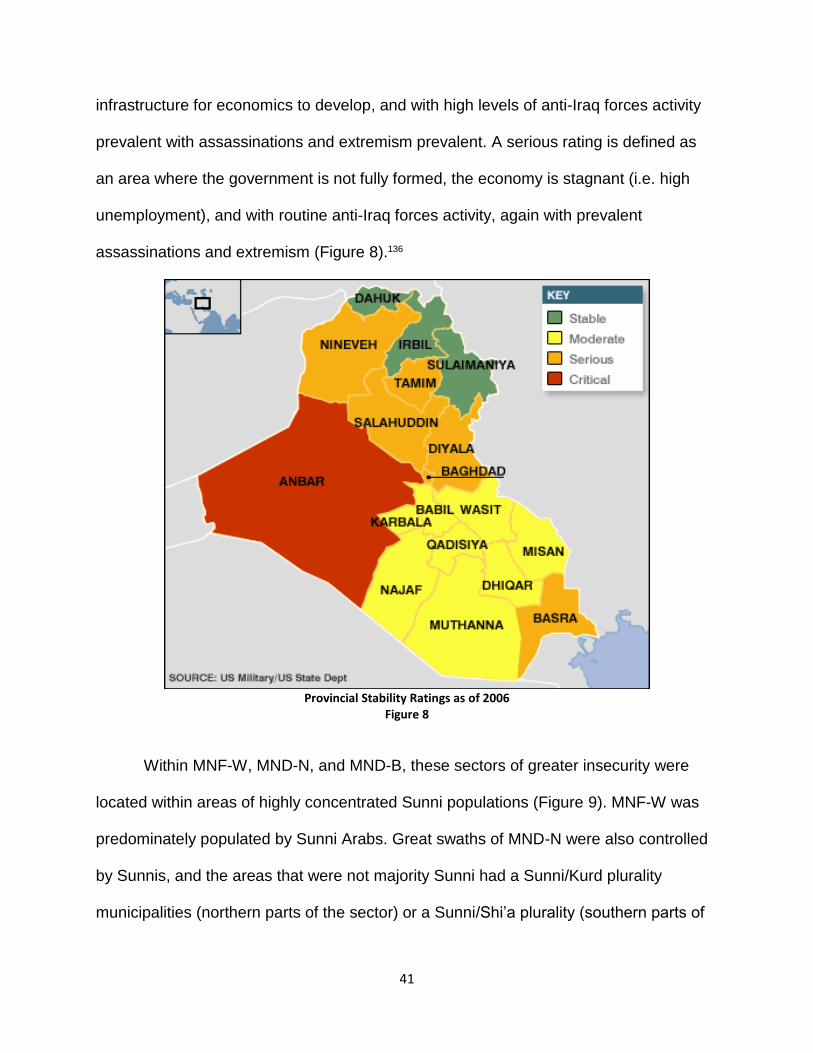
41
infrastructure for economics to develop, and with high levels of anti-Iraq forces activity
prevalent with assassinations and extremism prevalent. A serious rating is defined as
an area where the government is not fully formed, the economy is stagnant (i.e. high
unemployment), and with routine anti-Iraq forces activity, again with prevalent
assassinations and extremism (Figure 8).136
Provincial Stability Ratings as of 2006
Figure 8
Within MNF-W, MND-N, and MND-B, these sectors of greater insecurity were
located within areas of highly concentrated Sunni populations (Figure 9). MNF-W was
predominately populated by Sunni Arabs. Great swaths of MND-N were also controlled
by Sunnis, and the areas that were not majority Sunni had a Sunni/Kurd plurality
municipalities (northern parts of the sector) or a Sunni/Shi’a plurality (southern parts of

42
the sector). MND-B had a Sunni/Shi’a plurality similarly to MND-N, since it was
southernly adjacent.
Iraqi Ethic and Religious Distribution137
Figure 9
The liberation/invasion of Iraqi was based upon the use of speed instead of
mass. But initial tactical success could not long hide the fact that ‘Shock and Awe’ did
not equal control. The concept of rapid decisive operations – speed – restricted U.S.
commanders from dealing with all aspects of operations (offense, defense, and stability)
because it divorced the political, human and psychological dimensions of military

43
conflict from the war. Situational control was lost, if ever gained, lacking the mass to
deal with the above-mentioned dimensions.138 Into this void the sectarian violence
between Sunni insurgent and Shi’a militia arose. By 2007 the ‘Iraq War’ turned into a
series of overlapping and interconnected conflicts including anti-coalition insurgencies,
a sectarian Sunnis - Shi’a civil war, and community in-fighting within both the Sunni and
Shi’a sects.139 This was the situational status in which General Petraeus introduced his
Counterinsurgency strategy.
The underlying theme of Petraeus’ way forward was basically, “You can’t kill your
way out of this kind of war”.140 The goal changed from transforming Iraq into a
Jeffersonian democracy (and the entire Middle East for that matter) to achieving a
modicum of stability that would keep the country united and prevent the situation from
morphing into a regional atrocity. This required change in overall tactics were soldiers
would conduct more non-kinetic (aka.: non-shooting) engagements with the populace.
In some ways, the new tactics were akin to ‘Community Policing’ undertaken in major
U.S. cities. Conducting operations in proximity to local residents resulted in a number of
tactical gains. Relations built with local Iraqis gained American forces critical
intelligence, enabling the targeting of insurgents, and locating improvised explosive
devices (IEDs). Incoming surge brigades were dispersed across the capital and the
adjacent area. Two surge brigades were attached to the MND-B. Another three were
deployed to the sections in MND-N and MND-C. While MND-C was considered to be
‘moderate’ (functional but fragile government, slowly developing economy, and steady
but potentially unstable security situation), occupying the area to the south of Baghdad
was critical to controlling MND-B’s flank. Also, one of the more radical schemes was

44
already being implemented by U.S. Marine forces in MNF-W, albite in a small fashion.
An U.S. Army Brigade (1st Brigade Combat Team, 1st Armored Division – 1/1AD) was
assigned to the city of Ramadi within the Ambar Province (MNF-W). The unit developed
alliances with the local tribes in the region. 1/1AD was able to persuade the tribal elders
that the Americans planned to stay and were intent on working with them to clear
Ramadi of al-Qaeda insurgents. By the end 2006, the ‘Anbar Awakening’, brigade and
Iraqi police jointy achieved extraordinary success prior to the start of the Surge. Mortar
and small rocket attacks fell 67 percent, IED attacks declined 57 percent, and daily
attack averages were down 38 percent. With the brigade now inside the city, coalition
forces initiated humanitarian and civic reconstruction projects.141 Despite the skepticism
of the Marine commanders at the time, General Petraeus made the Awakening an
integral part of his Counterinsurgency plan.
Without going into details of various battles, the Surge was a mixed success. A
fitting description is “confusing starting to win with having won”.142 The Surge had
regained the strategic initiate, gaining the needed breathing space for the Iraqi
government to move forward; however, questions on the long-term direction of the
nation remained unclear. The country’s political tension seemed held in stasis by the
Surge. While the country experienced less sectarian violence, the national government
still suffered from dysfunctional sectarian divisions. There were de facto partitions
between the Shi’a, Sunni, and Kurds. Additionally, it appeared that the country was
becoming extremely influenced by its Shi’a majority neighbor Iran, and hostilities were
rising between Arabs in general and the Kurds over control of oil and the municipality
and province of Kirkuk.143 Of all the areas in which the Surge took place, Kirkuk in MND-

45
N experienced the lest declines in sectarian and insurgent violence. Additionally in
MND-N, Mosul (Nineveh Province) began to experience political strife as much of the
Iraqi Army at location was Kurdish but largest portion of the population plurality was
Arabic. Al Qaeda, while diminished, had not been successfully driven from the area and
continued to exacerbate the Arab-Kurd division.144 This is consistent with the findings of
this research’s first Delphi survey iteration.
As described above, the first round of Delphi questions consisted of open-ended,
designed to establish why and how Mosul was selected as the Stability main effort. The
first question was, “What were the factors leading to the designation of Nineveh
province as the theater main effort?” The comments generally focused on the political
strife between various factions:
While Baghdad had the largest population, there were multiple fracture lines (Sunni/Shia/Kurd) with the added issues of the northern provinces bordering Syria and Turkey. ... In 2006 the al-Askari Mosque (Shi’a Shrine - City of Samarra) was bombed with lingering accusations between the Shai and Sunni factions and the al-Qaeda insurgents being blamed. Problems between the ethnic/religious factions became paramount in the post-Surge OE.
[While the] ‘bad guys’ were in Anbar, Surge projects
like the ‘Sons of Iraq’ helped to mollify the situation there. Insurgent activity increased in Talifar and Mosul, and also along the Iranian border. The less hazardous option was to conduct operations in Mosul and Talifar and not risk some type of confrontation along the border.
… [T]he Surge stabilized Baghdad, Anbar and other
areas. Mosul was deemed the least secure. But the overriding issue was political. It was an opportunity for the national government to prove that they could provide for their own security and that the national government could properly deal with minority populations (i.e., Kurd). Key to this was trying to establish if the national government-controlled resources or if sectional areas controlled them.

46
Another participant noted that the main effort was in MND-N, a sector totally under U.S.
operational control. This enabled the focusing of U.S. assets more easily. MND-C,
MND-CS, and MND-SE were reconfigured just after the Surge into a new MND-C and
MND-S. Both new sectors became coalition partner operating areas. Applying post-
Surge assets primary became an issue of controlling resources. There were dissenting
viewpoints stating: “[While designated as such,] it was not readily apparent to this
participant that Mosul was the post-Surge main effort”.
With the overall political uncertainty within the OE being confirmed, the rational
developed from the Delphi initial iteration for choosing Mosul, Nineveh focused on some
degree of security. Responses include:
The focus was mainly on political issues with efforts toward security. It was all about proving a functional national government could be operated.
Security became the most important issue. Security was primary but used the political, economic
threads to hep to support and maintain security. There was a PRT [Provincial Reconstruction Team – a joint DoS/DoD Stability Operation] Mosul and the regional U.S. embassy which would provide good support to Stability efforts.
It was approximately equal between security and other
socio-economic issues. The OE still needed security, but stability began to emerge as an equal piece. As the security increased it gave greater possibility for stability operations.
When asked what procedures were used in the analysis of the post-Surge OE,
the general consensus was that there was not a specific analysis procedure. Opinions
ranged from:

47
While both PMESII and DIME were used, the most important thing was the decentralization of effort; getting off the large FOB into the communities. Greater integration among the population countering the enemies influence.
The analysis was more focused on troop to task.
There was little analysis on the root causes of the violence.
to, a very un-definitive:
[I am unsure] if an actual analysis process was used beyond security and the ability to leverage the U.S. Regional Embassy [in Mosul].
The final open-ended questions of the first Delphi survey asked whether any of
the factors bearing on a commander’s decision making ability displayed in a
geographically integrated fashion and, if so, was it any help in designating Nineveh
province as the theater’s main Stability effort. On this there was a consensus that there
was not an integrated geographically displayed of key factors existent. There was not a
‘Stability COP’ that assisted in the decision to designate Mosul as the Stability main
effort.
It is at this point in time and location that this case study examined the decision
to designate the municipality of Mosul as the Stability main effort. the end of the Iraqi
Surge. Civil Affairs units were scheduled to deploy into Iraq in October of 2008 and an
analysis of post-Surge activities was required. The following applies a retroactive
Stability COP analysis to the decision.
5. DATA
The data used for the quantitative portion of this study is based on content
analysis. While not a formal part of the methodology underpinning this study, it is
48
important to understand why content analysis is important to the CIM function, what
makes a properly developed content analysis data set appropriate for use, and why the
specific dataset used within the analysis was selected. This explanation includes how
the selected data set variables are applicable to Treviño’s conglomeration method and
ultimately Saaty’s AHP method.
5.1 Content Analysis
The main form of event communication in the military is the daily situation report,
commonly known as a SITREP. These reports are generally written qualitative
documents. To conduct the processing and analysis/evaluation CIM functions, the
qualitative data must be converted into a different form. The principal data form for
analysis is based upon content analysis. One well-known definition of content analysis
states that it is “a research technique for objective, systematic, and quantitative
description of the manifest content of communication”.145 A second popular and similar
definition describes a technique geared toward “making inferences by objectively and
systematically identifying specified characteristics of messages”.146 Both of these, as
noted by Neuendof, emphasize “the scientific method (including attention to objectivity,
… reliability, validity, generalizability, … and hypothesis testing)”.147 Researchers
consider content analysis at the crossroads of the qualitative and quantitative
methodologies, and the analysis method provides a rigorous exploration of many issues
of interest in areas ranging from business policy and business strategy to managerial
thought and organizational reasoning, and from social-issues management to
organizational theory.148 As the initial part of the sequential exploratory mixed-method
strategy, where collection and analysis of qualitative data leads the process, content

49
analysis provides the ability for qualitative data, such as written reports, to be converted
into quantitative data. An explanation of why content analysis is appropriate begins with
an explanation of how it meets scientific rigor followed by the general procedure of
conducting content analysis. The examination of its scientific rigor involves examining
its emphasis on ‘the scientific method’ components of objectivity, reliability, validity,
generalizability, and hypothesis testing.
Objectivity in content analysis is the development of procedures for the
systematic categorization of raw text in a transparent manner. Transparency is key to
the mitigation of an analyst’s personal bias.149 Additionally, the term ‘systematic’ also
concerns the issue of bias in categorization application. It is the consistent application of
categorization rules so that bias is suppressed. While the rules may reflect a
researcher’s interest and concerns, they can, or should, be applied without bias.150 It is
these actions, when conducted during the summarization of analyzed messages, that
allows a scientific method (or methods) to be applied in the examination of the text
involved.151 Noting that objectivity is positivist, it is still desirable in the conduct of
research. While there is no true objectivity, knowledge and reality are constructs agreed
upon socially.152 From this perspective, human inquiry is inherently subjective. Yet, as
stated in the second definition above, a systematic or consistent method of inquiry is
desired. By relaxing the overarching the standard from ‘Is this true?’ to ‘Is this agreed to
be true?’ researchers can maintain a scholarly standard called intersubjectivity.153 This
substitution of constraining questions allows the use of the scientific method with
allowances for the lack of pure objectivity. An a-priori, or previously theoretically
deduced, design is necessary for adherence to the scientific guidelines. This design is

50
reflected through the development of a coding scheme. While exploratory research can
be conducted in the development of coding schemes, the a-priori design process can be
viewed as a combination of induction and deduction.154 Deductive in the fact that
choices on variables’ measuring and coding procedures must be decided upon prior to
conducting observations. Inductive in the fact that exploratory work can take place
before finalization of the coding scheme. Coding is the process of interpreting text or
visual data in formal terms according to explicit and detailed rules.155 The rules
developed minimize idiosyncratic judgments that could create unreliability.
Reliability is the extent to which a process yields the same results in repeated
trials.156 It is a paramount necessity for the implementation of content analysis. For
coding conducted by content analysis, this translates as intercoder reliability (also
known as replicability). Intercoder reliability is defined as “the amount of agreement or
correspondence among two or more coders.” 157 It is a measure of the degree to which a
process can be reproduced by different analysts under varying conditions and in various
locations.158 Having intercoder reliability is important for two reasons. First, it provides
confirmation that the coding scheme was not used by only one individual. Doing so is
more akin to expert analysis and not consistent with content analysis. Second, the use
of multiple codes, when their efforts are calibrated against each other, allows for the
processing of more messages; this increases the scale of the analysis.159 Much effort
and attention must be given to conducting human-based content analysis.
While human-based approaches have been the norm for content analysis, the
computer-based analysis is becoming more applicable and offers advantages with
regard to the two issues of intercoder reliability. The need for coding scheme

51
standardization is mitigated. Computer-based techniques do not suffer from any
subconscious standards change during the coding process. Nor will the coding process
suffer potential differentiations in text interpretation during the process. Additionally, the
scale at which computer-based coding takes place dwarfs the capability of hundreds of
human coders.160 Yet, computer-based analysis is limited to a quantitative method of
analysis.161 Known as ‘manifest content’ analysis, analysis drawn via this method is
concerned with the apparent content of the observed text.162 This is in comparison to
latent content analysis that deals with normally unobserved concepts that are not
measured directly but can be ‘represented’ by one or more indicators.163 The difference
between the two content types is roughly categorized as ‘surface’ and ‘deep’ language
structures, with the latent content in issues of context, tone, and word/phrase usage.164
Yet the differentiation between the two is subtle. Manifest (quantitative) content analysis
is heavily dependent on the counting of coded textual data, but the act of coding
requires qualitative identification procedures. Contrasted with the latent (qualitative),
which places emphasis on themes and certain key ideas within the text.165 Thus,
reliability can be summarized by an archery target metaphor in which all the arrows fired
are closely clustered. Note, there is no mention of where on the target the arrows are
clustered, it is just important that they are closely clustered.
In contrast to where the target is consistently struck is the specification that the
correct part of the target (i.e. the center or bullseye) is struck. Validity refers to the range
that a measuring procedure represents the actual concept.166 This concept is
tantamount to discussed MOEs. The key question of validity is if one is measuring what
truly needs to be measured. This links to the MOE characterization question, ‘are we
52
doing the right things?’ due to the concentration on the true and correct issue (mission
or scenario) at hand. In the theme of hitting the center of the target, three types of
validity are presented: face, social, and empirical.167 While other forms of validity
assessment exist, these carry greater emphasis within content analysis than other
areas of study such as psychology due to the concern of content analysis with the text’s
meaningful relationship to a designated context.
Face validity is the stipulation that the measure reflects the content of the
concept in question.168 It is important in context analysis due to the attention toward how
text, symbols, and images are interpreted in the shared culture at a given point in
time.169 This tends to be difficult to measure but is always present. Determining face
validity is basically an intuitive process.
Social validity addresses whether the research result’s quality gains acceptance
due to its reflection of public discourse on significant social concerns.170 This type of
validity is concerned with the social desirability and usefulness of changes in behavior.
It is an examination of whose behavior is being changed.171 There are three key aspects
of social validity: goals, procedures, and effects.172 The term ‘social validity’ is most
commonly used in the field of behavior analysts with a focus on the ethics of treatment.
In terms of content analysis, social validity is the degree that researcher created content
analysis categories are relevant and meaningful beyond academia.
Empirical validity serves as an umbrella category for several types assessments
that support the stages of research, supports the finding of additional data, or defends
against criticism of observation, experiment, and measurement.173 While it does not
deny or separate itself from either face or social validity, empirical validity serves as the

53
scientifically grounded measure based upon rational arguments, research processes,
and research conditions under which the data were obtained. For empirical validity,
content analysis draws heavily from the field of psychology for its assessment methods.
Specifically, assessments of content validity, construct validity, criterion-related validity,
and predictive validity were defined as an important test of individual characteristics or
abilities.174 Content validity examines the extent a measure represents all features of a
given construct. Construct validity, acknowledging that measured concepts are often
abstract and not directly observable, examines how well a concept’s measure relates to
other concepts’ measures in respects that are consistent with established theory.175
Criterion-related validity, also known as instrumental or concurrent validity, examines
the extent to which a measure is related to an established outcome. This assessment is
based on a measure that are both known to differ from, and that are relevant to, the
research concept.176 Predictive validity, as noted by Bryman, is a similar concept, which
examines the extent to which a measure is related to an outcome with the difference
being that the measure is an outcome assessed at a later time. All the above mentioned
forms of validity (face, social, empirical – et al.) are categorized as internal validity, are
concerned with causal relationships of the measured variables.177 External validity, also
known as generalizability, is concerned about determining whether research findings
are applicable beyond the conducted study.178 Details on generalizability follows.
For issues of generalizability in content analysis, addressing how well a study’s
findings are applicable to other people, settings, and times is problematic for two
reasons. First, care must be given to geographic issues when attempting to apply
observations of one location to another location that is situationally similar but are not

54
spatially related (i.e., in close proximity). Cultural, political, economic and even
environmental differences between the two geographies could make any application of
findings from one to the other invalid. Second, if the topic of a study for a geography is
applied to a different situation in another geography, again any application of the
findings from one to the other could be invalid.179 However, these comparisons are
made at a ‘micro’ scale for quantitative analysis purposes. If two different scenarios
share key characteristics, then a larger scale theoretical inference is possible.180 In
terms of qualitative research, the vast amount of ‘thick and deep’ descriptive
observations are comparable when the contextual characteristics are similar at a larger
or more holistic scale. The ability of researchers to draw an overall perspective makes
the development of theoretical inference possible, but only on a case-by-case basis.181
This is key for developing the foundation for the final scientific method component,
hypothesis testing.
Traditional presentations of research methods place emphasis on testing
hypothesis for specific pattern evidence in designated datasets. Content analysis has a
different concern for hypothesis testing focused on origination, intended and unintended
audience, meaning to audience, mediation between antecedent and consequent
conditions, and the dataset’s ability to enable analysts to select valid answers
concerning contextual questions.182 Essentially, the counting of words, phases, or
themes is not the lone objective. The ‘analysis’ requires abductively inferring contextual
phenomena from texts based upon outside data. This develops a bridge between
descriptive accounts of texts and what the text holistically means and attempts to
provoke. Unlike deductive or inductive inferences, these abductive inferences are based

55
upon warrants (analytical constructs) that operationalize relationships between what the
text states explicitly and what the text implies.183 The abductive inferences develop the
theories which, in turn, develop the hypothesis for testing. Thus, in comparison to what
is normally seen as hypothesis testing, the generalization of observed phenomena
applied as a criterion, now the generalized test criterion becomes the extratextual
meanings and themes which the individual texts may conform within.
5.2 Global Database of Events, Language, and Tone
Since most of these SITREPs have an intelligence security designation of either
‘Classified’ or ‘For Official Use Only’ (FOUO), their use in an academic setting is
prohibited. Yet, a ‘pre-content analyzed’ set based upon periodical articles is available
as a proxy. The specific database used for the analysis is the Global Database of
Events, Language, and Tone (GDELT). It is a catalog of human societal scale behavior
and beliefs across multiple countries ranging from 1979 to 2012.184 The database events
have been geo-referenced to both national and sub-national levels. For the purpose of
this analysis, events at province/district level within Iraq for the month of September
2008 were used. Additionally, the data are formatted using the Conflict and Mediation
Event Observations (CAMEO) event coding taxonomy. Originally intended to support a
National Science Foundation (NSF) funded study of interstate conflict mediation, the
CAMEO-automated coded data can also be used for studying other types of
international interactions and natural disasters.185 CAMEO was intended as an
extension of Charles McClelland’s WEIS, a coding framework for event data research
developed during the Cold War and focused on a Clausewitzian global political view
where sovereign states reacted to each other primarily through diplomatic and military

56
pressure.186 This coding system, while innovative in its time, was sufficient for dealing
with contemporary issues of ethnic conflict, low-intensity violence, organized criminal
activity, and multilateral intervention. As a consequence, the first stage of the
development of CAMEO involved adding the cues and subcategories needed for the
study of mediation and conflict upon the WEIS framework. The next stage involved
searching for examples of the various category and defining them for the codebook, an
action leading to the understanding that some of the desired distinctions were not
possible given the quality of the news articles. The result was the consolidation of
multiple categories into fewer cue categories.187 Significant attention went into creating a
theoretically intelligible and comprehensive coding scheme for CAMEO. This led to the
development of ‘opposing’ cue categories (e.g., the creation of an ‘Approve’ category
necessitated the addition of a ‘Disapprove’ category). While originally intended to code
events on with international mediation, CAMEO has developed as an outstanding
general coding scheme for examining political conflict as a result of a more
comprehensive ontology from the WEIS base.188
This study’s analysis used two event action attributes. NumArticles and AvgTone.
NumArticles is the total number of source documents containing at least one incidences
of this event. It assesses an event’s importance; the more discussion of the event, the
more significant it is.189 It is a count/amount measurement and serves as an indication of
magnitude. AvgTone is the average tone of documents containing at least one mentions
of this event. With scores ranging from -100 (extremely negative) to +100 (extremely
positive) and a value of zero being neutral, it assesses the importance of an event and
serves as a proxy of event impact.190 These values normally range between -10 and

57
+10. It functions as an indication of intensity. AvgTone is derived using a tonal
algorithm.191 This algorithm is analogous to relative risk in epidemiological studies where
a ratio between the represent kernel density estimations (KDE - non-parametric method
of estimating random variable probability density functions) of disease infection
locations and case control locations is used to capture the disease risk for the case
control population. Similarly, the tonal algorithm calculates the topic intensity (tone) as
the ratio of the KDE of articles that mention a given topic compared to the KDE of
articles that do not mention the topic for a given set of sample points.192
Within the GDELT database, variables describing the condition or situation of an
OE are selected. The variables selected are based on the eight interrelated operational
planning variables PMESII.193 When a commander and staff know where their unit will
deploy, analysis using the PMESII variables on that area begins. It then continues after
receiving mission specifics and proceeds throughout the course of the operation. Not
only does PMESII decompose the OE for combat operations, it also enables effects
measurement for the range of operations considered under Stability Operations to
include humanitarian aid, disaster relief, and noncombatant evacuation operations.194
The military, information, and infrastructure operational variables are more readily
identified and monitored spatially than the other PMESII variables. Thus, the action
attributes of NumArticles and AvgTone derived by GDELT’s CAMEO coding taxonomy
for political, economic, and social events are especially useful for this analysis.
In terms of the content analysis’ emphasis on objectivity, reliability, validity,
generalizability, and hypothesis testing, only validity causes concern. Because of the
automated design of the content analysis methodology, the GDELT creators do not

58
allow for third-party verification. Neither the articles nor the article source list with dates
are released. Despite using publicly available news report sources, GDELT
representatives state that their licensing restrictions prohibit making the text available.195
While the standard tenets of journalism require answering of six basic questions for a
story (who, what, where, when, how, why), this information is sometimes lacking within
the GDELT dataset. Specifically, the ‘who’ information is often missing about Actor 1
and/or Actor 2 variables. The implication is that an automated coding algorithm will fail
to identify crucial information within the news reports; automation skimmed through the
articles and will not have the ability to code for certain seemingly common situations.
With no simple human verification to check for important missing data, the lack of
transparency in the data collection process causes a significant barrier to independent
validation of the constructs, affecting whether the content analyzed data is trustworthy.
Yet, a post refuting the assertions that the GDELT dataset is faulty states that news
reports of antagonistic political issues (e.g., government coercion, protest, insurgency,
terror, etc.) often not successful in identification of a specific ‘Actor’ and/or specific
‘Event Target’ variable attributes of significant interest worthy of coding by those who
investigate conflicts.196 Additionally, a study conducted by Best, Carpino and Crezcenzi
observed the differences between event data from full articles produced via human
coding finding that, converse to expectations, hand coding full news stories did not lead
to a significant improvement in the accuracy or depth of actor information compared to a
machine coding method (TABARI)197. However, in his dissertation on political conflict,
James Yonamine conducted analysis suggesting that the GDELT had a great amount of
external validity. He first used the GDELT data to develop a time-series reflecting the

59
amount of violent incidents that occurred weekly in Homs and Aleppo during 2011 and
2012. Specifically, he selected all conflict events that occurred in the vicinity of the
latitude and longitude coordinates encompassing Homs and Aleppo, and then totaled
these events by week. Then he plotted these time-series and visually compared the
values with a Syrian NGO’s ground-truthed database. The GDELT based time-series
from Homs and Aleppo was nearly identical to that of the ground-truthed dataset. A
second test reflecting Afghanistan located violence was conducted using the same
GDELT methods and presented to U.S. government officials. The results were
insignificantly indistinguishable to classified datasets maps (similar to the point that
government officials inquired if the GDELT based maps were plagiarized versions of
classified information).198 Despite the content analysis issue within the GDELT dataset,
it does not diminish its use as a SITREP proxy for demonstrating the use of SDSS for
Stability COP development. The focus of this analysis is on how qualitative data can be
spatially integrated, analyzed, evaluated, and displayed.
6. LITERATURE REVIEW
This literature review focuses on two major components: research within SDSS
and the historical development of CIM. Specifically, the SDSS focus highlights the
scope of its application to various domains and purposes. While based upon the
research conducted by Sugumaran and DeGroote, additional examples leading toward
the use of socio-economic data processing and analysis are presented. Next, the CIM
focus highlights the efforts involved with geographically presenting a Stability COP. It is
from the two reviews that the possibility of SDSS as a method of developing a collective
Stability COP was identified.

60
6.1 Spatial Decision Support Systems (SDSS) Review
Sugumaran and DeGroote produced a literature compilation on a variety of peer
reviewed articles, academic book chapters, and writings from conference proceedings.
Only publications that implementing, reviewed, or created programs toward integrated
model-based spatial software designed to support decision making procedures were
included.199 At the time of their publication, they discovered over 450 publications and
categorized them into 11 stylized application domains based upon the major topic of the
publication. These domains included the topics of public health, business,
transportation, emergency planning, agriculture, urban studies, environmental planning,
and natural resources management.200 While many of the SDSS publications deal with
policy issues, none specifically addressed SDSS use within U.S. military operations in
general, nor Stability Operations specifically (such as foreign nation emergency
services, infrastructure redevelopment and humanitarian relief). The largest number of
articles (103) focused on natural resources management. In addition to those articles
listed in the Sugumaran and DeGroote review, there have been other articles and
dissertations addressing the uses of SDSS to socioeconomic situations. In 1994 Lee
addresses the use of SDSS toward a specific ill-structured planning situation (a bus
routing problem). To evaluate the effectiveness of decision-oriented support systems
within an urban planning procedure (rather than just analysis-oriented planning), a DSS
generator for multi-attribute judgment was developed. Four judgment methods were
explored in constructing the judgment module. Scenario data for ill-structured judgment
methods were developed by Monte Carlo simulation and implemented into the module.
Evaluation of the system showed that the system satisfactorily functioned as designed,

61
enabling users to explore problems in a constructive and iterative manner.201 The
system exemplified how procedural expertise could be brought to bear in an operational
system.
SDSS application to land use decision making has been prevalent since McHarg
used the traditional suitability analysis toward land use planning for Staten Island in
1969.202 Anjomani, Sabri, and Shad dealt with land use/environmental planning
problems by applying SDSS to develop alternative land use solutions.203 Their study
began by noting that many of the problems that these issues generated were both too
complex for a purely speculative solution based on experience, imagination and
intuition, and often lacked comprehensive data for a purely inductive analytical
approach based solely on detailed study. They sought to use a more effectual
approach, synthesizing elements of the inductive and intuitional approaches in a
scientific process based on a combination of experimentation, observation, and
explanation. Specifically, they sought spatial land use arrangements that would yield
substantial improvements in energy conservation, ecological constancy, or agricultural
production.204 Key to the improvement was the search for an optimal solution. Anjomani,
in previous studies (1984 and 1992), suggested implementing optimization models in
the suitability analysis portion of the land use planning process instead of the traditional
map overlay technique. This was done to consider demand for various types of land use
in the analysis. In consideration of demand-side land use (i.e., how much of each land
use type is needed), the authors applied linear and quadratic programming models as a
part of a spatial analysis program (GIS). The map overlay technique previously used
only dealt with the land use supply-side identification (i.e., what is the highest and best

62
use for each land parcel).205 This spatial supply-demand analysis not only allowed for
the identification of locational equilibrium matches, but also a ‘what-if’ examination of
various policy choices. Such policy choice issues included the establishment or change
in zoning of an area. While zoning is technically a categorical variable, the combination
of experience-based speculation of where zoning change can occur combined with
spatial optimization enabled by SDSS methods measured the effects of the proposed
changes in its entirety and identified the requirement for a more specific land-use plan.
An initial, but key, recognition in recent SDSS literature involves dealing with
spatial planning’s numerous and contradictory objectives (e.g., minimizing air, water,
and soil pollution; gaining acceptance of the projects; implementation cost reduction).
There are requirements for societal values consideration in evaluations, human
participation increase in decision processes, and better incorporation of the spatial
dimension’s crucial role in such problems. Ferretti and Montibeller contend that there
are key challenges confronting both designers in model development and practitioners
in implementation toward decision making support.206 The challenges impose important
meta-choices to designers and practitioners. Different choices can lead to different
content within the evaluation model and to distinctively different outcomes of the
analysis. Meta-choices (also known as meta-decisions; Sousa and Yu, 2014) show that
beyond needing to resolve the problem decision makers also need to decide how they
will proceed to decide (i.e.: the ‘deciding how to decide’ problem).207 Ferretti and
Montibeller’s paper discussed the following key SDSS challenges:
• Who should participate
• How should they participate
• Selection of a [MMC] method to use
• Sources used to define objectives

63
• Compensating for limited spatial data for the criteria
• Attaining spatial standardization functions from experts
• Dealing with sustainability concerns in the evaluation
• Attaining criteria weights from experts
• Efficiently performing spatial sensitivity analysis 208 They attempted to provide practitioners and scholars with an increased awareness
about decision support systems design and implementation choices, a better
understanding about the available choice alternatives, and a richer appraisal of the
inherent advantages and disadvantages trade-offs between each alternative. Their
conclusion was that the SDSS multi-criteria analysis incorporates methodologies that
offer a sensible foundation for the assessment of dissimilar alternatives considering
multiple, conflicting, and often disproportionate dimensions measured by well-specified
criteria. A strength of the approach is that it can take into account qualitative criteria, as
well as quantitative criteria. They state that a SDSS can overcome some of the
shortcomings of traditional economic analysis (e.g., cost/benefit analysis) by allowing
the overt inclusion of intangible and non-tradable goods and by modeling the priorities
of decision makers and stakeholders.
Ferretti and Montibeller’s point about deciding how to decide has been reinforced
by Coutinho-Rodrigues, Simão, and Antunes.209 Noting that urban infrastructure
planning has important spatial implications, they stated that alternative courses of action
evaluation requires explicit consideration of the important social, economic, and
environmental effects encompassing multiple criteria. Their paper presented a DSS
focused toward offering users, such as municipal and transportation agencies, a flexible
and easy to use environment for providing decision aid in urban infrastructure planning.
The spatial presentation of alternatives on maps provides a value added decision

64
support processes of problems with support to urban infrastructure evaluation. It assists
the user in locating the spatial elements in the actual environment. This system’s
development was motivated by an actual metropolitan case study analyzing the
investment decision of an urban infrastructure in Coimbra, Portugal. Selection of the
best investment option for a water supply system to satisfy the new demand created by
urban development and expansion was the underlying decision. The multicriteria Spatial
Decision Support System (MC-SDSS) developed for Coimbra was named MCPUIS
(Multicriteria Planning of Urban Infrastructure Systems). MCPUIS integrated
methodologies from three areas of research: geographical information systems (GIS),
database management systems (DBMS), and multicriteria decision analysis (MCDA)
producing a menu-driven SDSS. Its interface was designed to be user intuitive and
friendly. The design allowed ease required parameter input and it allowed
experimentation with the decision support methods. The integration of modules was
designed to support the four basic functions: storage, retrieval, and display of data
(SRDD); investment option evaluation (IOE); investment option comparison and
selection (IOCS); and communication/interaction with the system and sensitivity
analysis. Of particular concentration for this study were the IOE and IOCS modules.
These modules most closely resembled the process and analysis perspectives of the
CIM-SDSS desired. The IOE module conducted the process function through an
assessment of investment options that accounts for performances on the various
evaluation criteria. This required a cost/benefit determination for each of the various
economic, social, and environmental alternatives. Because the data involved varies
spatially, the criteria scores are often difficult to determine. The MCPUIS’ IOE facilitates

65
evaluations through ensuring the evaluations are built upon the same technical formula
and data. Multiple criteria comparisons of the various alternatives for the urban
investment decisions are performed by the IOCS function. It is commonly understood
that no MCDA method is optimal for every problem and different methods will often
produce different results for the same problem. The differences are more prevalent
when there are greater alternatives with similar criteria values for those alternatives.
Their work serves as an early guide for quantifying social data and implementing spatial
comparative analysis.
While not specifically used in a military conflict specific domain, SDSS has been
used for a variety of emergency planning, emergency response, public health, and
hazard material mitigation situations. Such applications include Urban Search and
Recuse by Heth et al. in 2006, Epidemic Disease Prevention by Yang et al. in 2006, and
Guarnieri and Wybo’s 1995 ‘Wildland Fire Prevention and Fighting’ model implemented
in a GRASS (an Arc-GIS precursor).210 Researchers in England designed a SDSS for
emergency evacuation contingency planning that combined simulation techniques with
the spatial data management and display capabilities of a GIS.211 It linked together the
geo-topographical support and analysis capability provided by the GIS-ARC/INFO
program, with a model simulation designed to approximate the detail dynamics of an
evacuation process. The aim was to design a SDSS to provide an interactive
evacuation simulator with dynamic graphics allowing for experimentation with policies
by providing rapid feedback from the simulation. The purpose was to allow emergency
planners to use the SDSS for experimentation with emergency evacuation plans for
different contingencies. Key within this research was emergency evacuation that

66
involves addressing both logistical and behavioral issues influencing evacuation
operations. Two decision making streams occur in parallel during an evacuation. One
stream concerns the actions of the authorities, those managing the evacuation
operation. Another is the actions of individual evacuees. The behavioral issues
encompass the difficulties that arise due to the discrepancy between the two action
sets. The SDSS named the ‘configurable emergency management and planning
simulator’ (CEMPS) was designed for planning evacuation contingencies rather than
actual emergency management event execution. The simulation model is
parameterized based upon data from the geographic database. While simulating the
behavior of evacuees on the road network heading towards safety shelters outside the
danger zone, it also provides tools for stakeholder progress querying during the
simulation. The traffic load estimate on a road segment or the number of evacuees
reaching a selected safety shelter are available during various phases of a simulation
for policy and procedure evaluation. The approaches to traffic model design depends on
the geography of their intended application and the details required in modelling the
travelers’ behavior within the system. There are three basic categorization for network-
based traffic simulation models - micro, macro, and meso, This is based on how they
attempt to model the behavior of evacuating entities. Micro-simulators track the
movement of individual vehicles within the simulation. Macro-simulators are directed by
a fluid dynamic flow- like model. Meso-simulators attempt to combine the best of both
micro- and macro-simulation by simulating ‘formations’ of vehicles within the network.
The CEMPS traffic simulation model was designed as a micro-simulator of the
evacuating entities simulating the behavior of each individual vehicle as it moves from

67
the danger area to shelters outside the danger zone. Key to this research is the
concentration on the design of a functioning integration interface between the GIS and
the traffic replication model, or in other words, concentration on the DMC and MMC.
Related to emergency response uses, disaster relief and post-disaster activities
such as debris removal, search-and-rescue, and relief transportation have benefitted
from SDSS. Specifically, research on support to post-disaster debris operations
presents a decision-support tool to aid disaster and waste management government
officials with the collection, transport, reduction, recycling, and disposal.212 Post-disaster
debris hinders relief efforts and results in problems including economic, environmental
and health issues. The post-disaster tool enabled optimization and balance of financial
costs, environmental costs, removal operations duration, landfill usage, and recycled
material volume generation. Designed to support post-disaster operational decisions as
well as an aid in developing strategic disaster preparedness plans, the tool is presented
as a DSS that utilizes Google Maps Image APIs to present maps for input and solution
visualization. While not specifically using the spatial analysis capability of a GIS, the
mathematical model developed includes consideration of spatial variables such as the
usable area of landfills and locations of both debris and disposal sites used as inputs for
transportation time calculations (in terms of days). The objective function is designed to
minimize the weighted sum of financial costs, collection time, approximate disposal
time, debris amount sent` to landfills, environmental impact penalty costs, and recycled
debris revenue. The objective function is bounded by upper bounds for financial costs,
collection duration, disposal time, space used in landfills by disposed debris, and
environmental costs while the lower bound is represented by maximizing revenue
68
obtained from recycled and reused debris. Despite the listing of this tool as just a DSS,
it does contain all of the components of a SDSS despite only minimal focus on DBMC
development and a greater preponderance of focus on the dialog management,
stakeholder, and model management components (abbreviated DMC, SC, and MMC,
respectively).
Use of SDSS for business applications are prevalent in issues of retail site
selection, industrial location planning, tourism planning, consumer behavior analysis,
and investment analysis. One example of a marketing decision making process in the
selection of supermarket locations is the marketing exercise conducted in Sivas City,
Turkey.213 Sivas City was selected due to the ease of both participants access and data
gathering from the Sivas’ census bureau. The units of analysis were the city’s districts.
The study’s purpose was to emphasize the importance of food, health, and education
consumption expenditure maps that identifying significant factors important to investors
and marketers in determining optimum sites. In this situation data integrating occurred
within a GIS environment. Kotler presented use of a general marketing information
systems model with sub-systems similar to the structure for SDSS.214 The four sub-
systems consist of a research system, an intelligence system, an internal records
system, and a decision support system. A firm’s research system is germane to the
marketing research process. The intelligence system is the data gathering function
associated to the exterior marketing environment. The internal records system is the
data gathering function related to internal issues such as costs, revenue, and cash flow.
Both datasets (information sets) are stored in a database. Together they approximate
the SDSS’ DBMC. The decision support system is, in turn, germane to the marketing

69
manager’s analysis and decision making processes. The statistical and decision models
are synchronized together within this system in order for the company increase
effectiveness and efficiency in both the internal and external marketing environments
tracking process. This serves as the SDSS’ MMC. The company utilizes the acquired
information toward marketing strategy development and marketing planning processes
developed through the marketing decision support system, thus approximating the
SDSS’ SC.
The Sivas City supermarket location study focused on the marketing intelligence
and marketing decision support sub-systems that analyze data and information related
to the external marketing environment.215 These sub-systems, as part of a process, can
be likened to the collate-process-analysis/evaluate steps of the CIM process. Since the
extent of a consumer market is measured in demographic, geographic and economic
terms, the study focused on analyzing these factors as they exist within macro
environments. The ‘fusion’ of the marketing strategy development and marketing
planning process within the decision support system is a precursor to the type of social
data integration desired for CIM and the Stability COP. Conducted in two rudimentary
stages, the initial research stage was the data collection procedure using primary and
secondary data. Primary data was collected through questionnaires. The secondary
data was acquired from the Census Bureau of Sivas, Turkey. The two-part survey
questionnaire began with questions gathering demographics (incomes, household
residency count, etc.). The second survey portion inquired about consumption levels of
items to include education, health, and clothing. The second stage consisted of data
analysis using GIS to produce consumption and optimum location maps. The ‘Optimum
70
Location’ was a user interface program developed to determine the best spatial location
of market organizations, such as shopping centers, supermarkets, and clothing
stores.216 The optimum geographical location was determined by combining population,
mean income, and the level of monthly mean average consumption in the districts. The
program calculated the means of the related consumption types in all districts and then
identified specific district(s) having the highest mean consumption level taking into
account the mapped population and the district(s), and also displaying count of related
districts in a message box.217 Using an interface program, the ‘Determining the Optimum
Location’ query is performed post the selection of the investment type (shopping center,
supermarket etc.) and relays the circumstances related with population. The related
districts are automatically determined and shown on the map and the number of related
districts is then displayed in a message box.218 The study delivered substantial analysis
regarding Sivas City through the user interface programs created to perform certain
given operations such as spatial analysis, queries, and documentation performed
automatically. The entire process was structured off of Kotler’s marketing information
system model. The two marketing sub-systems (the research and the decision support
systems) of this model were systematically conducted. The ability to receive precise and
actionable information helps retail firms make marketing decision systems efficiently
and effectively. The model can assist a firm to both easily and quickly make objective
decisions without bias.
The United States Army Reserve (USARC) has used SDSS, not for tactical nor
operational level analysis within a conflict OE, but for the desirability evaluations and
comparisons of potential USARC unit sites.219 The ‘Army Reserve Installation

71
Evaluation System’ (ARIES) SDSS was developed in 1996 in order to deal with
operational readiness (trained and prepared manning) reserve units scheduled for rapid
deployment. The ARIES application integrated a multiple criteria “Army Reserve unit-
decision model” (ARU-DM), multiple Army Reserve data sources, and a GIS model into
a SDSS. ARIES was based upon a module-based development heuristic, Concept-to-
Code (C2C), and domain-explicit architectures. The design heuristic provided a
organized means to support the end users in developing the desired system, facilitating
creation of a data migration warehouse and integrating the SDSS application into the
existing USARC Headquarters information technology infrastructure. The overall
objective of site desirability was identified by twenty measurable decision parameters
and collated into three major categories: places, people, and things. The reserve unit
metrics had to be calculated directly from data sets accessible from the USARC local
area network (LAN) and the proposed site location referred to a 50-mile region within
the proposed site’s zip code center (centroid). The relocation decision model (i.e., the
MMC) was structured into a hierarchy of goals using Multi-Attribute Utility Theory
(MAUT).220 The MAUT model is a Full Aggregation model akin to AHP that utilizes
economic utility functions to measure the preference of various alternatives.221 ARIES
represents one of the few attempts by the U.S. Army to use SDSS. In this attempt,
however, the decision parameters under analysis did not include any socio-economic
variable, which may have been germane to the unit location selection process.
Research demonstrating a spatially statistical oriented MMC was conducted by
Sejwal, Jangra, and Sangwan.222 This paper proposed a SDSS using spatial outliers for
strategic industry foothold establishment analysis. More specifically, the analysis helped

72
to eliminate locations less optimal for the needs of the industry. Spatial outliers are
spatial objects with features statistically dissimilar from their surrounding neighbors.223
Spatial outlier detection techniques aid site selection decision makers by evaluating
locations from several variables. Using two different spatial outlier detection algorithms,
sites deemed most unsuitable for industry establish are distinguished. The two spatial
outlier detection algorithms used Mahalanobis distances - the measure of the distance
between a point’s value and the number of standard deviations of the mean of a
distribution - to find most inappropriate sites from a multiple attribute spatial dataset.224
One algorithm was based on neighborhood averages of the attribute values. The other
was based on the median attribute values. As an important factor facing firms (national
and international), industrial location establishment required managers to analyze large
amounts of information regarding an available list of sites to include the critical factors of
industrial location: rival markets, electricity, labor, raw material, transportation, tax
structure, government policies, etc. Sites determined unsuitable (spatial outlier sites)
were completely eliminated from the decision making process. Outlier identification
algorithms were applied to find such unsuitable locations. The multivariate spatial outlier
detection algorithms were used to establish how an information technology industry may
be improved by analyzing large numbers of locations which are spatially arrayed. The
proposed system is appropriate when large numbers of spatial items are distinguishable
by non-spatial attributes. The critical factors affecting the successful operation of an IT
industry were identified as availability of skilled labor, communication, transportation,
access to latest technologies, availability of projects, electricity, medical facilities, and
basic needs. Analysis conducted on a sample dataset of fifteen different sites located

73
at different regions presented the outliers using mean and median algorithms in
separate runs. Presented graphically, the identified sites are the ones where it is risky to
establish an information technology firms. There are two conclusions by Sejwal et al.
applicable to this study. The first is that the SDSS MMC can be improved by selecting
more efficient spatial outlier identification methods. The second is that SDSS can be
useful in other real-life applications including agricultural, financial, and demographic
survey decisions.225 It is from these two points that the use of Treviño’s conglomeration,
content analysis data, and demographics/socio-economic issues converge for the
Stability COP and CIM.
6.2 Civil Information Management (CIM) History
The title of ‘Civil Information Management’ is actually a misnomer based upon its
definition. The main basis for CIM is embedded in knowledge management (KM). As a
business concept, KM is the process of maintaining and utilizing a firm’s information by
integrating its employees’ professional experience and understanding.226 The formal
studies of KM and organizational design truly gained focus with the research by Drucker
in 1988, with his study of firms’ movement to information based organizations and
employees specializing in knowledge development and management.227 Embracing
knowledge management as a discipline in 2003, the U.S. Army’s perspective of KM is
“process of enabling knowledge flow to enhance shared understanding, learning, and
decisionmaking”.228 Army KM provides commanders with the knowledge and
understanding to make decisions. Staffs, using various techniques, practices, and
procedures piece together data and information and produce knowledge through
analysis and evaluation. Staffs provide collective actionable knowledge to the

74
commander, who in turn applies judgment to transform actionable knowledge into
understanding to base a decision.229 In other words, it enables action. As presented in
the ‘Statement of Problem’ section of this study, knowledge is derived from information
which, in turn, is derived from data. This process develops new knowledge, and
combines, restructures, or repurposes existing knowledge in response to knowledge
gaps. This is seen as ‘knowledge creation’. Table 1 shows an example of military data
becoming knowledge, giving note to the relationships occurring during the
transformation. The act of processing (step three of the CIM methodology) transforms
data into information. The act of cognition (analysis and evaluation, step four of the CIM
methodology) transforms information into knowledge.
Example of Military Data Transformed into Information and Knowledge230
Table 1
This discussion on ‘military knowledge management’ is critical when compared to
‘military information management’: “the science of using procedures and information
systems to collect, process, store, display, disseminate, and protect knowledge
products, data, and information and knowledge products”.231 Information management is
not focused on the transformation of data to knowledge, just the provision of a structure
for commanders and their staffs to process and transfer information for decision making.
While effective information management is necessary for knowledge creation, it is not
sufficient to fulfill knowledge management.

75
Initial attempts were to place CIM as a subcategory of military intelligence,
especially when dealing with irregular warfare (IW). Theorists and practitioners of IW
realized the criticality of understanding the civilian population to the success of a
campaign, but equated as part of traditional intelligence.232 Yet, Lindenmayer notes that
“[military] intelligence organizations frequently do not dedicate enough effort to support
the process of integrating unclassified civil information (e.g., religion, values, economy,
infrastructure, etc.) into the intelligence picture presented [to a military commander]”.233
While CA and special operations units focus on civil information requirements, these
unit’s tactics, techniques, and procedures (TTPs) have not historically been part of
conventional forces doctrine, causing the development of ‘one-off’ non-doctrinal
organizations in an effort to integrate social, economic, and cultural data and
information into MDMP. The situation, caused partly by doctrinal and cultural resistance
to socio-eco-culturally based analysis in the military intelligence branches and
encompassing the entire the DoD, is the basis for ‘big tent’ approaches that incorporate
the civil information gathering organizations and intelligence analysis agencies. This
Civil Information Fusion Concept (CIFC) proposes a framework to merge Civil-Military
information and intelligence.234 The main goal of the CIFC was to change an otherwise
stove-piped information sources environment so organizations and agencies can
collaborate and consolidate; becoming a force-multiplier through flattening operational
channels and developing a culture of sharing civil information. It is modeled from best
practices and lessons learned from various military commands and missions to include
the International Security Assistance Force (ISAF) Joint Command (IJC), Stability
Operations Information Centers (SOICs), United States Africa Command

76
(USAFRICOM), and the United States Southern Command (USSOUTHCOM) Haiti
Humanitarian Assistance and Disaster Relief (HA/DR) efforts. These organizations
conducted missions focused on Stability Operations and needed to civilian population
information requirements integration into the intelligence and operational planning
cycles.235 Listed criticisms to the CIFC concept included military intelligence’s
involvement in the collecting and managing of unclassified civil information
(conventionally a CA domain) for Combat Operations purposes and not for Stability, the
use of intelligence personnel to conduct reporter/sociologist style interviews, and the
wide spread acceptance of a framework allowing intelligence personnel working in
collaboration with all available colleagues (coalition, host nation, and NGO
personnel).236 The overarching theme in the list of criticisms is the involvement of
intelligence agencies in the collection and analysis of civil information, a situation that
presents negative perception issues with the available partners desired for creation of a
collaborative environment and skewed the analysis focus away from Stability concerns.
What Lindenmayer does not address is how the information is analyzed. The difficulty
with the lack of analysis has been already addressed within this study in the referenced
articles by Flavin and Schroden.
Within the U.S. Army Civil Affairs community, one of the earliest CIM execution
and development systems was the Civil Affairs Knowledge Management System
(CAKMS).237 A prototype civil information management that combined GIS capability
and decision support systems, it was developed to assist commanders in civil military
operations planning, executing, and assessing. The project began in the winter of 2003
as preparation for the deployment of the 350 Civil Affairs Command (350 CACOM). The
77
study of CAKMS by McQueen, Vialle, and Sullivan states that main concern of the 350
CACOM was the development of a civil COP methodology supporting military
operations in Iraqi. The primary goals of CAKMS were the development of an interface
for allowing users to geospatially view data and create map-embedded reports, and the
enablement of soldiers and leaders to geospatially analyze the civil-military situation
toward a more effective humanitarian aid response within an assigned area of
responsibility in the work.238 The intent of the database solution was to receive and
format information from existing off-line data collection tools, analyze for trends using
off-the-shelf GIS tools, and provide access through a web-based application. Key to this
was the performance of the processing and display of the civil-military COP overlaid on
a digital map or image and generation of standardized summary reports of collected
civil-military data. The conceptual framework developed for CAKMS was focused on
optimization of civil information flow, greater project data integration and de-confliction,
and automation collection and management of critical spatially-related data toward
leveraging for intelligence and civil military operations purposes.239 An important factor
was the idea of ‘GIS Informed Operational Design’. This is based upon the concept of
Operational Art – a cerebral approach by commanders and their staffs to: understand
the OE; frame ill-structured and complex problems; and design broad operational
approaches giving direction to planning.240 The need to implement this cognitive
approach requires understanding of Operational Design.
Operational design provides a creative methodology helping commanders
comprehend the operation’s context, develop an approach to surmount problem set
issues and establish conditions for achieving objectives that develop the desired end

78
state. It is essential toward creation of a common perspective and shared OE
understanding. Design (in military context) is the product of the converging trends of
complexity theory and new insights on social behavior on the military art.241 Through
leveraging the analysis capabilities of GIS, the traditional understanding of locational
geography is supplemented with a synthesis of the social, cultural, and economic
factors comprising human geography. Design based upon a COP enhanced by
demographic, economic, social and political activity, geospatial information trends
supports the requirements to develop a detailed understanding of the operational
environment.242 While championing the capability of a Stability COP, the CAKMS
program provided very little discussion on the methodology for conducting an integrated
analysis of designated Stability Operational factors for decision making purposes.
Additionally, Madera discussed in 2005 the role that CIM can play within
counterinsurgency.243 While recognizing that insurgency is a multidimensional
phenomenon, his research focused on the interaction between the human and physical
dimensions of geography. He states that while it was not an attempt to generalize this
interaction as the main factor of insurgency, the spatial analysis did not probe
profoundly into the greater geopolitical, macroeconomic, cultural, and psychological
issues involved in counterinsurgency. Specifically, his study focused on framework
provision development for understanding the interaction between the physical and
human factors relevant to assessing the usefulness of counterinsurgency efforts by the
Government of Colombia.244 While discussing the linkage between application of GIS
and increasing understanding concerning psychosocial, economic, and demographic
factors in counterinsurgency analysis, he proposed further research be conducted. Yet,

79
it was not specific on what methodological direction a GIS analysis based program
should take.
The Human Terrain System (HTS) was one of the attempts to integrate social
science and geographical analysis into the intelligence process. The concept was
developed by Montgomery McFate and Andrea Jackson in 2005.245 Initiated in 2007, the
United States Army, Training and Doctrine Command (TRADOC) supported program
hired personnel from the social science disciplines in order to provide military
commanders and their staffs with an understanding of the local population (i.e. the
‘human terrain’) within an OE. The overall goals of the pilot program were to:
• Produce training products and courses
• Populate analytical frameworks
• Prove the importance of social science research methodologies to operations
• Establish a center of excellence
• Create a staff of social scientists to perform operationally relevant social science research
• Provide development advice for TTPs, SOPs, doctrine, and PME 246
One of the key projects/products for development out of the HTT was a ‘Cultural
Preparation of the Environment’ (CPE), a comprehensive and continuously updated
database for use by maneuver commanders and their planning staffs. The database
included map overlays of tribes, religions, and demographics points and areas of
concern. The HTS connection to intelligence was primarily due as a response to the
Iraqi improvised explosive device (IED). The thought by some tactical commanders was
to get into the heads of tribal leaders and insurgent foot soldiers and deter them from
planting IEDs. At the operational and strategic levels of the Army, the Marine Corps,
and the DoD, there was a desire to find a way to insert cultural competence into training

80
and education. Despite having CA components in the Army and Marine Corps as well
as (not to mention Foreign Area Officers [FAO] and Psychological Operations soldiers
[PSYOP]), cultural competence was seen as lacking within intelligence and operational
capabilities.247 Yet, this effort to ‘bring in outside help’ fell short of the goal.
In his 2018 Military Review article, Connable listed multiple parallel narratives
describing the HTS initial emergence and ultimate demise. While the organic
(CA/PSYOP/FAO) versus external (HTS) debate was the foremost narrative, one less
publicized but equally important narrative was the difference between intelligence
experts focused on threats and killing, and those focused on cultural understanding.
While maintaining cultural competence, amassing and analyzing cultural information,
and advising the commander on cultural issues were supposed to be part of the military
intelligence community collective duty, the community did not have the capability to
meet any of the requirements the during both the Afghanistan and Iraq wars.
Intelligence was, and still is, designed and developed to warn of impending attacks and
find enemy formations. In addition, irregular warfare requirements led to the
development of high-value targeting capabilities. Intelligence was at the heart of the
intensive, ongoing effort to find, fix, and finish insurgencies and terrorists. 248 While
necessary for Combat Operations, this is not sufficient for Stability Operations.
Connable recognized that the two primary components of HTS (the teams and
the reach-back knowledge [analysis] center) are needed. While the team component
can be generated from the FAO, CA, PSYOP, human intelligence, and special
operations communities in the military, Connable suggested analysis be supported by
holistic, culture-inclusive military intelligence analysis; however, the various attempts to

81
‘integrate’ cultural analysis as a subset of intelligence repeatedly led to dismissal
analysis at best, or total obliviousness of the cultural component at worse.
From November 2008 through June 2011, the Joint Civil Information
Management (J-CIM) Joint Test program developed a guide designed to fill a doctrinal
gap for CIM. It resulted from a requirement for effective civil information sharing in
support of commanders and senior leadership decision making during Stability,
Security, Transition, and Reconstruction (SSTR) operations and HA/DR operations
conducted jointly by the DoS and the DoD. The lack of standardized CIM procedures for
collecting, consolidating, and sharing civil information was identified as the major limits
to operational planning capability.249 The J-CIM program standardized and codified four
of the six steps of the CIM process - collection, collation, production, and dissemination;
but not process and not analysis. While highlighting several analytical methods for use
in understanding the civil components of the operating environment, the training of
analysts was beyond the scope of the J-CIM Tactical Handbook and discussed in
generality within the J-CIM User Manual (the two main products of the J-CIM project).250
Subjects referenced in include: MOEs and MOPs, Geospatial Analysis, Targeting
Analysis (CARVER vulnerability analysis and MSHARPP forces protection
assessment), and Time-Series Analysis. The proponents of the J-CIM test (United
States Special Operations Command - USSOCOM) sought a follow-on joint test for the
analysis step, but this did not receive enough support.
In May 2010 the ‘Mapping the Human Terrain’ (MAP-HT) system was sponsored
by United States Central Command (USCENTCOM) as a limited Joint and Service
integrated capability gap. Designed to provide tactical and operational commanders with
82
improved capabilities to better integrate civil and socio-cultural information (stylized as
human domain information) into the MDMP, it was an attempt to facilitate the CIM
process within a commander’s area of operations (AO).251 This handbook served not as
a technical manual for the MAP-HT computer system, but as guide for tactical and
operational level CIM processes. Yet, the authors limit the scope of the document to
four out of the six elements of CIM, with analysis as one of the ‘specialty fields’ outside
the scope of the handbook.252 While the handbook did not focus on how to conduct the
analysis step of the CIM cycle, it did provide techniques and best practices for
accomplishment of other portions of the cycle. The presentation of analysis technique
concentrated on non-spatial analysis tools. Geospatial techniques consist of relatively
elementary functions to the causal GIS users (emplacing point data, buffering,
choropleth mapping). However, it does address the depiction of a Stability COP which
illustrates civil considerations from a layered perspective. The model stated as the ‘Dr.
Griffin model’ postulates a series of questions as a structured approach to developing a
meaningful understanding of an AO for commanders.253 Layer One asks, ‘What are the
meaningful social groups to which people belong?’ This concentrates not only on the
spatial identification of social, tribal and ethnic groups of influence, but also the
dynamics of the social groups that have an impact on the motivations of the populations
in which commanders operate. While the location is geo-referenced, under the Griffin
model the dynamics are displayed via a Social Link Diagram, an analysis tool enabling
determination of the relationships between various groups within an AO.254 The two
perspectives allow a joint depiction of the different groups that exist in the AO and
location of spheres of influence (geographic), the size of the groups and common

83
beliefs in the group (attributes of the geographic data), as well as the relationship they
have to each other and group rivalries (link). Layer Two asks ‘Who leads these groups
in the community; for what issues or domains do they have authority?’ Again, a social
link diagram is used to display this layer. Layer Two is not referenced within a spatial
context.255 The key question for Layer Three is ‘What are the hierarchy of needs for the
local populace overseen by that leadership?’. Beyond understanding what are the basic
[public goods] needs of the people, and the local government‘s ability to handle them,
this layer also attempts to identify outside organizations’ abilities to help with available
resources to address the needs of the local communities and build capacity in local
governance; gaps in local, international, and national resources to handle potential
humanitarian crisis; and most vulnerable communities within the AO.256 While the
information for this layer is referenced within a spatial context, each public good element
is mapped separately under the Griffin model. In fact, each of the ‘three layers’ is not a
functioning layer in the GIS/spatial analysis sense. The developed information from the
three was incapable of spatial integration. The methodology within the MAP-HT
Handbook went the furthest in attempting a Stability COP, but still fell short of spatially
integrating the various factors.
In 2012, Hanhauser advocated for a different use of existing capabilities toward
the generation of a collaborative CIM and development of a Stability COP.257 While the
concentration of his Army War College paper is on how the Stability COP is different
and need for collaborative civil information sharing, he presents points applicable to the
discussion of CIM spatial analysis. First, the local level is both the greatest resource and
consumer of civil information. This is due to the fact that needs, context, and effect are

84
all locally derived.258 Second, the various systems in use for CIM concentrate on data
exchange and not content or analysis exchange; it is at best information without
knowledge. He highlighted that the gathered information never serves a larger
purpose.259 His third applicable point is that even when the information is accessible, the
lack of real context and useable [spatial] formatting makes a comprehensive civil
common operating picture supporting appropriate decision making and action
unobtainable.260 Hanhauser’s work does not directly address the issues of how to
conduct analysis, spatial or otherwise. Yet, the emphasis on ‘what products must be
delivered and how’ instead of ‘what system should deliver information’ serves as a
guide toward the need of an effective spatial analysis for the Stability COP and Stability
Operations in general.
A team of cadets and their instructors from the United States Military Academy
(West Point) developed a tool to drive data collection methodology by U.S. Army Civil
Affairs Teams and Security Force Assistance Teams, combine it with open source data,
and conduct initial analysis and data visualization. Conducted in 2014, the intended
audience were military commanders from Brigades up to and including Combatant
Commands.261 Using a risk framework developed by U.S. Pacific Command’s
(USPACOM) Socio-cultural Analysis Team, it views regional, national, and sub-national
Stability environments through analysis the framework’s five primary pillars:
humanitarian crisis, outlier and recalcitrant states, regional power balancing, economic
insecurity, and violent extremism. While stating all of five primary pillars, their research
focused on creating a comparative index for the violent extremism pillar. They
conducted two methods for creating a single index to measure violent extremism. The

85
first method involved normalizing both a percentile rank and a ‘one-thru-five’ scale
survey responses, and then summing them with a weighted additive value model. The
second method used Principal Component Analysis (PCA) to generate a single index.
The PCA transformed the original set of indicators into an orthogonal variable set (the
principal components). By only using the first principal component (the first principal
accounting for the greatest share of variable variance), a single index is created from
multiple indicators. These methods used both human data collection and open source
data assisted leaders in understanding stability in a designated OE. Both methods
made use open source big data (GDELT) to meet information requirements.
Additionally, the methods limited the information requirements of data collection teams,
while also providing them with relevant national and regional data to assist in
extrapolating information to the sub-national level where necessary.262 While the West
Point study did develop methods for incorporating content analysis data applicable for
Stability Operations, it did not develop a way of integrating the USPACOM’s five pillar
risk framework either spatially or any other manner.
One attempt to concentrate on an integrated view of the Stability OE is the
“MANeuver in N-Dimensional Terrain” or MAN^N. This attempt involved mapping
synchronized maneuver operations in a multi-dimensional terrain intended toward
achieving a position of advantage in massing effects (i.e., aggregating and
synchronizing overwhelming power at a location place and period). The MAN^N
methodology generalizes spatial-temporal-centric maneuver concepts and identifies the
forms of contact that extend across many domains including PMESII. MAN^N is
designed to be complex, dynamic, adaptive, and distributed.263

86
MAN^N Spatial Analysis Conceptual Example264
Figure 10
The basic concept illustrated in Figure 10 is that various dimensions of an OE translate
to the dashed lines joining the different dimensions representing interactions between
the dimensions. Respective dimensions provide objectives conferring a position of
advantage that allows commanders the capability to analyze how to combine effects
across these dimensions. MAN^N, originally designed toward Counterinsurgency
(COIN) analysis, was proposed as proactive slant incorporating all essentials elements
of national power from the strategic through to the tactical level. This methodology did
address issues of integrated analysis to include spatial and temporal issues, but the
emphasis essentially ends on what inputs can be used and not how to conduct the
integrated analysis.
The current Civil Affairs Civil Information Management Army Techniques
Publication (ATP) was published in 2013 and delineates the collection – collation –
process – analysis [and evaluation] – production – dissemination methodology. Both the
‘Processing’ and ‘Analysis’ sections of the ATP (chapters five and six respectively)
reference the use of GIS to cognitively manipulate separate pieces of civil data into civil
information265 and to map the interrelationships of operational variables, current situation
and their combined impact on the civil component.266 In describing the use of spatial
analysis, the ATP states that by breaking down the civil component by operational

87
variables, each variable can be used separately of the others to establish specific
indicators of instability and then these separate variables, in the form of spatial layers,
can be stacked together to identify complex relationships and reveal how these
components jointly impact the OE.267 The ATP does not, however, discuss a
methodology for achieving analysis and evaluation. At best, the publication
concentrates on the spatial analysis of the “physical environment is referenced to form
the COP”.268 Additionally, inputs such as key leader engagements (KLEs), civil
geography mapping, and collecting of civil component reports [SITREPS] conducted by
maneuver units, coalition and allied partners are raw CIM data that often are not
inputted into a database for a proficient staff officer or NCO to collate, analyze, and
produce recommendations for potential action.269 While a revision of this ATP occurs at
the time of publication of this study, the lack of spatial integration and analysis of socio-
economic data/information prevents true Stability COP development and hence leads to
an incomplete assessment for Stability Operations.
6.3 Review Results: Intersection of SDSS, CIM, and Stability COP
The review of the publications concerning SDSS, the history of the application of
CIM, and the current methods of COP establishment was able to discover the extremely
limited application of SDSS toward military analysis in general and none to the
establishment of a Stability COP specifically. This identified knowledge gap highlights
an established need for research in analysis methods for Stability Operations. Because
of the needed ability to conduct judgments under ill-structured scenarios with both
qualitative and quantitate data, methodological examination of SDSS implementation
combining the use of content analysis of data, EDA and ESDA techniques, and MCDA

88
is justified. While this study falls within the wider disciplinary discussion of SDSS’
application, it is unique due to its domain application, military Stability Operations. The
research question of how SDSS can establish a Stability COP and provide analysis for
Stability Operations is an approach that differs from other that of scholars determining
how to conduct a geographically integrated analysis of socio-economic factors.
7. METHODOLOGY
This research establishes how to develop an SDSS Model Management
Component (MMC) for use in military Stability Operations. This requires
interconnectivity between written reports from the field, coding of the qualitative data for
quantitative use via a specified framework, statistical and spatial analysis of the
quantitative data, then use statistically and spatially analyzed data within a decision
matrix. The GDELT dataset provides a proxy for the field reports and, while initially
converted from qualitative to quantitative data by use of content analysis during the
GDELT process, requires additional coding for use in this study. Upon recoding using
the PMESII operational structure, a collection of statistical and spatial analysis is
conducted under a collective analysis method called Treviño’s Conglomeration. The
Conglomeration method is modified from Treviño’s original technique in support of this
research. Finally, the Conglomeration analyzed PMESII operational variables are used
as decision criteria within an Analytic Hierarchy Process (AHP) to complete decision
matrix. Due to the nature of data collected for decision analysis during Stability
Operations, this SDSS MMC is the synergetic fusion of multiple analysis functions as
opposed to a singular one. The organized parts of the gestalt are explained in the
following sections of the methodology.

89
7.1 Re-coding of the GDELT Data
While the action attributes NumArticles and AvgTone are used for the PMESII
variables, the current coding scheme used within GDELT is not PMESII. GDELT data
entries are formatted using the Conflict and Mediation Event Observations (CAMEO)
event coding taxonomy. Fortunately, the CAMEO coding taxonomy is readily ‘re-coded’
to conform for use in the PMESII analysis framework. This is done by identifying key
words and phases of the PMESII variables with the event code description attributes of
the GDELT database. The Political variable examines the formal and informal
distribution of power and responsibility through the entire spectrum of governance, in
addition to covert political powers. The Military variable examines the military (including
paramilitary and security) capacities of relevant enemy, friendly, and neutral actors
within a given OE. The Economic variable examines the individual and group activities
of producing, distributing, and consuming means. Social describes the population’s
cultural, religious, and ethnic composition and the beliefs, customs, and values within an
OE. The first ‘I’, Information, examines the environment, span, and features, and effects
of people, organizations, and systems collecting, processing, disseminating, or
otherwise acting on media, public communications, and public perceptions. The second
‘I’, Infrastructure, examines the basic facilities, services, and installations needed for the
functioning of a community or society. 270 Each of the eight operational variables also
has associated sub-variables. Table 2 provides examples of sub-variables for
consideration within each operational variable. Using these sub-variable lists as a guide,
GDELT-to-PMESII ‘Crosswalk’ queries were established in Microsoft Access and used
to implement the recoding procedure.

90
PMESII Sub-variables271
Table 2
The variables entitled ‘EventCode’, ‘EventBaseCode’, and ‘EventRootCode’ are aligned
with the PMESII categories. This re-coding process does not affect the values of the
NumArticles and AvgTone attributes. Not all for the entries from the September 2008
GDELT database are used. The GDELT-to-PMESII ‘Crosswalk’ Structured Query
Language (SQL) database query program script for each operational variable are
provided in the appendix.

91
7.2 Conglomeration in the MMC
The following is an example of how Treviño’s Conglomeration is conducted in the
initial part of the Model Management Component or MMC. For the purpose of this
research, events at municipal/city/town level within the country of Iraq during the month
of September 2008 are examined. For this example of Conglomeration, the event
actions under analysis are those corresponding with the Economic operational variable.
A spatial depiction of the Economic operational variable observations is presented in
Figure 11.
Map of Economic Operational Variables
Figure 11
Two event action attributes are used for this analysis, NumArticles and AvgTone.
NumArticles, the total number of source documents with at least one mention of an

92
event, assesses an event’s importance. The count/amount serves as an indication of
magnitude. AvgTone is the average tone of all documents containing at least one
mention of this event. While the scores can potentially range from -100 (extremely
negative) to +100 (extremely positive) with a value of zero denoting a neutral tone, the
range for the Economic Iraqi subset is from 0 (neutral) to 12.14. Tone is an assessment
of the importance of an event, serving as a proxy of event impact an indication of
intensity.272 The combination of geography, time frame, and variable selection results in
258 observations for analysis.
7.2.1 Descriptive Statistics and Normality Tests
The analysis begins with a calculation of mean, median, standard deviation, and
skewness of the two variables. Treviño begins with exploratory data analysis (EDA) to
verify that the data set is normal distributed. This analysis was calculated using SPSS
24 and Microsoft Excel 2013. NumArticles has a mean of 5.79, median of 2, standard
deviation of 13.98, and skewness of 7.38. Since skewness describes the degree of
asymmetry of a distribution about its mean, the relatively high positive value indicates
an asymmetric distribution with a tail extending toward the right (i.e.: toward more
positive values). The equation for skewness is defined as . This
skewness value is greater than 1, indicating positively skewed distribution. Figure 12,
produced using SPSS 24, graphically shows the shape and degree of skewness.

93
Economic NumArticle Histogram
Figure 12
AvgTone has a mean of 4.65, median of 4.75, standard deviation of 1.76, and skewness
of .13. This skewness value is between -1 and 1, indicating a relatively normal
distribution (Figure 13).
Economic AvgTone Histogram
Figure 13

94
To continue the exploratory analysis of the two variables in question,
identification of the ‘value spread’ and the outliers for each data set is required. A ‘Box-
Plot’ analysis was conducted using Microsoft Excel 2013 and GeoDa 1.4.3 graphics for
both NumArticles and AvgTone. The key components of a Box-Plot analysis are the
median, the first and third quartiles (Q1 and Q3 respectively), the interquartile range
(IQR – a measure of the range between Q1 and Q3), and the ‘whiskers’ (demarcation
lines on the end of Q1 and Q3). From this, any value less that the value Q1-1.5x(IQR)
or greater than Q3+1.5x(IQR) is classified as an outliner. For NumArticles, the critical
values are median: 2, Q1: 1, Q3: 5, IQR: 4, lower whisker: -5, and upper whisker: 11.
Given these values, the NumArticles dataset has 15 positive outliers and zero negative
outliers. This further supports the finding of positive skewness. (Figure 14)
Economic NumArticle Box Plot
Figure 14
For AvgTone, the critical values are median: 4.75, Q1: 3.46, Q3: 5.69, IQR: 2.13, lower
whisker: 0.36, and upper whisker: 8.89. Given these values, the AvgTone dataset has
three positive outliers and one negative outlier. This further supports the finding of a
normal distribution (Figure 15).
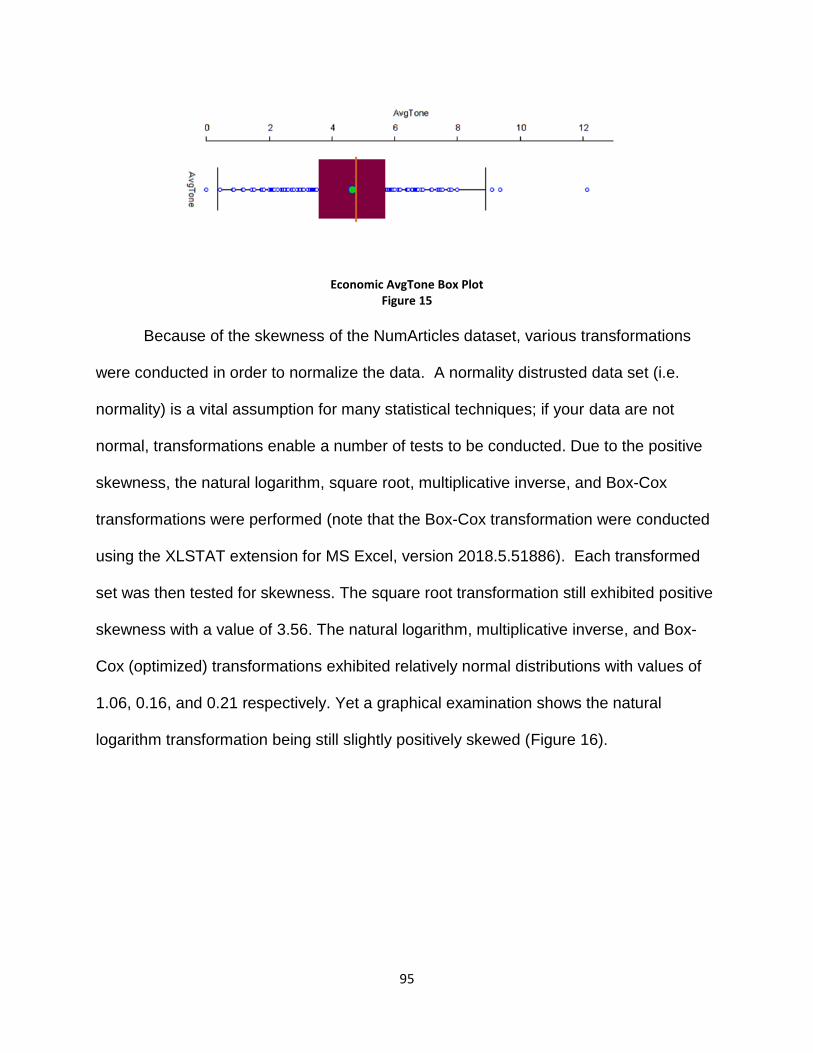
95
Economic AvgTone Box Plot Figure 15
Because of the skewness of the NumArticles dataset, various transformations
were conducted in order to normalize the data. A normality distrusted data set (i.e.
normality) is a vital assumption for many statistical techniques; if your data are not
normal, transformations enable a number of tests to be conducted. Due to the positive
skewness, the natural logarithm, square root, multiplicative inverse, and Box-Cox
transformations were performed (note that the Box-Cox transformation were conducted
using the XLSTAT extension for MS Excel, version 2018.5.51886). Each transformed
set was then tested for skewness. The square root transformation still exhibited positive
skewness with a value of 3.56. The natural logarithm, multiplicative inverse, and Box-
Cox (optimized) transformations exhibited relatively normal distributions with values of
1.06, 0.16, and 0.21 respectively. Yet a graphical examination shows the natural
logarithm transformation being still slightly positively skewed (Figure 16).

96
Histogram of Natural Log of NumArticle
Figure 16
A similar finding of relatively positive skewness resulted by graphing the square root
transformation dataset (Figure 17).

97
Histogram of NumArticle Square Root Figure 17
A finding relative normality resulting from graphing the Box-Cox transformation dataset
(Figure 18).

98
Histogram of NumArticle Box-Cox Transformation
Figure 18
And an additional finding relative normality resulting from graphing the multiplicative
inverse transformation dataset (Figure 19).
Histogram of NumArticle Multiplicative Inverse Transformation
Figure 19

99
As a final analysis of normality, the Kolmogorov-Smirnov (K-S) process was
applied to the data sets. The K-S algorithm within SPSS 24 was used for the
calculations. First, the Z values for NumArticles, AvgTone, and the natural logarithm,
and multiplicative inverse transformations of NumArticles were calculated. Then K-S
process was applied using the null hypothesis that the distribution of the various z-
scores were normal with a mean of zero and a standard deviation of one. Each of the
resulting p-values for the NumArticles variables were less than 0.05, causing rejection
of the normality null hypothesis. The resulting p-value for the Economic AvgTone was
greater than 0.05 (0.069) reflecting a failure to reject the normality null hypothesis; in
other words the observation of a relatively normal distribution was reinforced.
7.2.2 Robust Statistics and Global Outlier Identification
Whether or not normally distributed, both NumArticles and AvgTone can still
provide good performance statistics. As mentioned, the condition is known as
‘robustness’ or robust statistics.273 The identification of outliers, or the lack of outliers,
does not fully indicate a great amount of magnitude or intensity. What is required is a
determination of ‘how high is high?’ or ‘how low is low?’. In order to achieve this with
non-parametric variables, a procedure called bootstrapping is performed. Bootstrapping
creates a new distribution approximating the distribution for a sample mean where the
size of the population is not known.274 It allows development of accuracy measures (i.e.
variance, confidence intervals, etc.) to sample estimates. The procedure was conducted
using the XLSTAT extension for MS Excel using the bias corrected accelerated (BCa)
technique which aids in obtaining more accurate intervals for non-parametric
samples.275 For NumArticles the bootstrap confidence interval for the mean has a lower

100
bound of 4.09 and an upper bound of 7.49. Thus, of the 258 Economic variable events
reported Iraq during the month of September 2008, 180 ‘lower level magnitude’ events
and 49 ‘higher level magnitude’ events are identified. For AvgTone the bootstrap
confidence interval for the mean, the lower bound was 4.43 with an upper bound value
of 4.86. Thus, of the 258 Economic variable events reported Iraq during the month of
September 2008, 104 were of lower impact/intensity with 120 events deemed of higher
impact/intensity.
By identifying the non-parametric characteristics of both NumArticles and
AvgTone, and then applying robust statistical methods to these datasets, it is possible
to statistically support what is ‘high’ or ‘low’ to the entire sample. While the sample
containing these high and low values are determined partly by geographic orientation,
the designation of being high or low has no connection to any spatial orientation. In
other words, the relationship of ‘high’ and ‘low’ extends across the entire sample and
does not account for relative comparisons by proximity. This ‘global outlier’ identification
is a necessary but not sufficient part required to fulfill CIM’s mission to spatially analyze
the Stability Operational area.
7.2.3 Global Spatial Autocorrelation
With identification of the non-parametric characteristics of both variables and
establishment of concentration for the magnitude NumArticles variable but none for the
intensity AvgTone variable, it is necessary to identify where they geographically
agglomerate. This act of geographic clustering is measured by spatial autocorrelation,
the determination of a variable values’ interdependence pattern over space.276 Initially
this is done using the Moran’s I Global Index.277 The purpose is to identify existence of

101
the same pattern or process occurring over an entire geographic area. The ‘Global
Moran’s’ measures the correlation of a variable with itself through space.278 As with
other statistical tests, a null hypothesis is established for the purpose of falsification or
disproving. The null hypothesis in this case is that there is no (or zero) autocorrelation of
the variable values. Mathematically, the z-score for the expected value of a random
Moran’s I [E(I) = -1/(n-1)] is less than zero.279 Because ArcGIS’ Global Moran’s algorithm
assumes a normally distributed dataset (not applicable to this case study), analysis of
this dataset is conducted using GeoDa. The procedure in GeoDa utilizes a Monte Carlo
simulation process. Just as bootstrapping enables accuracy assessment measures (e.g.
variance, confidence intervals) for an unknown non-spatial population size through
random sampling with replacement, Monte Carlo simulations conduct multiple random
samples to obtain the distribution of populations (non-spatial and spatial) that are
neither random nor normal.280 At the time of this study, ArcGIS does not provide the
Monte Carlo simulation option. Using the GeoDa Moran’s scatterplot developed by
Anselin, the spatial agglomerations are identified as either zero (the null hypothesis),
positive (similar high or low values spatial clustered together), or negative (dissimilar
values in close location).281 It classifies the autocorrelation as either spatial
agglomerations or spatial outliers. Using a quadrant diagram, the different types of
spatial autocorrelation are classified by location within the quadrant (Figure 20).282

102
Stylized Categories for Moran’s Scatterplot283
Figure 20
Positive spatial autocorrelation values are in the lower quadrant to the left (III) and
upper quadrant to the right (I). Note that Quadrant III contains low value areas
surrounded by low value areas (LL) while Quadrant I include high value areas
surrounded by high value areas (HH). The different positive autocorrelations can be
alternately described as hot spots (Quadrant I) or cold spots (Quadrant III). Cases in
the upper left (II) and lower right (IV) quadrants corresponding to negative spatial
autocorrelation are also described as spatial outliers (note: not to be compared to non-
spatial outliers in the two standard deviations sense). These cases described as value
of one type surrounded by values of the other (i.e. Quadrant II - high values surrounded
by low values; Quadrant IV - low values surrounded by high values). Thus, the Moran’s
scatterplot classifications of global or overall spatial autocorrelation present values as
spatial outliers (HL or LH), hotspots (HH), and/or cold spots (LL).284 It graphically
displays the Global Moran’s I statistical significance of cases in the spatial
agglomerations and spatial outlier quadrants.

103
For this example, the Global Moran’s analysis is applied to the Economic
magnitude variable (NumArticles) and the Economic intensity variable (AvgTone). Since
the events studied are geospatially referenced by points unlike in the Treviño example,
the necessary spatial weight matrix cannot be calculated using the ‘Queen’ or ‘Rook’
contiguity methods designed for polygons. A ‘k-Nearest Neighbors’ spatial weights
matrix was created for both variables (using Geoda version 1.43). While the ‘Distance
Threshold’ method of creating spatial weight matrices is an option, that method often
leads to unbalanced connectedness structures.285 While analysis focusing on adjacency
(either immediate neighbor or indirect via intervening neighbors) is preferred for polygon
data, since this analysis is based on point data the Nearest Neighbors’ spatial weight
development is the method that best approximates a matrix calculated for polygons.
For the Economic NumArticles variable, the Global Moran value is 0.0148. Since
the use of Monte Carlo simulations has the possibility of the Global Moran’s I producing
different results, multiple randomized runs result in the pseudo-p values fluctuating
between 0.32 and 0.38 at 999 permutations. Since the values are stable, the null
hypothesis of randomness cannot be rejected at an alpha risk of 5% (95% confidence
level). The global autocorrelation is not significant the .05 level. As shown in Figure 21,
Moran’s Scatterplot presents the relatively clustered global distribution of the NumArticle
Economic variables (positioning mainly along the non-spatial lag access). With each
point referenced to an Iraqi urbanized area within the various provincial geographies,
the interpretation is that there is no discernible global spatial effect on the distribution
levels (magnitude) of Economic activity reported within provinces within Iraq. Again, the
NumArticles variable represents the sheer volume of reports and its Moran’s I

104
represents a general lack of clustering toward high or low levels of reports within the
country of Iraq.
Global Moran’s I – Economic NumArticle
Figure 21
Global Moran’s analysis for the intensity variable, AvgTone, presents a different
result. The Moran’s I is 0.0112 with a randomized p-value between 0.02 and 0.03 at a
Monte Carlo run of 999 permutations. The null hypothesis of randomness can be
rejected at an alpha risk of 5% (95% confidence level). Global Autocorrelation
significant the .05 level with the observations are clustering about similar values. The
Moran’s Scatterplot presents that there are AvgTone Economic variables that are
scattered tightly from Quadrant I (hot spot cluster quadrant) through Quadrant III (cold
spot cluster) along an approximately positive 11 degree line (the Moran’s I value). While

105
there some points clustered within the High-Low (quadrant II), there are relatively few
points plotted within the Low-High (quadrant IV) spatial outlier regions (Figure 22). With
each point referenced to an Iraqi urbanized area within the various provincial
geographies, the interpretation is that the intensity of reported Economic activity is
relatively positively clustered and not evenly dispersed throughout Iraq.
Global Moran’s I – Economic AvgTone
Figure 22
With the country level (global) identification of the Economic magnitude variable
that is statistically random but having an Economic intensity variable as being possibility
clustered around High-High (HH) hot spots with Low-High spatial outliers, it is important
to identify where the reported Economic activity occurs. Additionally, the lack of
statistically significant country wide (global) spatial autocorrelation (clustering) does not
preclude the identification of local pockets of reporting magnitude and intensity.
106
7.2.4 Local Spatial Autocorrelation
The Global Moran’s index provides a comprehensive examination of spatial
autocorrelation within a geographic population. In order to perform the CIM subtasks of
collation and analysis/evaluation on the civilian aspects of the OE, an aggregate or
comprehensive examination is not sufficient. Spatial identification of where significant
activities are needed to fulfill CIM’s geographic display requirements. A LISA measure
provides both information on the statistical significance of cases within the spatial
agglomerations/spatial outliers and identifies non-statistically significant cases. Simply
put, local high values can exist by virtue of being greater than others in their adjacent
area and yet not be globally large. This ‘Local Moran’s index’ (Ii) tests its statistical
significance of against an absence of spatial autocorrelation (i.e. a spatially randomly
distributed variable) null hypothesis (H0). The H0 is rejected under the NONO principle
(NOn-significant, NOt rejected).286 LISA provides a capability to examine individual
entities against the whole to develop a more nuanced picture of the OE.
While the Economic NumArticles observations under the Global Moran are
deemed independent (not clustered/non-correlated), a LISA calculation was conducted
and identified two provinces of Iraq with municipalities having LL or cold spot cluster
magnitude variables (Baghdad, Diyala). There are there is one province with LH outliers
(Baghdad). The LISA calculation identified one municipality within the province of Diyala
as containing HL outliers. For measures of magnitude, there are no HH hot spot clusters
identified.287 This is displayed in Figure 23.
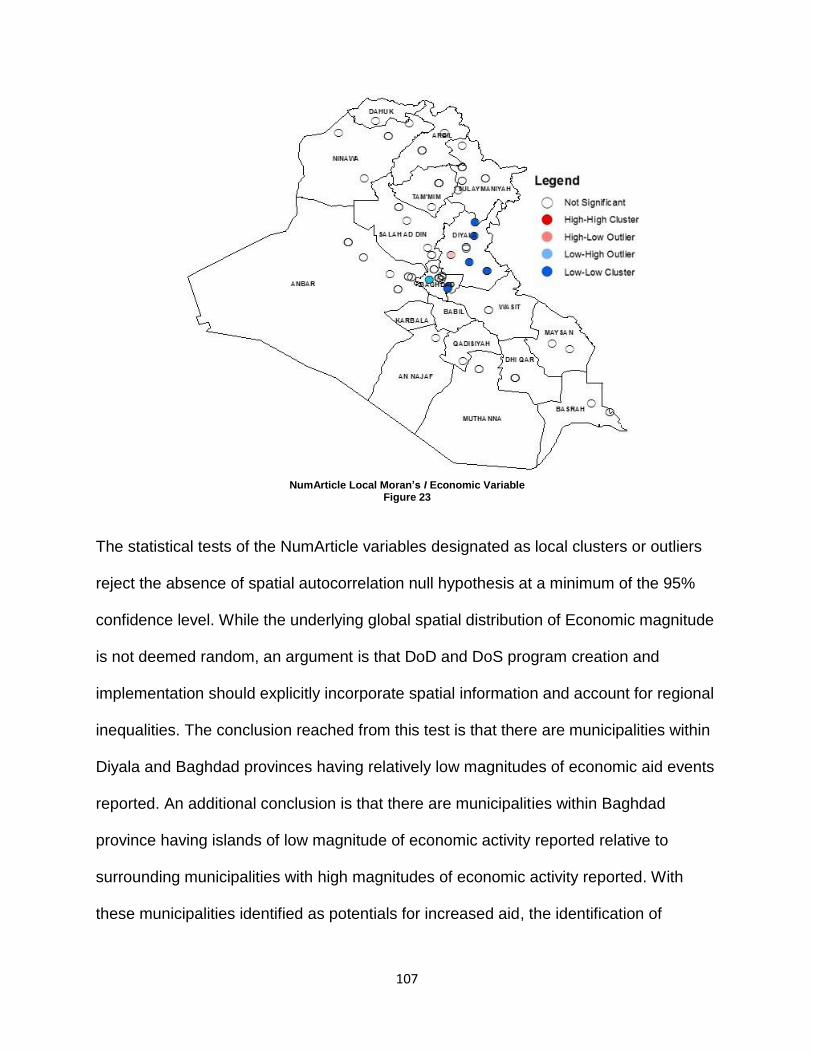
107
NumArticle Local Moran’s I Economic Variable
Figure 23
The statistical tests of the NumArticle variables designated as local clusters or outliers
reject the absence of spatial autocorrelation null hypothesis at a minimum of the 95%
confidence level. While the underlying global spatial distribution of Economic magnitude
is not deemed random, an argument is that DoD and DoS program creation and
implementation should explicitly incorporate spatial information and account for regional
inequalities. The conclusion reached from this test is that there are municipalities within
Diyala and Baghdad provinces having relatively low magnitudes of economic aid events
reported. An additional conclusion is that there are municipalities within Baghdad
province having islands of low magnitude of economic activity reported relative to
surrounding municipalities with high magnitudes of economic activity reported. With
these municipalities identified as potentials for increased aid, the identification of

108
relatively low aid activity must now be compared to areas where there are potential of
greater impact as reflected in intensity.
Based upon the intensity variable AvgTone’s Global Moran’s value of 0.112, a
LISA calculation was conducted and identified four provinces with municipalities having
with significant positive autocorrelation. As earlier noted, there were both hot spot and
cold spot local clusters as well has LH outliers. One of the municipalities in the Ta’mim
province was identified as hot spot (HH) cluster. Two municipalities in the province of
Anbar were identified as cold spot (LL) clusters. Low-high outliers were identified in the
provinces of Arbil and Baghdad (Figure 24). All of the local positive and negative
autocorrelated AvgTone values reject the absence of spatial autocorrelation null
hypothesis at a minimum of the 95% confidence level.
AvgTone Local Moran’s I Economic Variable Figure 24

109
Again, since the report underlying the locational distribution of Economic activity
is not random at the local level, an argument is that DoD and DoS program
development and implementation should clearly incorporate spatial information in
relation to potential impact and be targeted to account for the regional disparities. The
conclusion reached from this test is that there are multiple indications of regional spatial
intensity. On the surface, an increase in aid to HH hot spots and to other HL spatial
islands should provide greater intensity in the positive perception of aid efforts. What is
now required is a method for integrating the various measures for both magnitude and
intensity in order to reveal areas in which to enhance Economic activity.
7.2.5 First Modification of Treviño’s Conglomeration
Treviño, in his analysis of the spatial hierarchy of poverty in Mexico (Treviño,
2010), used GIS to combine the results of outlier identification using the bootstrap
statistical method (concentration) with a LISA analysis of spatial autocorrelation
(agglomeration). The spatial pattern of poverty analysis required distinction between
magnitude and intensity and thus both concentration and agglomeration analysis were
conducted on magnitude and intensity separately.288 The key purpose of his paper was
to demonstrate how the identification of priority areas can be improved for policy
formulation. The implicit methodological question is how the integration of spatial and
non-spatial statistics can identify those priority areas. Treviño used the concept of ‘Core
and Periphery’ analysis.289 His spatial core consisted of the high values surrounded by
high value hot spots (HH) or high values surrounded by low values (HL) as derived from
the local Moran´s Index LISA values. The periphery is the set of global values
exceeding the upper limit of the 95% confidence level derived from bootstrapping that

110
spatially intersect or surround the core.290 The process compensates for two issues.
First is the spatial inclusion of a locally important area while excluding others that
maybe nationally relevant. Second is the converse, the spatial inclusion of a nationally
important area while excluding others that possibly relevant locally.291 By using GIS to
integrate the periphery and core area layers via the intersection or union applications, a
new map layer containing the resulting conglomerates is created. Preforming the
procedure for both magnitude and intensity values as separate and independent tasks,
the high values overlay analysis comparison of the two presents a spatial pattern of
poverty based upon statistically determined threshold limit values.292 Essentially, after
conducting spatial mathematical analysis on magnitude and intensity, he used a basic
sieve mapping analysis to find the intersection of the two spatial sets. Inherent in
Treviño’s study is the identification of areas with both high magnitude and high intensity.
The nature of his research, identification of high poverty concentrations accounting for
both local and national significance, required maximization identification of both.
By using Treviño’s conglomeration procedure in the MMC, the merging and
analyzing aspects of the CIM mission can be accomplished. The specific analysis calls
for the identification of areas within Iraq requiring aid after the 2007 ‘Surge’ operation.
Implicit in this analysis was identification of areas where aid provision will have a
decisive impact. In order to find areas requiring economic activity in which a greater
impact is achieved, the first of two modifications in Treviño’s conglomeration procedure
is required. Impact maximization, as measured by AvgTone, will require identification of
high intensity. This is Treviño’s original procedure of ‘high level’ conglomerate
identification. But identification of neglected areas requiring more economic activity calls

111
for ‘low level’ conglomerate identification using the NumArticle variables. Specifically,
what is desired is low magnitude. In other words, the converse of Treviño’s
conglomeration procedure is used by identifying a spatial core consisting of the low
values encircled by low value hot spots (LL) or low values encircled by high values (LH)
as calculated from the local Moran´s Index LISA values and a periphery consisting of
values below the lower limit of the 95% confidence level derived from bootstrapping that
spatially intersect or surround the core.
First, identification of the magnitude (NumArticle) all municipalities resulting with
LL or LH as Local Moran´s Index values were identified (Figure 25). They located in the
Diyala and Baghdad provinces.
Economic NumArticle Agglomeration
Figure 25
Then, in order to find the NumArticle lower conglomerate core, low level conglomerates
are implemented. A BCa bootstrap analysis was conducted on the NumArticle variable

112
resulting in a 95% confidence level with (4.09, 7.49) as the bounds. In order to find the
lower conglomerate periphery, an attribute query within ArcGIS identifying all values
less than 4.09 (aka: the lower outliers) produces the following spatial concentration
(shown in Figure 26).
Economic NumArticle Agglomeration and Concentration
Figure 26
The resulting overlay shows the combination of agglomeration and concentration for the
‘low’ values of NumArticle (Figure 27). Yet, this in and of itself does not constitute the
‘Core and Periphery’ of Treviño’s conglomeration. His was based on contiguous
polygons. Since the data for this study is based upon points, buffers (blue rings) were
created around the points of agglomeration. While the spatial weight matrix for the
Global and Local Moran’s I is based upon the nearest neighbors’ spatial weights matrix
calculation, a buffer based upon the distance weight matrix threshold of 0.994 units

113
(decimal degrees) is developed. Thus, any point of concentration with its centroid within
the buffer constitutes the periphery.
Economic NumArticle Conglomerate
Figure 27
The NumArticle Conglomerate consists of municipalities within the Diyala, and Baghdad
provinces. With six sites in total, the collection represents a mixture of territories
occupied by Shia, Sunni, and Kurd majorities. These municipalities represent areas of
greatest potential neglect for economic activity in comparison to others.
Similarly, identification of the intensity high level conglomerates is implemented.
The BCa bootstrap analysis was conducted on the AvgTone variable resulting in a 95%
confidence level with (4.43, 4.86) as the bounds. Despite the finding of a relatively
normal distribution, bootstrap analysis is applied in order to maintain methodology
continuity. In order to find the higher conglomerate periphery, an attribute query within
ArcGIS identifying all values greater than 4.86 (i.e., the upper outliers) produces the
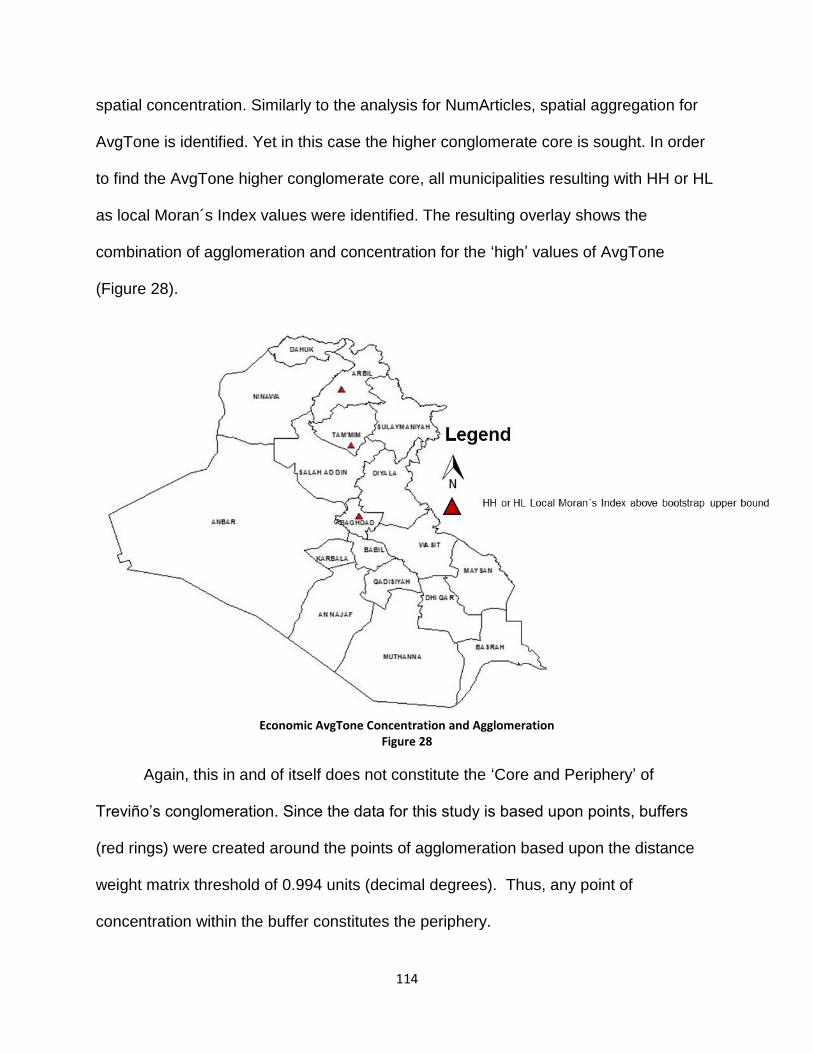
114
spatial concentration. Similarly to the analysis for NumArticles, spatial aggregation for
AvgTone is identified. Yet in this case the higher conglomerate core is sought. In order
to find the AvgTone higher conglomerate core, all municipalities resulting with HH or HL
as local Moran´s Index values were identified. The resulting overlay shows the
combination of agglomeration and concentration for the ‘high’ values of AvgTone
(Figure 28).
Economic AvgTone Concentration and Agglomeration
Figure 28
Again, this in and of itself does not constitute the ‘Core and Periphery’ of
Treviño’s conglomeration. Since the data for this study is based upon points, buffers
(red rings) were created around the points of agglomeration based upon the distance
weight matrix threshold of 0.994 units (decimal degrees). Thus, any point of
concentration within the buffer constitutes the periphery.

115
Economic AvgTone Conglomerate
Figure 29
The AvgTone conglomerate consists of municipalities within the Arbil, Baghdad,
and Tam’mim provinces. With three sites in total, the collection represents a mixture of
territories occupied by Sunni and Kurd majorities. These municipalities represent areas
with the greatest potential effectiveness for economic activity in comparison to others.
Once the conglomerates of intensity and magnitude are identified, the next step
is to distinguish and classify municipalities reflecting the Economic activity criteria. This
section overlaps the two conglomerates of AvgTone (Figure 29) and NumArticle (Figure
27) values to identify the highest priority municipalities (Figure 30). Results identify the
highest priority municipalities as Arbil (Arbil province), Jalawla (Diyala province),
Baghdad (Baghdad province) and Abd Al-Aziz (Ta'mim province).

116
Economic Magnitude and Intensity (NumArticle and AvgTone) Overlay
Figure 30
Since conglomerates are the result of overlapping non-spatial (concentration) and
spatial (agglomeration) of low values of magnitude or values of high intensity, they are
important as representations (relative or absolute) of the Economic variable. These
values are assigned the highest spatial priority for strategic and operational policy to the
intersection area of both conglomerates. Since remaining municipalities that are not
intersected in the intensity or magnitude conglomerates can also be significant, they are
arranged or classified to indicate a spatial priority for the decision making process.293
Allocating spatial priorities to the municipalities based on the core and periphery
estimates is direct. Non-intersecting core or periphery values (secondary and tertiary,
respectively) are directly attained from the overlapped maps (Figure 30). As anticipated,
core areas of intensity and their peripheries (conglomerates of intensity) cover more
117
area, and are situated in lesser populated areas, than those of magnitude that include
the major urban areas. Non-intersecting cores and peripheries are secondary and
tertiary priorities in both intensity and magnitude, respectively, due to both of stability aid
analysis characteristics are equally important.294 Yet, they are important for different
reasons. As the magnitude variable, the NumArticle core and periphery identifies where
economic activity waxes and wanes. It is an inverse relationship. Thus, the lower level
conglomerates denote where the greatest need is located. The intensity variable
represents something entirely different. The AvgTone core and periphery identifies
where economic activity provision results in the greatest impact. An alternate way of
stating this is ‘where can economic action provision produce the biggest bang for the
buck?’ This initial modification of Treviño’s conglomeration procedure allows
examination of the stability strategic policy question of where provisional and municipal
neglect intersects with maximum results.
7.2.6 Second Modification of Treviño’s Conglomeration
Treviño’s Conglomeration method concludes with the sieve spatial analysis
procedure mapping overlapping areas of magnitude and intensity. But like nominal
(categorical) numbers in mathematics, these mapped areas are just labels; they only
identify a geographic point with no indication of rank, quantity, or other type of
measurement. In order for AHP to work, values must be developed for each
geographical area. This is the rational for the second modification to the Treviño’s
Conglomeration method.
A value for each PMESII Conglomeration point is calculated based upon the
‘minimum magnitude/maximum intensity’ rule established above. First, because

118
attributes with larger ranges could have undue greater importance in the analysis, both
the NumArticle and AvgTone attributes for each PMESII is standardized so that they are
of comparable scales. Then analysis rule is applied by calculating intensity (AvgTone)
minus magnitude (NumArticle) for each statistically significant raw value of AvgTone
and NumArtcle. In the case where a statistically significant value for one of the attributes
does not occur (null value), the attribute takes on the value of zero. There are no values
calculated for municipalities where both the AvgTone and NumArtcle attributes are not
statistically significant. Because of the varying scales of each of the PMESII variables,
statistical normalization is applied to create a common scale. For municipalities with
multiple values, the mean is applied to the calculated results. The result is nine
identified municipalities with values for the Economic operational variable (Table 3).
While it is not surprising to find Baghdad on the list of statistically significant Economic
operational variables, it is not at the top of the list. This is due to the lack of significant
impact any additional economic activity would have as reflected by the lack of
magnitude values from the analysis.
Municipality Latitude Longitude Economic Variable
Arbil, Arbil 36.1926 44.0106 1.714850834
Baghdad, Baghdad 33.3386 44.3939 0.807691771
Abu Ghurayb, Baghdad 33.307 44.1869 0.343100921
Jalawla, Diyala 34.2772 45.1779 0.343100921
Salman Pak, Baghdad 33.102 44.5835 0.343100921
Ariz, Diyala 33.5 45.4667 0.271424778
Balad Ruz, Diyala 33.6963 45.0778 0.271424778
Madain, Baghdad 33.15 44.6167 0.271424778
Abd Al-Aziz, Ta'mim 34.9283 44.2303 0.236138412
Economic Variables
Table 3

119
This second modification of Treviño’s Conglomeration develops factors from
which final scores can be calculated in the AHP MMC model. Based upon the re-coded
GDELT data, the procedure is applicable for all of the PMESII operational variables. A
secondary effect of this modification is the limitation of analysis to non-transformed
GDELT data. Since factor development involves normalization of the GDELT data for
scaling purposes, the use of pre-transformed data may cause additional anomalies
within the factors that would unduly affect the final score. The is modification is a critical
step toward the overall implementation of this study’s SDSS.
7.3 PMESII Conglomeration Layers in the MMC
The previous example of the modified Treviño’s Conglomeration procedure is
used throughout the study. Specific categories from GDELT were used as proxies for
each of the PMESII operational variables. The summarized results of this
Conglomeration procedure for the remaining PMESII variables follow.
The Political Variable re-coding query of the GDELT Event Code produced
results concentrating on phrases containing ‘diplomatic cooperation’, ‘political parties or
politicians’, ‘political dissent’, or ‘political freedoms’. The SQL query resulted in 40
observations for analysis. A spatial representation of the Political operational variable
observations is shown in Figure 31.

120
Map of Political Operational Variables
Figure 31
Through the calculation of descriptive statistics, the magnitude (NumArticle)
variable attribute has a mean of 4.60, median of 1.00, standard deviation of 6.69, and
skewness of 2.4. It is found to be skewed. Additional exploratory analysis of the
NumArticle variable attribute via ‘Box-Plot’ analysis calculates the critical values of Q1:
1.00, Q3: 5.00, IQR: 4.00, lower whisker: -5.00, and upper whisker: 11.00. Given these
values, the Political NumArticles dataset has 5 positive outliers and 0 negative outliers.
This supports the finding of skewness. The additional K-S normality test conducted on
the standardize values with a null hypothesis of normal distribution, a mean of zero (0)
and a standard deviation of one (1) provides p-values less than 0.05, causing rejection
of the normality null hypothesis at the 95% confidence level. Identification of the
magnitude low level conglomerates begins with a BCa bootstrap analysis conducted on
the NumArticle attribute resulted with (2.87, 7.09) as the bounds with a 95% confidence

121
level. The lower conglomerate periphery attribute query within ArcGIS identifying all
values less than 2.87 (i.e.: the lower outliers) produces a spatial concentration reflecting
of the 40 Political variable events reported Iraq during the month of September 2008, 27
were of lower magnitude with 8 events deemed of higher magnitude. With identification
of the non-spatial, non-parametric characteristics of the Political NumArticle attribute,
spatial autocorrelation of the attribute is conducted to identify local Moran´s Index. The
Global Moran’s results were not significant the .05 level (pseudo-p values ranging
between 0.29 and 0.32 at a Monte Carlo run of 999 permutations). The Local Moran’s
produce only one statistically significant cluster (Figure 32), but it is categorized has HH.
There are no points considered as spatial cold spot clusters (LL) or spatially cold
outliers surrounded by areas of greater activity (LH) identified.
NumArticle Local Moran’s I Political Variable
Figure 32
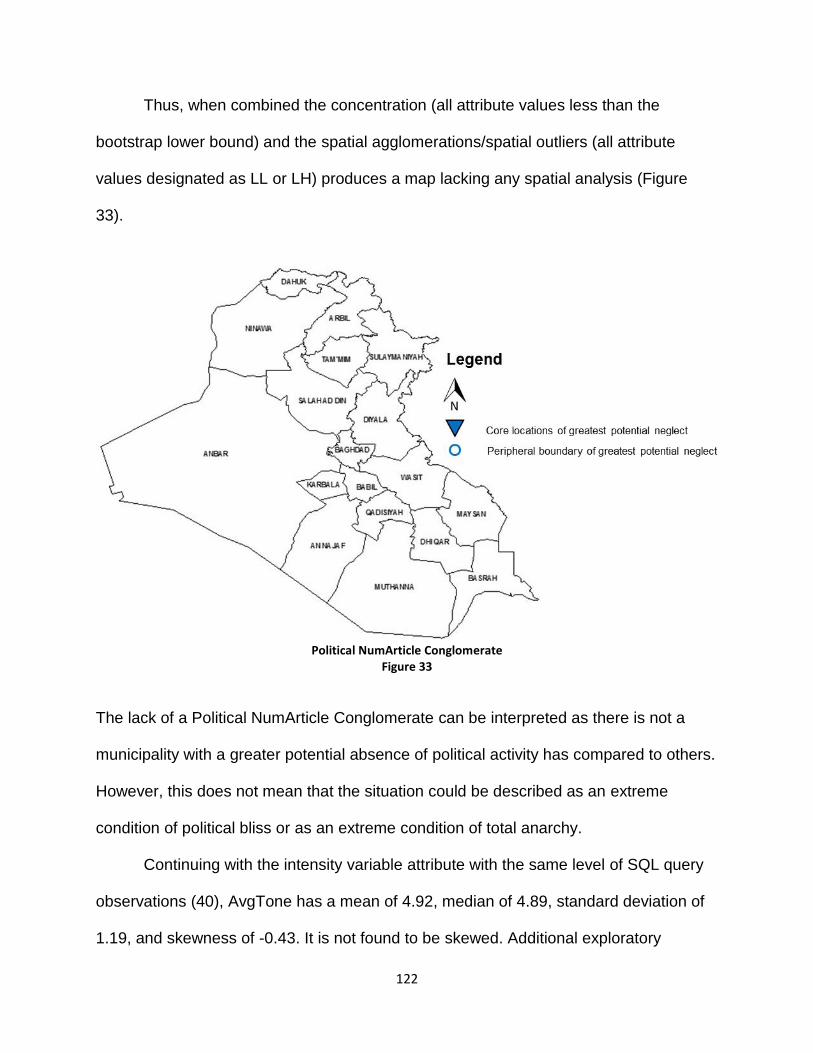
122
Thus, when combined the concentration (all attribute values less than the
bootstrap lower bound) and the spatial agglomerations/spatial outliers (all attribute
values designated as LL or LH) produces a map lacking any spatial analysis (Figure
33).
Political NumArticle Conglomerate
Figure 33
The lack of a Political NumArticle Conglomerate can be interpreted as there is not a
municipality with a greater potential absence of political activity has compared to others.
However, this does not mean that the situation could be described as an extreme
condition of political bliss or as an extreme condition of total anarchy.
Continuing with the intensity variable attribute with the same level of SQL query
observations (40), AvgTone has a mean of 4.92, median of 4.89, standard deviation of
1.19, and skewness of -0.43. It is not found to be skewed. Additional exploratory

123
analysis of the AvgTone variable attribute via ‘Box-Plot’ analysis calculates the critical
values of Q1: 4.46, Q3: 5.65, IQR: 1.19, lower whisker: 2.67, and upper whisker: 7.43.
Given these values, the Political AvgTone dataset has one (1) positive outliers and two
(2) negative outliers. This supports the finding of a lack of skewness. The additional K-S
normality test conducted on the standardize values with a null hypothesis of normal
distribution, a mean of zero (0) and a standard deviation of one (1) provides p-values
greater than 0.05 (0.118) for the basic AvgTone transformed, causing failure to reject
the normality null hypothesis at the 95% confidence level. The BCa bootstrap analysis
conducted on the AvgTone attribute resulted with (4.53, 5.28) as the bounds with a 95%
confidence level. The higher conglomerate periphery attribute query within ArcGIS
identifying all values greater than 5.28 (i.e.: the higher outliers) produces a spatial
concentration reflecting of the 40 Political variable events reported Iraq during the
month of September 2008, 10 were of lower intensity with 14 events deemed of higher
intensity. With identification of the non-spatial, non-parametric characteristics of the
Political AvgTone attribute, spatial autocorrelation of the attribute is conducted to
identify the Global and Local Moran´s Index using a k-Nearest Neighbors weight matrix.
The Global Moran’s with a pseudo-p value ranging between 0.34 and 0.38 from a Monte
Carlo run of 999 permutations was found not significant at the .05 level. The Local
Moran´s Index used to identify spatial hot spot clusters (HH) or spatially hot outliers
surrounded by areas of greater activity (HL), resulted in one HH cluster of intensity
reports. When combined the concentration (all attribute values greater than the
bootstrap upper bound of 5.28) and the spatial agglomerations/spatial outliers (all

124
attribute values designated as HH or HL) produces the following spatial analysis
illustrated in Figure 34.
Political AvgTone Conglomerate
Figure 34
Political AvgTone Conglomerate consists of the Badr municipality within Ninawa
province. The site is located in territory occupied by mixture of Shia and Kurd. The
municipality represent area of greatest potential effectiveness for political engagement
in comparison to others.
The final conglomeration step of applying the ‘minimum magnitude/maximum
intensity’ rule for the standardized NumArticle and AvgTone attributes is applied. The
result is one identified municipality with a value for the Political operational variable
(Table 4).

125
Municipality Latitude Longitude Political Variable
Badr, Ninaw 35.7489 42.1222 0.26704
Political Variables
Table 4
The small town of Badr in Ninaw province also registered a score due to strong
intensity values. This is probably due its proximity to the Syrian border and the plurality
of Sunni and Kurdish population. While Baghdad would be expected to have a strong
Political intensity variable value, being Iraq’s capital, the political variable observations
did not aggregate within the city. This denotes an area that may not be under neglect
for political activity, but any additional action conducted there may not reap the benefits
desired.
Stated in the context of either reducing or increasing the amount of support
provided in a designated area, the Military Variable re-coding query of the GDELT Event
Code produced results concentrating on phrases containing ‘military protection or
peacekeeping’, ‘military engagement’, ‘military aid’, ‘military force’, or ‘military
assistance’. For Surge analysis purposes, ‘Military’ incorporates security requirements.

126
Map of Military Operational Variables
Figure 35
The Military operational variable SQL query resulted in 1,450 observations for
analysis (Figure 35). The high volume of observations is to be expected due to the
period of the requested reports in Iraqi (September 2008 – the end of the Surge).
Through calculation of descriptive statistics, the magnitude (NumArticle) variable
attribute has a mean of 5.79, median of 2.00, standard deviation of 9.75, and skewness
of 6.90. It is found to be skewed. Additional exploratory analysis of the NumArticle
variable attribute via ‘Box-Plot’ analysis calculates the critical values of Q1: 1.00, Q3:
7.00, IQR: 6.00, lower whisker: -8.00, and upper whisker: 16.00. Given these values,
the Military NumArticles dataset has 113 positive outliers and zero negative outliers.
This supports the finding of skewness. The additional K-S normality test conducted on
the standardize values with a null hypothesis of normal distribution, a mean of zero (0)
and a standard deviation of one (1) provides p-values less than 0.05, causing rejection

127
of the normality null hypothesis at the 95% confidence level. Identification of the
magnitude low level conglomerates begins with a BCa bootstrap analysis conducted on
the NumArticle attribute resulted with (5.31, 6.31) as the bounds with a 95% confidence
level. The lower conglomerate periphery attribute query within ArcGIS identifying all
values less than 5.31 (i.e.: the lower outliers) produces a spatial concentration reflecting
of the 1,450 Military variable events reported Iraq during the month of September 2008,
1,009 were of lower magnitude with 389 events deemed of higher magnitude. With
identification of the non-spatial, non-parametric characteristics of the Military NumArticle
attribute, spatial autocorrelation of the attribute is conducted to identify Global and Local
Moran´s Index using a k-Nearest Neighbors weight matrix. The Global Moran’s with a
randomized pseudo-p value ranging between 0.13 and 0.17 from a Monte Carlo run of
999 permutations was found not significant at the .05 level. At a country level there was
no clustering or spatial outliers found for the magnitude attribute of the Military reports.
Yet, the Local Moran’s analysis identified 13 municipalities considered as spatial cold
spot clusters (LL) or spatially cold outliers surrounded by areas of greater activity (LH).
When combined the concentration (all attribute values less than the bootstrap lower
bound) and the spatial agglomerations/spatial outliers (all attribute values designated as
LL or LH) produces the following spatial analysis shown in Figure 36.

128
Military NumArticle Conglomerate Figure 36
Military NumArticle Conglomerate consists of municipalities within the Anbar,
Basrah, Babil, Baghdad, Diyala, Maysan, Ninawa, Sala ad Din, Sulaymaniyah, and
Tam’mim provinces. With 18 sites in total, the collection represents a mixture of
territories occupied by Shia, Sunni, and Kurd majorities. These municipalities represent
areas of greatest potential neglect of Military (security) engagement in comparison to
others.
Continuing with the intensity variable attribute with the same number of SQL
query observations (1,450), AvgTone has a mean of 3.56, median of 3.51, standard
deviation of 1.66, and skewness of 0.29. This dataset is initially found not to be skewed.
Additional exploratory analysis of the AvgTone variable attribute via ‘Box-Plot’ analysis
calculates the critical values of Q1: 2.39, Q3: 4.59, IQR: 2.21, lower whisker: -0.92, and

129
upper whisker: 7.90. Given these values, the Military AvgTone dataset has 17 positive
outliers and zero negative outliers. This does not support the finding of a lack of
skewness. The additional K-S normality test conducted on the standardize values with a
null hypothesis of normal distribution, a mean of zero (0) and a standard deviation of
one (1) provides p-value (0.006) less than 0.05, causing rejection of the normality null
hypothesis at the 95% confidence level. Because of the ambiguity of skewness in the
data, the Bootstrap transformation is used to find a concentration level to conduct the
analysis. Identification of the intensity high level conglomerates begins with a BCa
bootstrap analysis conducted on the AvgTone attribute resulted with (3.48, 3.64) as the
bounds with a 95% confidence level. The higher conglomerate periphery attribute query
within ArcGIS identifying all values greater than 3.64 (i.e.: the higher outliers) produces
a spatial concentration reflecting of the 1,450 Military variable events reported Iraq
during the month of September 2008, with 705 being of lower intensity with 694 events
deemed of higher intensity. In contrast to the NumArticle attribute, the spatial
autocorrelation analysis of the Military AvgTone attribute, both Global and Local
Moran’s, provide significant results. As per the established procedure, the Moran´s
Index was conducted using a k-Nearest Neighbors weight matrix. The Global Moran’s
Index value of 0.15 is found to be significant at the 0.05 level. This was verified with
multiple randomize Monte Carlo runs of 999 permutations. Throughout the runs the
pseudo-p value is consistent at 0.001 (Figure 37).

130
Global Moran’s I – Military AvgTone
Figure 37
The positive value of this Global Moran’s denotes active spatial clustering of the Military
AvgTone values with the country of Iraq. The majority of the clusters are in the third (LL)
quadrant of the chart, followed by the first (HH) quadrant. Given that the analysis of
AvgTone attributes emphases on ‘high magnitude value’ clusters, the targeting local
high magnitude value clusters for Military/security efforts not only helps those
municipalities, but also creates positive security affects for the entire country.
The Local Moran’s analysis identified points of both Low and High
concentrations. Conglomeration analysis for the Military AvgTone attribute focuses on
those considered to be spatial hot spot clusters (HH) or spatially hot outliers surrounded
by areas of lesser activity (HL). When intersected, the concentration (all attribute values
greater than the bootstrap upper bound of 3.64) and the spatial agglomerations/spatial
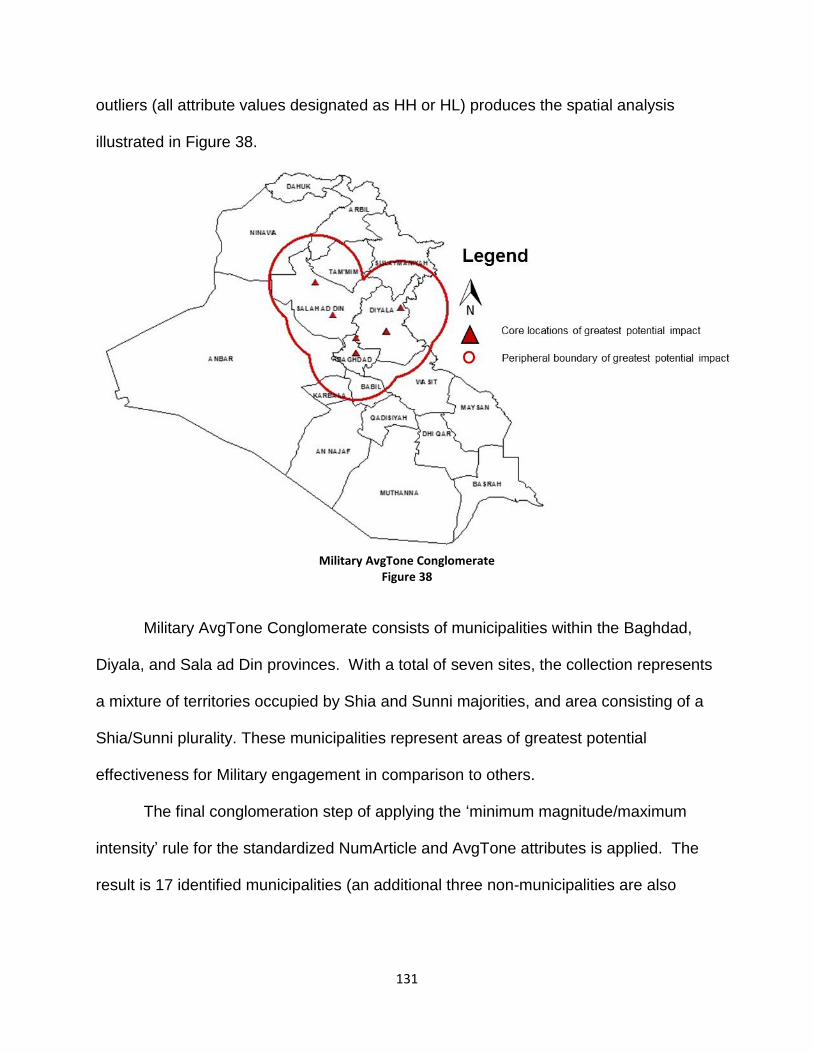
131
outliers (all attribute values designated as HH or HL) produces the spatial analysis
illustrated in Figure 38.
Military AvgTone Conglomerate
Figure 38
Military AvgTone Conglomerate consists of municipalities within the Baghdad,
Diyala, and Sala ad Din provinces. With a total of seven sites, the collection represents
a mixture of territories occupied by Shia and Sunni majorities, and area consisting of a
Shia/Sunni plurality. These municipalities represent areas of greatest potential
effectiveness for Military engagement in comparison to others.
The final conglomeration step of applying the ‘minimum magnitude/maximum
intensity’ rule for the standardized NumArticle and AvgTone attributes is applied. The
result is 17 identified municipalities (an additional three non-municipalities are also

132
mapped) with values for the Military operational variable within the Babil, Baghdad,
Basrah, Diyala, Ninawa, and Sala ad Din provinces (Table 5).
Municipality Latitude Longitude Military Variable
Khanaqin, Diyala 34.3482 45.3906 1.164943956
Mahdi, Diyala 33.8241 45.0788 0.966876454
Hasan Nasrallah, Diyala 33.8403 45.0690 0.891796791
Baghdad, Baghdad 33.3386 44.3939 0.853466415
Baiji, Sala ad Din 34.9307 43.4931 0.504495464
Abu Ghurayb, Baghdad 33.307 44.1869 0.490984184
Harthiyah, Baghdad 33.303 44.3711 0.490984184
Ali Kazim, Babil 32.3669 44.9621 0.490984184
Muthanna, Baghdad 33.3491 44.4682 0.490984184
Basra, Basrah 30.533 47.7975 0.490984184
Imam Mansur, Diyala 34.0209 44.7355 0.490984184
Khan Dari, Baghdad 33.2941 44.0726 0.490984184
Mosul, Ninawa 36.335 43.1189 0.490984184
Tuz Khurmatu, Sala ad Din 34.8881 44.6326 0.490984184
Zayyunah, Baghdad 33.327 44.4515 0.490984184
Samarra, Sala ad Din 34.1966 43.8739 0.478283275
Tarmiyah, Baghdad 33.6744 44.3958 0.211580455
Military Variables
Table 5
The results of the Military analysis were expected as the locations are generally
concentrated in provinces deemed routine for anti-Iraq forces activity and extremist
actions before the Surge took place. While the Surge may have deceased these events
in total, their relative intensity would still be greater than other areas. The variable
serves as highlight the importance of security issues within the overall Stability
Operations analysis.
While the Social Operational variable by definition is the broadest in scope,
dealing with the beliefs, values, customs, and behaviors that determine the social,
religious, and racial/tribal makeup within an OE, the actual re-coding query of the Social

133
GDELT Event Code produced results concentrating on crime. Specifically the terms
‘corruption’, ‘human rights abuses’, ‘crime’, and ‘ethnic cleansing’ were the only items
that could be queried for this operational variable.
Map of Social Operational Variables
Figure 39
The SQL query resulted in 44 observations for analysis. While this operational
variable focuses on issues varying from language and culture to population and
migration flows, reports during the study period centered on crime, corruption, and
human rights. Through calculation of the descriptive statistics, the magnitude
(NumArticle) variable attribute has a mean of 5.05, median of 3.00, standard deviation
of 4.90, and skewness of 1.50. It is found to be skewed. The Box-Plot analysis
exploratory of the NumArticle variable attribute provides the critical values of Q1: 1.00,
Q3: 8.25, IQR: 7.25, lower whisker: -9.88, and upper whisker: 19.13. Surprisingly, the

134
Social NumArticles dataset has no positive nor negative outliers. While a histogram of
the data support skewness, the lack of positive outliers does not support the finding of
skewness. The additional K-S normality test conducted on the standardize values with a
null hypothesis of normal distribution, a mean of zero (0) and a standard deviation of
one (1) provides p-values less than 0.05, causing rejection of the normality null
hypothesis at the 95% confidence level as thus re-supporting the belief that the data are
skewed. Identification of the magnitude low level conglomerates begins with a BCa
bootstrap analysis conducted on the NumArticle attribute resulted with (3.75, 6.59) as
the bounds with a 95% confidence level. The lower conglomerate periphery attribute
query within ArcGIS identifying all values less than 3.75 (i.e.: the lower outliers)
produces a spatial concentration reflecting of the 44 Social variable events reported Iraq
during the month of September 2008, 23 were of lower magnitude with 13 events
deemed of higher magnitude.
The p-values for the Global Moran’s conducted with a Monte Carlo run of 999
permutations fluctuate between 0.13 and 0.17. The finding is that global autocorrelation
is not significant the .05 level. The global pattern does not appear to be significantly
different than random. Social initiatives conducted at locations deemed neglected, or
lacking in reporting, would not likely have strong positive externalities for the country.
The Local Moran´s Index of the Social NumArticle attribute using a k-Nearest Neighbors
weight martix identified two points considered as spatial cold spot clusters (LL) or
spatially cold outliers surrounded by areas of greater activity (LH). When intersected,
the concentration (all attribute values less than the bootstrap lower bound of 3.75) and

135
the spatial agglomerations/spatial outliers (all attribute values designated as LL or LH)
produce the spatial analysis shown in Figure 40.
Social NumArticle Conglomerate
Figure 40
The Social NumArticle Conglomerate consists of municipalities within the Diyala, and
Sulaymaniyah provinces. Two sites in total, the collection represents mainly Kurdish
occupied areas. These municipalities represent areas of greatest potential neglect of
Social engagement in comparison to others.
Continuing with the intensity variable attribute with the same level of SQL query
observations (44), AvgTone has a mean of 3.38, median of 2.77, standard deviation of
1.67, and skewness of 0.60. It is not found to be skewed. While the histogram of data
does not approximate the prototypal ‘bell-shape’, the graph appears relatively normal.
Additional exploratory analysis of the AvgTone variable attribute via ‘Box-Plot’ analysis
136
calculates the critical values of Q1: 2.13, Q3: 5.13, IQR: 3.00, lower whisker: -2.38, and
upper whisker: 9.64. As with the Social NumArticle data, the Social AvgTones dataset
has zero positive outliers and zero negative outliers. This supports the finding of a lack
of skewness. Yet, the K-S normality test conducted on the standardize values with a null
hypothesis of normal distribution, a mean of zero (0) and a standard deviation of one (1)
provides p-values less than 0.05 (.003), causing rejection of the normality null
hypothesis at the 95% confidence level. Because of the ambiguity of skewness in the
data and because there are no values greater than the Box-Plot upper whisker, the
Bootstrap transformation is still used to find a concentration level to conduct the
analysis. The BCa bootstrap analysis conducted on the AvgTone attribute resulted with
(2.91, 3.88) as the bounds with a 95% confidence level. The higher conglomerate
periphery attribute query within ArcGIS identifying all values greater than 3.88 (i.e.: the
higher outliers) produces a spatial concentration reflecting of the 44 Social variable
events reported Iraq during the month of September 2008, 23 were of lower intensity
with 13 events deemed of higher intensity.
Global spatial autocorrelation of the Social AvgTone attribute conducted using a
k-Nearest Neighbors weight matrix produce significant results. The Global Moran’s
value is 0.44 with p-value ranging from 0.001 to 0.004 for Monte Carlo runs of 999
permutations. The global autocorrelation is significant the .05 level. The majority of
clustering occurs in Quadrant III of the Global Moran’s chart, identifying low intensity
value clustering. Yet, for the purposes of this analysis there is a significant amount
clustering in Quadrant I, or the high intensity value portion of the chart. Since the
observations are not independent with a clustering of similar values, likelihood that

137
Social oriented actions conducted at municipalities identified as ‘high intensity’ would
result in positive externalities for Iraq as a whole (Figure 41).
Global Moran’s I – Social AvgTone
Figure 41
The Local Moran’s index located one point (with 10 observations) considered as
either a spatial hot spot cluster (HH) or spatially hot outlier surrounded by areas of
lesser activity (HL). When the intersection between the concentration set (all attribute
values greater than the bootstrap upper bound of 3.88) and the spatial
agglomerations/spatial outliers (all attribute values designated as HH or HL) is
conducted, the spatial analysis shown in Figure 42 is produced.

138
Social AvgTone Conglomerate
Figure 42
The Social AvgTone Conglomerate consists only the of Baghdad municipality
representing a Shia/Sunni mixture. While this municipality statistically represents the
area of greatest potential effectiveness for Social engagement in comparison to others,
this is probably due to a lower level of intensity reported on these issues from other
sites.
The final conglomeration step of applying the ‘minimum magnitude/maximum
intensity’ rule for the standardized NumArticle and AvgTone attributes for the AHP
model. The result is three municipalities with Social variable values (Table 6).
Municipality Latitude Longitude Social Variable
Baghdad, Baghdad 33.3386 44.3939 0.608930771
Mansur, Sulaymaniyah 35.5119 44.9069 0.355579501
Jalawla, Diyala 34.2772 45.1779 0.355579501
Social Variables
Table 6

139
The Social Operational variable is one of the least observed. The lack of subject matter
content available for analysis is primarily due to the period in which the reports were
queried against. The Surge undoubtedly bought issues of corruption, human rights
abuses, crime, and ethnic cleansing to the forefront. Analysis of the Social variable
amplifies the importance of addressing these issues with care in the post-Surge
environment. As such, this variable serves as an additional highlight the importance of
security issues in the overall Stability Operations analysis.
The Information Operational variable is another that is broad in scope but limited
in content returns. In dealing with the persons, organizations and systems that collect,
process, disseminate, and act on information, the actual re-coding query of this GDELT
Event Code produced results concentrating on public communications entities and
statements that were either positive, neutral, or negative Iraqi government or collation
forces. Specifically, the terms ‘claim responsibility’, ‘deny responsibility’, ‘comment’
(empathetic, optimistic, or pessimistic), ‘share intelligence or information’ or ‘symbolic
act’ were the only items that could be queried for against this operational variable. While
limited in content analysis scope, it is the variable with the most observations. For the
Information Operational variable, the SQL query resulted in 1,563 observations for
analysis. These observations occurred in every province of Iraq and in over 106
municipalities and general site locations.
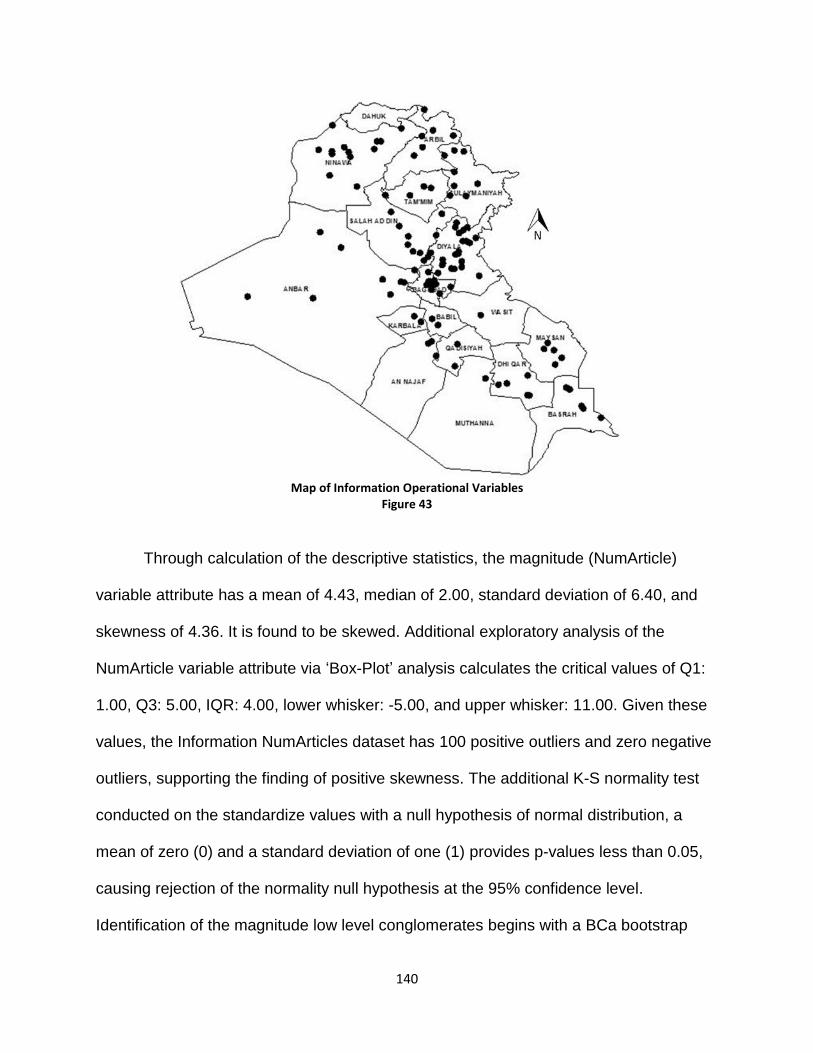
140
Map of Information Operational Variables
Figure 43
Through calculation of the descriptive statistics, the magnitude (NumArticle)
variable attribute has a mean of 4.43, median of 2.00, standard deviation of 6.40, and
skewness of 4.36. It is found to be skewed. Additional exploratory analysis of the
NumArticle variable attribute via ‘Box-Plot’ analysis calculates the critical values of Q1:
1.00, Q3: 5.00, IQR: 4.00, lower whisker: -5.00, and upper whisker: 11.00. Given these
values, the Information NumArticles dataset has 100 positive outliers and zero negative
outliers, supporting the finding of positive skewness. The additional K-S normality test
conducted on the standardize values with a null hypothesis of normal distribution, a
mean of zero (0) and a standard deviation of one (1) provides p-values less than 0.05,
causing rejection of the normality null hypothesis at the 95% confidence level.
Identification of the magnitude low level conglomerates begins with a BCa bootstrap

141
analysis conducted on the NumArticle attribute resulted with (4.12, 4.79) as the bounds
with a 95% confidence level. The lower conglomerate periphery attribute query within
ArcGIS identifying all values less than 4.12 (i.e.: the lower outliers) produces a spatial
concentration reflecting of the 1,563 Information variable events reported Iraq during the
month of September 2008, 1,133 were of lower magnitude and with 430 events deemed
of higher magnitude.
With identification of the non-spatial, non-parametric characteristics of the
Information NumArticle attribute established, spatial autocorrelation of the attribute is
conducted to identify both Global and Local Moran´s Indexes. Both analysis produced
statistically significant results. For the Global Moran's, the positive value of 0.006 is
calculated with Monte Carlo simulation p-value ranging from 0.003 to 0.011 for 999
permutations. At the .05 risk level, the global autocorrelation finding are deemed
significant.
Global Moran’s I – Information NumArticle
Figure 44

142
The observations are not independent, with similar values clustering mainly in Quadrant
I or the ‘high-level magnitude’ values chart section. Despite being a ‘HH’ category of
global clustering, actions conducted for municipalities deemed lacking in terms of the
Information variable would be beneficial both locally and for Iraq as a whole.
The Local Moran’s analysis identified 18 sites considered as spatial cold spot
clusters (LL) or spatially cold outliers (LH) for the magnitude analysis. When the
concentration set (all attribute values less than the bootstrap lower bound of 4.12) and
the spatial agglomerations/spatial outliers (all attribute values designated as LL or LH)
intersect, the following spatial analysis is featured in Figure 45.
Information NumArticle Conglomerates
Figure 45

143
The Information NumArticle Conglomerate consists of municipalities and sites
within the Anbar, Arbil, Babil, Baghdad, Basrah, Dhi Qar, Diyala, Qadissiya, Muthanna,
Najaf, Sala ad Din, Ninawa and Sulaymaniyah provinces. Thirty-four sites with 29
municipalities in total, the collection represents a mixture of territories occupied by Shia,
Sunni, and Kurd majorities. These municipalities represent areas of greatest potential
neglect of Information engagement in comparison to others.
Continuing with the information intensity variable attribute with the same level of
SQL query observations (1,536), AvgTone has a mean of 4.55, median of 4.49,
standard deviation of 1.90, and skewness of 0.19, an initial finding to be non-skewed.
Additional exploratory analysis of the AvgTone variable attribute via ‘Box-Plot’ analysis
calculates the critical values of Q1: 3.33, Q3: 5.67, IQR: 2.42, lower whisker: -0.30, and
upper whisker: 9.39. Given these values, the Information AvgTones dataset has 13
positive outliers and no negative outliers. This also supports the finding of a lack of
skewness. Yet the Kolmogorov-Smirnov (K-S) conducted on the standardize values with
a null hypothesis of normal distribution, a mean of zero (0) and a standard deviation of
one (1) provides a p-value of .01. At the 95% confidence level this causes rejection of
the normality null hypothesis and does indicate skewness. Since there is ambiguity
amongst the various tests, identification of intensity high level concentration is still
conducted using a BCa bootstrap analysis. The analysis conducted on the AvgTone
attribute resulted with (4.46, 4.65) as the bounds with a 95% confidence level. The
higher conglomerate periphery attribute query within ArcGIS identifying all values
greater than 4.65 (i.e.: the higher outliers) produces a spatial concentration reflecting of

144
the 1,536 Information variable events reported Iraq during the month of September
2008, 766 were of lower intensity with 741 events deemed of higher intensity.
With identification of the non-spatial, non-parametric characteristics of the
Information AvgTone attribute, spatial autocorrelation of the attribute is conducted to
identify both Global and Local Moran´s Index values. Both have statistically significant
results. The value the Information AvgTone attribute’s Global Moran’s is 0.235. With a
p-value consistently 0.001 for a Monte Carlo run of 999 permutations, the global
autocorrelation analysis is significant the 0.05 level and has a clustering of similar
values. There is significant clustering in Quadrants I, II, and III, or the HH, LH, and LL
intensity value portions of the chart. Since the observations are not independent with a
clustering of similar values, likelihood that Information oriented engagements conducted
at municipalities identified as ‘high intensity’ would result in positive secondary and
tertiary results for Iraq as a whole (Figure 46).
Global Moran’s I – Information AvgTone
Figure 46
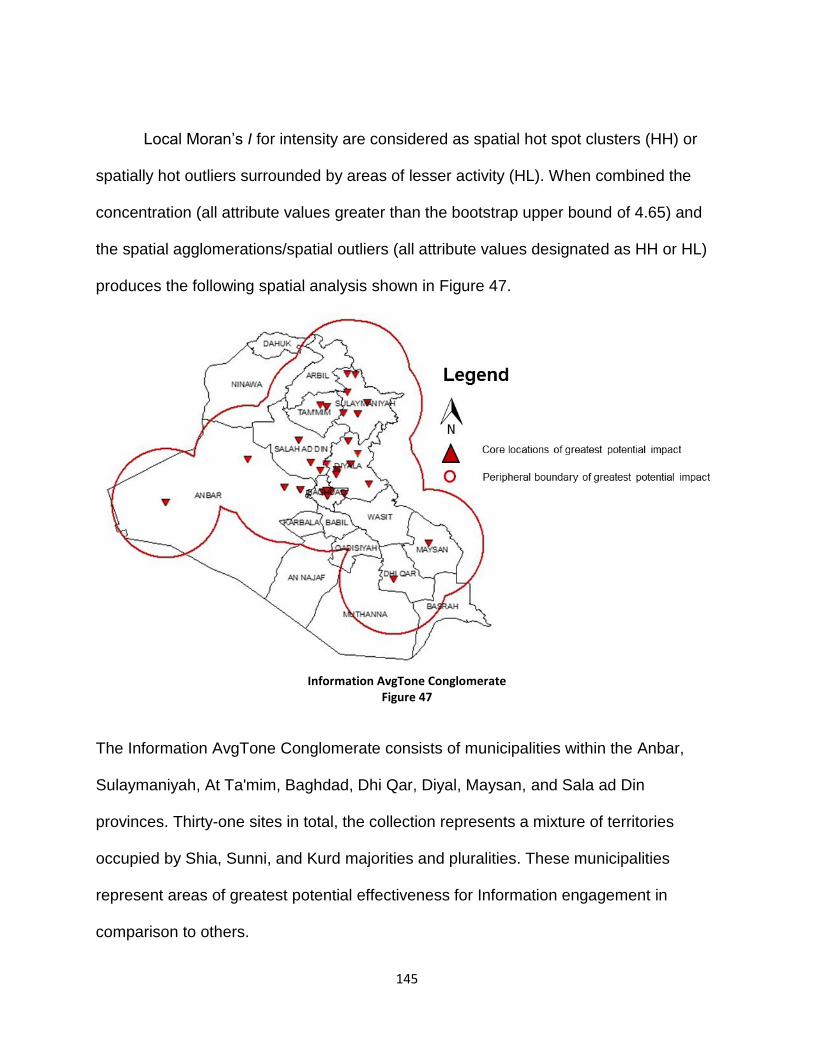
145
Local Moran’s I for intensity are considered as spatial hot spot clusters (HH) or
spatially hot outliers surrounded by areas of lesser activity (HL). When combined the
concentration (all attribute values greater than the bootstrap upper bound of 4.65) and
the spatial agglomerations/spatial outliers (all attribute values designated as HH or HL)
produces the following spatial analysis shown in Figure 47.
Information AvgTone Conglomerate
Figure 47
The Information AvgTone Conglomerate consists of municipalities within the Anbar,
Sulaymaniyah, At Ta'mim, Baghdad, Dhi Qar, Diyal, Maysan, and Sala ad Din
provinces. Thirty-one sites in total, the collection represents a mixture of territories
occupied by Shia, Sunni, and Kurd majorities and pluralities. These municipalities
represent areas of greatest potential effectiveness for Information engagement in
comparison to others.

146
The final conglomeration step of applying the ‘minimum magnitude/maximum
intensity’ rule for the standardized NumArticle and AvgTone attributes is performed.
The result is 29 identified municipalities with values for the Information operational
variable (Table 7).
Municipality Latitude Longitude Information Variable
Sangaw, Sulaymaniyah 35.286 45.1768 2.466252303
Hawr Rajab, Baghdad 33.1936 44.4049 2.19639932
Jabarah, Diyala 34.5925 44.9338 2.168589289
Rutbah, Anbar 33.0372 40.2859 1.737081435
Muhammad Amin, Diyala 33.8583 44.6522 1.644499747
Sulaimaniya, Sulaymaniyah 35.565 45.4329 1.63749696
Quraysh, Diyala 34.4109 44.5058 1.061091212
Kirkuk, At Ta'mim 35.4681 44.3922 1.023813155
Rand, Diyala 34.5267 45.1143 0.896039238
Tikrit, Sala ad Din 34.6158 43.6786 0.734876112
Kifri, Diyala 34.6896 44.9606 0.558963724
Mosul, Ninawa 36.335 43.1189 0.536602735
Al-Latif, Basrah 30.5911 47.7589 0.536602735
Al-Mansuriyah, Diyala 34.0408 45.0058 0.536602735
Dawah, Basrah 30.9583 47.4939 0.536602735
Hafiz, Muthanna 31.2031 45.6084 0.536602735
Hawijah, Diyala 34.0167 44.3833 0.536602735
Kufa, Najaf 32.0347 44.4033 0.536602735
Mahmud Abbas, Sala ad Din 33.9229 44.3193 0.536602735
Nahar, Dhi Qar 30.8333 46.55 0.536602735
Sharqiyah, Dhi Qar 30.8276 46.5914 0.536602735
Tuz Khurmatu, Sala ad Din 34.8881 44.6326 0.536602735
KhBani Saad, Diyala 33.5656 44.5434 0.45840862
Choman, Arbil 36.6367 44.8882 0.45840862
Alberta, Baghdad 33.2533 44.8289 0.431804483
Baghdad, Baghdad 33.3386 44.3939 0.410030579
Haditha, Anbar 34.1348 42.3772 0.306219726
Dora, Baghdad 33.2482 44.4091 0.10083704
Askar, Sulaymaniyah 35.8274 44.911 0.080227287
Information Variable
Table 7

147
While the presence of the Informational variable is widespread, it is very important to
understand where its intensity will have the greatest effect. Despite the lack of subject
matter content analyzed results, spatial identification of where positive public
communications perceptions that will be amplified (or conversely where generation of
negative perceptions will do the greater harm) is a critical part of getting ‘the biggest
bang for the buck’ from a Stability Operations initiated activity. This variable is especially
influenced by the positive, neutral, or negative tonal evaluations of the reports. By
identifying where the impact will have the greatest effect, decision makers can better
understand where to focus messaging activities.
The Infrastructure variable was the most difficult to derive from the GDELT
database. Explicit references to the words ‘infrastructure’, ‘utilities’, ‘transportation’, or
‘construction’ within the GDELT various event code descriptions used for the recoding
were not present. The only word remotely related was ‘property’. This was referenced
in terms of the seizure, release or destruction of stated property. While not optimal, this
was used for this variable. For the Infrastructure operational variable, the SQL query
resulted in 47 observations for analysis (Figure 48).

148
Map of Infrastructure Operational Variables
Figure 48
Through calculation of the descriptive statistics, the magnitude (NumArticle)
variable attribute has a mean of 3.87, median of 4.00, standard deviation of 3.18, and
skewness of 0.89. It is initially found not to be skewed. Additional exploratory analysis of
the NumArticle variable attribute via ‘Box-Plot’ analysis calculates the critical values of
Q1: 1.00, Q3: 5.00, IQR: 4.00, lower whisker: -5.00, and upper whisker: 11. Given these
values, the Infrastructure NumArticles dataset has one positive outlier and no negative
outliers. This further supports the finding of a lack of skewness. The additional K-S
normality test conducted on the standardize values with a null hypothesis of normal
distribution, a mean of zero (0) and a standard deviation of one (1) provides p-values
less than 0.05, causing rejection of the normality null hypothesis at the 95% confidence
level. Because of the ambiguity of skewness in the data, the Bootstrap transformation is

149
used to find a concentration level to conduct the analysis. Identification of the magnitude
low level conglomerates begins with a BCa bootstrap analysis conducted on the
NumArticle attribute resulted with (3.10, 4.81) as the bounds with a 95% confidence
level. The lower conglomerate periphery attribute query within ArcGIS identifying all
values less than 3.10 (i.e.: the lower outliers) produces a spatial concentration reflecting
of the 47 Infrastructure variable events reported Iraq during the month of September
2008, 23 were of lower magnitude with 17 events deemed of higher magnitude.
The Infrastructure NumArticle attribute global spatial autocorrelation produces a
global pattern that is non-statistically significant (i.e., not different than random). The
Local Moran´s Index analysis identifies only one area that can be classified as either a
spatial cold spot cluster (LL) or spatially cold outlier surrounded by areas of greater
activity (LH). The intersection of the concentration (all attribute values less than the
bootstrap lower bound of 3.1) and the spatial agglomerations/spatial outliers (all
attribute values designated as LL or LH) produces the following spatial analysis point of
statistical significance shown in Figure 49.

150
Infrastructure NumArticle Conglomerate
Figure 49
The lack of multiple Infrastructure NumArticle Conglomerates does not
necessarily mean that there are not multiple reports placed concerning property. In
reviewing the Global Moran’s Index, the p-value for this Global Moran’s I is not
statistically significant and thus the null hypothesis of the data being randomly
distributed cannot be rejected. The spatial distribution is apparently random. There are
no municipalities representing greater potential neglect of Infrastructure engagement in
comparison to others.
Continuing with the intensity variable attribute with the same number of SQL
query observations (47), AvgTone has a mean of 4.56, median of 4.50, standard
deviation of 1.33, and skewness of 0.26. It is initially not found to be skewed. Additional
exploratory analysis of the AvgTone variable attribute via ‘Box-Plot’ analysis calculates

151
the critical values of Q1: 3.60, Q3: 5.56, IQR: 2.06, lower whisker: 0.52, and upper
whisker: 8.75. Given these values, the Infrastructure AvgTones dataset has no positive
outliers nor negative outliers. This supports the finding of a lack of skewness. The
additional K-S normality test conducted on the standardize values with a null hypothesis
of normal distribution, a mean of zero (0) and a standard deviation of one (1) provides
p-values greater than 0.05 (0.20), causing a failure to reject the normality null
hypothesis at the 95% confidence level. Despite of the lack of skewness in the data, the
Bootstrap transformation is used to find a concentration level to conduct the analysis
(methodology continuity). The AvgTone BCa bootstrap analysis conducted resulted with
(4.198, 4.998) as the bounds with a 95% confidence level. The higher conglomerate
periphery attribute query within ArcGIS identifying all values greater than 4.998 (i.e.: the
higher outliers) produces a spatial concentration reflecting of the 47 Infrastructure
variable events reported Iraq during the month of September 2008, 17 were of lower
intensity with 17 events deemed of higher intensity. With identification of the non-spatial
but parametric characteristics of the Infrastructure AvgTone attribute, spatial
autocorrelation of the attribute is conducted to identify local Moran´s Index and which
ones are considered as spatial hot spot clusters (HH) or spatially hot outliers
surrounded by areas of lesser activity (HL). When combined the concentration (all
attribute values greater than the bootstrap upper bound of 4.998) and the spatial
agglomerations/spatial outliers (all attribute values designated as HH or HL) produces
the spatial analysis illustrated in Figure 50.

152
Infrastructure AvgTone Conglomerate
Figure 50
The Infrastructure AvgTone Conglomerate consists of municipalities within the
Diyal, Sala ad Din provinces. Three sites in total, the collection represents a mixture of
territories occupied by Sunni, and Kurd pluralities. These municipalities represent areas
of greatest potential effectiveness for Infrastructure engagement, in comparison to
others.
The final conglomeration step of applying the ‘minimum magnitude/maximum
intensity’ rule to the standardized NumArticle and AvgTone attributes is applied. The
result is three identified municipalities with values for the Infrastructure operational
variable (Table 8).
Municipality Latitude Longitude Infrastructure Variable
Tikrit, Sala ad Din 34.6158 43.6786 0.947684463
Baqubah, Diyala 33.7466 44.6437 0.892147966
Baghdad, Baghdad 33.3386 44.3939 0.815156456
Infrastructure Variable
Table 8

153
The Infrastructure variable does not present any major spatial outliers but does
have areas of statically significant spatial concentration in Diyala and Sala ad Din. The
implication of so few spatial hotspots is that these locations have relatively higher
dynamics in terms of property (or, as an extension property rights). While not an initially
obvious conclusion, bear in mind that a critical factor in Stability Operations is the
allocation (or the ability to adequately track the allocation) of public goods. The first step
in this is to identify for a society what is a public good (in terms of both services and
property). This is not a completely settled or decided issue. Beyond the obvious
extremes of property rights between strict capitalism, strict marxism (socialism), and
strict communist economic systems, individual societies and nations practice some
hybrid form of economic system in which the designation between private and public
goods can radically deviate from the understood U.S. norm. The analysis of the
Infrastructure variable designates flashpoint locations as well the importance of
addressing structural improvement in tandem with host nation governments in the post-
Surge environment.
Statistically overlapping conglomerates of magnitude and intensity for each
individual PMESII variable enabled identification highest priority areas for variable. .
Each PMESII highest priority areas is identified by calculating intensity (AvgTone) minus
magnitude (NumArticle) for each statistically significant raw value of AvgTone and
NumArtcle. Application the ‘minimum magnitude/maximum intensity’ rule develops
factors from which final scores can be calculated in the AHP MMC model. Without this
modification of Treviño’s original Conglomeration procedure, completion of the SDSS’
MMC could not take place.

154
7.4 AHP in the MMC
As stated above, the method of jointly analyzing the PMESII operational
variables in this study is AHP. As a Full Aggregation MCDA modeling technique, a
score for each selected judgment criterion is developed and then combined into a global
score for each alternative. While this analysis can be conducted within GIS using
rasterized data for polygon geographies, efficiency in using point data calls for
conducting the same Boolean operation raster algebra style calculations within a
database/spreadsheet construct without conversion of the spatial representation from
vector to raster. Because the point locations are identical (matched using
latitude/longitude), a sieve procedure is used to conduct the overlay allowing the
‘Boolean-like’ calculations.
The AHP procedure evaluates a set of alternative options based upon a set of
criteria for determination of which alternative is the better decision for a stated goal.
Users of AHP should note that, when dealing with criteria that can be interdependent
and somewhat intangible, the best option is not the one which generally optimizes each
single criterion, but is the one which accomplishes the goal based upon prioritization of
the different criteria. 295 Built into the tree-like criteria and alternatives hierarchy, the
alternatives are evaluated with respect to each criterion and each criterion is weighted
according to a collective stakeholders’ or decision makers’ importance assessment.296.
The scoring system allows the ranking of alternatives from best to worst to include equal
ranking of alternatives. Again, the three general hierarchical steps are: goal
identification, criteria selection, and alternative sets determination (courses of action).
For this analysis the goal is identification of municipalities in which to concentrate

155
Stability Operations efforts after the 2008 Iraqi Surge. The criteria are the PMESII
operational variables. The alternatives are the municipalities within the country of Iraq.
The higher score determines the greater overall preference among the municipalities.
The beginning of criterion weight development first involves ranking of criteria. In
this case, the Delphi participants (four in total) are asked to rank-order the interrelated
PMESII operational variables in respect to each one’s importance to the 2008 post-
Surge OE. This set of criteria was selected due its pervasive use as aspects of the OE
describing not only the military aspects but also the population’s influence on them. The
populace’s influence is a main factor for the effectiveness of Stability Operations. The
ranking procedure is from one (1) to six (6) with one having the greatest priority. The
composite ranking developed using the median average value of the four Delphi
participants for each of the PMESII operational criterion resulted following collective
ranking shown in Table 9.
Rank #1 Rank #2 Rank #3 Rank #4 Rank #5 Rank #6 Political Military Infrastructure Information Economic Social
Collective Operational Variable Ranking for post-Surge AHP Table 9
The analysis is continued with the construction of a pairwise comparison matrix.
Each of the PMESII operational criterion, in collective rank order, are compared to the
PMESII criterion in the level immediately below with respect to its rank. These pairwise
comparisons result in weights for application to each PMESII value within each Iraqi
province. Again, the Delphi participants are a proxy for the military staff within MDMP.
Each Delphi panel participant is asked to prioritize the rank-ordered PMESII
operational criterion by pair-wise comparing them for preference. The numbered scale

156
serves as an indication of how many times more important one PMESII criterion is over
another. Table 10 demonstrates the scale.
Intensity of Importance Definition Explanation
1 Equal Importance The row criterion is valued equal to the column criterion
3 Moderate importance The row criterion is valued slightly more important to the
column criterion
5 Strong importance The row criterion is valued more important to the column
criterion
7 Very strong importance The row criterion is valued intensely more important to the
column criterion
9 Extreme importance The row criterion is valued exceptionally more important to
the column criterion
Intensities of 2,4,6, and 8 are used for intermediate values.
AHP Pair-Wise Comparison Scale297 Table 10
The pair-wise comparison procedure is conducted using a six-by-six square matrix
illustrated in Table 11. The order of each row and column is determined by the
consolidated ranking conducted in the previous questionnaire. Each row criterion is
compared individually to each column criterion within the matrix using the values as
defined in the Pairwise Comparison Scale. Comparisons between the same criterion in
both the row and column positions receives a value of one (criterion is valued equal to
itself). This ‘diagonal row’ is highlighted in yellow. The reciprocal values are entered in
its transpose position highlighted in gray (Table 11).
Political Military Infrastructure Information Economic Social
Political 1.00 1.50 3.00 3.00 4.50 3.50
Military 0.67 1.00 4.00 2.50 5.00 3.00
Infrastructure 0.33 0.33 1.00 0.63 2.00 2.50
Information 0.33 0.40 1.60 1.00 3.50 1.50
Economic 0.22 0.20 0.50 0.29 1.00 2.00
Social 0.29 0.33 0.40 0.67 0.50 1.00
Median AHP Weight Development Matrix Table 11

157
The rank ordered pairwise comparison square matrix are used to calculate an
eigenvector. Developed from matrix algebra, eigenvectors are a special set of scalars
(either in a single row or single column) associated with a linear system of equations
(aka characteristic roots). The values of the eigenvector are the used as weights for
application with respect to the PMESII variable scores for each municipality calculated.
The calculated weight values are presented in Table 12.
Political Military Economic Social Information Infrastructure
.343 .275 .109 .149 .065 .061 AHP Weight Values for Operational Variables
Table 12
Additionally, as per the AHP method, a check for consistency is conducted. The
Consistency Ratio (CR) measures how consistent the judgments have been relative to
large samples of purely random judgments. AHP evaluations are based on the
assumption that the decision-maker is rational (i.e., if A is preferred to B and B is
preferred to C, then A is preferred to C). When the relationship between pairwise
comparisons does not hold, then the situation is inconsistent. Inconsistency can occur
due to vaguely defined problems or insufficient information (aka bounded rationality).298
If the CR is greater than 10 percent (0.1), then the judgements are deemed unreliable
due too closeness to randomness, making the exercise valueless and in need of
repeating.
To calculate the CR, first conduct matrix multiplication of the original rank
ordered pairwise comparison square matrix by its eigenvector which generates a
product vector. Next, a value termed λmax (pronounced lambda max) is calculated by
averaging the quotients of each product vector cell value against its corresponding
eigenvector cell value. The following calculation is the Consistency Index (CI). CI is

158
found by formula: CI = (λmax-number of rows) ÷ (number of rows -1). Finally, the CR is
calculated via taking the CI and dividing it by a Random Index (RI) value as the
denominator. The RI is the consistency index value if the entries of the rank ordered
pairwise comparison square matrix were completely random using the Saaty
comparison scale. This average value of random matrices was developed by Forman
and is based upon the number of rows within the selected pairwise comparison square
matrix.299 For the necessary RI, find the value corresponding to the number of matrix
rows in the Table 13. This gives a λmax of 6.471489191. Thus, the value for CI is
(6.471489191 - 6) ÷ (6 -1) or 0.0942984. Since this matrix had six rows, CR = CI/RI =
0.0942984/1.24, or 0.07604664 (≈ 0.08). Since this value of CR is less than 0.10, the
weights are found to be consistent.
# Rows 1 2 3 4 5 6 7 8 9 10 11 12 13 14 15 Value 0.00 0.00 0.58 0.90 1.12 1.24 1.32 1.41 1.45 1.49 1.51 1.48 1.56 1.57 1.59
Values of the Forman/Saaty Random Index (RI) Table 13
With both the individual municipality PMESII operational variables values and the
PMESII weights computed, the final AHP step is to compute a scores for the various
municipal alternates for Stability Operations main effort selection. For each of the 292
municipalities under consideration, each one requires the specific PMESII value
multiplied its corresponding PMESII weight. Then, for each municipality, the PMESII
products are summed for a total score. The highest score is selected as the post-Surge
Stability Operations main effort. While a deliberate procedure aided by the fact that
many of the individual PMESII scores for many of the municipalities are zero, the actual
management of this task require use (once again) of the MS Access relational database
management system (RDBMS) and MS Excel for the computations.

159
While a full mathematical explanation of the AHP is beyond the scope of this
study, details of the calculations conducted using an open source MS Excel model from
SCB Associates of London, England are contained in the Appendix.
7.5 Final Results
As noted in Table 14, the national capital of Baghdad is the highest ranked
municipality according to the AHP calculations of the ranked PMESII coded and
Treviño’s Conglomeration analyzed GEDLT data. Mosul, the originally selected main
effort municipality, ranked seventh of all of the municipalities with statistically significant
values.
Rank Municipality Latitude Longitude Final AHP Score
1 Baghdad, Baghdad 33.3386 44.3939 0.4898
2 Khanaqin, Diyala 34.3482 45.3906 0.3204
3 Mahdi, Diyala 33.8241 45.0788 0.2659
4 HasNasrallah, Diyala 33.8403 45.0690 0.2452
5 Arbil, Arbil 36.1926 44.0106 0.1869
6 Abu Ghurayb, Baghdad 33.3070 44.1869 0.1724
7 Mosul, Ninawa 36.3350 43.1189 0.1699
8 Tuz Khurmatu, Sala ad Din 34.8881 44.6326 0.1699
9 Sangaw, Sulaymaniyah 35.2860 45.1768 0.1603
10 Hawr Rajab, Baghdad 33.1936 44.4049 0.1428
11 Jabarah, Diyala 34.5925 44.9338 0.1410
12 Baiji, Sala ad Din 34.9307 43.4931 0.1387
13 Al-Harthiyah, Baghdad 33.3030 44.3711 0.1350
14 Ali Kazim, Babil 32.3669 44.9621 0.1350
15 Basra, Basrah 30.5330 47.7975 0.1350
16 Imam Mansur, Diyala 34.0209 44.7355 0.1350
17 KhDari, Baghdad 33.2941 44.0726 0.1350
18 Muthanna, Baghdad 33.3491 44.4682 0.1350
19 Zayyunah, Baghdad 33.3270 44.4515 0.1350
20 Samarra, Sala ad Din 34.1966 43.8739 0.1315
21 Rutbah, Anbar 33.0372 40.2859 0.1129
22 Muhammad Amin, Diyala 33.8583 44.6522 0.1069
23 Sulaimaniya, Sulaymaniyah 35.5650 45.4329 0.1064
24 Tikrit, Sala ad Din 34.6158 43.6786 0.1056
25 Badr, Ninaw 35.7489 42.1222 0.0916
26 Jalawla, Diyala 34.2772 45.1779 0.0904

160
27 Quraysh, Diyala 34.4109 44.5058 0.0690
28 Kirkuk, Ta'mim 35.4681 44.3922 0.0665
29 Rand, Diyala 34.5267 45.1143 0.0582
30 Tarmiyah, Baghdad 33.6744 44.3958 0.0582
31 Baqubah, Diyala 33.7466 44.6437 0.0544
32 Ali Mansur, Sulaymaniyah 35.5119 44.9069 0.0530
33 SalmPak, Baghdad 33.1020 44.5835 0.0374
34 Kifri, Diyala 34.6896 44.9606 0.0363
35 Al-Latif, Basrah 30.5911 47.7589 0.0349
36 Al-Mansuriyah, Diyala 34.0408 45.0058 0.0349
37 Dawah, Basrah 30.9583 47.4939 0.0349
38 Hafiz, Muthanna 31.2031 45.6084 0.0349
39 Hawijah, Diyala 34.0167 44.3833 0.0349
40 Kufa, Najaf 32.0347 44.4033 0.0349
41 Mahmud Abbas, Sala ad Din 33.9229 44.3193 0.0349
42 Nahar, Dhi Qar 30.8333 46.5500 0.0349
43 Sharqiyah, Dhi Qar 30.8276 46.5914 0.0349
44 KhBani Saad, Diyala 33.5656 44.5434 0.0298
45 Choman, Liwa' Irbil 36.6367 44.8882 0.0298
46 Ariz, Diyala 33.5000 45.4667 0.0296
47 Balad Ruz, Diyala 33.6963 45.0778 0.0296
48 Madain, Baghdad 33.1500 44.6167 0.0296
49 Alberta, Baghdad 33.2533 44.8289 0.0281
50 Abd Al-Aziz, Ta'mim 34.9283 44.2303 0.0257
51 Haditha, Anbar 34.1348 42.3772 0.0199
52 Dora, Baghdad 33.2482 44.4091 0.0066
53 Askar, Sulaymaniyah 35.8274 44.9110 0.0052
Municipal Rankings for Post-Surge Stability Operations
Table 14
Since the purpose of this research is to provide a spatial composite depiction of
the conditions, circumstances, and influences affecting capability employment and a
commander’s decision making process (aka., the COP), the AHP results are mapped.
Because the AHP values represent an integration of key socio-economic factors within
the OE, these plotted points presented in a geographical hierarchy. While multiple
methods of selecting the categories are available, the most direct is to divide the 53
identified municipalities in three sections. Figure 51 is a depiction of a Stability COP for
the evaluated post-Surge OE conditions.

161
Map of Municipal Rankings for Post-Surge Stability Operations
Figure 51
The first thing to notice is that the vast majority of top identified municipalities are
not in the northwestern provinces (Ninawa, Arbil, and Duhuk) were the majority of the
Kurdish population, military forces, and government were. The top third ranked
municipalities, represented by dark green stars, are oriented in the central and eastern
provinces of Iraq. While issues of population and reporting frequency can account for
some discrepancies, another unrecognized issue is highlighted. The provinces of
Sulaymaniyah, Diyala, and even Baghdad are in close proximity and influence on Iran. If
the variables used do represent Stability Operations as a measure of an area’s
resistance to political, economic, social and structural degradation, then the top tier
municipalities not only embody areas that projects could provide greater returns against
insurgent influence but also identify areas of contention from Iran’s attempt at regional
hegemony. With the assumption that a robust security presence would still be needed

162
throughout the country after the Surge, the issues of Stability projects must address
those components that would strengthen the nation of Iraq as a whole.
8. POLICY IMPLICATIONS AND RECOMMENDATIONS
The ability to conduct relevant research for the implementation of location-based
policy initiatives is critical to issues concerning reestablishing safe and secure
environments, providing critical government services, reconstructing disaster
preparedness infrastructure, and establishing humanitarian aid. Such research must
incorporate the fact that the tailoring of policy initiatives to local environments is
necessary due to the situational variations across space geographies. SDSS models,
such as the one presented in this research, provide a policy support system that assists
in the decision making of semi-structured spatial problems. While generally associated
with urban planners during land use decision making analysis, the use of SDSS proves
to be applicable to location decisions during Stability Operations.
The purpose of this study is to advance a new analysis methodology for the
conduct of Civil Information Management for the U. S. Army. The policy implications
addressed are at both a micro (specific SDSS model) and micro (U.S. Army
implementation) level. At the micro level the results of the joint Content Analysis –
Conglomeration - Multicriteria Decision Analysis method of SDSS applied to the post-
Serge case study shows that a different Stability Operations main effort from Mosul was
identified. Both Content Analysis and Conglomeration are required as parts of the
processing and analysis/evaluation CIM steps to prepare the data for the transformation
to information and knowledge. The use of AHP is a traditional method of multicriteria
decision making and is extremely applicable within the MDMP construct. Additionally,

163
the use of this Content Analysis – Conglomeration - Multicriteria Decision Analysis
method has possibilities beyond use in Stability Operations. The following begins with
an examination of each Content Analysis – Conglomeration - Multicriteria Decision
Analysis SDSS component for micro level policy adjustment.
8.1 Micro Level Policy Implications
The use of Content Analysis, while not conducted within this study, is necessary
for converting written qualitative data into quantitative data that can be spatially
presented and analyzed. While GDELT was used, it is a quantitative conversion of
written news articles. Content Analysis is used by many social science fields like
ethnography, anthropology, and urban planning to turn qualitative data (field reports)
into quantitative data beyond simple word counts. The Civil Affairs equivalent of social
science field reports (Stability SITREPS) can be transformed by Content Analysis for
quantitative analysis in both non-spatial and spatial environments. This is critical in
making positive use of little utilized data for Stability Operations.
Use of the Treviño’s Conglomeration procedure enables CIM's process and
analysis of civilian data through multiple social science models. The success in
mitigating informational problems and aiding decision making for public policy and
applied social sciences such as urban planning is transferable to Stability Operations.
Most of stability’s civilian data are qualitative. The use of content analysis enables use
of Treviño’s Conglomeration for merging of various civil variables, facilitating holistic
understandings various populations and their issues within an OE. CIM cells can use
Conglomeration to conduct sub-geography and sub-population analysis to reveal
combined social characteristics. These results can be spatially displayed and inform

164
military leader’s actions within the operational area when conducting specific stability
activities. Part of the value of conglomeration is its relative simplicity (if not ease). The
method enables the overlay of non-spatial and spatial data for variables of magnitude
and intensity separately, then combines the results in another overlay to identify key
locations concerning a specific social issue. In order to gain the processing and
analyzing capabilities of the CIM cell mission, use of Treviño’s Conglomeration is
presented as an option.
The AHP method differs very little to decision making applications conducted
during the Army’s MDMP. Specifically, AHP is but one of many valid methods to
conduct Step 5 of MDMP – Course of Action (COA) Comparison. The most used
method for COA comparison is a decision matrix. Generally, the decision matrix is the
summation of subjective criteria weights applied to criteria value of each actionable
alternative (COA). AHP provides a formalized method for subjective weight
development that is not arbitrary. For the purposes of this research, AHP is also a
technique applicable to spatial analysis.
8.2 Macro Level Policy Implications
At a macro level, any concept development or new policy implication
recommendation within the U.S. DoD will focus on identification of capability gaps in
implementing any new analysis methodology. The organization responsible for
managing this process and approving such proposals is the U.S. Army Training and
Doctrine Command (TRADOC). As part of the overall U.S. Department of Defense Joint
Capabilities Integration and Development System (JCIDS), the template used to assess
either the non-material or materiel approaches required for addressing such capability

165
gaps focuses on the subjects of doctrine, organization, training, materiel, leadership and
education, personnel, and facilities (DOTMLPF).300 The Doctrine analysis examines how
the military fights battles with emphasizes on ground maneuver combat. The
Organization analysis examines how the Army is preprogrammed for fighting to see if
there is a better structure that can be developed. The Training analysis examines how
the Army prepares forces to function from basic training, advanced individual training,
various types of unit training, joint exercises, and other ways to see if improvement can
be made. The Materiel analysis examines all the necessary systems and equipment
that are needed by Army forces to effectively fight and operate and examines where
new systems are needed. The Leadership and Education analysis examines how the
military prepares leaders to lead the fight thought out their overall professional
development cycle. The Personnel analysis examines availability of qualified Soldiers
for peacetime, wartime, and various contingency operations. The Facilities analysis
examines military property, installations and industrial facilities that support the armed
forces.
Currently, CIM cells lack the ability to conduct SDSS style analysis. While
potential analysts and system developers from SDSS' stakeholder components are
identified within the Army's Civil Affairs units, the skill set proficiencies currently held are
necessary but not sufficient for CIM effectiveness. This constitutes a capability gap as
defined by the JCIDS. CIM depends on three interconnected skill sets: social science
research, analysis, and evaluation capability; installation, operation, and maintenance of
information systems (both geographic and non-spatial); and geo-spatial knowledge
management (including, by definition, both information management and

166
analysis/evaluation capabilities) and presentation of the OE. For the U.S. Army, these
capabilities supposedly are spread between three enlisted military occupational
specialties (MOS) and an officer career field/branch.
Geospatial engineers (MOS 12Y) install, manage, and utilize geographic
information systems, but their training is focused toward terrain and infrastructure
analysis. They lack practical training geospatial analysis applications toward social
science issues. While the skill set is the same for developing the basic layers required in
GIS, the type of geospatial analysis training required to display and analyze the socio-
econ-political aspects of the civil environment is more statistically grounded and not part
of the Army’s geospatial engineer curriculum.
Information systems operators (MOS 25B) install and maintain necessary
computer information systems, but lack the skills to develop and manage database
systems (again both geographic and non-spatial). A critical component of CIM is the
ability to conduct knowledge discovery in databases (KDD, aka Data Mining), the
process of data selection, preparation, cleaning, pattern extracting, appropriate prior
knowledge incorporation, and proper results interpretation are jointly conducted
ensuring that useful knowledge results from the analysis.301 The term often used in
conjunction with Data Mining, ‘Big Data’, is misleading because issue with the datasets
in question is not one of dataset size but one of useful information and knowledge
extracted.302 The difficulty is not only due to size, but correspondingly to the complexity
and ‘messiness’ of the data. Key to the ‘data selection, data preparation, data cleaning’
is a basic ability to operate databases in order to gather, arrange and organize the raw
data needed for CIM analysis. Database operation includes the abilities to update,

167
query, join, and quality control the data with a database. These are the skills lacking
from the 25B MOS.
Civil Affairs Officers (Career field/branch 38A) and Civil Affairs Non-
commissioned officers (CA NCOs - MOS 38B) provide tactical-level knowledge of the
civil environment but often lack advanced socio-econ-political (Stability) spatial analysis
capabilities to include how to integrate those stability factors spatially into a maneuver
commander’s decision-making cycle. While the CA qualification courses for both active
and reserve components, and the CA NCO classification and reclassification courses
provide in depth training in socio-economic aspects of an OE, the training stops short of
teaching how to integrate them towards a decision during Stability Operations. All Army
officers approaching the rank or at the rank of Major are required to attend Intermediate
Level Education (ILE), a program for mid-career officers preparing for battalion
command or other field-grade positions at the division, brigade, or battalion levels and a
curriculum including instruction on the Military Planning and Decision Making Processes
(MDMP). NCOs assigned to battalion or higher operational coordinating staff positions
attend the Battle Staff NCO course where they are instructed in the intricacies of
MDMP. While MDMP is an effective standard for developing and analyzing courses of
action, its implementation in the Army is generally Combat operationally focused. The
listed cell entity issues described above constitute gaps in the organization, training,
personnel, and material perspectives of the JCIDS assessment for CIM.
Four possible remedies are offered. The first one address the training JCIDS gap
aspect. Each CIM cell entity can gain the required additional training needed for true
mission capability. For the 12Y and 25B MOS soldiers, the additional required skills can

168
be obtained through local community colleges and universities. As an incentive,
Soldiers within these MOS could be specially designated to receive funding under
various Army Reserve educational programs. For the 38A officer and the 38B NCO,
much of the advanced analysis capability is obtainable through the Security, Stability
and Development in Complex Operations (SSDCO) certificate program at the Naval
Postgraduate School (NPS). While probably the least expensive, this course of action is
problematic in implementation. It is not a deliberate action to ensure, as much as
possible, each unit’s CIM cell personnel receives the requisite additional training
required to fulfill the mission.
A second possibility addresses the training, and personnel JCIDS perspectives. It
calls for the creation of an additional skill identifier (ASI) for the Civil Affairs
noncommissioned officers (38B MOS) in place of the 12Y MOS. The CIM ASI integrates
Civil Affairs cultural training with the critical geo-spatial analysis and database
management skills. Plan of instruction (POI) management would need to originate at the
CA proponent (Special Warfare Center and School - SWCS). A possible alternative or
equivalent ASI certification could be obtained through civilian higher education facilities
and may mitigate cost. While funding and time would affect the training aspect of this
option, there would be a delay on units deemed ‘ready’ due to time it would take to have
the designated 38B NCOs gain the ASI.
The third possibility also addresses the training, and personnel JCIDS
perspectives in calling for creation of a manned Geospatial Engineering Technician
Warrant Officer position (125D) in addition to the enlisted 12Y MOS . This option
involves the organization, training, and personnel JCIDS perspectives. The intent is to

169
use the 125D Warrant’s current duty description in conjunction with the socio-economic
analysis requirements for CIM. A 125D current duties includes: assimilation, integration
and management of Geospatial-Intelligence (GEOINT) data and products,
implementation of analysis aiding the commander and his staff’s visualization and
understanding of the terrain’s impact upon operations, and participation with the
planning staff in each step of the Military Decision Making Process (MDMP) facilitating
decision making with accurate information. The 125D Warrant often serves as the
Officer in Charge (OIC) of a GEOINT cell, working with analysts for production of
mission-focused products that enable situational understanding.303 In order to gain the
‘civil’ component knowledge needed to be an OIC of a CIM cell, the 125D would be
required to attend the SSDCO certificate program at NPS or similarly structured course.
Analysis of the ‘civil’ component supplants the ‘intelligence’ focus found in a GEOINT
cell. The Warrant Officer position would potentially replace a Commissioned Officer as
the cell chief, or at least serve as the second in charge replacing the Non-commissioned
Officer in Charge (NCOIC – normally the second in charge). Funding and time would
affect this option the least in comparison to others. The most difficult part of
implementing this option is the availability of 125D Warrants willing to take the additional
SSDCO the training required.
The final possibility is creation of a ‘CIM Warrant Officer’. This option involves the
organization, training, and personnel JCIDS perspectives. The intent is to consolidate
most of the interconnected skill sets into one position. A Warrant Officer 380A position
would combine capabilities of a senior Civil Affairs NCO, Battle Staff operations NCO,
social science analyst and geo-spatial knowledge manager. The skill merger would

170
create subject matter experts in Stability Operations, civil knowledge management, and
CMO planning and execution at the Civil Affairs Battalion through CAPOC echelons.
The creation of CA Warrant Officer billet has been one of contention, with many Army
officials stating that the Civil Affairs branch is attempting to model itself after U.S. Army
Special forces despite the reserve CA branch having been removed from the U.S. Army
Special Operations Command (USASOC) in 2006. This option is probably the most time
consuming, most expensive, and most difficult to implement. As with the ASI option,
POI management would need to originate at SWCS. Conversely to the ASI option, an
organizational change would be needed. This Warrant Officer position would also
potentially replace a Commissioned Officer as the cell chief. Additionally, personnel
available will have a greater delay than the ASI option due to time it would take to both
complete Warrant Officer school and the SWCS developed POI (a rough estimate of
two years, minimum). There is an additional personnel concern with development of a
CIM specific CA Warrant Officer creation. With the limited availability of positions
(approximately 40 to 50 positions would be created within U.S. Army Reserve Civil
Affairs units) qualified 38B NCOs may be discourage from applying due to unit locations
and lack of proximity to candidate civilian residences.
All of these options are dependent upon material issues. Despite many of the
CIM discussions focusing upon what computer system will serve as the ‘coin of the
realm’, the minimum needs for a CIM cell is a suite of four laptop computers with
specifications to run a GIS program (2.2 GHz computer speed, 8 GB memory, 256 MB
graphics card, and 6 GB or more of diskspace); a SQL (Structured Query Language)
server to function as a RDBMS; and a GIS program capable of conducting the spatial

171
statistical analysis conducted earlier in this study. The suite of computers is similar to
what is found in Mission Planning Kits (MPK), a standalone local area network (LAN)
group of computers with associated devices that share a collective communications line.
While these MPKs are capable of interconnecting to a larger tactical local network, the
purpose here is to create a closed or partially closed system in order to employ a
division of labor for the joint Content Analysis – Conglomeration - Multicriteria Decision
Analysis method for the MMC. The computers would be configured with three
computers to breakout the individual parts of the MMC with one computer to serve as
an internal SQL server in order to allow data and information exchange between the
other breakout computers.
The options presented for a Stability COP capable CIM are valid ones, meeting
the military review protocol of being FAS: Feasible, Acceptable, and Suitable. Feasible
in terms of being capable of accomplishment within designated time, location, and
resource contraints. Acceptable meaning capable of balancing the cost/risk with the
reward gained. Suitable regarding capable accomplishment within the commander‘s
intent and planning guidance. Regardless of any of the presented options, or others not
presented here, additional capabilities are required for the proper conduct of CIM’s
collate, process and analyze/evaluate steps.
8.3 Policy Implications Beyond Stability Operations
The use of this Content Analysis – Conglomeration - Multicriteria Decision
Analysis method has potential beyond Stability Operations. Cities and towns conduct
community surveys in order to gage the satisfaction of various customer service
initiatives. These surveys tend to be heavily oriented to closed-ended survey questions

172
that limit the response to a pre-selected option list. With the addition of a structured
open-ended questions focused on a specific analysis framework topics, the Content
Analysis – Conglomeration - Multicriteria Decision Analysis method can be used to
identify needful sub-city areas strong potential of positive impact. Specifically, the
analysis would be useful in determining what urban policies (housing, economic
development, transportation, anti-poverty) could be combined for maximum effect.
9. CONCLUSIONS
9.1 Overview
This study is an attempt to apply the Spatial Decision Support System
methodology to the analysis of military Stability Operations, the conduct of Civil
Information Management (CIM), and the creation of a Stability orientated Common
Operational Picture. Unlike the majority of discussions in the U.S. Army concerning CIM
concentrating on what computer program system should be adopted, the concepts
presented focus on implementation of social-economic analysis skills applicable across
various multiple computerized analysis platforms. The study addressed the following
research questions:
• How can SDSS integrate qualitative political and socioeconomic factors into a singular visualization of the Stability Operational Environment (OE)?
• How can SDSS help provide a holistically spatial approach and systematic analysis adaptable to multiple situations and socioeconomic settings?
• How does SDSS facilitate cooperative planning and support all echelons in achieving situational awareness and decision making?
The study demonstrates that SDSS integrates qualitative data through use of the
Content Analysis – Conglomeration - Multicriteria Decision Analysis MMC method that

173
transforms text data into geographically referenced, statistically analyzed data for use
as decision criteria. Thorough use of a generalized analysis framework or heuristic (e.g.,
PMESII) as the decision criteria for an AHP model, this research demonstrated that
SDSS is adaptable to multiple situations and provides the capability of achieving a
spatially holistic approach. Such analysis frameworks are designed to partition key
social, economic, and demographic aspects of an OE, while the scoring, factor
weighting, and factor aggregation conducted within AHP combines the analysis
framework values for each location into a holistic value for comparison with other
locations within the OE based on the decision maker’s priorities. Finally, this study
demonstrates how SDSS facilitates collaborative planning toward situational awareness
and decision making through its use of the Delphi survey technique to produce
statistical weight to apply individual criteria values for each location in order to decide
where to apply resources. Overall, this study is significant for expanding both the Urban
Planning and SDSS fields of study and providing technical and methodological
capabilities to the U.S. Army Civil Affairs, Peacekeeping, and Stability Operations
communities.
9.2 Strengths and Limitations of the SDSS Method
The Spatial Decision Support System methodology for Stability
Operations/Peacekeeping analysis and the conduct of Civil Information Management
presented both strengths and limitations. The major strengths of the system include:
• Flexibility – this SDSS allows for various methods to be used, especially in the model management component (MMC). Various analysis frameworks are available for both the Content Analysis and Multicriteria Decision Analysis portions of the MMC.

174
• Adaptability – this SDSS can be applied during multiple phases of theater operations. Additionally, it can incorporate interoperability between joint U.S. military taskforces, U.S. interagency collaborations, multinational military coalitions, and Non-governmental organizations (NGOs) coordination.
Many limitations were overcome, as the methodology endured a myriad of
revisions. A summary of the limitations includes:
• Data – As stated in the beginning of this study, the GDELT dataset is a proxy for military SITREP and other governmental reports that would describe various aspects of the operational environment. GDELT is based upon broadcast, print, and web news articles and required a re-coding of the data for use in the PMESII analysis framework. Conducting the Content Analysis – Conglomeration - Multicriteria Decision Analysis MMC method with reports designed to directly support the PMESII analysis framework or any other designated analysis framework should improve the results.
• Content Analysis - Specifically, with the GDELT, running the Tonal Analysis model require some experience with statistical spatial analysis. It is specific to the GDELT database. With the use of other datasets, the specific Tonal Analysis model would not be needed to run the SDSS.
• Skill requirements – analysis using this model is difficult for one person to conduct alone. It requires a unique set of skills for a single individual to possess: GIS spatial analysis, statistical analysis, database management, and socio-cultural expertise just as a base. While it is not impossible to identify a person with all of these capabilities, the pool for such persons is limited. This Content Analysis - Conglomeration - Multicriteria Decision Analysis model requires a team of individuals with the collective skills mentioned.
9.3 Further Study Recommendations
Based on the research results and policy implications stated above, multiple
areas of research and development have been identified for future improvement of
SDSS use in CIM and Stability Operations analysis. The first is to attempt the Content
Analysis – Conglomeration – Multicriteria Decision Analysis model with raw (qualitative
written reports) data to conduct actual content analysis. This would require use of

175
SITREPs from real world missions (most of which are classified or designated as ‘For
Official Use Only – FOUO’).
Another recommendation is the use of other analysis frameworks or heuristics
besides PMESII. The use of an analysis framework affects both the conduct of Content
Analysis (coding) and Multi-Criteria analysis (decision criteria). While PMESII is the
‘overarching’ variable set for use in operational analysis, the needs of the maneuver
commander or the situation at the time of analysis (aka., the specific phase of the
‘Continuum of Military Operations’) might dictate a more nuanced approach. From the
commanders’ perspective, they may want to understand how Stability Operations
support the individual Lines of Effort (LOE – groupings of multiple tasks based upon
purpose that focus efforts towards establishing operational and strategic end states).
The listed end states become the criteria which the data are organized, and the
decisional analysis is built upon. From an operational phase perspective, the pre-
combat or ‘Shaping’ and ‘Deter’ phases (Phase 0 and Phase 1 respectively) might
require a risk management evaluation or vulnerability assessment of governmental
systems needed for post-combat recovery. The CARVER (Criticality, Accessibility,
Recuperability, Vulnerability, Effect and Recognizability) analysis matrix is useful for
categorizing and prioritizing high risk facilities, systems and assets that are more critical
to mission success.304 During the ‘Stabilize the Environment’ and ‘Enable Civilian
Authority’ phases (number four and number five respectively), the Tactical Conflict
Assessment and Planning Framework (TCAPF) is more applicable. This heuristic is an
outgrowth the theoretical underpinnings from USAID’s Conflict Assessment Framework
(CAF) developed in 2005.305 While the CAF is strategically focused, the TCAPF,

176
developed in 2006, adapts the CAF to tactical and operational level actions and links
conflict assessments to planning at the local level.
Additionally, if the scope of the OE is beyond U.S. governmental participation,
use of the various framework tools developed by both academicians and practitioners
during stability activities are available. The ‘Measuring Progress in Conflict Environment’
(MPICE) framework is a top-down outcome-based system designed to measure both
operational and strategic advancements in stabilization environments. Using both
quantitative and qualitative indicators, MPICE measures three stability development
levels: imposed, assisted and self-sustaining.306 Another is the ‘Sphere Project’,
developed jointly by humanitarian nongovernmental organizations and the Red
Cross/Red Crescent society. The framework outlines six humanitarian response critical
areas: nutrition, water supply, food aid, shelter, sanitation, food security and health
services.307 Within these six indication areas there are multiple individual indices which
provide the ability to set benchmarks for aid and monitor tipping point demarcations of
societies transitioning from danger to viability.
The use of analytical frameworks leads to another subject of study, scoring. In
this research the initial scores (factors) were developed from standardizing the raw
GDELT data. As mentioned above, researchers at West Point used Principal
Component Analysis (PCA) to develop factors. This is a possible avenue to explore for
content analysis data use.
Yet another recommendation concerns the use of an alternate spatial
autocorrelation models. The Getis-Ord Gi* is a statistic identifying point clusters of
higher value than would be found by random chance.308 The statistic jointly evaluates

177
the spatial dependency effect of the observed occurrence and attribute values within the
construct of the conceptualized spatial relationship. Regular point pattern analysis
concludes if the distribution of point events results from random or a systematic
clustered/regular patterns. Methods like nearest-neighbor distances, kernel density
estimation, and K-function concentrate on the point event distributional phenomena.
While spatial information is accounted for in basic point pattern analyses, each point is
equally weighted regardless of their characteristics. Spatial autocorrelation methods are
an advanced point pattern detection incorporating not only the positions of events but
also, if appropriately defined, their associated values. Like the Local Moran’s I, Getis-
Ord Gi* discriminates between hot spots and cold spots. Unlike the Local Moran’s I, it is
solely dependent on a statistical method requiring only the use of vector data to identify
the positions of statistically significant hot and cold spots and the aggregation of points
to polygons for the analysis. Additionally, since the Local Moran’s I can be calculated for
vector polygons as well as the point used for this research, the analysis could be
conducted by aggregating the points to their corresponding province. Such aggregation
would change the focus of what municipality is best for as the Stability main effort to
what province would be best.
A final recommendation concerns the use of an alternate Multicriteria Decision
Analysis model. As stated above, AHP is but one MCDA method. The pairwise
comparison method is useful when the economic utility of each criterion is not known.
This is the environment in which CIM is normally deployed; however, there are other
pairwise comparison methods which could be utilized such as the MACBETH
(Measuring Attractiveness by Categorical Based Evaluation Technique).309 The major

178
difference between AHP and MACBETH is that the former method’s comparisons are
based on a ratio scale while the latter method’s comparisons are based on an interval
scale.

179
APPENDIX
Delphi Questionnaires
Questionnaire #1 Participant # ______
The “Surge” in context of Operation Iraqi Freedom (OIF) is the military operation intended to help the Iraqi
Government to secure neighborhoods, protect the local population, and provide security within the
Baghdad and Al Anbar Provinces through the use of an increased American tactical presence. Once this
offensive military operation was deemed effective, a transition to Stability Operations was conducted.
Stability operations are best summarized as various coordinated mission conducted to maintain or
reestablish a safe and secure environment, provide essential governmental services, emergency
infrastructure reconstruction, and humanitarian relief. The general start time period of this Post-Surge
Stability Operation is September-October 2008 with the theater main effort located in the city of Mosul,
Nineveh province of northern Iraq.
In order to effectively conduct any military operation, there must be an understanding of the Operational
Environment (OE). The OE is a composite analysis of the conditions, circumstances, and influences that
affect the employment of capabilities and bear on the decisions of the commander. The geographical
representation of the OE is known as a Common Operating Picture (COP) and is difficult to achieve
during Stability Operations due to general characteristics of socio-economic data not being readily
practical for meaningful graphical presentation. Both the OE and resulting COP presentation can and
should aid the analysis of where Stability Operations should be conducted.
This first round of questions are open-ended ones designed to establish why and how the Nineveh
province was selected as the main effort. The questions are meant to describe the procedure(s) used to
identify and describe the Post-Surge composite civil OE and how this OE was used in the designation of
the main effort area.
1. What were the factors leading to the designation of Nineveh province as the theater main effort?
2. Did these factors focus on civil / socio-economic issues or was the focus more toward security
issues?
3. What procedures were used in the analysis of the Post-Surge Operational Environment (OE)?
4. Were the conditions, circumstances, and influences affecting force capabilities and
bearing on the commander’s decisions geographically displayed in an integrated
fashion? If so, did it effectively aid in the decision to designate Nineveh province as the
theater main effort?

180
Questionnaire #2 Participant # ______
1. In this second round your input will aid the establishment of a decisional Common Operation
Picture (COP) for Post-Surge operational environment (OE). This is an analytic approach for
solution to the problem of where should the main effort for post Surge Stability Operations be
designated (i.e. which Iraqi municipality). This involves the ranking of criteria in a similar
procedure used in the Army’s analytic approach known as the military decision making process
(MDMP). In this case the Delphi participants are a proxy for the military staff within MDMP.
2. Each Delphi panel participant is asked to rank-order the interrelated operational variables used by
the U.S. military to analyze the 2008 Post-Surge OE. Known as PMESII, these operational
variables are: political, military, economic, social, information, and infrastructure. They are the
criterion for analysis. This set of criterion was selected due its pervasive use as aspects of the
operational environment describing not only the military aspects but also the population’s
influence on it. The populace’s influence is a key factor in the effectiveness of Stability
Operations.
3. The ranking procedure is from one (1) to six (6) with one having the greatest priority. A composite
ranking will be developed using the median value for each of the PMESII operational criterion.
____ POLITICAL
____ MILITARY
____ ECONOMIC
____ SOCIAL
____ INFORMATION
____ INFRASTRUCTURE
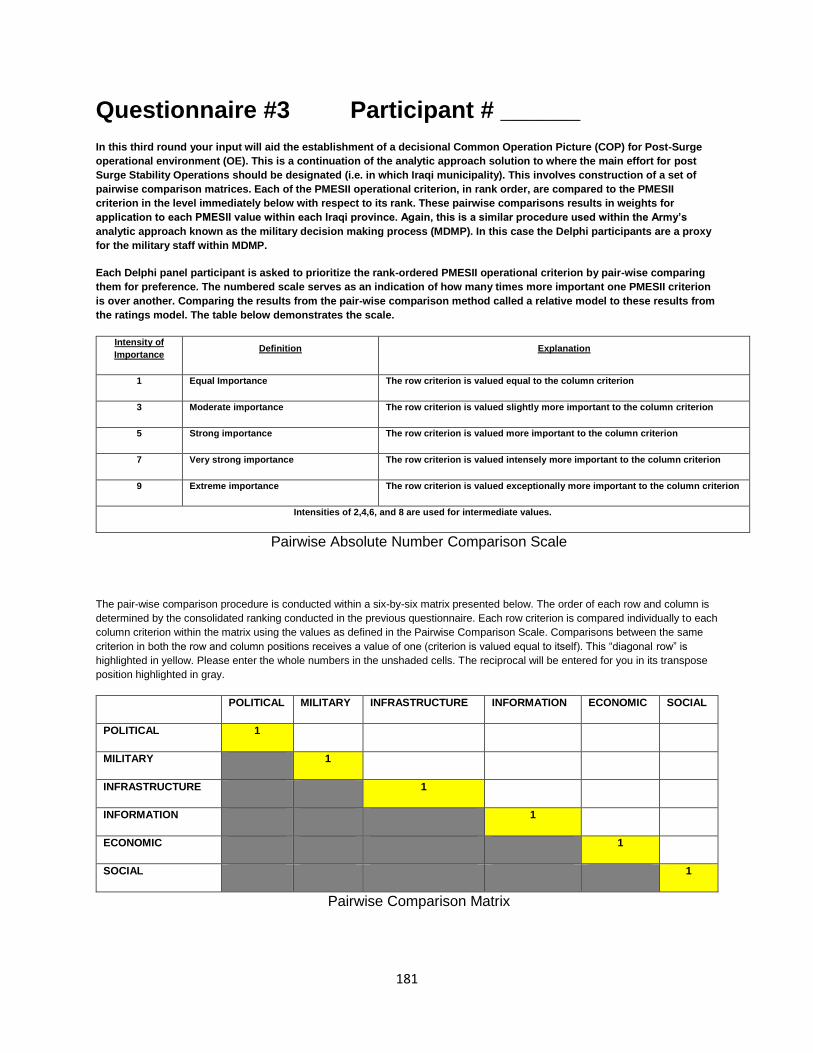
181
Questionnaire #3 Participant # ______
In this third round your input will aid the establishment of a decisional Common Operation Picture (COP) for Post-Surge
operational environment (OE). This is a continuation of the analytic approach solution to where the main effort for post
Surge Stability Operations should be designated (i.e. in which Iraqi municipality). This involves construction of a set of
pairwise comparison matrices. Each of the PMESII operational criterion, in rank order, are compared to the PMESII
criterion in the level immediately below with respect to its rank. These pairwise comparisons results in weights for
application to each PMESII value within each Iraqi province. Again, this is a similar procedure used within the Army’s
analytic approach known as the military decision making process (MDMP). In this case the Delphi participants are a proxy
for the military staff within MDMP.
Each Delphi panel participant is asked to prioritize the rank-ordered PMESII operational criterion by pair-wise comparing
them for preference. The numbered scale serves as an indication of how many times more important one PMESII criterion
is over another. Comparing the results from the pair-wise comparison method called a relative model to these results from
the ratings model. The table below demonstrates the scale.
Intensity of
Importance Definition Explanation
1 Equal Importance The row criterion is valued equal to the column criterion
3 Moderate importance The row criterion is valued slightly more important to the column criterion
5 Strong importance The row criterion is valued more important to the column criterion
7 Very strong importance The row criterion is valued intensely more important to the column criterion
9 Extreme importance The row criterion is valued exceptionally more important to the column criterion
Intensities of 2,4,6, and 8 are used for intermediate values.
Pairwise Absolute Number Comparison Scale
The pair-wise comparison procedure is conducted within a six-by-six matrix presented below. The order of each row and column is
determined by the consolidated ranking conducted in the previous questionnaire. Each row criterion is compared individually to each
column criterion within the matrix using the values as defined in the Pairwise Comparison Scale. Comparisons between the same
criterion in both the row and column positions receives a value of one (criterion is valued equal to itself). This “diagonal row” is
highlighted in yellow. Please enter the whole numbers in the unshaded cells. The reciprocal will be entered for you in its transpose
position highlighted in gray.
POLITICAL MILITARY INFRASTRUCTURE INFORMATION ECONOMIC SOCIAL
POLITICAL 1
MILITARY 1
INFRASTRUCTURE 1
INFORMATION 1
ECONOMIC 1
SOCIAL 1
Pairwise Comparison Matrix

182
Delphi Questionnaire Responses
Questionnaire #1 Participant # 1
The “Surge” in context of Operation Iraqi Freedom (OIF) is the military operation intended to help the Iraqi
Government to secure neighborhoods, protect the local population, and provide security within the
Baghdad and Al Anbar Provinces through the use of an increased American tactical presence. Once this
offensive military operation was deemed effective, a transition to Stability Operations was conducted.
Stability operations are best summarized as various coordinated mission conducted to maintain or
reestablish a safe and secure environment, provide essential governmental services, emergency
infrastructure reconstruction, and humanitarian relief. The general start time period of this Post-Surge
Stability Operation is September-October 2008 with the theater main effort located in the city of Mosul,
Nineveh province of northern Iraq.
In order to effectively conduct any military operation, there must be an understanding of the Operational
Environment (OE). The OE is a composite analysis of the conditions, circumstances, and influences that
affect the employment of capabilities and bear on the decisions of the commander. The geographical
representation of the OE is known as a Common Operating Picture (COP) and is difficult to achieve
during Stability Operations due to general characteristics of socio-economic data not being readily
practical for meaningful graphical presentation. Both the OE and resulting COP presentation can and
should aid the analysis of where Stability Operations should be conducted.
This first round of questions are open-ended ones designed to establish why and how the Nineveh
province was selected as the main effort. The questions are meant to describe the procedure(s) used to
identify and describe the Post-Surge composite civil OE and how this OE was used in the designation of
the main effort area.
1. What were the factors leading to the designation of Nineveh province as the theater main effort?
In context, the Surge stabilized Baghdad, Anbar and other areas. Mosul was the
least secure. But the overriding issue was political. It was an opportunity for the
national government to prove that they could provide for their own security and
that the national government could properly deal with minority populations (i.e.:
Kurd). Key to this was trying to establish if the national government controlled
resources or if sectional areas controlled them. This fed into the information
operations. Political deal with both U.S. and Iraqi domestic political issues.
2. Did these factors focus on civil / socio-economic issues or was the focus more toward security
issues?
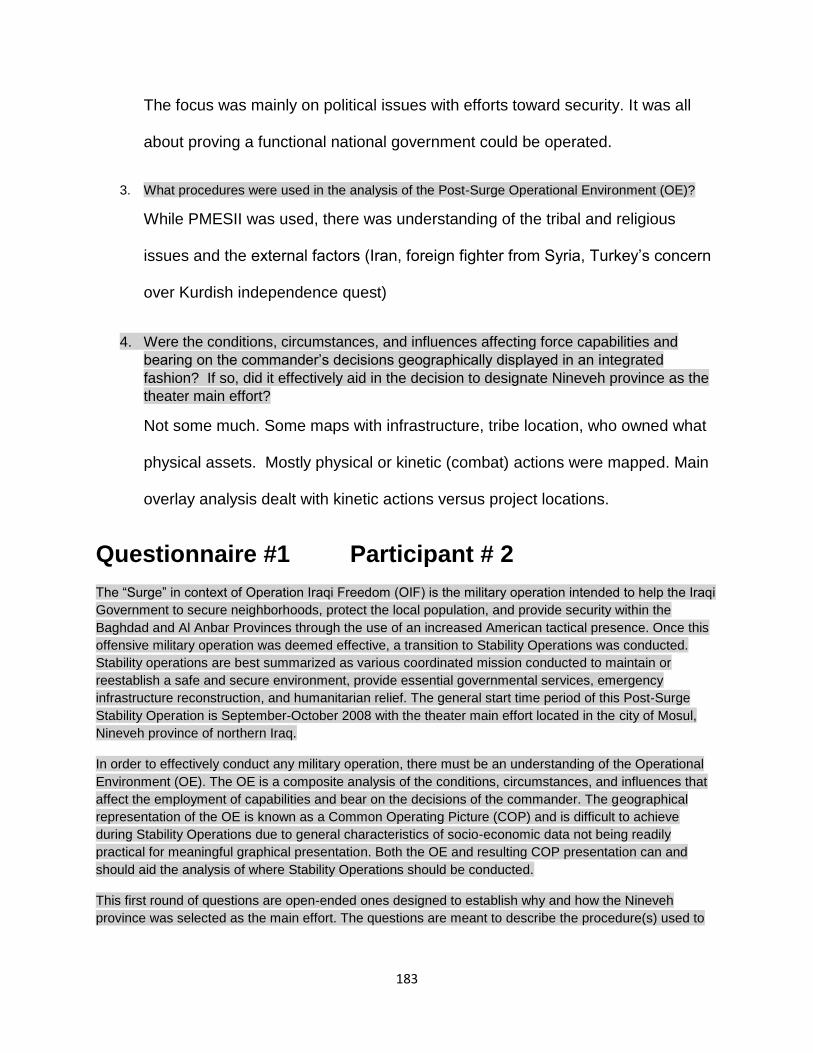
183
The focus was mainly on political issues with efforts toward security. It was all
about proving a functional national government could be operated.
3. What procedures were used in the analysis of the Post-Surge Operational Environment (OE)?
While PMESII was used, there was understanding of the tribal and religious
issues and the external factors (Iran, foreign fighter from Syria, Turkey’s concern
over Kurdish independence quest)
4. Were the conditions, circumstances, and influences affecting force capabilities and
bearing on the commander’s decisions geographically displayed in an integrated
fashion? If so, did it effectively aid in the decision to designate Nineveh province as the
theater main effort?
Not some much. Some maps with infrastructure, tribe location, who owned what
physical assets. Mostly physical or kinetic (combat) actions were mapped. Main
overlay analysis dealt with kinetic actions versus project locations.
Questionnaire #1 Participant # 2
The “Surge” in context of Operation Iraqi Freedom (OIF) is the military operation intended to help the Iraqi
Government to secure neighborhoods, protect the local population, and provide security within the
Baghdad and Al Anbar Provinces through the use of an increased American tactical presence. Once this
offensive military operation was deemed effective, a transition to Stability Operations was conducted.
Stability operations are best summarized as various coordinated mission conducted to maintain or
reestablish a safe and secure environment, provide essential governmental services, emergency
infrastructure reconstruction, and humanitarian relief. The general start time period of this Post-Surge
Stability Operation is September-October 2008 with the theater main effort located in the city of Mosul,
Nineveh province of northern Iraq.
In order to effectively conduct any military operation, there must be an understanding of the Operational
Environment (OE). The OE is a composite analysis of the conditions, circumstances, and influences that
affect the employment of capabilities and bear on the decisions of the commander. The geographical
representation of the OE is known as a Common Operating Picture (COP) and is difficult to achieve
during Stability Operations due to general characteristics of socio-economic data not being readily
practical for meaningful graphical presentation. Both the OE and resulting COP presentation can and
should aid the analysis of where Stability Operations should be conducted.
This first round of questions are open-ended ones designed to establish why and how the Nineveh
province was selected as the main effort. The questions are meant to describe the procedure(s) used to
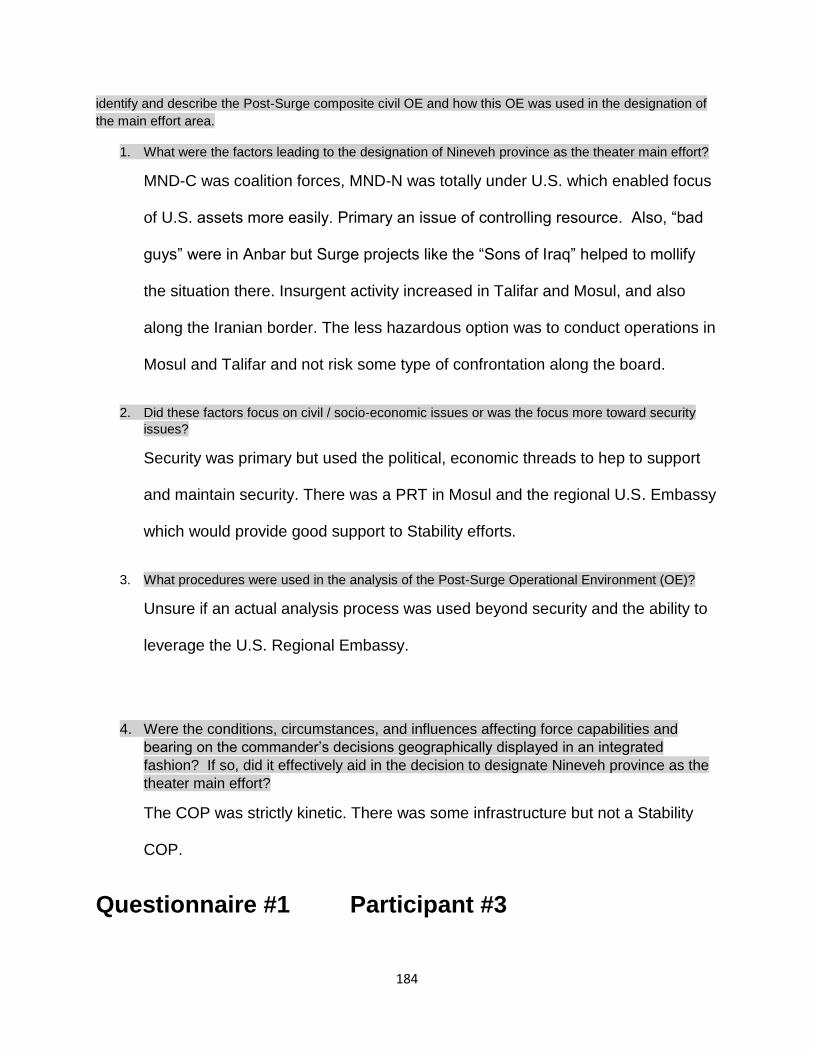
184
identify and describe the Post-Surge composite civil OE and how this OE was used in the designation of
the main effort area.
1. What were the factors leading to the designation of Nineveh province as the theater main effort?
MND-C was coalition forces, MND-N was totally under U.S. which enabled focus
of U.S. assets more easily. Primary an issue of controlling resource. Also, “bad
guys” were in Anbar but Surge projects like the “Sons of Iraq” helped to mollify
the situation there. Insurgent activity increased in Talifar and Mosul, and also
along the Iranian border. The less hazardous option was to conduct operations in
Mosul and Talifar and not risk some type of confrontation along the board.
2. Did these factors focus on civil / socio-economic issues or was the focus more toward security
issues?
Security was primary but used the political, economic threads to hep to support
and maintain security. There was a PRT in Mosul and the regional U.S. Embassy
which would provide good support to Stability efforts.
3. What procedures were used in the analysis of the Post-Surge Operational Environment (OE)?
Unsure if an actual analysis process was used beyond security and the ability to
leverage the U.S. Regional Embassy.
4. Were the conditions, circumstances, and influences affecting force capabilities and
bearing on the commander’s decisions geographically displayed in an integrated
fashion? If so, did it effectively aid in the decision to designate Nineveh province as the
theater main effort?
The COP was strictly kinetic. There was some infrastructure but not a Stability
COP.
Questionnaire #1 Participant #3

185
The “Surge” in context of Operation Iraqi Freedom (OIF) is the military operation intended to help the Iraqi
Government to secure neighborhoods, protect the local population, and provide security within the
Baghdad and Al Anbar Provinces through the use of an increased American tactical presence. Once this
offensive military operation was deemed effective, a transition to Stability Operations was conducted.
Stability operations are best summarized as various coordinated mission conducted to maintain or
reestablish a safe and secure environment, provide essential governmental services, emergency
infrastructure reconstruction, and humanitarian relief. The general start time period of this Post-Surge
Stability Operation is September-October 2008 with the theater main effort located in the city of Mosul,
Nineveh province of northern Iraq.
In order to effectively conduct any military operation, there must be an understanding of the Operational
Environment (OE). The OE is a composite analysis of the conditions, circumstances, and influences that
affect the employment of capabilities and bear on the decisions of the commander. The geographical
representation of the OE is known as a Common Operating Picture (COP) and is difficult to achieve
during Stability Operations due to general characteristics of socio-economic data not being readily
practical for meaningful graphical presentation. Both the OE and resulting COP presentation can and
should aid the analysis of where Stability Operations should be conducted.
This first round of questions are open-ended ones designed to establish why and how the Nineveh
province was selected as the main effort. The questions are meant to describe the procedure(s) used to
identify and describe the Post-Surge composite civil OE and how this OE was used in the designation of
the main effort area.
1. What were the factors leading to the designation of Nineveh province as the theater main effort?
It was not readily apparent to this participant that Mosul was the post-Surge main
effort.
2. Did these factors focus on civil / socio-economic issues or was the focus more toward security
issues?
It was approximately equal between security and other socio-economic issues.
The OE still needed security but stability began to emerge as an equal piece. As
the security increased it gave greater possibility for stability operations.
3. What procedures were used in the analysis of the Post-Surge Operational Environment (OE)?
While both PMESII and DIME were used, the most important thing was the
decentralization of effort; getting off the large FOB into the communities. Greater
integration among the population countering the enemies influence.
4. Were the conditions, circumstances, and influences affecting force capabilities and
bearing on the commander’s decisions geographically displayed in an integrated

186
fashion? If so, did it effectively aid in the decision to designate Nineveh province as the
theater main effort?
The participant did not see any of these socio-economic issues place on the map
for analysis.
Questionnaire #1 Participant #4
The “Surge” in context of Operation Iraqi Freedom (OIF) is the military operation intended to help the Iraqi
Government to secure neighborhoods, protect the local population, and provide security within the
Baghdad and Al Anbar Provinces through the use of an increased American tactical presence. Once this
offensive military operation was deemed effective, a transition to Stability Operations was conducted.
Stability operations are best summarized as various coordinated mission conducted to maintain or
reestablish a safe and secure environment, provide essential governmental services, emergency
infrastructure reconstruction, and humanitarian relief. The general start time period of this Post-Surge
Stability Operation is September-October 2008 with the theater main effort located in the city of Mosul,
Nineveh province of northern Iraq.
In order to effectively conduct any military operation, there must be an understanding of the Operational
Environment (OE). The OE is a composite analysis of the conditions, circumstances, and influences that
affect the employment of capabilities and bear on the decisions of the commander. The geographical
representation of the OE is known as a Common Operating Picture (COP) and is difficult to achieve
during Stability Operations due to general characteristics of socio-economic data not being readily
practical for meaningful graphical presentation. Both the OE and resulting COP presentation can and
should aid the analysis of where Stability Operations should be conducted.
This first round of questions are open-ended ones designed to establish why and how the Nineveh
province was selected as the main effort. The questions are meant to describe the procedure(s) used to
identify and describe the Post-Surge composite civil OE and how this OE was used in the designation of
the main effort area.
1. What were the factors leading to the designation of Nineveh province as the theater main effort?
While Baghdad had the largest pop, there were multiple fracture lines
(Sunni/Shia/Kurd) with the added issues of the northern provinces bordering Syria
and Turkey. There was internal political conflict within the U.S. Army command. In
2006 the al-Askari Mosque (Shi’a Shrine - City of Samarra) was bombed with
accusations between the Shai and Sunni factions and the al-Qaeda insurgents being
blamed. Problems between the ethnic / religious factions became paramount in the

187
post-Surge Operational Environment. Problems between the ethnic / religious
factions became paramount in the post-Surge Operational Environment.
2. Did these factors focus on civil / socio-economic issues or was the focus more toward security
issues?
Security became the most important issue.
3. What procedures were used in the analysis of the Post-Surge Operational Environment (OE)?
From 2004 to 2007 there was a combative focus and there was a relation that the
Iraqi. The analysis was more focused on troop to task. There was little analysis
on the root causes of the violence.
4. Were the conditions, circumstances, and influences affecting force capabilities and
bearing on the commander’s decisions geographically displayed in an integrated
fashion? If so, did it effectively aid in the decision to designate Nineveh province as the
theater main effort?
There were “heat maps” created but it focused permissive area, points of market
locations, etc. It was not certain if that information when upward. Much of spatial
data was not able to be place on CPOF due to difficulty of technical issue and
concern on information overload with combat COP.

188
Questionnaire #2 Participant # 1
In this second round your input will aid the establishment of a decisional Common Operation Picture
(COP) for Post-Surge operational environment (OE). This is an analytic approach for solution to the
problem of where should the main effort for post Surge Stability Operations be designated (i.e. which Iraqi
municipality). This involves the ranking of criteria in a similar procedure used in the Army’s analytic
approach known as the military decision making process (MDMP). In this case the Delphi participants are
a proxy for the military staff within MDMP.
Each Delphi panel participant is asked to rank-order the interrelated operational variables used by the
U.S. military to analyze the 2008 Post-Surge OE. Known as PMESII, these operational variables are:
political, military, economic, social, information, and infrastructure. They are the criterion for analysis. This
set of criterion was selected due its pervasive use as aspects of the operational environment describing
not only the military aspects but also the population’s influence on it. The populace’s influence is a key
factor in the effectiveness of Stability Operations.
The ranking procedure is from one (1) to six (6) with one having the greatest priority. A composite ranking
will be developed using the median value for each of the PMESII operational criterion.
1 POLITICAL
2 MILITARY
4 ECONOMIC
6 SOCIAL
3 INFORMATION
5 INFRASTRUCTURE

189
Questionnaire #2 Participant # 2
In this second round your input will aid the establishment of a decisional Common Operation Picture
(COP) for Post-Surge operational environment (OE). This is an analytic approach for solution to the
problem of where should the main effort for post Surge Stability Operations be designated (i.e. which Iraqi
municipality). This involves the ranking of criteria in a similar procedure used in the Army’s analytic
approach known as the military decision making process (MDMP). In this case the Delphi participants are
a proxy for the military staff within MDMP.
Each Delphi panel participant is asked to rank-order the interrelated operational variables used by the
U.S. military to analyze the 2008 Post-Surge OE. Known as PMESII, these operational variables are:
political, military, economic, social, information, and infrastructure. They are the criterion for analysis. This
set of criterion was selected due its pervasive use as aspects of the operational environment describing
not only the military aspects but also the population’s influence on it. The populace’s influence is a key
factor in the effectiveness of Stability Operations.
The ranking procedure is from one (1) to six (6) with one having the greatest priority. A composite ranking
will be developed using the median value for each of the PMESII operational criterion.
1 POLITICAL
2 MILITARY
6 ECONOMIC
3 SOCIAL
5 INFORMATION

190
Questionnaire #2 Participant # 3
In this second round your input will aid the establishment of a decisional Common Operation Picture
(COP) for Post-Surge operational environment (OE). This is an analytic approach for solution to the
problem of where should the main effort for post Surge Stability Operations be designated (i.e. which Iraqi
municipality). This involves the ranking of criteria in a similar procedure used in the Army’s analytic
approach known as the military decision making process (MDMP). In this case the Delphi participants are
a proxy for the military staff within MDMP.
Each Delphi panel participant is asked to rank-order the interrelated operational variables used by the
U.S. military to analyze the 2008 Post-Surge OE. Known as PMESII, these operational variables are:
political, military, economic, social, information, and infrastructure. They are the criterion for analysis. This
set of criterion was selected due its pervasive use as aspects of the operational environment describing
not only the military aspects but also the population’s influence on it. The populace’s influence is a key
factor in the effectiveness of Stability Operations.
The ranking procedure is from one (1) to six (6) with one having the greatest priority. A composite ranking
will be developed using the median value for each of the PMESII operational criterion.
2 POLITICAL
5 MILITARY
3 ECONOMIC
6 SOCIAL
1 INFORMATION
4 INFRASTRUCTURE
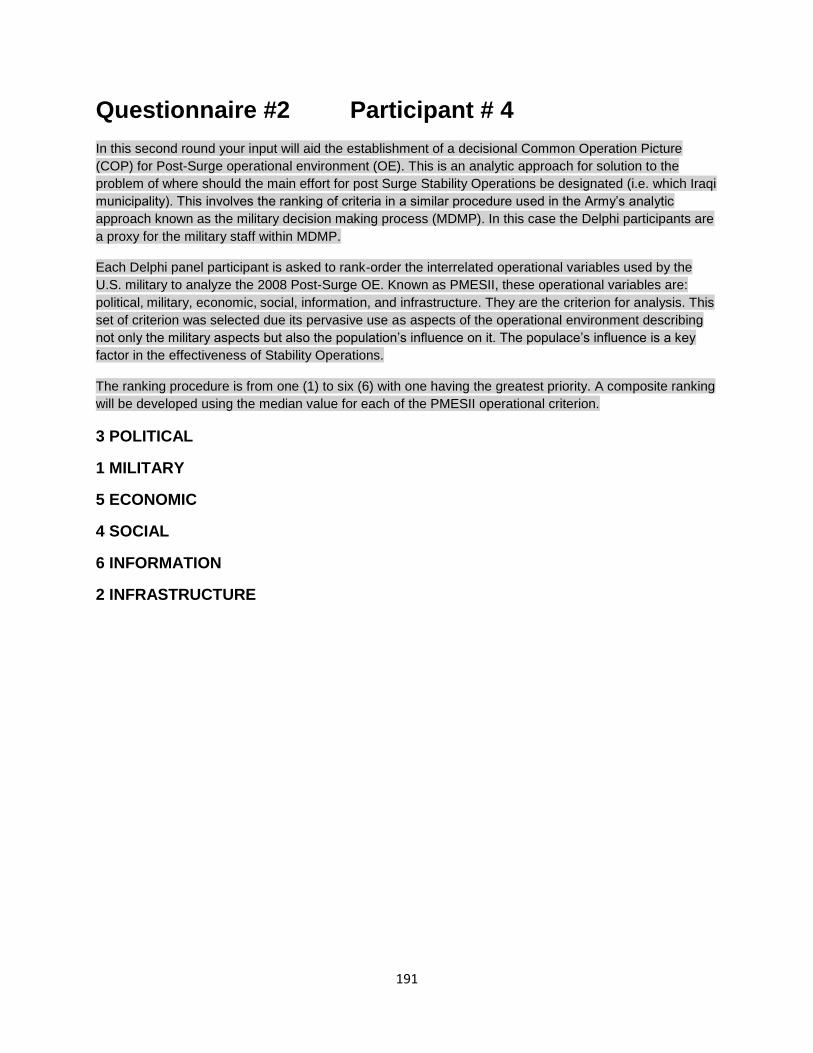
191
Questionnaire #2 Participant # 4
In this second round your input will aid the establishment of a decisional Common Operation Picture
(COP) for Post-Surge operational environment (OE). This is an analytic approach for solution to the
problem of where should the main effort for post Surge Stability Operations be designated (i.e. which Iraqi
municipality). This involves the ranking of criteria in a similar procedure used in the Army’s analytic
approach known as the military decision making process (MDMP). In this case the Delphi participants are
a proxy for the military staff within MDMP.
Each Delphi panel participant is asked to rank-order the interrelated operational variables used by the
U.S. military to analyze the 2008 Post-Surge OE. Known as PMESII, these operational variables are:
political, military, economic, social, information, and infrastructure. They are the criterion for analysis. This
set of criterion was selected due its pervasive use as aspects of the operational environment describing
not only the military aspects but also the population’s influence on it. The populace’s influence is a key
factor in the effectiveness of Stability Operations.
The ranking procedure is from one (1) to six (6) with one having the greatest priority. A composite ranking
will be developed using the median value for each of the PMESII operational criterion.
3 POLITICAL
1 MILITARY
5 ECONOMIC
4 SOCIAL
6 INFORMATION
2 INFRASTRUCTURE

192
Questionnaire #3 Participant # 1
In this third round your input will aid the establishment of a decisional Common Operation Picture (COP) for Post-Surge
operational environment (OE). This is a continuation of the analytic approach solution to where the main effort for post
Surge Stability Operations should be designated (i.e. in which Iraqi municipality). This involves construction of a set of
pairwise comparison matrices. Each of the PMESII operational criterion, in rank order, are compared to the PMESII
criterion in the level immediately below with respect to its rank. These pairwise comparisons results in weights for
application to each PMESII value within each Iraqi province. Again, this is a similar procedure used within the Army’s
analytic approach known as the military decision making process (MDMP). In this case the Delphi participants are a proxy
for the military staff within MDMP.
Each Delphi panel participant is asked to prioritize the rank-ordered PMESII operational criterion by pair-wise comparing
them for preference. The numbered scale serves as an indication of how many times more important one PMESII criterion
is over another. Comparing the results from the pair-wise comparison method called a relative model to these results from
the ratings model. The table below demonstrates the scale.
Intensity of
Importance Definition Explanation
1 Equal Importance The row criterion is valued equal to the column criterion
3 Moderate importance The row criterion is valued slightly more important to the column criterion
5 Strong importance The row criterion is valued more important to the column criterion
7 Very strong importance The row criterion is valued intensely more important to the column criterion
9 Extreme importance The row criterion is valued exceptionally more important to the column criterion
Intensities of 2,4,6, and 8 are used for intermediate values.
Pairwise Absolute Number Comparison Scale
The pair-wise comparison procedure is conducted within a six-by-six matrix presented below. The order of each row and column is
determined by the consolidated ranking conducted in the previous questionnaire. Each row criterion is compared individually to each
column criterion within the matrix using the values as defined in the Pairwise Comparison Scale. Comparisons between the same
criterion in both the row and column positions receives a value of one (criterion is valued equal to itself). This “diagonal row” is
highlighted in yellow. Please enter the whole numbers in the unshaded cells. The reciprocal will be entered for you in its transpose
position highlighted in gray.
POLITICAL MILITARY INFRASTRUCTURE INFORMATION ECONOMIC SOCIAL
POLITICAL 1 2 4 3 5 6
MILITARY 1 4 3 5 6
INFRASTRUCTURE 1 ¼ 2 4
INFORMATION 1 4 5
ECONOMIC 1 3
SOCIAL 1
Pairwise Comparison Matrix

193
Questionnaire #3 Participant # 2
In this third round your input will aid the establishment of a decisional Common Operation Picture (COP) for Post-Surge
operational environment (OE). This is a continuation of the analytic approach solution to where the main effort for post
Surge Stability Operations should be designated (i.e. in which Iraqi municipality). This involves construction of a set of
pairwise comparison matrices. Each of the PMESII operational criterion, in rank order, are compared to the PMESII
criterion in the level immediately below with respect to its rank. These pairwise comparisons results in weights for
application to each PMESII value within each Iraqi province. Again, this is a similar procedure used within the Army’s
analytic approach known as the military decision making process (MDMP). In this case the Delphi participants are a proxy
for the military staff within MDMP.
Each Delphi panel participant is asked to prioritize the rank-ordered PMESII operational criterion by pair-wise comparing
them for preference. The numbered scale serves as an indication of how many times more important one PMESII criterion
is over another. Comparing the results from the pair-wise comparison method called a relative model to these results from
the ratings model. The table below demonstrates the scale.
Intensity of
Importance Definition Explanation
1 Equal Importance The row criterion is valued equal to the column criterion
3 Moderate importance The row criterion is valued slightly more important to the column criterion
5 Strong importance The row criterion is valued more important to the column criterion
7 Very strong importance The row criterion is valued intensely more important to the column criterion
9 Extreme importance The row criterion is valued exceptionally more important to the column criterion
Intensities of 2,4,6, and 8 are used for intermediate values.
Pairwise Absolute Number Comparison Scale
The pair-wise comparison procedure is conducted within a six-by-six matrix presented below. The order of each row and column is
determined by the consolidated ranking conducted in the previous questionnaire. Each row criterion is compared individually to each
column criterion within the matrix using the values as defined in the Pairwise Comparison Scale. Comparisons between the same
criterion in both the row and column positions receives a value of one (criterion is valued equal to itself). This “diagonal row” is
highlighted in yellow. Please enter the whole numbers in the unshaded cells. The reciprocal will be entered for you in its transpose
position highlighted in gray.
POLITICAL MILITARY INFRASTRUCTURE INFORMATION ECONOMIC SOCIAL
POLITICAL 1 1 2 3 7 1
MILITARY 1 3 2 9 2
INFRASTRUCTURE 1 ¼ 1 3
INFORMATION 1 6 1
ECONOMIC 1 2
SOCIAL 1
Pairwise Comparison Matrix

194
Questionnaire #3 Participant # 3
In this third round your input will aid the establishment of a decisional Common Operation Picture (COP) for Post-Surge
operational environment (OE). This is a continuation of the analytic approach solution to where the main effort for post
Surge Stability Operations should be designated (i.e. in which Iraqi municipality). This involves construction of a set of
pairwise comparison matrices. Each of the PMESII operational criterion, in rank order, are compared to the PMESII
criterion in the level immediately below with respect to its rank. These pairwise comparisons results in weights for
application to each PMESII value within each Iraqi province. Again, this is a similar procedure used within the Army’s
analytic approach known as the military decision making process (MDMP). In this case the Delphi participants are a proxy
for the military staff within MDMP.
Each Delphi panel participant is asked to prioritize the rank-ordered PMESII operational criterion by pair-wise comparing
them for preference. The numbered scale serves as an indication of how many times more important one PMESII criterion
is over another. Comparing the results from the pair-wise comparison method called a relative model to these results from
the ratings model. The table below demonstrates the scale.
Intensity of
Importance Definition Explanation
1 Equal Importance The row criterion is valued equal to the column criterion
3 Moderate importance The row criterion is valued slightly more important to the column criterion
5 Strong importance The row criterion is valued more important to the column criterion
7 Very strong importance The row criterion is valued intensely more important to the column criterion
9 Extreme importance The row criterion is valued exceptionally more important to the column criterion
Intensities of 2,4,6, and 8 are used for intermediate values.
Pairwise Absolute Number Comparison Scale
The pair-wise comparison procedure is conducted within a six-by-six matrix presented below. The order of each row and column is
determined by the consolidated ranking conducted in the previous questionnaire. Each row criterion is compared individually to each
column criterion within the matrix using the values as defined in the Pairwise Comparison Scale. Comparisons between the same
criterion in both the row and column positions receives a value of one (criterion is valued equal to itself). This “diagonal row” is
highlighted in yellow. Please enter the whole numbers in the unshaded cells. The reciprocal will be entered for you in its transpose
position highlighted in gray.
POLITICAL MILITARY INFRASTRUCTURE INFORMATION ECONOMIC SOCIAL
POLITICAL 1 1 2 1 2 2
MILITARY 1 5 2 2 2
INFRASTRUCTURE 1 1 2 1
INFORMATION 1 3 1
ECONOMIC 1 2
SOCIAL 1
Pairwise Comparison Matrix

195
Questionnaire #3 Participant # 4
In this third round your input will aid the establishment of a decisional Common Operation Picture (COP) for Post-Surge
operational environment (OE). This is a continuation of the analytic approach solution to where the main effort for post
Surge Stability Operations should be designated (i.e. in which Iraqi municipality). This involves construction of a set of
pairwise comparison matrices. Each of the PMESII operational criterion, in rank order, are compared to the PMESII
criterion in the level immediately below with respect to its rank. These pairwise comparisons results in weights for
application to each PMESII value within each Iraqi province. Again, this is a similar procedure used within the Army’s
analytic approach known as the military decision making process (MDMP). In this case the Delphi participants are a proxy
for the military staff within MDMP.
Each Delphi panel participant is asked to prioritize the rank-ordered PMESII operational criterion by pair-wise comparing
them for preference. The numbered scale serves as an indication of how many times more important one PMESII criterion
is over another. Comparing the results from the pair-wise comparison method called a relative model to these results from
the ratings model. The table below demonstrates the scale.
Intensity of
Importance Definition Explanation
1 Equal Importance The row criterion is valued equal to the column criterion
3 Moderate importance The row criterion is valued slightly more important to the column criterion
5 Strong importance The row criterion is valued more important to the column criterion
7 Very strong importance The row criterion is valued intensely more important to the column criterion
9 Extreme importance The row criterion is valued exceptionally more important to the column criterion
Intensities of 2,4,6, and 8 are used for intermediate values.
Pairwise Absolute Number Comparison Scale
The pair-wise comparison procedure is conducted within a six-by-six matrix presented below. The order of each row and column is
determined by the consolidated ranking conducted in the previous questionnaire. Each row criterion is compared individually to each
column criterion within the matrix using the values as defined in the Pairwise Comparison Scale. Comparisons between the same
criterion in both the row and column positions receives a value of one (criterion is valued equal to itself). This “diagonal row” is
highlighted in yellow. Please enter the whole numbers in the unshaded cells. The reciprocal will be entered for you in its transpose
position highlighted in gray.
POLITICAL MILITARY INFRASTRUCTURE INFORMATION ECONOMIC SOCIAL
POLITICAL 1 2 4 6 4 5
MILITARY 1 4 7 5 4
INFRASTRUCTURE 1 6 2 2
INFORMATION 1 1 2
ECONOMIC 1 2
SOCIAL 1
Pairwise Comparison Matrix

196
AHP Calculations
PMESII Variable Median Spread Final Rank
POLITICAL 1.5 2 1
MILITARY 2 4 2
ECONOMIC 4.5 3 5
SOCIAL 5 3 6
INFORMATION 4 5 4
INFRASTRUCTURE 4 3 3 Median Average of Participants’ Rankings
Table 15
PMESII Variable Median Spread Final Rank
POLITICAL 1.5 2 1
MILITARY 2 4 2
INFRASTRUCTURE 4 3 3
INFORMATION 4 5 4
ECONOMIC 4.5 3 5
SOCIAL 5 3 6 Median Average of Participants’ Rankings in Rank Order
Table 16
POLITICAL MILITARY INFRASTRUCTURE INFORMATION ECONOMIC SOCIAL
POLITICAL 1.00 1.50 3.00 3.00 4.50 3.50
MILITARY 0.67 1.00 4.00 2.50 5.00 3.00
INFRASTRUCTURE 0.33 0.33 1.00 0.63 2.00 2.50
INFORMATION 0.33 0.40 1.60 1.00 3.50 1.50
ECONOMIC 0.22 0.20 0.50 0.29 1.00 2.00
SOCIAL 0.29 0.33 0.40 0.67 0.50 1.00
Median Average of Participants’ Pairwise Comparisons Table 17
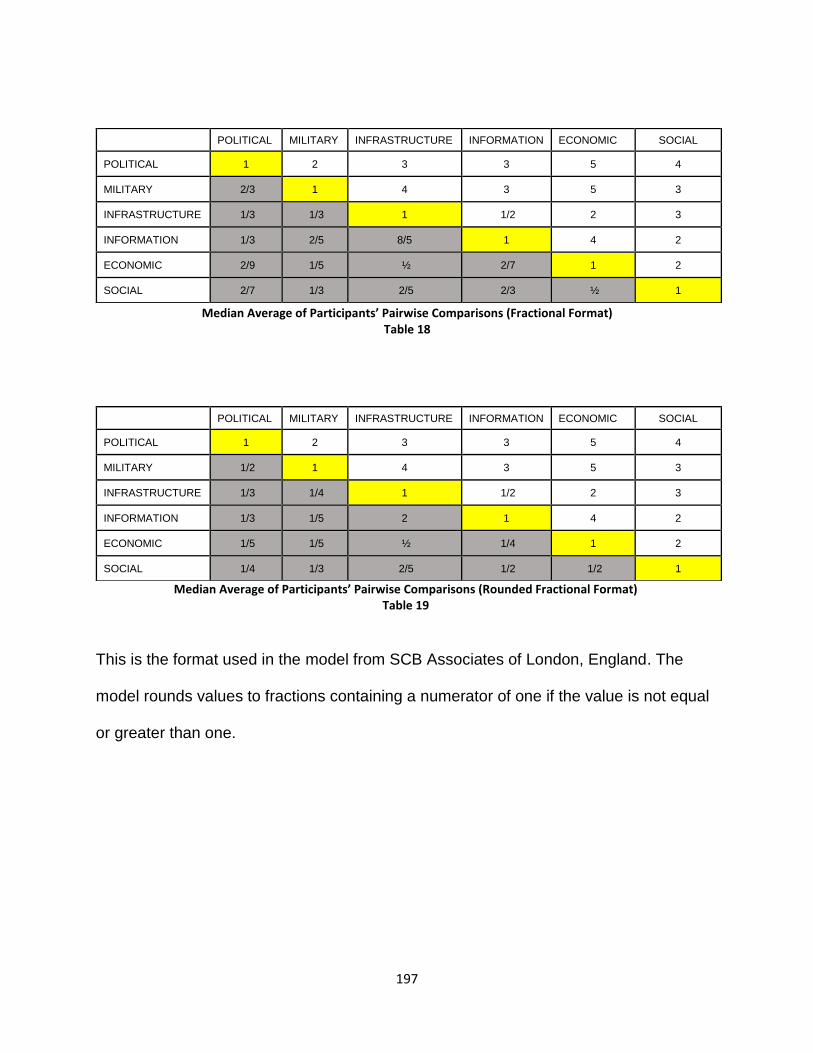
197
This is the format used in the model from SCB Associates of London, England. The
model rounds values to fractions containing a numerator of one if the value is not equal
or greater than one.
POLITICAL MILITARY INFRASTRUCTURE INFORMATION ECONOMIC SOCIAL
POLITICAL 1 2 3 3 5 4
MILITARY 2/3 1 4 3 5 3
INFRASTRUCTURE 1/3 1/3 1 1/2 2 3
INFORMATION 1/3 2/5 8/5 1 4 2
ECONOMIC 2/9 1/5 ½ 2/7 1 2
SOCIAL 2/7 1/3 2/5 2/3 ½ 1
Median Average of Participants’ Pairwise Comparisons (Fractional Format) Table 18
POLITICAL MILITARY INFRASTRUCTURE INFORMATION ECONOMIC SOCIAL
POLITICAL 1 2 3 3 5 4
MILITARY 1/2 1 4 3 5 3
INFRASTRUCTURE 1/3 1/4 1 1/2 2 3
INFORMATION 1/3 1/5 2 1 4 2
ECONOMIC 1/5 1/5 ½ 1/4 1 2
SOCIAL 1/4 1/3 2/5 1/2 1/2 1
Median Average of Participants’ Pairwise Comparisons (Rounded Fractional Format) Table 19

198
Base and PMESII SQL Queries of the GDELT Database
Base Data Query
SELECT [200809Data].SQLDATE, [200809Data].MonthYear,
EventFullCode.E_FullCode_Descr, [200809Data].EventCode,
EventBaseCode.E_BaseCode_Descr, [200809Data].EventBaseCode,
EventRootCode.E_RootCode_Descr, [200809Data].EventRootCode,
[200809Data].NumArticles, [200809Data].AvgTone, [200809Data].ActionGeo_Lat,
[200809Data].ActionGeo_Long, [200809Data].ActionGeo_CountryCode,
[200809Data].ActionGeo_FullName, [200809Data].ActionGeo_Type,
[200809Data].Actor1Geo_FullName, [200809Data].Actor1Geo_CountryCode,
[200809Data].Actor1Geo_ADM1Code
FROM ((200809Data INNER JOIN EventBaseCode ON [200809Data].EventBaseCode =
EventBaseCode.EventBaseCode) INNER JOIN EventRootCode ON
[200809Data].EventRootCode = EventRootCode.EventRootCode) INNER JOIN EventFullCode
ON [200809Data].EventCode = EventFullCode.EventFullCode
WHERE ((([200809Data].ActionGeo_CountryCode)="IZ") AND
(([200809Data].ActionGeo_FullName)<>"Iraq") AND
(([200809Data].Actor1Geo_CountryCode)="IZ"));
Military Data Sub Query
SELECT [Base Query].SQLDATE, [Base Query].MonthYear, [Base Query].E_FullCode_Descr,
[Base Query].EventCode, [Base Query].E_BaseCode_Descr, [Base Query].EventBaseCode,
[Base Query].E_RootCode_Descr, [Base Query].EventRootCode, [Base Query].NumArticles,
[Base Query].AvgTone, [Base Query].ActionGeo_Lat, [Base Query].ActionGeo_Long, [Base
Query].ActionGeo_CountryCode, [Base Query].ActionGeo_FullName, [Base
Query].ActionGeo_Type
FROM [Base Query]
WHERE ((([Base Query].E_FullCode_Descr) Like "*Military*") AND (([Base
Query].E_RootCode_Descr)<>"PROVIDE AID"));
Political Data Sub Query
SELECT [Base Query].SQLDATE, [Base Query].MonthYear, [Base Query].E_FullCode_Descr,
[Base Query].EventCode, [Base Query].E_BaseCode_Descr, [Base Query].EventBaseCode,
[Base Query].E_RootCode_Descr, [Base Query].EventRootCode, [Base Query].NumArticles,
[Base Query].AvgTone, [Base Query].ActionGeo_Lat, [Base Query].ActionGeo_Long, [Base

199
Query].ActionGeo_CountryCode, [Base Query].ActionGeo_FullName, [Base
Query].ActionGeo_Type
FROM [Base Query]
WHERE ((([Base Query].E_FullCode_Descr) Like "*Political*" Or ([Base
Query].E_FullCode_Descr) Like "*Policy*") AND (([Base Query].E_RootCode_Descr)<>"MAKE
PUBLIC STATEMENT"));
Economic Data Sub Query
SELECT [Base Query].SQLDATE, [Base Query].MonthYear, [Base Query].E_FullCode_Descr,
[Base Query].EventCode, [Base Query].E_BaseCode_Descr, [Base Query].EventBaseCode,
[Base Query].E_RootCode_Descr, [Base Query].EventRootCode, [Base Query].NumArticles,
[Base Query].AvgTone, [Base Query].ActionGeo_Lat, [Base Query].ActionGeo_Long, [Base
Query].ActionGeo_CountryCode, [Base Query].ActionGeo_FullName, [Base
Query].ActionGeo_Type
FROM [Base Query]
WHERE ((([Base Query].E_FullCode_Descr) Like "*Econ*") AND (([Base
Query].E_RootCode_Descr)<>"PROVIDE AID")) OR ((([Base Query].E_FullCode_Descr) Like
"*material*") AND (([Base Query].E_RootCode_Descr)<>"PROVIDE AID"));
Social Data Sub Query
SELECT [Base Query].SQLDATE, [Base Query].MonthYear, [Base Query].E_FullCode_Descr,
[Base Query].EventCode, [Base Query].E_BaseCode_Descr, [Base Query].EventBaseCode,
[Base Query].E_RootCode_Descr, [Base Query].EventRootCode, [Base Query].NumArticles,
[Base Query].AvgTone, [Base Query].ActionGeo_Lat, [Base Query].ActionGeo_Long, [Base
Query].ActionGeo_CountryCode, [Base Query].ActionGeo_FullName, [Base
Query].ActionGeo_Type
FROM [Base Query]
WHERE ((([Base Query].E_FullCode_Descr) Like "*religious*" Or ([Base
Query].E_FullCode_Descr) Like "*ethnic*" Or ([Base Query].E_FullCode_Descr) Like "*cultural*"
Or ([Base Query].E_FullCode_Descr) Like "*Education*" Or ([Base Query].E_FullCode_Descr)
Like "*Crim*" Or ([Base Query].E_FullCode_Descr) Like "*judicial*" Or ([Base
Query].E_FullCode_Descr) Like "*population*" Or ([Base Query].E_FullCode_Descr) Like
"*human rights*" Or ([Base Query].E_FullCode_Descr) Like "*demograph*" Or ([Base
Query].E_FullCode_Descr) Like "*social*"));

200
Information Data Sub Query
SELECT [Base Query].SQLDATE, [Base Query].MonthYear, [Base Query].E_FullCode_Descr,
[Base Query].EventCode, [Base Query].E_BaseCode_Descr, [Base Query].EventBaseCode,
[Base Query].E_RootCode_Descr, [Base Query].EventRootCode, [Base Query].NumArticles,
[Base Query].AvgTone, [Base Query].ActionGeo_Lat, [Base Query].ActionGeo_Long, [Base
Query].ActionGeo_CountryCode, [Base Query].ActionGeo_FullName, [Base
Query].ActionGeo_Type
FROM [Base Query]
WHERE ((([Base Query].E_FullCode_Descr) Like "*Information*")) OR ((([Base
Query].EventCode)>9 And ([Base Query].EventCode)<19));
Infrastructure Data Sub Query
SELECT [Base Query].SQLDATE, [Base Query].MonthYear, [Base Query].E_FullCode_Descr,
[Base Query].EventCode, [Base Query].E_BaseCode_Descr, [Base Query].EventBaseCode,
[Base Query].E_RootCode_Descr, [Base Query].EventRootCode, [Base Query].NumArticles,
[Base Query].AvgTone, [Base Query].ActionGeo_Lat, [Base Query].ActionGeo_Long, [Base
Query].ActionGeo_CountryCode, [Base Query].ActionGeo_FullName, [Base
Query].ActionGeo_Type
FROM [Base Query]
WHERE ((([Base Query].E_FullCode_Descr) Like "*Infrastructure*" Or ([Base
Query].E_FullCode_Descr) Like "*Property*"));

201
Exploratory Data Analysis Statistical Charts
Political NumArticles Summary Statistics
Table 20
Political NumArticles Histogram
Figure 52

202
Political NumArticles Box Plot
Figure 53
Political NumArticles Normality Test
Table 21

203
Political AvgTone Summary Statistics
Table 22
Political AvgTone Histograms
Figure 54

204
Political AvgTone Box Plot
Figure 55
Political AvgTone Normality Test
Table 23

205
Military NumArticle Summary Statistics
Table 24
Military NumArticles Histogram
Figure 56
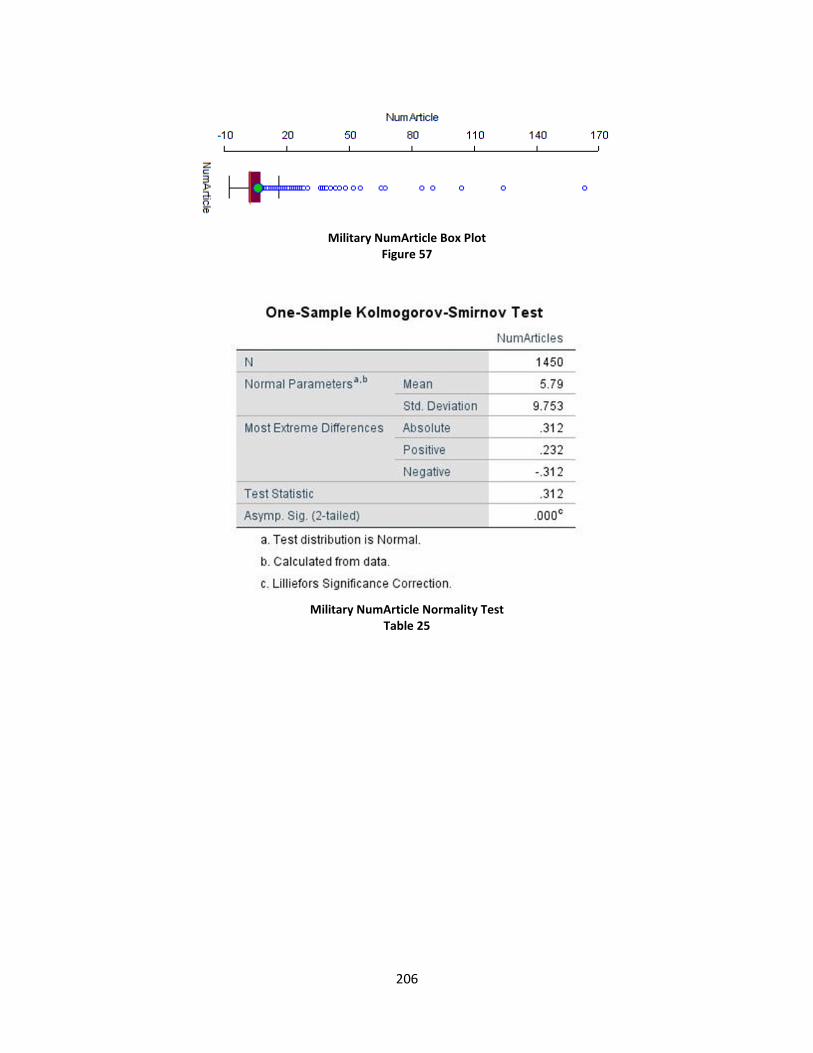
206
Military NumArticle Box Plot
Figure 57
Military NumArticle Normality Test
Table 25

207
Military AvgTone Summary Statistics
Table 26
Military AvgTone Histogram Figure 58

208
Military AvgTone Box-Plot
Figure 59
Military AvgTone Normality Test
Table 27

209
Economic NumArticles Summary Statistics
Table 28
Economic NumArticles Normality Test
Table 29
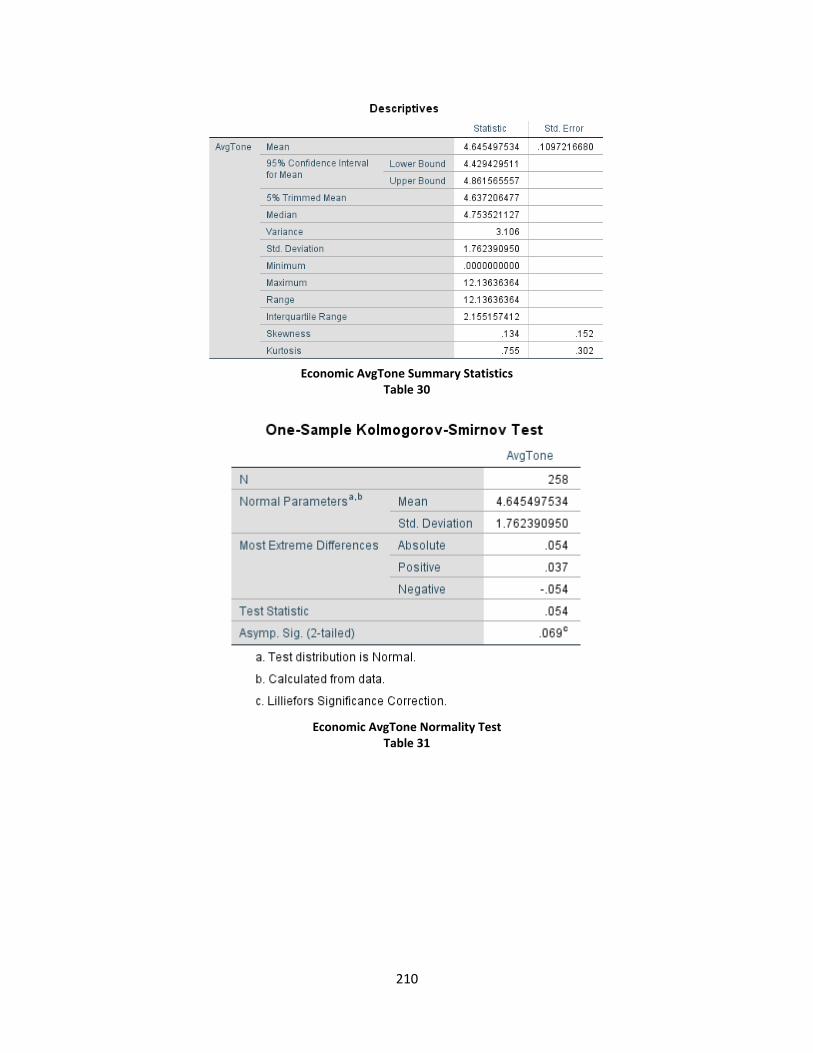
210
Economic AvgTone Summary Statistics
Table 30
Economic AvgTone Normality Test
Table 31

211
Social NumArticle Summary Statistics
Table 32
Social NumArticles Histogram
Figure 60

212
Social NumArticles Box-Plot
Figure 61
Social NumArticle Normality Test
Table 33
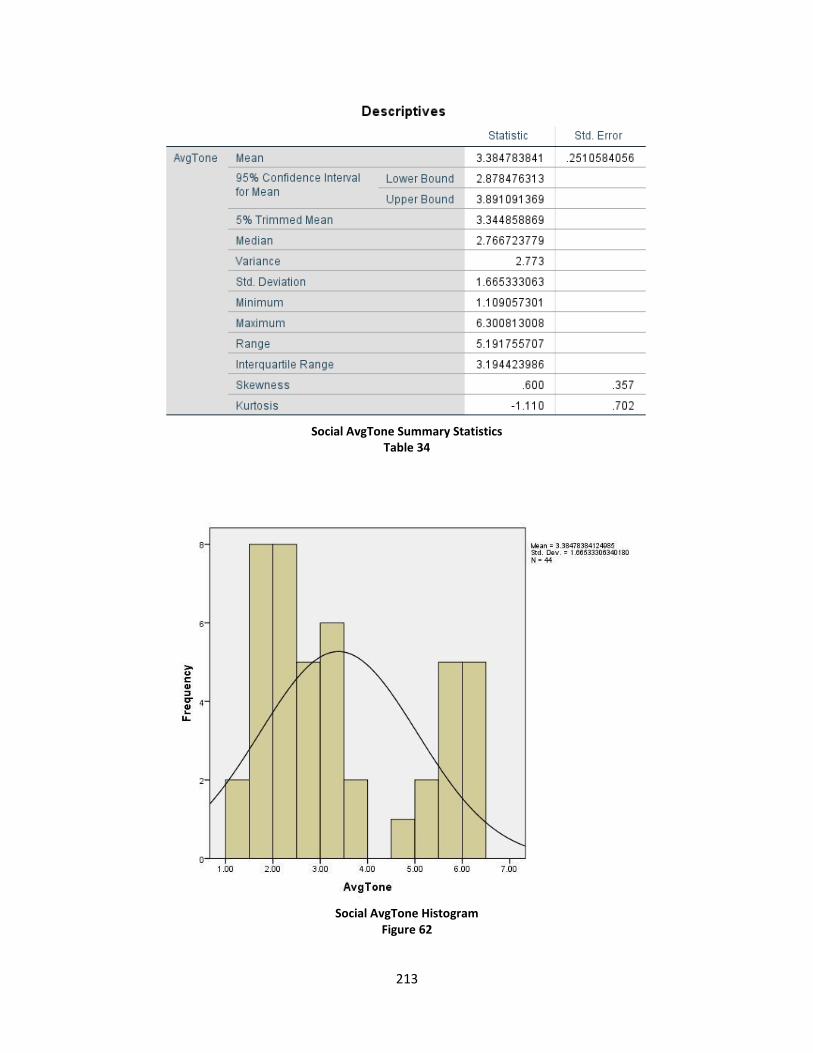
213
Social AvgTone Summary Statistics
Table 34
Social AvgTone Histogram
Figure 62

214
Social AvgTone Box-Plot
Figure 63
Social AvgTone Normality Test
Table 35

215
Information NumArticle Summary Statistics
Table 36

216
Information NumArticle Histogram
Figure 64
Information NumArticle Box-Plot
Figure 65

217
Information NumArticle Normality Test
Table 37
Information AvgTone Summary Statistics
Table 38

218
Information AvgTone Histogram
Figure 66
Information AvgTone Box-Plot
Figure 67

219
Information AvgTone Normality Test
Table 39
Infrastructure NumArticles Summary Statistics Table 40
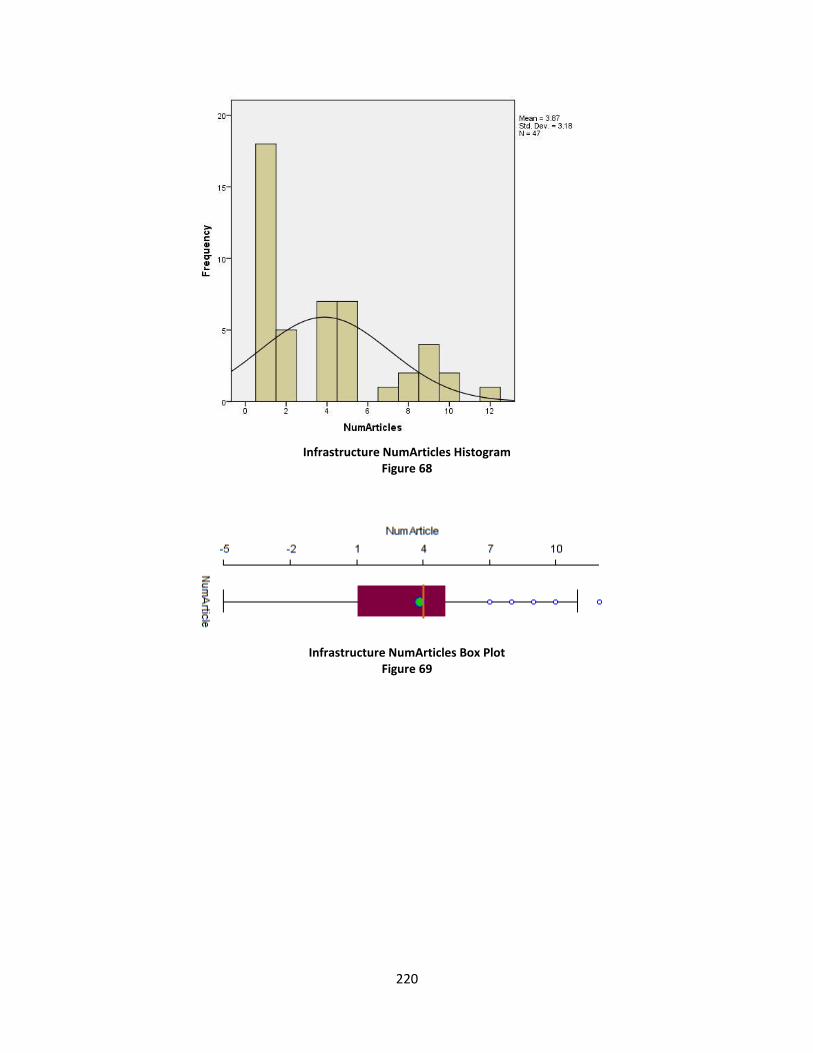
220
Infrastructure NumArticles Histogram
Figure 68
Infrastructure NumArticles Box Plot
Figure 69

221
Infrastructure NumArticles Normality Test
Table 41
Infrastructure AvgTone Summary Statistics
Table 42

222
Infrastructure AvgTone Histogram
Figure 70
Infrastructure AvgTone Box Plot
Figure 71

223
Infrastructure AvgTone Normality Test
Table 43

224
Resampled Statistics (Bootstrapping) Tables
Political NumArticles Resampled Statistics
Table 44
XLSTAT 2
018.5.51886 - Resam
pled
statistics - Start time: 7
/5/2018 at 1:08:35 P
M / En
d tim
e: 7/5/2018 at 1
:08:51 PM
/ Micro
soft Excel 1
6.010228
Qu
antitative d
ata: Wo
rkbo
ok = Po
liticalAsp
aitalData.xlsx / Sh
eet = Sh
eet1 / R
ange = 'Sh
eet1'!$C
$1:$C$41 / 4
0 row
s and
1 co
lum
n
Meth
od
: Bo
otstrap
Samp
le size: 40
Nu
mb
er of sam
ples: 1
000
Significan
ce level (%
): 5
Seed
(rand
om
nu
mb
ers): 1253677953
Sum
mary statistics:
Variab
leO
bserva
tion
sO
bs. w
ith m
issing d
ataO
bs. w
itho
ut m
issing d
ataM
inim
um
Maxim
um
Mea
nStd
. deviatio
n
Nu
mA
rticles40
040
1.00028.000
4.6006.690
Resu
lts of th
e resamp
ling (N
um
Articles):
Parameters
Estimato
rEstim
ator (B
oo
tstrap)
Stand
ard d
eviation
(Bo
otstrap
)Lo
wer b
ou
nd
(Stand
ard b
oo
tstrap in
terval)
Up
per b
ou
nd
(Stand
ard b
oo
tstrap in
terval)
Low
er bo
un
d (B
.C. p
ercentile in
terval)
Up
per b
ou
nd
(B.C
. percen
tile interva
l)
Sum
184.000183.132
42.50998.017
269.983114.000
282.000
Mea
n4.600
4.5781.063
2.4506.750
2.8747.092
Varian
ce (n)
43.64042.238
17.6217.998
79.28213.330
84.206
Varian
ce (n-1)
44.75943.321
18.0738.203
81.31513.673
86.365
Stand
ard d
eviation
(n)
6.6066.344
1.4133.748
9.4643.651
9.176
Stand
ard d
eviation
(n-1)
6.6906.425
1.4313.796
9.5843.698
9.293
Med
ian1.000
1.4100.542
-0.0962.096
1.0001.000
1st Qu
artile1.000
1.0010.024
0.9521.048
1.0001.000
3rd Q
uartile
5.0005.167
2.3470.253
9.7472.000
9.250
Variatio
n co
efficient
1.4361.394
0.1661.100
1.7721.149
1.773
Stand
ard erro
r of th
e mea
n1.058
1.0160.226
0.6001.515
0.5851.469
Mea
n ab
solu
te deviatio
n4.620
4.5161.206
2.1817.059
2.6277.375
Med
ian ab
solu
te deviatio
n0.000
0.4100.542
-1.0961.096
0.0000.000
Geo
metric m
ean
2.2992.330
0.4071.476
3.1221.714
3.362
Geo
metric stan
dard
deviatio
n2.958
2.9070.320
2.3113.605
2.3783.636
Harm
on
ic mea
n1.558
1.5750.159
1.2371.879
1.3151.956
1-Percentile
1.0001.000
0.0001.000
1.0001.000
1.000
99-Percentile
27.61024.808
4.35118.808
36.41213.000
28.000
2.5-Percentile
1.0001.000
0.0001.000
1.0001.000
1.000
97.5-Percentile
27.02522.577
6.21514.454
39.59610.075
28.000
5-Percentile
1.0001.000
0.0001.000
1.0001.000
1.000
95-Percentile
17.50018.447
6.4274.500
30.5009.050
28.000

225
Political AvgTone Resampled Statistics
Table 45
XLSTA
T 20
18
.5.5
18
86
- Resam
pled
statistics - Start time: 7
/5/2
01
8 a
t 1:5
9:3
5 P
M / E
nd
time: 7
/5/2
01
8 a
t 1:5
9:5
1 P
M / M
icroso
ft Excel 1
6.0
10
22
8
Qu
antitative d
ata: Wo
rkbo
ok = P
oliticalA
spaitalD
ata.xlsx / Shee
t = Sh
eet1
/ Ran
ge = 'Shee
t1'!$
e$1
:$e$
41
/ 40
row
s an
d 1
colu
mn
Meth
od
: Bo
otstrap
Samp
le size: 40
Nu
mb
er of sam
ples: 1
00
0
Significan
ce level (%
): 5
Seed
(rand
om
nu
mb
ers): 81
77
05
74
0
Sum
mary statistics:
Variab
leO
bserva
tion
sO
bs. w
ith m
issing d
ataO
bs. w
itho
ut m
issing d
ataM
inim
um
Maxim
um
Mea
nStd
. deviatio
n
AvgTo
ne
40
04
02
.24
27
.90
44
.91
61
.18
5
Re
sults o
f the
resam
plin
g (AvgTo
ne
):
Param
etersEstim
ator
Estimato
r (Bo
otstrap
)Stan
dard
deviatio
n (B
oo
tstrap)
Low
er bo
un
d (Stan
dard
bo
otstrap
interva
l)U
pp
er bo
un
d (Stan
dard
bo
otstrap
interva
l)Lo
wer b
ou
nd
(B.C
. percen
tile interva
l)U
pp
er bo
un
d (B
.C. p
ercentile in
terval)
Sum
19
6.6
48
19
6.9
51
7.5
25
18
1.4
26
21
1.8
69
18
1.1
48
21
1.3
51
Mea
n4
.91
64
.92
40
.18
84
.53
65
.29
74
.52
95
.28
4
Varian
ce (n)
1.3
70
1.3
36
0.3
40
0.6
81
2.0
59
0.8
14
2.2
03
Varian
ce (n-1
)1
.40
51
.37
00
.34
90
.69
92
.11
10
.83
52
.25
9
Stand
ard d
eviation
(n)
1.1
70
1.1
46
0.1
49
0.8
69
1.4
71
0.9
03
1.4
84
Stand
ard d
eviation
(n-1
)1
.18
51
.16
10
.15
10
.88
11
.49
00
.91
41
.50
3
Med
ian4
.88
95
.01
70
.19
44
.49
65
.28
14
.70
65
.25
0
1st Q
uartile
4.4
57
4.4
33
0.3
06
3.8
38
5.0
76
2.8
17
4.8
31
3rd
Qu
artile5
.64
75
.64
30
.18
35
.27
86
.01
75
.04
15
.74
9
Variatio
n co
efficient
0.2
38
0.2
33
0.0
34
0.1
69
0.3
07
0.1
78
0.3
09
Stand
ard e
rror o
f the m
ean
0.1
87
0.1
84
0.0
24
0.1
39
0.2
36
0.1
45
0.2
38
Mea
n a
bso
lute d
eviation
0.8
67
0.8
63
0.1
27
0.6
10
1.1
24
0.6
62
1.1
53
Med
ian a
bso
lute d
eviation
0.7
13
0.6
20
0.1
39
0.4
32
0.9
94
0.5
12
1.0
66
Geo
metric m
ean
4.7
52
4.7
64
0.2
11
4.3
26
5.1
78
4.3
36
5.1
62
Geo
metric stan
dard
deviatio
n1
.32
21
.31
40
.05
41
.21
21
.43
11
.21
01
.42
4
Harm
on
ic mea
n4
.55
54
.57
50
.24
34
.06
45
.04
54
.08
35
.02
9
1-P
ercentile
2.2
42
2.3
95
0.2
60
1.7
17
2.7
67
2.2
42
2.2
42
99
-Percen
tile7
.30
47
.11
30
.63
76
.01
58
.59
26
.08
77
.90
4
2.5
-Percen
tile2
.24
22
.50
30
.37
91
.47
53
.01
02
.24
22
.24
2
97
.5-P
ercentile
6.4
03
6.7
78
0.6
99
4.9
90
7.8
17
5.9
22
7.9
04
5-P
ercentile
2.7
68
2.7
54
0.4
92
1.7
72
3.7
64
2.2
42
2.8
16
95
-Percen
tile6
.36
56
.44
20
.45
95
.43
77
.29
25
.65
76
.36
5

226
Military NumArticles Resampled Statistics
Table 46
XLSTAT 2
018.5.51886 - Resam
pled
statistics - Start time: 7
/23/2018 at 10:41:48 A
M / En
d tim
e: 7/23/2018 at 1
0:56:10 AM
/ Micro
soft Excel 16.010228
Qu
antitative d
ata: Wo
rkbo
ok = M
ilitaryAsp
aitalData.xlsx / Sh
eet = MilitaryD
ata / Ra
nge = 'M
ilitaryData'!$C
$1:$C$1451 / 1
450 row
s and
1 co
lum
n
Meth
od
: Bo
otstrap
Samp
le size: 1450
Nu
mb
er of sam
ples: 9
99
Significan
ce level (%): 5
Seed (ran
do
m n
um
bers): 4
434548
Sum
mary statistics:
Variab
leO
bservatio
ns
Ob
s. with
missin
g data
Ob
s. with
ou
t missin
g data
Min
imu
mM
aximu
mM
eanStd
. deviatio
n
Nu
mA
rticles1450
01450
1.000163.000
5.7879.753
Resu
lts of th
e resamp
ling (N
um
Articles):
Parameters
Estimato
rEstim
ator (B
oo
tstrap)
Stand
ard d
eviation
(Bo
otstrap
)Lo
wer b
ou
nd
(B.C
. percen
tile interval)
Up
per b
ou
nd
(B.C
. percen
tile interval)
Mean
5.7875.799
0.2595.308
6.305
Stand
ard d
eviation
(n)
9.7509.716
1.1377.711
12.078
Stand
ard d
eviation
(n-1)
9.7539.719
1.1377.714
12.082
Med
ian2.000
2.2070.400
2.0002.000

227
Military AvgTone Resampled Statistics
Table 47
XLSTAT 2
018.5.51886 - Resam
pled
statistics - Start time: 7
/23/2018 at 11:12:51 A
M / En
d tim
e: 7/23/2018 at 1
1:20:01 AM
/ Micro
soft Excel 16.010228
Qu
antitative d
ata: Wo
rkbo
ok = M
ilitaryAsp
aitalData.xlsx / Sh
eet = MilitaryD
ata / Ra
nge = 'M
ilitaryData'!$d
$1:$d$1451 / 1
450 row
s and
1 co
lum
n
Meth
od
: Bo
otstrap
Samp
le size: 1450
Nu
mb
er of sam
ples: 9
99
Significan
ce level (%): 5
Seed (ran
do
m n
um
bers): 4
87866391
Sum
mary statistics:
Variab
leO
bservatio
ns
Ob
s. with
missin
g data
Ob
s. with
ou
t missin
g data
Min
imu
mM
aximu
mM
eanStd
. deviatio
n
AvgTo
ne
14500
14500.000
10.2273.561
1.661
Resu
lts of th
e resamp
ling (A
vgTon
e):
Parameters
Estimato
rEstim
ator (B
oo
tstrap)
Stand
ard d
eviation
(Bo
otstrap
)Lo
wer b
ou
nd
(B.C
. percen
tile interval)
Up
per b
ou
nd
(B.C
. percen
tile interval)
Mean
3.5613.561
0.0423.480
3.640
Stand
ard d
eviation
(n)
1.6611.659
0.0341.597
1.735
Stand
ard d
eviation
(n-1)
1.6611.660
0.0341.597
1.736
Med
ian3.513
3.5240.054
3.4293.651

228
Economic NumArticles Resampled Statistics
Table 48
XLSTA
T 20
18
.5.5
18
86
- Resam
pled
statistics - Start time: 7
/10
/20
18
at 9
:14
:55
AM
/ En
d tim
e: 7/1
0/2
01
8 a
t 9:1
7:2
4 A
M / M
icroso
ft Excel 1
6.0
10
22
8
Qu
antitative d
ata: Wo
rkbo
ok = Eco
nA
spaitalD
ata.xlsx / Shee
t = B
oo
tstrap A
nalysis / R
ange = 'B
oo
tstrap A
nalysis'!$
C$
1:$
C$
25
9 / 2
58
row
s an
d 1
colu
mn
Meth
od
: Bo
otstrap
Samp
le size: 25
8
Nu
mb
er of sam
ples: 9
99
9
Significan
ce level (%
): 5
Seed
(rand
om
nu
mb
ers): 44
20
55
6
Sum
mary statistics:
Variab
leO
bserva
tion
sO
bs. w
ith m
issing d
ataO
bs. w
itho
ut m
issing d
ataM
inim
um
Maxim
um
Mea
nStd
. deviatio
n
Nu
mA
rticles2
58
02
58
1.0
00
16
3.0
00
5.7
87
13
.97
9
Re
sults o
f the
resam
plin
g (Nu
mA
rticles):
Param
etersEstim
ator
Estimato
r (Bo
otstrap
)Stan
dard
deviatio
n (B
oo
tstrap)
Low
er bo
un
d (Stan
dard
bo
otstrap
interva
l)U
pp
er bo
un
d (Stan
dard
bo
otstrap
interva
l)Lo
wer b
ou
nd
(B.C
. percen
tile interva
l)U
pp
er bo
un
d (B
.C. p
ercentile in
terval)
Sum
14
93
.00
01
49
2.0
52
22
2.4
99
10
54
.84
61
93
1.1
54
11
23
.00
02
01
7.0
00
Mea
n5
.78
75
.78
30
.86
24
.08
97
.48
54
.35
37
.81
8
Varian
ce (n)
19
4.6
48
19
3.7
54
10
0.5
69
-3.3
97
39
2.6
94
59
.85
24
74
.00
1
Varian
ce (n-1
)1
95
.40
61
94
.50
81
00
.96
1-3
.41
03
94
.22
26
0.0
85
47
5.8
46
Stand
ard d
eviation
(n)
13
.95
21
3.4
44
3.6
09
6.8
45
21
.05
87
.73
62
1.7
72
Stand
ard d
eviation
(n-1
)1
3.9
79
13
.47
03
.61
66
.85
82
1.0
99
7.7
51
21
.81
4
Med
ian2
.00
02
.01
20
.10
71
.78
92
.21
12
.00
02
.00
0
1st Q
uartile
1.0
00
1.0
00
0.0
00
1.0
00
1.0
00
1.0
00
1.0
00
3rd
Qu
artile5
.00
05
.70
60
.93
13
.16
66
.83
43
.00
05
.00
0
Variatio
n co
efficient
2.4
11
2.2
93
0.3
73
1.6
77
3.1
45
1.6
88
3.0
03
Stand
ard e
rror o
f the m
ean
0.8
70
0.8
39
0.2
25
0.4
27
1.3
14
0.4
83
1.3
58
Mea
n a
bso
lute d
eviation
5.7
41
5.7
35
1.2
13
3.3
53
8.1
30
3.8
04
8.7
01
Med
ian a
bso
lute d
eviation
1.0
00
1.0
12
0.1
07
0.7
89
1.2
11
1.0
00
1.0
00
Geo
metric m
ean
2.6
94
2.6
99
0.1
75
2.3
51
3.0
38
2.3
87
3.0
69
Geo
metric stan
dard
deviatio
n2
.82
72
.82
10
.15
72
.51
93
.13
62
.54
83
.16
8
Harm
on
ic mea
n1
.83
61
.83
90
.07
91
.68
01
.99
21
.69
42
.00
7
1-P
ercentile
1.0
00
1.0
00
0.0
00
1.0
00
1.0
00
1.0
00
1.0
00
99
-Percen
tile7
0.7
20
68
.53
72
1.9
01
27
.59
11
13
.84
93
1.3
00
11
5.6
90
2.5
-Percen
tile1
.00
01
.00
00
.00
01
.00
01
.00
01
.00
01
.00
0
97
.5-P
ercentile
36
.57
53
8.5
46
15
.17
06
.70
16
6.4
49
15
.00
06
9.0
00
5-P
ercentile
1.0
00
1.0
00
0.0
00
1.0
00
1.0
00
1.0
00
1.0
00
95
-Percen
tile1
5.4
50
16
.05
86
.45
02
.74
92
8.1
51
9.0
00
28
.35
0

229
Economic AvgTone Resampled Statistics
Table 49
XLSTA
T 20
18
.5.5
18
86
- Resam
pled
statistics - Start time: 7
/10
/20
18
at 9
:28
:42
AM
/ En
d tim
e: 7/1
0/2
01
8 a
t 9:3
1:2
5 A
M / M
icroso
ft Excel 1
6.0
10
22
8
Qu
antitative d
ata: Wo
rkbo
ok = Eco
nA
spaitalD
ata.xlsx / Shee
t = B
oo
tstrap A
nalysis / R
ange = 'B
oo
tstrap A
nalysis'!$
d$
1:$
d$
25
9 / 2
58
row
s an
d 1
colu
mn
Meth
od
: Bo
otstrap
Samp
le size: 25
8
Nu
mb
er of sam
ples: 9
99
9
Significan
ce level (%
): 5
Seed
(rand
om
nu
mb
ers): 58
77
84
29
4
Sum
mary statistics:
Variab
leO
bserva
tion
sO
bs. w
ith m
issing d
ataO
bs. w
itho
ut m
issing d
ataM
inim
um
Maxim
um
Mea
nStd
. deviatio
n
AvgTo
ne
25
80
25
80
.00
01
2.1
36
4.6
45
1.7
62
Re
sults o
f the
resam
plin
g (AvgTo
ne
):
Param
etersEstim
ator
Estimato
r (Bo
otstrap
)Stan
dard
deviatio
n (B
oo
tstrap)
Low
er bo
un
d (Stan
dard
bo
otstrap
interva
l)U
pp
er bo
un
d (Stan
dard
bo
otstrap
interva
l)Lo
wer b
ou
nd
(B.C
. percen
tile interva
l)U
pp
er bo
un
d (B
.C. p
ercentile in
terval)
Sum
11
98
.53
81
19
8.5
06
28
.35
61
14
2.6
98
12
54
.37
81
14
2.3
75
12
53
.06
3
Mea
n4
.64
54
.64
50
.11
04
.42
94
.86
24
.42
84
.85
7
Varian
ce (n)
3.0
94
3.0
82
0.3
16
2.4
71
3.7
17
2.5
56
3.8
07
Varian
ce (n-1
)3
.10
63
.09
40
.31
72
.48
13
.73
12
.56
63
.82
2
Stand
ard d
eviation
(n)
1.7
59
1.7
53
0.0
90
1.5
82
1.9
36
1.5
99
1.9
51
Stand
ard d
eviation
(n-1
)1
.76
21
.75
70
.09
01
.58
51
.93
91
.60
21
.95
5
Med
ian4
.75
44
.75
30
.08
04
.59
54
.91
24
.55
14
.89
6
1st Q
uartile
3.5
60
3.5
41
0.1
31
3.3
02
3.8
18
3.3
08
3.7
68
3rd
Qu
artile5
.69
15
.71
20
.16
45
.36
86
.01
45
.46
15
.99
6
Variatio
n co
efficient
0.3
79
0.3
78
0.0
21
0.3
38
0.4
19
0.3
41
0.4
22
Stand
ard e
rror o
f the m
ean
0.1
10
0.1
09
0.0
06
0.0
99
0.1
21
0.1
00
0.1
22
Mea
n a
bso
lute d
eviation
1.3
62
1.3
61
0.0
70
1.2
25
1.5
00
1.2
30
1.5
03
Med
ian a
bso
lute d
eviation
1.1
22
1.1
10
0.0
83
0.9
59
1.2
85
0.9
55
1.2
83
Geo
metric m
ean
Geo
metric stan
dard
deviatio
n
Harm
on
ic mea
n
1-P
ercentile
0.8
47
0.8
16
0.2
74
0.3
08
1.3
86
0.0
00
1.0
39
99
-Percen
tile8
.46
48
.65
30
.85
46
.78
31
0.1
45
7.6
43
10
.54
9
2.5
-Percen
tile1
.18
31
.27
10
.27
80
.63
61
.73
10
.60
71
.74
5
97
.5-P
ercentile
7.9
13
7.8
25
0.2
80
7.3
63
8.4
64
7.3
78
8.6
24
5-P
ercentile
1.7
52
1.7
58
0.1
70
1.4
18
2.0
86
1.1
37
1.8
18
95
-Percen
tile7
.38
27
.31
50
.24
06
.91
07
.85
56
.89
27
.80
8

230
Social NumArticles Resampled Statistics
Table 50
XLSTAT 2
018.5.51886 - Resam
pled
statistics - Start time: 7
/23/2018 at 7:47:05 P
M / En
d tim
e: 7/23/2018 at 7
:47:14 PM
/ Micro
soft Excel 16.010228
Qu
antitative d
ata: Wo
rkbo
ok = So
cialAsp
aitalData.xlsx / Sh
eet = SocialD
ata / Ra
nge = So
cialData!$C
$1:$C$45 / 4
4 row
s and
1 co
lum
n
Meth
od
: Bo
otstrap
Samp
le size: 44
Nu
mb
er of sam
ples: 9
999
Significan
ce level (%): 5
Seed (ran
do
m n
um
bers): 4
525105
Sum
mary statistics:
Variab
leO
bservatio
ns
Ob
s. with
missin
g data
Ob
s. with
ou
t missin
g data
Min
imu
mM
aximu
mM
eanStd
. deviatio
n
Nu
mA
rticles44
044
1.00019.000
5.0454.899
Resu
lts of th
e resamp
ling (N
um
Articles):
Parameters
Estimato
rEstim
ator (B
oo
tstrap)Stan
dard
deviatio
n (B
oo
tstrap)
Low
er bo
un
d (B
.C. p
ercentile in
terval)U
pp
er bo
un
d (B
.C. p
ercentile in
terval)
Mean
5.0455.049
0.7273.750
6.591
Stand
ard d
eviation
(n)
4.8434.748
0.6823.500
6.119
Stand
ard d
eviation
(n-1)
4.8994.803
0.6903.540
6.189
Med
ian3.000
3.1751.099
2.0005.000
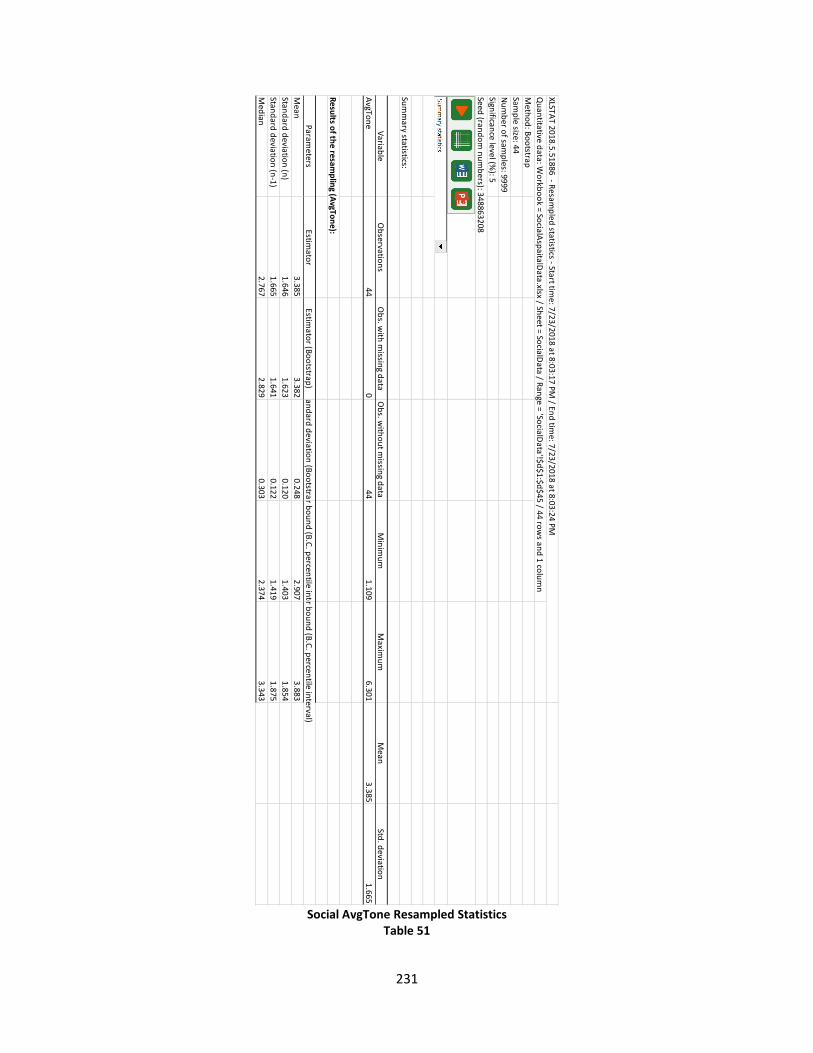
231
Social AvgTone Resampled Statistics
Table 51
XLSTAT 2
018.5.51886 - Resam
pled
statistics - Start time: 7
/23/2018 at 8:03:17 P
M / En
d tim
e: 7/23/2018 at 8
:03:24 PM
/ Micro
soft Excel 16.010228
Qu
antitative d
ata: Wo
rkbo
ok = So
cialAsp
aitalData.xlsx / Sh
eet = SocialD
ata / Ra
nge = 'So
cialData'!$d
$1:$d$45 / 4
4 row
s and
1 co
lum
n
Meth
od
: Bo
otstrap
Samp
le size: 44
Nu
mb
er of sam
ples: 9
999
Significan
ce level (%): 5
Seed (ran
do
m n
um
bers): 3
48863208
Sum
mary statistics:
Variab
leO
bservatio
ns
Ob
s. with
missin
g data
Ob
s. with
ou
t missin
g data
Min
imu
mM
aximu
mM
eanStd
. deviatio
n
AvgTo
ne
440
441.109
6.3013.385
1.665
Resu
lts of th
e resamp
ling (A
vgTon
e):
Parameters
Estimato
rEstim
ator (B
oo
tstrap)
Stand
ard d
eviation
(Bo
otstrap
)Lo
wer b
ou
nd
(B.C
. percen
tile interval)
Up
per b
ou
nd
(B.C
. percen
tile interval)
Mean
3.3853.382
0.2482.907
3.883
Stand
ard d
eviation
(n)
1.6461.623
0.1201.403
1.854
Stand
ard d
eviation
(n-1)
1.6651.641
0.1221.419
1.875
Med
ian2.767
2.8290.303
2.3743.343
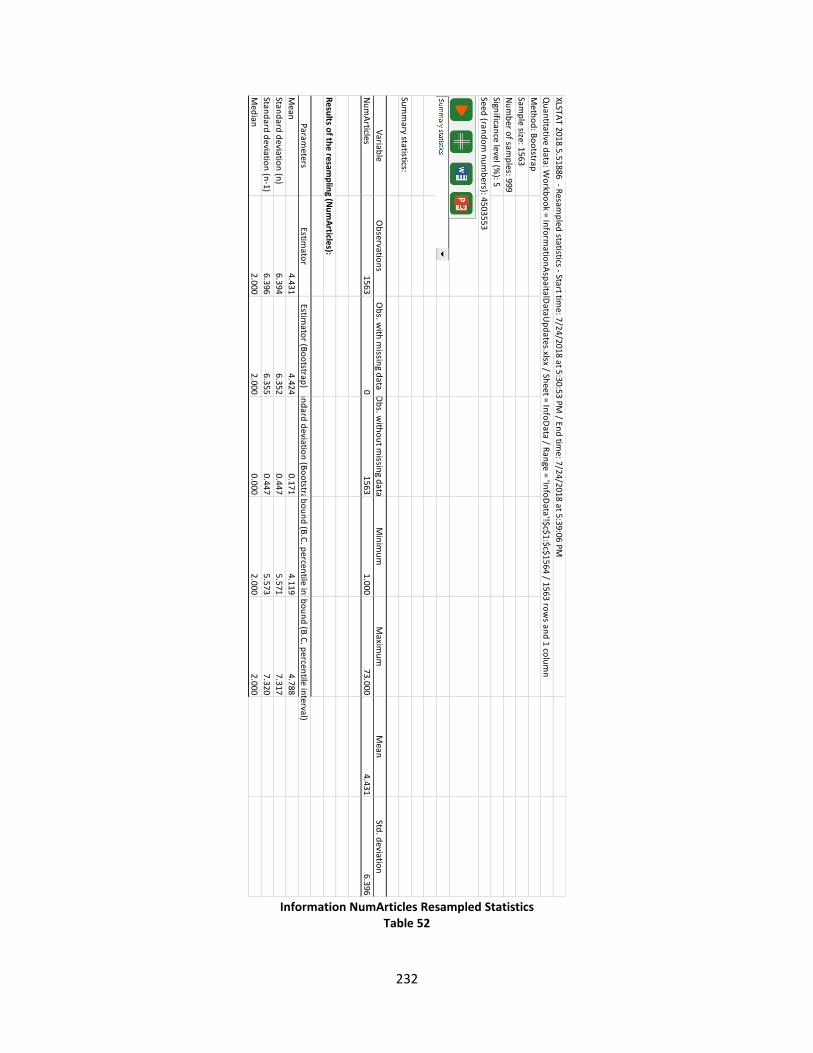
232
Information NumArticles Resampled Statistics
Table 52
XLSTAT 2
018.5.51886 - Resam
pled
statistics - Start time: 7
/24/2018 at 5:30:53 P
M / En
d tim
e: 7/24/2018 at 5
:39:06 PM
/ Micro
soft Excel 16.010228
Qu
antitative d
ata: Wo
rkbo
ok = In
form
ation
Asp
aitalDataU
pd
ates.xlsx / Sheet = In
foD
ata / Ra
nge = 'In
foD
ata'!$c$1:$c$1564 / 1563 ro
ws an
d 1
colu
mn
Meth
od
: Bo
otstrap
Samp
le size: 1563
Nu
mb
er of sam
ples: 9
99
Significan
ce level (%): 5
Seed (ran
do
m n
um
bers): 4
503553
Sum
mary statistics:
Variab
leO
bservatio
ns
Ob
s. with
missin
g data
Ob
s. with
ou
t missin
g data
Min
imu
mM
aximu
mM
eanStd
. deviatio
n
Nu
mA
rticles1563
01563
1.00073.000
4.4316.396
Resu
lts of th
e resamp
ling (N
um
Articles):
Parameters
Estimato
rEstim
ator (B
oo
tstrap)Stan
dard
deviatio
n (B
oo
tstrap)
Low
er bo
un
d (B
.C. p
ercentile in
terval)U
pp
er bo
un
d (B
.C. p
ercentile in
terval)
Mean
4.4314.424
0.1714.119
4.788
Stand
ard d
eviation
(n)
6.3946.352
0.4475.571
7.317
Stand
ard d
eviation
(n-1)
6.3966.355
0.4475.573
7.320
Med
ian2.000
2.0000.000
2.0002.000

233
Information AvgTone Resampled Statistics
Table 53
XLSTAT 2018.5.51886 - Resampled statistics - Start tim
e: 7/24/2018 at 5:43:20 PM / End tim
e: 7/24/2018 at 5:51:42 PM / M
icrosoft Excel 16.010228
Quantitative data: Workbook = Inform
ationAspaitalDataUpdates.xlsx / Sheet = InfoData / Range = InfoData!$D$1:$D$1564 / 1563 rows and 1 colum
n
Method: Bootstrap
Sample size: 1563
Number of sam
ples: 999
Significance level (%): 5
Seed (random num
bers): 1774257099
Summ
ary statistics:
VariableObservations
Obs. with m
issing dataObs. w
ithout missing data
Minim
umM
aximum
Mean
Std. deviation
AvgTone1563
01563
0.00012.136
4.5531.898
Results of the resampling (AvgTone):
Parameters
Estimator
Estimator (Bootstrap)
Standard deviation (Bootstrap)Low
er bound (B.C. percentile interval)Upper bound (B.C. percentile interval)
Mean
4.5534.554
0.0484.459
4.646
Standard deviation (n)1.897
1.8950.035
1.8361.969
Standard deviation (n-1)1.898
1.8960.035
1.8361.969
Median
4.4924.495
0.0644.362
4.643

234
Infrastructure NumArticles Resampled Statistics
Table 54
XLSTAT 2
018.5.51886 - Resam
pled
statistics - Start time: 7
/25/2018 at 7:39:21 P
M / En
d tim
e: 7/25/2018 at 7
:39:25 PM
/ Micro
soft Excel 16.010228
Qu
antitative d
ata: Wo
rkbo
ok = In
frastructu
reAsp
aitalDataU
pd
ate.xlsx / Sheet = In
fraData / R
an
ge = 'InfraD
ata'!$c$1:$c$48 / 47 ro
ws an
d 1
colu
mn
Meth
od
: Bo
otstrap
Samp
le size: 47
Nu
mb
er of sam
ples: 9
99
Significan
ce level (%): 5
Seed (ran
do
m n
um
bers): 6
70245819
Sum
mary statistics:
Variab
leO
bservatio
ns
Ob
s. with
missin
g data
Ob
s. with
ou
t missin
g data
Min
imu
mM
aximu
mM
eanStd
. deviatio
n
Nu
mA
rticles47
047
1.00012.000
3.8723.180
Resu
lts of th
e resamp
ling (N
um
Articles):
Parameters
Estimato
rEstim
ator (B
oo
tstrap)
Stand
ard d
eviation
(Bo
otstrap
)Lo
wer b
ou
nd
(B.C
. percen
tile interval)
Up
per b
ou
nd
(B.C
. percen
tile interval)
Mean
3.8723.888
0.4683.103
4.814
Stand
ard d
eviation
(n)
3.1463.102
0.2892.612
3.718
Stand
ard d
eviation
(n-1)
3.1803.136
0.2922.641
3.758
Med
ian4.000
3.1021.108
1.0004.000

235
Infrastructure AvgTone Resampled Statistics Table 55
XLSTAT 2
018.5.51886 - Resam
pled
statistics - Start time: 7
/25/2018 at 7:37:59 P
M / En
d tim
e: 7/25/2018 at 7
:38:04 PM
/ Micro
soft Excel 16.010228
Qu
antitative d
ata: Wo
rkbo
ok = In
frastructu
reAsp
aitalDataU
pd
ate.xlsx / Sheet = In
fraData / R
an
ge = InfraD
ata!$D$1:$D
$48 / 47 ro
ws an
d 1
colu
mn
Meth
od
: Bo
otstrap
Samp
le size: 47
Nu
mb
er of sam
ples: 9
99
Significan
ce level (%): 5
Seed (ran
do
m n
um
bers): 4
524359
Sum
mary statistics:
Variab
leO
bservatio
ns
Ob
s. with
missin
g data
Ob
s. with
ou
t missin
g data
Min
imu
mM
aximu
mM
eanStd
. deviatio
n
AvgTo
ne
470
471.786
8.6084.559
1.331
Resu
lts of th
e resamp
ling (A
vgTon
e):
Parameters
Estimato
rEstim
ator (B
oo
tstrap)
Stand
ard d
eviation
(Bo
otstrap
)Lo
wer b
ou
nd
(B.C
. percen
tile interval)
Up
per b
ou
nd
(B.C
. percen
tile interval)
Mean
4.5594.547
0.1994.198
4.998
Stand
ard d
eviation
(n)
1.3161.296
0.1541.056
1.643
Stand
ard d
eviation
(n-1)
1.3311.310
0.1551.067
1.661
Med
ian4.500
4.5450.261
3.6564.966

236
REFERENCES
Agresti, Alan and Barbara Finlay. Statistical Methods for the Social Sciences, 3rd ed. Upper Saddle River, NJ: Prentince Hall, Inc., 1999.
Akerlof, George A. “The Market for ‘Lemons’: Quality Uncertainty and the Market Mechanism.” The Quarterly Journal of Economics 84, no. 3. (August 1970): 488-500.
Alberts, David S., John J. Garstka and Frederick P. Stein. Network Centric Warfare: Developing and Leveraging Information Superiority, 2d ed. revised. Washington, DC: Office of the Assistant Secretary of Defense (NII), 2002): 127-128, http://www.dodccrp.org/files/Alberts_NCW.pdf. (accessed July 20, 2012)
Anjomani, Ardeshir with Ali Saberi and Naveed Shad, 2005. “SDSS for Land Use and Environmental Planning: An Application Example” GIS Planet (pp. S23). Spatial Decision Support Systems. Conference Proceeding.
Anselin, Luc. GeoDa™ 0.9 User's Guide. Urbana, IL: Center for Spatially Integrated Social Science, 2003.
Anselin, Luc. “The Moran scatterplot as an ESDA tool to assess local instability in spatial association,” in Spatial Analytical Perspectives on GIS, eds. Manfred Fischer, Henk J. Scholten, and David Unwin. London: Taylor & Francis, 1996.
Babbie, Earl. Observing Ourselves: Essays in Social Research. Belmont, CA: Wadsworth 1986.
Berger, Peter and Luckman, Thomas. The Social Construction of Reality: A Treaties in the Sociology of Knowledge. New York: Anchor Press 1966.
Beskow, David, et al., “Data Collection, Fusion, and Visualization for Decision Making in Stability Operations” in Proceedings of the 2014 Industrial and Systems Engineering Research Conference, ed. Y. Guan and H. Liao. Norcross, GA: Institute of Industrial Engineers, 2014.
Best, Rebecca H., Christine Carpino, and Mark J.C. Crescenzi, "An analysis of the TABARI coding system, " Conflict management and peace science 30, no. 4, (September 1, 2013): 335-348.
Bird, Alexander. Philosophy of Science. Montreal: McGill Queen’s University Press 1998.
Bongioanni, Marco A. “Remote Civil Information Management: A Concept For How U.S. Army Reserve Civil Affairs Subject Matter Experts Can Bring Relevant Civilian Skill Set Support to Combatant Commanders”2014 - 2015 Civil Affairs Issue Papers: The Future of Civil Affairs, ed. Christopher Holshek John C. Church, Jr. (Carlisle Barracks, PA: United States Army War College Press, February 18, 2015).
Bolstad, Paul. GIS Fundamentals: A First Text on Geographic Information Systems, 3rd ed. White Bear Lake, MN: Eider Press, 2008.

237
Brinkerhoff, Derick W., Ronald W. Johnson, and Richard Hill, Guide to Rebuilding Public Sector Services in Stability Operations: A Role for the Military. Carlisle, PA: Strategic Studies Institute, U.S. Army War College, October 2009.
Bryman, Alan. Social Research Methods 4th ed. (New York: Oxford University Press 2012).
Buffaloe, David L. “Defining Asymmetric Warfare.” The Institute of Land Warfare no. 58 (September 2006).
Burt, James E., Gerald M. Barber, and David L. Rigby. Elementary Statistics for Geographers, 3rd ed. New York: Guilford Press, 2009.
Bush, George W. “Management of Interagency Efforts Concerning Reconstruction and Stabilization”, National Security Presidential Directive/ NSPD-44. Washington DC: The White House, http://www.fas.org/irp/offdocs/nspd/nspd-44.html (accessed 30 August 2012).
Bush, George W. "President's Address to the Nation". Speech, Washington DC, January 10, 2007. Office of the Press Secretary. https://georgewbush-whitehouse.archives.gov/news/releases/2007/01/20070110-7.html (accessed 30 August 2012).
Carmines, Edward and Zeller Richard, Reliability and Validity Assessment. Beverly Hills, CA: Sage 1979.
Connable, Ben. “All Our Eggs in a Broken Basket: How the Human Terrain System is Undermining Sustained Cultural Competence,” Military Review 89, no. 2 (March-April 2009): 57-64.
Connable, Ben. “Human Terrain System is Dead, Long Live … What?: Building and Sustaining Military Cultural Competence in the Aftermath of the Human Terrain System” in Military Review 98, no.1 (January-February 2018), 24-33.
Coutinho-Rodrigues, João, Ana Simão and Carlos Henggeler Antunes. “A GIS-based multicriteria spatial decision support system for planning urban infrastructures.” Decision Support Systems 51 (February 3, 2011), 720-726. https://www.sciencedirect.com/science/article/pii/S0167923611000698 (accessed March 5, 2016).
Creswell, John W. Research Design: Qualitative, Quantitative, and Mixed Methods Approaches, 3rd ed. Thousand Oaks California: Sage 2009.
de Silva, FN and R.W. Eglese. “Integrating simulation modelling and GIS: spatial decision support systems for evacuation planning.” Journal of the Operational Research Society 51, no.4 (April, 2000): 423-430 https://link.springer.com/content/pdf/10.1057%2Fpalgrave.jors.2600879.pdf (accessed March 20, 2016).
de Sousa, Willy Hoppe and Abraham Sin Oih Yu. “Decision Making Planning: The Meta-decision Approach.” Engineering Management Research 3, No. 1 (March 19, 2014). http://dx.doi.org/10.5539/emr.v3n1p41 (accessed March 20, 2016).

238
Drucker, Peter F. “The Coming of the New Organization” in Harvard Business Review on Knowledge Management. Cambridge: Harvard Business School Press (January 1998): 1-19.
Ducote, Brian M. Challenging the Application of PMESII-PT in a Complex Environment Fort Leavenworth, Kansas: School of Advanced Military Studies United States Army Command and General Staff College April 26, 2010.
Duriau, Vincent J., Rhonda K. Reger and Michael D. Pfarrer. “A Content Analysis of the Content Analysis Literature in Organization Studies: Research Themes, Data Sources, and Methodological Refinements.” Organization Research Methods 10, no. 1 (January 2007) https://media.terry.uga.edu/socrates/publications/2011/07/A20Content20Analysis20of20the20Content20Analysis20Literature2028ORM20200729_1.pdf (accessed February 28, 2018).
Eldrandaly, Khalid et al. “Integrating GIS and MCDM Using COM Technology.” The International Arab Journal of Information Technology 2, no. 2 (April 2005): 162-163.
Elkus, Adam. “Complexity, Design, and Modern Operational Art: U.S. Evolution or False Start?” Canadian Army Journal 13, no. 3 (Autumn 2010): 55-67.
Falk, Peter R., ARIES: an architectural implementation of a multi-criterion Spatial Decision Support System (SDSS). Monterey, CA: Naval Postgraduate School, September 1997.
Fayyad, Usama, Gregory Piatetsky-Shapiro and Padhraic Smyth. "From Data Mining to Knowledge Discovery in Databases." AI Magazine (Fall 1996): 37-54. http://www.kdnuggets.com/gpspubs/aimag-kdd-overview-1996-Fayyad.pdf (accessed August 2, 2018).
Ferretti, Valentina and Gilberto Montibeller. “Key challenges and meta-choices in designing and applying multi-criteria spatial decision support systems.” Decision Support Systems (January 17, 2016) http://dx.doi.org/10.1016/j.dss.2016.01.005 (accessed February 27, 2018).
Flavin, William. "Planning for Conflict Termination and Post-Conflict Success." Parameters 32, no. 3 (Autumn 2003): 95-112.
Flynn, Major General Michael T., USA, Captain Matt Pottinger, U.S.MC, and Paul D. Batchelor, DIA. Fixing Intel: A Blueprint for Making Intelligence Relevant in Afghanistan. Washington, DC: Center for a New American Security (January 2010).
Forman, Ernest H. “Random Indices for Incomplete Pairwise Comparison Matrices.” European Journal of Operational Research 48, no 1 (September 5,1990): 153-155.
Foster, S. Thomas. Managing Quality: Integrating the Supply Chain, 3d ed. Upper Saddle, New Jersey: Pearson, Prentice Hall, 2007.

239
Greenwood, T.C. and T. X. Hammes, “War Planning for Wicked Problems.” Armed Forces Journal (December 2009/January 2010): 18 -37.
Han, Jiawei, Micheline Kamber and Jian Pei. Data mining: concepts and techniques (Waltham, MA: Morgan Kaufmann Publishers), 6-7.
Hanhauser IV, George J. “Comprehensive Civil Information Management: How to Provide It.” Strategic Research Paper, U.S. Army War College, March 4, 2012.
Hillson, R. "The DIME/PMESII Model Suite Requirements Project." The Naval Research Laboratory Review 2009, 235 Washington DC, Naval Research Laboratory.
Holsti, Ole R. Content Analysis for the Social Sciences and Humanities. Reading, MA: Addison-Wesley, 1969.
Hsu Chia-Chien and Sandford, Brian A. “The Delphi Technique: Making Sense of Consensus,” Practical Assessment, Research and Evaluation 12, no. 10 (August 2007):1-8.
Ishizaka, Alessio and Philippe Nemery. Multi-Criteria Decision Analysis: Methods and Software. West Sussex, UK: John Wiley and Sons, 2013.
Jacobs, Thomas Owen. “Strategic Environment,” In Strategic Leadership: The Competitive Edge, 170-188. Fort Lesley J. McNair, DC: Industrial College of the Armed Forces, National Defense University, 2002.
Kennedy, Craig H. “Trends in the Measurement of Social Validity,” The Behavior Analyst 15, No. 2 (Fall 1992), 147-156.
Klosterman, Richard. “Arguments For and Against Planning,” The Town Planning Review 56, no. 1 (January 1985): 5-20.
Krivoruchko, Konstantin and Gotway-Crawford, Carol A. “Assessing the Uncertainty Resulting from Geoprocessing Operations.” In GIS, Spatial Analysis, and Modeling edited David J. Maguire, Michael Batty, and Michael F. Goodchild, 67-92. Redlands: ESRI Press, 2005.
Lee, Insung. “Development of procedural expertise to support multiattribute spatial decision making.” Ph.D. diss. University of Illinois at Urbana-Champaign, 1994.
Leetaru, Kalev and Philip A. Schrodt, “GDELT: Global Data on Events, Location and Tone, 1979-2012. Version 1.0,” March 29, 2013, 45. http://data.gdeltproject.org/documentation/ISA.2013.GDELT.pdf (accessed August 31, 2014).
Leipnik, Mark R., Karen K. Kemp, and Hugo A. Loaiciga, “Implementation of GIS for water resources planning and management,” Journal of Water Resources Planning and Management 119, no. 2, (March 1993):184.
Lorca, Álvaro, Melih Çelik, Özlem Ergun, and Pinar Keskinocak. “A decision-support tool for post-disaster debris operations.” Humanitarian Technology: Science, Systems and Global Impact 2015, HumTech2015 in Procedia Engineering 107 (2015): 154-167. https://www.sciencedirect.com/science/article/pii/S187770581501022X/pdf?md5

240
=a42e12ba39e0f8b887807110c07afa9f&pid=1-s2.0-S187770581501022X-main.pdf (accessed March 10, 2016).
Lindblom, Charles and Edward J. Woodhouse, The Policy-Making Process. 3d ed. Upper Saddle River, New Jersey: Prentice Hall, 1993.
Lindenmayer, Martin J. “Civil Information and Intelligence Fusion: Making ‘Non-Traditional’ into ‘New Traditional’ for the JTF Commander”. Small Wars Journal. (June 2011) http://smallwarsjournal.com/blog/journal/docs-temp/794-lindenmayer.pdf&sa=U&ei=og56Ts-7BJGCsgKPgOnQAw&ved=0CBUQFjAB&usg=AFQjCNGRu1aCqcEXtv0Zftexl-eRZ0BnHQ (accessed September 21, 2011).
Lloyd, Earnestrheinold R. “Stability Operations, Civil Information Management and Spatial Decision Support Systems.” USAWC Directed Study Paper, (Carlisle Barracks, PA: U.S. Army War College May 10, 2012).
Lukes, Steven, Power: A Radical View (New York: Palgrave Macmillan, 2005), 20-21.
Madera, José M. “Civil Information Management in Support of Counterinsurgency Operations: A Case for the Use of Geospatial Information Systems in Colombia.” Monograph, (Fort Leavenworth, KS: School of Advanced Military Studies United States Army Command and General Staff College, May 25, 2005).
Malczewski, Jacek. GIS and Multicriteria Decision Analysis. (New York: John Wiley and Sons, Inc., 1999.
McConnell, Campbell, Stanley Brue, and Sean Flynn, “Chapter 16, Public Goods, Externalities, and Information Asymmetries.” In Economics 18th ed. (Columbus, OH: McGraw-Hill Economics). http://highered.mcgraw-hill.com/sites/dl/free/0073375691/627557/Chapter16.pdf (accessed May 21, 2012).
McFate, Montgomery and Jackson, Andrea "An Organizational Solution for DODs Cultural Knowledge Needs" Military Review 85, no.4 (July–August 2005): 18.
McHarg, Ian. Design With Nature (New York: John Wiley and Sons, 1992).
McNutt, Patrick. "Public Goods and Club Goods," In Encyclopedia of Law and Economics (Northampton, MA: Edward Elgar Publishing 1999). http://encyclo.findlaw.com/0750book.pdf, (accessed May 25, 2012).
Moore, Will H. “Two Rubes Walk into a Bar, Order Event Data (Part 2).” March 2, 2014. https://willopines.wordpress.com/2014/03/02/two-rubes-walk-into-a-bar-order-event-data-part-2/ (accessed May 28, 2016).
Mustajoki, Jyri and Mika Marttunen, “Comparison of Multi-Criteria Decision Analytical Software: Searching for ideas for developing a new EIA-specific multi-criteria software,” Finnish Environment Institute, Helsinki, 3 Feb 19, 2013, http://imperia.jyu.fi/tuotokset/Annex7.5.13ComparisonofMultiCriteriaDecisionAnalyticalSoftware.pdf (accessed 30 DEC 2014).
National Guard Bureau. “What is a Common Operational Picture (COP).” Domestic Joint Task Force Commander Training Course Handbook . Arlington VA,

241
National Guard Bureau, 2011. https://dde.carlisle.army.mil/documents/courses_13/Readings/2307_JTF%20CmdrHandbook.pdf (accessed July 20, 2012).
Neuendof, Kimbely A. The Content Analysis Guidebook. Thousand Oaks, California: Sage 2002.
O’Sullivan, David and Unwin, David J. Geographic Information Analysis. 2nd ed. Hoboken, NJ: John Wiley and Sons, Inc., 2010.
Pheanis, Mike and COL Donald Jackson. Joint Civil Information Management User Manual. MacDill AFB, FL: United States Special Operations Command, April 2011.
Pierce, Brian M. and James Zanol. “Maneuver in N-Dimensional Terrain Small Terrain Small.” Small Wars Journal ed. Dave Dilegge (Bethesda, MD: Small Wars Foundation, January 24, 2012) http://smallwarsjournal.com/jrnl/art/maneuver-in-n-dimensional-terrain-mann (accessed June 5, 2018).
Ricks, Thomas E., The Gamble: General Petraeus and the American Adventure in Iraq. New York: Penguin Group, 2009.
Riffe, Daniel, Frederick Fico and Stephen Lacy. Analyzing media messages: Using quantitative content analysis in research. Mahwah, NJ: Erlbaum, 1998.
Rittel, Horst W. J. and Melvin M. Webber, “Dilemmas in a General Theory of Planning.” Policy Sciences 4, no. 2 (June 1973): 158, http://www.thestudiony.com/ed/bfa/Rittel+Webber+Dilemmas.pdf (accessed June 6, 2012)
Sääksjärvi, Markku V.T. and Jari M. Talvinen. “Integration and effectiveness of marketing information systems.” European Journal of Marketing 27, no. 1 (February 1993): 64-80. https://doi.org/10.1108/03090569310024567 (accessed November 23, 2018).
Saaty, Thomas L., “Decision making with the analytic hierarchy process.” International Journal of Service Sciences 1, no. 1 (March 18, 2008): 83-98. http://www.rafikulislam.com/uploads/resourses/197245512559a37aadea6d.pdf (accessed February 28, 2016).
Sandler, Todd, and John Tschirhart, “Club theory: Thirty years later,” Public Choice 93, no 3/4 (1997): 336. https://193.40.33.19/doc/Sepp_Klubiteooria.pdf. (accessed July 2, 2012).
Schlosser, Nicholas J. The Surge 2007-2008. Washington, D.C.: Center of Military History, United States Army, 2017.
Schnaubelt, Christopher M., Eric V. Larson and Matthew E. Boyer, Vulnerability Assessment Method Pocket Guide: A Tool for Center of Gravity Analysis, Washington, DC: RAND Corporation, 2014.
Schroden, Jonathan. “Why Operations Assessments Fail: It's Not Just the Metrics.” Naval War College Review, 64 no 4, (Autumn 2011).
242
Schrodt, Philip A., and David Van Brackle, “Automated Coding of Political Event Data” in Handbook of Computational Approaches to Counterterrorism, ed. V.S. Subrahmanian (Springer Science Business Media, New York 2013) 32.
Schrodt, Philip A. “CAMEO Conflict and Mediation Event Observations Event and Actor Codebook,” Department of Political Science Pennsylvania State University Pond Laboratory University Park, PA. http://eventdata.psu.edu/ (accessed September 11, 2014).
Sejwal, Arvind , Surender Jangra, and Yashwant Singh Sangwan. “A Decision Support System for Industry based upon Multivariate Spatial Outlier Detection Techniques.” Procedia Technology 4 (Amsterdam, Netherlands: Elsevier, February 25 - 26, 2012): 401 – 404. http://isiarticles.com/bundles/Article/pre/pdf/5758.pdf (accessed 3 May 2016).
Shook, E., K. Leetaru, G. Cao, A. Padmanabhan, and S Wang, “Happy or not: Generating topic-based emotional heatmaps for Culturomics using CyberGIS.” IEEE 8th International Conference on Escience (October 8-12, 2012):1–6.
Songchitruksa, Praprut and Xiaosi Zeng, “Getis–Ord Spatial Statistics to Identify Hot Spots by Using Incident Management Data.” Journal of the Transportation Research Board, No. 2165 (December 2010): 42-51.
Steinberg, Steven J. and Steinberg, Sheila L. GIS: Geographic Information Systems for the Social Sciences. Thousand Oaks California: Sage 2006.
Sugumaran, Ramanathan and John DeGroote, Spatial Decision Support Systems: Principles and Practice. Boca Raton, FL: CRC Press, Taylor & Francis Group, 2011.
Treviño-Cantú, Jesus A. “Spatial pattern of poverty. A new procedure to identify the spatial hierarchy of poverty in Mexico, 2010” in Spatial Assessment of Poverty and Affordable Housing. Jesus A. Treviño-Cantú, ed. Monterrey, NL: Universidad Autónoma de Nuevo León. 2014.
Turk, Tarik, Olgun Kitapci and I. Taylan Dortyob, “The Usage of Geographical Information Systems (GIS) in the Marketing Decision Making Process: A Case Study for Determining Supermarket Locations” Procedia - Social and Behavioral Sciences 148 (August 25, 2014): 227 – 235.
U.S. Department of the Army. Civil Affairs Civil Information Management, Army Techniques Publication No. 3-57.50 (Washington, DC: U.S. Department of the Army, 6 September 2013), Glossary-3.
U.S. Department of the Army. Intelligence, Army Doctrine Reference Publication 2-0. (Washington, DC: U.S. Department of the Army, 31 August 2012).
U.S. Department of the Army. Intelligence Preparation of the Battlefield/Battlespace, Field Manual 2-01.3. (Washington, DC: U.S. Department of the Army, 15 October 2009),1-4 through 1-8.

243
U.S. Department of the Army. Joint Mapping the Human Terrain (MAP-HT) Handbook (Aberdeen Proving Ground, MD: United States Army Test and Evaluation Command, May 2010).
U.S. Department of the Army. Knowledge Management, Field Manuel (FM) 6-01.1. (Washington, DC: U.S. Department of the Army, 16 July 2012).
U.S. Joint Chiefs of Staff. Joint Intelligence Preparation of the Operational Environment, Joint Publication 2-01.3 (Washington, DC: U.S. Joint Chiefs of Staff, 16 June 2009), II-16.
U.S. Joint Chiefs of Staff. Joint Operation Planning. Joint Publication 5-0. (Washington, DC: U.S. Joint Chiefs of Staff, August 11, 2011), III-45.
U.S. Joint Chiefs of Staff. Planner's Handbook for Operational Design. Suffolk, VA: Joint Staff J-7, 7 October 2011.http://www.dtic.mil/doctrine/doctrine/jwfc/opdesign_hbk.pdf pages III-1 to III-3. Downloaded 20121210.
von Clausewitz, Carl. On War, Michael Howard and Peter Paret, eds./trans. Princeton, NJ: Princeton University Press, 1976), 140.
Weller, Nicholas and Kenneth McCubbins, ”Raining on the Parade: Some Cautions Regarding the Global Database of Events, Language and Tone Dataset.” February 20, 2014. https://politicalviolenceataglance.org/2014/02/20/raining-on-the-parade-some-cautions-regarding-the-global-database-of-events-language-and-tone-dataset (accessed May 28, 2016).
Wolf, Montrose M. “Social validity: The case for subjective measurement or how applied behavior analysis is finding its heart.” Journal of Applied Behavior Analysis 11, no. 2 (Summer, 1978): 203-214. https://www.ncbi.nlm.nih.gov/pmc/articles/PMC1311293/ (accessed February 21, 2018).
Yonamine, James E., “A nuanced study of political conflict using the global datasets of events location and tone (GDELT) dataset.” PhD diss., The Pennsylvania State University, 2013. http://search.proquest.com/docview/1467737683?accountid=7528. (accessed September 11, 2014).
Zhanga, Chaosheng, Lin Luo, Weilin Xu, and Valerie Ledwith, “Use of Local Moran's I and GIS to identify pollution hotspots of Pb in urban soils of Galway, Ireland” The Science of the Total Environment 398, nos.1-3 (July 15, 2008): 212-221.

244
ENDNOTES
1 George W. Bush, “Management of Interagency Efforts Concerning Reconstruction and Stabilization”, National Security Presidential Directive/ NSPD-44, (Washington DC: The White House, http://www.fas.org/irp/offdocs/nspd/nspd-44.html (accessed 30 August 2012), 1.
2 David Beskow et al., “Data Collection, Fusion, and Visualization for Decision Making in Stability Operations” in Proceedings of the 2014 Industrial and Systems Engineering Research Conference, ed. Y. Guan and H. Liao (Norcross, GA: Institute of Industrial Engineers, 2014), 1. http://www.xcdsystem.com/iie2014/abstract/finalpapers/I455.pdf (accessed August 31, 2014)
3 U.S. Department of the Army, Army Doctrine Reference Publication [ADRP] 3-0, Unified Land Operations, Department of the Army Washington, DC, 16 May 2012. page 1-2.
4 Earnestrheinold R. Lloyd, Stability Operations, Civil Information Management and Spatial Decision Support Systems, USAWC Directed Study Paper, (Carlisle Barracks, PA: U.S. Army War College May 10, 2012),7.
5 U.S. Joint Chiefs of Staff, Joint Operations. Joint Publication 3-0 (Washington, DC: U.S. Joint Chiefs of Staff, 11 August 2011), V-4.
6 U.S. Joint Chiefs of Staff. Stability Operations. Joint Publication 3-07 (Washington, DC: U.S. Joint Chiefs of Staff, 29 September 2011), vii.
7 William Flavin, "Planning for Conflict Termination and Post-Conflict Success," Parameters 32, no. 3 (Autumn 2003): 101, http://www.carlisle.army.mil/usawc/parameters/Articles/03autumn/flavin.pdf. (accessed November 28, 2012).
8 U.S. Department of the Army, Intelligence, Army Doctrine Reference Publication 2-0, (Washington, DC: U.S. Department of the Army, 31 August 2012), 5-1 through 5-2; U.S. Department of the Army, Intelligence Preparation of the Battlefield/Battlespace, Field Manual 2-01.3, (Washington, DC: U.S. Department of the Army, 15 October 2009),1-4 through 1-8.
9 Flavin, 101.
10 Schroden, Jonathan. “Why Operations Assessments Fail: It's Not Just the Metrics.” Naval War College Review, 64 no 4, (Autumn 2011): 89.
11David S. Alberts, John J. Garstka and Frederick P. Stein. Network Centric Warfare: Developing and Leveraging Information Superiority, 2nd ed. revised. (Washington, DC: Office of the Assistant Secretary of Defense (NII), 2002): 127-128, http://www.dodccrp.org/files/Alberts_NCW.pdf. (accessed July 20, 2012).
12 “Defining Knowledge, Information, Data,” July 23, 2018, linked from KM from A-Z: Knowledge Management Tools, https://www.knowledge-management-tools.net/knowledge-information-data.html#ixzz2dIvnBLkk&i (accessed August 31, 2018).
13 Alberts, Garstka and Stein, 128.

245
14 Ibid.
15 Ibid., 129.
16 “The Different Types of Knowledge,” July 23, 2018, linked from KM from A-Z: Knowledge Management Tools, https://www.knowledge-management-tools.net/different-types-of-knowledge.html (accessed August 31, 2018).
17 Bush, “Management of Interagency Efforts Concerning Reconstruction and Stabilization”, 5-6.
18 U.S. Department of the Army, Civil Affairs Civil Information Management, Army Techniques Publication No. 3-57.50 (Washington, DC: U.S. Department of the Army, 6 September 2013), Glossary-3.
19 Ibid., 4-1.
20 Ibid., 5-1.
21 Ibid., 6-1.
22 Ibid., 7-1.
23 Major General Michael T. Flynn, USA, Captain Matt Pottinger, USMC, and Paul D. Batchelor, DIA, Fixing Intel: A Blueprint for Making Intelligence Relevant in Afghanistan, (Washington, DC: Center for a New American Security, January 2010), 9.
24 George J. Hanhauser IV, Comprehensive Civil Information Management: How to Provide it, Strategic Research Paper (Carlisle Barracks, PA: U.S. Army War College March 4, 2012), 7.
25 U.S. Department of the Army, Civil Affairs Operations, Field Manual No. 3-57 (Washington, DC: U.S. Department of the Army, 16 May 2018), 2-4.
26 U.S. Joint Chiefs of Staff. Joint Operations, GL-7.
27 National Guard Bureau. “What is a Common Operational Picture (COP),” Domestic Joint Task Force Commander Training Course Handbook (Arlington VA, National Guard Bureau, 2011), 25-26, https://dde.carlisle.army.mil/documents/courses_13/Readings/2307_JTF%20CmdrHandbook.pdf (accessed July 20, 2012).
28 Ibid.
29 Alberts, Garstka and Stein, 123.
30 U.S. Joint Chiefs of Staff. Joint Intelligence Preparation of the Operational Environment, Joint Publication 2-01.3 (Washington, DC: U.S. Joint Chiefs of Staff, 16 June 2009), II-16.
31Joint Forces Staff College, Joint Advanced Warfighting School Operational Art and Campaigning Primer AY 09-10, (Norfolk, VA: Joint Forces Staff College - National Defense University, July 2009), 236.

246
32 Ibid.
33 Ibid., 237.
34 David L. Buffaloe, “Defining Asymmetric Warfare”, The Institute of Land Warfare, no. 58 (September 2006), 16.
35 National Guard Bureau, 25-26.
36 Alberts, Garstka and Stein, 123.
37 U.S. Joint Chiefs of Staff, Joint Operations, II-9.
38 Schroden, 89.
39 U.S. Joint Chiefs of Staff, Joint Operation Planning. Joint Publication 5-0. (Washington, DC: U.S. Joint Chiefs of Staff, August 11, 2011), III-45.
40 Ibid.
41 Ibid.
42 Ibid.
43 Ibid.
44 Schroden, 92.
45 Ibid.
46 Ibid.
47 Ibid., 95.
48 Thomas Owens Jacobs, “Strategic Environment,” In Strategic Leadership: The Competitive Edge (Fort Lesley J. McNair, DC: Industrial College of the Armed Forces, National Defense University, 2002) 170-188..
49 Ibid.,172.
50 U.S. Joint Chiefs of Staff, Stability Operations, I-2.
51 Lloyd, 7.
52 Horst W. J. Rittel and Melvin M. Webber, “Dilemmas in a General Theory of Planning.” Policy Sciences 4, no. 2 (June 1973): 158, http://www.thestudiony.com/ed/bfa/Rittel+Webber+Dilemmas.pdf (accessed June 6, 2012).
53 Ibid., 160.
54 Ibid., 160-167.

247
55 Adam Elkus, “Complexity, Design, and Modern Operational Art: U.S. Evolution or False
Start?”, Canadian Army Journal 13, no. 3 (Autumn 2010): 59. http://www.army.forces.gc.ca/caj/documents/vol_13/iss_3/caj_vol13.3_07_e.pdf. (accessed December 10, 2012).
56 Rittel and Webber, 167-168.
57 Ibid., 168.
58 Patrick McNutt, "Public Goods and Club Goods," In Encyclopedia of Law and Economics (Northampton, MA: Edward Elgar Publishing 1999), 928, http://encyclo.findlaw.com/0750book.pdf, (accessed May 25, 2012).
59 McNutt, 928-929.
60 Campbell McConnell, Stanley Brue, and Sean Flynn, “Chapter 16, Public Goods,
Externalities, and Information Asymmetries,” in Economics 18th ed (Columbus, OH: McGraw-
Hill Economics), 349. http://highered.mcgraw-
hill.com/sites/dl/free/0073375691/627557/Chapter16.pdf (accessed May 21, 2012).
61 George A. Akerlof, “The Market for ‘Lemons’: Quality Uncertainty and the Market Mechanism,” The Quarterly Journal of Economics 84, no. 3. (August 1970), 488, http://links.jstor.org/sici?sici=0033-5533%28197008%2984%3A3%3C488%3ATMF%22QU%3E2.0.CO%3B2-6 (accessed May 21, 2012).
62 McConnell, Brue, and Flynn, 350.
63 Todd Sandler and John Tschirhart, “Club theory: Thirty years later,” Public Choice 93, no 3/4 (1997): 336, https://193.40.33.19/doc/Sepp_Klubiteooria.pdf. (accessed July 2, 2012).
64 Charles Lindblom and Edward J. Woodhouse, The Policy-Making Process, 3rd (Upper Saddle River, New Jersey: Prentice Hall, 1993), 114-124.
65 Sandler and Tschirhart, 348.
66 Richard Klosterman, “Arguments For and Against Planning,” The Town Planning Review 56, no. 1 (January 1985), 9-8.
67 Ibid., 10-11.
68 JP 3-07 Stability Operations, vii.
69 Derick W. Brinkerhoff, Ronald W. Johnson, and Richard Hill, Guide to Rebuilding Public Sector Services in Stability Operations: A Role for the Military (Carlisle, PA: Strategic Studies Institute, U.S. Army War College, October 2009), 1. http://www.strategicstudiesinstitute.army.mil/pdffiles/PUB945.pdf (accessed July 2, 2012).
70 Brinkerhoff, Johnson, and Hill, 14.
248
71 Carl von Clausewitz, On War, Michael Howard and Peter Paret, eds./trans., (Princeton,
NJ: Princeton University Press, 1976), 140.
72 Steven Lukes, “Introduction,” Power: A Radical View (New York: Palgrave Macmillan, 2005), 20-21.
73 T.C. Greenwood and T. X. Hammes, “War Planning for Wicked Problems,” Armed Forces Journal (December 2009/January 2010): 18-23, 36-37. http://www.armedforcesjournal.com/2009/12/4252237/ (accessed December 26, 2012).
74 Rittel and Webber, 160.
75 Mark R. Leipnik, Karen K. Kemp, and Hugo A. Loaiciga, “Implementation of GIS for water resources planning and management,” Journal of Water Resources Planning and Management 119, no. 2, (March 1993):184.
76 Jacek Malczewski, GIS and Multicriteria Decision Analysis (New York: John Wiley and Sons, Inc., 1999), 281.
77 Ramanathan Sugumaran and John DeGroote, Spatial Decision Support Systems: Principles and Practice (Boca Raton, FL: CRC Press, Taylor & Francis Group, 2011),14.
78 Ibid., 397.
79 John W. Creswell, Research Design: Qualitative, Quantitative, and Mixed Methods Approaches, 3ed. (Thousand Oaks California: Sage 2009), 227.
80 Ibid., 211.
81 Chia-Chien Hsu and Brian A. Sandford, “The Delphi Technique: Making Sense of Consensus,” Practical Assessment, Research and Evaluation 12, no. 10 (August 2007): 1.
82 Sugumaran and DeGroote, 68.
83 U.S. Department of the Army, Army Doctrine Reference Publication [ADRP] 3-0, Unified Land Operations, Department of the Army Washington, DC, 16 May 2012. 1-2.
84 Brian M. Ducote, Challenging the Application of PMESII-PT in a Complex Environment (Fort Leavenworth, Kansas: School of Advanced Military Studies United States Army Command and General Staff College April 26, 2010), 6-7.
85 Sugumaran and DeGroote, 68.
86 Steven J. Steinberg and Sheila L. Steinberg, GIS: Geographic Information Systems for the Social Sciences (Thousand Oaks California: Sage 2006), 7.
87 Ibid., 22.
88 Sugumaran and DeGroote, 74.
89 Ibid.

249
90 Paul Bolstad, GIS Fundamentals: A First Text on Geographic Information Systems, 3rd
ed. (White Bear Lake, MN: Eider Press, 2008), 369-370. [also Steinberg and Steinberg, 24]
91 Steinberg and Steinberg, 22.
92 Sugumaran and DeGroote, 89.
93 Sugumaran and DeGroote, 166
94 Ibid., 146.
95 ESRI website http://support.esri.com/en/knowledgebase/GISDictionary/term/spatial%20analysis
96 David O’Sullivan and David J. Unwin, Geographic Information Analysis, 2nd ed. (Hoboken, NJ: John Wiley and Sons, Inc., 2010), 316-319.
97 Ibid.
98 Ian McHarg, Design With Nature, (New York: John Wiley and Sons, 1992), 103-115.
99 James E. Burt, Gerald M. Barber, and David L. Rigby, Elementary Statistics for Geographers, 3rd ed. (New York: Guilford Press, 2009), 64.
100 Ibid. 544.
101 Jesus A. Treviño-Cantú, “Spatial pattern of poverty. A new procedure to identify the spatial hierarchy of poverty in Mexico, 2010” in Spatial Assessment of Poverty and Affordable Housing Jesus A. Treviño-Cantú, ed. (Monterrey, NL: Universidad Autónoma de Nuevo León. 2014), 17.
102 Burt, 544.
103 Ibid., 555-556.
104 Jesus A. Treviño-Cantú, “Spatial Statistics/Spatial Autocorrelation” class notes, UT-Arlington, Fall 2014.
105 Luc Anselin, “The Moran scatterplot as an ESDA tool to assess local instability in spatial association,” in Spatial Analytical Perspectives on GIS, eds. Manfred Fischer, Henk J. Scholten, and David Unwin, (London: Taylor & Francis, 1996), 115-117.
106 Treviño-Cantú, “Spatial pattern of poverty.”, 20. (Diagram from Zhang C, Luo L, Xu W, Ledwith V (2008) Use of local Moran’s I and GIS to identify pollution hotspots of Pb in urban soils of Galway, Ireland. Sci Total Environ 398 (1-3):212-221)
107 Treviño-Cantú, “Spatial pattern of poverty.” , 19.
108 Sugumaran and DeGroote,149.
109 Steinberg and Steinberg, 24; Bolstad, 380.

250
110 Alessio Ishizaka and Philippe Nemery, Multi-Criteria Decision Analysis: Methods and
Software, (West Sussex, UK: John Wiley and Sons, 2013), 5-8.
111 Jyri Mustajoki and Mika Marttunen, “Comparison of Multi-Criteria Decision Analytical Software: Searching for ideas for developing a new EIA-specific multi-criteria software,” (Helsinki: Finnish Environment Institute, 2013), 3, http://imperia.jyu.fi/tuotokset/Annex7.5.13ComparisonofMultiCriteriaDecisionAnalyticalSoftware.pdf (accessed December 30, 2014).
112 Ishizaka and Nemery, 5-8.
113 Ibid.
114 Ibid.
115 Konstantin Krivoruchko and Carol A. Gotway-Crawford “Assessing the Uncertainty Resulting from Geoprocessing Operations,” in GIS, Spatial Analysis, and Modeling, ed. David J. Maguire, Michael Batty, and Michael F. Goodchild, Redlands: ESRI Press, 2005), 82-83.
116 Sugumaran and DeGroote, 158-159.
117 Ibid., 175-176.
118 Ibid., 176-178.
119 Treviño-Cantú, “Spatial pattern of poverty.”, 5.
120 Ibid., 15.
121 Ibid., 18.
122 Alan Agresti and Barbara Finlay, Statistical Methods for the Social Sciences, 3rd ed. (Upper Saddle River, NJ: Prentince Hall, Inc., 1999), 186.
123 Treviño-Cantú, “Spatial pattern of poverty.”, 14.
124 O’Sullivan and Unwin, 36-38.
125 Khalid Eldrandaly et al., “Integrating GIS and MCDM Using COM Technology,” The International Arab Journal of Information Technology 2, no. 2 (April 2005): 162-163.
126 Malczewski, 218.
127 Nicholas J. Schlosser, The Surge 2007-2008 (Washington, D.C.: Center of Military History, United States Army, 2017), 7.
128 Ibid.
129 George W. Bush. "President's Address to the Nation" (speech, Washington, DC, January 10, 2007), Office of the Press Secretary. https://georgewbush-whitehouse.archives.gov/news/releases/2007/01/20070110-7.html (accessed 30 August 2012).
251
130 Schlosser, 17-20.
131 Schlosser, Ibid.
132 Schlosser, Ibid
133 Schlosser, Ibid
134 Schlosser, Ibid.
135 Schlosser, 21.
136 BBC, “Interesting Map of Iraq,” BBC News Web site, https://www.democraticunderground.com/discuss/duboard.php?az=show_mesg&forum=132&topic_id=2569014&mesg_id=2569014 (accessed July 23, 2018).
137 Schlosser, 11.
138 Thomas E. Ricks, The Gamble: General Petraeus and the American Adventure in Iraq (New York: Penguin Group, 2009), 161.
139 Schlosser, 24.
140 Ricks, 162.
141 Schlosser, 30-38.
142 Ricks, 294.
143 Ricks, 296-297.
144 Ricks, 297.
145 Berelson Bernand, Content Analysis in Communication Research, (New York: Free Press 1952), 18.
146 Ole R. Holsti, Content Analysis for the Social Sciences and Humanities, (Reading, MA: Addison-Wesley 1969), 14.
147 Kimbely A. Neuendof, The Content Analysis Guidebook, (Thousand Oaks California: Sage 2002), 10.
148 Vincent J. Duriau, Rhonda K. Reger and Michael D. Pfarrer, “A Content Analysis of the Content Analysis Literature in Organization Studies: Research Themes, Data Sources, and Methodological Refinements,”. Organization Research Methods 10, no. 1 (January 2007): 5–23. https://media.terry.uga.edu/socrates/publications/2011/07/A20Content20Analysis20of20the20Content20Analysis20Literature2028ORM20200729_1.pdf (accessed February 28, 2018).
149 Alan Bryman. Social Research Methods 4th ed.(New York: Oxford University Press 2012), 289.
150 Ibid., 289-290.
252
151 Alexander Bird, Philosophy of Science. (Montreal: McGill Queen’s University Press
1988), 170. Bird suggest that there is a spectrum of methods, rules of thumb, general methodological principles, and heuristic precepts all of which play some role in generating scientific knowledge.
152 Peter Berger and Thomas Luckman, The Social Construction of Reality: A Treaties in the Sociology of Knowledge. (New York: Anchor Press 1966), 1-18.
153 Earl Babbie. Observing Ourselves: Essays in Social Research. (Belmont, CA: Wadsworth 1986), 27.
154 Neuendof, 11-12.
155 Krippendroff, 127.
156 Carmines, Edward and Zeller Richard, Reliability and Validity Assessment. Beverly Hills, CA: Sage 1979 page 11. (also Neuendorf 112)
157 Neuendorf, 141
158 Krippendroff, 271.
159 Neuendorf, 142
160 Leetaru, 2.
161 Leetaru, 3.
162 Bryman, 290.
163 Neuendorf, 23.
164 Neuendorf, 23.
165 Bryman, 290.
166 Carmines and Zeller, 11. (also Neuendorf 112).
167 Krippendroff, 334.
168 Bryman, 171.
169 Krippendroff, 330.
170 Daniel Riffe, Frederick Fico, and Stephen Lacy, Analyzing media messages: Using quantitative content analysis in research. (Mahwah, NJ: Erlbaum, 1998), 137.
171 Craig H. Kennedy, “Trends in the Measurement of Social Validity,” The Behavior Analyst 15, No. 2 (Fall 1992), 147-156.
172 Wolf, Montrose M., “Social validity: The case for subjective measurement or how applied behavior analysis is finding its heart,” Journal of Applied Behavior Analysis 11, no. 2
253
(Summer, 1978): 207. https://www.ncbi.nlm.nih.gov/pmc/articles/PMC1311293/ (accessed February 21, 2018).
173 Krippendroff, 331.
174 Ibid.
175 Neuendorf, 117.
176 Bryman, 171.
177 Ibid., 171-172.
178 Ibid., 711.
179 John Gaber and Sharon Gaber, Qualitative Analysis for Planning and Policy, Beyond the Numbers (Chicago, IL: Planners Press, American Planning Association, 2007), 121.
180 Martyn Hammersley, What’s Wrong with Ethnography?, (London: Routledge, 1992), 91.
181 Gaber and Gaber, 13.
182 Krippendroff, 82.
183 Krippendroff, 85; 170.
184 Beskow, 6.
185 Philip A. Schrodt, “CAMEO Conflict and Mediation Event Observations Event and Actor Codebook,” Department of Political Science Pennsylvania State University Pond Laboratory University Park, PA. 1-2. http://eventdata.psu.edu/ (accessed September 11, 2014).
186 Philip A. Schrodt and David Van Brackle, “Automated Coding of Political Event Data” in Handbook of Computational Approaches to Counterterrorism, ed. V.S. Subrahmanian (Springer Science Business Media, New York 2013) 32.
187 Ibid., 33-34.
188 Ibid., 34.
189 Kalev Leetaru and Philip A. Schrodt, “GDELT: Global Data on Events, Location and Tone, 1979-2012. Version 1.0,” March 29, 2013, 45. http://data.gdeltproject.org/documentation/ISA.2013.GDELT.pdf (accessed August 31, 2014).
190 Ibid., 46.
191 E. Shook, K. Leetaru, G. Cao, A. Padmanabhan, and S Wang, “Happy or not: Generating topic-based emotional heatmaps for Culturomics using CyberGIS,” IEEE 8th International Conference on Escience (October 8-12, 2012):3.
192 Ibid.
254
193 U.S. Department of the Army, ADRP 3-0,1-2.
194 R. Hillson, "The DIME/PMESII Model Suite Requirements Project", The Naval Research Laboratory Review 2009, Washington DC: The Naval Research Laboratory) 235.
195 Nicholas Weller and Kenneth McCubbins, ”Raining on the Parade: Some Cautions Regarding the Global Database of Events, Language and Tone Dataset,” February 20, 2014. https://politicalviolenceataglance.org/2014/02/20/raining-on-the-parade-some-cautions-regarding-the-global-database-of-events-language-and-tone-dataset (accessed May 28, 2016).
196 Will H. Moore, “Two Rubes Walk into a Bar, Order Event Data (Part 2),” March 2, 2014. https://willopines.wordpress.com/2014/03/02/two-rubes-walk-into-a-bar-order-event-data-part-2/ (accessed May 28, 2016).
197 Rebecca H. Best, Christine Carpino, and Mark J.C. Crescenzi, "An analysis of the TABARI coding system, " Conflict management and peace science 30, no. 4, (September 1, 2013): 335.
198 James E. Yonamine, “A nuanced study of political conflict using the global datasets of events location and tone (GDELT) dataset,” (PhD diss., The Pennsylvania State University, 2013) 19. http://search.proquest.com/docview/1467737683?accountid=7528. (accessed September 11, 2014).
199 Sugumaran and DeGroote, 388-389.
200 Ibid., 395.
201 Insung Lee, “Development of procedural expertise to support multiattribute spatial decision making,” (PhD diss., University of Illinois at Urbana-Champaign,1994), 10.
202 McHarg, 31.
203 Anjomani, Ardeshir with Ali Saberi and Naveed Shad, 2005. “SDSS for Land Use and Environmental Planning: An Application Example,” GIS Planet (pp. S23). Spatial Decision Support Systems Conference Proceeding.
204 Ibid.
205 Ibid.
206 Valentina Ferretti and Gilberto Montibeller, “Key challenges and meta-choices in designing and applying multi-criteria spatial decision support systems,” Decision Support Systems (January 17, 2016):3-4. http://dx.doi.org/10.1016/j.dss.2016.01.005 (accessed February 27, 2018).
207 Willy Hoppe de Sousa and Abraham Sin Oih Yu, “Decision Making Planning: The Meta-decision Approach,” Engineering Management Research 3, No. 1 (March 19, 2014). http://dx.doi.org/10.5539/emr.v3n1p41 (accessed March 20, 2016).
208 Ferretti and Montibeller, 4.

255
209 João Coutinho-Rodrigues, Ana Simão and Carlos Henggeler Antunes, “A GIS-based
multicriteria spatial decision support system for planning urban infrastructures,” Decision Support Systems 51 (February 3, 2011): 720. https://www.sciencedirect.com/science/article/pii/S0167923611000698 (accessed March 5, 2016).
210 Sugumaran and DeGroote, 419; 422-424.
211 FN de Silva and R.W. Eglese, “Integrating simulation modelling and GIS: spatial decision support systems for evacuation planning,” Journal of the Operational Research Society 51, no.4 (April, 2000): 423. https://link.springer.com/content/pdf/10.1057%2Fpalgrave.jors.2600879.pdf (accessed March 20, 2016).
212 Álvaro Lorca, Melih Çelik, Özlem Ergun, and Pinar Keskinocak, “A decision-support tool for post-disaster debris operations,” Humanitarian Technology: Science, Systems and Global Impact 2015, HumTech2015 in Procedia Engineering 107 (2015): 159. https://www.sciencedirect.com/science/article/pii/S187770581501022X/pdf?md5=a42e12ba39e0f8b887807110c07afa9f&pid=1-s2.0-S187770581501022X-main.pdf (accessed March 10, 2016).
213 Tarik Turk, Olgun Kitapci, and I. Taylan Dortyob, “The Usage of Geographical Information Systems (GIS) in the Marketing Decision Making Process: A Case Study for Determining Supermarket Locations,” Procedia - Social and Behavioral Sciences 148, (August 24, 2014): 229– 231.
214 Markku V.T. Sääksjärvi and Jari M. Talvinen, “Integration and effectiveness of marketing information systems,” European Journal of Marketing 27, no. 1 (February 1993): 64. https://doi.org/10.1108/03090569310024567 (accessed November 23, 2018).
215 Turk, Kitapci, and Dortyob, 228.
216 Ibid, 229.
217 Ibid.
218 Ibid.
219 Peter R. Falk, ARIES: an architectural implementation of a multi-criterion Spatial Decision Support System (SDSS) (Monterey, CA : Naval Postgraduate School, September 1997), 2.
220 Ibid., 14-20.
221 Ishizaka and Nemery, 81.
222 Arvind Sejwal , Surender Jangra, and Yashwant Singh Sangwan, “A Decision Support System for Industry based upon Multivariate Spatial Outlier Detection Techniques,” Procedia Technology 4 (Amsterdam, Netherlands: Elsevier, February 25 - 26, 2012): 403. http://isiarticles.com/bundles/Article/pre/pdf/5758.pdf (accessed 3 May 2016).
223 Ibid.

256
224 Prasanta Chandra "On the generalised distance in statistics" in Proceedings of the
National Institute of Sciences of India 2, no. 1 (1936): 49–55, http://www.new.dli.ernet.in/rawdataupload/upload/insa/INSA_1/20006193_49.pdf (accessed March 5, 2013).
225 Sejwal , Jangra, and Sangwan, 405.
226 Foster, S. Thomas. Managing Quality: Integrating the Supply Chain (3rd Edition). Upper Saddle, New Jersey: Pearson, Prentice Hall, 2007, p. 164.
227 Peter F. Drucker, “The Coming of the New Organization” Harvard Business Review on Knowledge Management (Cambridge: Harvard Business School Press, January 1998), 1-19.
228 U.S. Department of the Army, Army Doctrine Reference Publication (ADRP) 6-0, C1 - Mission Command, (Washington, DC: U.S. Department of the Army, 10 September 2012), 3-5.
229 U.S. Department of the Army, ATP 6-01.1 Techniques for Effective Knowledge Management, (Washington, DC: U.S. Department of the Army, 6 March 2015), 1-6.
230 U.S. Department of the Army, Field Manuel (FM) 6-01.1 Knowledge Management, (Washington, DC: U.S. Department of the Army, 16 July 2012), 1-1.
231 U.S. Department of the Army, Army Doctrine Reference Publication (ADRP) 6-0, C1 - Mission Command, (Washington, DC: U.S. Department of the Army, 10 September 2012), 3-5.
232 Martin J. Lindenmayer, “Civil Information and Intelligence Fusion: Making ‘Non-Traditional’ into ‘New Traditional’ for the JTF Commander”. Small Wars Journal. (June 2011) under “Journal,” http://smallwarsjournal.com/blog/journal/docs-temp/794-lindenmayer.pdf&sa=U&ei=og56Ts-7BJGCsgKPgOnQAw&ved=0CBUQFjAB&usg=AFQjCNGRu1aCqcEXtv0Zftexl-eRZ0BnHQ (accessed September 21, 2011).
233 Ibid.
234 Ibid.
235 Ibid., 2
236 Ibid.
237 José M. Madera, Civil Information Management in Support of Counterinsurgency Operations: A Case for the Use of Geospatial Information Systems in Colombia, Monograph (Fort Leavenworth, KS: School of Advanced Military Studies United States Army Command and General Staff College, May 25, 2005), 1.
238 LTC Mark McQueen, MAJ Dean Ratty, MAJ Greg Vialle, and CPT Michael Sullivan, “Civil Knowledge Management Systems (CKMS) GIS Integration Memo e-mail, Baghdad, Iraq, June 25, 2004.
239 Madera, 2.
257
240 U.S. Joint Chiefs of Staff, Planner's Handbook for Operational Design (Suffolk, VA: Joint
Staff J-7, October 7, 2011). http://www.dtic.mil/doctrine/doctrine/jwfc/opdesign_hbk.pdf pages III-1 to III-3. (accessed October 10, 2012).
241 Elkus, 59.
242 Madera, 62.
243 Ibid., 6.
244 Ibid., 6-7.
245 Montgomery McFate and Andrea Jackson "An Organizational Solution for DODs Cultural Knowledge Needs" in Military Review 85, no.4 (July–August 2005): 18.
246 Ibid., 20.
247 Ben Connable, “All Our Eggs in a Broken Basket: How the Human Terrain System is Undermining Sustained Cultural Competence,” in Military Review 89, no. 2 (March-April 2009): 60-62.
248 Ben Connable, “Human Terrain System is Dead, Long Live … What?: Building and Sustaining Military Cultural Competence in the Aftermath of the Human Terrain System” in Military Review x98, no.1 (January-February 2018), 25-30.
249 Mike Pheanis and COL Donald Jackson,” Joint Civil Information Management-Joint Test” briefing slide 5, MacDill AFB, FL: United States Special Operations Command.
250 Mike Pheanis and COL Donald Jackson, Joint Civil Information Management User Manual (MacDill AFB, FL: United States Special Operations Command, April 2011), 6-1.
251 U.S. Department of the Army. Joint Mapping the Human Terrain (MAP-HT) Handbook (Aberdeen Proving Ground, MD: United States Army Test and Evaluation Command, May 2010),1-1.
252 Ibid., 1-1 to 1-2.
253 Ibid., 4-7.
254 Ibid., 4-8 to 4-10.
255 Ibid., 4-10 to 4-11.
256 Ibid., 4-11 to 4-12.
257 Hanhauser IV, ABSTRACT.
258 Ibid., 19.
259 Ibid., 17.
260 Ibid., 18.

258
261 Beskow et al., 2.
262 Ibid., 4.
263 Brian M. Pierce and James Zanol, “Maneuver in N-Dimensional Terrain Small Terrain Small,” Small Wars Journal ed. Dave Dilegge (Bethesda, MD: Small Wars Foundation, January 24, 2012) http://smallwarsjournal.com/jrnl/art/maneuver-in-n-dimensional-terrain-mann (accessed June 5, 2018).
264 Ibid.
265 U.S. Department of the Army, Civil Affairs Civil Information Management, Army Techniques Publication 3-57.50, 5-1.
266 Ibid.
267 Ibid.
268 Ibid.
269 Marco A. Bongioanni, “Remote Civil Information Management: A Concept For How U.S. Army Reserve Civil Affairs Subject Matter Experts Can Bring Relevant Civilian Skill Set Support to Combatant Commanders”2014 - 2015 Civil Affairs Issue Papers: The Future of Civil Affairs, ed. Christopher Holshek John C. Church, Jr. (Carlisle Barracks, PA: United States Army War College Press, February 18, 2015): 73.
270 U.S. Department of the Army, The Operations Process, Army Doctrine Reference Publication No. 5-0 (Washington, DC: U.S. Department of the Army, 17 May 2012), 1-7.
271 Ibid.
272 Ibid., 46.
273 Agresti and Finlay, 186.
274 Laura Chuhara and Tim Hestering, Mathematical Statistics with Resampling and R (Hoboken, NJ: John Wiley & Sons 2011), 100.
275 “Using Bootstrapping to Obtain Confidence Intervals for Medians”, SPSS 22 Tutorial. http://127.0.0.1:49187/help/topic/com.ibm.spss.statistics.cs/spss/tutorials/bootstrap_employee01_intro.htm (accessed October 10, 2014)
276 James E. Burt, Gerald M. Barber, and David L. Rigby, Elementary Statistics for Geographers, 3rd ed. (New York: Guilford Press, 2009), 544.
277 Treviño-Cantú, “Spatial pattern of poverty.”, 17.
278 Burt, 544.
279 Ibid., 555-556.
259
280 Treviño-Cantú, “Spatial Statistics/Spatial Autocorrelation” class notes, UT-Arlington, Fall
2014.
281 Luc Anselin, L., “The Moran scatterplot as an ESDA tool to assess local instability in spatial association,” in Spatial Analytical Perspectives on GIS, eds. Manfred Fischer, Henk J. Scholten, and David Unwin, (London: Taylor & Francis, 1996), 115-117.
282 Treviño-Cantú, “Spatial pattern of poverty.”, 20. (Diagram from Zhang C, Luo L, Xu W, Ledwith V (2008) Use of local Moran’s I and GIS to identify pollution hotspots of Pb in urban soils of Galway, Ireland. Sci Total Environ 398)
283 Chaosheng Zhanga, Lin Luo, Weilin Xu, and Valerie Ledwith, “Use of Local Moran's I and GIS to identify pollution hotspots of Pb in urban soils of Galway, Ireland” The Science of the Total Environment 398, nos.1-3 (July 15, 2008) p. 212.
284 Treviño-Cantú, “Spatial pattern of poverty.”, 18-19.
285 Luc Anselin, GeoDa™ 0.9 User's Guide (Urbana, IL: Center for Spatially Integrated Social Science, 2003), 84-85.
286 Treviño-Cantú, “Spatial pattern of poverty,” 19.
287 NOTE: While the calculations were done using GeoDa 1.4.3, the resulting shapefiles were exported to ArcMAP 10.1 and modified for clarity. This process is repeated in the subsequent LISA maps.
288 Treviño-Cantú, “Spatial pattern of poverty.”, 3.
289 Ibid., 25.
290 Ibid., 22.
291 Ibid., 23-24
292 Ibid., 24.
293 Ibid., 44. (Treviño-Cantú’s wording used for analysis of magnitude and intensity of Mexican poverty is modified for this study).
294 Ibid.
295 Thomas L. Saaty, “Decision making with the analytic hierarchy process,” International Journal of Service Sciences 1, no. 1 (March 18, 2008): 84. http://www.rafikulislam.com/uploads/resourses/197245512559a37aadea6d.pdf (accessed February 28, 2016).
296 Mustajoki and Marttunen,3.
297 Ibid.
298 Ishizaka and Nemery, 18

260
299 Ernest H. Forman, “Random Indices for Incomplete Pairwise Comparison Matrices,”
European Journal of Operational Research 48, no 1 (September 5,1990): 153-155.
300 TRADOC Regulation 71-20, page 1.
301 Usama Fayyad, Gregory Piatetsky-Shapiro and Padhraic Smyth, "From Data Mining to Knowledge Discovery in Databases" AI Magazine, Fall 1996, 39. http://www.kdnuggets.com/gpspubs/aimag-kdd-overview-1996-Fayyad.pdf (accessed August 2, 2018).
302 Jiawei Han, Micheline Kamber and Jian Pei, Data mining: concepts and techniques 3ed. (Waltham, MA: Morgan Kaufmann Publishers 2012), 6-7.
303 Warrant Officer Prerequisites and Duty Description, http://www.usarec.army.mil/hq/warrant/prerequ/WO125D.shtml (accessed August 2, 2018).
304 Christopher M. Schnaubelt, Eric V. Larson and Matthew E. Boyer, Vulnerability Assessment Method Pocket Guide: A Tool for Center of Gravity Analysis (Washington, DC: RAND Corporation, 2014)107.
305 Nicholas Armstrong and Jacqueline Chura-Beaver Harnessing Post Conflict Transitions (Carlisle Barracks, PA: PKSOI Paper, Strategic Studies Institute), 51 and 55.
306 Ibid., 50.
307 Ibid., 54-55.
308 Praprut Songchitruksa and Xiaosi Zeng, “Getis–Ord Spatial Statistics to Identify Hot Spots by Using Incident Management Data,” Journal of the Transportation Research Board, No. 2165 (December 2010): 42.
309 Ishizaka and Nemery, 6.