Spatial characterization of interictal high frequency oscillations in
13
BRAIN A JOURNAL OF NEUROLOGY Spatial characterization of interictal high frequency oscillations in epileptic neocortex Catherine A. Schevon, 1 A. J. Trevelyan, 2 C. E. Schroeder, 3 R. R. Goodman, 4 G. McKhann Jr 4 and R. G. Emerson 1,5 1 Department of Neurology, Columbia University, New York, NY, USA 2 School of Neurology, Neurobiology and Psychiatry, University of Newcastle, Newcastle Upon Tyne, UK 3 Department of Psychiatry, Columbia University, New York, NY, USA 4 Department of Neurological Surgery, Columbia University, New York, NY, USA 5 Department of Pediatrics, Columbia University, New York, NY, USA Correspondence to: Catherine A. Schevon, Neurological Institute, 710 West, 168th Street, NY 10032, USA E-mail: [email protected] Interictal high frequency oscillations (HFOs), in particular those with frequency components in excess of 200 Hz, have been proposed as important biomarkers of epileptic cortex as well as the genesis of seizures. We investigated the spatial extent, classification and distribution of HFOs using a dense 4 4 mm 2 two dimensional microelectrode array implanted in the neocortex of four patients undergoing epilepsy surgery. The majority (97%) of oscillations detected included fast ripples and were concentrated in relatively few recording sites. While most HFOs were limited to single channels, 10% occurred on a larger spatial scale with simultaneous but morphologically distinct detections in multiple channels. Eighty per cent of these large-scale events were associated with interictal epileptiform discharges. We propose that large-scale HFOs, rather than the more frequent highly focal events, are the substrates of the HFOs detected by clinical depth electrodes. This feature was prominent in three patients but rarely seen in only one patient recorded outside epileptogenic cortex. Additionally, we found that HFOs were commonly associated with widespread interictal epileptiform discharges but not with locally generated ‘micro- discharges’. Our observations raise the possibility that, rather than being initiators of epileptiform activity, fast ripples may be markers of a secondary local response. Keywords: multichannel extracellular recording; epilepsy; intracranial EEG; interictal epileptiform activity; fast ripples; high frequency oscillations Abbreviations: HFOE = high frequency oscillation event; HFOs = high frequency oscillations; iEEG = intracranial electroencephalography; MEA = microelectrode array; MUA = multiunit activity; NREM = non-rapid eye movement; mEEG = Electroencephalography derived from microelectrode recording Introduction High frequency oscillations (HFOs), or brief events in the high gamma band ( 4 80 Hz), have been proposed as useful biomarkers of epileptic pathology. It has been suggested that fast ripples, or population bursts oscillating at rates 4 200 Hz, may be largely restricted to the epileptogenic zone in temporal lobe epilepsy (Bragin et al., 1999; Staba et al., 2002; Jirsch et al., 2006; Urrestarazu et al., 2007; Worrell et al., 2008) and in neocortical epilepsy syndromes (Jacobs et al., 2008). Studies in rodent doi:10.1093/brain/awp222 Brain 2009: 132; 3047–3059 | 3047 Received May 4, 2009. Revised June 12, 2009. Accepted July 11, 2009. Advance Access publication September 10, 2009 ß The Author(s) 2009. Published by Oxford University Press on behalf of Brain. This is an Open Access article distributed under the terms of the Creative Commons Attribution Non-Commercial License (http://creativecommons.org/licenses/by-nc/ 2.5/uk/) which permits unrestricted non-commercial use, distribution, and reproduction in any medium, provided the original work is properly cited. Downloaded from https://academic.oup.com/brain/article/132/11/3047/326739 by guest on 31 January 2022
Transcript of Spatial characterization of interictal high frequency oscillations in

BRAINA JOURNAL OF NEUROLOGY
Spatial characterization of interictal high frequencyoscillations in epileptic neocortexCatherine A. Schevon,1 A. J. Trevelyan,2 C. E. Schroeder,3 R. R. Goodman,4 G. McKhann Jr4 andR. G. Emerson1,5
1 Department of Neurology, Columbia University, New York, NY, USA
2 School of Neurology, Neurobiology and Psychiatry, University of Newcastle, Newcastle Upon Tyne, UK
3 Department of Psychiatry, Columbia University, New York, NY, USA
4 Department of Neurological Surgery, Columbia University, New York, NY, USA
5 Department of Pediatrics, Columbia University, New York, NY, USA
Correspondence to: Catherine A. Schevon,
Neurological Institute,
710 West, 168th Street,
NY 10032,
USA
E-mail: [email protected]
Interictal high frequency oscillations (HFOs), in particular those with frequency components in excess of 200 Hz, have been
proposed as important biomarkers of epileptic cortex as well as the genesis of seizures. We investigated the spatial extent,
classification and distribution of HFOs using a dense 4� 4 mm2 two dimensional microelectrode array implanted in the
neocortex of four patients undergoing epilepsy surgery. The majority (97%) of oscillations detected included fast ripples and
were concentrated in relatively few recording sites. While most HFOs were limited to single channels, �10% occurred on a
larger spatial scale with simultaneous but morphologically distinct detections in multiple channels. Eighty per cent of these
large-scale events were associated with interictal epileptiform discharges. We propose that large-scale HFOs, rather than the
more frequent highly focal events, are the substrates of the HFOs detected by clinical depth electrodes. This feature was
prominent in three patients but rarely seen in only one patient recorded outside epileptogenic cortex. Additionally, we found
that HFOs were commonly associated with widespread interictal epileptiform discharges but not with locally generated ‘micro-
discharges’. Our observations raise the possibility that, rather than being initiators of epileptiform activity, fast ripples may be
markers of a secondary local response.
Keywords: multichannel extracellular recording; epilepsy; intracranial EEG; interictal epileptiform activity; fast ripples; highfrequency oscillations
Abbreviations: HFOE = high frequency oscillation event; HFOs = high frequency oscillations; iEEG = intracranialelectroencephalography; MEA = microelectrode array; MUA = multiunit activity; NREM = non-rapid eye movement;mEEG = Electroencephalography derived from microelectrode recording
IntroductionHigh frequency oscillations (HFOs), or brief events in the high
gamma band (480 Hz), have been proposed as useful biomarkers
of epileptic pathology. It has been suggested that fast ripples,
or population bursts oscillating at rates 4200 Hz, may be largely
restricted to the epileptogenic zone in temporal lobe epilepsy
(Bragin et al., 1999; Staba et al., 2002; Jirsch et al., 2006;
Urrestarazu et al., 2007; Worrell et al., 2008) and in neocortical
epilepsy syndromes (Jacobs et al., 2008). Studies in rodent
doi:10.1093/brain/awp222 Brain 2009: 132; 3047–3059 | 3047
Received May 4, 2009. Revised June 12, 2009. Accepted July 11, 2009. Advance Access publication September 10, 2009
� The Author(s) 2009. Published by Oxford University Press on behalf of Brain.
This is an Open Access article distributed under the terms of the Creative Commons Attribution Non-Commercial License (http://creativecommons.org/licenses/by-nc/
2.5/uk/) which permits unrestricted non-commercial use, distribution, and reproduction in any medium, provided the original work is properly cited.
Dow
nloaded from https://academ
ic.oup.com/brain/article/132/11/3047/326739 by guest on 31 January 2022

epilepsy models have indicated that fast ripples or population
bursts oscillating at rates higher than 200 Hz are present interic-
tally in epileptic rats (Bragin et al., 2003) and play important roles
during epileptogenesis (Bragin et al., 2000, 2002, 2007) and at
seizure onset (Bikson et al., 2003; Bragin et al., 2005). On the
other hand, evoked oscillations in the fast ripple range have been
found in recordings from the somatosensory cortex of normal rats
(Gibson et al., 1999) and humans (Haueisen et al., 2001). This
suggests that, like the lower frequency (5200 Hz) ripple oscillations
found in normal rodent hippocampus (Buzsaki et al., 1992) and
normal primate thalamus and neocortex (Schroeder et al., 1992,
1995; Steinschneider et al., 1992), fast ripples may also play a role
in normal neocortical processing. Thus, further characterization of
fast ripples and particularly of differences between fast ripples
recorded from epileptogenic versus non-epileptogenic cortex, will
be helpful if fast ripples are to be used to delineate epileptogenic
areas for the purposes of epilepsy surgical treatment.
A concern underlying the study of fast ripples is that they are
highly restricted both spatially and temporally (Bragin et al., 2003)
and thus may not be sampled adequately in macroelectrode or
sparse microcontact recordings. While fast ripples have been
detected with depth macroelectrodes (Jirsch et al., 2006;
Urrestarazu et al., 2007), comparison of simultaneous recordings
from macroelectrodes and microwire bundles (Worrell et al., 2008)
found clear differences in detection rates and frequency distribu-
tions. The limited spatial sampling of microcontacts may help to
isolate spatially restricted events such as fast ripples; it could, how-
ever, adversely affect detection if the events are sparsely distributed.
The discovery of ‘microdischarges’ and ‘microseizures’ in
microelectrode recordings from epileptogenic neocortex provide
additional evidence of very fine-scale architecture of epileptiform
activity (Schevon et al., 2008). However, the precise relationship
of these microscale features to interictal epileptiform events
typically recognized in subdural macroelectrode recordings and
to fast ripples remains to be determined.
To address these questions, we evaluated interictal HFOs
recorded from a dense two dimensional microelectrode array
(MEA) (4�4 mm2, 0.4 mm spacing) implanted in epilepsy patients
undergoing chronic invasive monitoring. Microelectrode or micro-
wire recordings in epilepsy patients have previously been used to
acquire otherwise unobtainable information on the neurophysiol-
ogy of both epilepsy (Bragin et al., 1999; Staba et al., 2002;
Ulbert et al., 2004a, b; Worrell et al., 2008) and normal cognition
(Wang et al., 2005; Cash et al., 2009). In this report, we inves-
tigate the spatial extent and fine-scale distribution of neocortical
ripples and fast ripples, and characterize their relationship to
disturbances of electrocerebral activity detected by both the
MEA and subdural macroelectrodes.
Materials and methods
Microelectrode array implantationThe MEA used in this study is an FDA-approved device (NeuroportTM
neural monitoring system, Cyberkinetics Neurotechnology Systems,
Foxboro, MA) that has been safely implanted in humans at several
institutions (Hochberg et al., 2006; House et al., 2006; Waziri et al.,
2009). The array measured 4� 4 mm2 and contained 96 microelec-
trodes arranged in a regular 10�10 square with no electrodes at
the corner positions. The individual microelectrodes were platinum-
coated silicon, protruding 1 mm from the array base and were electri-
cally insulated except for the terminal 70mm. They tapered from 35 to
75 mm in diameter at the base to 3–5 mm at their recording tips.
Electrode impedance at manufacture was 322� 138 kOhm.
The MEA was implanted alongside subdural and depth electrodes
into the neocortex of patients with medically intractable focal epilepsy
undergoing intracranial electroencephalography (iEEG) recording at the
Columbia University Medical Center and the New York-Presbyterian
Hospital to help to identify the epileptogenic zone, i.e. the tissue that
must be removed to obtain seizure control (Rosenow and Luders,
2001). Use of the MEA was limited to patients for whom the pre-
surgical evaluation indicated clear seizure localization to a restricted
region and in whom invasive recording was performed to refine the
resection boundaries, in order to ensure that the implantation site was
included in the area targeted for subsequent surgical treatment. Cases
that were considered appropriate included temporal lobe epilepsy, in
which implantation was performed to define the contribution of lateral
temporal neocortex and tailor temporal lobectomy, and extratemporal
syndromes in which scalp EEG recording indicated a consistent and
well-defined interictal and ictal focus limited to a sublobar distribution
and confirmed by a neuroimaging study. The study was approved by
the Institutional Review Board of the Columbia University Medical
Center and informed consent was obtained from each patient prior
to the procedure.
The MEA was implanted into flat surfaces of exposed neocortical
gyri through the pia mater using a pneumatic insertion technique
(for more details, see Suner et al., 2005; Hochberg et al., 2006;
Waziri et al., 2009). The implant site was selected based on the
estimation of the epileptogenic region from pre-surgical studies, as
described above, and selected so as to be included in the subsequent
surgical treatment. Lateral temporal sites were chosen to fall within
the region to be included in anterolateral temporal lobectomy.
Extratemporal implantation sites were selected from regions with
prominent interictal epileptiform discharges identified by intraoperative
corticography, a standard clinical procedure during subdural electrode
implantation at our institution. Potentially eloquent sites such as
Broca’s area or primary motor cortex were avoided. Following implan-
tation, standard clinical macroelectrode grids were placed. The MEA
assembly includes two reference wires: one was placed subdurally near
the MEA and the other epidurally. During monitoring, MEA data were
made available to the clinical team to assist in the surgical evaluation.
Following the monitoring period, with duration determined by clinical
needs, the MEA was explanted along with the clinical grids. Gross
pathology and histopathology of the implant sites were evaluated.
These studies revealed no gross tissue damage, minimal tissue injury
with microscopic haemorrhages and microglial activation localized to
the electrode insertion sites, and little evidence of neuronal death.
These findings are similar to those reported in animal histopathology
studies (Rousche and Normann, 1998). Neuronal degeneration at
the microelectrode sites was minimal and far less marked than that
associated with clinical depth electrode implantation, which is con-
sidered to be a safe procedure. These results are being reported
separately.
The epileptogenic zone was determined by the consensus of at least
two epileptologists at the Columbia Comprehensive Epilepsy Center,
based on interictal and ictal intracranial and scalp video-EEG, neuro-
imaging studies and results of functional evaluation. The location of
the MEA relative to both the cortical surface and the subdural
3048 | Brain 2009: 132; 3047–3059 C. A. Schevon et al.
Dow
nloaded from https://academ
ic.oup.com/brain/article/132/11/3047/326739 by guest on 31 January 2022

macroelectrodes was identified by intraoperative photographs and fra-
meless stereotactic localization (Brainlab, Westchester, IL), combined
with postoperative imaging studies.
Dual modality recordingMEA signals were sampled at 30 kHz/channel (0.3–7.5 kHz bandpass
filtering) with 16-bit precision and a range of �8 mV. The reference
signal was selected to optimize recording quality; most often it was
found that best results were obtained using the pedestal ground as the
reference. To monitor recording integrity, electrode impedance testing
and visual inspection of sample data was performed after the initial
hook-up and daily thereafter.
iEEG was recorded from standard clinical electrodes (Ad-tech
Medical Instrument Corp., Racine, WI or PMT Corp., Chanhassen,
MN), 4.0 or 4.5 mm diameter platinum disks spaced 1 cm centre
to centre and arranged in a grid or strip. Data were acquired at
500 Hz/channel with 24-bit precision (0.5–125 Hz bandpass filtering)
using a standard clinical video-EEG system (XLTek Inc., Oakville,
ON, Canada). Two contacts of an epidurally placed electrode strip,
with electrodes facing away from the dura, served as the reference.
Coded sequences of transistor–transistor logic pulses delivered
simultaneously to digital inputs of both acquisition systems were
used to align iEEG and MEA recordings.
Microdischarge and macrodischargedetectionOffline, MEA recorded data were down-sampled to 500 Hz/channel
after low pass filtering at 125 Hz (fourth order Butterworth) to yield
high spatial resolution local field potential signals in the frequency
range of standard EEG (‘mEEG’). Synchronized mEEG and iEEG data
were then converted into identical digital formats, merged into
combined files and viewed in spatially organized, referential montages
using a commercial EEG viewing program (Insight, Persyst
Development Corp., Prescott, AZ).
Each patient’s recording was reviewed visually in its entirety by two
neurophysiologists (C.A.S. and R.E.) to identify interictal discharge
populations and seizures. In the case of differing interpretations, a
joint review was conducted and the more conservative interpretation
was agreed upon. Wake and non-rapid eye movement (NREM) sleep
periods were determined by identifying periods of increased iEEG theta
and delta activity combined with simultaneous video evidence. mEEG
features likely to represent interictal and ictal epileptiform abnormal-
ities were identified visually and classified based on the waveform
characteristics analogous to well-recognized epileptiform abnormalities
in standard resolution electroencephalography (Niedermeyer and
Lopes da Silva, 1999), as well as correlation to simultaneous iEEG
events. Interictal epileptiform events seen in nearby iEEG channels
and occurring simultaneously over a broad distribution in the low-
pass filtered mEEG are referred to as ‘macrodischarges’. Conversely,
spatially restricted waveforms seen only in the mEEG with an epilepti-
form appearance were identified as ‘microdischarges’ (Schevon et al.,
2008). An example of a typical microdischarge, associated with a fast
ripple oscillation, is shown in Fig. 1b. The rates of each discharge type
were determined by visually inspecting the first 5 min of the recording
samples analysed for HFOs (described below). Additionally, the MEA
channels at which microdischarge activity was present at any time
during both recording samples were identified for each patient.
High frequency oscillation detectionand classificationHFOs in MEA recorded data were determined by combining the
automatic detection technique described by Staba et al. (2002) with
visual screening by two neurophysiologists (C.A.S. and R.E.).
Automated detection was performed using bipolar signals, obtained
by pairing orthogonally adjacent channels, to avoid possible contami-
nation by referential artifact; visual screening was then performed
separately on each channel.
Two 30 min recording samples for each patient, one during waking
and one during NREM sleep, were chosen from the interictal record-
ing. Samples were required to be at least 4 h before or after a seizure,
at least 48 h after surgery to minimize the effects of anaesthesia,
and free of transient artefacts detected either visually or by inspecting
100–500 Hz time-frequency plots. After bandpass filtering between
100–500 Hz (90th order finite impulse response), the automated
detection algorithm was applied. The algorithm, as originally defined,
applies the following criteria to epochs of at least 6 ms in duration: (i)
root mean square amplitude of at least 5 SD above the mean for the
rectified signal over the recording sample being tested; and (ii) at least
six peaks with amplitude 43 SD above the mean. This method has a
reported sensitivity of 84% compared with manual review (Staba
et al., 2002). For the purpose of this study, the sensitivity of the
automatic detection algorithm was increased by reducing the
number of signal peaks required from six to four. The detected
samples were then reviewed visually to achieve 100% specificity.
Visual review and event classification were carried out using a
custom-developed display that simultaneously shows views of the
HFO along with the surrounding mEEG channels (Matlab, Mathworks
Inc., Natick, MA) (Fig. 1). The detected event was displayed in four
separate frequency bands, derived by symmetrically bandpass filtering
the raw data (90th order FIR): mEEG, ripples (80–200 Hz), fast ripples
(200–500 Hz), and multiunit activity (MUA). The latter was con-
servatively defined to be from 800 Hz to 3 kHz to avoid overlap with
the fast ripple band, and was displayed as a rectified signal.
Simultaneously, a 5�5 subregion of the MEA over a 4 s time slice
centred on the start time and at the location of the detected HFO was
shown, to permit distinguishing micro- from macrodischarges.
Reviewers recorded the time span of each HFO and classified them
visually by HFO type, correlation with multiunit spikes, and correlation
with mEEG features. Ripples were defined as HFOs that were visible in
the ripple band but not in the fast ripple band, while fast ripples were
defined as HFOs that were visible in the 200–500 Hz band, with
or without visible activity in the ripple band. HFOs were classified
according to their temporal association with microdischarges, whether
in the same channel or a neighbouring channel, and with
macrodischarges.
Spatial distribution of high frequencyoscillationsThe MEA recorded a large number of channels in regularly spaced
locations from a tiny cortical region, providing opportunity for deter-
mining the spatial extent and occurrence pattern of HFOs. To study
patterns of simultaneous detections, we introduce the term
‘HFO event’ (HFOE) to signify the detection of one or more HFOs
in different channels during time intervals that were either overlapp-
ing or at most 6 ms apart. An HFOE can therefore consist of
either one or several individual HFO detections and involve one or
more channels. To estimate the size of the cortical region spanned
Spatial characterization of HFOs Brain 2009: 132; 3047–3059 | 3049
Dow
nloaded from https://academ
ic.oup.com/brain/article/132/11/3047/326739 by guest on 31 January 2022

by the HFO detections within a single HFOE, we determined the area
of the smallest square enclosing the detection sites in units of chan-
nels, i.e. the number of channels covered by the square. Simultaneous
detections occurring in two adjacent channels could be either due
to a larger area of origin or to a single restricted-area event detected
in two nearby channels. The latter cannot, however, be the case if the
number of channels is greater than two. Accordingly, we refer to
HFOEs spanning an area of more than two channels as ‘large-scale’.
For example, in Fig. 2a, the area of the HFOE is equal to one, while
Fig. 2b depicts a large-scale HFOE with an area of 80 (8�10).
Relative location of high frequencyoscillations and microdischargesTo test whether fast ripples and microdischarges are co-located, we
calculated Euclidean distance in units of microelectrode spacing from
Figure 1 Ripples, fast ripples and their mEEG correlates. (A) Fast ripple correlating with a macrodischarge. Left panel: Data from a
350 ms time slice filtered to produce four views: mEEG with high frequencies preserved (2–500 Hz), ripple (R) (100–200 Hz), fast ripple
(FR) (200–500 Hz), and MUA (800 Hz to 3 kHz). Below is a time-frequency plot (100–500 Hz) computed using the Morlet wavelet
transform. Right panel: Two seconds of 2–50 Hz mEEG from the surrounding MEA channels (enclosed box in the MEA schematic),
organized by row (top to bottom) and column (channel groups, left to right). The HFO channel is indicated by the heavy black trace;
with the detection at the vertical grey line. Note the timing of the fast ripple after the mEEG discharge peak. The increase in MUA
amplitude coincides with the fast ripple but not the preceding ripple oscillation or the discharge peak. This timing pattern of the fast
ripple, MUA and discharge peak was typical of many macrodischarge-associated HFO detections. (B) Ripple with peak frequency at
200 Hz correlating with a microdischarge. In contrast to the macrodischarge shown in (A), the field of the mEEG waveform (right panel)
is limited. The relative prominence of ripple activity and the occurrence of the HFO with the discharge peak were typical of HFOs
associated with microdischarges.
3050 | Brain 2009: 132; 3047–3059 C. A. Schevon et al.
Dow
nloaded from https://academ
ic.oup.com/brain/article/132/11/3047/326739 by guest on 31 January 2022

each HFO to the nearest microdischarge site. For example, an HFO
detected at a site adjacent to a channel in the same MEA row or
column at which microdischarges were recorded was considered to
have a distance of one. If HFO activity was always generated from
the same sites as those responsible for microdischarges, the distances
thus obtained would be zero. Conversely, if HFOs are equally likely to
be generated at each MEA channel, the values in the distance vector
would be variable and would depend on the distribution of micro-
discharge sites. To obtain this hypothetical uniform-distribution
distance vector, a set of N/R HFO detections at each channel
(N = number of HFOs, R = number of recording channels) was assumed
and the distances computed as above. Statistically significant differ-
ences between the actual and hypothetical distance vectors and the
actual and zero distance vectors were then determined using
the Wilcoxon signed rank test. Thus, if HFO activity was generated
from channels ‘neighbouring’ microdischarge sites, the expected
value of the distance vector would be greater than zero but smaller
than it would be if HFOs were uniformly distributed throughout
the MEA.
ResultsFive patients with medically refractory epilepsy were implanted
with the Neuroport device. One patient experienced cyclic seizures
every 10–40 min throughout the 48 h monitoring period, so that
no definite interictal periods were recorded. This patient was
therefore not included in the study. Clinical data for the remaining
four patients are summarized in Table 1. Data were recorded
from all patients during the entire time they were implanted, for
5–14 days. All had non-lesional epilepsy syndromes originating
either from the mesial/basal temporal region (two patients) or
the lateral frontal lobe (two patients). The MEA was located
within the epileptogenic zone in three patients (Patients 2–4). In
Patient 1, the MEA was implanted in lateral temporal neocortex
�4 cm posterior to the anterior temporal pole, a region standardly
included in non-dominant anterolateral temporal lobectomy for
medically refractory mesial temporal lobe epilepsy, but which did
not show independent or propagated epileptiform activity.
Subsequent to the recordings, the cortical location of the MEA
was resected or treated with multiple subpial transections in
each case.
Macrodischarges and microdischarges were only found in the
recordings where the MEA was located within the epileptogenic
zone (Patients 2–4) (Schevon et al., 2008). No microdischarges or
macrodischarges were seen in Patient 1’s recording. The rates of
microdischarges and macrodischarges (Table 2) were highly
variable in Patients 2–4, with the number of microdischarge sites
ranging from 8 to 24 (mean 15.7) or from 9% to 28% of the total
recorded channels (mean 13%). Visual inspection of the aligned
iEEG and mEEG recordings revealed that microdischarges did not
correlate with disturbances in the activity of nearby macro-
electrodes. The macrodischarge correlates in the surrounding
Figure 2 Spatial pattern of high frequency activity during two HFOEs. The MEA is represented according to its physical layout as a
10� 10 grid, with each channel corresponding to one square. Within each square, 100–500 Hz bandpass filtered signal is shown.
Channels excluded because of data quality and the empty corner positions are indicated by blank squares. Solid black boxes mark
channels at which HFOs were detected. (A) HFOE with a single HFO detection from Patient 1. The fast ripple shown in the boxed
channel is not seen in neighbouring channels, located at orthogonal distances of 400 mm. (B) Large-scale HFOE associated with a
macrodischarge in Patient 4. The time scale reflects the longer duration of the events depicted. The transient increase in 100–500 Hz
activity within the time period shown can be seen in the majority of channels, however, not all these met amplitude or duration criteria
relative to baseline for HFO detection (see ‘Materials and methods’ section). The figure illustrates how the use of objective detection
criteria can mask subthreshold increases in high frequency activity. Differences in amplitude and temporal pattern of the waveforms
are apparent, even in adjacent channels.
Spatial characterization of HFOs Brain 2009: 132; 3047–3059 | 3051
Dow
nloaded from https://academ
ic.oup.com/brain/article/132/11/3047/326739 by guest on 31 January 2022
macroelectrodes, on the other hand, revealed significant variability
in relative timing (Fig. 3) that suggested differing source locations
and propagation pathways.
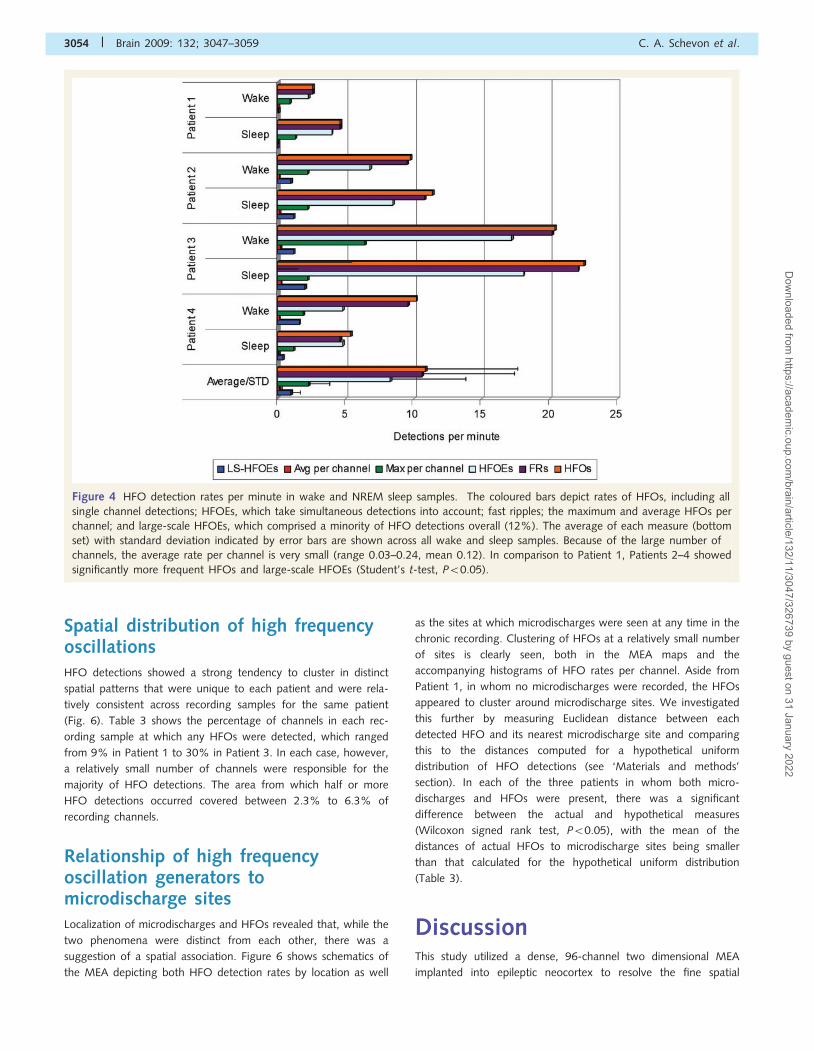
HFOs were detected in both wake and sleep interictal record-
ing samples of all four patients (Fig. 4). The rate of individual
HFO detections over all channels (per recording sample) ranged
from 2.6 to 22.5/min (mean 10.9), with Patient 1 having the
lowest rates. Rates were generally higher in NREM sleep
(individual rate 4.6–22.46, mean 11.0) than in waking
(2.6–20.4, mean 10.7); however, the difference was not statisti-
cally significant. For individual channels at which HFOs were
detected, the per-channel average rate varied between 0.03 and
0.24 (mean 0.12) HFOs per minute. The maximum rate for a
single channel in a given recording sample, however, was an
order of magnitude higher, up to 6.4 HFOs per minute in the
wake sample from Patient 3 and averaging 2.3 detections
per minute (Fig. 4).
High frequency oscillationsclassificationHFOs were classified by visual review as either ripples (80–200 Hz)
or fast ripples (visible in the 200–500 Hz band), as well as whether
the HFO correlated with visible multiunit spiking (Table 2).
Oscillations limited to the ripple range were relatively rare and
none were found in Patient 1’s recording. In contrast, nearly all
HFOs either combined ripple and fast ripple components, or were
pure fast ripples (86%–100%, mean 97%). The amplitudes of
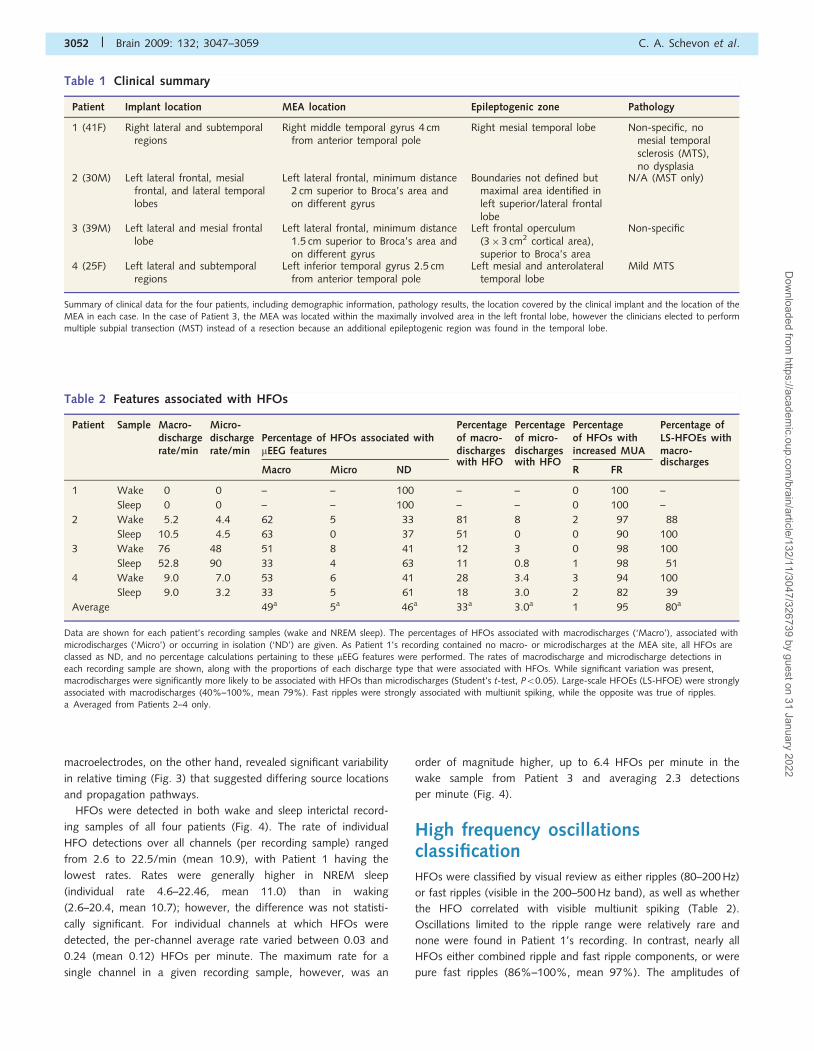
Table 2 Features associated with HFOs
Patient Sample Macro-dischargerate/min
Micro-dischargerate/min
Percentage of HFOs associated withmEEG features
Percentageof macro-discharges
Percentageof micro-discharges
Percentageof HFOs withincreased MUA
Percentage ofLS-HFOEs withmacro-
Macro Micro NDwith HFO with HFO
R FRdischarges
1 Wake 0 0 – – 100 – – 0 100 –
Sleep 0 0 – – 100 – – 0 100 –
2 Wake 5.2 4.4 62 5 33 81 8 2 97 88
Sleep 10.5 4.5 63 0 37 51 0 0 90 100
3 Wake 76 48 51 8 41 12 3 0 98 100
Sleep 52.8 90 33 4 63 11 0.8 1 98 51
4 Wake 9.0 7.0 53 6 41 28 3.4 3 94 100
Sleep 9.0 3.2 33 5 61 18 3.0 2 82 39
Average 49a 5a 46a 33a 3.0a 1 95 80a
Data are shown for each patient’s recording samples (wake and NREM sleep). The percentages of HFOs associated with macrodischarges (‘Macro’), associated with
microdischarges (‘Micro’) or occurring in isolation (‘ND’) are given. As Patient 1’s recording contained no macro- or microdischarges at the MEA site, all HFOs areclassed as ND, and no percentage calculations pertaining to these mEEG features were performed. The rates of macrodischarge and microdischarge detections ineach recording sample are shown, along with the proportions of each discharge type that were associated with HFOs. While significant variation was present,macrodischarges were significantly more likely to be associated with HFOs than microdischarges (Student’s t-test, P50.05). Large-scale HFOEs (LS-HFOE) were stronglyassociated with macrodischarges (40%–100%, mean 79%). Fast ripples were strongly associated with multiunit spiking, while the opposite was true of ripples.a Averaged from Patients 2–4 only.
Table 1 Clinical summary
Patient Implant location MEA location Epileptogenic zone Pathology
1 (41F) Right lateral and subtemporalregions
Right middle temporal gyrus 4 cmfrom anterior temporal pole
Right mesial temporal lobe Non-specific, nomesial temporalsclerosis (MTS),no dysplasia
2 (30M) Left lateral frontal, mesialfrontal, and lateral temporallobes
Left lateral frontal, minimum distance2 cm superior to Broca’s area andon different gyrus
Boundaries not defined butmaximal area identified inleft superior/lateral frontallobe
N/A (MST only)
3 (39M) Left lateral and mesial frontallobe
Left lateral frontal, minimum distance1.5 cm superior to Broca’s area andon different gyrus
Left frontal operculum(3�3 cm2 cortical area),superior to Broca’s area
Non-specific
4 (25F) Left lateral and subtemporalregions
Left inferior temporal gyrus 2.5 cmfrom anterior temporal pole
Left mesial and anterolateraltemporal lobe
Mild MTS
Summary of clinical data for the four patients, including demographic information, pathology results, the location covered by the clinical implant and the location of theMEA in each case. In the case of Patient 3, the MEA was located within the maximally involved area in the left frontal lobe, however the clinicians elected to performmultiple subpial transection (MST) instead of a resection because an additional epileptogenic region was found in the temporal lobe.
3052 | Brain 2009: 132; 3047–3059 C. A. Schevon et al.
Dow
nloaded from https://academ
ic.oup.com/brain/article/132/11/3047/326739 by guest on 31 January 2022

ripple components varied from 10 to 76 mV (mean 21 mV), and the
amplitudes of fast ripple components varied between 2 and 26 mV,
with a mean of 5mV. Most strikingly, fast ripples correlated
strongly with increased MUA (82%–100%), while ripples rarely
had any MUA correlate (0%–3%). Consistent with prior reports
(Buzsaki et al., 1992; Bragin et al., 2007; Foffani et al., 2007),
populations of unit spikes were seen to coincide with the peaks of
fast ripple but not ripple oscillations (Fig. 1).
HFOs were further classified by visual review according
to their association with mEEG features (Table 2). Overall,
49% of detections in Patients 2–4 were associated with
macrodischarges, ranging from 33% in the sleep recordings of
Patients 3 and 4 to 63% in both of Patient 2’s recording samples.
While prior reports of neocortical interictal epileptiform events
associated with HFOs in depth macroelectrode recordings
indicate that the high frequency activity often rode the discharge
peaks (Jirsch et al., 2006; Urrestarazu et al., 2007), we found
that in our data, fast ripple components were often seen trailing
the peaks. HFOs not associated with interictal epileptiform
events comprised all of Patient 1’s HFO detections and 46%
of those recorded from the other three patients. In contrast,
there were comparatively few detections associated with
microdischarges; on average 5% of detections in Patients 2–4
occurred in conjunction with microdischarges that were seen
either in the same channel or an adjacent channel. We
also directly measured the proportion of macrodischarges and
microdischarges that were associated with HFO activity;
while those proportions varied markedly between patients, the
difference between macrodischarges (mean 33%) and micro-
discharges (mean 3%) was clear and significantly different
(Student’s t-test, P50.05).
Large-scale high frequency oscillationeventsWe investigated the number and location of channels involved in
HFOEs in order to estimate their extent within the 4� 4 mm2
boundaries of the MEA. Compared with the rate of single HFO
detections (mean 10.9/min), the somewhat lower HFOE rates
per minute (Fig. 4; overall range 2.3–18.1, mean 8.3) reflect the
multiple contemporaneous HFO detections seen in most recording
samples. While most HFOEs involved only a single microelectrode
channel, simultaneous HFO detections spanning more than two
channel sites were seen in 12% (Fig. 4). Such large-scale HFOEs
were rare in Patient 1, while they were significantly more common
in the other three patients (Student’s t-test, P50.05). These
multiple detections were never seen with microdischarges but
were commonly associated with macrodischarges (Table 2).
The HFOs comprising large-scale HFOEs revealed a high degree
of local variability, as evidenced by variations in waveform mor-
phology, frequency range and timing. Figure 5 shows an example
of two channels from a typical large-scale HFOE, illustrating the
differences that can occur even over short distances.
Figure 3 Macrodischarges and their iEEG correlates. Top grouping: recordings from subdural grid macroelectrodes surrounding the
MEA are shown, organized by row and column; blue traces indicate macroelectrodes adjacent to the MEA, and pink traces indicate
subdural electrodes directly overlying the MEA. Bottom grouping: selected MEA channels (every other channel in each row and
column); channels organized by row. Vertical blue lines are provided for convenience in viewing aligned waveform features. (A and B)
Two macrodischarges from Patient 3. The discharge in A appears to align closely with the mEEG waveforms, but the discharge in B is
seen to lead in from the bottom iEEG channel. (C) Macrodischarge from Patient 2, with earliest peak appearing in the top row of iEEG
channels. (D) Macrodischarges from Patient 4, again showing variations in the relative discharge latencies in the iEEG record. These
samples suggest that the location of the MEA relative to the discharge source and propagation pathway is variable.
Spatial characterization of HFOs Brain 2009: 132; 3047–3059 | 3053
Dow
nloaded from https://academ
ic.oup.com/brain/article/132/11/3047/326739 by guest on 31 January 2022
Spatial distribution of high frequencyoscillationsHFO detections showed a strong tendency to cluster in distinct
spatial patterns that were unique to each patient and were rela-
tively consistent across recording samples for the same patient
(Fig. 6). Table 3 shows the percentage of channels in each rec-
ording sample at which any HFOs were detected, which ranged
from 9% in Patient 1 to 30% in Patient 3. In each case, however,
a relatively small number of channels were responsible for the
majority of HFO detections. The area from which half or more
HFO detections occurred covered between 2.3% to 6.3% of
recording channels.
Relationship of high frequencyoscillation generators tomicrodischarge sitesLocalization of microdischarges and HFOs revealed that, while the
two phenomena were distinct from each other, there was a
suggestion of a spatial association. Figure 6 shows schematics of
the MEA depicting both HFO detection rates by location as well
as the sites at which microdischarges were seen at any time in the
chronic recording. Clustering of HFOs at a relatively small number
of sites is clearly seen, both in the MEA maps and the
accompanying histograms of HFO rates per channel. Aside from
Patient 1, in whom no microdischarges were recorded, the HFOs
appeared to cluster around microdischarge sites. We investigated
this further by measuring Euclidean distance between each
detected HFO and its nearest microdischarge site and comparing
this to the distances computed for a hypothetical uniform
distribution of HFO detections (see ‘Materials and methods’
section). In each of the three patients in whom both micro-
discharges and HFOs were present, there was a significant
difference between the actual and hypothetical measures
(Wilcoxon signed rank test, P50.05), with the mean of the
distances of actual HFOs to microdischarge sites being smaller
than that calculated for the hypothetical uniform distribution
(Table 3).
DiscussionThis study utilized a dense, 96-channel two dimensional MEA
implanted into epileptic neocortex to resolve the fine spatial
Figure 4 HFO detection rates per minute in wake and NREM sleep samples. The coloured bars depict rates of HFOs, including all
single channel detections; HFOEs, which take simultaneous detections into account; fast ripples; the maximum and average HFOs per
channel; and large-scale HFOEs, which comprised a minority of HFO detections overall (12%). The average of each measure (bottom
set) with standard deviation indicated by error bars are shown across all wake and sleep samples. Because of the large number of
channels, the average rate per channel is very small (range 0.03–0.24, mean 0.12). In comparison to Patient 1, Patients 2–4 showed
significantly more frequent HFOs and large-scale HFOEs (Student’s t-test, P50.05).
3054 | Brain 2009: 132; 3047–3059 C. A. Schevon et al.
Dow
nloaded from https://academ
ic.oup.com/brain/article/132/11/3047/326739 by guest on 31 January 2022

structure of interictal HFOs. The HFOs in this data set, almost all
of which showed fast ripple components, were both highly loca-
lized and concentrated in a small proportion of MEA channels.
Detection rates and the extent of the spatial distribution were
both significantly greater within the epileptogenic zone.
Additionally, we found evidence of large scale simultaneous
HFO activation, most often in association with macrodischarges,
but with marked differences in the oscillation characteristics
between channels; these were rarely seen in the only patient
recorded outside the epileptogenic zone. As HFOs only
rarely accompanied microdischarges and were found at different
sites, it is clear that they are distinct phenomena, albeit
with a possible link indicated by their locations relative to each
other.
High frequency oscillation occurrencerates and classificationTaking all MEA channels into account, the rate of HFO detections
(11/min on average) far exceeds rates reported in studies
using implanted microwires, which range from 0.25 (Staba
et al., 2002) to 3.0/min (Worrell et al., 2008). However, the
average detection rate per MEA channel (0.12 HFOs per
minute) is similar to these earlier findings, suggesting that
random sampling of a subset of MEA channels would produce
results similar to those seen with sparser-sampling microwires.
The high detection rate then is most likely an effect of the
dense spatial sampling afforded by the MEA’s 400 mm inter-
electrode spacing, combined with the finding that HFOs are
Figure 5 HFOs occurring simultaneously during a macrodischarge recorded from Patient 4. Two pairs of adjacent channels in different
areas of the MEA are shown (A, B; solid black boxes in schematics). The same time slice is shown in all four panels, with signals
displayed as in Fig. 1. Note the marked differences in timing, morphology, and frequency range in both the 100–500 Hz bands and in
MUA between adjacent recording sites. For example, in (B) the maxima of the fast ripple amplitude envelope are clearly seen to occur
at different times in the two channels, while in (A) there is fast ripple activity in the top channel that is not reflected in the bottom
channel. These observations indicate that recording sites separated by 400 mm are capable of distinguishing independent generators of
high frequency activity.
Spatial characterization of HFOs Brain 2009: 132; 3047–3059 | 3055
Dow
nloaded from https://academ
ic.oup.com/brain/article/132/11/3047/326739 by guest on 31 January 2022

often restricted to a single microelectrode and tend to concentrate
in a relatively small number of electrode sites.
In contrast to earlier studies, nearly all HFO detections were
classified by visual inspection as fast ripples. One possible expla-
nation is that the previous microelectrode studies, both animal and
human, have focused almost exclusively on mesial temporal areas
while our recordings are all from the neocortex. There may be
physiological differences between these areas in the production
of HFOs that have yet to be fully explored. For example, Staba
et al. (2002) found higher rates of ripples contralateral to seizure
onset and increased fast ripple rates in ipsilateral structures, while
we found no ripples in the one patient in whom the MEA was
situated outside the epileptogenic zone. It is also possible
that the MEA microelectrodes themselves are more sensitive to
high frequency activity; for example, it is known that microwires
are more likely to detect high frequencies than depth macroelec-
trodes, probably due to differences in spatial averaging (Worrell
et al., 2008). Another possible explanation is that the location of
Figure 6 Spatial distribution of HFOs. HFO rate per channel site, per recording sample is depicted in the topographical maps of
the MEA, expressed as a percentage of the maximum rate for that sample. Non-recording channels (NR) are shown in black.
Microdischarge sites are indicated by the small white circles. The bar plots were obtained by sorting the channels by HFO rate; channels
with no HFO detections are excluded. The concentration of HFO generation in a small number of channels is clearly evident, as is the
significantly larger distribution of HFO generating sites in Patients 2–4 compared with Patient 1 (Student’s t-test, P50.05). Poisson
distribution parameters, obtained using maximum likelihood estimation, also were significantly greater in Patients 2–4. Note that the
generating regions for HFOs and microdischarges are not co-located, although some overlap is present. Clustering of HFO generating
sites near microdischarge sites is particularly evident in Patient 3’s data.
3056 | Brain 2009: 132; 3047–3059 C. A. Schevon et al.
Dow
nloaded from https://academ
ic.oup.com/brain/article/132/11/3047/326739 by guest on 31 January 2022

our 1 mm long MEA electrodes resulted in selective recording of
fast ripples. This might be the case if fast ripples were highly
localized to layers 4 or 5, and were therefore often not recorded
by microwires positioned to less tightly constrained depths.
Similarly, if ripple oscillations are localized to more superficial
cortical layers, our sensor may have failed to detect them. Layer
specificity of ripples and fast ripples has not been described in
human neocortex. However, there is some evidence that at least
normally occurring neocortical fast ripples may indeed be layer-
specific. Stimulus-induced activity up to 320 Hz in neocortical
layers IV and VI has been reported in normal rat barrel cortex
(Gibson et al., 1999).
We and others have observed a strong correlation of fast ripples
with population spikes (Buzsaki et al., 1992; Bragin et al., 2003,
2007). In contrast, we found ripples to correlate only rarely with
multiunit spiking. One possible explanation is that ripples reflect
the high frequency inhibitory restraint of pyramidal cells (Prince
and Wilder, 1967; Trevelyan et al., 2006, 2008). Another proposal
is that ripples and fast ripples are generated by electrically-
connected pyramidal cells in the absence of synaptic firing, with
the network path length determining the rate of the oscillation
(Traub and Bibbig, 2000; LeBeau et al., 2003). Populations of
fast-spiking interneurons firing out of phase in a ‘see-saw’ pattern
have been proposed as a possible mechanism explaining the high
oscillation rate of fast ripples (Foffani et al., 2007).
High frequency oscillation spatialextent and distributionThe evidence for non-uniform spatial distribution of HFOs is
striking. HFOs were detected at 9%–30% of recording sites
within the MEA in a Poisson pattern, with half of them seen at
2%–6% of sites. Overall, the area of HFO generation comprised
between one-tenth and one-third of the recorded area, or
between about 2 and 5 mm2 out of the 16 mm2 monitored by
the MEA, with the smallest portion in the patient recorded outside
the epileptogenic zone. Half of the HFOs were found in 57% of
the total recording area, or less than �1.2 mm2.
Because contemporaneous HFO detections were not infrequent
and were often widely distributed, we found it useful to introduce
the term HFOE to describe instances with one or more concurrent
detections in different MEA channels. We found that most
HFOEs detected in our data (85%) were limited to a single
channel, indicating localization to a cortical region of at most
400�400 mm, or approximately the size of a single cortical macro-
column (Mountcastle, 1997). This finding is consistent with studies
of HFOs in hippocampal slice recordings (Buzsaki et al., 1992;
Bragin et al., 2003, 2007) which identified spatial extents of
51 mm2.
Simultaneous HFO detections have been reported in studies
employing microwire bundles, in which the distance between
contacts was estimated to be 1 mm (Worrell et al., 2008). As
the example in Fig. 2b illustrates, large-scale HFOEs were seen
to extend over several square millimetres. Moreover, simultaneous
transient increases in 100–500 Hz activity were present in several
other channels that did not meet criteria for detection, either
because signal amplitude was not high enough relative to the
baseline activity in that channel to exceed detection threshold,
or because there were too few signal peaks outside of the thresh-
old values. This suggests that large-scale HFOEs may occur
on a continuum rather than as a binary process, and that binary
HFO detection may underestimate the spatial extent of this
activation.
While simultaneous detections at two adjacent MEA channels
could be due to a HFO arising in a region sampled by both micro-
electrodes, multiple contemporaneous detections spanning more
than two channel sites cannot be explained either in this way or
by such mechanisms as volume conduction or reference contam-
ination. First, the majority of detections (85%) were limited to a
single channel. Second, large scale events spanning most of the
MEA were seen (Fig. 5), an observation incompatible with simple
volume conduction from a single source. Third, close examination
of the signal in adjacent contacts, such as those illustrated in
Fig. 5, reveal differences in morphology, frequency spectra and
timing of amplitude peaks that can only be the result of indepen-
dent sources. These findings are a strong indication that HFOE
generation can occur simultaneously across larger cortical regions,
as was seen in 12% of HFOEs in this study. Moreover, data from
all MEA channels during an HFOE (Fig. 2b) reveals that high
frequency activity is increased in many channels that did not
Table 3 Restricted distribution of HFOs
Patient Sample Percentage channelswith HFO detections
Percentage channels responsiblefor 50% of detections
Mean HFO to microdischargesites distance
Expected distance foruniform distribution
1 Wake 9 2.3 N/A N/A
Sleep 15 3.5 N/A N/A
2 Wake 22 4.4 0.71 1.08
Sleep 24 4.4 0.83 1.08
3 Wake 27 4.2 0.46 1.20
Sleep 30 6.3 0.71 1.20
4 Wake 22 4.7 0.19 0.66
Sleep 28 5.8 0.25 0.66
HFOs are limited to small subregions of the MEA, as indicated both by the percentage of recording channels with any HFO detections and the percentage of channelsresponsible for half of HFO detections. HFO clusters also tended to be closer than expected to microdischarge sites, an effect that was found to be significant in eachcase (Wilcoxon signed rank test, P50.01).
Spatial characterization of HFOs Brain 2009: 132; 3047–3059 | 3057
Dow
nloaded from https://academ
ic.oup.com/brain/article/132/11/3047/326739 by guest on 31 January 2022

meet criteria for automated detection. We conclude, then, that
while most HFOs appear to be highly focal, perhaps limited to a
single cortical microdomain, there is a subclass of HFOs that have
a large scale component, most commonly seen in association with
interictal epileptiform events.
High frequency oscillations andinterictal epileptiform eventsLarge-scale HFOEs were associated with macrodischarges 80% of
the time, a rate close to that reported in studies using cortical or
depth macroelectrodes (Urrestarazu et al., 2007; Worrell et al.,
2008). This observation points to the phenomenon of large-scale
HFOEs as a plausible explanation for the ability of depth macro-
electrodes to detect HFOs, an otherwise surprising finding given
the limited size of individual HFOs compared with the recording
area of macroelectrodes.
Microdischarges are limited to small subregions within the
MEA and, as such, probably originate locally (Schevon et al.,
2008). Macrodischarges, however, represent more widespread
epileptiform events and may originate as distant events that
then propagate to the MEA (Fig. 3) (Emerson et al., 1995;
Schevon et al., 2008). While, it is clear from both the prior liter-
ature and the present study that HFOs occur more frequently
within the epileptogenic zone, and that they are prominent in
the epileptogenic zone at the onset of seizures (Jirsch et al.,
2006), our observations of large-scale HFOEs suggest either simul-
taneous initiation of HFO activity in multiple cortical domains
through an as yet undiscovered mechanism, or that the activity
constitutes a local response to a neurally propagated triggering
epileptiform event.
Despite the lack of association between HFOs and micro-
discharges in both the spatial and temporal domains, a relationship
between the two is possible. The distance between HFO and
microdischarge sites was generally less than would be expected
based on a uniform distribution. Bragin et al. (2000) have
hypothesized that during epileptogenesis, tiny ‘pathologically
interconnected neuron clusters’ coalesce to form an epileptogenic
network and generate fast ripples (Bragin et al., 2000). Consistent
with this view, we propose that microdischarges are produced by
locally excitable clusters, and that cortical domains near micro-
discharge sites become primed to produce fast ripples; the latter
are most effectively associated with well developed, propagating
interictal epileptiform events.
High frequency oscillations as markersof epileptogenic cortexMultiple studies have shown fast ripples to be more frequent in
epileptogenic mesial temporal structures than in the unaffected
side; indeed, they may serve as a useful biomarker of epilepto-
genic cortex (Staba et al., 2002; Jacobs et al., 2008; Worrell et al.,
2008). Limited data exist suggesting that the same may be true in
neocortical epilepsy syndromes. Although the number of patients
recorded is small, with only one recorded outside the epileptogenic
zone, the results of our study support this hypothesis. Rates of
HFOs, large-scale HFOEs and the number of channels generating
HFOs were all higher in Patients 2–4, in whom the MEA was
located within the epileptogenic zone, than in Patient 1. The
implant site in Patient 1, while included in the subsequent
standard anterolateral temporal lobectomy, was presumed not to
be epileptogenic due to the absence of interictal epileptiform
activity. Microdischarges, another potential marker of epilepto-
genic cortex, were also absent.
Our findings highlight some of the strengths and limitations of
commonly available methods of sampling HFOs. Sparsely distrib-
uted microwires may miss the strongest HFO-generating sites, and
may be more likely to do so outside of the epileptogenic zone.
Macroelectrodes are most likely to detect large-scale HFOEs,
which are potentially clinically useful as they appear to be the
best predictor of the epileptogenic zone.
ReferencesBikson M, Fox JE, Jefferys JGR. Neuronal aggregate formation
underlies spatiotemporal dynamics of nonsynaptic seizure initiation.
J Neurophysiol 2003; 89: 2330–3.
Bragin A, Azizyan A, Almajano J, Wilson CL, Engel J. Analysis of chronic
seizure onsets after intrahippocampal kainic acid injection in freely
moving rats. Epilepsia 2005; 46: 1592–8.
Bragin A, Engel J, Wilson CL, Fried I, Buzsaki G. High-frequency
oscillations in human brain. Hippocampus 1999; 9: 137–42.
Bragin A, Mody I, Wilson CL, Engel J. Local generation of fast ripples in
epileptic brain. J Neurosci 2002; 22: 2012–21.Bragin A, Wilson CL, Engel J. Spatial stability over time of brain
areas generating fast ripples in the epileptic rat. Epilepsia 2003; 44:
1233–7.Bragin A, Wilson CL, Engel J. Voltage depth profiles of high-frequency
oscillations after kainic acid-induced status epilepticus. Epilepsia 2007;
48: 35–40.
Bragin A, Wilson CL, Engel J Jr. Chronic epileptogenesis requires
development of a network of pathologically interconnected neuron
clusters: a hypothesis. Epilepsia 2000; 41 (Suppl 6): S144–52.
Buzsaki G, Horvath Z, Urioste R, Hetke J, Wise K. High-
frequency network oscillation in the Hippocampus. Science 1992;
256: 1025–27.
Cash SS, Halgren E, Dehghani N, Rossetti AO, Thesen T, Wang C, et al.
The human K-complex represents an isolated cortical down-state.
Science 2009; 324: 1084–7.
Emerson RG, Turner CA, Pedley TA, Walczak TS, Forgione M.
Propagation patterns of temporal spikes. Electroencephal Clin
Neurophysiol 1995; 94: 338–48.
Foffani G, Uzcategui YG, Gal B, Menendez de la Prida L. Reduced spike-
timing reliability correlates with the emergence of fast ripples in the rat
epileptic hippocampus. Neuron 2007; 55: 930–41.
Gibson JR, Beierlein M, Connors BW. Two networks of electrically
coupled inhibitory neurons in neocortex. Nature 1999; 402: 75–9.
Haueisen J, Schack B, Meier T, Curio G, Okada Y. Multiplicity in
the high-frequency signals during the short-latency somatosensory
evoked cortical activity in humans. Clin Neurophysiol 2001; 112:
1316–25.
Hochberg LR, Serruya MD, Friehs GM, Mukand JA, Saleh M, Caplan AH,
et al. Neuronal ensemble control of prosthetic devices by a human
with tetraplegia. Nature 2006; 442: 164–71.House PA, MacDonald JD, Tresco PA, Normann RA. Acute microelec-
trode array implantation into human neocortex: preliminary technique
and histological considerations. Neurosurg Focus 2006; 20: 1–4.Jacobs J, Levan P, Chander R, Hall J, Dubeau F, Gotman J. Interictal
high-frequency oscillations (80-500 Hz) are an indicator of seizure
3058 | Brain 2009: 132; 3047–3059 C. A. Schevon et al.
Dow
nloaded from https://academ
ic.oup.com/brain/article/132/11/3047/326739 by guest on 31 January 2022

onset areas independent of spikes in the human epileptic brain.Epilepsia 2008; 49: 1893–907.
Jirsch JD, Urrestarazu E, LeVan P, Olivier A, Dubeau F, Gotman J. High-
frequency oscillations during human focal seizures. Brain 2006; 129:
1593–608.LeBeau FEN, Traub RD, Monyer H, Whittington MA, Buhl EH. The role
of electrical signaling via gap junctions in the generation of fast
network oscillations. Brain Res Bull 2003; 62: 3–13.
Mountcastle VB. The columnar organization of the neocortex. Brain1997; 120: 701–22.
Niedermeyer E, Lopes da Silva F. Electroencephalography: basic
principles, clinical applications, and related fields. Baltimore, MD:Lippincott Williams & Wilkins; 1999.
Prince DA, Wilder BJ. Control mechanisms in cortical epileptogenic foci.
‘‘Surround’’ inhibition. Arch Neurol 1967; 16: 194–202.
Rosenow F, Luders H. Presurgical evaluation of epilepsy. Brain 2001;124: 1683–700.
Rousche PJ, Normann RA. Chronic recording capability of the Utah
Intracortical Electrode Array in cat sensory cortex. J Neurosci Meth
1998; 82: 1–15.Schevon CA, Ng SK, Cappell J, Goodman RR, McKhann G, Waziri A,
et al. Microphysiology of Epileptiform Activity in Human Neocortex.
J Clin Neurophysiol 2008; 25: 321–30.
Schroeder CE, Steinschneider M, Javitt DC, Tenke CE, Givre SJ,Mehta AD, et al. Localization of ERP generators and identification of
underlying neural processes. Electroencephalogr Clin Neurophysiol
Suppl 1995; 44: 55–75.Schroeder CE, Tenke CE, Givre SJ. Subcortical contributions to the
surface-recorded flash-VEP in the awake macaque.
Electroencephalogr Clin Neurophysiol 1992; 84: 219–31.
Staba RJ, Wilson CL, Bragin A, Fried I, Engel J Jr. Quantitative analysis ofhigh-frequency oscillations (80-500 Hz) recorded in human epileptic
hippocampus and entorhinal cortex. J Neurophysiol 2002; 88:
1743–52.
Steinschneider M, Tenke CE, Schroeder CE. Cellular generators of thecortical auditory evoked potential initial component.
Electroencephalogr Clin Neurophysiol 1992; 84: 196–200.
Suner S, Fellows MR, Vargas-Irwin C, Nakata GK, Donoghue JP.Reliability of signals from a chronically implanted, silicon-based
electrode array in non-human primate primary motor cortex. IEEE
Trans Neural Syst Rehabil Eng 2005; 13: 524–41.
Traub RD, Bibbig A. A model of high-frequency ripples in thehippocampus based on synaptic coupling plus axon-axon gap junctions
between pyramidal neurons. J Neurosci 2000; 20: 2086–93.
Trevelyan AJ. Intrinsic cortical mechanisms which oppose epileptiform
activity: Implications for seizure prediction. In: Schelter B, Schulze-Bonhage A, Timmer J, editors. Seizure prediction in epilepsy – from
basic mechanisms to clinical applications. Berlin: Wiley-VCH; 2008.
Trevelyan AJ, Sussillo D, Watson BO, Yuste R. Modular propagationof epileptiform activity: Evidence for an inhibitory veto in neocortex.
J Neurosci 2006; 26: 12447–55.
Ulbert I, Heit G, Madsen J, Karmos G, Halgren E. Laminar analysis of
human neocortical interictal spike generation and propagation: currentsource density and multiunit analysis in vivo. Epilepsia 2004a; 45:
48–56.
Ulbert I, Magloczky Z, Eross L, Czirjak S, Vajda J, Bognar L, et al. In vivo
laminar electrophysiology co-registered with histology in the hippo-campus of patients with temporal lobe epilepsy. Exp Neurol 2004b;
187: 310–18.
Urrestarazu E, Chander R, Dubeau F, Gotman J. Interictal high-frequency
oscillations (100-500 Hz) in the intracerebral EEG of epileptic patients.Brain 2007; 130: 2354–66.
Wang C, Ulbert I, Schomer DL, Marinkovic K, Halgren E. Responses of
human anterior cingulate cortex microdomains to error detection,conflict monitoring, stimulus-response mapping, familiarity, and
orienting. J Neurosci 2005; 25: 604–13.
Waziri A, Schevon C, Cappell J, Emerson R, McKhann G, Goodman R.
Initial surgical experience with a dense cortical microarray in epilepticpatients undergoing craniotomy for subdural electrode implantation.
Neurosurgery 2009; 64: 540–5; discussion 545.
Worrell GA, Gardner AB, Stead SM, Hu S, Goerss S, Cascino GJ, et al.
High-frequency oscillations in human temporal lobe: simultaneousmicrowire and clinical macroelectrode recordings. Brain 2008; 131:
928–37.
Spatial characterization of HFOs Brain 2009: 132; 3047–3059 | 3059
Dow
nloaded from https://academ
ic.oup.com/brain/article/132/11/3047/326739 by guest on 31 January 2022