Spatial characterization of colonies of the flying fox bat ... · Spatial characterization of...
14
RESEARCH ARTICLE Open Access Spatial characterization of colonies of the flying fox bat, a carrier of Nipah Virus in Thailand Weerapong Thanapongtharm 1,2* , Catherine Linard 2,3 , Witthawat Wiriyarat 4 , Pornpiroon Chinsorn 1 , Budsabong Kanchanasaka 5 , Xiangming Xiao 6,7 , Chandrashekhar Biradar 8 , Robert G Wallace 9 and Marius Gilbert 2,3 Abstract Background: A major reservoir of Nipah virus is believed to be the flying fox genus Pteropus, a fruit bat distributed across many of the world’s tropical and sub-tropical areas. The emergence of the virus and its zoonotic transmission to livestock and humans have been linked to losses in the bat’s habitat. Nipah has been identified in a number of indigenous flying fox populations in Thailand. While no evidence of infection in domestic pigs or people has been found to date, pig farming is an active agricultural sector in Thailand and therefore could be a potential pathway for zoonotic disease transmission from the bat reservoirs. The disease, then, represents a potential zoonotic risk. To characterize the spatial habitat of flying fox populations along Thailand’s Central Plain, and to map potential contact zones between flying fox habitats, pig farms and human settlements, we conducted field observation, remote sensing, and ecological niche modeling to characterize flying fox colonies and their ecological neighborhoods. A Potential Surface Analysis was applied to map contact zones among local epizootic actors. Results: Flying fox colonies are found mainly on Thailand’s Central Plain, particularly in locations surrounded by bodies of water, vegetation, and safe havens such as Buddhist temples. High-risk areas for Nipah zoonosis in pigs include the agricultural ring around the Bangkok metropolitan region where the density of pig farms is high. Conclusions: Passive and active surveillance programs should be prioritized around Bangkok, particularly on farms with low biosecurity, close to water, and/or on which orchards are concomitantly grown. Integration of human and animal health surveillance should be pursued in these same areas. Such proactive planning would help conserve flying fox colonies and should help prevent zoonotic transmission of Nipah and other pathogens. Keywords: Flying foxes, Nipah, Species distribution model, Ensemble modeling, Potential surface analysis Background Habitat loss is the greatest threat to wildlife and bio- diversity. The loss and fragmentation of wildlife habitats can lead to increasing contact among wildlife, domestic animals, and people, potentially leading to the emer- gence and spread of zoonotic diseases [1]. The Nipah virus (NiV) is one such pathogen. The novel RNA para- myxovirus (genus Henipavirus), closely related to Hendra virus, is named after the village Sungai Nipah in the State of Negeri Sembilan, Malaysia from which the virus was first isolated from a human patient in 1998 [2]. In humans, NiV causes Nipah virus infection, presenting a range of clinical outcomes, from asymptomatic infection to acute respiratory syndrome and fatal encephalitis [3]. Investigations of the origins of NiV identified the flying fox genus Pteropus to be a major reservoir [4,5]. Subclin- ical infections have been found in flying fox populations in Malaysia, Cambodia, Thailand and Madagascar [4-8]. Flying foxes are mammals, members of the Pteropididae or fruit bat family, and are the largest of all bats [9]. They are found throughout tropical and sub-tropical Asia and Australia and on islands of the Indian Ocean and the western Pacific [9]. Pteropididae play a crucial role in rain- forest ecosystems [10]. They pollinate flowers and disperse seeds as they forage on the nectar and pollen of plants and on the fruits of rainforest trees and vines [10]. In Thailand, flying foxes are protected by the Wildlife Preservation and Protection Act, B.E. 2535 (1992), which forbids hunting protected wild animals and protects wildlife * Correspondence: [email protected] 1 Department of Livestock Development (DLD), Bangkok, Thailand 2 Lutte biologique et Ecologie spatiale (LUBIES), Université Libre de Bruxelles, Brussels, Belgium Full list of author information is available at the end of the article © 2015 Thanapongtharm et al.; licensee Biomed Central. This is an Open Access article distributed under the terms of the Creative Commons Attribution License (http://creativecommons.org/licenses/by/4.0), which permits unrestricted use, distribution, and reproduction in any medium, provided the original work is properly credited. The Creative Commons Public Domain Dedication waiver (http://creativecommons.org/publicdomain/zero/1.0/) applies to the data made available in this article, unless otherwise stated. Thanapongtharm et al. BMC Veterinary Research (2015) 11:81 DOI 10.1186/s12917-015-0390-0
-
Upload
nguyendieu -
Category
Documents
-
view
218 -
download
0
Transcript of Spatial characterization of colonies of the flying fox bat ... · Spatial characterization of...

Thanapongtharm et al. BMC Veterinary Research (2015) 11:81 DOI 10.1186/s12917-015-0390-0
RESEARCH ARTICLE Open Access
Spatial characterization of colonies of the flyingfox bat, a carrier of Nipah Virus in ThailandWeerapong Thanapongtharm1,2*, Catherine Linard2,3, Witthawat Wiriyarat4, Pornpiroon Chinsorn1,Budsabong Kanchanasaka5, Xiangming Xiao6,7, Chandrashekhar Biradar8, Robert G Wallace9 and Marius Gilbert2,3
Abstract
Background: A major reservoir of Nipah virus is believed to be the flying fox genus Pteropus, a fruit bat distributedacross many of the world’s tropical and sub-tropical areas. The emergence of the virus and its zoonotic transmissionto livestock and humans have been linked to losses in the bat’s habitat. Nipah has been identified in a number ofindigenous flying fox populations in Thailand. While no evidence of infection in domestic pigs or people has beenfound to date, pig farming is an active agricultural sector in Thailand and therefore could be a potential pathwayfor zoonotic disease transmission from the bat reservoirs. The disease, then, represents a potential zoonotic risk. Tocharacterize the spatial habitat of flying fox populations along Thailand’s Central Plain, and to map potential contactzones between flying fox habitats, pig farms and human settlements, we conducted field observation, remotesensing, and ecological niche modeling to characterize flying fox colonies and their ecological neighborhoods. APotential Surface Analysis was applied to map contact zones among local epizootic actors.
Results: Flying fox colonies are found mainly on Thailand’s Central Plain, particularly in locations surrounded bybodies of water, vegetation, and safe havens such as Buddhist temples. High-risk areas for Nipah zoonosis in pigsinclude the agricultural ring around the Bangkok metropolitan region where the density of pig farms is high.
Conclusions: Passive and active surveillance programs should be prioritized around Bangkok, particularly on farmswith low biosecurity, close to water, and/or on which orchards are concomitantly grown. Integration of human andanimal health surveillance should be pursued in these same areas. Such proactive planning would help conserveflying fox colonies and should help prevent zoonotic transmission of Nipah and other pathogens.
Keywords: Flying foxes, Nipah, Species distribution model, Ensemble modeling, Potential surface analysis
BackgroundHabitat loss is the greatest threat to wildlife and bio-diversity. The loss and fragmentation of wildlife habitatscan lead to increasing contact among wildlife, domesticanimals, and people, potentially leading to the emer-gence and spread of zoonotic diseases [1]. The Nipahvirus (NiV) is one such pathogen. The novel RNA para-myxovirus (genus Henipavirus), closely related to Hendravirus, is named after the village Sungai Nipah in the Stateof Negeri Sembilan, Malaysia from which the virus wasfirst isolated from a human patient in 1998 [2]. Inhumans, NiV causes Nipah virus infection, presenting a
* Correspondence: [email protected] of Livestock Development (DLD), Bangkok, Thailand2Lutte biologique et Ecologie spatiale (LUBIES), Université Libre de Bruxelles,Brussels, BelgiumFull list of author information is available at the end of the article
© 2015 Thanapongtharm et al.; licensee BiomCreative Commons Attribution License (http:/distribution, and reproduction in any mediumDomain Dedication waiver (http://creativecomarticle, unless otherwise stated.
range of clinical outcomes, from asymptomatic infectionto acute respiratory syndrome and fatal encephalitis [3].Investigations of the origins of NiV identified the flying
fox genus Pteropus to be a major reservoir [4,5]. Subclin-ical infections have been found in flying fox populationsin Malaysia, Cambodia, Thailand and Madagascar [4-8].Flying foxes are mammals, members of the Pteropididaeor fruit bat family, and are the largest of all bats [9]. Theyare found throughout tropical and sub-tropical Asia andAustralia and on islands of the Indian Ocean and thewestern Pacific [9]. Pteropididae play a crucial role in rain-forest ecosystems [10]. They pollinate flowers and disperseseeds as they forage on the nectar and pollen of plantsand on the fruits of rainforest trees and vines [10]. InThailand, flying foxes are protected by the WildlifePreservation and Protection Act, B.E. 2535 (1992), whichforbids hunting protected wild animals and protects wildlife
ed Central. This is an Open Access article distributed under the terms of the/creativecommons.org/licenses/by/4.0), which permits unrestricted use,, provided the original work is properly credited. The Creative Commons Publicmons.org/publicdomain/zero/1.0/) applies to the data made available in this
Thanapongtharm et al. BMC Veterinary Research (2015) 11:81 Page 2 of 14
sanctuaries. A better understanding of the flying fox andits habitat preferences and dispersal would be a usefulcontribution to its conservation in Thailand. In addition,such an investigation should help efforts in better prevent-ing potential disease transmission.Work outside Thailand shows that in response to
losses in its natural foraging areas, the adaptive Pteropushave turned to foraging in orchards, including thosegrown on pig farms where the NiV it carries are inter-mittently passed to pigs via urine or the contaminationof partially-eaten fruit [4,5,11]. Investigation showed thevirus to subsequently spill over from pigs to other animalsand humans via respiratory droplets or close contact[2,12]. Pig farmers and workers exposed to respiratory ill-ness and encephalitis in pigs were the first group ofhumans infected with the virus [13]. In 1999, abattoirworkers in Singapore developed Nipah virus encephalitis[14]. Investigation showed direct contact with live pigsimported from Malaysia appeared to be the most import-ant risk factor for those infections [15]. In contrast, aretrospective study of human cases in Bangladesh in 1999,the consumption of raw date palm sap proved one of themain risk factors of infection [16-18]. The result suggestsNiV may have passed directly from bats to humanswithout an amplification host, as was apparently thecase in Malaysia [11,12]. Human-to-human transmis-sion was observed in several outbreaks in Bangladeshand India [18-20].The situation of Nipah virus infection in Thailand
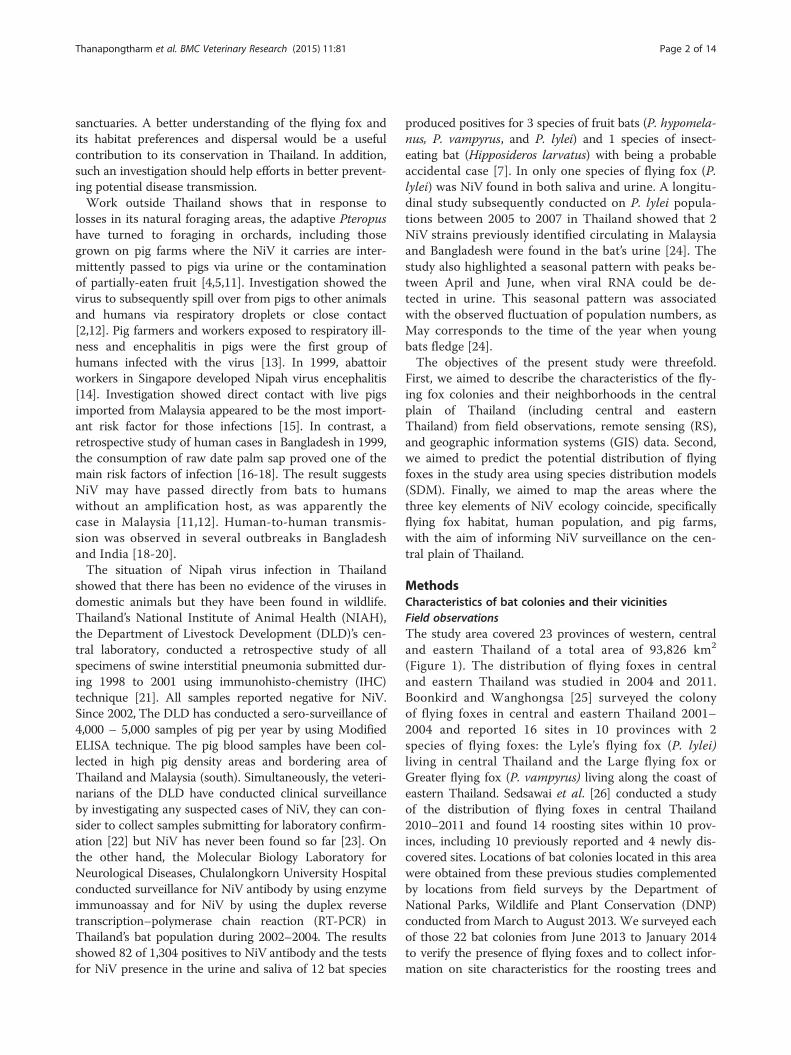
showed that there has been no evidence of the viruses indomestic animals but they have been found in wildlife.Thailand’s National Institute of Animal Health (NIAH),the Department of Livestock Development (DLD)’s cen-tral laboratory, conducted a retrospective study of allspecimens of swine interstitial pneumonia submitted dur-ing 1998 to 2001 using immunohisto-chemistry (IHC)technique [21]. All samples reported negative for NiV.Since 2002, The DLD has conducted a sero-surveillance of4,000 – 5,000 samples of pig per year by using ModifiedELISA technique. The pig blood samples have been col-lected in high pig density areas and bordering area ofThailand and Malaysia (south). Simultaneously, the veteri-narians of the DLD have conducted clinical surveillanceby investigating any suspected cases of NiV, they can con-sider to collect samples submitting for laboratory confirm-ation [22] but NiV has never been found so far [23]. Onthe other hand, the Molecular Biology Laboratory forNeurological Diseases, Chulalongkorn University Hospitalconducted surveillance for NiV antibody by using enzymeimmunoassay and for NiV by using the duplex reversetranscription–polymerase chain reaction (RT-PCR) inThailand’s bat population during 2002–2004. The resultsshowed 82 of 1,304 positives to NiV antibody and the testsfor NiV presence in the urine and saliva of 12 bat species
produced positives for 3 species of fruit bats (P. hypomela-nus, P. vampyrus, and P. lylei) and 1 species of insect-eating bat (Hipposideros larvatus) with being a probableaccidental case [7]. In only one species of flying fox (P.lylei) was NiV found in both saliva and urine. A longitu-dinal study subsequently conducted on P. lylei popula-tions between 2005 to 2007 in Thailand showed that 2NiV strains previously identified circulating in Malaysiaand Bangladesh were found in the bat’s urine [24]. Thestudy also highlighted a seasonal pattern with peaks be-tween April and June, when viral RNA could be de-tected in urine. This seasonal pattern was associatedwith the observed fluctuation of population numbers, asMay corresponds to the time of the year when youngbats fledge [24].The objectives of the present study were threefold.
First, we aimed to describe the characteristics of the fly-ing fox colonies and their neighborhoods in the centralplain of Thailand (including central and easternThailand) from field observations, remote sensing (RS),and geographic information systems (GIS) data. Second,we aimed to predict the potential distribution of flyingfoxes in the study area using species distribution models(SDM). Finally, we aimed to map the areas where thethree key elements of NiV ecology coincide, specificallyflying fox habitat, human population, and pig farms,with the aim of informing NiV surveillance on the cen-tral plain of Thailand.
MethodsCharacteristics of bat colonies and their vicinitiesField observationsThe study area covered 23 provinces of western, centraland eastern Thailand of a total area of 93,826 km2
(Figure 1). The distribution of flying foxes in centraland eastern Thailand was studied in 2004 and 2011.Boonkird and Wanghongsa [25] surveyed the colonyof flying foxes in central and eastern Thailand 2001–2004 and reported 16 sites in 10 provinces with 2species of flying foxes: the Lyle’s flying fox (P. lylei)living in central Thailand and the Large flying fox orGreater flying fox (P. vampyrus) living along the coast ofeastern Thailand. Sedsawai et al. [26] conducted a studyof the distribution of flying foxes in central Thailand2010–2011 and found 14 roosting sites within 10 prov-inces, including 10 previously reported and 4 newly dis-covered sites. Locations of bat colonies located in this areawere obtained from these previous studies complementedby locations from field surveys by the Department ofNational Parks, Wildlife and Plant Conservation (DNP)conducted from March to August 2013. We surveyed eachof those 22 bat colonies from June 2013 to January 2014to verify the presence of flying foxes and to collect infor-mation on site characteristics for the roosting trees and

Figure 1 Study area of flying fox colonies. Study area covering 93,826.2 km2 of 23 provinces across western, central, and eastern Thailand(grey); 22 flying foxes’ colonies (red circles); comparing the size and locations of the study area and Thailand map (right).
Thanapongtharm et al. BMC Veterinary Research (2015) 11:81 Page 3 of 14
their vicinities. We also estimated the margins of eachcolony with a hand-held GPS in order to delineate theirspatial extent polygons.
Descriptive analysesThe GIS layer of the colonies was overlaid on otherlayers, including of bodies of water, human populationdensity, elevation, and land cover. The vector map ofpermanent bodies of water was provided by the Ministryof Transportation. A human population density rastermap at 100 m resolution was obtained from the World-pop project [27]. We used the SRTM elevation databasewith 90 m spatial resolution produced by NASA [28].A land cover map was developed using LANDSAT im-
ages with the Exelis VIS ENVI image processing software.Eleven scenes of the LANDSAT 7 Enhanced ThematicMapper Plus (LANDSAT 7-ETM+) were used to coverthe 23 provinces of the study area (path/row = 131/49-50,130/49-51,129/49-51,128/49-51). The LANDSAT 7 ETM+sensor has six optical spectral bands at 30 m spatialresolution and one panchromatic band at 15 m spatialresolution and a 16 day revisit cycle. We searched theLANDSAT image archive at the United States GeologicalSurvey EROS Data Center (http://glovis.usgs.gov) anddownloaded images with low cloud cover acquired in
January 2014. All images were mosaicked and the mini-mum distance technique supervised classification method[29] was used to classify images into 4 land cover typesmost-related to flying fox habitat, including forest, irri-gated vegetation, settlement/rainfed vegetation, and bodiesof water. The regions of interest (ROIs) were built as clas-sification training sets using ground truth data, 2D scatterplots, visible composition images, and spectral profiles.We evaluated the accuracy of the classes with 100 pointsper class of additional ground truth data and high-resolution data from Google Earth images for accuracy.Overall accuracy was 93%, with 98% accuracy for forest,95% for irrigated vegetation, 91% for settlement/rainfedvegetation, and 86% for bodies of water, results consideredacceptable and sufficient for the analysis.For each bat colony polygon, we estimated summary
descriptive statistics on the environment, geography, andanthropogenic variables. Specifically, we estimated thearea of each colony, the distance from each colony to itsnearest neighbor (another colony), the distance fromeach colony to the nearest body of water, the distancefrom each colony to the nearest temple, the average ele-vation within the colony, the average human populationdensity, the proportion of irrigated vegetation land coverin a 10 km buffer around the colony, and the mean

Thanapongtharm et al. BMC Veterinary Research (2015) 11:81 Page 4 of 14
normalized difference vegetation index (NDVI) withinthe colony acquired from LANDSAT images. The vectormap of Buddhist temples was provided by the Ministryof Transportation.
Species distribution modelsIn this study, we used ensemble modeling (EM) (or con-sensus methods or ensemble forecasting) with the ‘dismo’and ‘raster’ packages in R, which combines the predictionsfrom several different statistical modeling techniques intoa single prediction. Species distribution models (SDM)were initially used to map the ecological suitability for fly-ing fox colonies across the study area. SDM can be usedto predict the geographical distribution of species as afunction of a series of spatial variables, as they relate spe-cies distribution data (occurrence or abundance in knownlocations) to information on the environmental and/orspatial characteristics of those locations [30]. They havebeen widely used both for describing patterns and makingpredictions across terrestrial, freshwater and marine eco-systems [30,31]. Flying fox colonies can occasionally move,and such modeling should allow inferring other areas towhich colonies might move, even those from which theyare presently absent. The variables used to build themodels were selected according to field observations andthe results of the descriptive analysis. This would allow,for example, to map areas where colonies are not presentat the time of the study, but where the colonies may movein the future if they are too disturbed, or if their currenthabitat became degraded. The seven different SDMmethods used in analyses include: Bioclim, Domain, gen-eralized linear model (GLM), generalized additive model(GAM), maximum entropy model (Maxent), boosted re-gression tree (BRT), and random forests (RF). The Bioclimand Domain are presence-only modeling methods. Bio-clim characterizes the occurrences that are located withinthe environmental hyper-space occupied by a species,whereas Domain is a distance-based method that assessesnew locations in terms of their environmental similarity tolocations of presence [32]. The GLM and GAM arepresence-absence models based on the regression frame-work. The GLM is a generalization of ordinary leastsquares regression using maximum likelihood allowingthe linear model to be related to the response variable viaa logit link function. The GAM is an extension of theGLM, where the linear predictor is the sum of smoothingfunctions. It is more flexible and much as machine learn-ing methods can fit very complex functions [33].Maxent, BRT, and RF are machine learning methods
using presence-absence data. Maxent, sometimes mis-leadingly referred to as presence-only methods, actuallydoes require the use of background data [33]. It esti-mates species’ distributions by finding the distribution ofmaximum entropy (i.e. closest to uniform) subject to the
constraint that the expected value of each environmentalvariable (or its transform and/or interactions) under thedistribution matches its empirical average [34]. BRTcombines the strengths of two algorithms, regressiontrees and boosting, creating a single best model from alarge numbers of relatively simple models, each formedby a regression tree [35]. RF combines tree predictorssuch that each tree depends on the values of a randomvector sampled independently and with the same distri-bution for all trees in the forest [36]. When comparedwith other methods, RF shows a very high accuracy, anability to model complex interactions among predictors,and the flexibility to perform several types of statisticalanalysis [37]. The predictions of the seven SDM werethen combined into a single ensemble model predictionby weighting each prediction by the performance of itssource model, a procedure called ensemble modeling(EM) recognized as producing significantly more robustpredictions than all the single models alone [38-42].For three reasons, all our models were subject to 10
bootstraps. First, there was a very low proportion of posi-tive samples in our data set, which can introduce bias intothe logistic regression analysis framework. So for each trialwe bootstrapped a different set of pseudo-absences [33,43].Second, the bootstrapping also aims at preventing over-fitting. That is, we aim at avoiding modeling the noise ra-ther than the main pattern in the data by assemblingacross a population of models trained with different sub-sets of data. Third, the pseudo-absences were distributedwithin a given distance of the presence sites. We wantedto bootstrap through different distance values. The 10 setsof absence data were randomly selected from the back-ground and from 6–15 kilometers beyond the presencesites. Then each set was randomly selected again and di-vided into two parts equally: a model set used to train themodel and a test set used to evaluate the models. Thesewere then used as weights in combining the methods.Nine times the number of positives was randomly selectedat each bootstrap to maintain 10% of the positive values ofthe outcome variable. This 10% ratio was chosen becauseprevious studies compared the various prevalences acrossmodels and reported that GAM was not influenced byprevalence, whereas the accuracy increased up to anasymptote when the number of presences reached onetenth of the number of absences for GLM, BRT, and RF[33]. All predictor variables were simultaneously tested inthe models.The performance of the models was evaluated using
the area under the curve (AUC) of the receiver operatingcharacteristics (ROC) plots. AUC is a quantitative meas-ure of the overall fit of models that varies from 0.5(chance event) to 1.0 (perfect fit) [44]. Although AUCwas recently criticized as an absolute measure of good-ness of fit by many authors, it remains valuable in
Thanapongtharm et al. BMC Veterinary Research (2015) 11:81 Page 5 of 14
comparing the performances of several models tested onthe same data set [32].
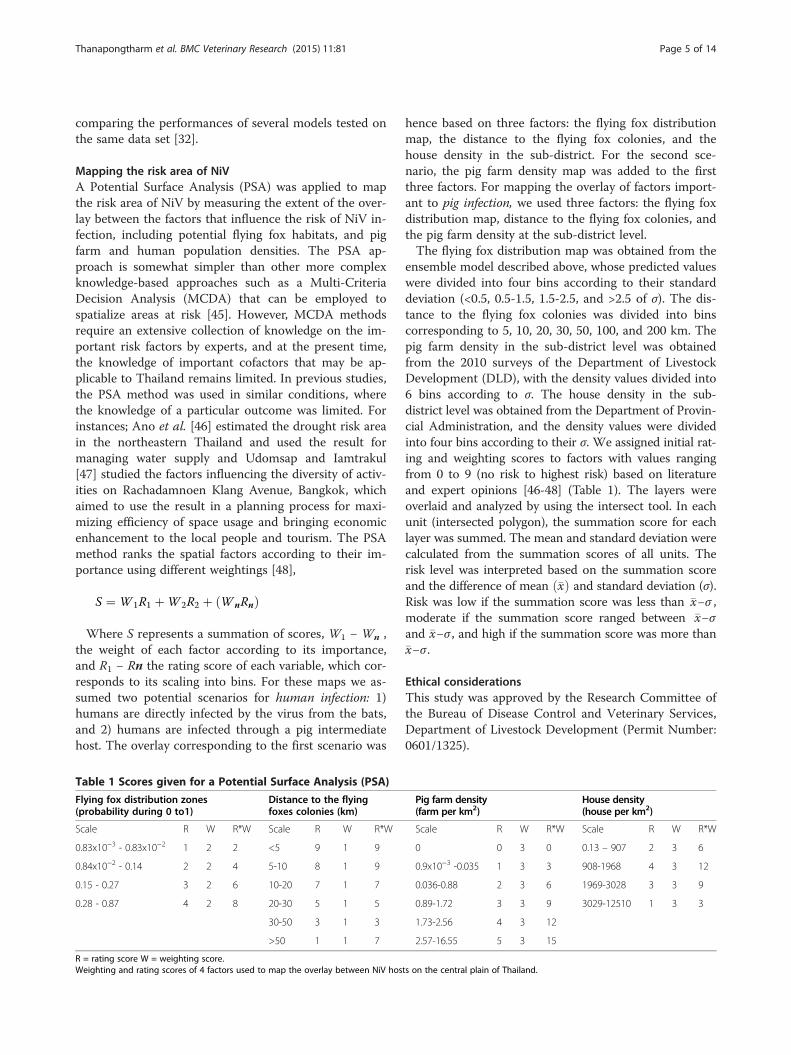
Mapping the risk area of NiVA Potential Surface Analysis (PSA) was applied to mapthe risk area of NiV by measuring the extent of the over-lay between the factors that influence the risk of NiV in-fection, including potential flying fox habitats, and pigfarm and human population densities. The PSA ap-proach is somewhat simpler than other more complexknowledge-based approaches such as a Multi-CriteriaDecision Analysis (MCDA) that can be employed tospatialize areas at risk [45]. However, MCDA methodsrequire an extensive collection of knowledge on the im-portant risk factors by experts, and at the present time,the knowledge of important cofactors that may be ap-plicable to Thailand remains limited. In previous studies,the PSA method was used in similar conditions, wherethe knowledge of a particular outcome was limited. Forinstances; Ano et al. [46] estimated the drought risk areain the northeastern Thailand and used the result formanaging water supply and Udomsap and Iamtrakul[47] studied the factors influencing the diversity of activ-ities on Rachadamnoen Klang Avenue, Bangkok, whichaimed to use the result in a planning process for maxi-mizing efficiency of space usage and bringing economicenhancement to the local people and tourism. The PSAmethod ranks the spatial factors according to their im-portance using different weightings [48],
S ¼ W 1R1 þW 2R2 þ W nRnð Þ
Where S represents a summation of scores, W1 − Wn ,the weight of each factor according to its importance,and R1 − Rn the rating score of each variable, which cor-responds to its scaling into bins. For these maps we as-sumed two potential scenarios for human infection: 1)humans are directly infected by the virus from the bats,and 2) humans are infected through a pig intermediatehost. The overlay corresponding to the first scenario was
Table 1 Scores given for a Potential Surface Analysis (PSA)
Flying fox distribution zones(probability during 0 to1)
Distance to the flyingfoxes colonies (km)
Scale R W R*W Scale R W R*W
0.83x10⁻³ - 0.83x10⁻² 1 2 2 <5 9 1 9
0.84x10⁻² - 0.14 2 2 4 5-10 8 1 9
0.15 - 0.27 3 2 6 10-20 7 1 7
0.28 - 0.87 4 2 8 20-30 5 1 5
30-50 3 1 3
>50 1 1 7
R = rating score W = weighting score.Weighting and rating scores of 4 factors used to map the overlay between NiV hos
hence based on three factors: the flying fox distributionmap, the distance to the flying fox colonies, and thehouse density in the sub-district. For the second sce-nario, the pig farm density map was added to the firstthree factors. For mapping the overlay of factors import-ant to pig infection, we used three factors: the flying foxdistribution map, distance to the flying fox colonies, andthe pig farm density at the sub-district level.The flying fox distribution map was obtained from the
ensemble model described above, whose predicted valueswere divided into four bins according to their standarddeviation (<0.5, 0.5-1.5, 1.5-2.5, and >2.5 of σ). The dis-tance to the flying fox colonies was divided into binscorresponding to 5, 10, 20, 30, 50, 100, and 200 km. Thepig farm density in the sub-district level was obtainedfrom the 2010 surveys of the Department of LivestockDevelopment (DLD), with the density values divided into6 bins according to σ. The house density in the sub-district level was obtained from the Department of Provin-cial Administration, and the density values were dividedinto four bins according to their σ. We assigned initial rat-ing and weighting scores to factors with values rangingfrom 0 to 9 (no risk to highest risk) based on literatureand expert opinions [46-48] (Table 1). The layers wereoverlaid and analyzed by using the intersect tool. In eachunit (intersected polygon), the summation score for eachlayer was summed. The mean and standard deviation werecalculated from the summation scores of all units. Therisk level was interpreted based on the summation scoreand the difference of mean �xð Þ and standard deviation (σ).Risk was low if the summation score was less than �x−σ ,moderate if the summation score ranged between �x−σand �x−σ , and high if the summation score was more than�x−σ .
Ethical considerationsThis study was approved by the Research Committee ofthe Bureau of Disease Control and Veterinary Services,Department of Livestock Development (Permit Number:0601/1325).
Pig farm density(farm per km2)
House density(house per km2)
Scale R W R*W Scale R W R*W
0 0 3 0 0.13 – 907 2 3 6
0.9x10⁻³ -0.035 1 3 3 908-1968 4 3 12
0.036-0.88 2 3 6 1969-3028 3 3 9
0.89-1.72 3 3 9 3029-12510 1 3 3
1.73-2.56 4 3 12
2.57-16.55 5 3 15
ts on the central plain of Thailand.
Thanapongtharm et al. BMC Veterinary Research (2015) 11:81 Page 6 of 14
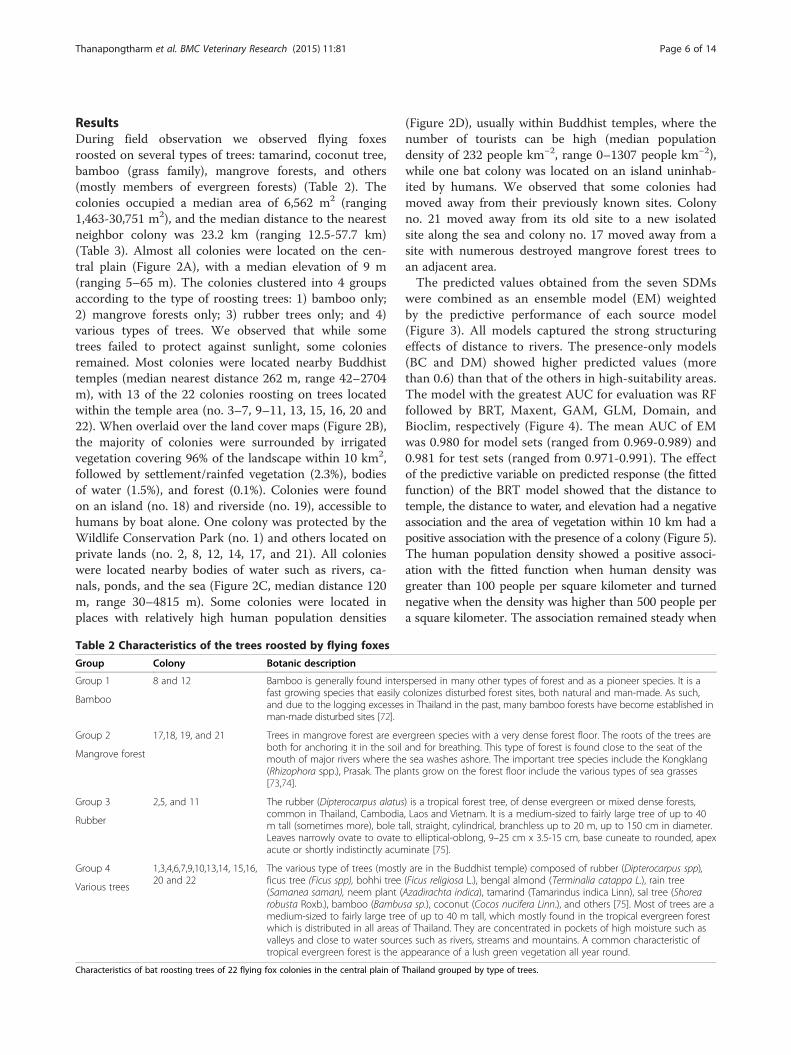
ResultsDuring field observation we observed flying foxesroosted on several types of trees: tamarind, coconut tree,bamboo (grass family), mangrove forests, and others(mostly members of evergreen forests) (Table 2). Thecolonies occupied a median area of 6,562 m2 (ranging1,463-30,751 m2), and the median distance to the nearestneighbor colony was 23.2 km (ranging 12.5-57.7 km)(Table 3). Almost all colonies were located on the cen-tral plain (Figure 2A), with a median elevation of 9 m(ranging 5–65 m). The colonies clustered into 4 groupsaccording to the type of roosting trees: 1) bamboo only;2) mangrove forests only; 3) rubber trees only; and 4)various types of trees. We observed that while sometrees failed to protect against sunlight, some coloniesremained. Most colonies were located nearby Buddhisttemples (median nearest distance 262 m, range 42–2704m), with 13 of the 22 colonies roosting on trees locatedwithin the temple area (no. 3–7, 9–11, 13, 15, 16, 20 and22). When overlaid over the land cover maps (Figure 2B),the majority of colonies were surrounded by irrigatedvegetation covering 96% of the landscape within 10 km2,followed by settlement/rainfed vegetation (2.3%), bodiesof water (1.5%), and forest (0.1%). Colonies were foundon an island (no. 18) and riverside (no. 19), accessible tohumans by boat alone. One colony was protected by theWildlife Conservation Park (no. 1) and others located onprivate lands (no. 2, 8, 12, 14, 17, and 21). All colonieswere located nearby bodies of water such as rivers, ca-nals, ponds, and the sea (Figure 2C, median distance 120m, range 30–4815 m). Some colonies were located inplaces with relatively high human population densities
Table 2 Characteristics of the trees roosted by flying foxes
Group Colony Botanic description
Group 1 8 and 12 Bamboo is generally found interfast growing species that easilyand due to the logging excessesman-made disturbed sites [72].
Bamboo
Group 2 17,18, 19, and 21 Trees in mangrove forest are evboth for anchoring it in the soilmouth of major rivers where the(Rhizophora spp.), Prasak. The pla[73,74].
Mangrove forest
Group 3 2,5, and 11 The rubber (Dipterocarpus alatuscommon in Thailand, Cambodiam tall (sometimes more), bole taLeaves narrowly ovate to ovateacute or shortly indistinctly acum
Rubber
Group 4 1,3,4,6,7,9,10,13,14, 15,16,20 and 22
The various type of trees (mostlficus tree (Ficus spp), bohhi tree(Samanea saman), neem plant (robusta Roxb.), bamboo (Bambumedium-sized to fairly large treewhich is distributed in all areasvalleys and close to water sourctropical evergreen forest is the a
Various trees
Characteristics of bat roosting trees of 22 flying fox colonies in the central plain of
(Figure 2D), usually within Buddhist temples, where thenumber of tourists can be high (median populationdensity of 232 people km−2, range 0–1307 people km−2),while one bat colony was located on an island uninhab-ited by humans. We observed that some colonies hadmoved away from their previously known sites. Colonyno. 21 moved away from its old site to a new isolatedsite along the sea and colony no. 17 moved away from asite with numerous destroyed mangrove forest trees toan adjacent area.The predicted values obtained from the seven SDMs
were combined as an ensemble model (EM) weightedby the predictive performance of each source model(Figure 3). All models captured the strong structuringeffects of distance to rivers. The presence-only models(BC and DM) showed higher predicted values (morethan 0.6) than that of the others in high-suitability areas.The model with the greatest AUC for evaluation was RFfollowed by BRT, Maxent, GAM, GLM, Domain, andBioclim, respectively (Figure 4). The mean AUC of EMwas 0.980 for model sets (ranged from 0.969-0.989) and0.981 for test sets (ranged from 0.971-0.991). The effectof the predictive variable on predicted response (the fittedfunction) of the BRT model showed that the distance totemple, the distance to water, and elevation had a negativeassociation and the area of vegetation within 10 km had apositive association with the presence of a colony (Figure 5).The human population density showed a positive associ-ation with the fitted function when human density wasgreater than 100 people per square kilometer and turnednegative when the density was higher than 500 people pera square kilometer. The association remained steady when
spersed in many other types of forest and as a pioneer species. It is acolonizes disturbed forest sites, both natural and man-made. As such,in Thailand in the past, many bamboo forests have become established in
ergreen species with a very dense forest floor. The roots of the trees areand for breathing. This type of forest is found close to the seat of thesea washes ashore. The important tree species include the Kongklangnts grow on the forest floor include the various types of sea grasses
) is a tropical forest tree, of dense evergreen or mixed dense forests,, Laos and Vietnam. It is a medium-sized to fairly large tree of up to 40ll, straight, cylindrical, branchless up to 20 m, up to 150 cm in diameter.to elliptical-oblong, 9–25 cm x 3.5-15 cm, base cuneate to rounded, apexinate [75].
y are in the Buddhist temple) composed of rubber (Dipterocarpus spp),(Ficus religiosa L.), bengal almond (Terminalia catappa L.), rain treeAzadirachta indica), tamarind (Tamarindus indica Linn), sal tree (Shoreasa sp.), coconut (Cocos nucifera Linn.), and others [75]. Most of trees are aof up to 40 m tall, which mostly found in the tropical evergreen forest
of Thailand. They are concentrated in pockets of high moisture such ases such as rivers, streams and mountains. A common characteristic ofppearance of a lush green vegetation all year round.
Thailand grouped by type of trees.
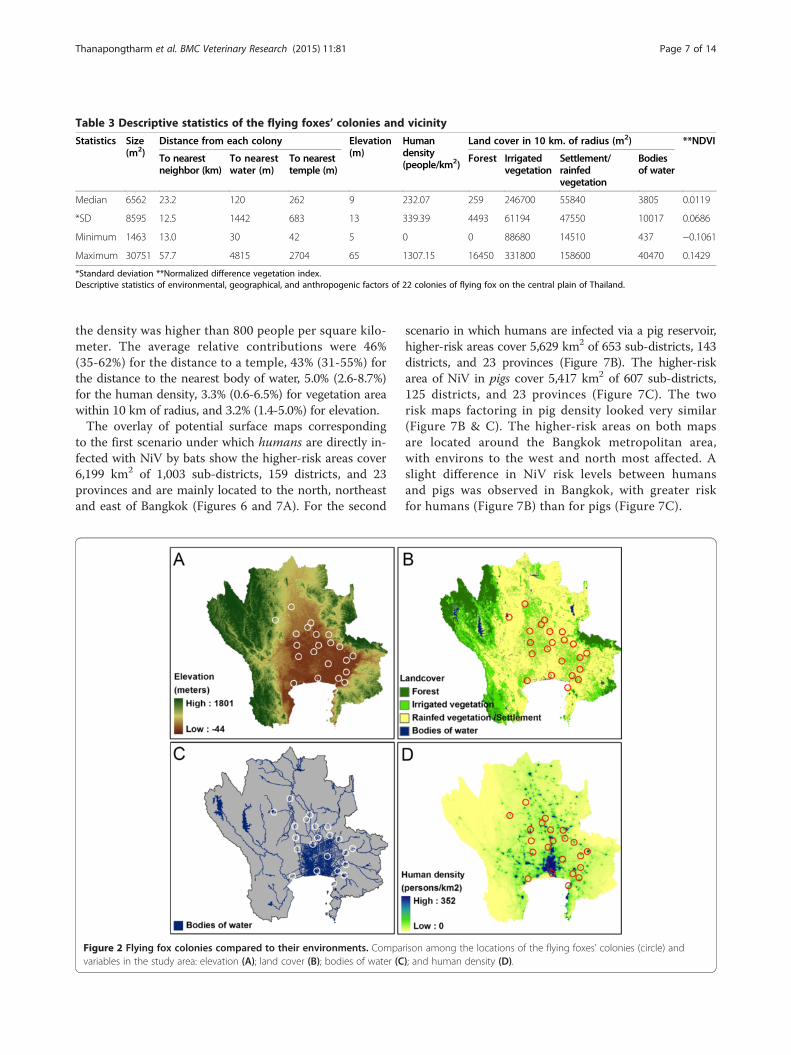
Table 3 Descriptive statistics of the flying foxes’ colonies and vicinity
Statistics Size(m2)
Distance from each colony Elevation(m)
Humandensity(people/km2)
Land cover in 10 km. of radius (m2) **NDVI
To nearestneighbor (km)
To nearestwater (m)
To nearesttemple (m)
Forest Irrigatedvegetation
Settlement/rainfedvegetation
Bodiesof water
Median 6562 23.2 120 262 9 232.07 259 246700 55840 3805 0.0119
*SD 8595 12.5 1442 683 13 339.39 4493 61194 47550 10017 0.0686
Minimum 1463 13.0 30 42 5 0 0 88680 14510 437 −0.1061
Maximum 30751 57.7 4815 2704 65 1307.15 16450 331800 158600 40470 0.1429
*Standard deviation **Normalized difference vegetation index.Descriptive statistics of environmental, geographical, and anthropogenic factors of 22 colonies of flying fox on the central plain of Thailand.
Thanapongtharm et al. BMC Veterinary Research (2015) 11:81 Page 7 of 14
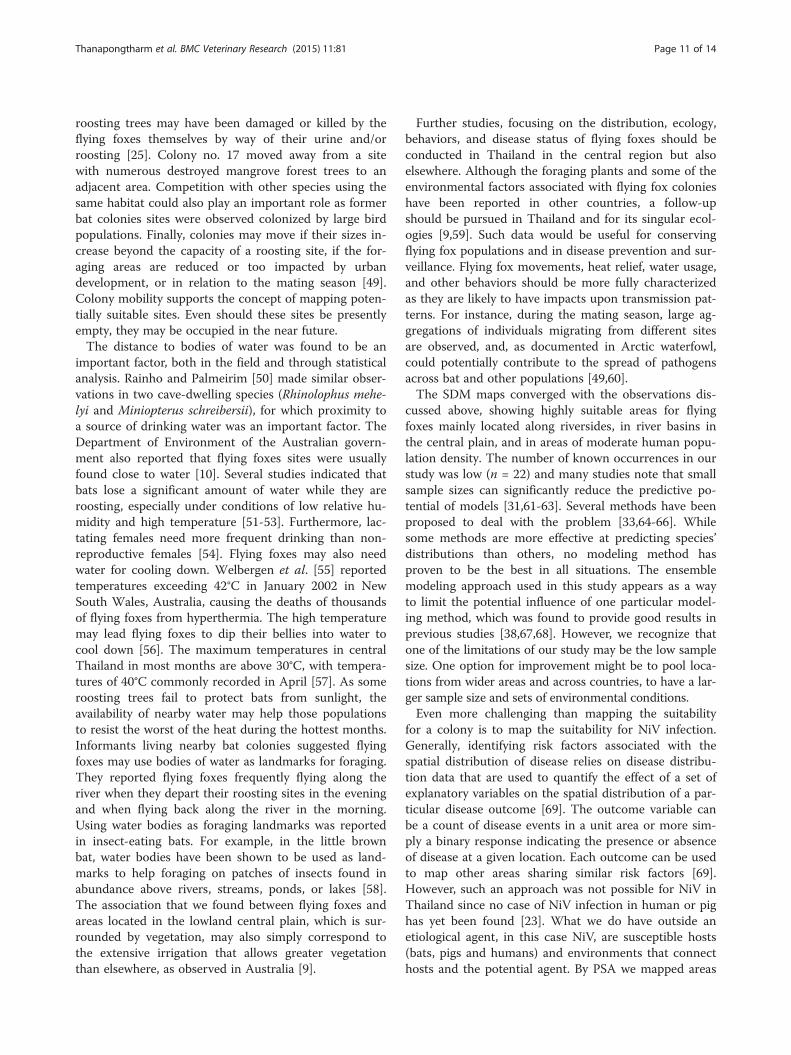
the density was higher than 800 people per square kilo-meter. The average relative contributions were 46%(35-62%) for the distance to a temple, 43% (31-55%) forthe distance to the nearest body of water, 5.0% (2.6-8.7%)for the human density, 3.3% (0.6-6.5%) for vegetation areawithin 10 km of radius, and 3.2% (1.4-5.0%) for elevation.The overlay of potential surface maps corresponding
to the first scenario under which humans are directly in-fected with NiV by bats show the higher-risk areas cover6,199 km2 of 1,003 sub-districts, 159 districts, and 23provinces and are mainly located to the north, northeastand east of Bangkok (Figures 6 and 7A). For the second
Figure 2 Flying fox colonies compared to their environments. Compavariables in the study area: elevation (A); land cover (B); bodies of water (C
scenario in which humans are infected via a pig reservoir,higher-risk areas cover 5,629 km2 of 653 sub-districts, 143districts, and 23 provinces (Figure 7B). The higher-riskarea of NiV in pigs cover 5,417 km2 of 607 sub-districts,125 districts, and 23 provinces (Figure 7C). The tworisk maps factoring in pig density looked very similar(Figure 7B & C). The higher-risk areas on both mapsare located around the Bangkok metropolitan area,with environs to the west and north most affected. Aslight difference in NiV risk levels between humansand pigs was observed in Bangkok, with greater riskfor humans (Figure 7B) than for pigs (Figure 7C).
rison among the locations of the flying foxes’ colonies (circle) and); and human density (D).

Figure 3 Predicted suitability maps for flying fox colonies on the central plain of Thailand. The maps explained by Bioclim (BC), Domain(DM), Generalized Linear Model (GLM), Generalized Additive Model (GAM), Maximum Entropy Model (MAX), Boosted Regression Tree (BRT), andRandom Forest (RF). The large map shows the Ensemble model (EM) output obtained by combining the 7 SDMs weighted by their respectivepredictive performance.
Figure 4 The predictive performance of 7 species distribution models. Box plots showing the predictive performance of 7 SDMs evaluatedusing the area under the curve (AUC) of ROC plots for the model sets (left) and test sets (right).
Thanapongtharm et al. BMC Veterinary Research (2015) 11:81 Page 8 of 14

Figure 5 Fitted functions and relative contributions of variables predicted by the BRT. Partial dependence plots show the effect of apredictive variable on the response after accounting for the average effects of all other variables in the model: distance to water (A); distance totemple (B); human density (C); amount of vegetation area within 10 km radius (D); and elevation (E). The relative contributions of each variablefrom the BRT is shown in (F).
Figure 6 Factors used in mapping NiV risk. Maps of 4 factors used for analyzing the risk map of NiV in the central plain of Thailand: flying foxdistribution map (A); distance to the flying foxes colonies (B); pig farm density at the sub-district level (C); house density at the sub-districtlevel (D).
Thanapongtharm et al. BMC Veterinary Research (2015) 11:81 Page 9 of 14

Figure 7 Risk area of NiV in the central plain of Thailand. Risk area of NiV produced by Potential Surface Analysis (PSA) based on i) flying foxdistribution map, ii) distance to flying fox colonies, iii) house density and iv) pig farm density. The risk area of NiV for humans obtained from thefirst 3 factors (A), from all 4 factors (B), and the risk area of NiV for pigs produced by combining factors i, ii and iv (C). The yellow circles showdifferent risk areas between B and C. Risk was low if the summation score was less than �x−σ, moderate if the summation score was rangebetween �x−σ and �x−σ, and high if the summation score was more than �x−σ.
Thanapongtharm et al. BMC Veterinary Research (2015) 11:81 Page 10 of 14
DiscussionOur field observations indicated that flying foxes choosea variety of tree types, especially members of evergreenforests, for roosting, even if the trees no longer protectthe bats from sunlight. The observations are supportedby remote sensing, showing a normalized differencevegetation index acquired from January 2014 LANDSATimagery with relatively low values at some of the roost-ing sites. This suggests flying foxes prefer evergreen for-ests to protect themselves from the sunlight whileroosting, but also show a tolerance to trees damaged bybat urine and roosting [25]. We found roosting sites inrelatively safe places, including Buddhist temples,islands, the Wildlife Conservation Park, and privatelands, as marked by SDMs that included distance to atemple as an important predictor. Even as flying foxesare protected by the Wildlife Preservation and Protec-tion Act, B.E. 2535 (1992), they are still threatened byhuman hunting, efforts to protect fruit orchards, and in-formal efforts at disease prevention. Most of the popula-tion is Buddhist (>90%) and would largely refrain fromthreatening animals in the vicinity of temples. Human
density appears to correspond positively with roostingsites for temple communities but is negatively associatedfor the greatest densities in and around urban areas.Some bat colonies are located in private lands and studyinformants indicated landlords and/or the people in thelocal community around these sites had tried to protectthe bats against hunters. Finally, the other colonies werelocated in isolated areas such as islands, riverside, and atseaside that are hard to reach by hunters. The WildlifeConservation Park is closed off as a unit of wildlife con-servation. Therefore, all bat colonies, across a variety oflocales, were protected from hunters for an array of rea-sons, including cultural practices, ownership, local senti-ment, and remoteness.The distribution of flying fox colonies is dynamic and
changes are observed over time. In 2004–2014, new col-onies were observed and a few colonies moved awayfrom their previously known sites [26]. Apart from dis-turbances caused by hunters, other factors may triggercolony migration. Disturbance by visitors or tourists isassumed to have caused colony no. 21 to move awayfrom its old site to a new isolated site seaside. The
Thanapongtharm et al. BMC Veterinary Research (2015) 11:81 Page 11 of 14
roosting trees may have been damaged or killed by theflying foxes themselves by way of their urine and/orroosting [25]. Colony no. 17 moved away from a sitewith numerous destroyed mangrove forest trees to anadjacent area. Competition with other species using thesame habitat could also play an important role as formerbat colonies sites were observed colonized by large birdpopulations. Finally, colonies may move if their sizes in-crease beyond the capacity of a roosting site, if the for-aging areas are reduced or too impacted by urbandevelopment, or in relation to the mating season [49].Colony mobility supports the concept of mapping poten-tially suitable sites. Even should these sites be presentlyempty, they may be occupied in the near future.The distance to bodies of water was found to be an
important factor, both in the field and through statisticalanalysis. Rainho and Palmeirim [50] made similar obser-vations in two cave-dwelling species (Rhinolophus mehe-lyi and Miniopterus schreibersii), for which proximity toa source of drinking water was an important factor. TheDepartment of Environment of the Australian govern-ment also reported that flying foxes sites were usuallyfound close to water [10]. Several studies indicated thatbats lose a significant amount of water while they areroosting, especially under conditions of low relative hu-midity and high temperature [51-53]. Furthermore, lac-tating females need more frequent drinking than non-reproductive females [54]. Flying foxes may also needwater for cooling down. Welbergen et al. [55] reportedtemperatures exceeding 42°C in January 2002 in NewSouth Wales, Australia, causing the deaths of thousandsof flying foxes from hyperthermia. The high temperaturemay lead flying foxes to dip their bellies into water tocool down [56]. The maximum temperatures in centralThailand in most months are above 30°C, with tempera-tures of 40°C commonly recorded in April [57]. As someroosting trees fail to protect bats from sunlight, theavailability of nearby water may help those populationsto resist the worst of the heat during the hottest months.Informants living nearby bat colonies suggested flyingfoxes may use bodies of water as landmarks for foraging.They reported flying foxes frequently flying along theriver when they depart their roosting sites in the eveningand when flying back along the river in the morning.Using water bodies as foraging landmarks was reportedin insect-eating bats. For example, in the little brownbat, water bodies have been shown to be used as land-marks to help foraging on patches of insects found inabundance above rivers, streams, ponds, or lakes [58].The association that we found between flying foxes andareas located in the lowland central plain, which is sur-rounded by vegetation, may also simply correspond tothe extensive irrigation that allows greater vegetationthan elsewhere, as observed in Australia [9].
Further studies, focusing on the distribution, ecology,behaviors, and disease status of flying foxes should beconducted in Thailand in the central region but alsoelsewhere. Although the foraging plants and some of theenvironmental factors associated with flying fox colonieshave been reported in other countries, a follow-upshould be pursued in Thailand and for its singular ecol-ogies [9,59]. Such data would be useful for conservingflying fox populations and in disease prevention and sur-veillance. Flying fox movements, heat relief, water usage,and other behaviors should be more fully characterizedas they are likely to have impacts upon transmission pat-terns. For instance, during the mating season, large ag-gregations of individuals migrating from different sitesare observed, and, as documented in Arctic waterfowl,could potentially contribute to the spread of pathogensacross bat and other populations [49,60].The SDM maps converged with the observations dis-
cussed above, showing highly suitable areas for flyingfoxes mainly located along riversides, in river basins inthe central plain, and in areas of moderate human popu-lation density. The number of known occurrences in ourstudy was low (n = 22) and many studies note that smallsample sizes can significantly reduce the predictive po-tential of models [31,61-63]. Several methods have beenproposed to deal with the problem [33,64-66]. Whilesome methods are more effective at predicting species’distributions than others, no modeling method hasproven to be the best in all situations. The ensemblemodeling approach used in this study appears as a wayto limit the potential influence of one particular model-ing method, which was found to provide good results inprevious studies [38,67,68]. However, we recognize thatone of the limitations of our study may be the low samplesize. One option for improvement might be to pool loca-tions from wider areas and across countries, to have a lar-ger sample size and sets of environmental conditions.Even more challenging than mapping the suitability
for a colony is to map the suitability for NiV infection.Generally, identifying risk factors associated with thespatial distribution of disease relies on disease distribu-tion data that are used to quantify the effect of a set ofexplanatory variables on the spatial distribution of a par-ticular disease outcome [69]. The outcome variable canbe a count of disease events in a unit area or more sim-ply a binary response indicating the presence or absenceof disease at a given location. Each outcome can be usedto map other areas sharing similar risk factors [69].However, such an approach was not possible for NiV inThailand since no case of NiV infection in human or pighas yet been found [23]. What we do have outside anetiological agent, in this case NiV, are susceptible hosts(bats, pigs and humans) and environments that connecthosts and the potential agent. By PSA we mapped areas

Thanapongtharm et al. BMC Veterinary Research (2015) 11:81 Page 12 of 14
where the virus’s documented reservoirs potentially co-incide. The approach has not been used in epidemio-logical study but may be useful in the absence of diseasedata, as a way to spatialize disease surveillance and re-gionally plan livestock production. Even though it hasnot been used in epidemiological study and is not basedon a formal statistical model, it remained useful in thepresent case of a disease that is absent (and hence pro-vides no data to train a model) as a way to integrate dif-ferent factors in a risk map that can inform furtherplanning and disease surveillance in a context of verylimited knowledge. A limitation of the approach is, how-ever, the somewhat arbitrary choices on weights that aremade along the process, that are defined in a more ex-plicit and thorough way in using MCDA approaches. Ul-timately, the spatial validity of both approaches couldonly be formally evaluated in retrospect, if NiV infectionwere eventually identified in the country.
ConclusionsBroad-scale delineation of areas where three potentialhost types—bat, pig and human—are present could im-prove NiV surveillance strategy [70]. Indeed, in a contextof limited financial support for animal disease surveil-lance systems, a more optimal use of resources could beimplemented if active surveillance is targeted at higher-risk farms or areas [70]. One approach could circlearound developing passive and active surveillance pro-grams on pig farms of predicted risk, for example, withparticular focus on farms of low biosecurity, nearby bod-ies of water, and/or hosting orchards as additional riskfactors [11]. The surveillance program should be inte-grated with those for other diseases to reduce cost andmanpower. Simultaneously, such surveillance effortscould be reinforced with enhanced communication ongood farm management practices and public awarenesscampaigns.In addition, preventing direct transmission of NiV from
bats to humans could be adapted to the characteristichabitats identified in this study. For instance, it is apparentthat flying foxes on the central plain of Thailand are foundin particular conditions in spatial (e.g., distance to water,vegetation) and social terms (e.g., undisturbed environ-ment and community). An active surveillance programcould be conducted on the people who live closely to fly-ing fox colonies. A new colony detected in 2011 (no. 17) issurrounded by commercial orchards, in particular coconuttrees [26]. Testing NiV in a fresh coconut-palm sugar,usually produced by leaving a container on the trees over-night, may be useful for a focal study. In Bangladesh, sapharvesters were encouraged to use bamboo skirts on theirtrees to prevent contacts between fruit bats and raw datepalm sap. Authorities educated locals to avoid drinkingraw date palm sap or eat partially eaten fruit, and these
efforts could be adapted for Thailand [71]. Finally, thecentral plain of Thailand is an area with intense farmingactivities, including pig husbandry, reflecting strongly theconvergence across multiple risk models here. Surveil-lance programs in pigs and humans should be integratedto mutually increase their effectiveness.
Competing interestsThe authors declare that they have no competing interests.
Authors’ contributionsWT and MG conceived and designed the study. WT generated the raw dataand performed statistical analysis with contributions from MG, CL, XX, andCB. WT drafted the paper, which MG, CL and RW critically reviewed. PC, WW,and BK provided raw data. All authors read and approved the finalmanuscript.
AcknowledgementsPart of this work was supported through the NIH NIAID grant(1R01AI101028-01A1). We thank the staff of the Department of LivestockDevelopment (DLD) for conducting the surveillance on the animals; NationalInstitute of Animal Health (NIAH) and Regional Veterinary Research andDevelopment Centers for evaluating the NiV; Ministry of Transportation forgeodata; Department of Provincial Administration, Ministry of Interior forpopulation data; and Department of National Parks, Wildlife and PlantConservation, Ministry of Resources and Environment for location data forthe fruit bats. We also thank colleagues at Lutte biologique et Ecologiespatiale (LUBIES), ULB, Belgium, for assistance and suggestions.
Author details1Department of Livestock Development (DLD), Bangkok, Thailand. 2Luttebiologique et Ecologie spatiale (LUBIES), Université Libre de Bruxelles,Brussels, Belgium. 3Fonds National de la Recherche Scientifique (FNRS),Brussels, Belgium. 4The Monitoring and Surveillance Center for ZoonoticDiseases in Wildlife and Exotic Animals (MOZWE), Mahidol University,Nakhonpatom, Thailand. 5Department of National Parks, Wildlife, and PlantConservation, Bangkok, Thailand. 6Department of Microbiology and PlantBiology, Center for Spatial Analysis, University of Oklahoma, Norman, OK73019, USA. 7Institute of Biodiversity Science, Fudan University, Shanghai200433, China. 8International Center for Agricultural Research in Dry Areas(ICARDA), Amman, Jordan. 9Institute for Global Studies, University ofMinnesota, Minneapolis, USA.
Received: 8 September 2014 Accepted: 10 March 2015
References1. Suzán G, Marcé E, Giermakowski JT, Armién B, Pascale J, Mills J, et al. The
effect of habitat fragmentation and species diversity loss on hantavirusPrevalence in Panama. Ann N Y Acad Sci. 2008;1149:80–3.
2. Mohd Nor MN, Gan CH, Ong BL. Nipah virus infection of pigs in peninsularMalaysia. Rev Sci Tech Int Off Epizoot. 2000;19:160–5.
3. WHO | Nipah Virus (NiV) Infection [http://www.who.int/csr/disease/nipah/en/]4. Chua KB, Lek Koh C, Hooi PS, Wee KF, Khong JH, Chua BH, et al. Isolation of
Nipah virus from Malaysian Island flying-foxes. Microbes Infect. 2002;4:145–51.5. Mohd Yob J, Hume F, Azmin Mohd R, Christopher M, Van Der Heide B, Paul
R, et al. Nipah virus infection in bats (order Chiroptera) in peninsularMalaysia. Emergin Infect Dis. 2001;7:439–41.
6. Reynes J-M, Counor D, Ong S, Faure C, Seng V, Molia S, et al. Nipah virus inLyle’s flying foxes, Cambodia. Emerg Infect Dis. 2005;11:1042–7.
7. Wacharapluesadee S, Lumlertdacha B, Boongird K, Wanghongsa S,Chanhome L, Rollin P, et al. Bat Nipah Virus, Thailand. Emerg Infect Dis.2005;11:1949–51.
8. Iehlé C, Razafitrimo G, Razainirina J, Andriaholinirina N, Goodman SM, FaureC, et al. Henipavirus and tioman virus antibodies in pteropodid bats,Madagascar. Emerg Infect Dis. 2007;13:159–61.
9. DEPI - Flying-foxes [http://www.depi.vic.gov.au/environment-and-wildlife/wildlife/flying-foxes]
10. Flying-foxes and national environmental law [http://www.environment.gov.au/node/16394]

Thanapongtharm et al. BMC Veterinary Research (2015) 11:81 Page 13 of 14
11. Chua K, Chua B, Wang C. Anthropogenic deforestation, El Niño and theemergence of Nipah virus in Malaysia. Malays J Pathol. 2001;24(1):15–21.
12. Tan K-S, Tan C-T, Goh K-J. Epidemiological aspects of Nipah virus infection.Neurol J Southeast Asia. 1999;4:77–81.
13. Chua KB, Goh KJ, Wong KT, Kamarulzaman A, Tan PSK, Ksiazek TG, et al.Fatal encephalitis due to Nipah virus among pig-farmers in Malaysia. Lancet.1999;354:1257–9.
14. Paton NI, Leo YS, Zaki SR, Auchus AP, Lee KE, Ling AE, et al. Outbreak ofNipah-virus infection among abattoir workers in Singapore. Lancet.1999;354:1253–6.
15. Chew MHL, Arguin PM, Shay DK, Goh K-T, Rollin PE, Shieh W-J, et al. Riskfactors for Nipah virus infection among abattoir workers in Singapore. JInfect Dis. 2000;181:1760–3.
16. Hsu VP, Hossain MJ, Parashar UD, Ali MM, Ksiazek TG, Kuzmin I, et al. Nipahvirus encephalitis reemergence, Bangladesh. Emerg Infect Dis. 2004;10:2082–7.
17. Luby S, Rahman M, Hossain M, Blum L, Husain M, Gurley E, et al. Foodbornetransmission of Nipah virus, Bangladesh. Emerg Infect Dis. 2006;12:1888–94.
18. Luby SP, Gurley ES, Hossain MJ. Transmission of human infection with Nipahvirus. Clin Infect Dis. 2009;49:1743–8.
19. Luby SP, Hossain MJ, Gurley ES, Ahmed B-N, Banu S, Khan SU, et al. Recurrentzoonotic transmission of Nipah virus into humans, Bangladesh, 2001–2007.Emerg Infect Dis. 2009;15:1229–35.
20. Chadha MS, Comer JA, Lowe L, Rota PA, Rollin PE, Bellini WJ, et al. Nipahvirus-associated encephalitis outbreak, Siliguri, India. Emerg Infect Dis.2006;12:235–40.
21. Pathchimasiri T, Kalpravidh W, Damrongwatanapokin S, ChantamaneechoteT, Daniels P, Buranathai C: Immunohistochemistry Investigation of NipahVirus : A Retrospective study in Thailand. In The 11th InternationalSymposium of the World Association of Veterinary Laboratory Diagnosticialsand OIE Seminar on Biotechnology. Thai Association of Veterinary LaboratoryDiagnosticians; 2003:44–45.
22. Department of Livestock Development. Animal health in Thailand 2011.Bangkok, Thailand: Department of Livestock Development; 2012.
23. OIE World Animal Health Information System [http://www.oie.int/wahis_2/public/wahid.php/Countryinformation/Animalsituation]
24. Wacharapluesadee S, Boongird K, Wanghongsa S, Ratanasetyuth N,Supavonwong P, Saengsen D, et al. A longitudinal study of the prevalenceof Nipah virus in Pteropus lylei bats in Thailand: evidence for seasonal preferencein disease transmission. Vector-Borne Zoonotic Dis. 2010;10:183–90.
25. Boonkird K, Wanghongsa S. On the population number and distribution foflying foxes (Pteropus lylei) in central plain. Wildl Yearb. 2004;5:89–100.
26. Sedwisai P, Changbunjong T, Chamsai T, Yongyuttawichai P, Sangkachai N,Weluwanarak T, et al. The distribution of flying fox (Pteropus spp.) in thecentral region of Thailand. J Appl Anim Sci. 2011;4:21–9.
27. Gaughan AE, Stevens FR, Linard C, Jia P, Tatem AJ. High resolutionpopulation distribution maps for Southeast Asia in 2010 and 2015. PLoSOne. 2013;8:e55882.
28. CGIAR-CSI SRTM 90 m DEM Digital Elevation Database [http://srtm.csi.cgiar.org/]29. Classification References (Using ENVI) | Exelis VIS Docs Center
[http://www.exelisvis.com/docs/ClassificationReferences.html]30. Elith J, Leathwick JR. Species distribution models: ecological explanation
and prediction across space and time. Annu Rev Ecol Evol Syst.2009;40:677–97.
31. McPherson JM, Jetz W, Rogers DJ. The effects of species’ range sizes on theaccuracy of distribution models: ecological phenomenon or statisticalartefact?: Species’ range and distribution model accuracy. J Appl Ecol.2004;41:811–23.
32. Elith J, Graham CH, Anderson RP, Dudík M, Ferrier S, Guisan A, et al. Novelmethods improve prediction of species’ distributions from occurrence data.Ecography. 2006;29:129–51.
33. Barbet-Massin M, Jiguet F, Albert CH, Thuiller W. Selecting pseudo-absencesfor species distribution models: how, where and how many? Methods EcolEvol. 2012;3:327–38.
34. Phillips SJ, Anderson RP, Schapire RE. Maximum entropy modeling ofspecies geographic distributions. Ecol Model. 2006;190:231–59.
35. Elith J, Leathwick JR, Hastie T. A working guide to boosted regression trees.J Anim Ecol. 2008;77:802–13.
36. Breiman L. Random forests. In: Machine learning, vol. 45. The Netherlands:Kluwer Academic Publishers; 2001. p. 5–32.
37. Cutler DR, Edwards TC, Beard KH, Cutler A, Hess KT, Gibson J, et al. Randomforests for classificaiton in ecology. Ecology. 2007;88:2783–92.
38. Marmion M, Parviainen M, Luoto M, Heikkinen RK, Thuiller W. Evaluation ofconsensus methods in predictive species distribution modelling. DiversDistrib. 2009;15:59–69.
39. Araujo M, New M. Ensemble forecasting of species distributions. Trends EcolEvol. 2007;22:42–7.
40. Robert J. Hijmans, Jane Elith: Species distribution modeling with R. 2013.41. Engler R, Waser LT, Zimmermann NE, Schaub M, Berdos S, Ginzler C,
et al. Combining ensemble modeling and remote sensing formapping individual tree species at high spatial resolution. For EcolManag. 2013;310:64–73.
42. Thuiller W, Lafourcade B, Engler R, Araújo MB. BIOMOD - a platform forensemble forecasting of species distributions. Ecography. 2009;32:369–73.
43. Augustin NH, Mugglestone MA, Buckland ST. An autologistic model for thespatial distribution of wildlife. J Appl Ecol. 1996;33:339–47.
44. Fielding AH, Bell JF. A review of methods for the assessment of predictionerrors in conservation presence/absence models. Environ Conserv.1997;24:38–49.
45. Stevens KB, Gilbert M, Pfeiffer DU. Modeling habitat suitability foroccurrence of highly pathogenic avian influenza virus H5N1 in domesticpoultry in Asia: a spatial multicriteria decision analysis approach. SpatSpatio-Temporal Epidemiol. 2013;4:1–14.
46. Ano T, Hormwichian R, Jitrapinate N, Compliew S, Kangrang A. Theestimation of drought risk area using potential surface analysis technique.UBU Eng J. 2013;6:13–21.
47. Udomsap T, Iamtrakul P. Accessibility improvement for district’s urbandiversity: case study of Rachadamnoen klong avenue, Bangkok. J Soc TranspTraffic Stud JSTS. 2011;2:1–17.
48. Nakya S, Leopairojna SK, Rangsiraksa L. Use of satellite data and potentialsurface analysis for Urban expansion of Hua Hin Municipality, Prachuap KhiriKhan Province, Thailand. In: 31st Asian conference on remote sensing 2010.Volume 1. Hanoi, Vietnam: Asian Association on Remote Sensing;2010. p. 293–302.
49. Eby P. Seasonal movements of grey-headed flying-foxes, Pteropus poliocephalus(Chiroptera : Pteropodidae), from two maternity camps in northern New SouthWales. Wildl Res. 1991;18:547.
50. Rainho A, Palmeirim JM. The importance of distance to resources in thespatial modelling of bat foraging habitat. PLoS One. 2011;6:e19227.
51. Webb PI. The comparative ecophysiology of water balance inmicrochiropteran. 67;1995:203–218
52. Webb PI, Speakman JR, Racey PA. Evaporative water loss in two sympatricspecies of vespertilionid bat, Plecotus auritus and Myotis daubentoni:relation to foraging mode and implications for roost site selection. J Zool.2009;235:269–78.
53. Studier EH, O’Farrell MJ. Biology of Myotis thysanodes and M. lucifugus(Chiroptera: Vespertilionidae)—III. Metabolism, heart rate, breathing rate,evaporative water loss and general energetics. Comp Biochem Physiol APhysiol. 1976;54:423–32.
54. Adams RA, Hayes MA. Water availability and successful lactation by bats asrelated to climate change in arid regions of western North America. J AnimEcol. 2008;77:1115–21.
55. Welbergen JA, Klose SM, Markus N, Eby P. Climate change and the effectsof temperature extremes on Australian flying-foxes. Proc R Soc B Biol Sci.2008;275:419–25.
56. Killer climate: tens of thousands of flying foxes dead in a day [http://www.brisbanetimes.com.au/queensland/killer-climate-tens-of-thousands-of-flying-foxes-dead-in-a-day-20140225-33drr.html]
57. Thai Meteorological Department [http://www.tmd.go.th/en/]58. Clare EL, Barber BR, Sweeney BW, Hebert PDN, Fenton MB. Eating local:
influences of habitat on the diet of little brown bats (Myotis lucifugus):molecular detection of variation in diet. Mol Ecol. 2011;20:1772–80.
59. Flying foxes | NSW Environment & Heritage [http://www.environment.nsw.gov.au/animals/flyingfoxes.htm]
60. Olsen B. Global patterns of influenza A virus in wild birds. Science.2006;312:384–8.
61. Stockwell DR, Peterson AT. Effects of sample size on accuracy of speciesdistribution models. Ecol Model. 2002;148:1–13.
62. Chen H, Wood MD, Linstead C, Maltby E. Uncertainty analysis in a GIS-basedmulti-criteria analysis tool for river catchment management. Environ ModelSoftw. 2011;26:395–405.
63. Hirzel A, Guisan A. Which is the optimal sampling strategy for habitatsuitability modelling. Ecol Model. 2002;157:331–41.
Thanapongtharm et al. BMC Veterinary Research (2015) 11:81 Page 14 of 14
64. Segurado P, Araújo MB. An evaluation of methods for modelling speciesdistributions: methods for modelling species distributions. J Biogeogr.2004;31:1555–68.
65. Engler R, Guisan A, Rechsteiner L. An improved approach for predicting thedistribution of rare and endangered species from occurrence andpseudo-absence data. J Appl Ecol. 2004;41:263–74.
66. Hanberry BB, He HS, Palik BJ. Pseudoabsence generation strategies forspecies distribution models. PLoS One. 2012;7:e44486.
67. Lauzeral C, Grenouillet G, Brosse S. Dealing with noisy absences to optimizespecies distribution models: an iterative ensemble modelling approach.PLoS One. 2012;7:e49508.
68. Grenouillet G, Buisson L, Casajus N, Lek S. Ensemble modelling of speciesdistribution: the effects of geographical and environmental ranges.Ecography. 2011;34:9–17.
69. Graham A, Atkinson P, Danson F. Spatial analysis for epidemiology. ActaTrop. 2004;91:219–25.
70. Katharina DS, Regula G, Hernandez J, Knopf L, Fuchs K, Morris RS, et al.Concepts for risk-based surveillance in the field of veterinary medicine andveterinary public health: Review of current approaches. BMC Health ServRes 2006:6–20
71. Khan SU, Gurley ES, Hossain MJ, Nahar N, Sharker MAY, Luby SP. Arandomized controlled trial of interventions to impede date palm sapcontamination by bats to prevent Nipah virus transmission in Bangladesh.PLoS One. 2012;7:e42689.
72. Forest Types in Thailand [http://wildlifethailand.com]73. Mangrove Forest Habitat in Tropical Thailand [http://www.kohphrathong.
com/thailand_mangrove.html]74. Asia-Pacific Forestry Sector Outlook Study: Country Report - Thailand [http://
www.fao.org/docrep/003/x2649e/X2649E03.htm]75. Biodiversity & Expert Database [http://www.bedo.or.th/lcdb/default.aspx]
Submit your next manuscript to BioMed Centraland take full advantage of:
• Convenient online submission
• Thorough peer review
• No space constraints or color figure charges
• Immediate publication on acceptance
• Inclusion in PubMed, CAS, Scopus and Google Scholar
• Research which is freely available for redistribution
Submit your manuscript at www.biomedcentral.com/submit