SPATIAL ANALYSIS TO RANK AND QUANTIFY HEALTHY CHANGE … · La Mesa 27 23 25 26 39 23 28 Vista 28...
23
SPATIAL ANALYSIS TO RANK AND QUANTIFY HEALTHY CHANGE BY NEIGHBORHOOD Isabel Corcos, PhD, MPH 1 , Leslie Ray, MPH, MPPA, MA 1,2 , Ryan Smith, MPH 2 , Amelia Kenner-Brininger, MPH, CPH 1 , Joshua Smith, PhD, MPH 1 , Maria Pena, MPH 2 , Sanaa Abedin, MPH 2 ,Barbara M. Stepanski, MPH 1 . 1 County of San Diego Health and Human Services Agency, Public Health Services, Emergency Medical Services 2 County of San Diego Health and Human Services Agency, Public Health Services, Community Health Statistics Unit
Transcript of SPATIAL ANALYSIS TO RANK AND QUANTIFY HEALTHY CHANGE … · La Mesa 27 23 25 26 39 23 28 Vista 28...

SPATIAL ANALYSIS TO RANK AND QUANTIFY HEALTHY
CHANGE BY NEIGHBORHOOD
Isabel Corcos, PhD, MPH 1, Leslie Ray, MPH, MPPA, MA 1,2, Ryan Smith, MPH2, Amelia Kenner-Brininger, MPH, CPH 1, Joshua Smith, PhD, MPH 1, Maria Pena, MPH2 , Sanaa Abedin,
MPH 2,Barbara M. Stepanski, MPH 1 . 1County of San Diego Health and Human Services Agency, Public Health Services, Emergency Medical
Services
2County of San Diego Health and Human Services Agency, Public Health Services, Community Health Statistics Unit

5th largest county in the U.S. (4,200 sq. mi.)18 cities, 3.1 million residentsMajor tourist destination, 5 climate zones!
SAN DIEGO COUNTY, CALIFORNIA
41 communities (aggregated census tracts)
• Reflect diverse population, lifestyles, urbanicity across county
• Allow consistent analysis of demographic & health data over time
• Excluding military population which is part of a different medical system

Building Better Health
Living Safely Thriving
3
THE VISION

Market Potential data purchased from ESRI • Derived from large, national consumer spending/use survey• Estimates the likely demand for goods & services• Used by business to understand & target consumers
USE OF MARKET POTENTIAL DATA TO PROFILE COMMUNITIES
Limitations:
• Based on survey, projected behaviors of adults
• Variables collected for business purposes, targeting consumers, not for assessing population health
• Relationship with medical outcome is correlative

UTILITY: DATA ON HEALTH-RELATED BEHAVIORS
WE CAN USE THIS INFORMATION TO
UNDERSTAND WHO’S DOING WHAT AND WHERE,
AND WHO WILL PROBABLY DO IT AGAIN
• Critical to chronic disease pathway
• Census tract level
Diet, exercise, smoking, dental care, medication,
medical services use
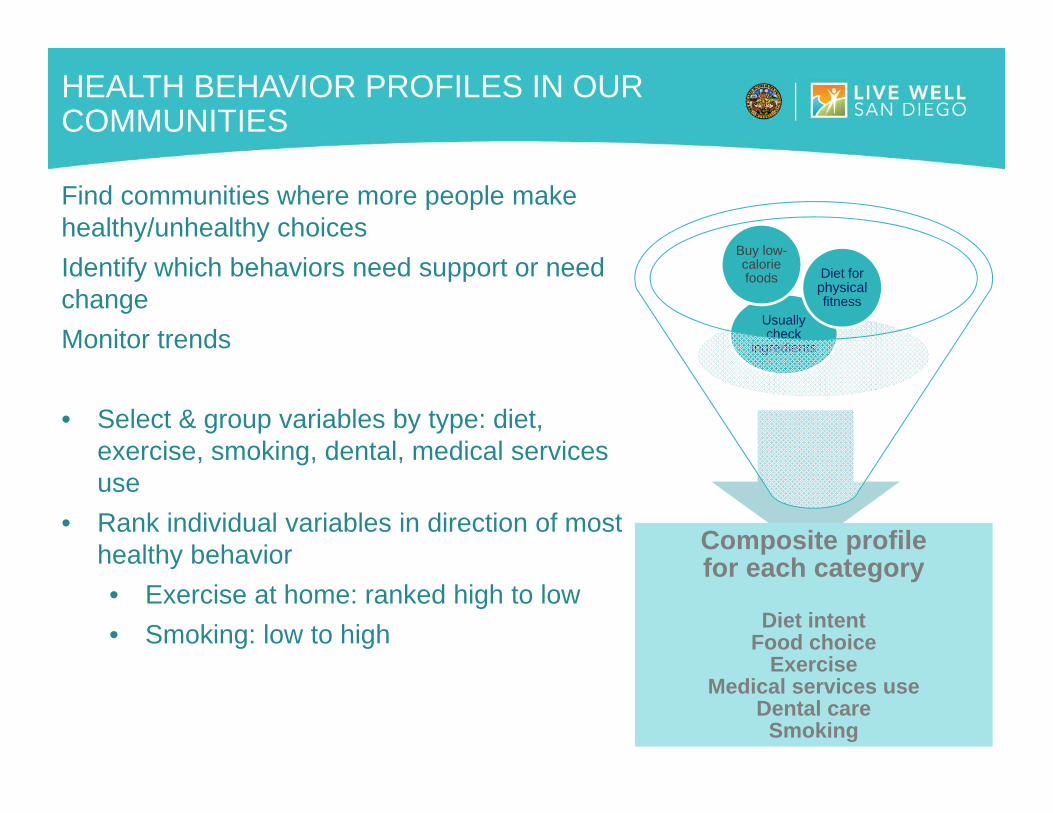
HEALTH BEHAVIOR PROFILES IN OUR COMMUNITIES
Find communities where more people make healthy/unhealthy choicesIdentify which behaviors need support or need changeMonitor trends
• Select & group variables by type: diet, exercise, smoking, dental, medical services use
• Rank individual variables in direction of most healthy behavior• Exercise at home: ranked high to low• Smoking: low to high
Composite profile for each category
Diet intentFood choice
ExerciseMedical services use
Dental careSmoking
Usually check
ingredients
Buy low-calorie foods Diet for
physicalfitness

SELECTED VARIABLES BY GROUP
Used frankfurters/hot dogs in last 6 mos 64.4 21.8Used cookies (ready-to-eat) in last 6 mos 62.5 16.0Drank cola (regular) in last 6 mos 43.9 19.7Used white bread in last 6 mos 38.1 15.0
Used fresh milk in last 6 mos 89.6 8.2Used fresh fruit/vegetables in last 6 mos 87.6 10.2Used fish/seafood (fresh or frozen) in last 6 mo 56.8 8.1Used multi-grain bread in last 6 mos 31.4 13.9
Food Choice
Smoked cigarettes in last 12 mos 17.1 9.5Smoked cigar in last 6 mos 4.2 2.8Smoked 9+ packs of cigarettes in last 7 days 2.6 2.4Smoked 2+ cigars in last 7 days 2.2 1.9
Smoking
Follow / frequently follow regular exercise routine 61.7 10.2Spend 3-6+h exercising per week 48.0 20.1Exercise at home 2+ times per week 30.4 10.5Exercise at club 2+ times per week 15.0 15.4Own weight lifting equipment 13.0 9.5
Exercise
Variables by category (subset shown for diet, food, exercise)
Percent of adults (mean/range) across communities
Diet IntentVariable Mean Range
Try / frequently try to eat healthy 84.1 8.7Usually / frequently check food ingredients 60.0 10.5Went to fast food/drive-in restaurant 9+ times/mo 38.7 12.9Presently controlling diet 36.9 10.3Diet control for weight loss 14.1 5.5Buy foods specifically labeled as fat-free 12.7 4.5Buy foods specifically labeled as high protein 6.5 3.6
Medical Services UseVisited doctor in last 12 mos 75.6 19.3Visited doctor in last 12 mo: general/family 40.0 18.4Visited doctor in last 12 mo: eye 20.3 10.3Visited doctor in last 12 mo: dermatologist 8.9 8.5Visited doctor in last 12 mo: chiropractor 6.9 3.9Visited doctor in last 12 mo: internist 6.8 7.4Visited doctor in last 12 mo: cardiologist 6.6 6.5Visited doctor in last 12 mo: physical therapist 4.8 3.6Visited doctor in last 12 mo: ear/nose/throat 4.4 2.5Visited nurse practitioner in last 12 mos 4.2 4.1Visited doctor in last 12 mo: gastroenterologist 4.0 2.5Visited doctor in last 12 mo: urologist 4.0 4.0Visited doctor in last 12 mo: podiatrist 2.9 3.0
Dental CareUsed toothpaste in last 6 mos 96.4 5.1Used dental floss in last 6 mos 67.2 13.9Visited doctor in last 12 mo: dentist 37.2 19.6Used denture cleaner in last 6 mos 8.6 9.0Used denture adhesive/fixative in last 6 mos 4.9 7.2

WHERE HEALTHY BEHAVIORS MAP
Den
tal C
are
Smok
ing
Exer
cise
Med
ical
Srv
csFo
od C
hoic
es
Die
t int
ent
These show the general pattern where people are making the best choices they can & the variability in health behaviors changing across
the county

PROFILING HEALTHY COMMUNITIES
Healthy & unhealthy behaviors cluster
Overall correlation with low/high medical encounter data (not shown)
Community Overall Diet Intent
Food Choice Exercise Smoking
Medical Services
UseDental
Poway 7 10 14 5 5 6 4San Dieguito 8 10 15 5 5 7 4Valley Center 8 5 15 8 5 5 11Jamul 9 11 15 9 6 7 9Carlsbad 10 8 16 7 9 10 9Alpine 10 8 16 11 9 8 11North San Diego 11 13 16 6 8 14 7Del Mar-Mira Mesa 12 13 17 7 9 16 7Sweetwater 12 14 18 5 11 18 5Coastal 12 14 19 7 14 13 6Fallbrook 14 11 16 16 10 9 21Elliott-Navajo 14 13 18 12 16 13 12Pauma 15 25 20 12 8 19 6Ramona 16 15 20 18 15 15 16Peninsula 18 17 19 14 21 19 16Harbison Crest 18 13 19 21 18 12 27Coronado 19 17 19 20 15 20 21Laguna-Pine Valley 20 22 18 22 15 14 29University 20 22 24 7 28 29 13San Marcos 22 24 22 22 19 23 23Kearny Mesa 22 21 21 19 29 24 18Santee 23 23 22 23 26 22 21Spring Valley 23 25 23 24 26 21 20Palomar-Julian 24 16 21 30 27 12 37Mountain Empire 25 24 21 29 23 17 34Lemon Grove 25 30 22 27 24 28 18Anza-Borrego Springs 26 19 22 32 29 12 40Central San Diego 26 24 22 22 32 30 27Oceanside 26 26 24 25 29 27 26Escondido 27 27 24 29 24 29 27Lakeside 27 20 25 29 35 22 31La Mesa 27 23 25 26 39 23 28Vista 28 29 24 30 25 31 27Southeastern San Diego 29 31 24 31 27 35 23El Cajon 29 30 26 29 34 27 28South Bay 31 36 26 36 23 36 29Chula Vista 32 33 26 35 31 34 31National City 32 34 25 36 27 37 34Mid-City 33 34 27 32 37 37 29
PROFILING HEALTHY COMMUNITIES
Other community differences apparent• University (Don’t eat well, avoid doctors &
smoke)
• Anza-Borrego Springs (higher medical services use)
• Age & mobility are key in these areas

FOCUSING ON MEDICAL SERVICES USE


REGULAR MEDICAL SERVICES USE
75.6
37.2
20.3
40.0
0.0
10.0
20.0
30.0
40.0
50.0
60.0
70.0
80.0
90.0
Doctor Visit Dentist Eye GP
Health Professional Visit in past 12 mo (%)

DATA RELATED TO CHRONIC DISEASE PREVALENCE
Data reflect diagnosed diabetes, or heart disease symptoms
Particularly helpful for communities where rates for medical encounter cannot be calculated
Opportunity for early surveillance and intervention in disease progression

12.4
3.2
8.5 9.1
0.0
2.0
4.0
6.0
8.0
10.0
12.0
14.0
16.0
High blood pressure Rx Diet control for salt restriction High cholesterol Rx Diet control for cholesterollevel
ADULTS USING PRESCRIPTION MEDICATION OR DIET CONTROL FOR HEALTH CONDITION (%)
28.7% of Adults diagnosed with HBP, and of these (71.5% take medication (California Health Interview Survey, 2014)

Top: Diet control: Salt restriction; cholesterol levelBottom: Prescription medication use: HBP; Cholesterol
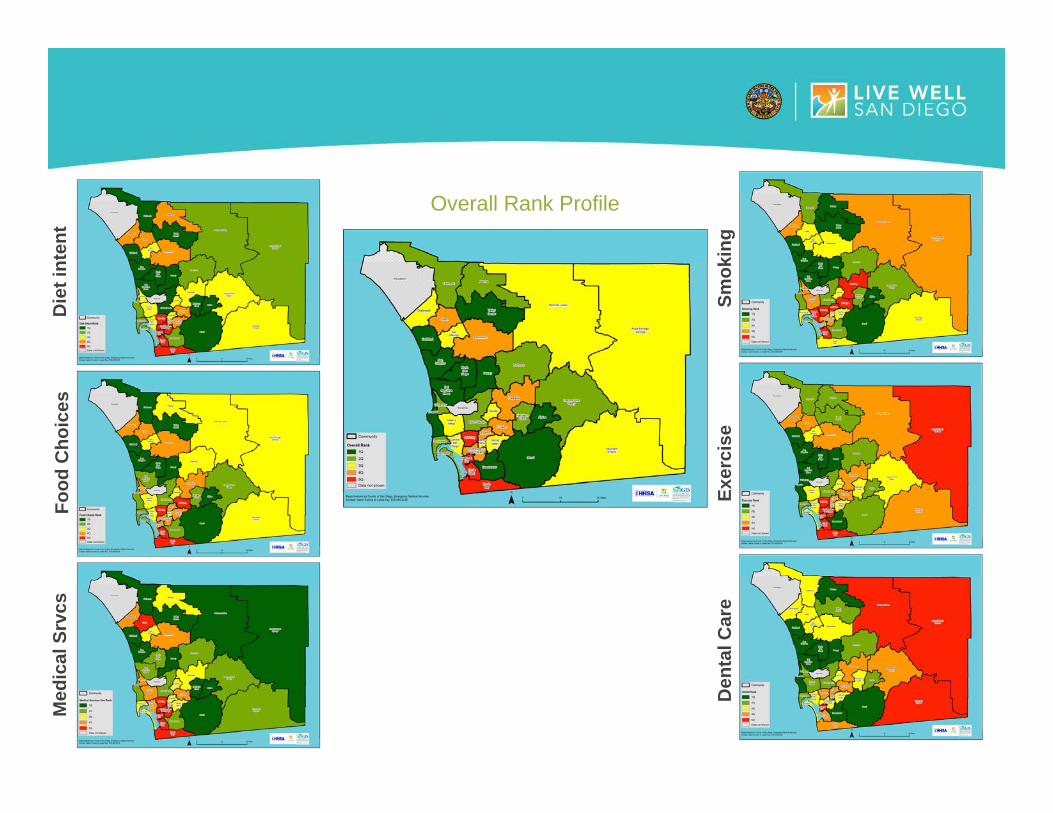
Overall Rank Profile
Den
tal C
are
Smok
ing
Exer
cise
Med
ical
Srv
csFo
od C
hoic
es
Die
t int
ent

PROFILING HEALTHY COMMUNITIES
Community Overall Diet Intent
Food Choice Exercise Smoking
Medical Services
UseDental
Poway 7 10 14 5 5 6 4San Dieguito 8 10 15 5 5 7 4Valley Center 8 5 15 8 5 5 11Jamul 9 11 15 9 6 7 9Carlsbad 10 8 16 7 9 10 9Alpine 10 8 16 11 9 8 11North San Diego 11 13 16 6 8 14 7Del Mar-Mira Mesa 12 13 17 7 9 16 7Sweetwater 12 14 18 5 11 18 5Coastal 12 14 19 7 14 13 6Fallbrook 14 11 16 16 10 9 21Elliott-Navajo 14 13 18 12 16 13 12Pauma 15 25 20 12 8 19 6Ramona 16 15 20 18 15 15 16Peninsula 18 17 19 14 21 19 16Harbison Crest 18 13 19 21 18 12 27Coronado 19 17 19 20 15 20 21Laguna-Pine Valley 20 22 18 22 15 14 29University 20 22 24 7 28 29 13San Marcos 22 24 22 22 19 23 23Kearny Mesa 22 21 21 19 29 24 18Santee 23 23 22 23 26 22 21Spring Valley 23 25 23 24 26 21 20Palomar-Julian 24 16 21 30 27 12 37Mountain Empire 25 24 21 29 23 17 34Lemon Grove 25 30 22 27 24 28 18Anza-Borrego Springs 26 19 22 32 29 12 40Central San Diego 26 24 22 22 32 30 27Oceanside 26 26 24 25 29 27 26Escondido 27 27 24 29 24 29 27Lakeside 27 20 25 29 35 22 31La Mesa 27 23 25 26 39 23 28Vista 28 29 24 30 25 31 27Southeastern San Diego 29 31 24 31 27 35 23El Cajon 29 30 26 29 34 27 28South Bay 31 36 26 36 23 36 29Chula Vista 32 33 26 35 31 34 31National City 32 34 25 36 27 37 34Mid-City 33 34 27 32 37 37 29

DEMOGRAPHICS
Median income
Age 55+ / sq mi

HEALTH CARE SHORTAGE AREAS
Medically Underserved Area Primary Care Shortage Area

WHAT THIS ADDS TO OUR GOAL OF BUILDING BETTER HEALTH
Census tract-level data for detailed analysis of community
Estimates of diagnosed diabetes prevalence
Verification that correlations have a significant spatial component
Evaluate community health in areas where medical outcome rates are not
calculable

WHAT THIS ADDS TO OUR GOAL OF BUILDING BETTER HEALTH
Ability to monitor trends & forecast challenges to
population health
Enriched evidence base for data-driven decision-making
Insight into collective impact of key health behaviors

For more information please contact
Dr. Isabel CorcosCounty of San Diego, Health & Human Services Agency
Public Health Services, Emergency Medical [email protected]