Spartan Dairy Farm Business Analysis Workbooksteind/Dairy Farm Business Analysis Handbook.pdf ·...
28
Spartan Dairy Farm Business Analysis Workbook Financial Section (with answers and comments) Michigan State University Dairy Extension Team Dairy Programs Group Lead author and editor: Roger Betz Section contributing authors: Sherrill Nott Gerry Schwab Janice Knuth Mike Staton Aug 2012 Replacements 0 - 2 Months Lactating Cows Replacements 3 -12 Months Transition Cows Replacements 13 - 23 Months Labor Crops Financial
-
Upload
phungtuong -
Category
Documents
-
view
224 -
download
0
Transcript of Spartan Dairy Farm Business Analysis Workbooksteind/Dairy Farm Business Analysis Handbook.pdf ·...
Spartan
Dairy Farm Business Analysis Workbook
Financial Section
(with answers and comments)
Michigan State University
Dairy Extension Team Dairy Programs Group
Lead author and editor: Roger Betz
Section contributing authors: Sherrill Nott
Gerry Schwab Janice Knuth Mike Staton
Aug 2012
Replacements 0 - 2 Months
Lactating Cows
Replacements 3 -12 Months
Transition Cows
Replacements 13 - 23 Months
Labor
Crops
Financial

Dairy Analysis Workbook - Financial [PAGE 2]
The In-depth Farm Financial Analysis
Table of Contents INSTRUCTIONS……………………………………………………………………………………………….……………….……….. 3 BALANCE SHEET EXPLANATION…………………………………………..……………………………………………....………. 4 BALANCE SHEET: ASSETS……………………………………………….…………….……………………………………………...6 BALANCE SHEET: LIABILITIES & NET WORTH……………………….………………………………………………………….11 DEBT AND STRUCTURE-BEGINNING OF YEAR …………………….…………………………………………………………...12 DEBT AND STRUCTURE-END OF YEAR ……………………………….………………………………………………….…...….14 SUMMARY AND COMPARISON FOR ASSETS AND LIABILITIES ……….……..……………………………….……..……….16 INCOME STATEMENT EXPLANATION…………………..…………………….…………………………………………………..17 INCOME STATEMENT: CASH FARM REVENUE………………………….....…………………………………...….…………….18 INCOME STATEMENT: CASH FARM EXPENSES………….………..……………………………………………....……………..19 NET FARM INCOME STATEMENT…………………………………………………………………………………………………..20 STATEMENT OF CASH FLOWS AND CASH RECONSILIATION..………………………………………………………………..21 FINANCIAL MEASUREMENTS EXPLANATIONS..……………………………………………………………………….………..22 FINANCIAL MEASUREMENTS……………….…………………………………………………………………………….………..25 DAIRY FARM BREAK EVEN MILK PRICES...…………………………………………………………………………….………..26 FINANCIAL RATIOS AND GENERAL GUIDELINES…….……………………………………………………………...….……...27 FEED DISAPPEARANCE CALCULATION TABLE………………………………………………………………………………….28 APPENDIX - FEED CONVERSION, WEIGHTS AND MEASURES, STORAGE CAPACITIES
Date: Herd Number:
Farm/owner: Phone:
Address:
City: State: Zip:
Dairy Analysis Workbook - Financial [PAGE 3] INSTRUCTIONS The Dairy Farm Analysis Workbook is divided into sections of the dairy farm that can be analyzed including financial, labor, crops and the dairy herd. The dairy herd is further divided into 3 replacement age groups, lactating cows and transition cows. The information in this section of the Dairy Analysis Workbook is for financial analysis of the farm business. Goal: For a one-year period, develop an accrual adjusted income statement. This means preparing the following financial reports: 1. Balance Sheet statement at beginning of year, with both cost and market valuations. 2. Balance Sheet statement at end of year, with both cost and market valuations. 3. Income statement, showing inventory adjustments and depreciation. 4. Summary of cash flows including principal borrowings and repayments. From the accrual income statement and other documents, various profit and financial ratios indicating strengths and weaknesses of the farm business can be calculated. This financial analysis should be performed every year to monitor the business. Choices: You have three ways to accomplish this. 1. Fill in the worksheets in the following pages to perform a manual “paper” business analysis. Once this workbook is completed it can easily be used for FINPACK computerized business analysis input. Your Extension Agent can help you with the FINPACK program. or 2. Run Finpack software, using the Year End Analysis (FINAN) option.
a. Contact your county Michigan State University Extension office and ask to be put in contact with your District Extension Farm Management Agent or with your Local Agent. They have the software on their computers and will arrange to do the analysis.
b. Buy the FINPACK software from the Center for Farm Financial Management at the University of Minnesota, 249 Classroom Office Building, 1994 Buford Avenue, St. Paul, Minnesota 55108 or phone 800-234-1111. To preview what FINPACK does, visit their web site at: http://www.cffm.umn.edu/finpack.htm
or 3. Your consultant or accountant may already have prepared statements that meet the above for completeness. Have these available. From these consultant prepared statements, calculate the ratios on page 27 of this document. Work with your consultant, District Farm Management Agent, and/or Local Agent to identify strengths and areas of potential improvement. With their help, establish a strategic plan to implement improvements within your business.
Dairy Analysis Workbook - Financial [PAGE 4]
Balance Sheet Instructions and Explanations The balance sheet or net worth statement is a snapshot of the financial position of the farm business at a given point in time. Everything the business owns and owes is listed on the balance sheet. It provides a summary of how funds have been invested in the business (assets) and the financing methods (liabilities) used at a given point in time. Accurate and detailed balance sheets are needed to accomplish the following: Analyze the financial performance of the
business. Secure credit and financing from lenders Monitor financial progress over time Make financial projections Understand the financial risk position Provide information for Estate Planning The first step in building an accurate balance sheet is to select the date that the balance sheet represents. It needs to be consistent from year to year. December 31st is the preferred date as this corresponds to the end of the previous cash accounting year and the beginning of the next. Accurate balance sheets for the beginning and end of the cash accounting period enables adjustment of cash accounting for inventory changes that occurred during the year. This is essential to understanding the farm’s financial performance. The next step is to decide what business entity the balance sheet represents (partnership, individual or the whole farm). Clearly identify the person(s) or entity being described at the top of the balance sheet and be consistent each year. Within the balance sheet, it is important to keep separate farm from non-farm assets and liabilities. ASSETS Assets are all the things owned or coming to the business as of the date of the statement. There may be a liability against the asset. This will be accounted for in the liability part of the Balance Sheet
Current Farm Assets Current assets are cash or other assets that are expected to be realized in cash or consumed (feed, etc.) in production during a business year. All supplies on hand should be priced at their cost. Growing crops such as wheat or alfalfa, should be listed at the actual cash costs invested to date. See appendix 1 for information on calculating the quantity of crops in storage and pricing corn silage and haylage. Government payments should reflect payments yet to come as a result of past activities, not future activities. A crop under loan can be valued and listed with crops held for sale only if offset later by a loan against it in the liability section. The Market Value and Cost Value values are the same for current assets. Valuation Methods for Intermediate and Long-term Assets Values for intermediate and long-term assets should be determined using both their Cost Value and their Market Value. The Cost Value is the purchase price minus the depreciation taken to date. This should be consistent with income tax records. The Market Value is the amount that would be received if the asset were sold on the open market. It is important to use consistent values from year to year. This formula may be helpful to help be consistent from year to year on Market Value: “beginning value” PLUS “purchases made during the year” MINUS “cash sales” TIMES “90%” (The 90% can be changed to reflect the years of the asset. 90% would be a 10% or 10 year life. 85.71% would be 7year life and 95% would be 20 year life.) Lenders want to see the Market Value of term assets so they can determine ability to repay the loan if they had to foreclose. The accrual income statements (over several years) should be used to determine ability to repay without foreclosure.
Dairy Analysis Workbook - Financial [PAGE 5] There is significant value in both Market Value and Cost Value balance sheets. Market Value only can be very misleading in determining profitability and monitoring financial progress over time. Net worth calculated from a Market Value balance sheet is affected by inflation or deflation as well as actual earned income. The Cost Value balance sheet is not affected by inflation or deflation and is more useful in monitoring the businesses financial profitability and progress since only the changes in net worth resulting from earnings are included. There is space to enter both the Cost Value and the Market Value of term assets in the worksheet. Intermediate Farm Assets Intermediate-term assets are those resources that support production. They are not intended for immediate sale. Such assets are expected to have a useful line of 1 to 7 years. They include machinery and equipment (marketable value and un-depreciated value; be consistent year to year), breeding livestock, and securities not readily marketable. Long-Term Farm Assets Long-term assets include items of a more permanent nature, such as farmland, buildings and improvements, and non-farm real estate. Land should be listed separately from farm buildings and improvements. Non-Farm Assets Non-farm Assets are those assets not used in the farm business. These could be profits taken from the business for personal use. Personal residence, house hold items, retirement funds and cash value of life insurance typically are non-farm assets. LIABILITIES Liabilities are all obligations that are owed as of the
statement date. Do not change the classification of a liability as it matures. Make sure principal and unpaid accrued interest are separated. The principal balances should not include unpaid interest. Accrued unpaid interest is listed separately. Statements from lending institutions should be used to verify balances. Current Farm Liabilities Current liabilities are those due and payable on demand or within the operating year. Commodity credit loans should be added to this section. If a CCC loan is entered, make sure the product is listed on the asset side of the balance sheet as well. It is important to separate and understand the difference between borrowed money and unpaid bills. In cash accounting, unpaid bills have not yet been claimed as a tax-deductible expense. Intermediate Farm Liabilities- Intermediate liabilities and debts are against intermediate assets. These typically are due within 7 or 10 years. Loans for machinery and equipment purchases and breeding livestock tend to fall into this category. Leases, such as on silos and machinery, should be added here. Long-term Farm Liabilities Long-term liabilities are against long term Assets. Typically these are land contracts and mortgages on land and buildings. These typically were set up originally with 10 or more year to repay. Non-Farm Liabilities Non-Farm Liabilities are those liabilities against non-farm Assets. B=Beginning, E=Ending, C=Cost Value, M=Market Value
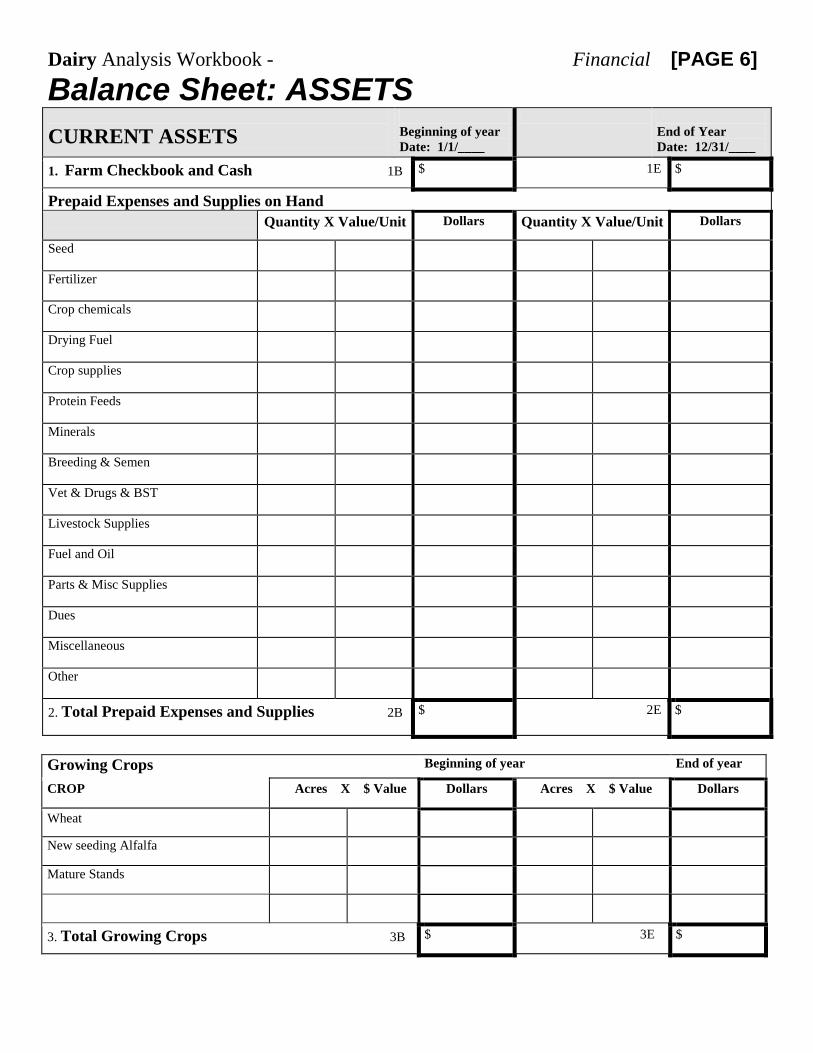
Dairy Analysis Workbook - Financial [PAGE 6] Balance Sheet: ASSETS
CURRENT ASSETS
Beginning of year Date: 1/1/____
End of Year Date: 12/31/____
1. Farm Checkbook and Cash 1B $ 1E $
Prepaid Expenses and Supplies on Hand Quantity X Value/Unit Dollars Quantity X Value/Unit Dollars
Seed
Fertilizer
Crop chemicals
Drying Fuel
Crop supplies
Protein Feeds
Minerals
Breeding & Semen
Vet & Drugs & BST
Livestock Supplies
Fuel and Oil
Parts & Misc Supplies
Dues
Miscellaneous
Other
2. Total Prepaid Expenses and Supplies 2B $ 2E $
Growing Crops Beginning of year End of year
CROP Acres X $ Value Dollars Acres X $ Value Dollars
Wheat
New seeding Alfalfa
Mature Stands
3. Total Growing Crops 3B $ 3E $
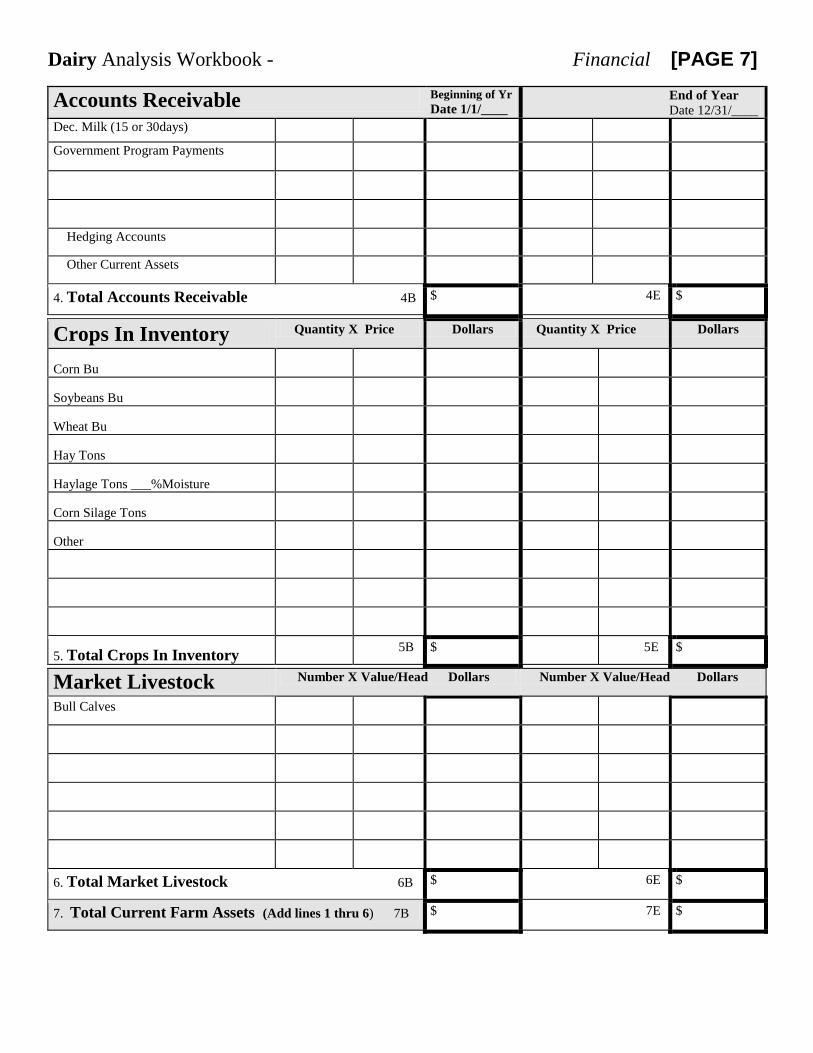
Dairy Analysis Workbook - Financial [PAGE 7]
Accounts Receivable Beginning of Yr Date 1/1/____
End of Year Date 12/31/____
Dec. Milk (15 or 30days)
Government Program Payments
Hedging Accounts
Other Current Assets
4. Total Accounts Receivable 4B $ 4E $
Crops In Inventory Quantity X Price Dollars Quantity X Price Dollars
Corn Bu
Soybeans Bu
Wheat Bu
Hay Tons
Haylage Tons ___%Moisture
Corn Silage Tons
Other
5. Total Crops In Inventory 5B $ 5E $
Market Livestock Number X Value/Head Dollars Number X Value/Head Dollars
Bull Calves
6. Total Market Livestock 6B $ 6E $
7. Total Current Farm Assets (Add lines 1 thru 6) 7B $ 7E $
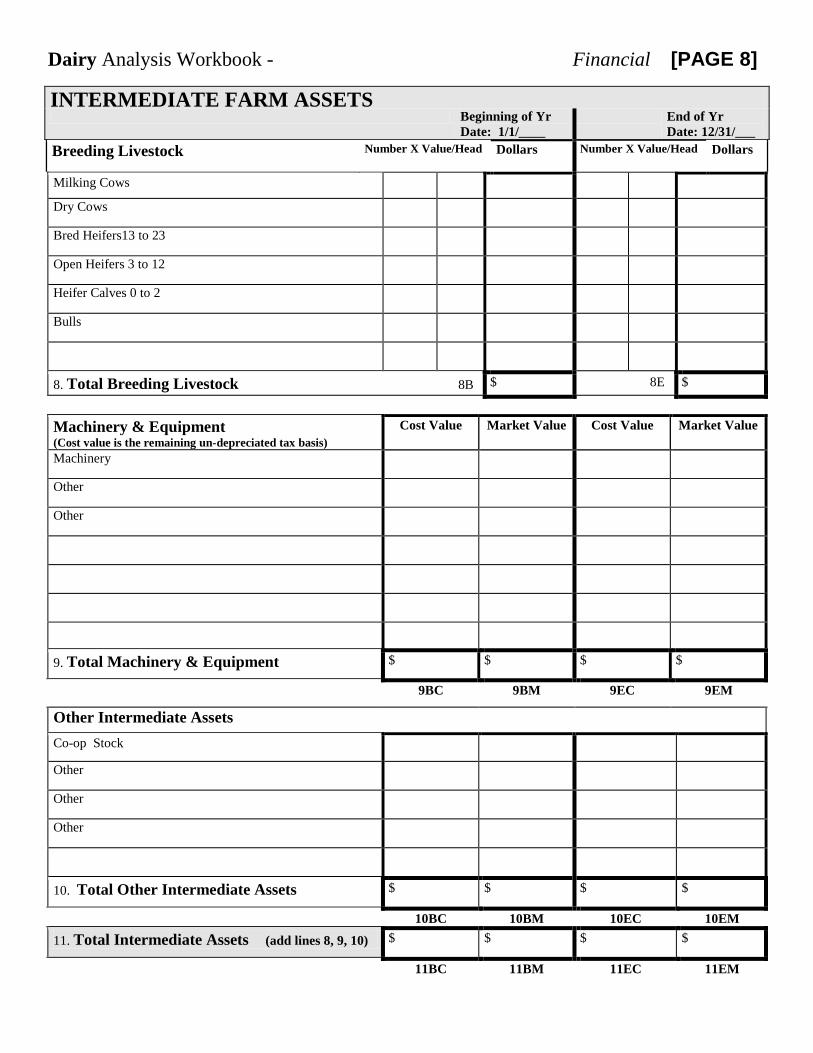
Dairy Analysis Workbook - Financial [PAGE 8]
INTERMEDIATE FARM ASSETS Beginning of Yr
Date: 1/1/____ End of Yr
Date: 12/31/___ Breeding Livestock
Number X Value/Head Dollars Number X Value/Head Dollars
Milking Cows
Dry Cows
Bred Heifers13 to 23
Open Heifers 3 to 12
Heifer Calves 0 to 2
Bulls
8. Total Breeding Livestock 8B $ 8E $
Machinery & Equipment (Cost value is the remaining un-depreciated tax basis)
Cost Value Market Value Cost Value Market Value
Machinery
Other
Other
9. Total Machinery & Equipment $ $ $ $
9BC 9BM 9EC 9EM
Other Intermediate Assets Co-op Stock
Other
Other
Other
10. Total Other Intermediate Assets $ $ $ $
10BC 10BM 10EC 10EM 11. Total Intermediate Assets (add lines 8, 9, 10) $ $ $ $
11BC 11BM 11EC 11EM
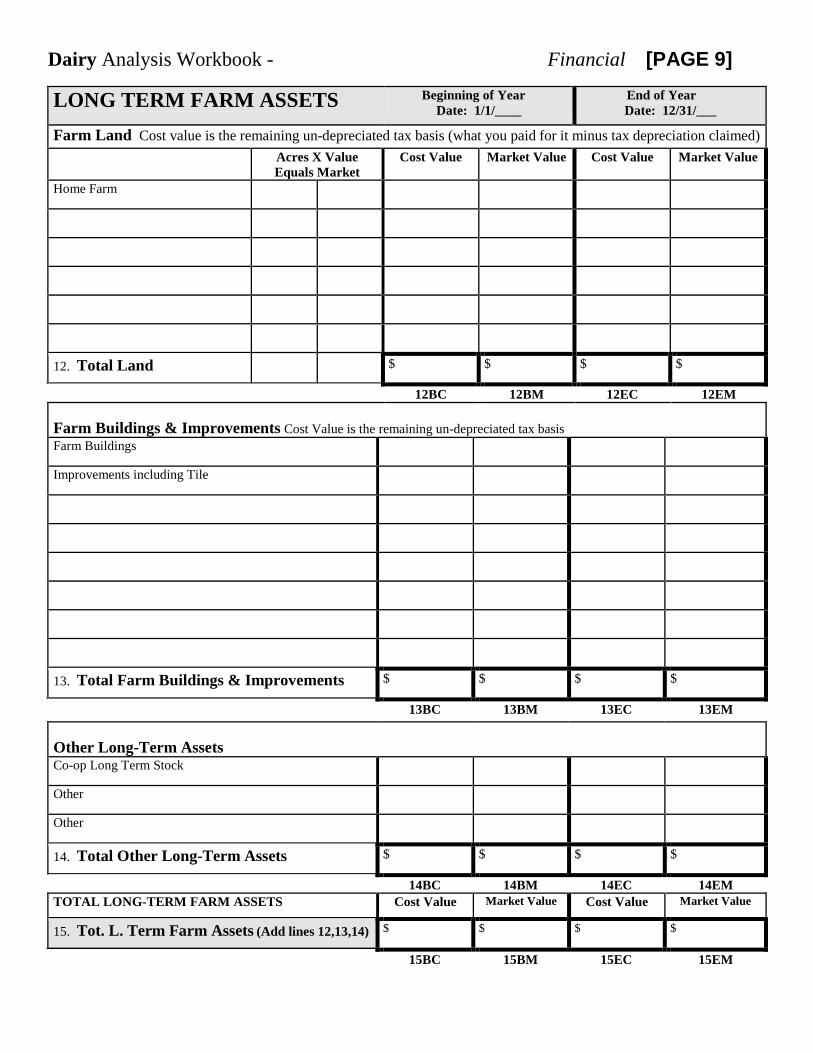
Dairy Analysis Workbook - Financial [PAGE 9]
LONG TERM FARM ASSETS Beginning of Year Date: 1/1/____
End of Year Date: 12/31/___
Farm Land Cost value is the remaining un-depreciated tax basis (what you paid for it minus tax depreciation claimed) Acres X Value
Equals Market Cost Value Market Value Cost Value Market Value
Home Farm
12. Total Land $ $ $ $
12BC 12BM 12EC 12EM Farm Buildings & Improvements Cost Value is the remaining un-depreciated tax basis Farm Buildings
Improvements including Tile
13. Total Farm Buildings & Improvements $ $ $ $
13BC 13BM 13EC 13EM Other Long-Term Assets Co-op Long Term Stock
Other
Other
14. Total Other Long-Term Assets $ $ $ $
14BC 14BM 14EC 14EM TOTAL LONG-TERM FARM ASSETS Cost Value Market Value Cost Value Market Value
15. Tot. L. Term Farm Assets (Add lines 12,13,14) $ $ $ $
15BC 15BM 15EC 15EM
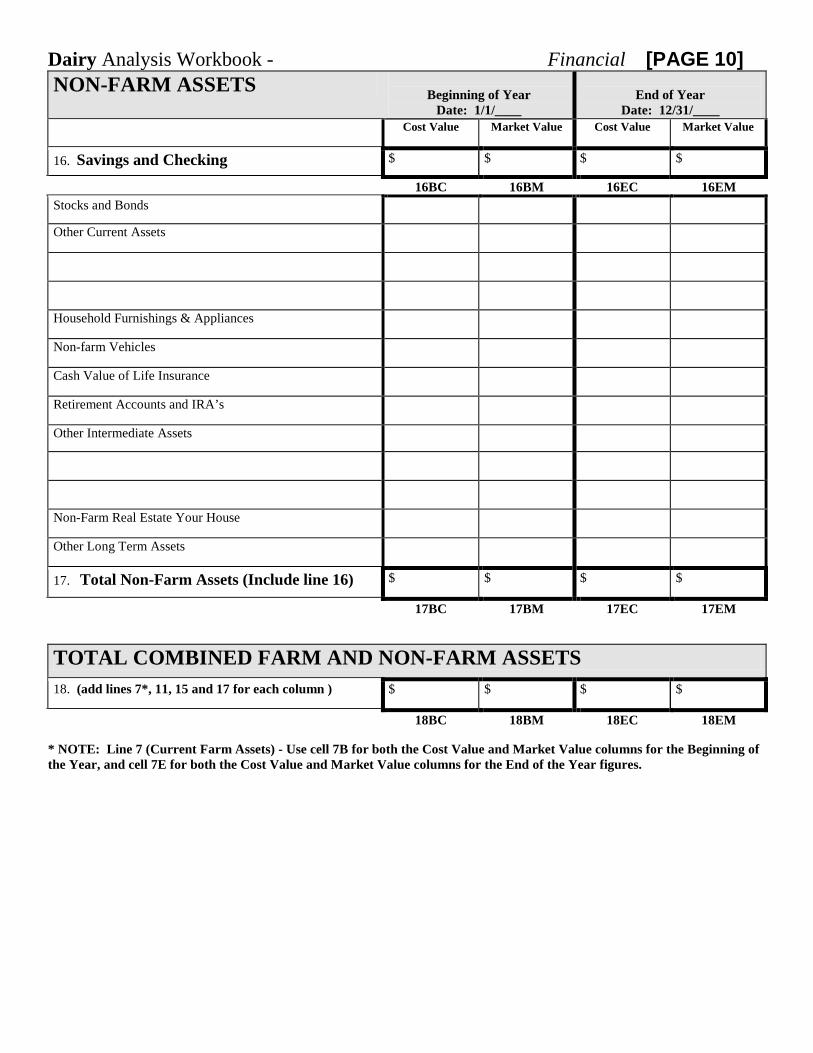
Dairy Analysis Workbook - Financial [PAGE 10] NON-FARM ASSETS
Beginning of Year Date: 1/1/____
End of Year
Date: 12/31/____ Cost Value Market Value Cost Value Market Value
16. Savings and Checking $ $ $ $
16BC 16BM 16EC 16EM Stocks and Bonds
Other Current Assets
Household Furnishings & Appliances
Non-farm Vehicles
Cash Value of Life Insurance
Retirement Accounts and IRA’s
Other Intermediate Assets
Non-Farm Real Estate Your House
Other Long Term Assets
17. Total Non-Farm Assets (Include line 16) $ $ $ $
17BC 17BM 17EC 17EM
TOTAL COMBINED FARM AND NON-FARM ASSETS 18. (add lines 7*, 11, 15 and 17 for each column ) $ $ $ $
18BC 18BM 18EC 18EM * NOTE: Line 7 (Current Farm Assets) - Use cell 7B for both the Cost Value and Market Value columns for the Beginning of the Year, and cell 7E for both the Cost Value and Market Value columns for the End of the Year figures.
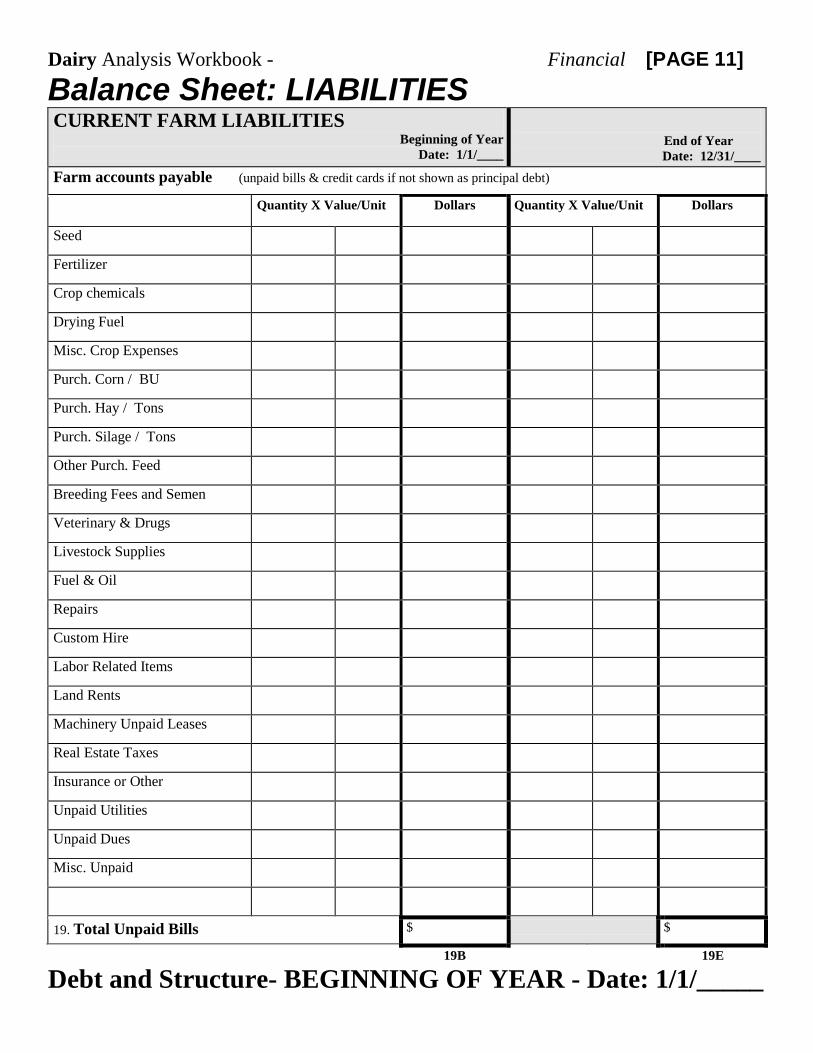
Dairy Analysis Workbook - Financial [PAGE 11] Balance Sheet: LIABILITIES
CURRENT FARM LIABILITIES Beginning of Year
Date: 1/1/____
End of Year
Date: 12/31/____ Farm accounts payable (unpaid bills & credit cards if not shown as principal debt)
Quantity X Value/Unit Dollars Quantity X Value/Unit Dollars
Seed
Fertilizer
Crop chemicals
Drying Fuel
Misc. Crop Expenses
Purch. Corn / BU
Purch. Hay / Tons
Purch. Silage / Tons
Other Purch. Feed
Breeding Fees and Semen
Veterinary & Drugs
Livestock Supplies
Fuel & Oil
Repairs
Custom Hire
Labor Related Items
Land Rents
Machinery Unpaid Leases
Real Estate Taxes
Insurance or Other
Unpaid Utilities
Unpaid Dues
Misc. Unpaid
19. Total Unpaid Bills $ $
19B 19E
Debt and Structure- BEGINNING OF YEAR - Date: 1/1/_____
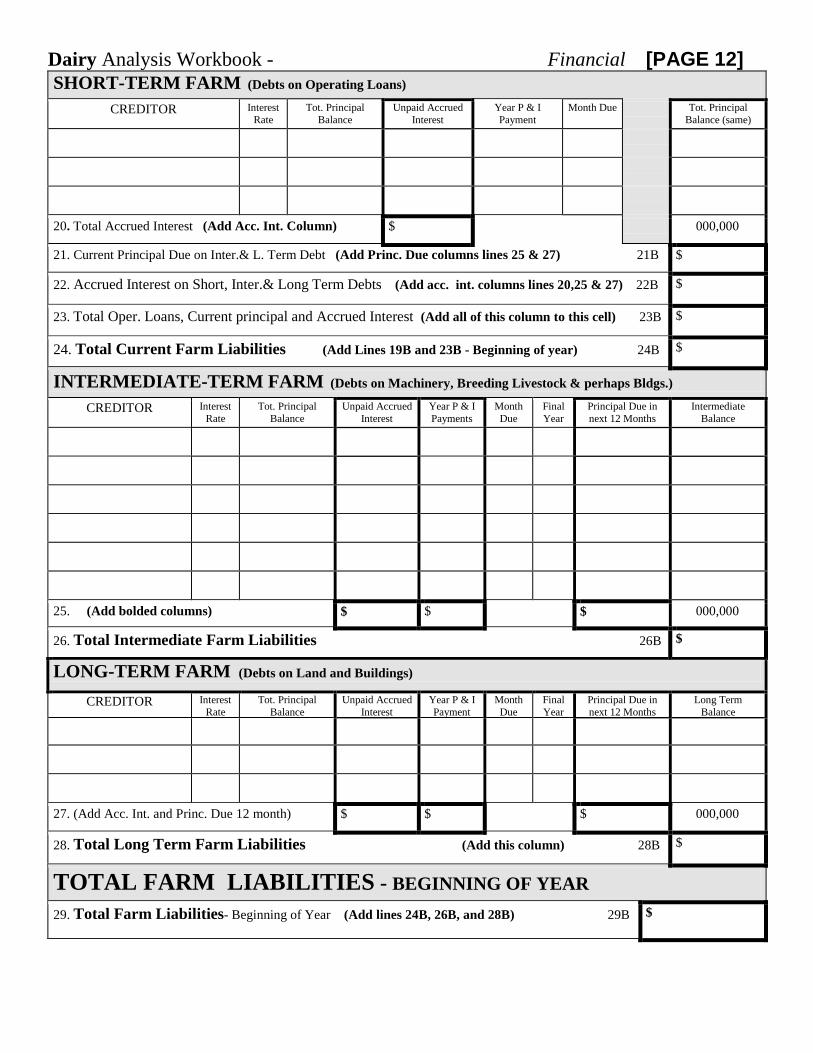
Dairy Analysis Workbook - Financial [PAGE 12] SHORT-TERM FARM (Debts on Operating Loans)
CREDITOR Interest Rate
Tot. Principal Balance
Unpaid Accrued Interest
Year P & I Payment
Month Due Tot. Principal Balance (same)
20. Total Accrued Interest (Add Acc. Int. Column) $ 000,000
21. Current Principal Due on Inter.& L. Term Debt (Add Princ. Due columns lines 25 & 27) 21B $
22. Accrued Interest on Short, Inter.& Long Term Debts (Add acc. int. columns lines 20,25 & 27) 22B $
23. Total Oper. Loans, Current principal and Accrued Interest (Add all of this column to this cell) 23B $
24. Total Current Farm Liabilities (Add Lines 19B and 23B - Beginning of year) 24B $
INTERMEDIATE-TERM FARM (Debts on Machinery, Breeding Livestock & perhaps Bldgs.)
CREDITOR Interest Rate
Tot. Principal Balance
Unpaid Accrued Interest
Year P & I Payments
Month Due
Final Year
Principal Due in next 12 Months
Intermediate Balance
25. (Add bolded columns) $ $ $ 000,000
26. Total Intermediate Farm Liabilities 26B $
LONG-TERM FARM (Debts on Land and Buildings)
CREDITOR Interest Rate
Tot. Principal Balance
Unpaid Accrued Interest
Year P & I Payment
Month Due
Final Year
Principal Due in next 12 Months
Long Term Balance
27. (Add Acc. Int. and Princ. Due 12 month) $ $ $ 000,000
28. Total Long Term Farm Liabilities (Add this column) 28B $
TOTAL FARM LIABILITIES - BEGINNING OF YEAR 29. Total Farm Liabilities- Beginning of Year (Add lines 24B, 26B, and 28B) 29B $
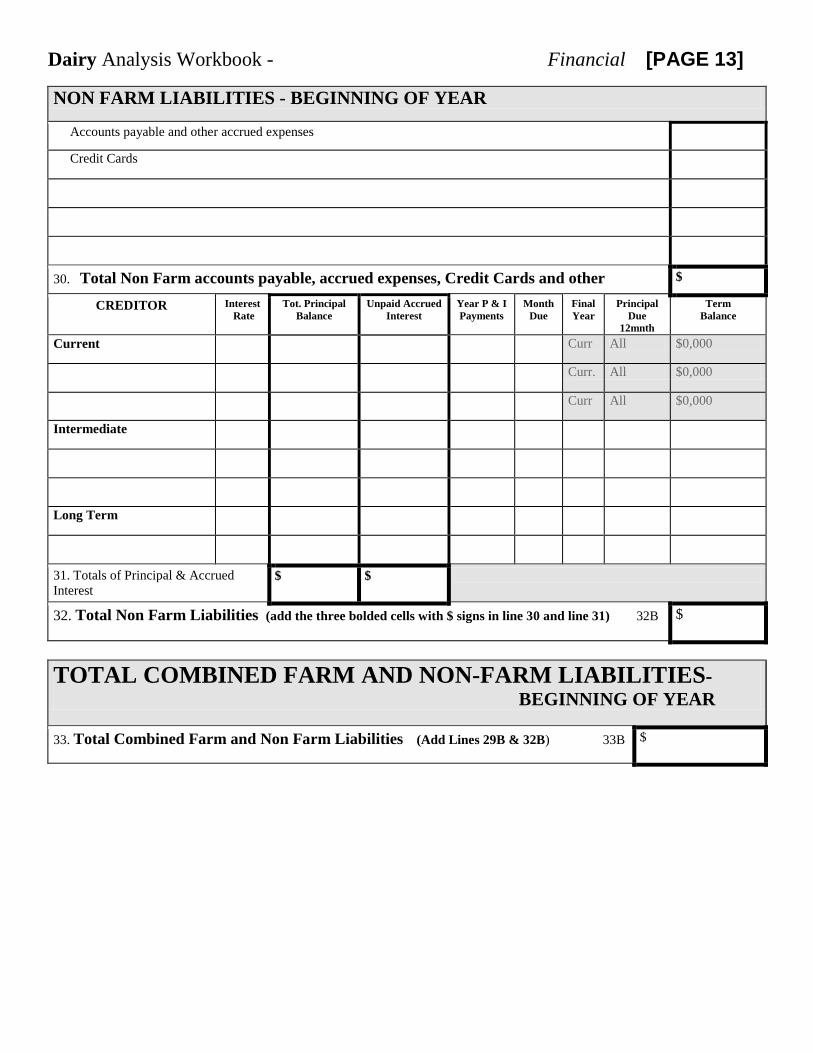
Dairy Analysis Workbook - Financial [PAGE 13]
NON FARM LIABILITIES - BEGINNING OF YEAR
Accounts payable and other accrued expenses
Credit Cards
30. Total Non Farm accounts payable, accrued expenses, Credit Cards and other $
CREDITOR Interest Rate
Tot. Principal Balance
Unpaid Accrued Interest
Year P & I Payments
Month Due
Final Year
Principal Due
12mnth
Term Balance
Current Curr All $0,000
Curr. All $0,000
Curr All $0,000
Intermediate
Long Term
31. Totals of Principal & Accrued Interest
$ $
32. Total Non Farm Liabilities (add the three bolded cells with $ signs in line 30 and line 31) 32B $
TOTAL COMBINED FARM AND NON-FARM LIABILITIES- BEGINNING OF YEAR
33. Total Combined Farm and Non Farm Liabilities (Add Lines 29B & 32B) 33B
$
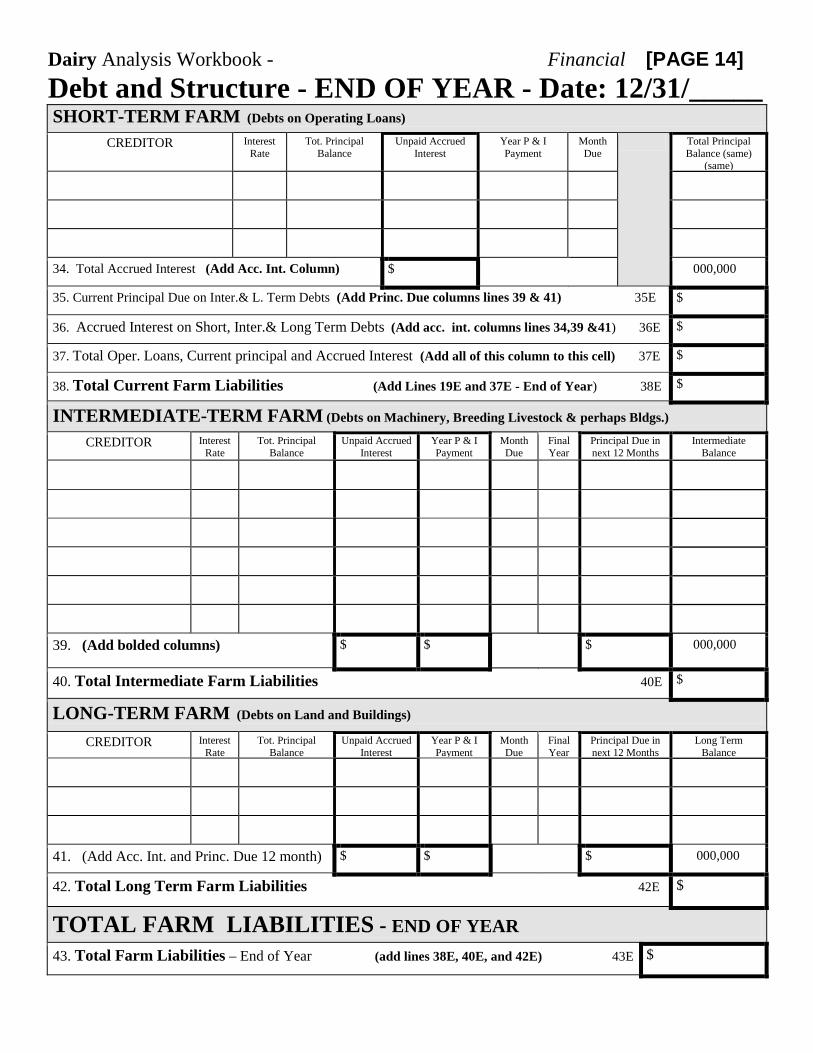
Dairy Analysis Workbook - Financial [PAGE 14] Debt and Structure - END OF YEAR - Date: 12/31/_____
SHORT-TERM FARM (Debts on Operating Loans)
CREDITOR Interest Rate
Tot. Principal Balance
Unpaid Accrued Interest
Year P & I Payment
Month Due
Total Principal Balance (same)
(same)
34. Total Accrued Interest (Add Acc. Int. Column) $ 000,000
35. Current Principal Due on Inter.& L. Term Debts (Add Princ. Due columns lines 39 & 41) 35E $
36. Accrued Interest on Short, Inter.& Long Term Debts (Add acc. int. columns lines 34,39 &41) 36E $
37. Total Oper. Loans, Current principal and Accrued Interest (Add all of this column to this cell) 37E $
38. Total Current Farm Liabilities (Add Lines 19E and 37E - End of Year) 38E $
INTERMEDIATE-TERM FARM (Debts on Machinery, Breeding Livestock & perhaps Bldgs.)
CREDITOR Interest Rate
Tot. Principal Balance
Unpaid Accrued Interest
Year P & I Payment
Month Due
Final Year
Principal Due in next 12 Months
Intermediate Balance
39. (Add bolded columns) $ $ $ 000,000
40. Total Intermediate Farm Liabilities 40E $
LONG-TERM FARM (Debts on Land and Buildings)
CREDITOR Interest Rate
Tot. Principal Balance
Unpaid Accrued Interest
Year P & I Payment
Month Due
Final Year
Principal Due in next 12 Months
Long Term Balance
41. (Add Acc. Int. and Princ. Due 12 month) $ $ $ 000,000
42. Total Long Term Farm Liabilities 42E $
TOTAL FARM LIABILITIES - END OF YEAR 43. Total Farm Liabilities – End of Year (add lines 38E, 40E, and 42E) 43E $
Dairy Analysis Workbook - Financial [PAGE 15]
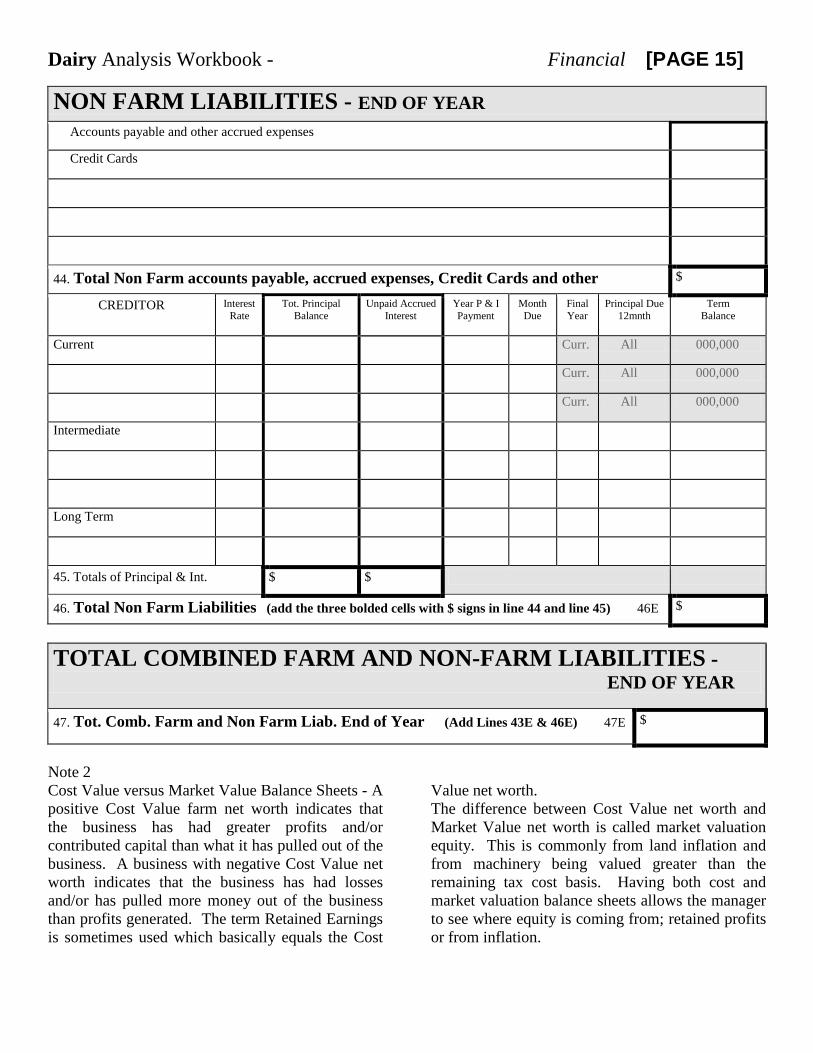
NON FARM LIABILITIES - END OF YEAR Accounts payable and other accrued expenses
Credit Cards
44. Total Non Farm accounts payable, accrued expenses, Credit Cards and other $
CREDITOR Interest Rate
Tot. Principal Balance
Unpaid Accrued Interest
Year P & I Payment
Month Due
Final Year
Principal Due 12mnth
Term Balance
Current Curr. All 000,000
Curr. All 000,000
Curr. All 000,000
Intermediate
Long Term
45. Totals of Principal & Int. $ $
46. Total Non Farm Liabilities (add the three bolded cells with $ signs in line 44 and line 45) 46E $
TOTAL COMBINED FARM AND NON-FARM LIABILITIES - END OF YEAR
47. Tot. Comb. Farm and Non Farm Liab. End of Year (Add Lines 43E & 46E) 47E $
Note 2 Cost Value versus Market Value Balance Sheets - A positive Cost Value farm net worth indicates that the business has had greater profits and/or contributed capital than what it has pulled out of the business. A business with negative Cost Value net worth indicates that the business has had losses and/or has pulled more money out of the business than profits generated. The term Retained Earnings is sometimes used which basically equals the Cost
Value net worth. The difference between Cost Value net worth and Market Value net worth is called market valuation equity. This is commonly from land inflation and from machinery being valued greater than the remaining tax cost basis. Having both cost and market valuation balance sheets allows the manager to see where equity is coming from; retained profits or from inflation.

Dairy Analysis Workbook - Financial [PAGE 16] Summary and Comparison Sheet for Assets and Liabilities ASSETS Beginning of Year
Date: 1/1/____ End of Year
Date: 12/31/____ NOTE: For Total Farm Current Assets use cell 7B for both Cost Value & Market Value for Beginning Year; use cell 7E for both Cost Value & Market Value for End of Year
Cost Value Market Value
Cost Value Market Value
48. Total Farm Current Assets (line 7)
49. Total Farm Intermediate (line 11)
50. Total Farm Long-Term Farm (line 15)
51. Total Farm Assets (add lines 48, 49, 50) $ $ $ $
52. Non Farm Assets (line 17)
53. Total Combined Farm & Non-Farm Assets (add lines 51 and 52)
$ $ $ $
LIABILITIES (Cost and Market Values will be the same) NOTE: Cost Value and Market Values are the same for the Beginning of Year and Cost Value and Market Values are the same for the End of the Year columns for Liabilities
Cost Value Market Value
Cost Value Market Value
Beg. of Yr. End of Yr. 54. Total Farm Current Liabilities (24B) (38E)
55. Total Farm Interm. Liabilities (26B) (40E)
56. Total Farm L. T. Liabilities (28B) (42E)
57. Total Farm Liabilities (add lines 54, 55 & 56) $ $ $ $
58. Non Farm Liabilities (32B) (46E)
59. Total Combined Farm & Non-Farm Liabilities (add lines 57 & 58)
$ $ $ $
BALANCE SHEET OR NET WORTH COMPARISON Cost Value Market
Value Cost Value Market
Value 60. Farm Net Worth (line 51 minus line 57) $ $ $ $
61. Farm Contingent Tax Liability (optional)
62. Farm Net Worth after Contingent Tax Liability (line 60 minus 61)
$ $ $ $
63. Non Farm Net Worth (line 52 minus line 58) $ $ $ $
64. Non Farm Contingent Tax Liability (optional)
65. Non Farm Net Worth after Contingent Tax Liability (line 63 minus line 64)
$ $ $ $
66. Tot. Combined Farm & Non Farm Net Worth (add lines 62 and 65)
$ $ $ $
67. Farm Market Valuation Equity (See note 2) (line 51 Market Value minus line 51 Cost Value for each year)
XXXXXXXX $ XXXXXXXX $
68. Change in Combined Net Worth for the year (use line 66 for both CV and MV, Ending minus Beginning)
XXXXXXXX XXXXXXXX $ $
Dairy Analysis Workbook - Financial [PAGE 17] INCOME STATEMENT - Explanations The profit and loss statement or NET FARM INCOME presents a summary of income, related expenses and the resultant profit or loss from operations for a given period, normally one year. The income statement starts with the NET CASH FARM INCOME and then makes inventory adjustments to determine NET OPERATING PROFIT. Depreciation and other capital adjustments are made next to determine NET FARM INCOME. By comparing profit and loss statements for several years, you can see trends in your business. If you use a profit and loss statement along with a balance sheet, you can calculate your return on investment. An income statement must include adjustments for inventories, and depreciation. NET CASH FARM INCOME is simply the
difference between total cash income and total cash expenses. This value minus tax depreciation is what are subject to cash basis income taxes. NET OPERATING PROFIT takes into account inventory changes of current assets and unpaid bills. These changes are often huge and make significant differences to the income statement. A feed shortage due to drought often will not show in cash flow until next year. NET FARM INCOME takes into account depreciation and other capital activities. This is where the cost of machinery, buildings and other assets with a life of more than one year gets accounted for. The change in inventory of Breeding Livestock is accounted for in this section. The Net Farm Income is the return to unpaid labor and management and the farm equity used in the business.
B=Beginning, E=Ending, C=Cost Value, M=Market Value
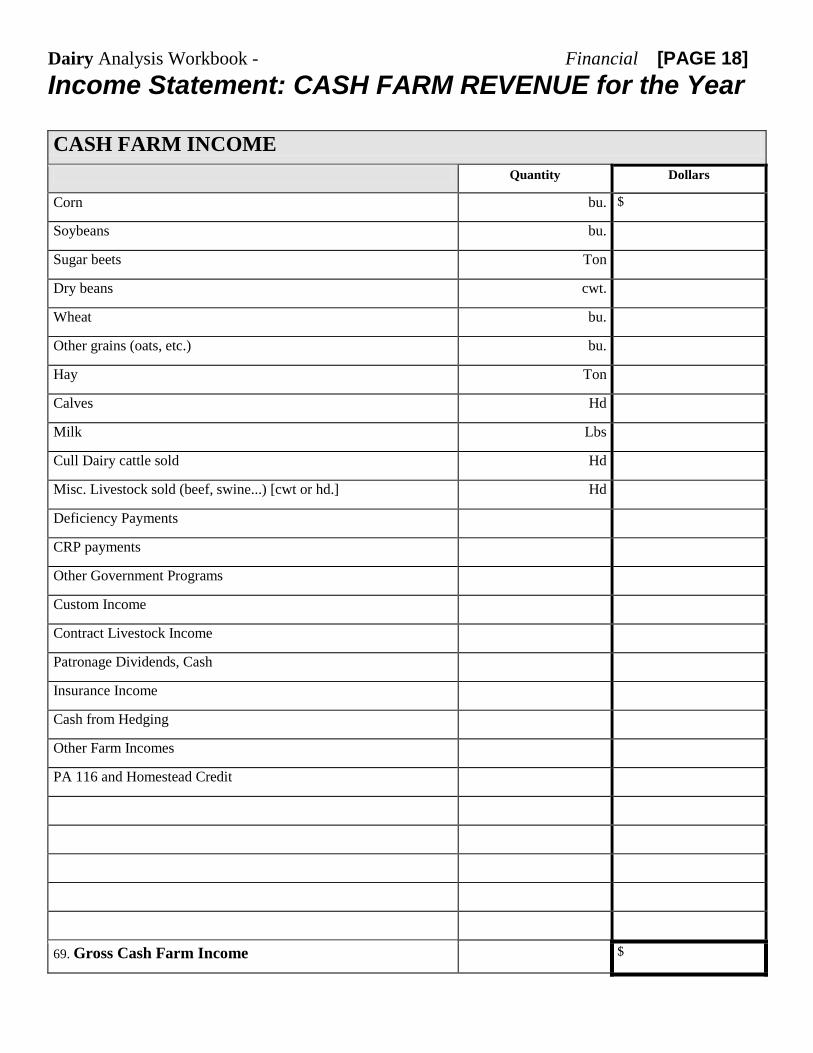
Dairy Analysis Workbook - Financial [PAGE 18] Income Statement: CASH FARM REVENUE for the Year CASH FARM INCOME
Quantity Dollars
Corn bu. $
Soybeans bu.
Sugar beets Ton
Dry beans cwt.
Wheat bu.
Other grains (oats, etc.) bu.
Hay Ton
Calves Hd
Milk Lbs
Cull Dairy cattle sold Hd
Misc. Livestock sold (beef, swine...) [cwt or hd.] Hd
Deficiency Payments
CRP payments
Other Government Programs
Custom Income
Contract Livestock Income
Patronage Dividends, Cash
Insurance Income
Cash from Hedging
Other Farm Incomes
PA 116 and Homestead Credit
69. Gross Cash Farm Income $
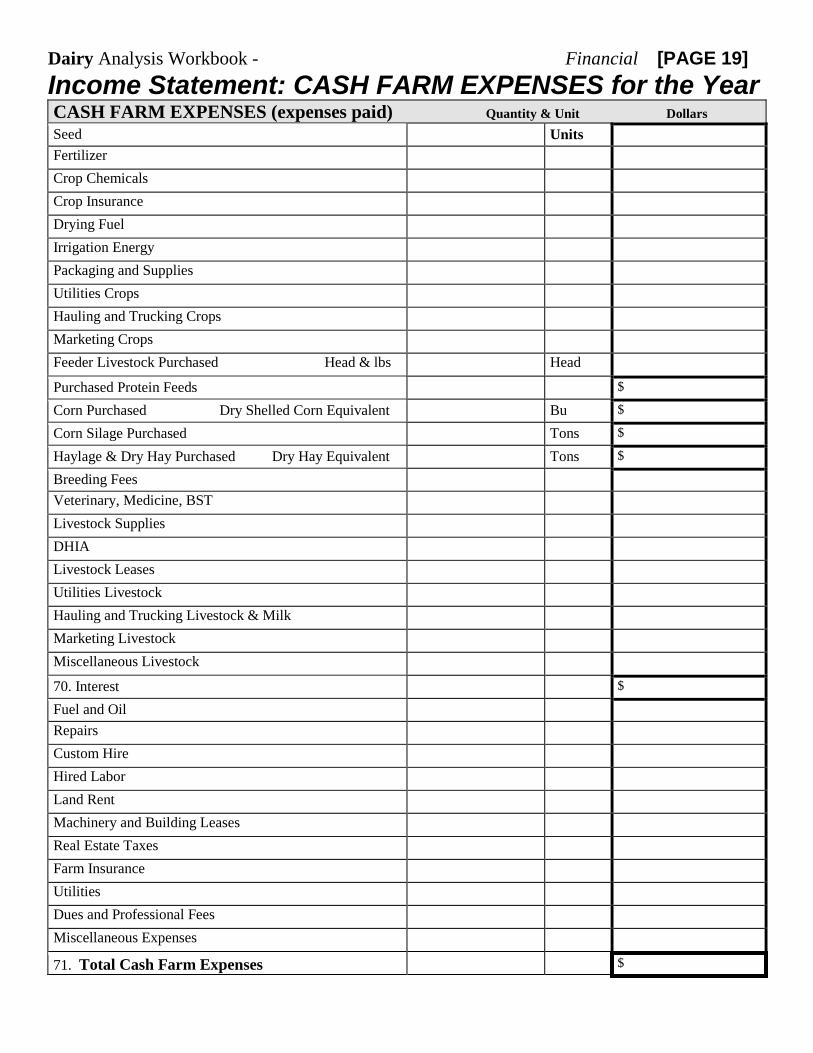
Dairy Analysis Workbook - Financial [PAGE 19] Income Statement: CASH FARM EXPENSES for the Year CASH FARM EXPENSES (expenses paid) Quantity & Unit Dollars Seed Units
Fertilizer
Crop Chemicals
Crop Insurance
Drying Fuel
Irrigation Energy
Packaging and Supplies
Utilities Crops
Hauling and Trucking Crops
Marketing Crops
Feeder Livestock Purchased Head & lbs Head
Purchased Protein Feeds
$
Corn Purchased Dry Shelled Corn Equivalent
Bu $
Corn Silage Purchased
Tons $
Haylage & Dry Hay Purchased Dry Hay Equivalent Tons $
Breeding Fees
Veterinary, Medicine, BST
Livestock Supplies
DHIA
Livestock Leases
Utilities Livestock
Hauling and Trucking Livestock & Milk
Marketing Livestock
Miscellaneous Livestock
70. Interest $
Fuel and Oil
Repairs
Custom Hire
Hired Labor
Land Rent
Machinery and Building Leases
Real Estate Taxes
Farm Insurance
Utilities
Dues and Professional Fees
Miscellaneous Expenses
71. Total Cash Farm Expenses $

Dairy Analysis Workbook - Financial [PAGE 20]
72. NET CASH FARM INCOME (Line 69 minus Line 71) $
INVENTORY CHANGES
*Note: The numbers below the cell or box is where you find your value.
Crop & Feed Market Livestock
Receivables & other
income items
Prepaid Expenses
Payables & Accrued Expenses
73. Ending Inventory
(line 5E) (line 6E) (line 4E+3E) (line 2E) (line 19B+22B) (Beginning)
74. Beginning Inventory
(line 5B) (line 6B) (line 4B+3B) (line 2B (line 19E+36E) (Ending)
75. Inventory Change (line 73 minus line 74)
$ $ $ $ $
76. Total Inventory Change $
(Combine all cells in line 75. Make sure to add or subtract depending on the cell’s individual value.)
77. NET OPERATING PROFIT (Line 72 combined with line 76) $
DEPRECIATION AND OTHER CAPITAL ADJUSTMENTS
Breeding Livestock
Machinery & Equipment
Building & Improvements
Other Assets
78. Ending Inventory
(line 8E) (line 9EC) (line 13EC) (line 10EC+14EC) 79. Capital Sales ( + )
(Separate out sales by categories) (line 85) (line 85) (line 85) (line 85) 80. Beginning Inventory ( - )
(line8B) (line 9BC) (line 13BC) (line 10BC+14BC) 81. Capital Purchases ( - )
(Separate out purchases by categories) (line 90) (line 90) (line 90) (line 90) 82. Depreciation/Capital Adjust. ( = ) (Line 78 plus L. 79 minus L. 80 minus L. 81)
$ $ $ $
83. Total Depreciation/Capital Adjustment (Combine all cells in line 82. Make sure to add or subtract depending on your cell’s individual value.)
$
84. NET FARM INCOME (Cost Value) (line 77 combined with line 83) $
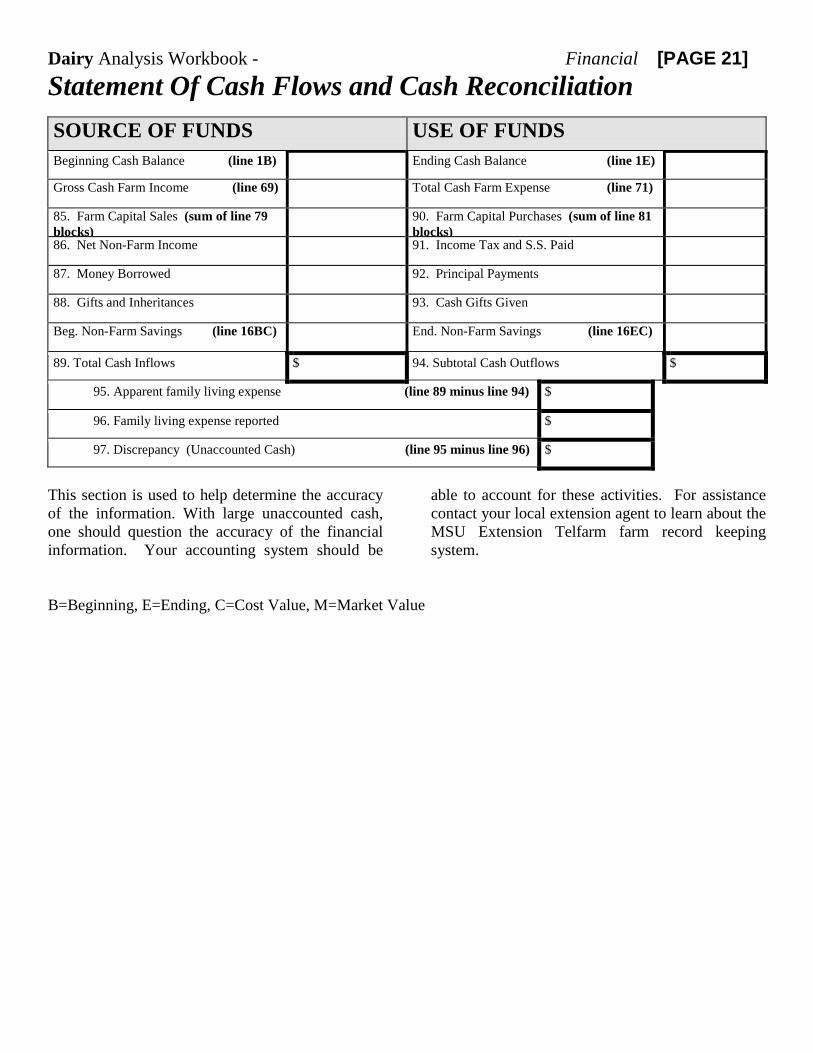
Dairy Analysis Workbook - Financial [PAGE 21] Statement Of Cash Flows and Cash Reconciliation
SOURCE OF FUNDS USE OF FUNDS
Beginning Cash Balance (line 1B) Ending Cash Balance (line 1E)
Gross Cash Farm Income (line 69) Total Cash Farm Expense (line 71)
85. Farm Capital Sales (sum of line 79 blocks)
90. Farm Capital Purchases (sum of line 81 blocks)
86. Net Non-Farm Income 91. Income Tax and S.S. Paid
87. Money Borrowed 92. Principal Payments
88. Gifts and Inheritances 93. Cash Gifts Given
Beg. Non-Farm Savings (line 16BC) End. Non-Farm Savings (line 16EC)
89. Total Cash Inflows $ 94. Subtotal Cash Outflows $
95. Apparent family living expense (line 89 minus line 94) $
96. Family living expense reported $
97. Discrepancy (Unaccounted Cash) (line 95 minus line 96) $
This section is used to help determine the accuracy of the information. With large unaccounted cash, one should question the accuracy of the financial information. Your accounting system should be
able to account for these activities. For assistance contact your local extension agent to learn about the MSU Extension Telfarm farm record keeping system.
B=Beginning, E=Ending, C=Cost Value, M=Market Value
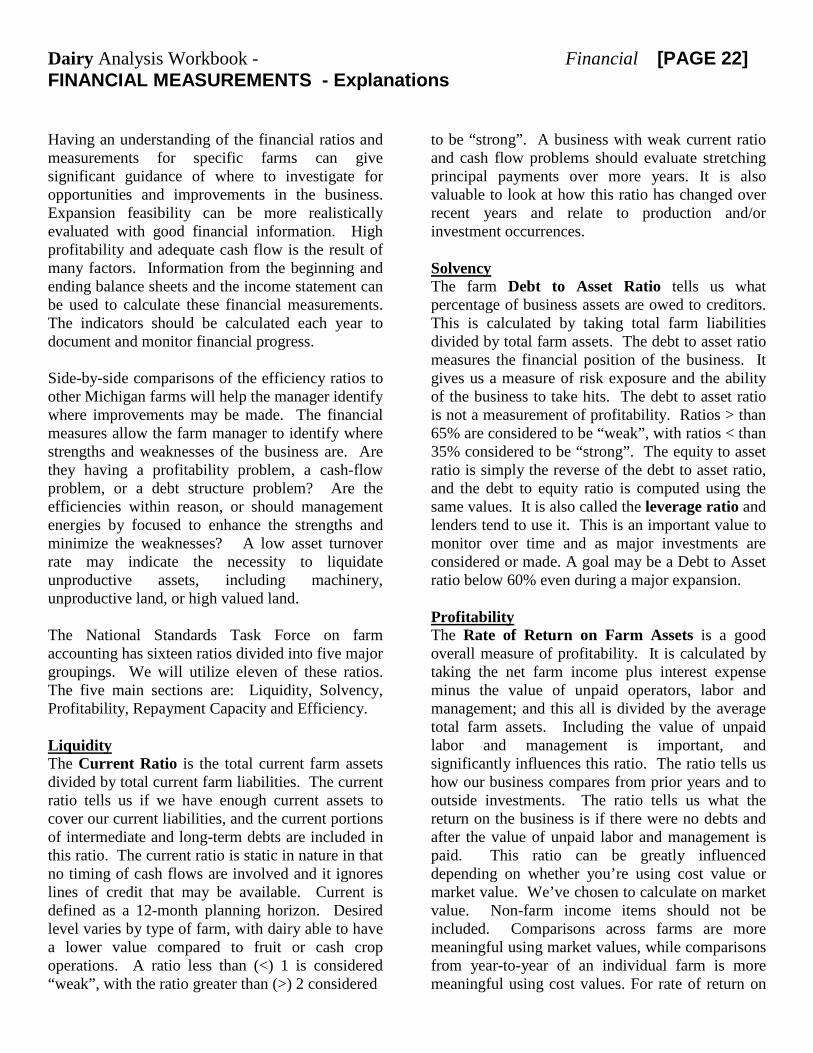
Dairy Analysis Workbook - Financial [PAGE 22] FINANCIAL MEASUREMENTS - Explanations Having an understanding of the financial ratios and measurements for specific farms can give significant guidance of where to investigate for opportunities and improvements in the business. Expansion feasibility can be more realistically evaluated with good financial information. High profitability and adequate cash flow is the result of many factors. Information from the beginning and ending balance sheets and the income statement can be used to calculate these financial measurements. The indicators should be calculated each year to document and monitor financial progress. Side-by-side comparisons of the efficiency ratios to other Michigan farms will help the manager identify where improvements may be made. The financial measures allow the farm manager to identify where strengths and weaknesses of the business are. Are they having a profitability problem, a cash-flow problem, or a debt structure problem? Are the efficiencies within reason, or should management energies by focused to enhance the strengths and minimize the weaknesses? A low asset turnover rate may indicate the necessity to liquidate unproductive assets, including machinery, unproductive land, or high valued land. The National Standards Task Force on farm accounting has sixteen ratios divided into five major groupings. We will utilize eleven of these ratios. The five main sections are: Liquidity, Solvency, Profitability, Repayment Capacity and Efficiency. Liquidity The Current Ratio is the total current farm assets divided by total current farm liabilities. The current ratio tells us if we have enough current assets to cover our current liabilities, and the current portions of intermediate and long-term debts are included in this ratio. The current ratio is static in nature in that no timing of cash flows are involved and it ignores lines of credit that may be available. Current is defined as a 12-month planning horizon. Desired level varies by type of farm, with dairy able to have a lower value compared to fruit or cash crop operations. A ratio less than (<) 1 is considered “weak”, with the ratio greater than (>) 2 considered
to be “strong”. A business with weak current ratio and cash flow problems should evaluate stretching principal payments over more years. It is also valuable to look at how this ratio has changed over recent years and relate to production and/or investment occurrences. Solvency The farm Debt to Asset Ratio tells us what percentage of business assets are owed to creditors. This is calculated by taking total farm liabilities divided by total farm assets. The debt to asset ratio measures the financial position of the business. It gives us a measure of risk exposure and the ability of the business to take hits. The debt to asset ratio is not a measurement of profitability. Ratios > than 65% are considered to be “weak”, with ratios < than 35% considered to be “strong”. The equity to asset ratio is simply the reverse of the debt to asset ratio, and the debt to equity ratio is computed using the same values. It is also called the leverage ratio and lenders tend to use it. This is an important value to monitor over time and as major investments are considered or made. A goal may be a Debt to Asset ratio below 60% even during a major expansion. Profitability The Rate of Return on Farm Assets is a good overall measure of profitability. It is calculated by taking the net farm income plus interest expense minus the value of unpaid operators, labor and management; and this all is divided by the average total farm assets. Including the value of unpaid labor and management is important, and significantly influences this ratio. The ratio tells us how our business compares from prior years and to outside investments. The ratio tells us what the return on the business is if there were no debts and after the value of unpaid labor and management is paid. This ratio can be greatly influenced depending on whether you’re using cost value or market value. We’ve chosen to calculate on market value. Non-farm income items should not be included. Comparisons across farms are more meaningful using market values, while comparisons from year-to-year of an individual farm is more meaningful using cost values. For rate of return on

Dairy Analysis Workbook - Financial [PAGE 23] farm assets, ratios <4% are considered “weak”, while >10% are considered to be “strong”. The Rate of Return on Farm Equity measures how well your equity capital is being employed by the business. It is calculated by taking the net farm income, minus the value of operator’s unpaid labor and management, divided by the average total farm equity. Highly leveraged and under capitalized farms can get wild results. If your debt is working for you, the return on equity will be higher than the return on assets. If the farm has no debt, the return on equity will be the same as the return on assets. Rate of return on farm equity should be higher than rate of return on assets, but ratios <6% are considered “weak”, while ratios >12% are considered “strong”. The Operating Profit Margin ratio measures the efficiency in terms of the return per dollar of sales. The operating profit is before interest expense, but after taking a charge for the value of unpaid labor and management. A low operating profit margin can be caused by low production, low prices, or high input costs. These input costs include all the expenses included under cash farm expenses, but not including interest. Interest expense does not affect the operating profit margin. A high value of unpaid labor management will reduce the operating profit margin. Depreciation is also not part of the ratio. Big-ticket items on dairy operations are: crop expenses, purchased feed, labor, veterinary costs, livestock supplies and repairs. Operating profit margin ratios <10% are considered “weak”, while ratios >20% are considered “strong”. The operating profit margin ratio calculates the profit of the business without taking into consideration interest, but after taking into account the value of unpaid labor and management. A farm heavily leveraged must have a strong rate of return on farm assets, while a business that has relatively low debt, or no debt, can be quite profitable from an income tax standpoint, and provide significant family living and some increase in net worth. A low operating profit margin can be caused by low milk production, low crop yields and/or low milk prices. It can also be caused by high input cost, including: fertilizer expense where manure is not utilized, high chemical expenses from poor weed control, high cost of purchased feed,
including corn and hay, and purchased protein feeds. Poor quality forages may necessitate high purchase feed, while in other circumstances, balancing rations for unrealistic milk production levels can cause high feed expenses. Veterinary and medicines, livestock supplies and hired labor are other areas often identified on dairy operations as needing attention. High labor is sometimes identified with inefficient facilities. Repayment Capacity The Term Debt Coverage Ratio measures the ability of businesses to cover all intermediate and long-term debt payments. It is calculated by taking net earnings, which includes farm and non-farm earnings plus depreciation, plus interest on the intermediate and long-term debts divided by the annual scheduled principle and interest on the intermediate and long-term debts. Notice that the amount of money available for debt servicing of the intermediate and long-term debts does not include the interest that is paid on short-term one year and operating loans. The ratio of 1 or 100% means that there is just enough money to service the debt. Ratios less than 115% are considered “weak”, while ratios greater than 140% are considered “strong”. The farm with a weak repayment capacity may or may not have a profitability problem. Repayment capacity is a measurement of the ability of the business to pay interest and principal in relationship to how debt is structured. A fast debt repayment structure will generate a lower repayment capacity. The farm may be experiencing cash flow problems, creating a weak current ratio, because of the fast repayment schedule. A farm with a relatively good rate of return on assets and net farm income ratio, but a weak repayment capacity can restructure its debt to spread out payments and improve cash flow.
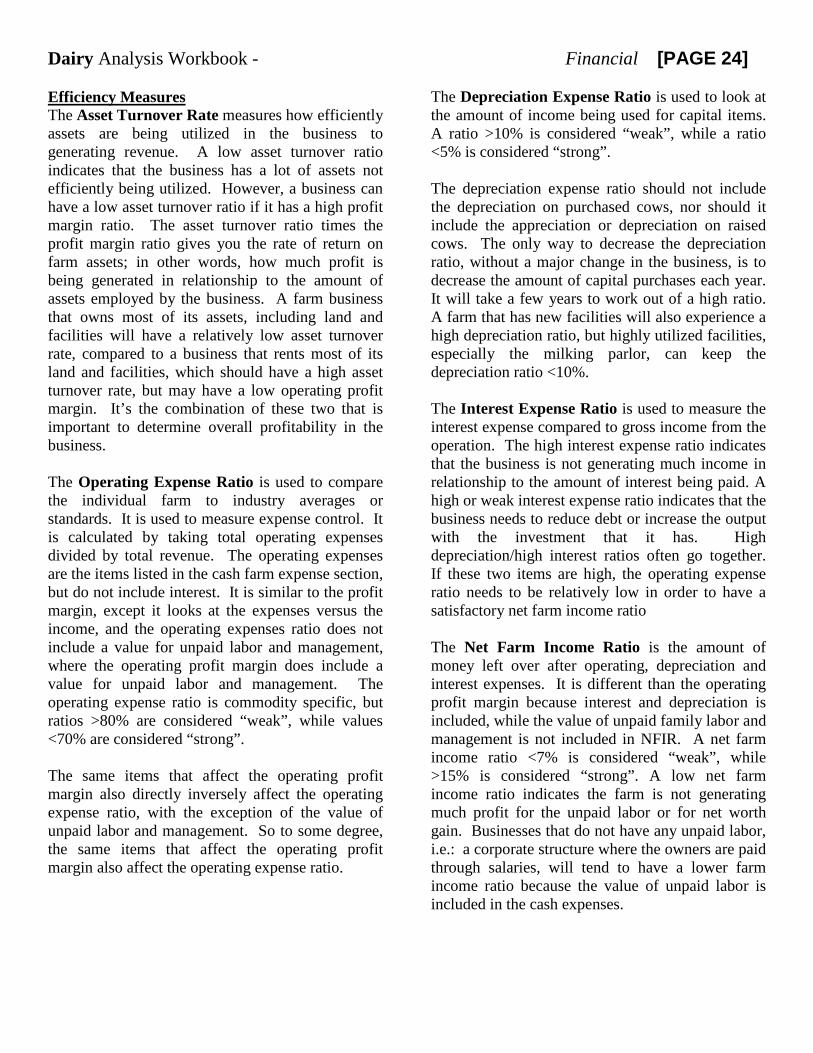
Dairy Analysis Workbook - Financial [PAGE 24] Efficiency Measures The Asset Turnover Rate measures how efficiently assets are being utilized in the business to generating revenue. A low asset turnover ratio indicates that the business has a lot of assets not efficiently being utilized. However, a business can have a low asset turnover ratio if it has a high profit margin ratio. The asset turnover ratio times the profit margin ratio gives you the rate of return on farm assets; in other words, how much profit is being generated in relationship to the amount of assets employed by the business. A farm business that owns most of its assets, including land and facilities will have a relatively low asset turnover rate, compared to a business that rents most of its land and facilities, which should have a high asset turnover rate, but may have a low operating profit margin. It’s the combination of these two that is important to determine overall profitability in the business. The Operating Expense Ratio is used to compare the individual farm to industry averages or standards. It is used to measure expense control. It is calculated by taking total operating expenses divided by total revenue. The operating expenses are the items listed in the cash farm expense section, but do not include interest. It is similar to the profit margin, except it looks at the expenses versus the income, and the operating expenses ratio does not include a value for unpaid labor and management, where the operating profit margin does include a value for unpaid labor and management. The operating expense ratio is commodity specific, but ratios >80% are considered “weak”, while values <70% are considered “strong”. The same items that affect the operating profit margin also directly inversely affect the operating expense ratio, with the exception of the value of unpaid labor and management. So to some degree, the same items that affect the operating profit margin also affect the operating expense ratio.
The Depreciation Expense Ratio is used to look at the amount of income being used for capital items. A ratio >10% is considered “weak”, while a ratio <5% is considered “strong”. The depreciation expense ratio should not include the depreciation on purchased cows, nor should it include the appreciation or depreciation on raised cows. The only way to decrease the depreciation ratio, without a major change in the business, is to decrease the amount of capital purchases each year. It will take a few years to work out of a high ratio. A farm that has new facilities will also experience a high depreciation ratio, but highly utilized facilities, especially the milking parlor, can keep the depreciation ratio <10%. The Interest Expense Ratio is used to measure the interest expense compared to gross income from the operation. The high interest expense ratio indicates that the business is not generating much income in relationship to the amount of interest being paid. A high or weak interest expense ratio indicates that the business needs to reduce debt or increase the output with the investment that it has. High depreciation/high interest ratios often go together. If these two items are high, the operating expense ratio needs to be relatively low in order to have a satisfactory net farm income ratio The Net Farm Income Ratio is the amount of money left over after operating, depreciation and interest expenses. It is different than the operating profit margin because interest and depreciation is included, while the value of unpaid family labor and management is not included in NFIR. A net farm income ratio <7% is considered “weak”, while >15% is considered “strong”. A low net farm income ratio indicates the farm is not generating much profit for the unpaid labor or for net worth gain. Businesses that do not have any unpaid labor, i.e.: a corporate structure where the owners are paid through salaries, will tend to have a lower farm income ratio because the value of unpaid labor is included in the cash expenses.

Dairy Analysis Workbook - Financial [PAGE 25] Year _________
FINANCIAL MEASUREMENTS Beginning of Year
End of Year
LIQUIDITY 98. Current Farm Assets (line 7B) and (line 7E) $ $
99. Current Farm Liabilities (line 24B) and (line 38E) $ $
100. Farm Current Ratio (line 98 divided by line 99)
SOLVENCY 101. Total Farm Debt (line 29 B) and (line 43 E) $ $
102. Total Farm Assets (line 51 BM) and (Line 51 EM) $ $
103. Debt to Asset Ratio (Farm,Market) (line 101 divided by line 102) X 100 % %
PROFITABILITY _____ 104. Net Farm Income (Market Value) (Line 84 plus line 67EM minus line 67BM) $
105. Farm Total Accrual Interest (line 70 plus line 36E minus line 22B) $
106. Value of Unpaid Family labor and Management (what is yours and others time worth) $
107. Average Farm Assets (Market Value) ((line 102B plus line 102E) divided by 2) $
108. Rate of Ret. on Farm Assets ((line104 plus line105 minus line106) divided by line107) X 100 %
109. Average Total Farm Equity ((line 60BM plus line 60EM) divided by 2) $
110. Rate of Return on Farm Equity ((line 104 minus line 106) divided by line 109) X 100 %
111. Operating Profit Margin (line104 plus line105 minus line106) divided by line116) X 100 %
REPAYMENT CAPACITY – Accrual 112. Cash Available for Principal and Interest (line 77 plus line 105 minus interest expense only on operating and short term debts plus line 86 minus line 95 minus line 91)
113. (sum of scheduled yearly P & I payments on Interm. And Long Term Debts from lines 25 and 27)
114. Term Debt Coverage Ratio - Accrual (line 112 divided by line 113) X 100 %
EFFICIENCY 115. Gross Farm Income (line 69 plus line 3E plus line 4E plus line 5E plus line 6E minus line 3B minus line 4B minus line 5B minus line 6B)
$
116. Value of Farm Production (line 115 minus purchased livestock and purchased feed from line 71) $
117. Asset Turnover Ratio (Market Value) (line 116 divided by line 107) X 100 %
118. Operating Expense Ratio (Cost Value) ((line71 minus line105 plus line19E minus line19B minus line2E plus line2B) divided by line115) X 100
%
119. Depreciation Expense Ratio (Cost Value) (line 83 divided by line 115) X 100 %
120. Interest Expense Ratio (Cost Value) (line 105 divided by line 115) X 100 %
121. Net Farm Income Ratio (Cost Value) (line 84 divided by line 115) X 100 %
Dairy Analysis Workbook - Financial [PAGE 26]
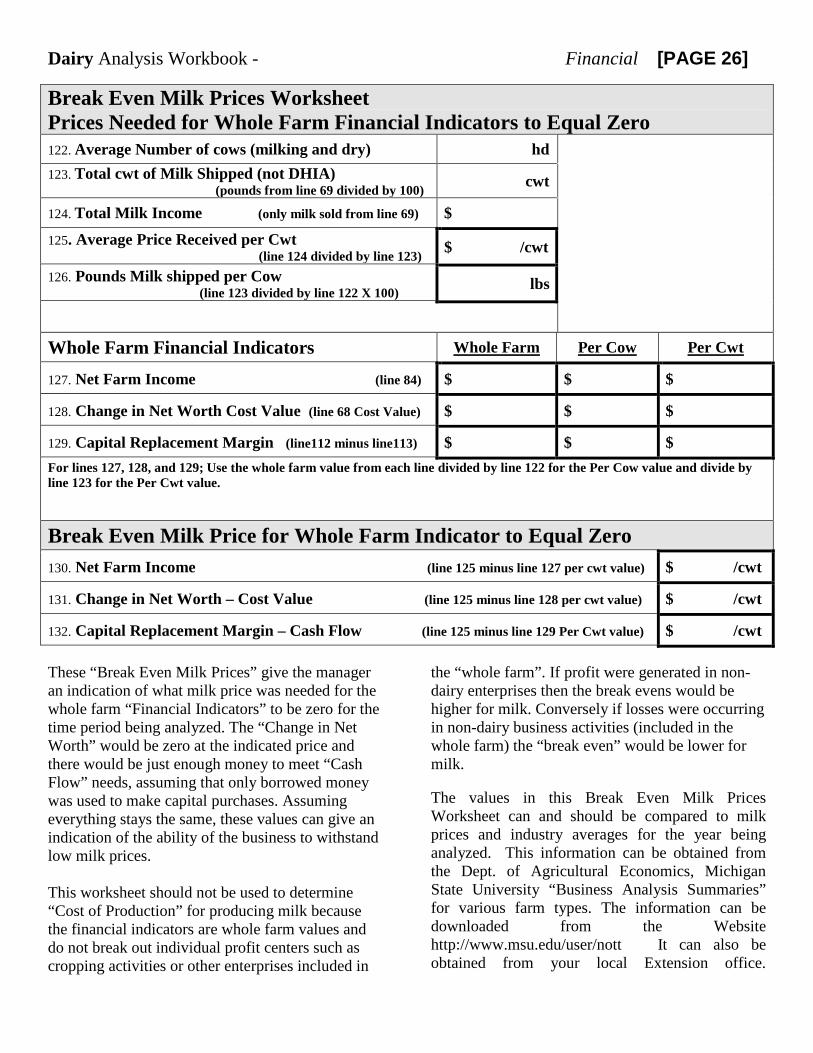
Break Even Milk Prices Worksheet Prices Needed for Whole Farm Financial Indicators to Equal Zero
122. Average Number of cows (milking and dry) hd
123. Total cwt of Milk Shipped (not DHIA) (pounds from line 69 divided by 100) cwt
124. Total Milk Income (only milk sold from line 69) $
125. Average Price Received per Cwt (line 124 divided by line 123) $ /cwt
126. Pounds Milk shipped per Cow (line 123 divided by line 122 X 100) lbs
Whole Farm Financial Indicators Whole Farm Per Cow Per Cwt
127. Net Farm Income (line 84) $ $ $
128. Change in Net Worth Cost Value (line 68 Cost Value) $ $ $
129. Capital Replacement Margin (line112 minus line113) $ $ $ For lines 127, 128, and 129; Use the whole farm value from each line divided by line 122 for the Per Cow value and divide by line 123 for the Per Cwt value.
Break Even Milk Price for Whole Farm Indicator to Equal Zero 130. Net Farm Income (line 125 minus line 127 per cwt value) $ /cwt
131. Change in Net Worth – Cost Value (line 125 minus line 128 per cwt value) $ /cwt
132. Capital Replacement Margin – Cash Flow (line 125 minus line 129 Per Cwt value) $ /cwt
These “Break Even Milk Prices” give the manager an indication of what milk price was needed for the whole farm “Financial Indicators” to be zero for the time period being analyzed. The “Change in Net Worth” would be zero at the indicated price and there would be just enough money to meet “Cash Flow” needs, assuming that only borrowed money was used to make capital purchases. Assuming everything stays the same, these values can give an indication of the ability of the business to withstand low milk prices. This worksheet should not be used to determine “Cost of Production” for producing milk because the financial indicators are whole farm values and do not break out individual profit centers such as cropping activities or other enterprises included in
the “whole farm”. If profit were generated in non-dairy enterprises then the break evens would be higher for milk. Conversely if losses were occurring in non-dairy business activities (included in the whole farm) the “break even” would be lower for milk. The values in this Break Even Milk Prices Worksheet can and should be compared to milk prices and industry averages for the year being analyzed. This information can be obtained from the Dept. of Agricultural Economics, Michigan State University “Business Analysis Summaries” for various farm types. The information can be downloaded from the Website http://www.msu.edu/user/nott It can also be obtained from your local Extension office.
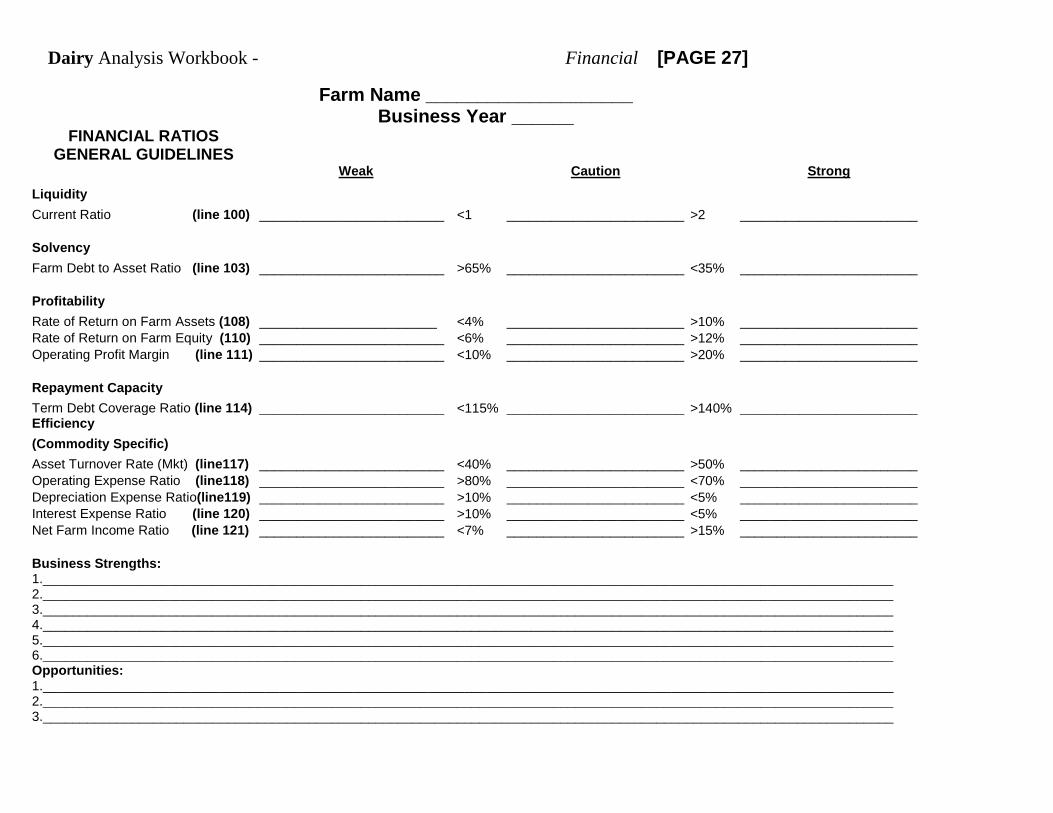
Dairy Analysis Workbook - Financial [PAGE 27]
Farm Name ____________________ Business Year ______
FINANCIAL RATIOS GENERAL GUIDELINES
Weak Caution Strong
Liquidity Current Ratio (line 100) _________________________ <1 ________________________ >2 ________________________
Solvency Farm Debt to Asset Ratio (line 103) _________________________ >65% ________________________ <35% ________________________
Profitability Rate of Return on Farm Assets (108) ________________________ <4% ________________________ >10% ________________________ Rate of Return on Farm Equity (110) _________________________ <6% ________________________ >12% ________________________ Operating Profit Margin (line 111) _________________________ <10% ________________________ >20% ________________________
Repayment Capacity Term Debt Coverage Ratio (line 114) _________________________ <115% ________________________ >140% ________________________ Efficiency (Commodity Specific) Asset Turnover Rate (Mkt) (line117) _________________________ <40% ________________________ >50% ________________________ Operating Expense Ratio (line118) _________________________ >80% ________________________ <70% ________________________ Depreciation Expense Ratio(line119) _________________________ >10% ________________________ <5% ________________________ Interest Expense Ratio (line 120) _________________________ >10% ________________________ <5% ________________________ Net Farm Income Ratio (line 121) _________________________ <7% ________________________ >15% ________________________
Business Strengths: 1.___________________________________________________________________________________________________________________ 2.___________________________________________________________________________________________________________________ 3.___________________________________________________________________________________________________________________ 4.___________________________________________________________________________________________________________________ 5.___________________________________________________________________________________________________________________ 6.___________________________________________________________________________________________________________________ Opportunities: 1.___________________________________________________________________________________________________________________ 2.___________________________________________________________________________________________________________________ 3.___________________________________________________________________________________________________________________
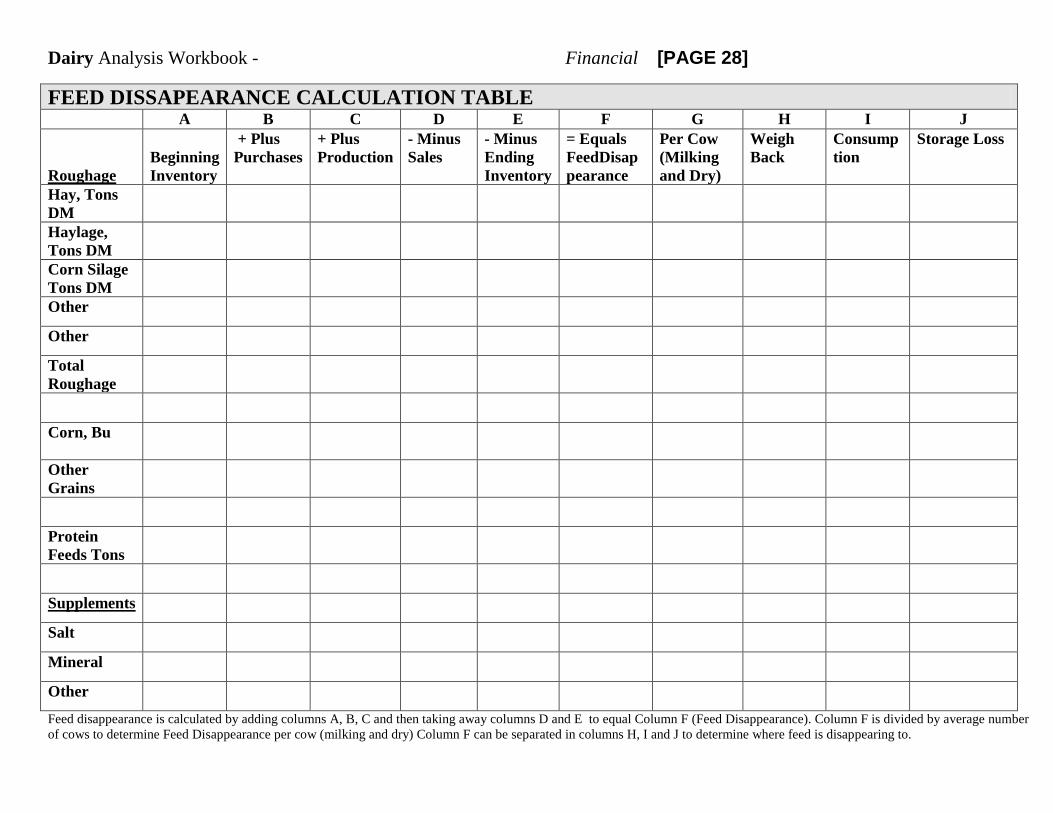
Dairy Analysis Workbook - Financial [PAGE 28]
FEED DISSAPEARANCE CALCULATION TABLE A B C D E F G H I J Roughage
Beginning Inventory
+ Plus Purchases
+ Plus Production
- Minus Sales
- Minus Ending Inventory
= Equals FeedDisappearance
Per Cow (Milking and Dry)
Weigh Back
Consumption
Storage Loss
Hay, Tons DM
Haylage, Tons DM
Corn Silage Tons DM
Other
Other
Total Roughage
Corn, Bu
Other Grains
Protein Feeds Tons
Supplements
Salt
Mineral
Other
Feed disappearance is calculated by adding columns A, B, C and then taking away columns D and E to equal Column F (Feed Disappearance). Column F is divided by average number of cows to determine Feed Disappearance per cow (milking and dry) Column F can be separated in columns H, I and J to determine where feed is disappearing to.