
Spark Summit EU talk by Javier Aguedes
34
Origin-Destination Matrix Using Mobile Network Data with Spark Dr. Javiera Guedes Teralytics
-
Upload
spark-summit -
Category
Data & Analytics
-
view
224 -
download
0
Transcript of Spark Summit EU talk by Javier Aguedes

Origin-Destination Matrix Using Mobile Network Data with Spark
Dr. Javiera Guedes Teralytics

TeralyticsWe transform raw, human mobile activity data into valuable insights
(near)

We Provide Insights into Human Behavior

Data Privacy
De-identification Re-hashing
Extrapolation K-Anonymization

Problem Overview

OD MatrixIn transportation processes, it is important to understand how many people travel between zones. This interchange is organized in an origin-destination table or matrix.
One approach to statically computing this matrix is:
These factors can be estimated from mobility and census data, surveys, ground truth collection data extrapolation, etc.
With telco data we can do this dynamically, over time, and including mode of transport to answer major transportation questions.

OD Matrix Germany
Zip code level 5 geometries, Germany
Region 1 2 3
1 120 12 58
2 12 80 95
3 56 90 34
1 Matrix per • Time bucket (15 min, hour, day) • Mode of transport (flight, car, train) 8199 zip code level 5 geometries
40 days, 100 Billion events

Approach

ApproachTelco Data
HDFSNetwork Info PostgreSQL
USA: 25 Billion events / day Germany: 3 Billion events / day
Raw Data Processing
Filtering Location Estimation
MoT Detection
Routing (optional)Trip Aggregation
Group By Subscriber
Scala / Spark
K-anonymization

Cell phone tower
Event Generation
O
D

8 AM
9 AM
9:05
8:05
8:20
9:15
9:10
10 AM
10:25
10:05
3 pm
4 pm
4:0510 pm
10:05
11 pm
O
D
Event at cell locationCoverage area
Coverage Areas

O
D
8 AM
9 AM
9:05
8:20
9:15
9:10
10 AM
10:25
10:05
3 pm
4 pm
4:05 pm
10 pm
10:05 pm
11 pm
8:05
Event at cell location
Event at est. location
Confidence area
Location Estimation

O
Event at cell locationLocation estimation Most probable route Alternative route
D
Trip Estimation

O
D
Event at cell locationLocation estimation Most probable routeSubway
Mode of Transport Estimation

Coverage Estimation:
• Expectation Maximization around cell locations using estimated locations of events associated with the cells.
Coverage Area Estimation

Aggregation:
• Can be done in any desired geometry (e.g zip code)
• Reduces the amount of data for visualizations and ensures k-anonymization
• Hexagons are great geometries because they are space-filling and can be approximately nested to archive varying levels of resolution
• Sampling an underlying distribution with hexagons is 13% more accurate than squares
• Allows for fast data analysis and visualization as data can be pre-aggregated into different hexagon levels

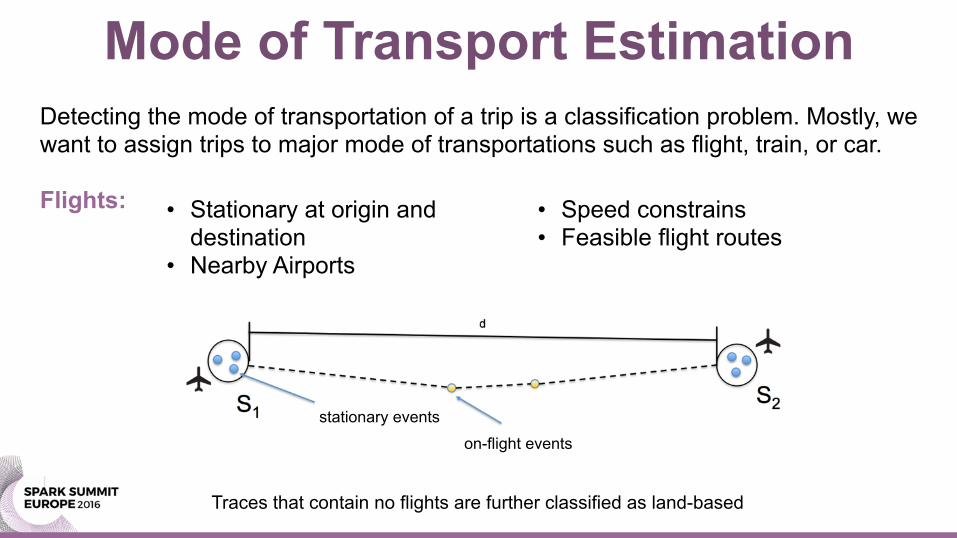
Detecting the mode of transportation of a trip is a classification problem. Mostly, we want to assign trips to major mode of transportations such as flight, train, or car.
Flights: • Stationary at origin and destination
• Nearby Airports
• Speed constrains • Feasible flight routes
stationary events
on-flight events
Traces that contain no flights are further classified as land-based
Mode of Transport Estimation

Detecting the mode of transportation of a trip is a classification problem. Mostly, we want to assign trips to major mode of transportations such as flight, train, or car.
Train / Car:
• Features derived from e.g. distance to railways or highways
pcar / ptrain > t MoT = Car ptrain / pcar > t MoT = Train
• Routing
Mode of Transport Estimation

PRODUCT

OD Matrix Product:
• Departure time from origin • Arrival time at destination • Mode of Transport
• Aggregated by desired region (state, city, zip code, etc.)
• Bucketed in any desired time (15 min, 1 hr, 1 week, etc.)

OD Matrix GermanyGoal:
• Compute a matrix between all zip code level 5 areas in Germany (8199 PLZ5)2
• Bucketed by 15 min, hour, day, or week • Split by mode of transport: flight, car, train
Data:
• 40 days • 100 Billion events
Zip code level 5 geometries, Germany

ExtrapolationThe extrapolation factors for each entry of the OD matrix are computed using the market share of the origin and destination regions.
Estimated local market share based on telco and census data in Germany 0 < MS < 1

OD Matrix Germany
• Telco data is intrinsically dynamic, patterns can be seen varying over time, or even over the course of day.
• Data accompanied by visualizations that allow customers to dice and slice the data for specific regions
Matrix is k-anonymized, i.e. all flow with less than five commuters is removed.

Validation

We validate out results using several criteria and data sets:
• MoT validation using limited calibration data labeled to measure performance.
• Limited ground truth for train and flight trips from our providers and customers • Common sense checks, e.g. whether counts are balanced:
OD[i,j] ~ OD[j,i]
Criteria for Validation
precision recall
flights 0.96 0.81
car 0.96 0.88
train 0.95 0.91

Building up a strong network of women in tech — Javiera Guedes — [email protected] — July 14, 2016 27

Borussia Dortmund vs
M’gladbach
September 11, 2015 54,000 fans
Borussia Park
Bayern Munich vs
FC Augsburg
September 12, 2015 75,000 fans
Allianz Arena
Bundesliga Games

Berlin, Germany

Guangzhou, China

OD Matrix USA
USA

Why SparkOur production code is written entirely in Scala / Spark:
• Terabyte data sets processed on a single job • Fast and compatible with Hadoop HDFS and Accumulo • The domain is easy to parallelize since every trip is independent
Dark Matter Streams | Kavli Institute Stanford University

Why SparkOur production code is written entirely in Scala / Spark:
• Terabyte data sets processed on a single job • Fast and compatible with Hadoop HDFS and Accumulo • The domain is easy to parallelize since every trip is independent • Natural choice of the map / reduce nature of our algorithmic approach
Spark is used for slicing and dicing data in dashboards
Spark was not our top choice for data visualization dashboard, since only small batches of data are queried

THANK [email protected] http://www.teralytics.net