Sparebanken Sør - sor.no · Sparebanken Sør Summary Business Balance Employees Products and...
61
Sparebanken Sør Investor presentation April 2018 CEO Geir Bergskaug
Transcript of Sparebanken Sør - sor.no · Sparebanken Sør Summary Business Balance Employees Products and...

Sparebanken Sør
Investor presentation April 2018 CEO Geir Bergskaug

Sparebanken Sør
• The sixth largest savings bank in Norway with a strong market position in Southern Norway
• High capitalization; Core Tier 1 ratio of 14.9 %, and leverage ratio of 9.2% at 31 December 2017
• Rated A1 (negative outlook) by Moody’s
• Strong asset quality – 65 % of loan book to retail customers
• Very low direct exposure to oil and oil service industry
• Positive development in net interest income in 2017
• Interest margin trend – Flat development in the corporate market while increasing in the retail market
• Loan growth of 7.2 percent during 2017
• Deposit growth of 7.8 percent during 2017
Norwegian economy
• Economic growth in Norway has picked up and unemployment is falling
• Oil investment is set to increase again after the sharp drop that followed the oil price collapse, and a weak
NOK and strong growth abroad support exports. An improving labour market supports private
consumption. Mainland business investments are also on the rise
• Only drag to growth is housing investment which will drop from a high level
• Still large surplus on the current account and government budgets despite the drop in oil price
Southern region economy
• The Southern region is clearly less exposed to oil production than Western Norway
• Registered unemployment in the Southern region remains below 4 % and has decreased at a higher pace
than the national average
• House price development over the past years has been more moderate than average in Norway
Executive summary
2

I Sparebanken Sør
II
III
IV
V
Financial key figures
Funding structure
Table of contents
Capital strategy and development
Planned transaction
VI Norwegian economy
VII Appendix
3

4
Sparebanken Sør – A leading financial institution in Southern Norway
A market with 470 000 inhabitants. No other bank covers this area as widely as Sparebanken Sør. The bank has approximately 175 000 retail customers and 23 000 corporate customers.
In the first quarter of 2017, Sparebanken Sør opened a new office at Bryne in Rogaland. This opens up a market with approx. 60 000 people.
4
*
*CM = Corporate Market, RM = Retail Market
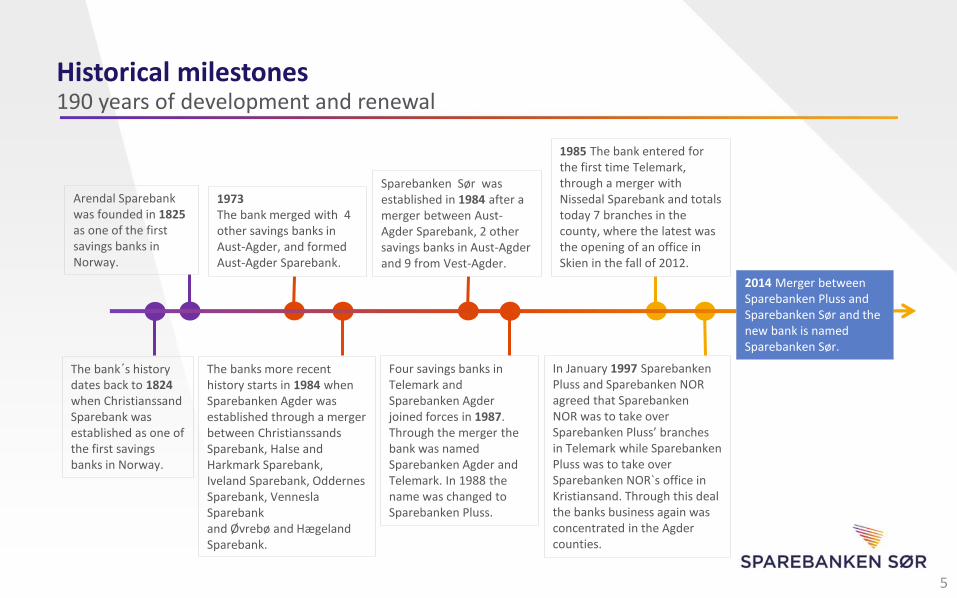
Historical milestones 190 years of development and renewal
Arendal Sparebank was founded in 1825 as one of the first savings banks in Norway.
1973 The bank merged with 4 other savings banks in Aust-Agder, and formed Aust-Agder Sparebank.
Sparebanken Sør was established in 1984 after a merger between Aust-Agder Sparebank, 2 other savings banks in Aust-Agder and 9 from Vest-Agder.
1985 The bank entered for the first time Telemark, through a merger with Nissedal Sparebank and totals today 7 branches in the county, where the latest was the opening of an office in Skien in the fall of 2012.
The bank´s history dates back to 1824 when Christianssand Sparebank was established as one of the first savings banks in Norway.
The banks more recent history starts in 1984 when Sparebanken Agder was established through a merger between Christianssands Sparebank, Halse and Harkmark Sparebank, Iveland Sparebank, Oddernes Sparebank, Vennesla Sparebank and Øvrebø and Hægeland Sparebank.
Four savings banks in Telemark and Sparebanken Agder joined forces in 1987. Through the merger the bank was named Sparebanken Agder and Telemark. In 1988 the name was changed to Sparebanken Pluss.
In January 1997 Sparebanken Pluss and Sparebanken NOR agreed that Sparebanken NOR was to take over Sparebanken Pluss’ branches in Telemark while Sparebanken Pluss was to take over Sparebanken NOR`s office in Kristiansand. Through this deal the banks business again was concentrated in the Agder counties.
2014 Merger between Sparebanken Pluss and Sparebanken Sør and the new bank is named Sparebanken Sør.
5

Sparebanken Sør
Summary
Business
Balance
Employees
Products and services
Sparebanken Sør is an independent financial group with activities within banking, securities and real estate
432 employees in branch offices across the counties of Aust-Agder, Vest-Agder, Telemark and Rogaland
General banking services and products, supplemented by real-estate brokerage, life- and non-life insurance, stock brokerage and leasing through wholly and partially owned subsidiaries and companies As one of the largest regional banks, Sparebanken Sør is committed to further growth and development in the region
The sixth largest Norwegian bank with total assets above NOK 114 billion
6
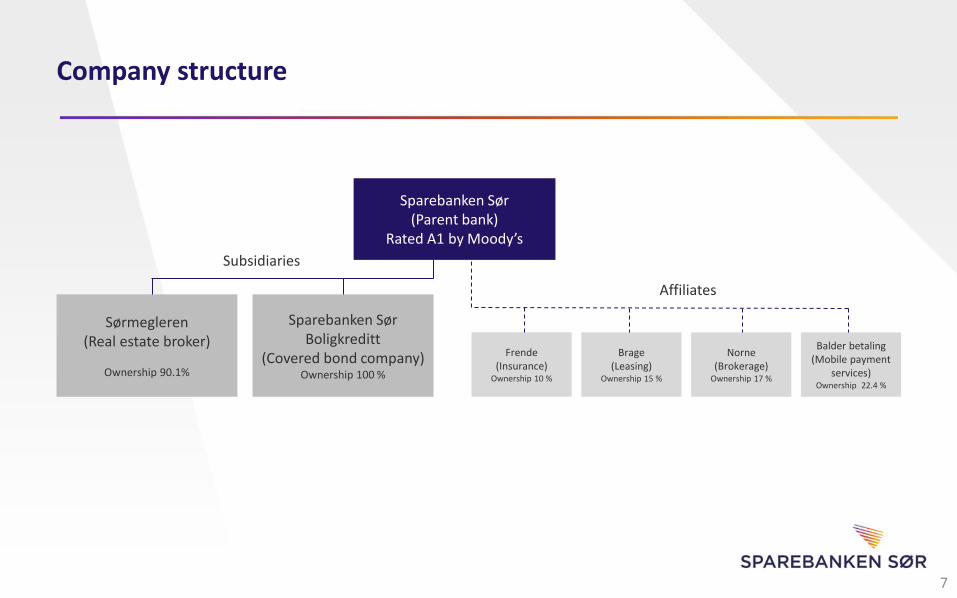
Sparebanken Sør (Parent bank)
Rated A1 by Moody’s
Sørmegleren (Real estate broker)
Ownership 90.1%
Sparebanken Sør Boligkreditt
(Covered bond company) Ownership 100 %
Frende (Insurance)
Ownership 10 %
Brage (Leasing)
Ownership 15 %
Norne (Brokerage)
Ownership 17 %
Subsidiaries
Affiliates
Company structure
Balder betaling (Mobile payment
services) Ownership 22.4 %
7

8
A complete provider of financial services
• Sparebanken Sør Boligkreditt is a wholly owned subsidiary of Sparebanken Sør
• The subsidiary is licensed as a financial enterprise with the right to issue covered bonds, in which investors receive preferential coverage in home mortgages granted by the bank (covered bonds)
• Through the issuance of covered bonds, the Sparebanken Sør Group can offer mortgages with competitive terms to its customers
• Sparebanken Sør is a 90.1%-owner in Sørmegleren Holding AS, which is the parent company of the real estate agency Sørmegleren AS
• Sørmegleren is represented with a total of 14 offices, with its headquarters in Kristiansand
• Conveys about 2.200 homes a year, and is the regions largest real estate agency
Suppliers Business partners
• Sparebanken Sør entered in 2008 as a 10%-owner in Frende Holding and is one of 15 independent savings banks with holdings
• Frende has 175 000 customers and offers insurance, both life and general, to corporate and retail customers
• Brage Finans is a financing company owned by 12 independent savings banks, and Sparebanken Sør is a 15%-owner
• The distribution of the company's products is handled through the ownerbanks through its own sales organization
• Sparebanken Sør is a 17% co-owner in Norne Sec. and is one of 14 independent savings banks with holdings
• Norne is a full service investment firm with corporate finance – services, analysis, and stock and bond brokerage
• Together with 14 other savings banks within the Frende collaboration group, Sparebanken Sør has entered Vipps, through the newly established company, Balder Betaling AS
• Sparebanken Sør is a 22.4%-owner of Balder Betaling AS, which is a 12%-owner of Vipps AS
Subsidiaries
Considerable product range – still potential for increased product sales

9
Three strategic pillars
One of the most cost effective financial institutions1)
Strong customer relations
The bank is customer relation oriented, known for fast decisions based on local knowledge through closeness to customers and market
Optimal channel interaction and digitalization
1) Costs as a percentage of total assets, Q4 2017, Norwegian regional savings banks
0,74%
peer 1 peer 2 peer 3 Sør peer 4

Better payment solutions
Payment networks
Shared payment technology
Retail
Driven by PSD2 and new services
Start-ups
?
Multiple mobile payment solutions
Banks
Consumer
Digital wallets
«Tech giants»
Payment services – The new frontier
10

11
2016 2017
Instagram Twitter
LinkedIn SnapChat
Des. 2016 Des. 2017
Changes in distribution structure Better tools for consumers Building relations through multiple channels
Aquiring expertise in new fields CRM - a valuable tool for channel interaction
80 percent increase in sales of BSU after launch of new digital solutions
Improvements in mobile banking Large following from customers in social media
May 13 May 14 May 15 May 16 May 17
Strategic moves
Number of logins in mobile banking app Manual Digital
Dec. 2016 Dec. 2017

I Sparebanken Sør
II
III
IV
V
Financial key figures
Funding structure
Table of contents
Capital strategy and development
Planned transaction
VI Norwegian economy
VII Appendix
12

Total assets Equity
1) Changes from the same accounting period in 2016
NOK billion
Balance sheet items – Quarterly development
105,5 105,9 110,9 111,3 114,3
Q4 2016 Q1 2017 Q2 2017 Q3 2017 Q4 2017
+8,3 %1)
9,2 9,3 9,5 9,8 10
10,1 9,9 10,4 10,8 11,1
Q4 2016 Q1 2017 Q2 2017 Q3 2017 Q4 2017
+8,7 %1)
Equity including hybrid capital
13

Loans Deposits
NOK billion
1) Changes from the same accounting period in 2016 2) Loan growth in 2017 amounted to NOK 6.6 billion, equivalent to 7.2 percent, of which retail
customers accounted for 6.7 percent and corporate customers 8.1 percent
Balance sheet items – Quarterly development
90,9 92,6 94,6 96 97,5
Q4 2016 Q1 2017 Q2 2017 Q3 2017 Q4 2017
7,2 %1,2)
51,6 52,8 55,7 54,6 55,6
Q4 2016 Q1 2017 Q2 2017 Q3 2017 Q4 2017
+7,8 %1)
14

34 %
66 %
CM RM
46 %
26 %
11 %
2 % 15 %
Vest-Agder Aust-Agder Telemark Rogaland Others
Geographical distribution of loans Distribution Retail (RM) / Corporate Market (CM)
Gross loans, year end 2017 Gross loans, year end 2017
• # 1 position in Vest-Agder and Aust-Agder, # 3 position in Telemark. Positive development in Rogaland.
• Close and long term cooperation with major firms/organizations in the region. The KNIF* segment amounts to NOK 8.1 billion in loans to customers and NOK 4.6 billion in customer deposits. KNIF corporates constitute the biggest share with NOK 4.9 billion in loans and NOK 4 billion in deposits
• Loans to customers are concentrated in the banks market area
• High RM share is risk reducing.
Note(*): KNIF = Kristen-Norges interessefellesskap (Norwegian Christian interest organization) -> Consists of more than 70 national organizations
A well diversified loan portfolio High RM share and geographical diversification contribute to a balanced portfolio
15

The loan portfolio in Sparebanken Sør Loan to Value (Group)
• Mortgages constitute a large part of the RM portfolio
• Loans with LTV (Loan to Value) below 75 percent constitute 80.4 percent
The LTV distribution is based on a distribution, of which the whole commitment is rated as the last part of the commitment.
As a consequence the actual LTV-distribution will be lower than what is displayed in the table.
Sparebanken Sør – Mortgages
14,0 %
10,5 %
16,8 %
27,8 %
11,3 %
18,1 %
1,5 %
< 40 % 41 - 50 % 51 - 60 %
61 - 70 % 71 - 75 % 76 - 100 %
16
Gross loans, year end 2017 Mortgages, year end 2017

17
Distribution Corporate Market (CM): Tenant distribution1):
Property management - 49,7 %
Social services - 13,3 %
Real estate development - 10,5 %
Financial/commercial services - 6,7 %
Building and construction industry - 4,3 %
Housing cooperatives - 3,3 %
Retail trade - 3,0 %
Manufacturing industry - 2,6 %
Primary industry - 2,5 %
Transport - 1,9 %
Public sector - 1,2 %
Hotel and restaurants - 1,0 %
Rental - Merchandising - 20,1 %
Rental - Offices - 13,4 %
Development - Real estate - 9,8 %
Development - Residents - 8,3 %
Rental - Hotel - 8,0 %
Rental - Public services - 6,2 %
Rental - Residents - 4,9 %
Housing cooperatives - 4,2 %
Development - Merchandising - 3,4 %
Rental - Other industries - 2,6 %
Rental - Private health services - 2,3 %
Offshore industry - 1,5 %
Others - 16,8 %
1) Property management, real estate development, housing cooperatives and building and construction (Loan commitment > NOK 10 million). Q3 2017, yearly update. Loan commitments (> NOK 10 million) for the respective industry groups amounted to NOK 17.7 billion.
The CM loan portfolio reflects the business activity in the region with two major exceptions:
Sparebanken Sør has a very low direct exposure to the oil industry (incl. oil service) and shipping industry.
A well diversified loan portfolio

Losses and non-performing loans – Quarterly development
15 15 13
4
-12
0,06 % 0,06 %
0,05 %
0,02 %
-0,04 %
- 15
Q4 2016
Q1 2017
Q2 2017
Q3 2017
Q4 2017
910 874 908 903 892
0,99% 0,94% 0,95% 0,94% 0,91%
Q42016
Q12017
Q22017
Q32017
Q42017
18
All graphs in NOK million and as a percentage of gross loans
Losses Non-performing loans Loss provisions

Net interest income
1) Changes from the same period in 2016.
Net commission income
NOK million
Net interest income, adjusted for the fee to the Norwegian Banks’ Guarantee Fund and interest on hybrid capital
Profit and loss – Quarterly development
+7,6 %1)
+11,4 %1)
19

Net interest income to total assets, adjusted for the fee to the Norwegian Banks’ Guarantee Fund
Cost income ratio excl. financial instruments
Net interest income to total assets Cost Income Ratio
Profit and loss – Quarterly development
20

Loans: Average interest rates minus 3 month weighted average of 3 month NIBOR. Deposits: 3 month weighted average of 3 month NIBOR minus average interest rates. All numbers in % per annum.
Interest margin - Quarterly development
1,65 1,81 1,85
1,94 1,91
2,40 2,42 2,43 2,44 2,39
Q4 2016 Q1 2017 Q2 2017 Q3 2017 Q4 2017
Loans (%)
Retail market (RM) Corporate market (CM)
0,26 0,20 0,10
- 0,01 0,00
- 0,03 - 0,08 - 0,14 - 0,23
- 0,11
Q4 2016 Q1 2017 Q2 2017 Q3 2017 Q4 2017
Deposits (%)
Retail market (RM) Corporate market (CM)
21

Operating expenses Profit from ordinary operations1)
1) Net interest income, adjusted for accounting changes + Net commision income + Other operating income – Operating costs, adjusted for the conversion of the pension scheme
2) Changes from the same accounting period in 2016 3) Q4 2017 numbers are extraordinarily low because of the net accounting effect of NOK 28 million
after the conversion of the pension scheme
NOK million
Profit and loss - Quarterly development
8,2 %2)
+20,8 %2)
22

Considerable potential has been realized – further efficiency improvements will take place as part of ongoing operations. The Group opened a new office in Bryne on 27 April 2017.
Number of employees Total assets in NOK million per
employee Number of offices
Restructuring and cost focus
520 432
OB 2013 Status
44 34
OB 2013 Status
180
265
OB 2013 Status
23

NOK million 31.12.2017 31.12.2016 Change
Net interest income 1 679 1 565 114
Net commission income
312 293 19
Net income from financial instruments
88 224 -136
Other operating income
18 28 -10
Total income 2 097 2 110 -13
Total expenses 811 787 24
Profit before losses on loans
1 286 1 323 -37
Losses on loans, guarantees
20 50 -30
Profit before taxes 1 266 1 273 -7
Tax expenses 282 284 -2
Profit for the period 984 989 -5
• Good results from ordinary operations
• Positive development in net interest income
• Increased commission income
• Efficient operations and low costs
• Very low loan losses
• Loan growth of 7.2 percent during the last 12 months
• Deposit growth of 7.8 percent during the last 12 months
• Successful opening of a new branch in Rogaland
• Return on equity after tax of 9.7 percent
• Common equity tier 1 capital ratio of 14.9 percent and leverage ratio of 9.2 percent
• The Board of Directors will propose a dividend for 2017 of NOK 6 per equity certificate to the Board of Trustees
24
Key developments in 2017

1 273 1 266
114
19
30
-136
-10 -24
Net
inte
rest
inco
me
Net
co
mis
sio
n in
com
e
Net
inco
me
fro
m f
inan
cial
in
stru
me
nts
Oth
er o
per
atin
g in
com
e
Op
erat
ing
cost
s
Loss
es
on
loan
s
2016 2017
NOK million
25
Change in profit before taxes, 2016 – 2017

Return on equity after tax1) Return on equity after tax excl. financial instruments2)
Key figures – quarterly development
26

Summary
Result
Finance
Capital
Balance
Improved profit from ordinary operations, through positive growth, stable net interest income, combined with low costs and losses on loans
Common equity tier 1 capital ratio amounts to 14.9 percent and the leverage ratio amounts to 9.2 percent Loan growth of NOK 6.6 billion the last 12 months, corresponding to a 7.2 percent annual growth. Deposit growth of NOK 4.0 billion, corresponding to a 7.8 percent annual growth.
Sound operations contribute to a pre-tax result of NOK 1 266 million in 2017
Positive net income from financial instruments due to positive changes in the market value of bonds and strategic equity stakes in subsidiaries
Status as of 31 December 2017
27

14,5 %14,9 %
2017 2018
1)
7,2 %7,0%
2017 2018
Cost development
Return on equity Common equity tier 1 capital
(Group)1) 2)
Loan growth3)
Dividend ratio
1) Incl. share of profit 2) Will be determined with regard to market expectations, the Financial Supervisory Authority recommendations and ICAAP 3) Credit growth + 1 percentage point
Financial key variables and ambitions
28

I Sparebanken Sør
II
III
IV
V
Financial key figures
Funding structure
Table of contents
Capital strategy and development
Planned transaction
VI Norwegian economy
VII Appendix
29

Common equity tier 1 capital ratio with Brage partially consolidated
Common equity tier 1 capital ratio Leverage ratio
Common equity tier 1 capital ratio with Brage partially consolidated
Solid financial base – High capital ratios
30

• Sparebanken Sør is very solid, has high CET1 capital and a very high Leverage ratio.
• Sparebanken Sør is the only large regional bank that use the standard method in the capital adequacy calculations.
• In November 2017, the board decided to put in process an application to the Norwegian FSA to be approved for IRB. The application is scheduled to be sent to the Norwegian FSA by the end of 2019.
Capital ratio – Leverage ratio
31.12.2017 Method CET1 Leverage
Ratio
Sør Standard 14,9 9,2
Peer 1 IRB 15,0 7,3
Peer 2 IRB 14,9 7,2
Peer 3 IRB 14,9 7,2
Peer 4 IRB 14,9 7,2
Peer 5 IRB 16,8 7,1
31
Peer group is Norwegian regional savings banks

32
14,7 % 15,1 %
4,5 %
2,5 %
3,0 %
2,0 %
2,1 %
14,5 %
Q4 2016 Q4 2017 Regulatory Target
Common equity tier 1 capital (CET1) Pilar 1 minimum requirement
Buffer Systemic risk buffer
Countercyclical buffer SREP
Target CET1
Regulatory considerations
SREP – CET1 Capital Requirements and Generation
SREP includes Pillar 2 requirements
IFRS 9 / MREL / Basel IV
Sparebanken Sør is well positioned for future regulatory requirements • IFRS 9
• The implementation of IFRS 9 will have a positive effect on the Group’s equity and subordinated capital, and the Group has no need for the transitional rule for calculating capital adequacy
• MREL • MREL will be implemented in Norway, but the timeline is
not yet public • Potential issuance needs to be decided when
requirements and structure is clear for Norway • Basel IV
• Sør is well positioned for Basel IV o Sør uses standard models and has 9.2 percent in
leverage ratio • Norway still has Basel I floors

I Sparebanken Sør
II
III
IV
V
Financial key figures
Funding structure
Table of contents
Capital strategy and development
Planned transaction
VI Norwegian economy
VII Appendix
33

Distribution Retail /C orporate Market (31.12.17) Deposit to net loans
Deposits as a percentage of net loans have increased over the last 12 months, with a deposit growth of 7.8 percent
Solid financial base - Deposits
Deposits to net loans (parent bank)
34
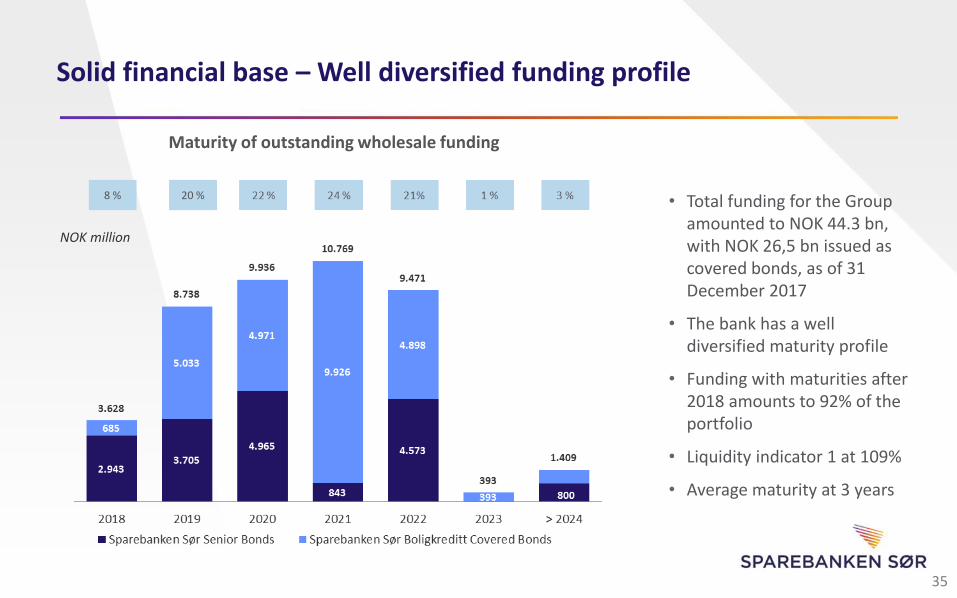
• Total funding for the Group amounted to NOK 44.3 bn, with NOK 26,5 bn issued as covered bonds, as of 31 December 2017
• The bank has a well diversified maturity profile
• Funding with maturities after 2018 amounts to 92% of the portfolio
• Liquidity indicator 1 at 109%
• Average maturity at 3 years
Maturity of outstanding wholesale funding
NOK million
Solid financial base – Well diversified funding profile
20 % 8 %
35

Category Rating
• Total liquidity portfolio of NOK 13.4 bn
• 100 % investment grade and 100 % liquid instruments (LCR eligible)
• Liquidity reserve (LCR) of 139 % for the Group
Solid financial base – High liquidity buffers to handle liquidity stress
Norwegian government bonds; 3,0 % Others; 0,7 %
Norwegian covered bonds /
nordic / municipal;
73,6 %
0% weighted bonds / gov. Guarantees / owned
AAA/AA; 22,7 %
AAA; 88,3 %
AA ; 10,6 %
OMF Norwegian
without rating; 1,1 %
36

Credit opinion from Moody’s updated by 9 January 2018
37
Summary
• Sparebanken Sor's baa1 BCA reflects its strong asset quality metrics
• The bank’s baa1 BCA also captures the increase in Sparebanken Sor’s capital buffers which reached 14.7% as of September 2017 from 13.6% in September 2016
• Sparebanken Sor benefits from a large volume of deposits and substantial layers of subordination, resulting in very low LGF and providing two notches of rating uplift from its BCA
• In addition, the bank's A1 rating also incorporates one notch of rating uplift due to government support, although this is likely to be revised downwards following the implementation of BRRD in Norway
• Click here for credit opinion in pdf

I Sparebanken Sør
II
III
IV
V
Financial key figures
Funding structure
Table of contents
Capital strategy and development
Planned transaction
VI Norwegian economy
VII Appendix
38

• Sparebanken Sør established a €3,000,000,000 Euro Medium Term Note Program (EMTN) in the second quarter of 2017
• This is the first issuance of senior bonds in EUR for Sparebanken Sør
• Click here for EMTN programme in pdf
Euro Medium Term Note Programme
39

40
Planned inaugural EUR Senior Unsecured transaction
Issuer Sparebanken Sør
Type Senior unsecured, unsubordinated
Expected Issue Rating A1 (Moody’s)
Maturity [3 years expected]
Size EUR Sub-benchmark
Coupon [Floating]
Documentation The Issuer’s EMTN programme dated 30 June 2017 and supplemented 11 April 2018
Law English law
Listing Irish Stock Exchange
Lead Managers LBBW, Natixis, Nordea, Swedbank

I Sparebanken Sør
II
III
IV
V
Financial key figures
Funding structure
Table of contents
Capital strategy and development
Planned transaction
VI Norwegian economy
VII Appendix
41

Key indicators for the Norwegian economy Healthy growth
Source: Estimates from Norges Bank’s March Monetary Policy report and Statistics Norway (Current account)
In % 2015 2016 2017 2018E 2019E
GDP growth, mainland 1.4 1.0 1.8 2.6 2.0
Core inflation 2.7 3.0 1.4 1.5 1.8
Unemployment rate registered 3.0 3.0 2.7 2.3 2.2
Key policy rate (Average) 1.0 0.6 0.5 0.6 1.1
House price growth 5.9 -0.7 2.0
Current account surplus / GDP 8.7 4.9 5.1 6.6 6.3
Sovereign wealth fund / GDP 240 241 247 N.A N.A
• Economic growth in Norway has picked up and unemployment is falling
• Growth is self-sustained and no longer in need of fiscal support, interest rates are on their way up
• Oil investment is set to increase again after the sharp drop that followed the oil price collapse
• Weak NOK and strong growth abroad support exports, mainland business investments also on the rise
• Improving labour market supports private consumption
• Only drag to growth is housing investment, which will drop from a high level
• Still large surplus on the current account and government budgets despite the drop in oil price
42
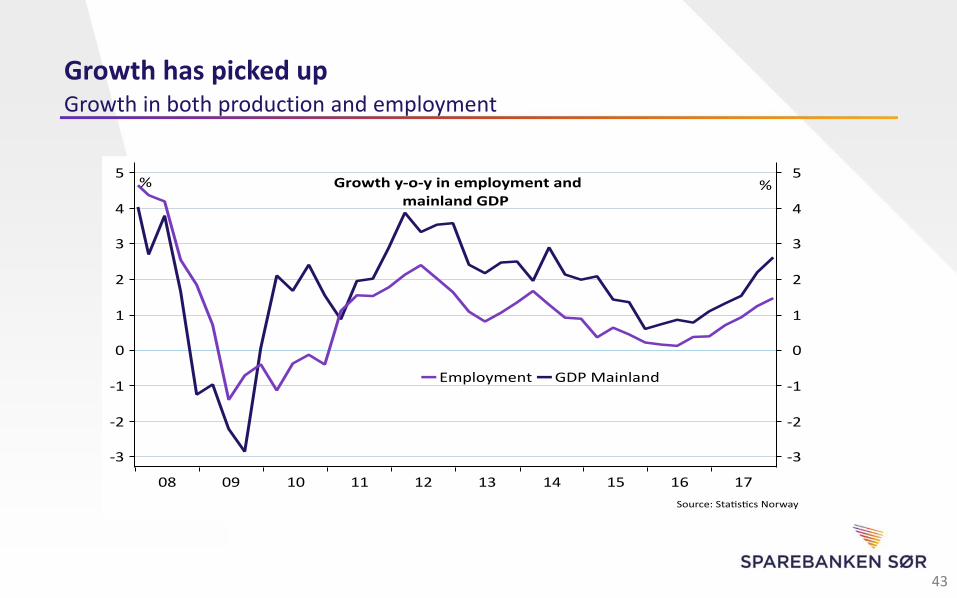
Growth has picked up Growth in both production and employment
43

Unemployment is falling sharply and sentiment improving Especially in counties hit by the oil downturn
44

Oil investments growing again Counteracting the negative effect from lower house building
45

Cost cutting has made oil companies more profitable Graph shows break-even price on new fields brought down
0
10
20
30
40
50
60
70
80
90
100
USD
pe
r b
arre
l
2015
2017- September
46

NOK, oil price and competitiveness Norway has benefited from the weak NOK and increased competitiveness
47

Strong public finances Fiscal policy has supported the economy
• The Government Pension Fund currently amounts to close to NOK 8,000bn (approx. EUR 850bn) which is near three times the size of Mainland GDP and equals six annual national budgets
• The Fund and large petroleum revenues give the Norwegian government substantial economic leeway
• The fiscal rule: 3% (previously 4%) of the fund’s value can be used in the national budget (expected real return on the fund)
• The rule is to ensure that the fund itself would not be tapped. Thus the fiscal break even oil price is zero
• In response to lower oil price public spending was increased, i.e. the deficit increased as a share of GDP. For 2018, fiscal policy is estimated to be close to neutral
48

Debt and income Rich countries have higher debt relative to income
49

Norwegian housing market House prices have increased alongside income growth
50

Norwegian housing market The downturn is over, house prices are levelling out
51

How expensive is housing? House prices have increased, but cost of servicing has not
Sources: Statistics Norway, Real Estate Norway and Macrobond
The model assumes that a constant share of income (equal to its average from 2000) is allocated to serve interest rate and downpayments from buying the average home for a family. 25 years’ downpayment period and loan to value of 85%.
52

Income and living expenses Income has increased and households spend less on living expenses
Sources: Statistics Norway and National Institute for Consumer Research
53

Norwegian housing market Key characteristics
Source: Finance Norway, Norwegian Labour and Welfare Administration
High home ownership • Around 80% of Norwegian households own their home which is among the highest home ownership ratios in the world. Hence, buy-to-let market is limited in Norway
Key features of residential mortgage loans in Norway
• Residential mortgage loans are predominantly granted by banks and mortgage credit institutions (97% as of January 2015)
• Lenders have access to wide range of information about borrowers before granting the mortgage (e.g. tax records for the last three years, any debt collection outstanding, any bankruptcies)
• Properties are registered in a central register to which banks have direct access
• Typical maturity of a new loan is 25 to 30 years
• The majority of residential mortgage loans have a floating interest rate meaning that banks are allowed to increase the interest rate with a six weeks’ notice
• Borrowers are personally liable for their debt also after foreclosure or forced sale
Good tax incentives and supportive social security system
• Borrowing costs on mortgages are tax deductible (the tax rate applied is 24%)
• Tax valuation of dwellings is favourably treated in the wealth tax system
• If a dwelling is occupied by the owner for a minimum of one year, capital gain is tax free when the dwelling is sold
• Unemployment benefit equals approximately 62% of the previous calendar year’s gross income and is paid for up to 104 weeks
54

I Sparebanken Sør
II
III
IV
V
Financial key figures
Funding structure
Table of contents
Capital strategy and development
Planned transaction
VI Norwegian economy
VII Appendix
55
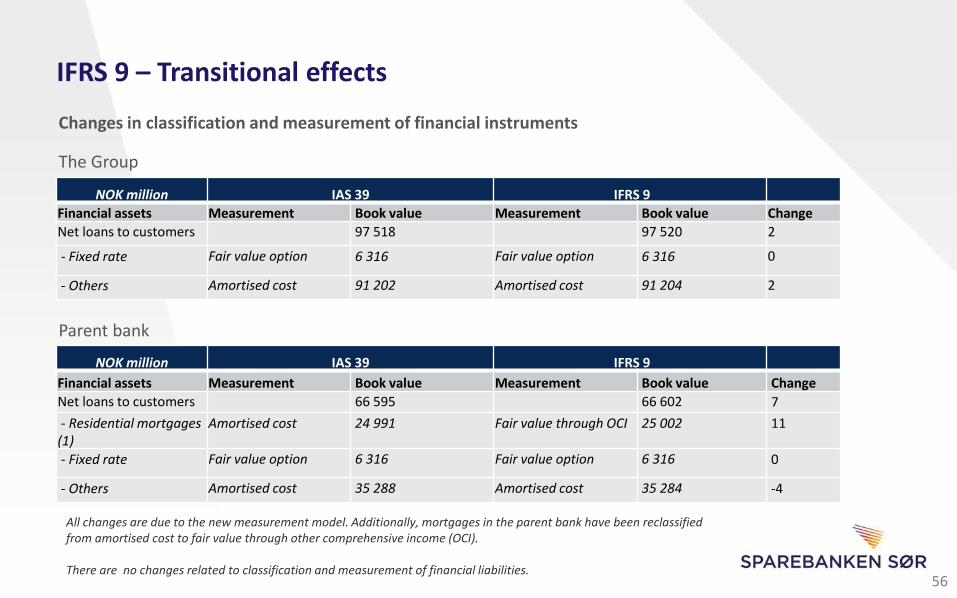
All changes are due to the new measurement model. Additionally, mortgages in the parent bank have been reclassified from amortised cost to fair value through other comprehensive income (OCI). There are no changes related to classification and measurement of financial liabilities.
Changes in classification and measurement of financial instruments
NOK million IAS 39 IFRS 9
Financial assets Measurement Book value Measurement Book value Change
Net loans to customers 97 518 97 520 2
- Fixed rate Fair value option 6 316 Fair value option 6 316 0
- Others Amortised cost 91 202 Amortised cost 91 204 2
The Group
NOK million IAS 39 IFRS 9
Financial assets Measurement Book value Measurement Book value Change
Net loans to customers 66 595 66 602 7
- Residential mortgages (1)
Amortised cost 24 991 Fair value through OCI 25 002 11
- Fixed rate Fair value option 6 316 Fair value option 6 316 0
- Others Amortised cost 35 288 Amortised cost 35 284 -4
Parent bank
56
IFRS 9 – Transitional effects

The implementation of IFRS 9 will have a positive effect on the Group’s equity and subordinated capital, and the Group has no need for the transitional rule for calculating capital adequacy.
Changes in equity
The Group
Parent bank
NOK million
Equity
certificates
Premium
fund
Equalization
fund
Hybrid
capital
Primary
capital Gift fund Other equity
Minority
interests TOTAL
Balance 31 Dec. 2017 783 451 341 1 075 7 165 61 1 230 2 11 108
Changes as a result of
IFRS 9 2 2
Effect on taxes as a
result of IFRS 9 -1 -1
Balance 1 Jan. 2018 783 451 341 1 075 7 165 61 1 232 2 11 109
NOK million Equity
certificates
Premium
fund
Equalization
fund
Hybrid
capital
Primary
capital Gift fund Other equity
Minority
interests TOTAL
Balance 31 Dec. 2017 783 451 341 1 075 7 165 61 94 0 9 970
Changes as a result of
IFRS 9 7 7
Effect on taxes as a
result of IFRS 9 -2 -2
Balance 1 Jan. 2018 783 451 341 1 075 7 165 61 99 0 9 975
57
IFRS 9 – Transitional effects

Development of tools important for the customer relation
Data Warehouse
CRM
Marketing tools
Robots
Automation
Tools that are important for achieving the Group’s strategic goals: • Better customer overview • Targeted advertising with relevant and
customized messages • Automation and streamlining of work-
processes • Better scoring and portfolio
management • Compliance with legal requirements
(GDPR)
58

Marianne Lofthus – Director Capital Market, Sparebanken Sør/CEO Sparebanken Sør Boligkreditt AS
Phone, mobile + 47 90 51 41 83
E-mail [email protected]
Bjørn Erik Kittelsen – Head of Treasury, Sparebanken Sør
Phone, mobile + 47 90 92 86 63
E-mail [email protected]
www.sor.no
Contact details and website
Geir Bergskaug – CEO Sparebanken Sør
Phone, mobile + 47 90 12 72 06
E-mail [email protected]
Steinar Vigsnes – Head of accounting and reporting, Sparebanken Sør
Phone, mobile + 47 90 61 31 35
E-mail [email protected]
59

This presentation has been prepared solely for use at this presentation. By attending the meeting where this presentation is made, or by reading the presentation slides, you agree to be bound by the following limitations. This presentation does not constitute or form part of and should not be construed as, an offer to sell or issue or the solicitation of an offer to buy or acquire securities of Sparebanken Sør (the “Company”), in any jurisdiction or an inducement to enter into investment activity. No part of this presentation, nor the fact of its distribution, should form the basis of, or be relied on in connection with, any contract or commitment or investment decision whatsoever. This presentation has been prepared solely for use in connection with the presentation of the Company. The information contained in this document is strictly confidential and is being provided to you solely for your information and cannot be distributed to any other person or published, in whole or in part, for any purpose. It may not be reproduced, redistributed, passed on or published, in whole or in part, to any other person for any purpose. Failure to comply with this and the following restrictions may constitute a violation of applicable securities laws. No representation, warranty or undertaking, express or implied, is made as to, and no reliance should be placed on, the fairness, accuracy, completeness or correctness of the information or the opinions contained herein. None of the Company or any of their respective affiliates, advisors or representatives shall have any liability whatsoever (in negligence or otherwise) for any loss howsoever arising from any use of this presentation or its contents or otherwise arising in connection with the presentation. This presentation is only for persons having professional experience in matters relating to investments and must not be acted or relied on by persons who are not Relevant Persons (as defined below). Solicitations resulting from this presentation will only be responded to if the person concerned is a Relevant Person. This presentation is not an offer of securities for sale in the United States. Neither the presentation nor any copy of it may be taken or transmitted into United States, its territories or possessions or distributed, directly or indirectly, in the United States, its territories or possessions, except to qualified institutional buyers as defined in Rule 144A under the U.S. Securities Act of 1933, as amended (the “Securities Act”) or outside the United States in reliance on Regulation S under the Securities Act. Any failure to comply with this restriction may constitute a violation of the United States securities laws.