Spare Parts Pricing Optimization - Cognizant
11
To contend with the unpredictable global economy, industrial manufacturers need a structured approach to spare parts pricing that takes into account material costs and competitive offers and applies analytics to uncover customer perceived value. Spare Parts Pricing Optimization • Cognizant 20-20 Insights cognizant 20-20 insights | july 2012 Service Is More Profitable than Core Business $0 $50 $100 $150 $200 Profit Revenue SERVICES BUSINESS CORE BUSINESS 75% MORE Executive Summary The manufacturing industry is still suffering from the effects of the global economic recession that started in 2007 and persists, at least in Europe, today. Industrial segments are slowly recovering, but overall performance remains weak. The decline in customer demand across many sectors is causing severe revenue pressure. This has caused many players not only to examine avenues for reducing capital expenditures but also to look at ways of generating new revenue streams. As manufacturing companies look for ways to increase efficiency, lower operational costs and identify growth opportunities, an emerging area of focus (one that was previously ignored) for fueling a turnaround is after-sales service. Aftermarket sales and services are estimated to be 75% more profitable than those of the core business (see Figure 1). However, research indicates that over 67% of companies are growing their services business more slowly than their main businesses. 1 As companies begin to realize the growth potential in the after–sales market they should take heightened interest in their services business. Figure 1
Transcript of Spare Parts Pricing Optimization - Cognizant

To contend with the unpredictable global economy, industrial manufacturers need a structured approach to spare parts pricing that takes into account material costs and competitive offers and applies analytics to uncover customer perceived value.
Spare Parts Pricing Optimization
• Cognizant 20-20 Insights
cognizant 20-20 insights | july 2012
Service Is More Profi table thanCore Business
$0
$50
$100
$150
$200
Profit Revenue
SERVICES BUSINESSCORE BUSINESS
75% MORE
Executive Summary
The manufacturing industry is still sufferingfrom the effects of the global economicrecession that started in 2007 and persists,at least in Europe, today. Industrial segmentsare slowly recovering, but overall performanceremains weak. The decline in customer demandacross many sectors is causing severe revenuepressure. This has caused many players notonly to examine avenues for reducing capitalexpenditures but also to look at ways of generating new revenue streams.
As manufacturing companies look for waysto increase efficiency, lower operationalcosts and identify growth opportunities,an emerging area of focus (one that waspreviously ignored) for fueling a turnaround isafter-sales service.
Aftermarket sales and services are estimatedto be 75% more profitable than those of thecore business (see Figure 1). However, researchindicates that over 67% of companies are growing their services business more slowly than their main businesses.1 As companies begin to realize the growth potential in theafter–sales market they should take heightenedinterest in their services business.
Figure 1
2
Spare Parts’ Contribution to Revenue and Profit
Figure 2
cognizant 20-20 insights
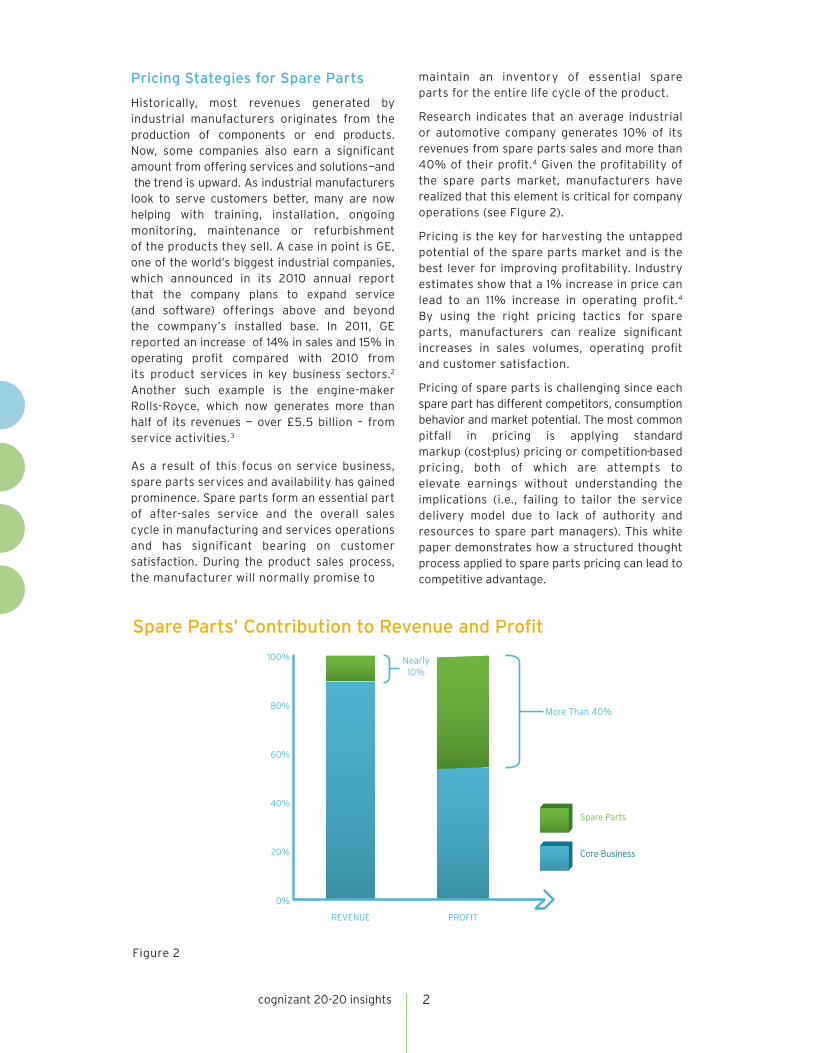
Pricing Stategies for Spare Parts
Historically, most revenues generated by industrial manufacturers originates from the production of components or end products. Now, some companies also earn a significant amount from offering services and solutions — and the trend is upward. As industrial manufacturers look to serve customers better, many are now helping with training, installation, ongoing monitoring, maintenance or refurbishment of the products they sell. A case in point is GE, one of the world’s biggest industrial companies, which announced in its 2010 annual report that the company plans to expand service (and software) offerings above and beyond the cowmpany’s installed base. In 2011, GE reported an increase of 14% in sales and 15% in operating profit compared with 2010 from its product services in key business sectors.2
Another such example is the engine-maker Rolls-Royce, which now generates more than half of its revenues — over £5.5 billion – from service activities.3
As a result of this focus on service business, spare parts services and availability has gained prominence. Spare parts form an essential part of after-sales service and the overall sales cycle in manufacturing and services operations and has significant bearing on customer satisfaction. During the product sales process, the manufacturer will normally promise to
maintain an inventory of essential spare parts for the entire life cycle of the product.
Research indicates that an average industrial or automotive company generates 10% of its revenues from spare parts sales and more than 40% of their profit.4 Given the profitability of the spare parts market, manufacturers have realized that this element is critical for company operations (see Figure 2).
Pricing is the key for harvesting the untapped potential of the spare parts market and is the best lever for improving profitability. Industry estimates show that a 1% increase in price can lead to an 11% increase in operating profit.4 By using the right pricing tactics for spare parts, manufacturers can realize significant increases in sales volumes, operating profit and customer satisfaction.
Pricing of spare parts is challenging since each spare part has different competitors, consumption behavior and market potential. The most common pitfall in pricing is applying standard markup (cost-plus) pricing or competition-based pricing, both of which are attempts to elevate earnings without understanding the implications (i.e., failing to tailor the service delivery model due to lack of authority and resources to spare part managers). This white paper demonstrates how a structured thought process applied to spare parts pricing can lead to competitive advantage.
0%
20%
40%
60%
80%
100%Spare Parts
Core Business
PROFITTURNOVER
More Than 40%
0%
20%
40%
60%
80%
100%
Spare Parts
Core Business
REVENUE PROFIT
More Than 40%
Nearly10%

3
Cost-plus Pricing
Most industrial companies rely on standard markup (i.e., cost-plus) to price spare parts. Prices are set at unit variable cost plus unit allocation from the fixed cost multiplied by the markup. Industrial manufacturers often opt for this method because the data on price elasticity and customer demand is difficult to gather. The pitfall in this approach to pricing is that markup is applied to spare parts irrespective of the value of the spare parts and customers’ willingness to pay.
Let’s take a look at an example in the automotive industry (see Figure 3). The cost of the navigation system is higher than the customer’s willingness to pay. Not considering the customer’s perspective, and applying a markup of 50% on the cost, will result in a price that is higher than customer expectations. This likely will result in customer dissatisfaction.
Another disadvantage of cost-plus pricing is the lost profit opportunity. For example, consider the case of metallic paint, as also shown in Figure 3, which the customer perceives to have a high value and is willing to pay a higher price for. Companies that use the standard cost-plus method end up with a
price that is far below the price the customer is willing to pay, resulting in lower profits.
Competitor-based Pricing
Competitor - based pricing is offered by companies that want to adjust their pricing vis-à-vis the competition irrespective of the perceived value of the spare parts. In this strategy, the products are priced to outsell the mainstream competition without considering the impact on reduced profit margins. Even while considering the competition, only mainstream manufacturers are accounted for— not so-called imitators. However, this kind of pricing will be applicable for standard spare parts that compete in a commodity market.
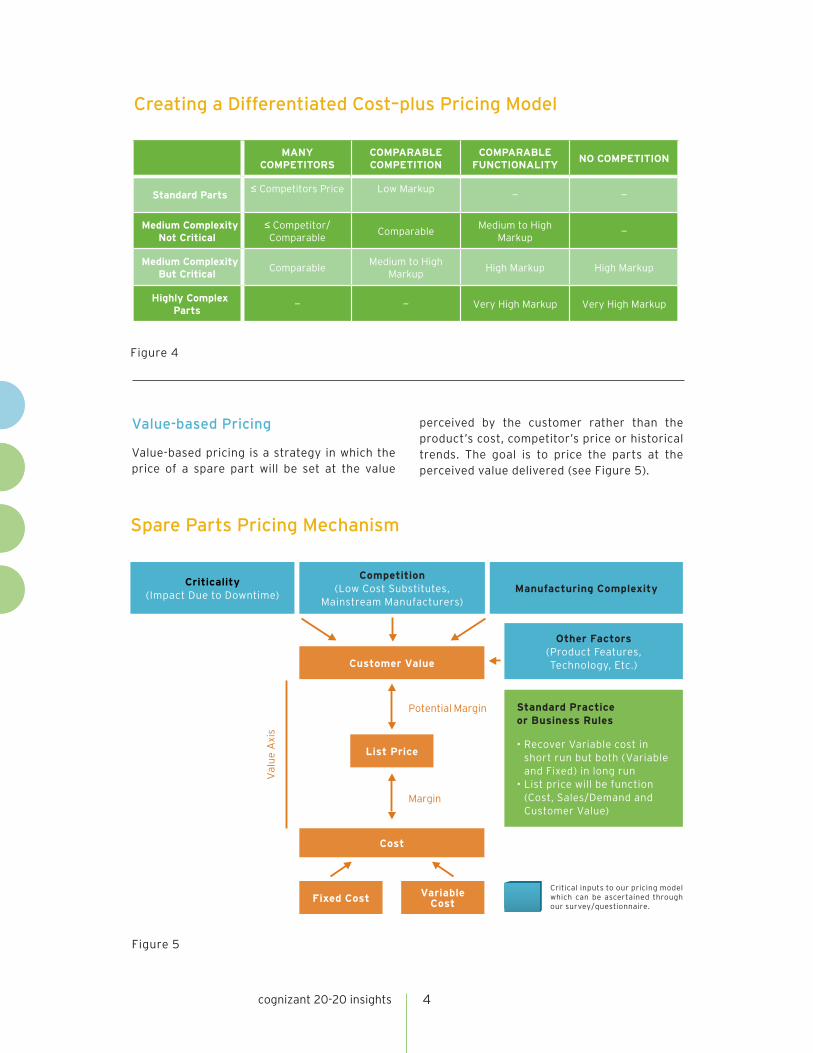
Differentiated Cost-plus Pricing
In this approach, spare parts are separated into various segments based on specified parameters and a differentiated markup is applied to each segment. Figure 4 illustrates two parameters used for price segmentation: complexity and competition. Based on these two parameters, there are roughly eleven segments identified. Depending on the segment, an extremely high markup can be applied to raise profit margins or a low markup can be applied to match the competitor’s price.
$0
$100
$200
$300
$400
$500
$600
$700
$800Cost
METALLIC PAINTNAVIGATION SYSTEM
Willingess to pay
Price (markup 50%)
Automotive Industry Example
Figure 3
cognizant 20-20 insights
4
Creating a Differentiated Cost–plus Pricing Model
MANY COMPETITORS
COMPARABLE COMPETITION
COMPARABLE FUNCTIONALITY
NO COMPETITION
Standard Parts≤ Competitors Price Low Markup
— —
Medium Complexity Not Critical
≤ Competitor/Comparable
Comparable Medium to High
Markup —
Medium Complexity But Critical
Comparable Medium to High
Markup High Markup High Markup
Highly Complex Parts
— — Very High Markup Very High Markup
Figure 4
Value-based Pricing
Value-based pricing is a strategy in which the price of a spare part will be set at the value
perceived by the customer rather than the product’s cost, competitor’s price or historical trends. The goal is to price the parts at the perceived value delivered (see Figure 5).
Spare Parts Pricing Mechanism
Figure 5
Criticality (Impact Due to Downtime)
Competition(Low Cost Substitutes,
Mainstream Manufacturers)
Customer Value
Cost
Fixed Cost
Standard Practice or Business Rules
• Recover Variable cost in short run but both (Variable and Fixed) in long run
• List price will be function (Cost, Sales/Demand and Customer Value)
Other Factors(Product Features, Technology, Etc.)
Critical inputs to our pricing model which can be ascertained through our survey/questionnaire.
Manufacturing Complexity
Val
ue
Axi
s
Potential Margin
Margin
List Price
Variable Cost
cognizant 20-20 insights

5
A Sample Value-based Pricing Questionnaire
Customer value is derived through structured and detailed primary and secondary research. Interviews with original equipment manufacturers and industry experts and customer surveys can help to determine the attributes which contribute to the value of spare parts. A questionnaire (as depicted in Figure 6) can help gather insights about factors that determine customer value.
Factors such as the criticality of the spare part (impact and downtime suffered due to
nonavailability), existing competition (substitutes and cheaper competitor parts, differentiating features, etc.), complexity in parts manufacturing and the end product features are used to ascertain customer value.
The derived customer value provides clear insight on what the customer would be willing to pay for the spare part. Since industrial companies already know the cost of the spare part, they can decide the list price by creating a delta between the part’s cost and the customer-perceived value, depending on the margin target.
$50.00 $30.00 $28.00
1. Definitely Would Buy 4% 5% 15%
2. Very Likely to Buy — — 2%
3. Probably Would Buy 7% 14% 30%
4. Neutral 1% 2% 4%
5. Probably Not Buy 22% 34% 18%
6. Unlikely to Buy 2% 2% 1%
7. Definitely Not Buy 65% 54% 30%
A Sample Value-based Pricing Questionnaire
Figure 6
Figure 7
Step-by-step Approach to Spare Parts Pricing
cognizant 20-20 insights
Select a Pricing Tool That Will Assist in
Spare Parts PricingUse Analytics to
Assist Pricing Decision
Decide a Commercialization
StrategyEnforce Business Rules
Perform ABC Analysis for All
Parts
Decide Price Range for ABC Analyzed
Products
47% of customers would buy if the price is $28
STATED PRICE OF CONTROL BOARD MODULE FUSES IN A HEAT PUMP
6
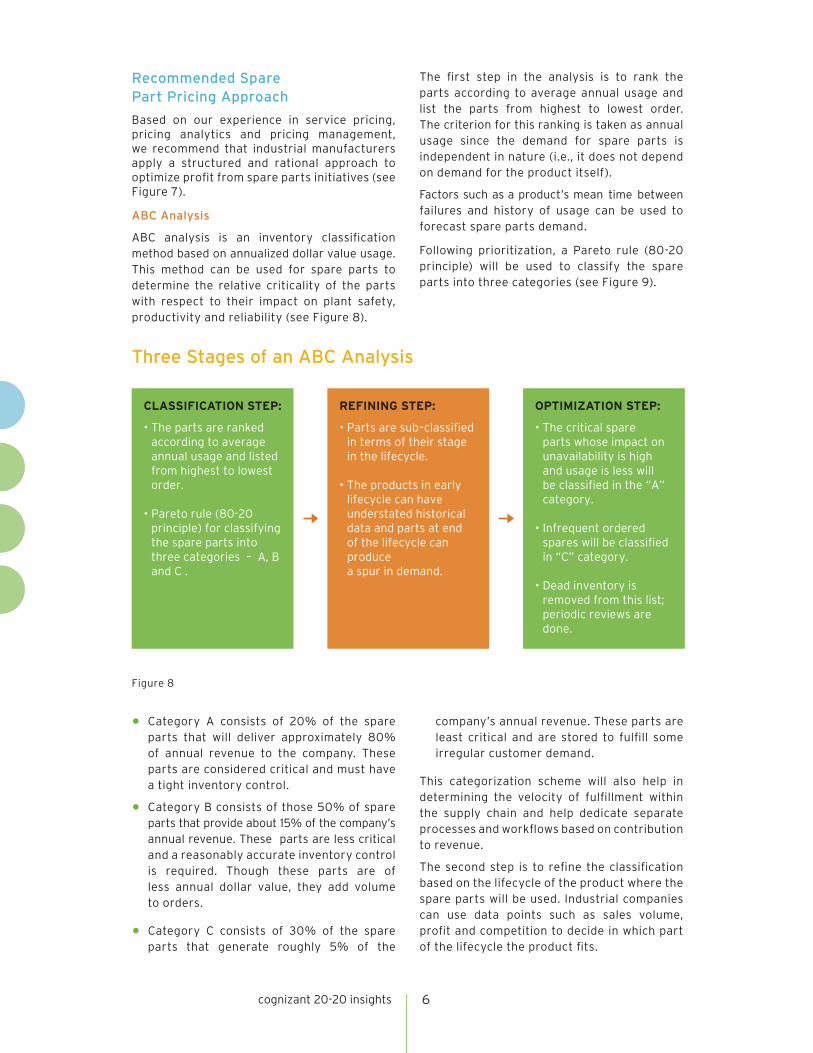
Three Stages of an ABC Analysis
CLASSIFICATION STEP:
• The parts are ranked according to average annual usage and listed from highest to lowest order.
• Pareto rule (80-20 principle) for classifying the spare parts into three categories – A, B and C .
REFINING STEP:
• Parts are sub–classified in terms of their stage in the lifecycle.
• The products in early lifecycle can have understated historical data and parts at end of the lifecycle can produce a spur in demand.
OPTIMIZATION STEP:
• The critical spare parts whose impact on unavailability is high and usage is less will be classified in the “A” category.
• Infrequent ordered spares will be classified in “C” category.
• Dead inventory is removed from this list; periodic reviews are done.
Figure 8
• Category A consists of 20% of the spare parts that will deliver approximately 80% of annual revenue to the company. These parts are considered critical and must have a tight inventory control.
• Category B consists of those 50% of spare parts that provide about 15% of the company’s annual revenue. These parts are less critical and a reasonably accurate inventory control is required. Though these parts are of less annual dollar value, they add volume to orders.
• Category C consists of 30% of the spare parts that generate roughly 5% of the
company’s annual revenue. These parts are least critical and are stored to fulfill some irregular customer demand.
This categorization scheme will also help in determining the velocity of fulfillment within the supply chain and help dedicate separate processes and workflows based on contribution to revenue.
The second step is to refine the classification based on the lifecycle of the product where the spare parts will be used. Industrial companies can use data points such as sales volume, profit and competition to decide in which part of the lifecycle the product fits.
Recommended Spare Part Pricing Approach
Based on our experience in service pricing, pricing analytics and pricing management, we recommend that industrial manufacturers apply a structured and rational approach to optimize profit from spare parts initiatives (see Figure 7).
ABC Analysis
ABC analysis is an inventory classification method based on annualized dollar value usage. This method can be used for spare parts to determine the relative criticality of the parts with respect to their impact on plant safety, productivity and reliability (see Figure 8).
The first step in the analysis is to rank the parts according to average annual usage and list the parts from highest to lowest order. The criterion for this ranking is taken as annual usage since the demand for spare parts is independent in nature (i.e., it does not depend on demand for the product itself).
Factors such as a product’s mean time between failures and history of usage can be used to forecast spare parts demand.
Following prioritization, a Pareto rule (80-20 principle) will be used to classify the spare parts into three categories (see Figure 9).
cognizant 20-20 insights

7
Figure 10 indicates the spare parts demand in each stage of the product lifecycle. In the introduction phase, the chances of product failure are lower and hence the spare parts demand will be minimal. However, as the product reaches its decline phase, the number of product failures increases, leading to a peak in the demand for spare parts. Taking into account such scenarios, while refining inventory requirements, may result in spare parts ascending or descending ABC categories.
The final step involved in the ABC analysis is optimization. The critical spare parts — those whose impact relative to unavailability is high and usage is less — are identified in this step. Such parts will be classified in the “A” category. The infrequently ordered spares will be moved to the “C” category, and finally the dead inventory is removed from this list. Periodic reviews are conducted to refine and optimize the classification of spare parts.
A Pareto Rule Breakdown for Inventory Management
Figure 9
SPARE PARTS CATEGORIES
NUMBER OF ITEMS
ANNUAL DOLLAR VALUE = QUANTITY * PRICE
CRITICALITYINVENTORY CONTROL
A 20% 80% Critical Tight
B 50% 15% Less Critical Reasonably Accurate
C 30% 5% Least Critical Minimum
* The percentages indicated in the columns “Number of Items”and “Annual Dollar Value” differs from industry to industry and can be adjusted in accordance with the opinion of the experts.
Product Lifecycle Breakdown for Calculating Spare Part Demand
PRODUCT LIFECYCLE
SALES VOLUME PROFIT COMPETITIONSPARE PARTS
DEMAND
Introduction Less Less Less Low
Growth Increase Increase Growing Steady
Maturity Increase Decrease Growing Steady
Decline Decrease Decrease High Peaks
Figure 10
cognizant 20-20 insights
ABC analysis will help to classify the products into categories. Following ABC, the next step is to decide the price range for spare parts in each category. The price range for any spare part will be more than the cost of goods sold and less than the true economic value. The price will then be set lower than the perceived value and will be fine-tuned by pricing experts. Different pricing strategies can be used to determine the range for products in each of the categories identified by the ABC analysis.
Since the products in category “A” are critical to the company, a tighter control of inventory is required and hence the price range will be determined with detailed analysis and effort. A strategy of value-based pricing is best suited to this category, as it takes into account the customer’s perceived value of the product.
Decide Price Range

8
Inputs to Business Rules that Help Set Prices
Figure 11
Choose a Commercialization Strategy
Commercialization defines the go-to-market strategy for the OEMs. Go-to-market is usually decided by considering three important criteria for spare parts: when (scheduled time), where (locations) and whom (target market). From an industrial manufacturing perspective, while planning the commercialization of spare parts, companies should additionally consider the nature of spare parts.
For example, if the spare part is captive in nature (i.e., no comparable competition) and
forms almost a monopoly in the market, then the OEM should take control of maintaining inventory and distribution until the part reaches the customer. However, for a non-captive part, the OEM should collaborate with distributors or dealers for inventory management (see Figure 12).
With the multiple channels available for distribution, OEMs should also decide the channel partners and the distribution model they want to follow.
Category “B” products will have a more relaxed pricing approach. A strategy of differentiated cost-plus strategy can be used. Here, the products will be classified into different segments based on numerous parameters such as complexity of the product and competition for the product or other parameters selected by product managers.
Category “C” products, which have minimal impact on the company, should follow a simple cost-plus or competition-based pricing strategy.
Enforce Business Rules
Once the price ranges are set, industrial companies should enforce business rules to govern the pricing strategy and dictate guide lines that need to be adhered to during the pricing process (see Figure 11). Rules help in automating the process of raising notifications in case they are not met. Rules such as the discounts for a particular segment of parts, discounts for particular geography, sales volume, margins, allowable price variation, time period for variations, etc. can be preset in the system to assist pricing managers.
ALLOWABLE PRICE VARIATION FOR A
PRESPECIFIED PERIOD
DISCOUNTS BASED ON CHANNELS, PRODUCT
SEGMENT, CUSTOMERS, GEOGRAPHY
BUSINESS RULES
SALES VOLUME, MARGINS
cognizant 20-20 insights

9
Analytical Approaches to Pricing Determination
Use Analytics to Support Pricing Decisions
Price analytics can be used as an iterative exploration of historic pricing information to gain insights that enhance planning for the next pricing cycle. These analytics make use of statistical, quantitative and fact-based analyses to drive decision-making. Since any pricing improvement for critical spare parts
can lead to better returns for the company, pricing analytics can be applied for critical spare parts belonging to “A” category. Figure 13 highlights analytical approaches which can be used, depending on the circumstance.
Such analytics will provide insights that help to identify opportunities for improving the spare parts pricing process.
Partner Collaboration
Figure 13
PRICE SENSITIVITY ANALYSIS
COMPETIVENESS ELASTICITY ANALYTICS
REVENUE/PROFIT MAXIMIZING ANALYTICS
PRICE WATERFALL MODEL
• Identify critical price points for the spare parts — i.e., the correlation between purchasing decisions and various pricing drivers.
• Understand the price sensitivities of each individual customer/segment; manufacturers to keep the price within control limits.
• Gain insights such as how sales volumes are impacted by price changes and if cannibalization of other product sales will take place due to price change.
• Benchmark the price vis-à-vis the competition and identify the price premium/differential that the consumer would be willing to pay for competitors’ product.
• Determine the premium that the consumer would be willing to pay for buying from the firm.
• Choose the correct pricing strategy during the various stages of the product lifecycle.
• Change the price range of a product/family post - transition to a new stage in product’s lifecycle – namely, launch to growth, growth to steady, steady to saturation phase.
• Find out how much revenue companies really keep from each of their transactions.
• Identify the components of discounts, allowances, rebates and incentives, and constantly try to improve so they can add an additional 1% or more of the price to their pockets.
OEM controls the inventory and distribution to the end customer.
CAPTIVE PART
OEM collaborates with distributors or dealers.
NON-CAPTIVE PART
Figure 12
cognizant 20-20 insights

10
Criteria for Selecting a Pricing Tool for Spare Parts
Figure 14
SPARE PART PRICING OPTIMIzATION
CUSTOM-BUILT SOLUTION
ENTERPRISE APPLICATION PLATFORM-BASED SOLUTION
BEST-OF-BREED PRICE MANAGEMENT SOLUTION
SAP VENDAVO
PROS
zILLIANT
ORACLE
cognizant 20-20 insights
Tool Selection to Assist
Spare Parts Pricing
The current market scenario makes price management indispensible. Industrial companies can choose a custom-built solution or enterprise application platform-based solution or best-of-breed systems for their pricing needs (see Figure 14). Custom-built solutions are preferred since they are more cost-effective and serve specific needs.
Enterprise applications are simpler to implement but may not have built-in capability for price enforcement. Best-of-breed solutions provide the maximum capability and may need to be configured to make them suitable for companies’ requirements. These solutions not only provide advanced analytics, but also allow spare price optimization and enforcement.
ConclusionSpare parts can evolve into a key profit center for industrial companies if the parts are correctly priced. Companies should avoid the trap of merely applying cost-plus pricing for all spare parts, and should instead tactically price spares to satisfy customer expectations while keeping an eye on profit margins. They should revisit their spare parts pricing process and reengineer the process if it is not optimal.
We advise industrial companies to identify the nature of their spare parts before segmenting them and applying an ABC analysis. They should also select a price range for products by using customer perception feedback and then fine-tune pricing based on expert opinion and industry surveys. From there, they need to enforce business rules to account for key business terms and conditions and apply analytics to assist decision-making. Only then can they effectively decide upon the best IT application to inform the spare parts pricing process.

Footnotes
About Cognizant
Cognizant (NASDAQ: CTSH) is a leading provider of information technology, consulting, and business process outsourcing services, dedicated to helping the world’s leading companies build stronger businesses. Headquartered in Teaneck, New Jersey (U.S.), Cognizant combines a passion for client satisfaction, technology innovation, deep industry and business process expertise, and a global, collaborative workforce that embodies the future of work. With over 50 delivery centers worldwide and approximately 140,500 employees as of March 31, 2012, Cognizant is a member of the NASDAQ-100, the S&P 500, the Forbes Global 2000, and the Fortune 500 and is ranked among the top performing and fastest growing companies in the world. Visit us online at www.cognizant.com or follow us on Twitter: Cognizant.
World Headquarters
500 Frank W. Burr Blvd.Teaneck, NJ 07666 USAPhone: +1 201 801 0233Fax: +1 201 801 0243Toll Free: +1 888 937 3277Email: [email protected]
European Headquarters
1 Kingdom StreetPaddington CentralLondon W2 6BDPhone: +44 (0) 207 297 7600Fax: +44 (0) 207 121 0102Email: [email protected]
India Operations Headquarters
#5/535, Old Mahabalipuram RoadOkkiyam Pettai, ThoraipakkamChennai, 600 096 IndiaPhone: +91 (0) 44 4209 6000Fax: +91 (0) 44 4209 6060Email: [email protected]
© Copyright 2012, Cognizant. All rights reserved. No part of this document may be reproduced, stored in a retrieval system, transmitted in any form or by any means, electronic, mechanical, photocopying, recording, or otherwise, without the express written permission from Cognizant. The information contained herein is subject to change without notice. All other trademarks mentioned herein are the property of their respective owners.
About Cognizant Business Consulting’s Manufacturing/Logistics Practice
Cognizant Business Consulting’s manufacturing and logistics consultants are experts in supply chain planning and can help organizations create new revenue streams by applying service and spare parts availability as a differentiator in the competitive landscape. Our consultants leverage their industrial industry experience to advise clients on each step of pricing, from deciding the business rules that best suit particular parts to creating price waterfall models, which can indicate and plug revenue leakages. For example, we recently advised an industrial client on setting a price for its new service offering for various industry segments along with a pricing model to evaluate profitability. We also have experience helping clients to select the most appropriate vendor-supplied price management solution.
1 “ Service Parts Management: Bringing Industry Leadership to Your Service Parts Business,” Deloitte Research, 2006.
2 GE Annual Reports, 2010 and 2011.
3 “Full-Year Results,” Rolls-Royce Group plc, 2010.
4 Compustat, McKinsey Analysis.
About the Authors
Karthik Natarajan is a Consulting Manager within Cognizant Business Consulting, focused on the manufacturing and logistics domain, who has led numerous critical business transformation and strategic projects across a full spectrum of business processes. His experience includes supply chain consulting, process reengineering and IT strategy. Karthik has over 11 years of combined technology and business consulting experience advising clients on strategy, transforming and optimizing their processes. He can be reached at [email protected].
Nazia Tarannum is a Consultant within Cognizant Business Consulting, focused on the manufacturing and logistics domain. With almost five years of industry experience, she has helped manufacturing and logistics companies to define and identify improvements in pricing processes and systems. Nazia holds a bachelor’s degree in electronic engineering and a post-graduate degree in business management (logistics and supply chain) from S.P Jain Center of Management, Singapore and Dubai. She can be reached at [email protected].