Spanish Flu in Sydney, 1919
15
Dr Kevin McCracken Macquarie University Flu Symposium: Centenary of the 1918 Pandemic Spanish Flu in Sydney, 1919
Transcript of Spanish Flu in Sydney, 1919

Dr Kevin McCrackenMacquarie University
Flu Symposium: Centenary of the 1918 Pandemic
Spanish Flu in Sydney, 1919

Dr Kevin McCracken, Honorary Fellow, Macquarie University
2
Macquarie University
Dean, Division of Environmental and Life Sciences: 2008
Associate Professor of Human Geography
Research Areas
Global health, health geography, population ageing, historical demography
Selected Publications
McCracken, K. and Phillips, D.R. (2017). Global Health: An Introduction to Current and Future Trends (2nd
edition), Routledge, London and New York.
McCracken, K. and Phillips, D.R. (2017). “Demographic and Epidemiological Transition”, in D.R. Richardson
(Editor-in-Chief), The International Encyclopedia of Geography: People, the Earth, Environment and Technology,
Wiley-Blackwell: New York.
Caley, P., Philp, D. and McCracken, K. (2008). “Quantifying social distancing arising from pandemic influenza”,
Journal of the Royal Society Interface, 5(23), pp.631-639.
Curson, P. and McCracken, K. (2006). “An Australian perspective of the 1918-1919 influenza pandemic”,
NSW Public Health Bulletin, 17(7-8), pp.103-107.
McCracken, K. and Curson, P. (2003). "Flu downunder: a demographic and geographic analysis of the 1919
pandemic in Sydney, Australia", pp.110-131 and 272-275 in H. Phillips and D. Killingray (eds.), The Spanish Flu
Pandemic of 1918: New Perspectives, Routledge Studies in the Social History of Medicine, Routledge: London.
3
Outline• Introduction
• Sydney, 1919
• Origins
• Control measures
• Temporal path
• Mortality patterns
- age and sex
- socio-economic
- geographical
• Summary
- uncertainties (origins? - waves? – govt. regulations? - differentials?)

4
Population size and mortality,
Sydney, 1918-20
Source: McCracken, K. and Curson, P. (2003)
Greatest health and social disaster in Sydney’s history
Morbidity
- Estimated 300,000 Sydney residents went down with the flu
- 36-37% attack rate
Mortality
- Sydney’s flu death rate highest of Australia’s metropolitan areas
- many marriages ruptured – children orphaned
Sydney 2018 (5.1 million population) equivalent
- Flu cases: ≈1.8-1.9 million
- Flu Deaths: ≈ 22,000
Global tolls – most radical resculpturing of human populations
since 14th century Black Death
1918 influenza pandemic– est. 50-100 million people died (cf.
WW1 est. 17 million) – included Donald Trump’s grandfather;
Lawrence of Arabia’s father; Arthur Conan Doyle’s son
Simulation of similar highly contagious & lethal modern-day
influenza outbreak
(Institute for Disease Modelling/Bill Gates, NEJM, May 31, 2018
- After 3 months: 10.1 million deaths
- After 6 months: 32.9 million deaths
29.3%
Table 1
5
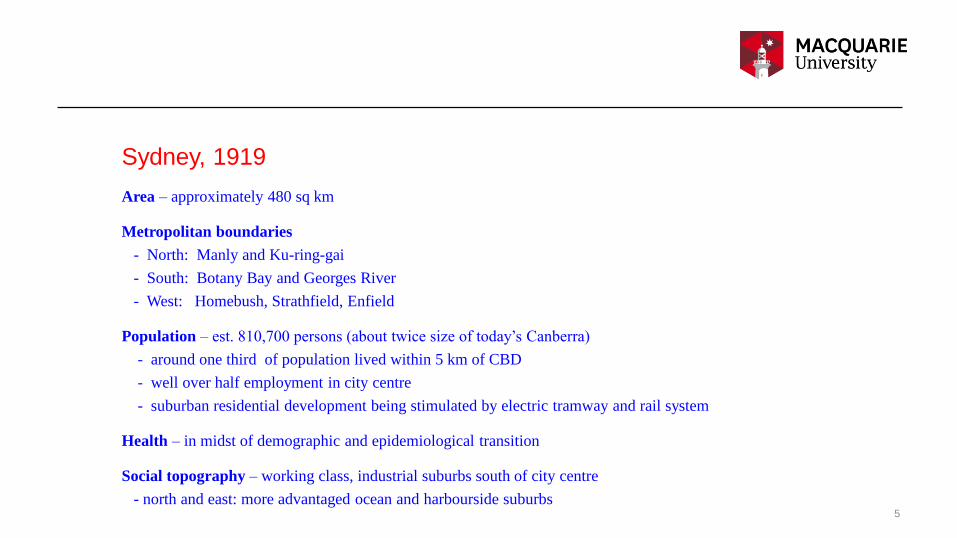
Sydney, 1919
Area – approximately 480 sq km
Metropolitan boundaries
- North: Manly and Ku-ring-gai
- South: Botany Bay and Georges River
- West: Homebush, Strathfield, Enfield
Population – est. 810,700 persons (about twice size of today’s Canberra)
- around one third of population lived within 5 km of CBD
- well over half employment in city centre
- suburban residential development being stimulated by electric tramway and rail system
Health – in midst of demographic and epidemiological transition
Social topography – working class, industrial suburbs south of city centre
- north and east: more advantaged ocean and harbourside suburbs

6
The arrival of ‘Spanish’ flu in Sydney, January 1919(Sydney Morning Herald, 28 January, 1919)
Source: McCracken, K. and Curson, P. (2003)
Epidemic initially seeded in Sydney by arrivals from Melbourne
(soldiers then civilians) in late January 1919 – early clusters of
cases (Randwick Military Hospital, Paddington, Darlinghurst,
central Sydney)
Quickly developed into a general community outbreak, spreading
from initial inner city concentration – Canterbury badly hit (21
hospitalised cases Feb 7-27) – also by 20 Feb had reached
Willoughby, Ryde, Hunter’s Hill, Burwood Auburn, Bankstown,
Lidcombe Hornsby)
Figure 1
7
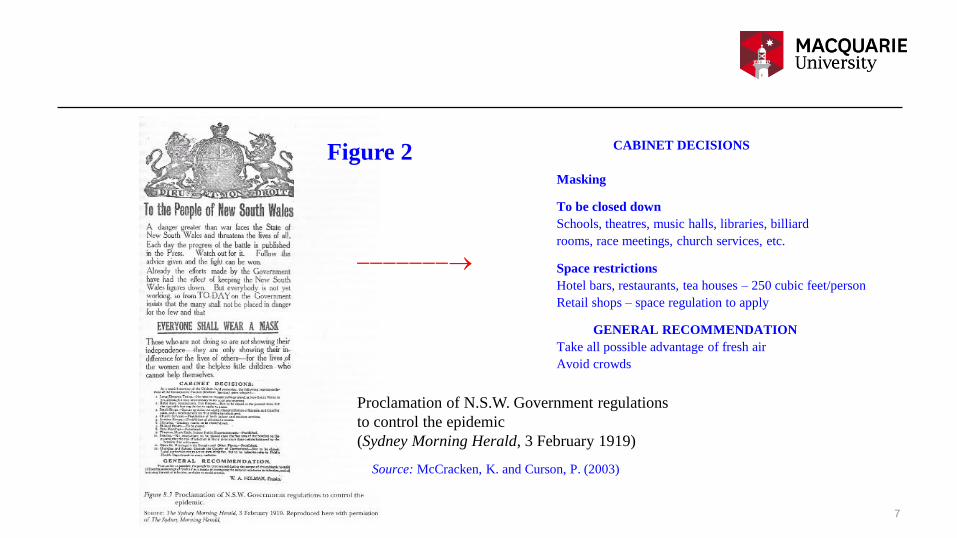
Proclamation of N.S.W. Government regulations
to control the epidemic
(Sydney Morning Herald, 3 February 1919)
Source: McCracken, K. and Curson, P. (2003)
CABINET DECISIONS
Masking
To be closed down
Schools, theatres, music halls, libraries, billiard
rooms, race meetings, church services, etc.
Space restrictions
Hotel bars, restaurants, tea houses – 250 cubic feet/person
Retail shops – space regulation to apply
GENERAL RECOMMENDATION
Take all possible advantage of fresh air
Avoid crowds
-------
Figure 2
8
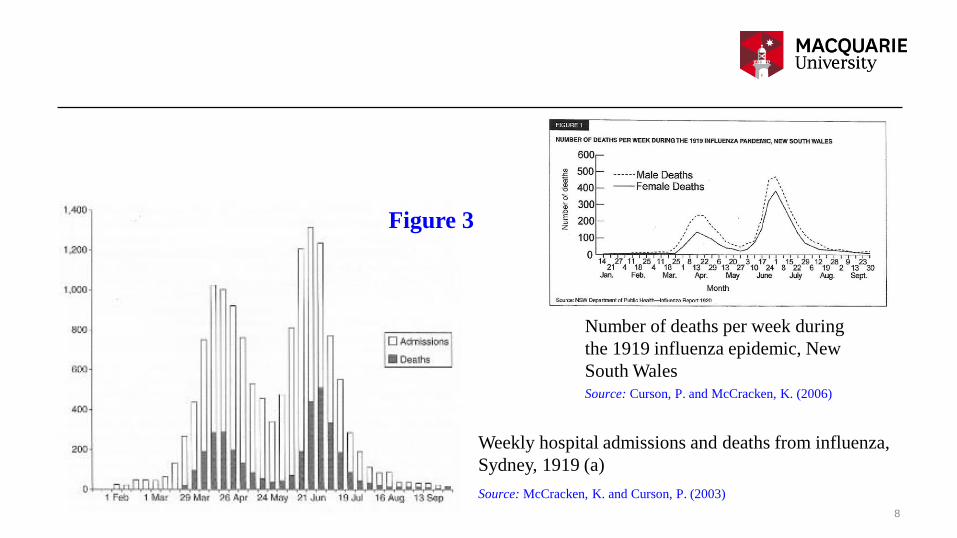
Weekly hospital admissions and deaths from influenza,
Sydney, 1919 (a)
Number of deaths per week during
the 1919 influenza epidemic, New
South Wales
Source: McCracken, K. and Curson, P. (2003)
Source: Curson, P. and McCracken, K. (2006)
Figure 3

9
Daily hospital admissions and deaths from influenza,
Sydney, 1919 (b)
Source: Caley, P., Philp, D. and McCracken, K. (2008)
Waxing and waning of epidemic
- Changing nature/virulence of virus?
- Introduction/lifting of restrictions?
- Build up of immunity?
- Weather?
Figure 4

10
Summary of epidemic incidence, policy and individual’s perceived
risk factors influencing the degree of social distancing during different
periods of the influenza epidemic in Sydney, 1919
Source: Caley, P., Philp, D. and McCracken, K. (2008)
1st Wave
2nd Wave
Late Mar – mid May
Mid June – early Aug
Govt regulations
Table 2

11
Time from symptom onset to death for the
cases of pandemic influenza in Sydney, 1919
Source: Caley, P., Philp, D. and McCracken, K. (2008)
Deaths often occurred rapidly
– newspapers fanned alarm – reports of people waking fine
in morning and being dead by nightfall
– like media-induced panic in present day epidemics
Figure 5

12
Age-sex-specific death rates from influenza,
Sydney, 1919
Source: McCracken, K. and Curson, P. (2003)
Uneven sweep across the city – age, sex, social, geographical
differentials
Young adults (“prime of life” – 25-39yrs) - usual flu victims are
the elderly and young
Higher male mortality (especially 1st wave) – why?
- some greater male biological susceptibility to the particular
viral strain? – 100 years on can only remain conjecture
- differential socio-behavioural risk factors of males/females
probably more a factor than biology – i.e. mobility and
mixing by males? (employment?, hotels?, races?, football?)
No age-sex tabulations of attacks available – so whether deaths
reflected attack rates unknown
Figure 6

Death rates from influenza per 1,000 males
aged 15+, by occupational group, New South
Wales, 1919
Source: McCracken, K. and Curson, P. (2003)
Occupational differentials – 2 sets of possible mechanisms?
– direct on-the-job risk factors?
and/or
– life style and socio-economic factors?
Jobs involving close contact with public (e.g. tramways,
postal, road carters/carriers)
LS and SES
Workers on low incomes, living in sub-standard houses,
poor nutrition
Table 3
13
14
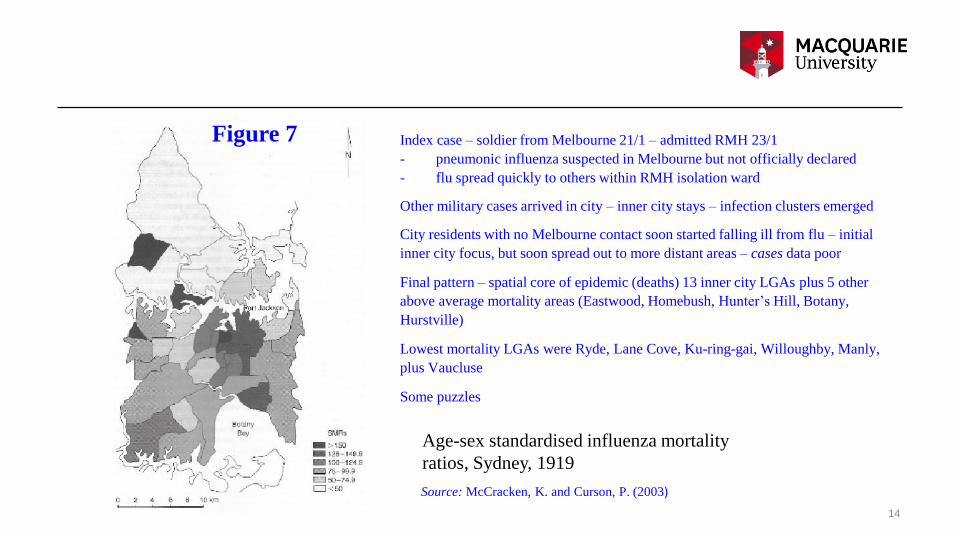
Age-sex standardised influenza mortality
ratios, Sydney, 1919
Source: McCracken, K. and Curson, P. (2003)
Index case – soldier from Melbourne 21/1 – admitted RMH 23/1
- pneumonic influenza suspected in Melbourne but not officially declared
- flu spread quickly to others within RMH isolation ward
Other military cases arrived in city – inner city stays – infection clusters emerged
City residents with no Melbourne contact soon started falling ill from flu – initial
inner city focus, but soon spread out to more distant areas – cases data poor
Final pattern – spatial core of epidemic (deaths) 13 inner city LGAs plus 5 other
above average mortality areas (Eastwood, Homebush, Hunter’s Hill, Botany,
Hurstville)
Lowest mortality LGAs were Ryde, Lane Cove, Ku-ring-gai, Willoughby, Manly,
plus Vaucluse
Some puzzles
Figure 7
15
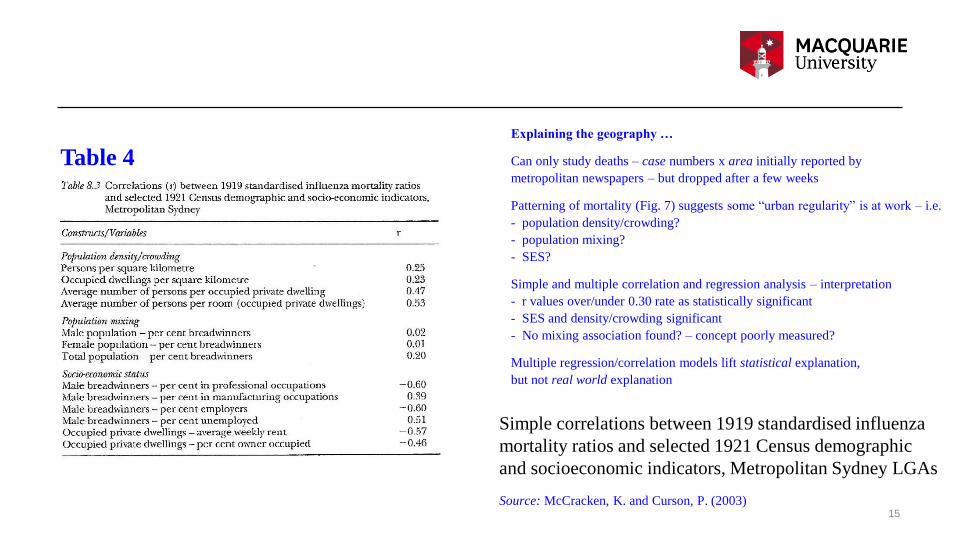
Simple correlations between 1919 standardised influenza
mortality ratios and selected 1921 Census demographic
and socioeconomic indicators, Metropolitan Sydney LGAs
Source: McCracken, K. and Curson, P. (2003)
Explaining the geography …
Can only study deaths – case numbers x area initially reported by
metropolitan newspapers – but dropped after a few weeks
Patterning of mortality (Fig. 7) suggests some “urban regularity” is at work – i.e.
- population density/crowding?
- population mixing?
- SES?
Simple and multiple correlation and regression analysis – interpretation
- r values over/under 0.30 rate as statistically significant
- SES and density/crowding significant
- No mixing association found? – concept poorly measured?
Multiple regression/correlation models lift statistical explanation,
but not real world explanation
Table 4