
SPACE SCIENCE INSTITUTE No 8,November2001 … · Published bythe Association Pro ISSI ... To study...
20
Published by the Association Pro ISSI No 8, November 2001 INTERNATIONAL SPACE SCIENCE INSTITUTE Sun and Climate Sun and Climate
Transcript of SPACE SCIENCE INSTITUTE No 8,November2001 … · Published bythe Association Pro ISSI ... To study...
Published by the Association Pro ISSI
No 8,November 2001
INTERNATIONAL SPACESCIENCEINSTITUTE
Sun and ClimateSun and Climate

Man’s early ancestors were wiseenough not to call themselveshomo sapiens. They were also wiseenough not to exploit their habitatto an extent which could cause the climate to change. But thechange occurred all the same:droughts entailed the jungles toretreat, leaving wide-open spacefor savannas. In order to survive in such radically different sur-roundings, the hominids had toadapt their behaviour appropri-ately. They were successful: theywere able to propagate all over theEarth.
Much later, their descendentscoined the term homo sapiens, thewise man, for themselves. Theywere wise enough to invent ma-chines that burn huge amounts offossil fuel. They did so to such anextent that the Earth’s atmosphereincreasingly became a greenhouse:letting the warmth of the Sunenter but not radiate back tospace. The wise man has got nowthe chance to prove his wisdomadapting his behaviour appropri-ately.
Scientific research must have thegoal of augmenting collective wis-dom. Climate research is neededto increase our knowledge of theproperties of that thin layeraround Earth where life can exist.But the term wisdom is appropriateonly if knowledge turns intoaction, with a full awareness ofresponsibility.
The present issue of Spatium isdevoted to a general overview ofthe Earth’s climate system, withspecial emphasis on the role of
the Sun, because it is by far themost important forcing factor ofthe climate system. Since theIndustrial Revolution some 150years ago, however, the anthro-pogenic influence can no longerbe neglected. Climate researchprovides the knowledge requiredfor mankind to act in awareness ofresponsibility towards its futuregenerations.
We are very grateful to Dr. JürgBeer, head of the Radioactive Trac-ers Group at the Swiss Federal In-stitute for Environmental Scienceand Technology in Dübendorf(ZH) for his kind permission topublish herewith a summary ofhis fascinating lecture on climateresearch given at our association’smeeting in late autumn 2000.
Hansjörg SchlaepferBern, November 2001
2SPAT IUM 8
Impressum
S PATI UMPublished by theAssociation Pro ISSItwice a year
Association Pro ISSIHallerstrasse 6, CH-3012 BernPhone ++41 31 631 48 96Fax ++41 31 631 48 97
President Prof. Hermann Debrunner, University of BernPublisherDr. Hansjörg Schlaepfer, legenda schläpfer wort & bild,WinkelLayoutMarcel Künzi, marketing · kom-munikation, CH-8483 KollbrunnPrinting Druckerei Peter + Co dpcCH-8037 Zurich
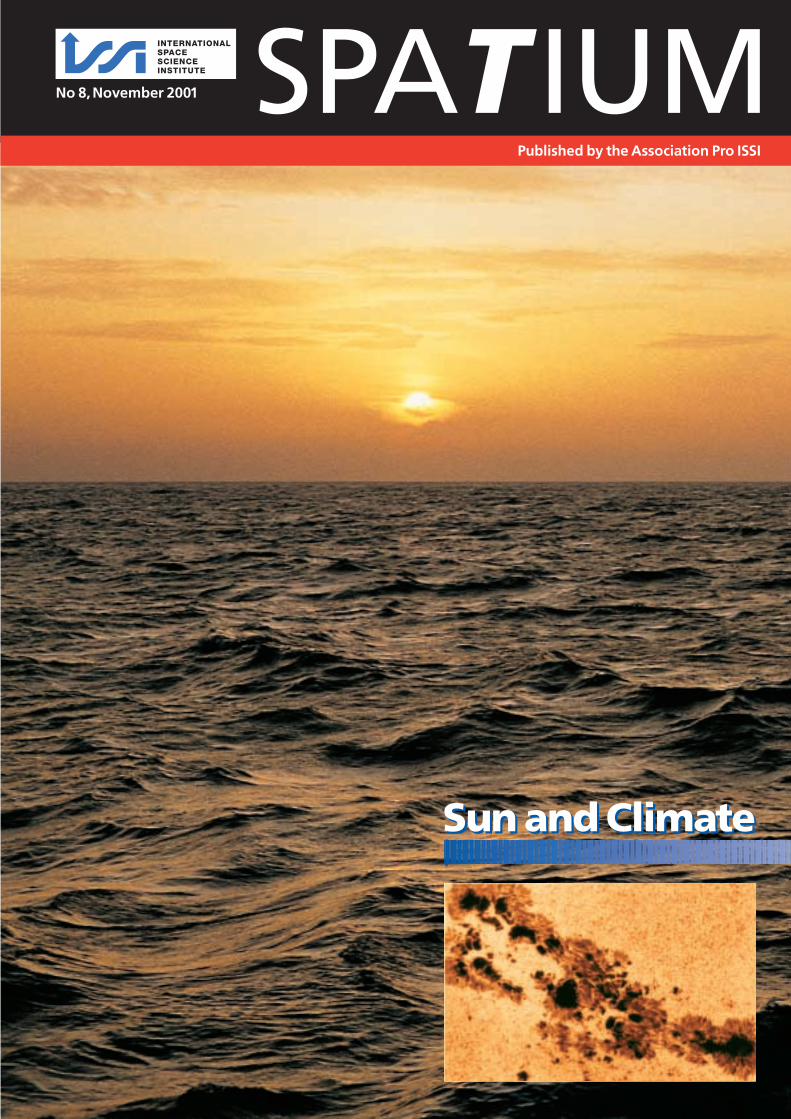
Front CoverSun-set over the Thyrrenian Sea.(Photo: H. Schlaepfer)
INTERNATIONAL SPACESCIENCEINSTITUTE
Editorial

3SPAT IUM 8
Introduction:Setting theScene
The Sun is by far the most impor-tant driving force of the Earth’sclimate system. However, only lit-tle is known how variably thisforce acts on time scales rangingfrom minutes to millennia andhow the climate system reacts tochanges in this forcing.
In the core of the Sun nuclearfusion processes generate energy,which is then transported towards
the solar surface. The total solarradiation that arrives at the top ofthe Earth’s atmosphere dependson several factors: the energy pro-duction in the core of the Sun,the energy transport through theSun’s radiative and convectivezone, the emission of radiationfrom the photosphere and the dis-tance between Sun and Earth.
Satellite-based measurements overthe past two decades have re-vealed a clear correlation betweenthe solar irradiance and the11-year sunspot cycle. The ob-served changes in total solar irra-diance between solar maximumand solar minimum of an 11-yearcycle amount to about 0.1% (an-
nual average). This is too small achange to significantly affect theclimate. However, there is grow-ing evidence that, on longer timescales, solar variability is muchmore pronounced and the climatesystem is much more sensitive tosolar forcing due to feedbackmechanisms.
The response of the climate sys-tem to changes in solar forcingdepends not only on the intensityof the radiation, but also on itsspectral composition, seasonal dis-tribution over the globe and onfeedback mechanisms connectedwith clouds, atmospheric watervapour, ice cover, atmospheric andoceanic transport of heat andother terrestrial processes. It istherefore impossible to establish a simple quantitative relationshipbetween reconstructed climatechanges in the past and recon-structed solar variability. There is,however, growing evidence thatperiods of low solar activity coin-cide with the advance of glaciers,changes in lake levels and othersignificant environmental changes.These findings indicate that theSun played an active role in pastclimate changes in concert withother geophysical climate forcingfactors such as volcanic eruptions,greenhouse gases and internalvariability of the climate system.
To study the climate in the pastone has to rely on archives. Thelast few hundred years are quitewell documented. The sunspotsrecorded by many observers tellus about solar activity and meteor-ological stations provide informa-tion about local air temperatures.
Sun and Climate *)
Jürg Beer,Swiss Federal Institute for Environmental Science and Technology (EAWAG)
*) Pro ISSI lecture, Bern, October 31st, 2000
Figure 1Sunspots represent areas where dense magnetic flux tubes cross the solar sur-face. As a consequence of the intense magnetic fields, the local convective heat trans-port is reduced and the surface temperature lowered by 1,000 to 2,000 K. In spite ofthe still very high temperatures of ca. 4,000 K, a sunspot looks dark compared to thetemperature of 6,000 K of the surrounding area. The number of spots waxes andwanes with a periodicity of about 11 years (Schwabe cycle).

Unfortunately, these stations arenot equally distributed around theglobe.This instrumental time span,however, is too short to documentslow climate changes and does not allow us to study the under-lying long-term processes. Weneed archives that record climatechanges over much longer periodsof time. Glaciers and polar ice capsare especially promising types ofarchives which were formed fromsnowfalls over very long periodsof time (up to several hundredthousand years). Snow scavenges avariety of solid and liquid con-stituents from the atmosphere,which are subsequently stored inthe ice in chronological order andcan later be retrieved and analysedby use of sophisticated techniques.
The present issue of Spatium isdevoted to the topics of solar forc-ing, the Earth’s climate and tosome aspects of how informationis retrieved from ice cores. How-ever, a complete overview on allaspects of climate change wouldby far exceed the scope of thissmall booklet. The interested read-er is referred to the followingsources:
PAGES (Past Global Changes)Programme, jointly sponsored bythe United States and the SwissNational Science Foundation(http: //www.pages-igbp.org.)
R. von Steiger, Das neue Bildder Sonne (1998), Spatium Nr. 2.
Hoyt, D. V. and K. H. Schatten(1997): The Role of the Sun inClimate Change. New York, Ox-ford University Press.
The Sun: Our Daytime Star
On the one hand, our Sun is sim-ply an ordinary star, one of morethan 100 billion in our galaxy. Onthe other hand, it is a very specialstar for us because it is by far theclosest (8 light minutes comparedto 4 light years). In comparison tothe planet Earth, several of theSun's properties are quite impres-sive. Its diameter of 1,390,000 kmis more than 100 times the Earth’sdiameter, its mass equals morethan 300,000 times the Earth’smass and its surface temperatureequals 5,800 K. The conditions inthe Sun's core (the inner 25% ofits radius) are extreme comparedto the conditions on Earth. Thetemperature is 16 million Kelvinand the pressure is 250 billion at-mospheres. These are the condi-tions required to maintain thepresent energy production, whichmakes the Sun shine.
The Sun is by far the largest objectin the solar system. It containsmore than 99.8% of the total massof the Solar System, and Jupitercontains most of the rest. At pres-ent, the Sun consists of about92.1% hydrogen and 7.8% heliumby number of atoms; other heav-ier elements such as metals onlymake up for 0.1%. This composi-tion changes slowly over time asthe Sun converts hydrogen tohelium in a giant nuclear powerplant in its core. Every second,about 700 million tons of hy-drogen are converted to about
696 million tons of helium. Thismeans that 4.3 million tons ofmass are converted into energyevery second, generating a powerof 3.86 ·1026 Watt. This powertravels from the core towards the surface of the Sun in theform of radiation (radiative zone).On its way it is continuously ab-sorbed and re-emitted at increas-ingly lower temperatures. Havingreached about 2/3 of the solar ra-dius the gas is too cool and hencetoo opaque for radiation to pass, soconvection sets in. In the adjacentconvection zone, energy is trans-ported by hot material rising tothe surface and cool material sink-ing to the bottom, forming hugeconvection currents.
Overall, it is a long way. It takesthe radiation several million yearsto work its way out from the coreto the solar surface (photosphere).From the surface, the power is ra-diated into space. If this totalpower reached the Earth it wouldtake only 10 seconds to evaporateall the water stored in the oceansand the ice caps on Earth! In reali-ty, only about 1 part per billionreaches the Earth. All the same,the amount of solar energy thatarrives on the surface of the Earthevery hour is greater than the totalamount of energy that the world’spopulation consumes in a wholeyear. The radiation emitted is pri-marily visible light. This is no coincidence: during the hundredsof millions of years of the evolu-tion the spectral sensitivity of oureyes has been perfectly matchedto that part of the sunlight’s spec-trum which contains most of theenergy.
4SPAT IUM 8

The radiating surface of the Sun,called photosphere, is a very thinlayer of only a few hundred kilo-metres with a temperature ofabout 5,800 K. In a more or lessregular rhythm of 11 years, thegolden face of the Sun is disgracedby dark spots: the famous sunspots(Figure 1). Sunspots are caused bydense magnetic flux tubes thatcross the solar surface and hinderthe convective heat transport tothe surface. Therefore, sunspotsare “cool" regions, with tempera-tures of only 4,000 K. They lookdark in comparison with thesurrounding areas. Sunspots cangrow very large, up to 100,000 kmin diameter.
The outermost region of the solaratmosphere, the corona, extendsinto space for millions of kilome-tres. However, the beautiful crownof the Sun is visible to the nakedeye of the observer only during aneclipse.
The Sun's magnetic field is verystrong compared to the geomag-netic field and also very com-plicated. The magnetosphere ex-tends well beyond the outer-most planet Pluto and plays an im-portant role in shielding theEarth’s surface from high-energycosmic rays, which, otherwise,would endanger life on Earth(Figure 2).
Apart from heat and light, the Sunalso emits a low-density stream ofcharged particles (mostly elec-trons and protons) called solarwind, which spreads throughoutthe solar system with a speed ofseveral hundred kilometres persecond. The solar wind and themuch higher energy particlesejected by solar flares can havedramatic effects on the Earthranging from power line surges tothe beautiful aurora phenomenon.
The Sun has a life cycle like a liv-ing creature. It was born out ofcosmic dust about 4.5 billion yearsago. Since then it has used upabout half of the hydrogen in itscore. It will continue to burn hy-drogen for another 5 billion yearsor so (although its luminosity will approximately double in thattime, see Figure 3). Eventually, itwill run out of hydrogen fuel in the core and its life cycle willcome to an end. This will set off anumber of dramatic changes: TheSun will turn into a red giant byincreasing its diameter beyond theEarth’s orbit, swallowing all theinner planets and then creating aplanetary nebula by throwing outpart of its gaseous shells. This willbe the termination of all life onEarth. Finally, it will collapse to awhite dwarf and its light will ex-tinguish.
Besides these large but very slowand steady changes over billions of years, the Sun also exhibitsvariability on much shorter timescales. After a period of large vari-ability in its young age the Suncalmed down and became a rela-tively stable star, an important
5SPAT IUM 8
Figure 2In this cartoon the Sun’s atmosphere continually expands from the left intointerplanetary space. The flow of ionised gas, called solar wind, carries frozen-inmagnetic fields from the Sun into space. When sweeping by the Earth, it deforms thegeomagnetic field. Explosive eruptions lead to sudden “space storms” which canseriously affect the Earth. The solar wind fills a space larger than 100 times the dis-tance from Sun to Earth. The magnetic field deflects the charged cosmic ray particles.Therefore, the cosmic ray flux is reduced considerably within the solar system duringperiods of high solar activity. (Credit: ESA).

condition for the evolution of lifeon Earth. Nevertheless, the Sun isa variable star. Today, on timescales of millennia and shorter,fluctuations in the energy produc-tion in the core are extremelysmall (10–8), and very small (10–6)in the energy transport throughthe radiative zone (1/3 to 2/3 of theSun’s radius). In the convectionzone, however, turbulence givesrise to fluctuations of up to per-cents on various time scales. Final-ly, the emission of radiation fromthe solar surface is given by thetemperature of the photosphere,which is not homogeneous. Activemagnetic regions (faculae) arewarmer and sunspots are colderthan the surrounding solar sur-face. On average, the faculae over-compensate the cooling effect of
the sunspots leading to a slightlybrighter Sun during periods ofhigh activity. Periods of highersolar activities with many sunspotsare followed by minima in an11-year cycle. In addition, thereare other variations with periodic-ities of approximately 90, 200 andpossibly 2,000 years.
Sometimes, the Sun relaxes andbecomes quiet for several decadesor even a few centuries. The fa-mous Maunder Minimum (1645–1715 AD) was such an event, a pe-riod during which hardly anysunspots were detected. It is inter-esting to note that the MaunderMinimum falls into a period char-acterised by generally lower tem-peratures and glacial advancesknown as the Little Ice Age.
The ClimateSystem: The Distributorand Equalizer ofEnergy on Earth
Following the laws of thermo-dynamics, the Earth’s climatesystem seeks to redistribute theenergy input from space equally: On top of the atmosphere, everysquare meter perpendicular to theaxis Sun–Earth receives approx.1,365 W of power from the Sun.This value is called the solar con-stant by tradition although weknow that it is not constant overtime. There are other sources ofenergy on Earth such as the tidalforces related to the Moon orbit-ing around the Earth or geo-thermal heat resulting from radio-active decay processes in theEarth’s interior. However, theircontribution is negligible in com-parison to the solar input.
A very thin layer of only approxi-mately 1/1,000 of the Earth’s diame-ter forms the stage on which theclimate system acts. Basically, itconsists of the atmosphere, thehydrosphere, the biosphere andthe continents. For simple geo-metrical reasons the mean annualradiative input of the Sun isstrongest in the equatorial regions,where the Sun is near the zenithand becomes lower at higher lati-tudes. This unequally distributedenergy input leads to thermal gra-
6SPAT IUM 8
Rel
ativ
e Lu
min
osi
ty
Time (billion years)
0 2 4 6 8 10
1.6
1.4
1.2
1.0
0.8
0.6
Figure 3The standard solar model reveals that the solar luminosity (total solar energeticoutput) has continuously increased since the formation of the solar system 4.55 bil-lion years ago and will continue to do so for another 5 billion years until most of thehydrogen in the core is burned to helium. This change is too slow to be relevant ontime-scales of millennia. (Credit: W. Mende).

dients, which the climate systemtries to level out by transportingenergy from lower to higher lati-tudes. The energy is transportedby wind, ocean circulation andwater vapour. Instead of followinga direct path to the poles, thetransport follows a rather complexregime. This is due to several rea-sons: firstly, warm air masses areless dense and move upwardsforming convection cells. Second-ly the distribution of land andwater and the physical topographyaffect the energy flow. Thirdly, theCoriolis force deflects air andwater masses moving towards thepoles to the right on the northernhemisphere and to the left on thesouthern hemisphere.
The first redistributor is the lowerpart of the atmosphere, the tropo-sphere, where large wind systemsare generated as a result of the dif-ferent factors influencing the airmasses moving north or south.The trade winds in the tropicalzones, which played a key role atthe time of the first conquistadoresare probably the best known ofthese. The wind systems are thedomain of meteorology dealingwith cyclones and anticyclones,with air humidity and tempera-ture eventually causing clouds andprecipitation. The short term be-haviour of all these quantities de-termines the daily weather. Thelong-term development of weath-er patterns defines the climate.
The second redistributor is the hy-drosphere, which consists of thewater in oceans, rivers and lakes,the ice in glaciers and polar icecaps, the vapour in the air, the
droplets in clouds and the groundwater. The thermal gradients in-duced by solar insolation causethe water to flow. Warm tropicalwaters flow pole-wards over thecooler deep-sea water. Evapora-tion increases the salinity of thewater and thus its density. Coolingfurther increases the density ofthe water until it begins to sink to the bottom of the ocean fromwhere it flows back, closing theloop. These processes generate the great streams on Earth such asthe Gulf Stream in the northernAtlantic or the Humboldt Streamwest of South America. Theamount of water involved in thecirculation system of the NorthAtlantic, which is an importantpart of the global oceanic convey-er belt, is equal to about 100 Ama-zon Rivers. Interruption of thisconveyer belt would change theclimate conditions in northern Eu-rope dramatically. London wouldexperience winters like Irkutsk inSiberia.
The third redistributor is the radi-ation, which is reflected, absorbedand emitted by the Earth’s surface,by greenhouse gases and clouds inthe atmosphere.
An astronaut travelling throughthe solar system will inevitablyhave his attention drawn to theblue planet, the Earth, which lookscompletely different from all theother planets. The main reason forthis special appearance are theoceans and the clouds. The bios-phere also plays an important role.In spite of the fact that it uses onlya very small part of the solar ener-gy input, the biosphere has e. g.
produced all the oxygen presentin the atmosphere. All the fossilfuel we are combusting within afew centuries is solar energy whichwas accumulated by the biosphereover millions of years. Presently,mankind lives primarily on solarenergy delivered to Earth in thepast.
Although, at first glance, the taskof redistributing energy seemsrather simple, this is not the case.In fact, the climate system isextremely complex. Everybodyknows that forecasting the weath-er for more than a day is a chal-lenging task. Even professionalmeteorologists who can rely on adense global network of weatherstations, satellites and most sophis-ticated computer models are un-able to make reliable predictionsfor more than a few days. The rea-son for this is that the weatherconditions are the result of a verylarge number of processes andtheir complex interaction on vari-ous time and length scales. Be-cause the behaviour of the weath-er system is to some part chaoticeven the most powerful comput-ers will not be able to solve thisproblem in the future.
In the case of climate change,which we will discuss later on, thesituation is less chaotic, but stillvery complex. This is illustratedby the fact that the best answer atpresent to the question of the re-sponse of the climate system to adoubling of the atmospheric CO2
concentration is not a precise fig-ure but a temperature range (2–5oC). This as yet unsatisfactory an-swer can only be improved by a
7SPAT IUM 8

better understanding of the cli-mate system. The clue to this liesin the past. Careful study of theclimate changes in the past willallow us to identify the key pro-cesses and determine the responseto changes in the forcing. Natureis generous enough to provide uswith a variety of archives, whichcontain all the necessary informa-tion to reconstruct the history ofthe Earth’s climate and the forc-ing. However, reading and de-ciphering this information is notalways an easy task.
Climate Archives: The Diaries of Nature
For the last several centuries, re-construction of the climate historyis comparatively simple. Beside di-rect physical measurements, there
is a wealth of information in writ-ten historical documents. Evenpaintings can be a useful source ofclimate information. Paintings andmore recently, photographs of aglacier from the same site docu-ment very nicely how its sizechanges with time and how dra-matic the present global warmingis (Figure 4). Another example isdepicted in Figure 5, showing amarket on the frozen RiverThames in the winter 1813/1814.It is reported that such marketsand other events took place on theThames during winter quite regu-larly as from the 15th century, butnever again after 1814.
For earlier times, ice itself servesas an archive. Glaciers in highmountains and ice sheets in the
8SPAT IUM 8
Figure 5Market on the River Thames in London in the year 1813/1814. Between 1400 and1814 such markets were quite common. In the winter of 1683/1684 the ice reached athickness of 26 cm and the river was completely frozen for 2 months.Painting by Luke Clement. (Credit: Wetterbuch, Christian Verlag, 1982, ISBN 3-88472-080-5).
Figure 4The glacier near Grindelwald photographed in 1858 and 1974. (Credit: F. Martens,H. J. Zumbühl in Hydrologischer Atlas der Schweiz).

polar zones store climate infor-mation for centuries to hun-dreds of millennia. They truth-fully record the average climateconditions, levelling out the capri-cious moods of the weather.One example of such an archive is the glacier on Mt. Kilimanjaro(Figure 6), which is of special in-terest since it stores climate infor-mation on the tropical zone.Unfortunately, this irreplaceablearchive is melting away quicklydue to the increasing mean tem-perature.
Precipitation in form of snowscavenges various constituents ofthe atmosphere and stores themchronologically, layer by layer. In-creasing pressure from additionallayers causes the snowflakes to
compact and become ice. Theconsequence of this formationprocess is that the ice not onlypreserves all the atmospheric con-stituents such as aerosols and dust,it also contains air bubbles thatenable scientists to determine theatmospheric composition and inparticular the concentration ofgreenhouse gases in the past. Thisunique property makes ice theonly archive that virtually storesall the climate forcing factors suchas greenhouse gases, aerosols andvolcanic dust and cosmogenic iso-topes reflecting solar variability.Ice cores also contain informa-tion on the corresponding climateresponses: temperature, precipi-tation rate, wind speed and at-mospheric circulation. (Figures 7and 8).
Reading and deciphering the infor-mation nature stored in archivesis, however, not a simple task. Forexample, the temperature signal isstored in the form of the oxygenisotope ratio 18O/ 16O in ice. Thecorresponding temperature canonly be determined if this ratiocan be measured with high pre-cision and if the relationship be-tween the 18O/ 16O ratio and thetemperature is known. Solar vari-ability, on the other hand, isrecorded in the ice through solarwind induced modulation of thecosmic ray flux. Some high ener-getic cosmic ray particles travel-ling through our galaxy penetrateinto the Earth’s atmosphere wheremost of them collide with nitro-gen or oxygen atoms. If theseatoms are hit by fast travelling
9SPAT IUM 8
Figure 6The extent of ice cover on Mt. Kilimanjaro (5,895 m) decreased by 81% between 1912 and 2000. In 1889, when Hans Meyerfirst climbed Kibo, the crater rim was nearly encircled by ice. Today only a small fraction of this ice remains. Clearly visible is thebanding of the ice sheet associated with the annual cycles. In the background Mt. Meru. (Credit: Andri Schlaepfer).

cosmic ray particles they canbreak up into smaller atoms, socalled cosmogenic radioisotopessuch as 10Be. Opposite to stableisotopes, radioisotopes disappearby radioactive decay and aretherefore very rare. Within a fewhalf-lives they reach an equilib-rium between production anddecay. On Earth there is a totalamount of only about 100 tons of 10Be.
During periods of high solar activ-ity there is a stronger solar wind.Magnetic fields carried by thesolar wind deflect the cosmic rayparticles more efficiently and hence
reduce the production rate of cos-mogenic isotopes in the atmos-phere. These isotopes are removed
from the atmosphere mainly byrain and snow and some of themare stored in ice caps and glacierspreserving information on theprevailing space weather condi-tions. Therefore, if we measure areduced 10Be concentration in anice core we can conclude that less10Be was produced by cosmic rays.Such lower production rate indi-cates a stronger shielding of thecosmic rays induced by more in-tense solar wind, which, in itself,is the result of increased solar ac-tivity.
This relationship between the con-centration of the Beryllium iso-tope 10Be in a Greenland ice coreand the sunspot number as aproxy of solar activity can be seenin Figure 9. More specifically, theanalysis of the cosmogenic iso-topes 10Be and 36Cl in ice and 14C
10SPAT IUM 8
Isotopes are atoms whichare chemically identical butdiffer in mass due to a dif-ferent number of neutronsin the nucleus.
Figure 7View of a typical drill-site for shallow ice-cores up to 300 m length in Greenland.The building in the background is the former American radar station of Dye 3.
Figure 8Deep-drilling (2,000 to 3,000 metres) is performed underground and takes about 2to 3 years (Summer seasons). The drill is lowered into the borehole, drills a core ofabout 2,5 m length and is then brought up to the surface again. The picture showshow the ice-core is taken out of the drill. The liquid is used to prevent the boreholefrom closing.

in tree rings reveals not only thatsolar variability is partly cyclicwith periodicities around 11, 90,200 years and possibly longerones, but also that the beginningof extended periods of low solaractivity, so called grand minima,often coincide with rapid climatechanges. This points to a relation-ship between solar activity and cli-mate.
Combining the information fromice with additional informationfrom other archives such as lakeand sea sediments, loess deposits,peat bogs, tree rings, corals, spele-othems and others provides amuch more complete picture ofhow the climate system behavedin the past and which were thedriving forces.
Accelerator Mass Spectro-metry: Unravelling theSecrets of Cosmogenic Iso-topes in Ice Cores
Since the late seventies, there hasbeen great progress in the analyti-cal techniques used to read the in-formation stored in archives. Anincreasing number of additionalparameters can be measured andthe analytical sensitivity has im-proved significantly. This is espe-cially true in the case of cosmo-genic isotopes, which can now bemeasured by so-called AcceleratorMass Spectrometers (AMS). TheSwiss Federal Institute of Tech-nology of Zurich (ETHZ) wasamong the first laboratories in Eu-rope to operate such an instru-ment.
Mass spectrometers are complextechnical systems designed to sep-arate and measure atoms with dif-ferent masses. In a conventionalmass spectrometer the material isionised and then accelerated by ahigh voltage. The accelerated ionsare formed to a beam by electricaland/or magnetic lenses. A magnetseparates the ions into differentbeams depending on their masses.In the case of cosmogenic isotopes(14C, 10Be, 36Cl) we are faced withextremely small numbers of atoms,which even further decrease withtime due to radioactive decay. Forexample, the 14C/12C ratio in ourbody is about 12 ·10–13, in the bodyof the ice man it is about 6 ·10–13
and in the body of a Neanderthalman it is as low as 10–15. Measuringsuch small ratios exceeds the capa-bility of conventional mass spec-trometers due to background prob-lems caused by isobars (14N in thecase of 14C) and molecules (e.g.13CH). A great step forward wasthe development of the Accelera-tor Mass Spectrometer (see Figure10), which works along the sameprinciple as a conventional massspectrometer, but accelerates theions to approximately 1,000 timeshigher energies. At these energiesthe molecules are destroyed andevery single ion reaching the detec-tor can be identified and countedindividually. The power of this ana-lytical technique is best illustratedby a simple comparison.The task ofdetermining the 10Be concentrationin 1 kg of ice is comparable tomeasuring the ink concentration in1 litre of water from lake Con-stance after putting a small drop (3microliters) of ink into the lake andallowing it to mix completely!
11SPAT IUM 8
Figure 9Comparison between the observed mean annual number of sunspots with the con-centration of 10Be atoms in the ice-core from Dye 3 (Figure 7). A large number ofsunspots correspond to higher solar activity, more solar wind, fewer cosmic rays,lower production rates of 10Be and therefore a lower 10Be concentration. Bothrecords show a clear 11-year Schwabe cycle and a long-term trend interrupted byshort periods of reduced solar activity around 1815 and 1900.
10B
e [1
04 a
tom
s g
–1]
Year1800 18801840 1920 1960
0
Sun
spo
ts200
150
100
50
0
0.2
0.4
0.6
0.8
1.0
1.2
1.4
Sunspots
Beryllium–10

Climate Change:TheStoryof Per-petual Change
Newspapers and scientific jour-nals tell us the story of the presentclimate change, the global warm-ing. Ice cores and other archives tellus the story of the climate in the past.It is a story of perpetual change:
20,000 years ago: The worldlooked completely different. Sealevels were lower by some 100 m.Large parts of Switzerland werecovered by ice. Glaciers carvedthe landscape and transportedhuge rocks over hundreds of kilo-metres found today as erraticblocks.
5,000 years ago: A young mantried to cross the mountains fromItaly to Austria. He died at an alti-tude of about 3,200 m and wasburied under snow and ice formore than 5000 years. In the year1991, his tomb of ice was openeddue to global warming and hisbody was discovered by hikers.
2,000 years ago: The Romansexpanded their empire and con-quered part of England. Thanks to favourable climatic conditionsthey were even able to producewine on the British isle.
1000–1300: The Vikings took ad-vantage of the favourable climateconditions to explore the sea inthe north and west. On a big is-land in the north, Erik the Red
12SPAT IUM 8
Figure 10View of the accelerator mass spectrometer of ETH/PSI, which is used to meas-ure the 10Be concentration in ice. The central part of this instrument is the tandemaccelerator (blue tank in upper right corner), which accelerates the Beryllium ions tovery high energies (20 MeV). This is necessary to analyse ice samples of 1 kg contain-ing as few as 10 million 10Be atoms.

settled down with a group of peo-ple and lived well on agricultureand keeping cattle. They calledthis island Greenland. Gothic churches were constructedall over Europe. Culture flour-ished on a global scale.
1400–1850: The weather becameworse. Sea ice severed the connec-tion to Greenland. The cattle died.Greenland turned from a green toan icy island.In Switzerland, the glaciers ad-vanced considerably. They cov-ered areas where there had beenforest (Figure 4). Since then, theyare generally retreating.
Today: Mankind is concernedabout the ongoing rapid globalwarming.
These are just a few examples toillustrate that the climate systemnever reached stable conditionsfor long periods of time. In otherwords: the climate has alwaysbeen variable. What are the causesof this variability? We can distin-guish between external and inter-nal factors with respect to theplanet Earth.
Potential External Factors:Forcing the Climate
Since the Sun is the dominantsource of energy on Earth it is alsothe main candidate for introduc-ing variability in the climate sys-tem. First, we will consider sourcesof variability of the Sun itself.Then we will discuss how theEarth's orbit around the Sun is
perturbed by the gravitationalforces of the other planets andhow this affects insolation.
Climate Change and Solar Forcing:The Solar Connection
On time scales of solar evolution,reliable models show that, com-pared to today, solar luminosity waslower by approximately 30% short-ly after the formation of the solarsystem and has increased slowly
but steadily over the past 4.5 billionyears (Figure 3). As mentioned earli-er, there may be fluctuations in thetransport of heat from the core ofthe Sun towards its surface, in par-ticular in the convection zonewhere, like in boiling water, hot gasbubbles rise quickly to higher lev-els while cooler gas sinks down tobe reheated. This turbulent boilingcreates a characteristic pattern ofgranulation on the surface. Fluctua-tions in the heat transport causechanges in the solar luminosity.
13SPAT IUM 8
Figure 11Comparison of the solar irradiance with the sunspot numbers for the last twoSchwabe cycles. The irradiance record is a compilation of data from different satel-lites. During periods of high solar activity there are more sunspots, darkening a smallpart of the solar disk (visible in the negative excursions of the irradiance). However,the brightness of the Sun is increased at the same time, overcompensating the dark-ening effect of the sunspots. (Irradiance data: credit: C. Fröhlich, PMOD).
On very short time scales, infor-mation on the inconstancy of solarforcing comes from differentsources:
Since 1978, direct measurementsof the total solar irradiance aremade by satellites equipped withradiometers.They show a relative-ly small amplitude of total solar ir-radiance of about 0.1% within one11-y cycle (Figure 11). Unfortunate-ly, at present, these measurementscannot tell us how much the solarconstant changes over decades tocenturies. However, from the cli-mate point of view, centuries andmillennia are the more importanttime scales.
Since, for obvious reasons, nobodywants to wait for decades to mil-lennia to learn more about thelong-term behaviour of the Sun, acomplementary project was initi-ated to simultaneously study alarge number of sun-like stars(stars with properties very similarto the Sun). A monitoring pro-gram of this kind began 3 decadesago. The results obtained to datefrom sun-like stars indicate a po-tential for much larger solar varia-
tions than those observed by satel-lites over the short time period of20 years.
Theoretical considerations sug-gest that, as a general rule, slowchanges in solar variability tend to have larger amplitudes than fast changes. Variability on timescales up to 20,000 years seemspossible. Moreover, the climatesystem generally reacts more sen-sitively to slow changes than tofast changes. Building up an icesheet, for example, takes a longtime.
The so-called Little Ice Age (ap-prox. 1400–1850) is characterisedby generally lower solar activitycompared to today. During thistime there were several periodswith very low activity. During theMaunder Minimum (1645–1715)hardly any sunspots were ob-served in spite of the continuousefforts of several researchers di-recting their newly invented tele-scopes towards the Sun. Since ap-prox. 1700, the solar activity hassteadily increased and was only in-terrupted by some weak minimaaround 1815 and 1890 (Figure 9).From Figure 11 we know that anincrease in solar activity results inan increase in solar irradiance. Ifthis relationship,which was only es-tablished for the last two decades,also holds true for longer periodsof time, we have a tool in hand toestimate solar irradiance in thepast. Using sunspot numbers or10Be data from ice cores we canreconstruct the history of solar ac-tivity, which in turn reflects thesolar irradiance. This postulatedrelationship can be tested by com-
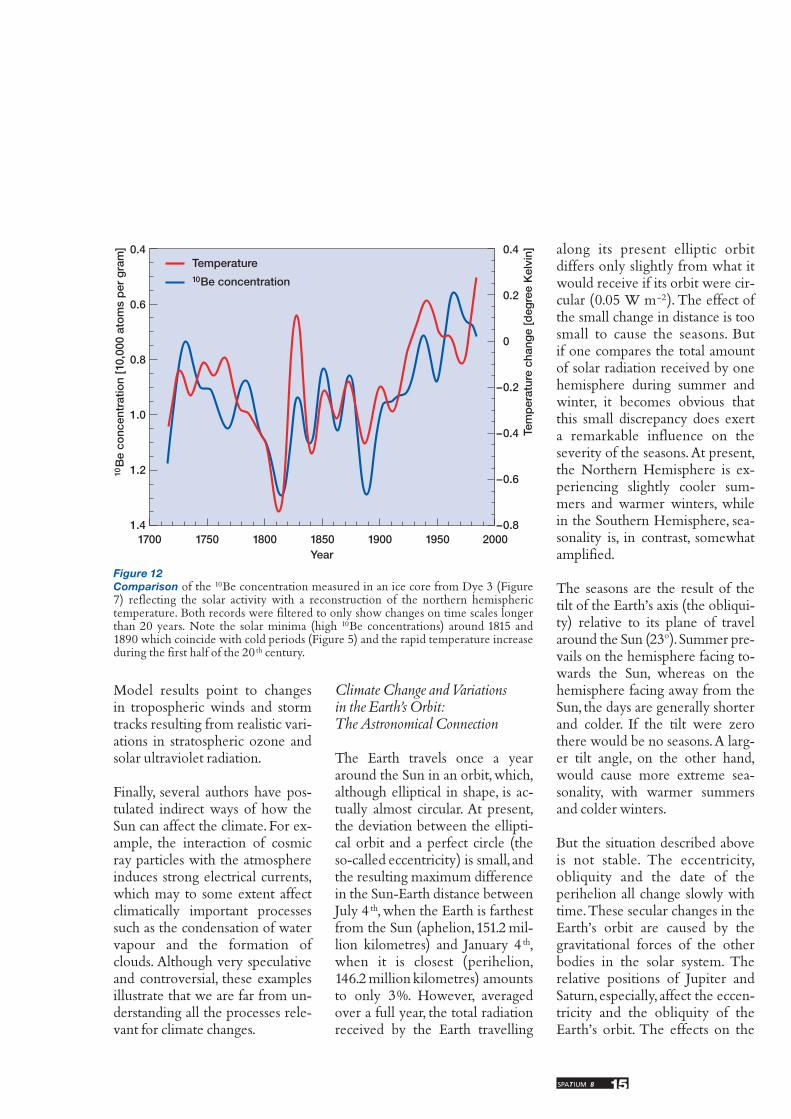
paring the solar forcing signal(10Be) with the climate response(temperature). In fact, Figure 12shows that high 10Be concentra-tions (low solar activity) in an icecore from Dye 3, Greenland, (Fig-ure 7) coincide with cold tempera-tures (reduced irradiance). It hasbeen estimated that the solarconstant was reduced during theMaunder Minimum by about2.50/00 compared to today. Thiscould account for most of the ob-served cooling. 14C data from treerings and 10Be data from ice coresshow that during the past 10,000years a number of such minima insolar activity occurred. Many ofthem can be related to climate de-teriorations, which suggests a solarconnection. A good example is themarket on River Thames men-tioned earlier, which took place inthe winter 1813/1814, precisely atthe onset of such a solar minimum(Figure 12).
When it comes to the question ofthe mechanisms responsible for theobserved climate changes, no finalanswers are yet available. Besidethe most important changes in thetotal irradiance, which induce avariety of feedback and amplifica-tion processes there are othermechanisms which may also playan important role. For example,the relative change of ultravioletradiation during a solar cycle ismuch larger than the change oftotal radiation. Since the ultravio-let component of the spectrum isresponsible for the production ofozone in the stratosphere, consid-erable effects on the stratosphericchemistry and dynamics can beexpected.
14SPAT IUM 8
Luminosity: Total poweremitted by the Sun.
Irradiance: Total powerarriving at the top of theatmosphere in the distanceof 1 astronomical unit(average distance betweenSun and Earth)
15SPAT IUM 8
Model results point to changes in tropospheric winds and stormtracks resulting from realistic vari-ations in stratospheric ozone andsolar ultraviolet radiation.
Finally, several authors have pos-tulated indirect ways of how theSun can affect the climate. For ex-ample, the interaction of cosmicray particles with the atmosphereinduces strong electrical currents,which may to some extent affectclimatically important processessuch as the condensation of watervapour and the formation ofclouds. Although very speculativeand controversial, these examplesillustrate that we are far from un-derstanding all the processes rele-vant for climate changes.
Climate Change and Variations in the Earth’s Orbit: The Astronomical Connection
The Earth travels once a yeararound the Sun in an orbit, which,although elliptical in shape, is ac-tually almost circular. At present,the deviation between the ellipti-cal orbit and a perfect circle (theso-called eccentricity) is small, andthe resulting maximum differencein the Sun-Earth distance betweenJuly 4 th, when the Earth is farthestfrom the Sun (aphelion, 151.2 mil-lion kilometres) and January 4 th,when it is closest (perihelion,146.2 million kilometres) amountsto only 3%. However, averagedover a full year, the total radiationreceived by the Earth travelling
along its present elliptic orbitdiffers only slightly from what itwould receive if its orbit were cir-cular (0.05 W m–2). The effect ofthe small change in distance is toosmall to cause the seasons. But if one compares the total amountof solar radiation received by onehemisphere during summer andwinter, it becomes obvious thatthis small discrepancy does exert a remarkable influence on theseverity of the seasons. At present,the Northern Hemisphere is ex-periencing slightly cooler sum-mers and warmer winters, whilein the Southern Hemisphere, sea-sonality is, in contrast, somewhatamplified.
The seasons are the result of thetilt of the Earth’s axis (the obliqui-ty) relative to its plane of travelaround the Sun (23o). Summer pre-vails on the hemisphere facing to-wards the Sun, whereas on thehemisphere facing away from theSun, the days are generally shorterand colder. If the tilt were zerothere would be no seasons. A larg-er tilt angle, on the other hand,would cause more extreme sea-sonality, with warmer summersand colder winters.
But the situation described aboveis not stable. The eccentricity,obliquity and the date of theperihelion all change slowly withtime. These secular changes in theEarth’s orbit are caused by thegravitational forces of the otherbodies in the solar system. Therelative positions of Jupiter andSaturn, especially, affect the eccen-tricity and the obliquity of theEarth's orbit. The effects on the
Figure 12Comparison of the 10Be concentration measured in an ice core from Dye 3 (Figure7) reflecting the solar activity with a reconstruction of the northern hemispherictemperature. Both records were filtered to only show changes on time scales longerthan 20 years. Note the solar minima (high 10Be concentrations) around 1815 and1890 which coincide with cold periods (Figure 5) and the rapid temperature increaseduring the first half of the 20 th century.
10B
e co
ncen
trat
ion
[10,
000
ato
ms
per
gra
m]
Year1700 18001750 1850 1900 1950 2000
0.4
Tem
per
atur
e ch
ang
e [d
egre
e K
elvi
n]–0.4
–0.2
–0
–0.2
–0.4
–0.6
–0.8
0.6
0.8
1.0
1.2
1.4
Temperature10Be concentration
16SPAT IUM 8
orbital parameters are quasi-peri-odic because they consist of sever-al components.
Eccentricity: This parameterchanges with periodicities of100,000 and 400,000 years. Thiseffect influences the smallest andlargest Sun–Earth distances. Thegreater the eccentricity, the largerthe hemispheric asymmetry. InFigure 13 the eccentricity is plot-ted for the past 400,000 and thecoming 100,000 years. It was at itsmaximum 200,000 years ago,and is now declining towards a400,000-year minimum, whichwill be reached in about 30,000years. The eccentricity is the onlyorbital effect, which affects the an-nual global average of incidentsolar radiation. This global effect,however, is very small (a maximumof 0.6 Wm–2 in the daily mean or2.4 Wm–2 for the solar constant),and cannot therefore be responsi-ble for the observed 100,000-yearperiodicity in many paleoclimaterecords.
Obliquity: Gravitational forcescause the obliquity of the Earth'sorbit to oscillate between 22o and25o, with a periodicity of 41,000years. The larger the obliquity, thegreater the seasonal temperaturevariation at high latitudes.
Precession: The Earth’s axis doesnot point in a fixed direction. Likea spinning top, which starts to gy-rate around the vertical axis if yougive it a nudge, the Earth’s axisspins around, describing a largecircle in the sky. The ‘Polar Star’ to which the axis now points willtherefore be quite distant from
the pole in a few thousand years.The cause of this precession, as it iscalled, is the equatorial bulge of theEarth. This bulge is formed by theEarth's rotation, which changes itsshape from a perfect sphere to aslightly flattened one. The gravita-tional attraction of the Moon, theSun and the planets on the bulgeacts as the “nudge” which causes theEarth to precess like a spinning top.
As a consequence of the preces-sion of the Earth, the perihelionand aphelion do not always occurat the same date each year, but in-stead move slowly through theseasons with a periodicity of about23,000 years. This means that11,500 years from now the perihe-lion will occur on July 4th, and sea-sonal temperature variations in theNorthern Hemisphere will be larg-er than at present (colder winters,warmer summers), because theEarth will then be closest to theSun during the Northern Hemi-sphere summer.
The last two orbital effects do notaffect the total amount of the solarradiation received by the Earth,
they only affect its geographicaldistribution. The variation of theobliquity spreads the radiationsymmetrically polewards, whilethe precession controls its asym-metric distribution over the hemi-spheres.
The �18O data measured in deepsea sediments show a very distinct100,000 year cycle of glacial andinterglacial periods in phase withthe eccentricity (Figure 13). Thisseems to be in conflict with theweakness of the direct forcing.However, the importance of theeccentricity lies not in the changein the amount of the total radia-tion, but in its coupling with the precession. As matter of fact,the larger the eccentricity of the Earth’s orbit, the greater theamplitude of the precessionalvariation. That means that theprecessional amplitudes of theinsolation at any given location on the Earth depend very muchon the instantaneous degree ofeccentricity. Hence, the eccen-tricity period is reflected in theamplitudes of the precessionaleffects (amplitude modulation ofthe precession by the eccentric-ity).
For example in Berne, the differ-ence in insolation between July 4th
and January 4th has changed con-siderably with time. 80,000 yearsago it was 425 W m–2. Then it de-creased by 85 Wm–2 to a mini-mum of 340 Wm–2 65,000 yearsago. After having attained a maxi-mum of 410 Wm–2 about 60,000years ago, it then decreased by 55Wm–2 to reach another minimumof 355 Wm–2 23,000 years ago,
�18O
relative deviation of the 18O16O
ratio
of a sample from the 18O16O
ratio
measured in present oceanwater.

which coincides with the maxi-mum of the last glaciation. Thiswas followed by a rapid increaseof 68 Wm–2 at the transition fromthe last Glacial to the Holocene,11,000 years ago. Since then, theseasonal difference has been de-creasing to its present value ofabout 365 Wm–2. As already dis-cussed, it will rise again to a newmaximum within the next 11,500years. However, for the next50,000 years the seasonal differ-ence will never again rise by morethan 30 Wm–2 due to the declin-ing eccentricity. Also, the twoother orbital forcings reach a min-imum in the next 30,000 years.This means that we must expectonly small changes in the globalclimate due to orbital forcing dur-ing this time.
The uneven distribution of seaand land between the two hemi-spheres is important for the cli-matic response to changes in solarradiation. Therefore, a change inthe hemispheric distribution ofradiation can have a net effect onthe global mean temperature. Pro-cesses, such as the melting and ab-lation of glaciers and the growthof plants, that are more sensitive to summer than to winter tem-peratures can accumulate theseasonal effects over thousandsof years.
It was Milutin Milankovich who,60 years ago, postulated that peri-odic variations in the Earth’s or-bital parameters affect the local in-solation and could be the clue forsome of the most prominent cli-mate changes during the past mil-lion years.
17SPAT IUM 8
Figure 13The analysis of the isotopic 16O/18O ratio in foraminifera (skeleton of plankton)stored in ocean sediments provides a means of reconstructing the sequence of glacialand interglacial periods (Bottom panel). Large values correspond to warm periodsand vice versa. This sequence is dominated by a 100,000-year cycle but also showsshorter periodicities. It can be explained by the effects of the near-by planets on theorbit of the Earth (Milankovich theory). Small deviations from a circular orbit (ec-centricity) (top panel) occur regularly with a dominant 100,000-year cycle. The mid-dle panel shows the calculated changes of the eccentricity for the past 400,000 andthe next 100,000 years. Note that the dramatic climate effects observed on Earth aredue to very small deviations from the average annual forcing. (Lower panel: Credit:SPECMAP curve).
0.06
0.05
0.04
0.03
0.02
0.01
0
0.30
0.19
0.11
0.05
0.01
0
W·m–2
Eccentricity � = 0.5
Eccentricity�
3
2
1
0
–1
–2
�18O
–400 –300 –200Age (millennia)
–100 0 100
Deep sea sediment
Climate Change and Internal Forcing: The Terrestrial Connection
A great variety of internal factorsaffect the Earth’s climate systemand its reaction to the solar input.It is beyond the scope of this shortoverview to mention all of them.Instead, a limited selection of someimportant parameters are present-ed below:
For many years, climatologistshave observed a connection be-tween large explosive volcaniceruptions and short-term climaticchange. For example, one of thecoldest years in the last twocenturies was the year followingthe Tambora volcanic eruption in 1815. Explosive volcanic erup-tions have been shown to have ashort-term cooling effect on theatmosphere if they eject largequantities of sulphur dioxide andfine-grained dust into the strato-sphere forming an opaque com-pound with water vapour. Thecoarse-grained dust returns to the Earth's surface within a fewmonths and hence has little im-pact on the climate.
Continents slowly move over time. Their drift not only changesthe direction of the large oceancurrents but also the position ofAntarctica. This large continentcollects enormous amounts ofwater in form of ice, therebychanging the sea levels on a globalscale. This in itself influences the amount of water transportedby the winds. Higher humidity inthe air masses tends to increasethe cloud cover and the Earth
albedo, thereby contributing to an increased scatter of sunlightback into space and hence caus-ing a reduction of atmospherictemperature.
Greenhouse gases such as CO2
allow the visible sunlight to enter the atmosphere and beabsorbed by the land and sea sur-face, but they hinder the ther-mal (infrared) radiation that isemitted by the Earth's surfacefrom escaping into space. In-creasing density of greenhousegases cause the climate to be-come warmer. The tropical rainforests bind huge amounts ofcarbon to build up their bio-mass. When it is burnt in theprocess of deforestation this car-bon is released in form of CO2, which contributes to thegreenhouse effect (Figure 14). As a result of industrialisation, a large part of the solar energywhich had been accumulated asbiomass over millions of years isnow released within a few cen-turies by combustion of oil, coaland gas.
Epilogue
4.5 billion years ago, when thesolar system was formed, Earthand possibly also Mars were theonly planets with an appropriatedistance to the Sun to become hab-itable. Since then, the Earth's climatehas varied all the time. In spite ofthis dramatic variability at times, italways remained within the bound-aries of habitability and never turnedinto a hot-house like Venus norinto a snowball like Mars. Most ofthis variability is related to themain source of energy, the Sun.Even in ancient times, people in-tuitively recognised the impor-tance of the Sun and worshippedit. Stable and favourable climateconditions brought wealth and pros-perity, unstable and unfavourableconditions such as droughts andfloods caused famines, forced peo-ple to migrate to other places andsometimes even caused wars. Un-derstanding the climate and fore-casting changes was always an im-portant issue so that people whowere able to make reliable pre-dictions were highly respected.Today our knowledge of how theclimate system works is much ad-vanced compared to those times.Our observation systems and com-puting capabilities allow us to col-lect huge amounts of data and tomodel the complex processes inthe climate system. However, weare still far from understanding itin detail. The most promising strat-egy to improve our understandingis to study past and present climatechanges in parallel.Obviously, study-ing past changes is more difficult.
18SPAT IUM 8
“...whereas all experiencesare of the past,all decisionsare about the future... it isthe great task of humanknowledge to bridge thisgap and find those patternsin the past which can beprojected into the future asrealistic images...”
K. Boulding 1973

Fortunately, nature built its ownarchives and kept track of mostchanges. We just have to findthese archives, read and interpretthe stored information and puttogether the individual pieces tohave a complete picture of the
temporal and spatial changes inthe past. Without looking backinto the deep past it will be impos-sible to estimate the anthropogenicand solar contribution to the pres-ent climate change and make reli-able predictions about the future.
Looking back into the past is par-ticularly important in the contextof the controversial debate aboutthe role man plays in the presentglobal warming.
It is only about a century ago thatmankind began to significantly in-teract with nature and perform aglobal experiment by increasingthe atmospheric greenhouse gasconcentrations to levels never ex-perienced in the past half millionyears (Figure 14). In view of our stillvery limited understanding of hownature works and our responsibili-ty for future generations we shouldthink twice before performing suchblind and uncontrolled experi-ments. Many species have beenextinguished before. Up to today,Homo Sapiens is the first with thepotential to cause his own extinc-tion.
Acknowledgments
This article was written in close con-tact with several colleagues.The nu-merous scientific discussions withW. Mende who contributed manyideas were particularly useful andenjoyable. The conversations withH. J. Schlaepfer who handled allthe editorial aspects with great ex-perience and patience were verystimulating. The comments of R.Muscheler and M. Vonmoos andthe careful linguistic corrections byC. Wedema improved the manu-script considerably.
Figure 14 Global CO2 concentration in parts per million (ppm) measured in air bubbles occlud-ed in the Vostok ice core from Antarctica (blue line, credit: Nature 399: 429–436). The red line shows the man made increase in CO2 since 1750 based on an ice core (Siple station, Antarctica, 1750–1953, credit: Nature 315, 45–47) and direct atmos-pheric measurements from Mauna Loa, Hawaii, 1959 to present, credit: http: //cdiac.esd.ornl.gov). As a result of the global warming the glacier in the background(Quelccaya, Andes) no longer exists. (Photo: L. Thompson, Science 203: 1240–43).
CO
2 co
ncen
trat
ion
(pp
m)
Age (millennia)
400 300 200 100 0
400
350
300
250
200
19SPAT IUM 8

The author
beginning of a very fruitful col-laboration with the group of Prof.Woelfli at the nuclear physics de-partment of the ETH in Zürich.Supported by the Swiss NationalScience Foundation, ETH and PSIand following the design of M.Suter and G. Bonani, the Tandemaccelerator of the ETH developedinto one of the world’s leadingAMS facilities. Jürg Beer took ad-vantage of this unique opportuni-ty and started to explore potentialapplications of cosmogenic radio-nuclides (mainly 10Be and 36Cl) invarious natural archives such aspolar ice cores and Chinese loessdeposits.
In 1987, Prof. Imboden set up the department of environmen-tal physics located at the SwissFederal Institute of Environ-mental Science and Technology(EAWAG) in Dübendorf. JürgBeer became the leader of thegroup “Radioactive Tracers” andextended his research activities.Since then, his group concen-trates mainly on the analysis ofthe GRIP ice core from centralGreenland and works on the re-construction of the geomagneticfield, the solar activity and its in-fluence on climate change. From1994 to 1995 he spent a year atthe High Altitude Observatory of the National Centre of Atmos-pheric Research (NCAR) in Boul-der, USA to expand his knowl-edge of solar physics.
Jürg Beer is convinced that thekey to understanding present andfuture climate changes lies in thepast. He often sees himself in the role of a detective seeking fornatural archives to collect allavailable traces of the mechanismsresponsible for environmentalchanges. These traces are oftenpartly erased and written in hiero-glyphs, which can only be de-ciphered by the joint efforts ofscientists from different fields.
Jürg Beer lives with his familynear Zürich. His interest in natureis not restricted to his professionalwork. During his free time he en-joys hiking, biking and watchingthe beauties of nature.
Jürg Beer grew up in Gerlafingenin the Swiss midlands. He finishedschool with a “type A Matura”including Latin and Greek inSolothurn. In spite of this classicaleducation, Jürg Beer was alwaysinterested in natural sciences,mainly in experimental and theo-retical physics. In 1968 he regis-tered at the University of Berne to study physics, mathematics andastronomy. He joined the group ofProf. Oeschger where he becamefamiliar with low level countingtechniques used to study environ-mental processes and reconstructclimate changes in the past. Thedevelopment of a new and ex-tremely sensitive analytical tech-nique in 1977, the Accelerator MassSpectrometry (AMS), opened up alarge variety of new applications.Cosmogenic nuclides could nowbe measured virtually everywherein the environment. This was the