SPAA Precision Ag News magazine Vol 11 Issue 3 Winter 2015
24
Features Redesign for vine uniformity Improved rice productivity PA pastures Sensors for animal nutrition Winter 2015 Volume 11 Issue 3 precision ag news
-
Upload
amanda-woods -
Category
Education
-
view
24 -
download
0
Transcript of SPAA Precision Ag News magazine Vol 11 Issue 3 Winter 2015

FeaturesRedesign for vine uniformityImproved rice productivityPA pasturesSensors for animal nutrition
Winter 2015 Volume 11 Issue 3
precision ag news

SPAA SPAA, a non-profit, independent membership organisation - promoting the development and adoption of precision
technologies in agriculture, viticulture and horticulture
Precision Ag News is published by SPAA - Society of Precision Agriculture Australia Inc.© 2015 ISSN1449-3705SPAA - PO Box 3490 Mildura VIC 3502Ph 0437 422 000 Fax 1300 422 279 Email [email protected] www.spaa.com.auAdvertising contact: Nicole Dimos 0437 422 000 or [email protected] Ag News is edited and produced for SPAA by AgriKnowHow with design by Lightning Designs.
SPAA DISCLAIMERSPAA has prepared this publication, on the basis of information
available at the time of publication without any independent verification. Neither SPAA and its editors nor any contributor to this publication represent that the contents of this publication are accurate or complete; nor do we accept any omissions in
the contents, however they may arise. Readers who act on the information in this publication do so at their risk. The contributors may identify particular types of products. We do not endorse or recommend the products of any manufacturer referred to. Other
products may perform as well or better than those specifically referred to.
SPAA is supported by
KEY FEATURES INCLUDE:
� Digital farm mapping � Paddock record keeping � On-farm grain management � Comprehensive reporting � Receive recommendations from
your connected adviser � APSIM yield simulations � NDVI crop tracking � Drought status monitoring � Seasonal climate and soil moisture assessment � Developed by Grain Growers Limited – your grains industry leader
SUPPORTING YOUR DECISIONS
FREECALL 1800 620 519
APP OUT NOW

Volume 11 Issue 3 3SPAA
Contents
From the presidentAs this issue goes to press, the Civil Aviation Safety Authority (CASA) has announced changes to the regulations around flying UAVs which will come into place later in the year. These look to be positive for agriculture and I encourage you to look at CASA’s website for the details.
Those toying with the idea of using UAVs for agricultural and horticultural applications will find Tony Proffitt’s article in this issue of Precision Ag News a valuable source of information.
A reminder that membership is now due. I believe SPAA membership represents great value for money enabling your organisation to leverage this money by:
• developing a network of farmers using PA to share knowledge through Precision Ag News, e-newsletters, conferences, workshops, twitter and videos;
• keeping you informed about PA developments;
• helping new entrants using PA;
• providing opportunities for linkages between PA providers and farmers;
• influencing general PA research direction with funding bodies;
• collaborating with researchers to ensure the best outcomes for PA research.
In the last issue I reported that the new position of development officer was filled by Cath Loder. Unfortunately, in the last few weeks Cath has had to resign for personal reasons. We wish Cath all the best. SPAA has now implemented other options to temporarily fill the gap and ensure the series of Expos are expertly delivered (see Page 6).
Robin Schaefer President SPAA
www.spaa.com.au
SPAA NEWS
4 SPAA News
6 EXPOs Face to face learning
FEATURES
7 Block uniformity High resolution spatial data is matching grape variety to soil and location to simplify grape management and maximise wine quality due to minimising in block variation.
10 Releasing rice’s potential Farmers and researchers are using PA tools in rice production to unlock yield potential.
12 Sensor collars monitor grazing behaviour Cow based sensors are being used by Tasmanian researchers to understand the balance between pasture and grain intake in dairy cows.
14 Targeted N for pastureNot applying nitrogen to urine patches in intensive dairy pastures is saving about 40kg N/ha/year without reducing pasture production.
17 Appy farmersFarmers are developing their own native and web based applications to provide practical management tools.
20 UAVs for viticultureRemote sensing using aircraft is an established practice in many vineyards but can unmanned aerial vehicles (UAVs) offer better results or just new options?
INNOVATION
12
DEVELOPMENTS AND DEMOS
20
PA IN PRACTICE
7

4 Issue 3 Volume 11 SPAA NEWS
SPAA has been a long standing member of the Ag Excellence Alliance, an organisation that
works with South Australian grain and livestock farmers to improve their profitability and sustainability. Following our successful relationship in partnering with many farming groups across SA, SPAA saw an opportunity to replicate this relationship in Western Australia.
SPAA is thrilled to become the latest member of the Grower Group Alliance (GGA), a non-profit, farmer driven organisation connecting mixed farming grower groups, natural resource management bodies, research organisations and agribusiness in a network across Western Australia. Links with both of these organisations help SPAA support other farming groups and their members with the adoption of PA.
In March, I attended and presented at the Ag Ex Forum and to further develop SPAA’s presence in the west, I hope to attend the WA event later in the year.
In April, SPAA supported Sheep Connect a day of presentations and demonstrations of technology relating to the sheep industry held at two locations in South Australia. The event was well attended and as well as including the ever popular displays of unmanned aerial vehicles (UAVs), it also showcased auto identification and technology
developments in sheep handling, drafting and shearing.
SPAA also attended two events in May which also focused on new technology.
Mobile Tech Australia attracted over 140 delegates including farmers, industry specialists and researchers. They came to hear about the potential agricultural applications of UAVs and robotics. Many of the issues presented have already been covered at SPAA events or communications but I thought the following points may be of interest to SPAA members.
Data ownership - Andrew Cooke from Rezare Systems Limited (NZ) presented information about the Farm Data Code of Practice and Standards that is being implemented in New Zealand. It identifies a number of interesting points in relation to data ownership, rights and security.
Check it out at http://www.farmdatacode.org.nz
Google glass - Jordan Duffy presented on the potential use of wearable technology and the future of having instant access to information. His start-up company Buckham and Duffy is one of a handful of Australian businesses that Google has approved to develop its latest “glass” display technology.
If you have an idea about the use of this technology for agriculture, they
would love to hear from you at www.buckhamduffy.com
New UAV regs - Scott Duffy from CASA presented on UAVs, which generated much discussion. He reported that new regulations relating to the agricultural use of UAVs (or as CASA likes to call them remotely piloted aircraft) were outlined in late May with details due in the near future (see CASA website for details).
PA is a hot topic in Tasmania. Not only are two Tassie based projects reported in this issue of Precision Ag News, SPAA also attended the Precision Agriculture Expo in Deloraine. This event was run by the Tasmanian Agricultural Productivity Group (TAPG) and was the first activity as part of a three year PA adoption push being driven by the agriculture industry in Tasmania.
Many thanks to SPAA member Rueben Wells of Ag Logic who provided SPAA with space on his trade display and assistance with travel.
In June, SPAA ran a viticultural event in the Coonawarra, SA, with support from Natural Resources South East. This workshop looked at the use of vineyard sensing to identify individual vines, to improve irrigation and overall management decisions. Further information from this event will be reported in the November issue of Precision Ag News.
SPAA in action
Photo: Cath LoderNicole Dimos @SPAA_EO

Volume 11 Issue 3 5SPAA NEWS
SponsorshipI am pleased to announce that Grain Growers Ltd continues as a Silver Sponsor and this year will be supporting our membership prize. In recognition of ongoing support, members who renewed their membership before 10th July went into the prize draw to win subscriptions to ProductionWise, SprayWise and PropertyWise. The prize will be drawn at the PA Symposium in September (see Diary Dates). I’m also thrilled to welcome Farmscan Ag as SPAA’s newest corporate partner. Farmscan Ag has developed, acquired and employed industry leading technologies, innovations and innovators to assist farmers to become the world’s most efficient producers. It provides a complete range of electronics to steer, map, monitor and control spraying, spreading, planting and harvesting machinery. SPAA looks forward to seeing its team at its upcoming events.If your business is interested in becoming a sponsor of SPAA, the leading precision agriculture organisation in Australia, please contact me to discuss opportunities. Details are also available on the website.
New committee memberWelcome to Agronomic consultant Andrew Newall, NEWAG Consulting who joined the SPAA committee at the AGM in February.
Andrew is based in Horsham, Victoria and has clients throughout the Wimmera. He also works with growers and groups in Victoria and other regions in relation to implementing controlled traffic farming.
Andrew decided to join the SPAA committee as he wanted to be involved with a group of people focused on PA.
“I really enjoy what PA has to offer growers and advisers, so I was keen to join the committee.”
Andrew saw the introduction of GPS guidance and autosteer as really significant to agriculture. However, he thinks the new technology that is on the horizon will make PA an even bigger focus for the efficient management of farms.
“I have yet to see a yield map that is even right across a paddock; the potential to manage all inputs by production zone is enormous.
“Without using PA tools we would never be able to identify these areas accurately and would continue to use a broad brush approach with inputs.”
In cropping Andrew does not anticipate big yield gains on the horizon through improvements in chemical, fertiliser and plant breeding. He does believe that it will be the further advancement of PA that will provide growers with the next financial gains in cropping and he wants to be a part of this progress.
Andrew can be contacted via his website www.newag.com.au
PROJECTS Controlled traffic farming Surveys are really valuable tools for research planning but most hate completing them. So SPAA was delighted when over 200 broadacre croppers responded to its survey. This gathered their opinions on the adoption and use of controlled traffic farming in the low rainfall zone. The majority of these responses were to the online survey; and SPAA thanks all who participated.
The results have been collated and used to help direct the research and extension activities as part of the GRDC funded project on controlled traffic farming in low rainfall regions. This project is being led by ACTFA with SPAA as a participant.
PA Fact sheets With support from the SA Grains Industry Trust (SAGIT), SPAA will produce six fact sheets highlighting growers’ tried and tested experience in relation to the adoption of PA tools. Before deciding on the topics for these fact sheets, grain growers will be surveyed on their requirements. If you don’t ask, you don’t get – so when you receive this survey online please take a few moments to share your thoughts.
As part of another SAGIT project looking at the H-sensor for weeds, we will be making a YouTube video, which will be released later in the year.
D i a r y D a t e sSPAA – details www.spaa.com.au5 August – PA Expo, Three Springs, WA
14 August – PA Expo, Jerilderie, NSW Riverina
7-8 September, Wagga Wagga, NSW
6 October - PA Expo, Gunnedah, Northern NSW
9 October - PA Expo, Horsham, Victoria
International16-20 November – 6th Asian Conference on Precision Agriculture (ACPA2015) Guangzhou, China. www.acpa2015.org
Photo: Emma Leonard
6 Issue 3 Volume 11 SPAA NEWS
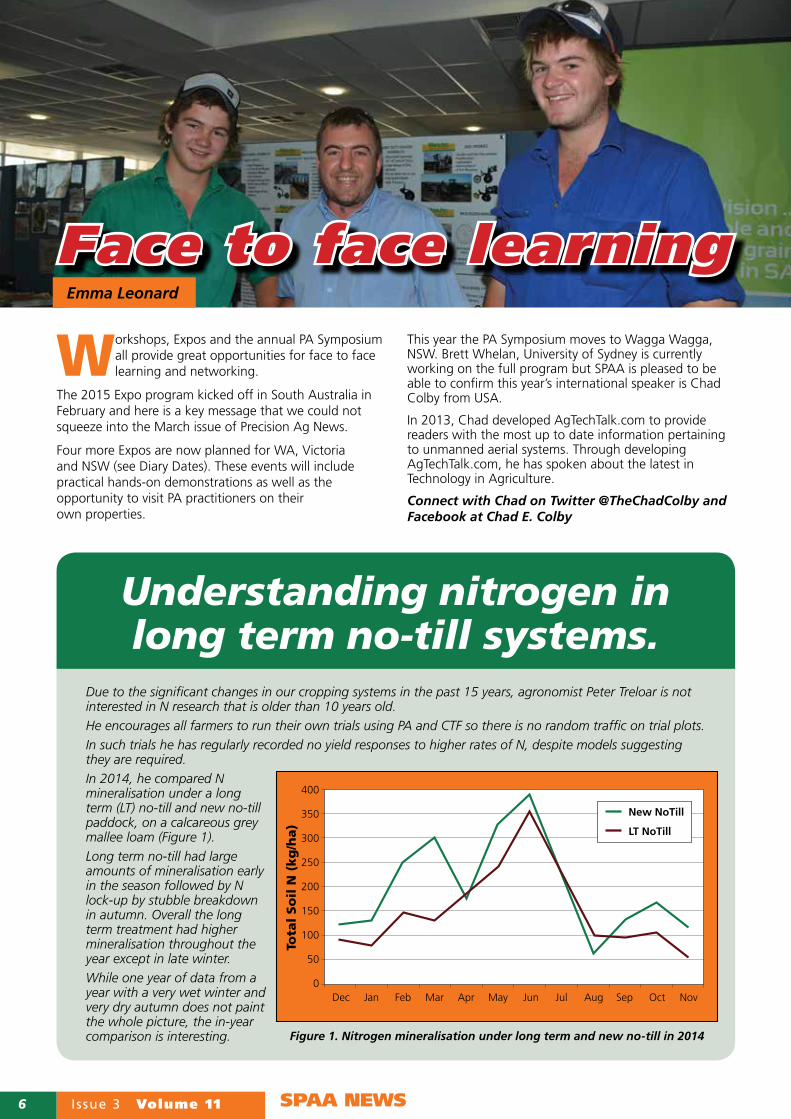
Face to face learning
Workshops, Expos and the annual PA Symposium all provide great opportunities for face to face learning and networking.
The 2015 Expo program kicked off in South Australia in February and here is a key message that we could not squeeze into the March issue of Precision Ag News.
Four more Expos are now planned for WA, Victoria and NSW (see Diary Dates). These events will include practical hands-on demonstrations as well as the opportunity to visit PA practitioners on their own properties.
This year the PA Symposium moves to Wagga Wagga, NSW. Brett Whelan, University of Sydney is currently working on the full program but SPAA is pleased to be able to confirm this year’s international speaker is Chad Colby from USA.
In 2013, Chad developed AgTechTalk.com to provide readers with the most up to date information pertaining to unmanned aerial systems. Through developing AgTechTalk.com, he has spoken about the latest in Technology in Agriculture.
Connect with Chad on Twitter @TheChadColby and Facebook at Chad E. Colby
Understanding nitrogen in long term no-till systems.
Emma Leonard
Due to the significant changes in our cropping systems in the past 15 years, agronomist Peter Treloar is not interested in N research that is older than 10 years old.He encourages all farmers to run their own trials using PA and CTF so there is no random traffic on trial plots.In such trials he has regularly recorded no yield responses to higher rates of N, despite models suggesting they are required. In 2014, he compared N mineralisation under a long term (LT) no-till and new no-till paddock, on a calcareous grey mallee loam (Figure 1). Long term no-till had large amounts of mineralisation early in the season followed by N lock-up by stubble breakdown in autumn. Overall the long term treatment had higher mineralisation throughout the year except in late winter.While one year of data from a year with a very wet winter and very dry autumn does not paint the whole picture, the in-year comparison is interesting. Figure 1. Nitrogen mineralisation under long term and new no-till in 2014
New NoTill
LT NoTill
400
350
300
250
200
150
100
50
0 Dec Jan Feb Mar Apr May Jun Jul Aug Sep Oct Nov
Tota
l So
il N
(kg
/ha)

Volume 11 Issue 3 7PA IN PRACTICE
Great wines start with great grapes and Colin Hinze’s objective as Vineyard
Manager for Taylors is to manage the soil and vineyard planting for quality and productivity.
“We want to produce uniform parcels of grapes of sufficient quantity that the winemakers can manage as a batch; the next parcel may differ but this allows optimum fermentation and management of each parcel by the winemaker,” explained Colin Hinze.
Wine grapes have been grown at the Taylor’s property in the Clare Valley in South Australia for over 40 years. Initially the philosophy was to plant every acre and maximise output and large areas were planted in the mid 1990s. Since 2004, this philosophy has changed and a major vineyard redevelopment program of the low value areas of the estate made way for new plantings. These plantings aim to match grape variety to soil and aspect across this undulating property as well as to
locate headlands on land suitable for equipment and less suited for growing vines.
This has resulted in a patchwork of varieties across the 500 hectares of vineyard. Therefore, Colin and his team of 14 vineyard hands and two viticulturists require excellent vineyard maps and simple management systems to ensure operations are carried out in the right place and at the right time.
The property’s elevation ranges from 330m above sea level to 420m. In the low lying gullies, heavier soils that hold more water are found and these cooler areas typically suit the white varieties, Chardonnay and Riesling, which each covers about 10 per cent of the planted area. The mid-slopes rising to the hilltops are areas of less vigour and greater exposure, with soil depth and water holding capacity reducing with elevation. These higher areas are planted to reds with 25 per cent of the total vineyard planted to Shiraz and a further 35 per cent to
Cabernet Sauvignon. A further 10 per cent is planted to Merlot and there are other small blocks of minor varieties.
Both rootstock and variety are selected to match these changeable soil and topographic conditions. Blocks now range in size from 2.5ha to 10ha.
Data layers for vineyard designJoining Taylors in 2005 as a viticulturist with some experience in and considerable enthusiasm for precision viticulture, Colin has been involved with helping to guide and implement this program of vineyard redesign.
“Given that all trellis and irrigation infrastructure is removed prior to
Block uniformity
Emma Leonard
FARM DETAILS
Location: Auburn, South Australia
Farm size: 780ha, 500ha under grapes
Rainfall: Annual 520mm plus up to 100mm (1ML/ha) irrigation
Soil: Red-brown earth (terra rossa) over soft limestone/bluestone and alluvial clays
Enterprises: Wine grapes – Shiraz, Cabernet Sauvignon, Merlot, Chardonnay, and Riesling, and small blocks of minor varieties
Personnel: Viticultural, administration and workshop team - 20 full time plus seven regular casuals
Yield: Average grape yield 7-8t/ha
Photo: Emma Leonard
High resolution spatial data is matching grape variety to soil and location
to simplify grape management and maximise wine quality due to minimising in block variation.

8 Issue 3 Volume 11 PA IN PRACTICE
grubbing the vines, we have the opportunity to re-design the vineyard layout from the ground up.”
2004 was also the year when Murray River irrigation water was first introduced to the Clare Valley. Amid concerns over importing salt, an extensive program of soil surveying with electromagnetic (EM38) equipment was conducted as part of developing irrigation management plans. The issuing of water licences relied on such plans. EM38 provides information about changes in soil texture (particularly clay content), moisture content and the concentration of salts within the soil profile to a depth of 0.75m or 1.5m depending on how the instrument is used.
Colin was lucky in his initial year because a new grape harvester
equipped with a yield monitor was purchased. The following year a yield monitor was added to the second harvester.
“I would love to say that we have seven to eight years of yield data across the vineyard but the reality is that an around the clock harvest operation cannot be stopped by a failing yield sensor or the need for regular recalibration due to the build-up of residue on the belts.
“We do have multiple years of yield data for the majority of the vineyard and as grapes are not a rotation crop, we can gain meaningful data within a few years of starting collection.”
Colin finds that yield data really helps to reinforce information about the size and location of underperforming areas.
Colin uses remote sensing via light aircraft to collect plant cell density (PCD) data each January at veraison, although in the early days the time between the flight and receiving the processed PCD data was too long. By the time the vigour data was processed and delivered, decisions about harvesting the early varieties had been taken.
Elevation data is also acquired during the EM38 survey and this is used to produce high resolution digital topographic maps.
Regardless of the level of information used to plan a new vineyard, there will always be geographical and business factors which will influence the design. At Taylors, the following criteria are taken into account:
• The need to work within existing physical constraints, including natural waterways, existing roadways, irrigation mainlines and a high pressure gas pipeline.
• Row orientation to be up-and-down the dominant slope, not across.
• Minimal short rows for operational efficiency.
• Headland size and slope to be suitable for machine harvest and multi-row machinery turning.
• Minimum 2.5ha block size to optimise fruit parcels for winery efficiency.
• Minimal soil type variability within each block, aiming for more uniform ripeness and quality of fruit.
Back in 2009, an area of 80ha was chosen for study to examine the potential benefits of using high resolution spatial data to better inform vineyard design. This study was funded by what was the Grape and Wine Research and Development Corporation, now the Australian Grape and Wine Authority (AGWA). The vineyard redesign was initially based on a conventional 75m grid soil survey plus topography data. This system was now compared with a revised design based on the use of these layers of higher resolution data.
Initially, no strong relationship was found between yield and PCD data gathered between 2006 and 2008.
Figure 1. The creation of the topographic wetness index (b) from the elevation model (a), in combination with EM38 (c) provides an understanding of how soil texture and moisture may interact. (d). The black circle indicates a potential location for a separate block in the design.Source: Originally published in the paper by Colin Hinze and Rob Bramley - Below Ground Management for Quality and Productivity - presented in the proceedings of ASVO & PGIBSA 2011.
“A detailed digital elevation model identified preferred row orientation”

Volume 11 Issue 3 9PA IN PRACTICE
However, with further analysis of the three years of PCD data, some recommendations for block separation into different zones across the 80ha area were developed.
The detailed digital elevation model (Figure 1a) helped clearly identify preferred row orientation and where headlands should be located.
Another output from the digital elevation model is the Topographic Wetness Index (TWI), which identifies ‘wetter’ and ‘drier’ areas of land based on the upslope area and relative slope of that land (Figure 1b).
On its own, this image is not easy to interpret, but when combined with the EM38 (Figure 1c) image, the result highlighted a distinct area which had both higher electromagnetic conductivity and higher wetness (Figure 1d).
With further data analysis it has been established that by overlaying and clustering PCD, yield, EM38 data, slope and the TWI, decisions about zoning, block layout, rootstock and variety selection can be greatly assisted.
As well as supporting decisions about what to plant where, these datasets have also helped Colin identify areas to avoid due to frost risk, waterlogging, shallow rocky soils, etc.
PV managementDue to the long term nature of vineyard development, the
measurement of success of this approach is a decade away. However, if the objective of greater uniformity within a block can be achieved, this offers opportunities to improve the quality of wine made and help to better match management to the growth stage of the whole block.
Currently Colin cannot justify the research and establishment time required to adopt in-crop PV management practices. Instead he prefers to focus on establishing blocks that have minimal in-block variation, enabling uniform treatments across the block.
So while irrigation practices and the use of mulch or even ripping may vary between blocks, Colin’s
aim is to have uniform treatments within a block.
He has experimented with differential picking, which research has shown to be profitable where high and lower value wines are both made. In reality there is only a small market for the very high value wines, so Colin aims to provide Taylors’ winemakers with suitably sized parcels of fruit to be treated as a batch. This approach removes the complexities of split picking and allows each batch to be managed appropriately to maximise wine quality.
A new AGWA funded trial being hosted at Taylors is using a harvester mounted fluorescence sensor to measure and map phenolic compounds of grapes. The aim is to determine whether their spatial distribution can be related to changes in wine quality, and whether these compounds are influenced by yield.
More details of this trial work by CSIRO will be reported in future issues of Precision Ag News.
Biog: Colin Hinze has nearly 20 years of professional experience in the wine industry. In 2005 he joined Taylors Wines. In 2014, at the inaugural Clare Valley Winemakers Hall Of Fame Awards, Colin received the Viticulturist of the Year Award for his contribution to the advancement of the region.
Details: Colin Hinze, 0404 819 330, [email protected]
Call toll free: 1800 1 TOPCON
Topcon CropSpec® Crop Canopy Sensors reduce fertilizer costs with on-the-go application based on crop need … or create prescription maps for later use. Reduce input costs while
improving yield. Largest sensor footprint in the industry. See CropSpec sensors at topconpositioning.com
SEE MORE YIELDSCAN MORE FIELD
PA applications Intensive soil testing targeted locations based on spatial knowledgeElectromagnetic soil maps 2004Annual PCD Imaging 2006GPS dGPS sub 50cm used for yield mapping 2006Grape yield monitoring 2006Grape quality mapping on trial 2015
Photo: Emma Leonard

10 Issue 3 Volume 11 PA IN PRACTICE
Riverina farmer Nathan Pate has been using PA on his winter crops since 2000 when he
purchased a header with a yield monitor. Fifteen years later, he is finding that PA tools in relation to soil management are giving him or have the potential to provide the greatest return. While about 70 per cent of the farm has been electromagnetically (EM) mapped and soil sampled by zone, it is pH mapping that Nathan feels has been the most valuable. “We have mapped soil pH and varied lime and/or gypsum across about 70 per cent of the farm and we are noticing benefits in production and in the weed spectrum we are dealing with,” said Nathan.“Next year it will be three years since we started the pH and variable rate lime program so we will go back and remap to see how the readings have changed.”As Nathan varies seed, nitrogen (N) and phosphorus (P) at seeding based on the previous year’s performance, his yield maps are a key tool for establishing rate zones. “Nitrogen is not applied in areas where soils waterlog or around trees, tracks where crops never perform, instead that N is reallocated to higher yielding parts of the paddock.“In-crop N, based on potential yield, is applied via the centre pivot with the unirrigated areas topped up with granular urea at the dryland rate.”Lack of time has prevented Nathan from adopting in-crop vegetation
indexes from crop scanners to develop in-crop variable rate N maps.Phosphorus is applied based on replacement in relation to the previous crop removal with the aim of keeping P levels stable. The rates Nathan uses are five units of P for a tonne of wheat and eight for a tonne of canola.As soils become less acidic, productivity is improving, providing there is enough soil moisture. While soil moisture probes are used in the irrigated ground, Nathan would love to have a map of water holding capacity across the farm.Nathan has been pleased with his adoption of the package of PA, controlled traffic and no-till in his winter crops. However, research is suggesting that it is in his summer rice crops where there is still huge potential for improvement with the support of PA.A trial by Rice Research Australia and Precisionagriculture.com.au, with support from RIRDC, has identified that within paddock yield variation of 2t/ha exists. Much of this relates to difference in cut and fill areas created when levelling paddocks. Fill areas tend to be more productive, while cut areas are lower yielding;
the spatial data from the trials has enabled the size of these low yielding areas to be quantified and the cost of lost production to be calculated. Results showed a difference in profit between the two zones of $450/ha. Increasing N rates by 150kg/ha ($82.50/ha) in the lower performing cut zones increased yield to be similar to or greater than the fill zone, making this management highly profitable.Rice yield is mapped with the same yield monitor as used for the winter crops and elevation data is aquired by the GPS unit when seeding or at harvest.
FARM DETAILS
Location: Tocumwal, New South Wales
Farm size: 1300ha plus about 1000ha contracting
Rainfall: Annual 450mm traditionally winter dominant but becoming more equal; 12 Mega litres/ha (equivalent to 1200mm) for rice
Soil: Heavy clay under rice land to grey loam over clay and sand hills. Generally acid before liming
Enterprises: Approx 200-250ha rice (last year only 130ha), 250ha irrigated winter crop and 800ha dryland winter crop – wheat, barley, canola, clover as manure crop
Personnel: Farming with wife Leah and one full time employee plus additional as required at seeding and harvest
Yield: Average wheat yield 2-3t/ha dryland, 6-10t/ha irrigated
Releasing rice’s potential
Farmers and researchers are using PA tools
in rice production to unlock
yield potential.
Emma Leonard Photo: Emma Leonard
Photo: The Land
Volume 11 Issue 3 11PA IN PRACTICE
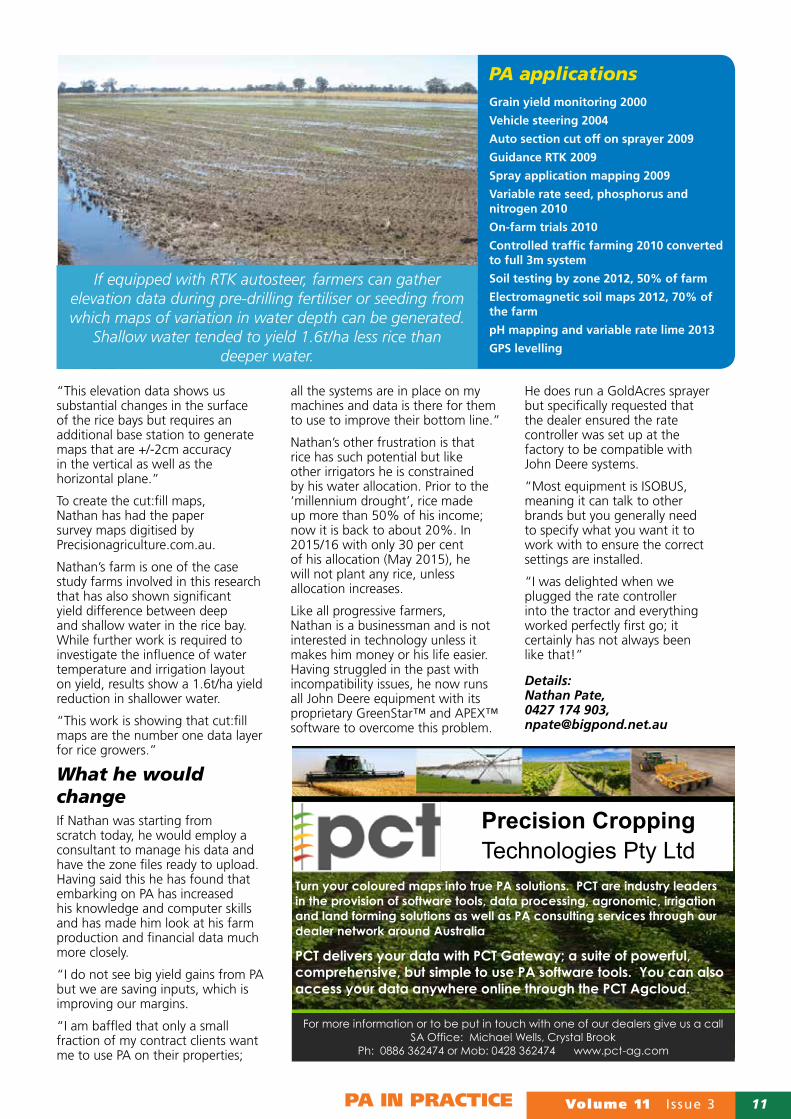
“This elevation data shows us substantial changes in the surface of the rice bays but requires an additional base station to generate maps that are +/-2cm accuracy in the vertical as well as the horizontal plane.”
To create the cut:fill maps, Nathan has had the paper survey maps digitised by Precisionagriculture.com.au.
Nathan’s farm is one of the case study farms involved in this research that has also shown significant yield difference between deep and shallow water in the rice bay. While further work is required to investigate the influence of water temperature and irrigation layout on yield, results show a 1.6t/ha yield reduction in shallower water.
“This work is showing that cut:fill maps are the number one data layer for rice growers.”
What he would changeIf Nathan was starting from scratch today, he would employ a consultant to manage his data and have the zone files ready to upload. Having said this he has found that embarking on PA has increased his knowledge and computer skills and has made him look at his farm production and financial data much more closely.
“I do not see big yield gains from PA but we are saving inputs, which is improving our margins.
“I am baffled that only a small fraction of my contract clients want me to use PA on their properties;
all the systems are in place on my machines and data is there for them to use to improve their bottom line.”
Nathan’s other frustration is that rice has such potential but like other irrigators he is constrained by his water allocation. Prior to the ‘millennium drought’, rice made up more than 50% of his income; now it is back to about 20%. In 2015/16 with only 30 per cent of his allocation (May 2015), he will not plant any rice, unless allocation increases.
Like all progressive farmers, Nathan is a businessman and is not interested in technology unless it makes him money or his life easier. Having struggled in the past with incompatibility issues, he now runs all John Deere equipment with its proprietary GreenStar™ and APEX™ software to overcome this problem.
He does run a GoldAcres sprayer but specifically requested that the dealer ensured the rate controller was set up at the factory to be compatible with John Deere systems.
“Most equipment is ISOBUS, meaning it can talk to other brands but you generally need to specify what you want it to work with to ensure the correct settings are installed.
“I was delighted when we plugged the rate controller into the tractor and everything worked perfectly first go; it certainly has not always been like that!”
Details: Nathan Pate, 0427 174 903, [email protected]
Precision Cropping Technologies Pty Ltd
Turn your coloured maps into true PA solutions. PCT are industry leaders in the provision of software tools, data processing, agronomic, irrigation and land forming solutions as well as PA consulting services through our dealer network around Australia
PCT delivers your data with PCT Gateway; a suite of powerful, comprehensive, but simple to use PA software tools. You can also access your data anywhere online through the PCT Agcloud.
For more information or to be put in touch with one of our dealers give us a call SA Office: Michael Wells, Crystal Brook
Ph: 0886 362474 or Mob: 0428 362474 www.pct-ag.com
If equipped with RTK autosteer, farmers can gather elevation data during pre-drilling fertiliser or seeding from which maps of variation in water depth can be generated.
Shallow water tended to yield 1.6t/ha less rice than deeper water.
PA applications Grain yield monitoring 2000
Vehicle steering 2004
Auto section cut off on sprayer 2009
Guidance RTK 2009
Spray application mapping 2009
Variable rate seed, phosphorus and nitrogen 2010
On-farm trials 2010
Controlled traffic farming 2010 converted to full 3m system
Soil testing by zone 2012, 50% of farm
Electromagnetic soil maps 2012, 70% of the farm
pH mapping and variable rate lime 2013
GPS levelling
12 Issue 3 Volume 11 INNOVATION
Approximately 50 per cent of Australia’s dairy farms base cow nutrition on
grazed pasture and other forages augmented with at least one tonne of grain (concentrate) per lactation. Grain represents a substantial part of the feed costs in these systems so an improved understanding of pasture substitution would benefit feed management, production and ultimately profitability. Pasture intake is known to reduce as the quantity of concentrate feed increases. However, additional factors including pasture availability, nutritive value, stage of lactation and weather can all influence grazing behaviour and the amount of pasture substitution that occurs.Due to the dynamic and complex nature of this system, the substitution rate and marginal milk response for a given situation are usually estimated at the whole of herd.At the Tasmanian Institute of Agriculture, we are using high tech on-animal sensors, developed by CSIRO, to monitor the grazing behaviour of cows under varying management scenarios, including grain feeding rate. By combining the on-animal sensor data with visual observations and using sophisticated modelling, we are starting to unravel the relationship between grazing behaviours, milk production and grain consumption on an individual cow basis.
We are dealing with highly dynamic systems. We know pasture quality varies diurnally as sugars increase and then decline, and that fibre content increases as pasture matures. We also know cows vary in their genetic propensity for milk production and that production is modified by stage in lactation, number of lactations and body condition. Weather conditions can affect pasture and cows, adding another dynamic element.While many cow factors such as current milk production, body condition and stage of lactation are already taken into account when developing grain feeding strategies, how much pasture is or could be eaten cannot be included in the calculation. Many dairies have the capability to feed grain in the dairy on an individual cow basis. However, this is often not done but instead cows are fed as subgroups of the herd. With the ability to individually monitor a cow’s grazing behaviour, this data may be applied to achieve a better utilisation of individual feeding.Using sophisticated on-animal sensors, we were able to capture and record the grazing behaviour of individual cows. With this data we initially hoped to better understand what cows were doing in the paddock and how their intake was modified by feeding grain in the dairy.
MethodsThis study was conducted on 24 Holstein-Friesian cows from the TIA Dairy Research Facility herd. Two groups, each of 12 cows, were established and balanced for means and variances (± SD) of milk production (25.0 ± 3.9 litres per day), days in milk (71± 9 days), body weight (480 ± 34 kg), and age (4.6 ± 1.9 yr). Each group of cows was allocated to one of two concentrate feeding levels, 6.0 or 0.0kg DM/day. Cows received 50% of their concentrate feed allocation of Coprice® Dairy Pellets (CP = 14% of DM; ME = 12 MJ ME/kg of DM) twice daily during milking via automatic feeders. Feeding treatments commenced on 25th of October 2012 and ceased on 31st December 2012.Cows were milked twice daily through a herringbone dairy at approximately 6.30am and 3.30pm. Milk yield for each cow at each milking was recorded automatically. Pastures were predominantly perennial ryegrass and cows were rotationally grazed as one herd, with daily forage allocation allowance of approximately 30kg DM/cow/day of feed on offer above ground. Between 27th November and 13th December, each of the 24 cows was fitted with a collar which consisted of a FleckTM with wireless networking. Each collar had a number of sensors including
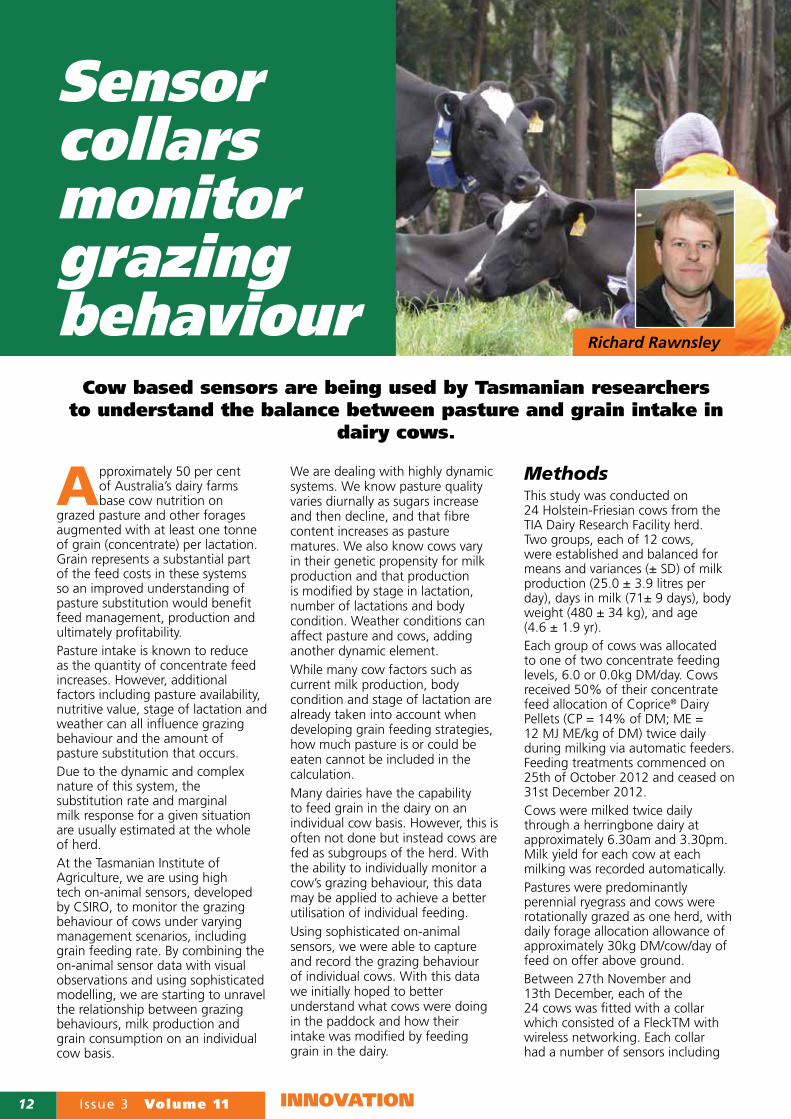
Cow based sensors are being used by Tasmanian researchers to understand the balance between pasture and grain intake in
dairy cows.
Sensor collars monitor grazing behaviour
Richard Rawnsley

Volume 11 Issue 3 13INNOVATION
GPS, 3-axis accelerometer, 3-axis magnetometer and data storage capacity. The collar number, time (seconds), latitude and longitude were collected and saved in the dataset. The dataset generated from the cow collars combined with observed visual behaviours was used to establish algorithms that allow for the generation of a model that can capture the behaviour of the animal (Figures 1 and 2). In this trial, the battery life of the collars was 14 days but new solar powered collars are now being used, providing greater continuity of recording.
ResultsA significant difference in the proportion of time spent grazing between the two grain feeding groups was found. Cows receiving 0kg of concentrate spent more time grazing than cows receiving 6kg. Similarly, cows receiving 6kg of concentrate were found to spend significantly more time ruminating than cows receiving 0kg. Between approximately 7am and 12pm (the period following morning milking), there was significant difference in the proportion of time spent grazing between the two grain feeding groups (Figure 1). Between approximately 7pm and 2am and also between 9am and 12pm, there was a significant difference in the proportion of time spent ruminating between the grain feeding groups (Figure 2).These observations were consistent with results from other studies, where behaviour was measured visually. These results gave us confidence in the collars as systems for collection of this data.Our results suggest that grazing time, as an indicator of pasture substitution, is reduced following the morning milking but not in the period following afternoon milking. As suggested by Angela Sheahan et al. (2013), this indicates different factors may regulate grazing behaviour at differing times of the day. Technology, such as the cow collar sensors deployed in this study, in combination with individual bail feeding technologies and a greater understanding of the factors known to affect hunger and satiety in dairy cows could potentially result in development of new feeding approaches. Such knowledge, data
and technologies will be required to develop and research new approaches to optimise individual bail feeding and economically optimise individual cow performance in pasture based systems.
A $2.2 million project brings together the Tasmanian Institute of Agriculture and CSIRO to extend research conducted during Sense-T’s Stage 1 Beef and Dairy project. Researchers will further enhance their pasture prediction model by using sensors and data to allow farmers to predict and prepare for different scenarios, and will further develop on-animal sensors to better monitor health, grazing and productivity in the dairy and livestock
industries. More information at http://www.sense-t.org.au/projects-and-research/agriculture
Biog: This work was undertaken by Richard Rawnsley and colleagues at CSIRO as part of the Sense-T dairy and beef optimisation project. Sense-T is a partnership program between the University of Tasmania, CSIRO (through the Australian Centre for Broadband Innovation), and the Tasmanian Government. It is also funded by the Australian Government.
Details: Richard Rawnsley, Tasmanian Institute of Agriculture, 03 6430 4504, [email protected]
Pro
po
rtio
n o
f ti
me s
pen
t g
razi
ng
Hour of day
0.4
0.3
0.2
0.1
0.0
0 5 10 15 20
Pro
po
rtio
n o
f ti
me s
pen
t ru
min
ati
ng
Hour of day
0.4
0.3
0.2
0.1
0.0
0 5 10 15 20
Pro
po
rtio
n o
f ti
me s
pen
t g
razi
ng
Hour of day
0.4
0.3
0.2
0.1
0.0
0 5 10 15 20
Pro
po
rtio
n o
f ti
me s
pen
t ru
min
ati
ng
Hour of day
0.4
0.3
0.2
0.1
0.0
0 5 10 15 20
Figure 1. Proportion of time spent grazing by the two grain groups (solid line = 6kg, dashed line= zero) over a 24 hour period. Shaded area represents the 95% confidence interval for each of the two grazing groups. Heavy line along axis shows the day where the grazing differs significantly (P < 0.05) between the two grain groups.
Figure 2. Proportion of time spent ruminating by the two grain groups (solid line = 6kg, dashed line= zero) over a 24 hour period. Shaded area represents the 95% confidence interval for each of the two grazing groups. Heavy line along axis shows the time of day where the grazing differs significantly (P < 0.05) between the two grain groups.

14 Issue 3 Volume 11 INNOVATION
A precision tool tested in Tasmania and Western Australia has achieved a
30 per cent reduction in applied nitrogen (N) without a reduction in pasture production. This is not only economically significant but also helps reduce greenhouse gas emissions.
Intensive pasture based dairy production systems are a major user of fertiliser N. For example, in 2012/13 Tasmanian dairy farms used an average of 140kg N/ha per farm. The average figure across Australian and New Zealand farms is 240kg N/ha.
Yet dairy cows excrete between 75 and 80 per cent of the N they consume, primarily in their urine. These urine patches, which are estimated in intensively managed dairy pastures to cover about 25 per cent of the paddock, have N concentrations equivalent to 1000kg N/ha.
Approximately 10% of all greenhouse gas emissions from Tasmanian pasture-based dairy farms are nitrous oxide (N2O) emissions associated with urine and dung deposition. While no figures exist for WA systems, similar emissions are expected.
Applying N fertiliser to pasture not only increases the levels of N present but increases the risk of N loss as nitrous oxide (N2O).
New Zealand dairy farmer and SPAA member Craige Mackenzie recognised this waste of nitrogen and environmental problem and in response developed the Smart-N system.
Smart-N systemSmart-N uses WeedSeeker® technology to strategically apply liquid nitrogen (N) to intensively grazed pastures. The set-up is the same as for weeds with one sensor per spray nozzle. However,
in Smart-N mode, the sensors are reverse engineered; so, when a high N/high biomass patch of pasture is detected the spray nozzle is turned off rather than on as for weed control.
The Smart-N technology works by detecting differences in normalised difference vegetation index (NDVI) between high N (urine and faeces patches) and low N areas. When the NDVI reading is above a predetermined calibrated NDVI level, the sensor switches off the corresponding spray nozzle to prevent the application of fertiliser N to these N rich zones.
With funding from the Australian Government Department of Agriculture, Fisheries and Forestry as part of its Carbon Farming Futures - Action on the Ground program a project was designed to trial and demonstrate the efficacy of Smart-N technology in Australian intensive dairy production systems.
Targeted N for pasture Not applying nitrogen to urine patches in intensive dairy
pastures is saving about 40kg N/ha/year without reducing pasture production.
James Hills and Sam Taylor Photo: Craige Mackenzie
Volume 11 Issue 3 15INNOVATION
The specific objectives of the project were:
1. to quantify and demonstrate the Smart-N technology in a commercial setting;
2. to assess reductions in N fertiliser through adoption of Smart-N technology across different agro climatic regions of Australia;
3. determine if adoption of this technology has any impact on pasture productivity; and
4. quantify the reduction in nitrous oxide emissions arising from changes in N fertiliser management with adoption of Smart-N technology.
Trial workInitially the trial looked at calibration of the Smart-N system. It established that urine patches were reliably detected by the system seven days post grazing, indicating a N response.
Small scale calibration and validation trials were executed by applying urine in strips on a paddock that had been cut for silage and not
grazed, to ensure it was free of urine patches. The 2m boom was set at 750mm above ground level and was driven over the treated and untreated strips every two to three days using varying sensitivity settings.
These trials were to establish when and what was registering so a better indication of the appropriate timing of nitrogen application after grazing was gained.
Over a three year period Smart-N trials were run on seven farms in WA and Tasmania and at the Tasmanian Institute of Agriculture Dairy Research facility (TDRF).
At each trial site, liquid urea-ammonium nitrate (UAN - containing 42.5% N w/v) was applied with (SN) or without (Control) the Smart-N technology. In the second year an untreated control strip (untreated) was also included for some of the sites. In the final year at TDRF additional plots an equivalent amount of N as used on the control plots was applied as granular urea (urea- 46% N).
The number of N applications in a year depended on the season
and availability of irrigation water; they ranged between one and six applications at each site. The UAN was generally applied 10 to15 days post grazing and the following grazing was not less than 10 days post application; this varied depending on the length of the grazing rotation.
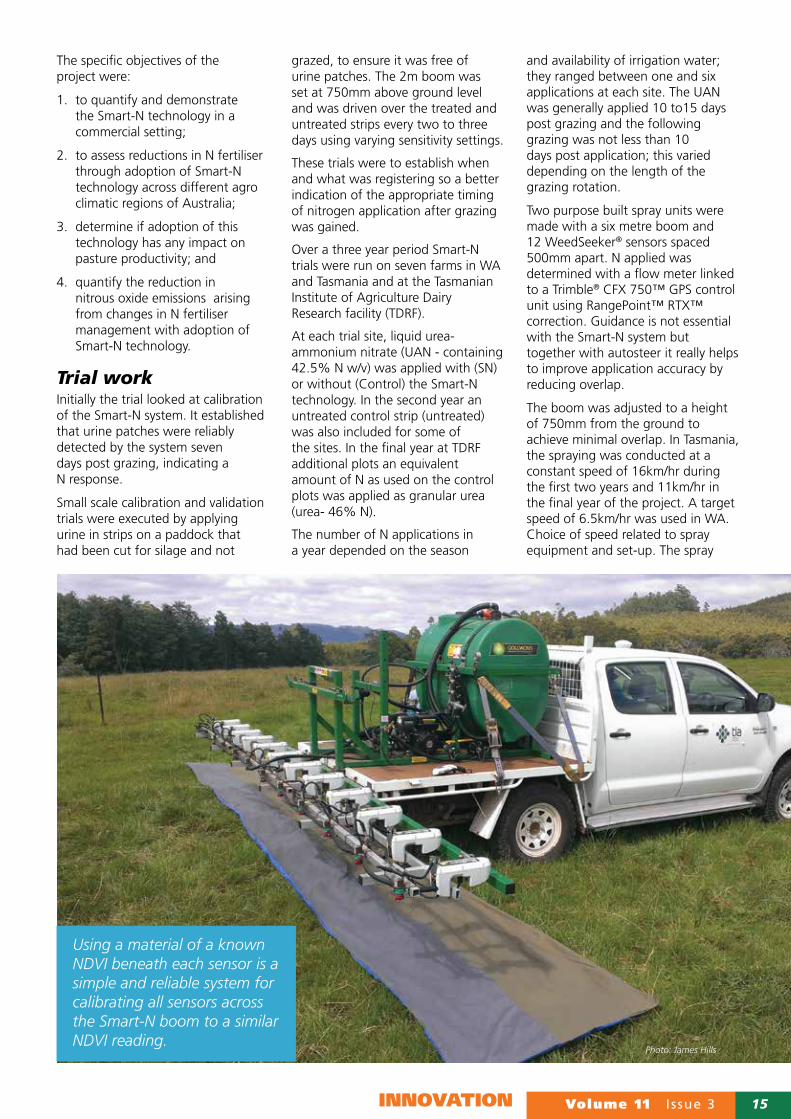
Two purpose built spray units were made with a six metre boom and 12 WeedSeeker® sensors spaced 500mm apart. N applied was determined with a flow meter linked to a Trimble® CFX 750™ GPS control unit using RangePoint™ RTX™ correction. Guidance is not essential with the Smart-N system but together with autosteer it really helps to improve application accuracy by reducing overlap.
The boom was adjusted to a height of 750mm from the ground to achieve minimal overlap. In Tasmania, the spraying was conducted at a constant speed of 16km/hr during the first two years and 11km/hr in the final year of the project. A target speed of 6.5km/hr was used in WA. Choice of speed related to spray equipment and set-up. The spray
Using a material of a known NDVI beneath each sensor is a simple and reliable system for calibrating all sensors across the Smart-N boom to a similar NDVI reading. Photo: James Hills

16 Issue 3 Volume 11 INNOVATION
nozzles on both booms were set back 250mm from the sensor.
The aim was to deliver 100L/ha of solution at the given vehicle speed. Initially N was applied using flat fan nozzles that produced fine droplets but due to concerns about drift, these were replaced with nozzles that produced very coarse droplets.
Pasture growth was measured at each site using a calibrated rising plate meter.
CalibrationFor the trial the sensors were calibrated at each site and every application. For calibration a hand-held GreenSeeker® was used to determine the NDVI readings for background pasture and urine patches. GreenSeeker® is an active optical sensor that provides an NDVI value based on the amount of red and near infra-red light emitted and reflected back to the sensor. The boom was calibrated using a material with a known NDVI reading placed beneath all the sensors. The sensor sensitivity setting was adjusted to an NDVI just below the lowest NDVI reading detected from a urine patch.
Correct calibration is essential for optimising N application. Applying the previous calibration method, it was found that detection and avoidance of N applications to the patches is achieved without compromising pasture DM yields when compared with blanket applications of N.
The method developed in the trial is a simple and reliable system for use on farm.
However, one of the challenges is the average NDVI readings of both background and urine patches can vary within and between paddocks at some sites, requiring the calibration setting to be adjusted during application. This is particularly the case where there are large differences in topography or soil types within and between paddocks.
Development of an automated calibration system that adjusts in real time would be useful for commercial application.
Results and issuesIn the Tasmanian trials the mean N rate for the control across all sites was 21.4kg N/ha compared to the Smart-N treatments which received 13.4kg N/ha, a saving of 8kg N/ha per application. A smaller (5.6kg N/ha) but also significant reduction in N was recorded across the WA trials where 36.7kg N/ha was applied on the control and 31.1kg N/ha on the Smart-N plots.
Across the trials in both regions there was no significant change in pasture growth under the lower N treatments applied with the Smart-N system.
It is estimated for the average Tasmanian farm that the Smart-N technology has the potential to
save approximately 40kg N/ha per annum without compromising pasture growth rates. This equates to a potential greenhouse gas abatement of approximately 50t CO2-e. The saving could be up to 50kg N/ha per annum for WA dairy farms.
Using the Smart-N technology with wet pastures was highlighted as a problem as moisture affects the NDVI readings. In addition, the application of UAN to wet pasture can result in leaf scorch, although in the trial the effect was short lived and pasture recovered quickly.
In the final year of testing at TDRF, pasture growth rates for the untreated plots were similar to the plots where N was applied. This indicated that either the background level of fertility for this site was already high, or the application rate of 20kg N/ha for each grazing cycle was too low to initiate a significant enough response. The same was not seen in the commercial paddocks. This response and the issues relating to low and high rates of UAN delivered via Smart-N require further investigation.
Biog. These trials were led by Sam Taylor, Dairy Australia Consultant, Western Australia and Dr James Hills, Research Fellow at the Tasmanian Institute of Agriculture.
Details: Sam Taylor, 0429 332 593, [email protected]
James Hills, Research Fellow, 03 6430 4937, [email protected]
“Correct calibration is essential for optimising N application”
Volume 11 Issue 3 17DEVELOPMENTS & DEMOS
Farmers are developing their own native and web based applications to provide practical management tools. Here are a few examples that have been
developed primarily for the grains industry but two have the potential for use in other production sectors.
Name - AgriTrack™Developed by - Andrew Humphries, New Zealand farmer and contract worker. Now general manager of AgriTrack™.
Reason for developingWhen driving tractors on farms in Western Australia, Andrew Humphries recognised the potential for a system that would enable all drivers and managers to see what others were doing or had done. The driver of the seeder can see what has and has not been sprayed, the manager can see at what speed the sprayer or other vehicles are being operated and the workers can see if the manager is in the paddock, office or in town collecting parts or having a coffee!
“When you are contracting it can be hard to know the layout of new paddocks, location of obstacles and what is happening where; I wanted to develop a tool to make life easier for all working on the farm,” said Andrew.
He knew such a system had to be simple to load and use, able to run on tablets and smart phones and cost effective.
Platform – www.agritrack.com.au - AgriTrack is currently developed to run on the Android platform with plans to launch onto iOS in the future.
Cost – AgriTrack costs approx. $2200 per vehicle (including all hardware, e.g. tablet). A sliding price exists depending on the number of vehicles. There is an annual subscription of $350/device, depending on how many vehicles are monitored.
What it doesAgriTrack provides a comprehensive live tracking solution. Using the GPS software in a tablet or smart phone, AgriTrack follows the location, status, speed and productivity of your farm vehicle fleet via live information from in-vehicle software.
Multiple users can view and receive up-to-date reporting wherever they are, maximising workflow through minimised downtime, and eliminating miscommunication, unnecessary operations or the use of drums across the paddock to mark a stop, start or miss.
Other features are that it is quick to install, is vehicle type independent and runs on the 3G network with specialised hardware to allow for the connection of an external antenna. It also features historical speed tracking, easy area measurement, and syncable notepad to share notes between vehicles.
Appy farmersFarmers are developing their own native and web based
applications to provide practical management tools.
Emma Leonard Photo: Emma Leonard
18 Issue 3 Volume 11 DEVELOPMENTS & DEMOS
Name - In Season Nitrogen CalculatorDeveloped by - David Cox, grain and beef farmer, Esperance WA
Reason for developingMost of Australia’s winter cropping regions have variable spring rainfall, which makes accurate yield prediction difficult. David Cox found that as most current nitrogen (N) tools require an accurate yield prediction they were not working on his farm.
In the search to resolve this problem David developed a calculator appropriate to Australian cropping conditions that uses readings from an active optical biomass sensor across the crop and N-rich strips. His objective was to establish a system to ensure that any N deficiency during the winter, the period when yield potential is established, is eliminated. His calculator does not aim to predict crop yield but to produce N rates that remove N as a limiting factor.
“I have been using this calculator on my farm for nearly 10 years and it has consistently resulted in yields and proteins meeting target,” said David.
Platform - web based - www.ncalc.com.au
Cost - contact David Cox via the website. A per N calculation charge ($50 plus GST) is applied so if you do a calculation for each of 10 paddocks, there would be 10 charges.
What it doesThe aim of the “In Season Nitrogen Calculator” is to determine the exact amount of N required to maximise the yield potential of the paddock, where N is a limiting factor.
The system is based around ‘asking the plant’ if it can respond to extra N. This is done by comparing normalised difference vegetation index (NDVI) readings gathered by the GreenSeeker® from an N-rich strip and crop under the farmer practice.
The calculations will target grain protein levels of 10.5% in wheat and barley. However, rates to produce 11.5% or 12.5% protein in wheat can be produced if required.
The calculator is being used successfully on wheat and barley and canola grown in rainfall ranging from 200mm to 500mm.The inputs required for the In Season Nitrogen Calculator are:• crop type; accurate seeding date. If crop was dry sown,
then use date of germinating rain; sensing date; NDVI from N-rich strip; and NDVI from farmer practice – this can be by paddock or zone.
A post harvest grain protein test can be used to ground truth N management.
The In Season N Calculator can be used before any in-season application of N:• in barley before 55 days from planting (recommended)• in wheat from 20 to 70 days from planting• in canola when NDVI is between 0.5 and 0.7.The calculator cannot be used after a crop has been grazed or if the crop has suffered from water logging.
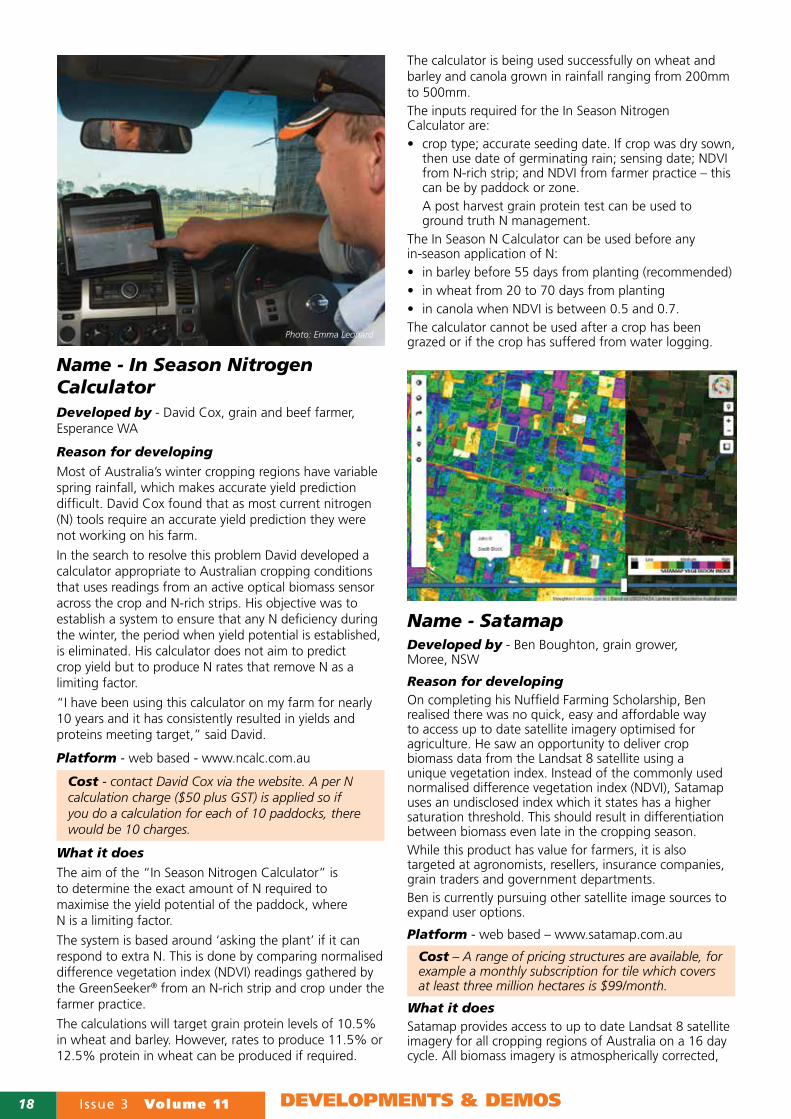
Name - SatamapDeveloped by - Ben Boughton, grain grower, Moree, NSW
Reason for developingOn completing his Nuffield Farming Scholarship, Ben realised there was no quick, easy and affordable way to access up to date satellite imagery optimised for agriculture. He saw an opportunity to deliver crop biomass data from the Landsat 8 satellite using a unique vegetation index. Instead of the commonly used normalised difference vegetation index (NDVI), Satamap uses an undisclosed index which it states has a higher saturation threshold. This should result in differentiation between biomass even late in the cropping season. While this product has value for farmers, it is also targeted at agronomists, resellers, insurance companies, grain traders and government departments.Ben is currently pursuing other satellite image sources to expand user options.
Platform - web based – www.satamap.com.au
Cost – A range of pricing structures are available, for example a monthly subscription for tile which covers at least three million hectares is $99/month.
What it doesSatamap provides access to up to date Landsat 8 satellite imagery for all cropping regions of Australia on a 16 day cycle. All biomass imagery is atmospherically corrected,
Photo: Emma Leonard

Volume 11 Issue 3 19DEVELOPMENTS & DEMOS
archived and available for comparison at any time and major towns, roads and waterways rendered over imagery for easy location. The user is not required to draw in any paddock boundaries and there is a custom marker feature for quick access to areas of interest.
The web based map builder makes it easy to analyse maps in a familiar interface and on a GPS enabled device Satamap shows your position on the image.
Compare any two selected images with a simple slider. The colour scale remains the same for all dates for direct comparison.
Satamap’s unique colour ramp clearly shows in-crop variability from emerging dryland crops to high biomass irrigated crops in the same image. For colour images each pixel represents a 15x15m area and Satamap Vegetation Index is 30x30m.
All data in Satamap is able to be exported in common GIS file formats. So Satamap biomass data can be, for example, used to develop prescription maps in SMS Advanced or made available for offline use on an iPad in PDFMaps.
There is a measurement tool for measuring areas and distances.
Satamap aims to keep things simple, with a core set of features that are a pleasure to use.
Name - iPaddockYieldDeveloped by – Mic Fels, grain farmer, Esperance WA
Reason for developingAn understanding of potential yield is fundamental to all Mic Fels fertiliser, pesticide and marketing decisions. iPaddockYield started life as an Excel spread sheet that used a modified French Schulz yield prediction model. Over a period of time Mic developed his own novel method for forecasting yield and soil water availability that constantly recalibrates itself from the individual’s own historical rainfall and yield records. Mic has found this to be much more accurate as it builds in the unique local impacts of water logging, drought, rainfall frequency and even the farmer’s own systems, all factors that are overlooked by an annual French Schulz linear prediction.
“From my experience an app needs to do one job and do that really well,” said Mic.
“I would love iPaddockYield to be able to log multiple rain gauges and work as reliably for broadleaf crops as it does in wheat and barley, but all these features take money to develop and can only be made available as uptake of this version of the app occurs.”
In 2012, iPaddockYield won Mic the GRDC Grain Inventor’s Award and he has also produced a comprehensive spray management and record keeping app, ‘iPaddockSpray’.
Platform – iOS Apple, iPad or iPhone
Cost - $69.99 from the App Store
What it doesiPaddockYield is a decision making tool designed to provide daily updated forecasts of realistic yield potential and soil water during the growing season. Incorporating a comprehensive rainfall recorder, it generates a farm specific yield forecast using your farm’s historical rainfall and yield records, plus rainfall during the current season.
This tool supports decisions relating to in season fertiliser, pesticides and grain marketing decisions early in the season.
Download and go, with minimal set-up time – no paddock inspections or testing required. This app has full functionality available at all times, regardless of mobile coverage.
Note – WA grain growers may also be interested in the ‘Wheat yield constraint calculator’ - www.agric.wa.gov.au
Photo: Emma Leonardw w w . f a r m s c a n a g . c o m
Start at any level then add components to control your sprayer, air seeder, spreader or harvesting machinery all at minimal cost and all compatible in one system.
AGGUIDE
Providing INNOVATION in agriculture for over 37 years!
JACKALA Compact & robust monitor that adapts onto almost any machine. A Multifunctional monitor, capable of many simultaneous tasks! e.g Speed & Area, Tacho & More
7000The all-new 7000 series of controllers from Farmscan Ag allows for complete control of your spraying, spreading and seeding application rates! UPGRADE TODAY
CALL OR VISIT US ONLINE NOW Farmscan Ag Pty Ltd, 11/493 South Street, Toowoomba QLD 4350, ABN 92 143 803 070
Tel 1800 327 672 Fax 07 4602 4151 Email [email protected] Website www.farmscan.ag
CALL OR VISIT US ONLINE NOW Farmscan Ag Pty Ltd, 11/493 South Street, Toowoomba QLD 4350, ABN 92 143 803 070
WIRELESS BLOCKAGE & FLOW MONITOR
ow
ned & operated
Proudly Australian

20 Issue 3 Volume 11 DEVELOPMENTS & DEMOS
Australian vineyards have effectively used remotely sensed reflectance data to
better manage operations during the growing season and at harvest since the early 2000s. The data is generally acquired by light aircraft and plant cell density (PCD) has been adopted as the preferred vegetation index to use. Other platforms for acquiring remotely sensed data include satellites and unmanned aerial vehicles (UAVs).
While the Civil Aviation Safety Authority (CASA) continues to review the regulation of UAVs, also called remotely piloted aircraft (RPA), the interest in their use by the agricultural/horticultural industries continues to escalate.
So what are the potential uses for UAVs in viticulture?
Is there value in using UAVs to perform tasks that viticulturists can already do cost-effectively with existing technologies? Do UAVs supersede other platforms in acquiring imagery?
Remote sensingHigh-quality remote sensing for agricultural/viticultural applications requires the use of narrow-band, multispectral camera systems, which can detect light at the blue, green, red and near infrared (NIR) wavelengths. The majority of UAVs do not carry such camera systems; instead they carry off-the-shelf digital cameras which may not be able to acquire all the required wavebands. In addition, the wavebands are generally not well-defined and data contamination can occur. Vegetation indices such as PCD and normalised
difference vegetation index (NDVI) require reflectance data at both the red and NIR wavelengths.
UAVs have the ability to carry out functions in near real-time or on-demand. This is attractive, and potentially cost-effective, where there is a need for tasks to be performed throughout the growing season and in exploiting limited windows of opportunity (e.g. cloud cover). UAVs also have the ability to acquire data at ultra-high resolution (see Key differences).
Other tasksTasks performed by UAVs are not limited to the acquisition of imagery. Australian researchers have used high resolution imagery, combined with terrain models, to create 3D imagery of cereal crops to assess growth and drainage for irrigation planning. Three-dimensional lasers have been attached to UAVs by Spanish researchers to assess the leaf area index of crops.
In Western Australia, ultra-high resolution imagery is being investigated by researchers at the Centre for Crop and Disease Management for early disease detection. Researchers at the Plant Biosecurity Cooperative Research Centre have teamed with Kansas
SummaryUAVs may offer new opportunities to viticulture and other agricultural industries and should be viewed as having the potential to fill an unoccupied niche that is complementary to, rather than a substitute for, data that is currently acquired by satellites and light aircraft.
A number of other applications apart from remote sensing are potentially available. Farmers need to identify what those applications are in order for research to be carried out to determine whether UAVs are capable of performing those tasks.
Remote sensing using aircraft is an established practice in many vineyards but can unmanned aerial vehicles (UAVs) offer better
results or just new options?
UAVs for viticultureTony Proffitt
Photo: Tony Proffitt

Volume 11 Issue 3 21DEVELOPMENTS & DEMOS
State University to investigate UAVs for early detection of Russian Wheat Aphid and Stripe Rust in wheat. A company in Queensland (Aerobugs) is using the UAV platform to distribute predatory insects into horticultural crops.
In the USA, thermal infrared sensors are currently being trialled on UAVs to monitor canopy temperature as a means of detecting plant water stress and soil temperature as a means of detecting irrigation leaks.
In the Netherlands, UAVs in the shape of birds of prey are being trialled for bird management tasks. Closer to home, a WA farmer has fitted air-horns to a UAV as a means of managing sheep, while a grape grower has fitted a high definition sports video camera to a UAV in order to monitor the movement of vehicles, staff and stock within the vineyard area.
In Japan, over one million hectares of farmland, mainly rice, are annually sprayed using the Yamaha Rmax UAV (see UAV 101). This larger UAV carries 16 litres of liquid and dispenses it at 2L per minute. This system is now being tested in difficult–to-access vineyards in California.
Key differencesThere are key differences between the three remote sensing platforms
– spatial resolution, flight frequency and cost/time input.
Satellites operate hundreds of kilometres above the Earth’s surface compared to light aircraft that operate at altitudes between 600 and 1700m. UAVs can operate within a few metres of the canopy and upwards to the regulation-imposed altitude of 120m.
Spatial resolution (i.e. pixel size) is determined by the camera system being used (megapixel capability) and the distance between the camera and target.
Most satellites produce pixels of 15 by 15m or 30m2, although the WorldView-3 satellite has a pixel size of 30cm. Light aircraft typically acquire imagery with pixels between 0.1 to 0.5m. For vineyard applications, PCD is generally supplied with an on-ground resolution of 0.5m. Depending on flying height, UAVs are capable of acquiring imagery at an ultra-high resolution of 0.01m/pixel.
When comparing Figure 1a with Figure 1b, there are similarities in the spatial distribution of PCD values along the rows. The main difference between the two figures is that the higher resolution in Figure 1b makes it possible to detect differences in PCD value perpendicular to the vine row, with the centre of the vine canopy generally more vigorous than
the outer edges of the canopy. At this spatial resolution it is possible to provide a better definition of ‘vine only pixels’ than at coarser resolutions. This is demonstrated in Figure 2.
Figure 2. UAV PCD ‘vine only pixels’ (shown as a red to blue scale) superimposed on light aircraft PCD ‘vine only pixels’ (shown as a greyscale).
However, the question remains; is this greater definition of canopy size/health and pixel definition useful and is it cost-effective? It is worth noting that it is possible to acquire imagery at 0.10m resolution by light aircraft.
The frequency of satellites passing overhead is generally every 16 days; but image loss due to cloud cover can extend this, especially during winter months in the southern states.
Flights by light aircraft can be arranged at any time but cloud cover is an issue that needs to be considered. In vineyards, data is generally acquired once per season (at veraison) and on the nominated day, the flight will occur close to solar noon to minimise the effect of shadows. Generally, the data is made available to the grower within a week.
The flight duration of a small fixed-wing UAV carrying a multispectral camera ranges from 20-90 minutes depending on weather conditions and the battery configuration. For a rotary-wing model, the flight duration is about 10-15 minutes.
Being operated from the ground at low altitudes, UAV flights are
Figure 1: Plant Cell Density (PCD) ‘vine only pixels’ for a section of vineyard, where values are shown grading from blue (highest values) to red (lowest values). Reflectance data was acquired by a multispectral camera at (a) 0.5m spatial resolution using a light aircraft and (b) 0.11m spatial resolution using a fixed-wing UAV.
(b)(a)
“Is greater definition of canopy size/health and pixel definition useful and cost-effective?”

22 Issue 3 Volume 11 DEVELOPMENTS & DEMOS
not affected by cloud. However, the influences of shadow, sun angle and wind speed (the recommended maximum wind speed is 40km/hr) all need to be considered. When piloting a UAV the operator is required to keep the vehicle in sight and away from airports, people, buildings and power lines. A full set of operating rules is available from CASA (www.casa.gov.au).
While higher resolution data may seem desirable, it may not be necessary for the application you wish to use the data for. The greater the resolution, the smaller the area that can be captured in one flight and the greater the amount of data that has to be processed. This will be reflected in the price to purchase imagery. At present it is hard to envisage the UAV platform being a cost-effective replacement for light aircraft if imagery is only required on an annual (or less frequent) basis (e.g. for precision viticulture applications).
Guidance and navigationCommercially-used UAVs require on-board guidance, navigation and computing equipment. There are three forms of flight control that an operator can exert:
• Ground-control (remote piloting). This requires constant radio-controlled input from the operator (i.e. similar to models available for the hobbyist to purchase).
• Semi-autonomous. This requires ground input during critical parts of the flight such as take-off and landing. Once airborne, an autopilot function can be engaged and the aircraft will follow a set of pre-programmed waypoints. The operator can assume control at any time.
• Fully-autonomous. This capability allows the aircraft to complete all operations without an operator doing anything more than monitoring its system. For autonomous piloting, a UAV must be fitted with devices that assist with altitude control and navigation. The latter is achieved by using a global positioning system (GPS).
Fixed wingThese are generally used to acquire imagery across areas of up to 200ha in a single flight (depending on flight altitude and payload) and have a range of approximately 2km (with line-of sight restrictions). Typical battery life allows for flights of up to 90 minutes.They can either be launched by hand or from a catapult and can fly at relatively high cruising speeds (75km/hr). A relatively flat piece of land (about 20 x 50m in size) is required for landing.
Rotary wingThere are a range of configurations with main and tail rotors (conventional helicopters), coaxial rotors, tandem rotors and multi-rotors. Most have vertical take-off and landing (VTOL) capability and have the advantage of being able to hover above the target. They are generally used to acquire imagery from small areas (<100ha) and have a practical range of about 0.5km.Typical battery life allows for flights of up to 15 minutes.
UAVs generally fall into two categories and each of these can have
one or more forms of guidance and navigation system. UAVs are available
as either complete, commercially available units, or can be assembled
from off-the-shelf parts.
Photo: Emma Leonard
Photo: Emma Leonard
Photo: Emma Leonard
Photo: Emma Leonard
Biog. Tony Proffitt has worked as a viticultural consultant and educator in the Australian wine industry since 1995. He currently divides his time between AHA Viticulture/Precision Viticulture Australia and lecturing at Curtin University.
Details: Tony Proffitt, 0408 479478, [email protected]

Be smart about your seeding
When your seeding window opens, you’ve got one chance to get it right. That’s why we provide the most advanced seeding and guidance technology to meet your needs.
Our 1910 Commodity Air Cart carts come in 10 confi gurations, including liquid fertiliser options, with accurate metering and seed distribution to match the capacity of our seeding tools.
Seed monitoring and cart control are all managed through our Green Star™ 3 display for completely integrated, variable-rate seeding and guidance.
Our Air Hoe and No-Till Air Drills have ground-engaging boots that provide precise depth control and seed placement row after row. Ranging in widths between 30 ft (9.1m) and 60 ft (18.2m) they offer exceptional capacity across the ever changing terrain and conditions in your fi elds.
When it comes down to it, less seed and fertiliser waste mean higher yields and more consistent fi elds. This is smart seeding.
Speak to your John Deere dealer today for details. Nothing Runs Like a Deere™ JohnDeere.com.au