
S&P MARC 5% IndexL i m (2d) S&P Dow Jones Indices: S&P MARC 5% Index Methodology 6 Index Maintenance...
12
August 2019 S&P Dow Jones Indices: Index Methodology S&P MARC 5% Index Methodology
Transcript of S&P MARC 5% IndexL i m (2d) S&P Dow Jones Indices: S&P MARC 5% Index Methodology 6 Index Maintenance...
August 2019 S&P Dow Jones Indices: Index Methodology
S&P MARC 5% Index Methodology
S&P Dow Jones Indices: S&P MARC 5% Index Methodology 1
Table of Contents
Introduction 2
Index Objective and Highlights 2
Supporting Documents 2
Index Construction 3
Approach 3
Index Level Calculations 4
Index Maintenance 6
Rebalancing 6
Currency of Calculation and Additional Index Return Series 6
Base Date and History Availability 6
Index Governance 7
Index Committee 7
Index Policy 8
Holiday Schedule 8
Unexpected Exchange Closures 8
Rebalancing 8
Recalculation Policy 8
Contact Information 8
Index Dissemination 9
Tickers 9
Index Data 9
Web site 9
Disclaimer 10
S&P Dow Jones Indices: S&P MARC 5% Index Methodology 2
Introduction
Index Objective and Highlights
The S&P MARC 5% Index measures the performance of a risk-weighted strategy consisting of three sub-indices. The index provides multi-asset diversification within a simple risk weighting framework and is comprised of three underlying component indices representing different asset classes:
Underlying Component Index Asset Class Represented
S&P 500 Total Return Index1 Equities
S&P GSCI Gold Excess Return Index Commodities
S&P 10-Year U.S. Treasury Note Futures Excess Return Index
Fixed Income
For information on the underlying component indices, please refer to their respective index methodologies available at www.spdji.com. Please refer to Index Construction for details on each index’s allocation to equities, commodities, and fixed income.
Supporting Documents
This methodology is meant to be read in conjunction with supporting documents providing greater detail with respect to the policies, procedures and calculations described herein. References throughout the methodology direct the reader to the relevant supporting document for further information on a specific topic. The list of the main supplemental documents for this methodology and the hyperlinks to those documents is as follows:
Supporting Document URL
S&P Dow Jones Indices’ Equity Indices Policies & Practices Methodology
Equity Indices Policies & Practices
S&P Dow Jones Indices’ Index Mathematics Methodology
Index Mathematics Methodology
S&P Dow Jones Indices’ Commodities Indices Policies & Practices Methodology
Commodities Indices Policies & Practices
S&P Dow Jones Indices’ Fixed Income Policies & Practices Methodology
Fixed Income Policies & Practices
S&P Dow Jones Indices’ Fixed Income Index Mathematics Methodology
Index Mathematics Methodology
This methodology was created by S&P Dow Jones Indices to achieve the aforementioned objective of measuring the underlying interest of each index governed by this methodology document. Any changes to or deviations from this methodology are made in the sole judgment and discretion of S&P Dow Jones Indices so that the index continues to achieve its objective.
1 For purposes of the S&P MARC 5% Index, an excess return version of the S&P 500 is calculated from the S&P 500 Total Return
Index as described in Index Construction and is used as the underlying equities component index.
S&P Dow Jones Indices: S&P MARC 5% Index Methodology 3
Index Construction
Approach
The index allocates among three sub-indices based on their respective realized volatilities. The underlying commodities and fixed income indices are calculated and published by S&P Dow Jones Indices on a daily basis as excess return indices. For purposes of the S&P MARC 5% Index, an excess return version of the S&P 500 is calculated from the S&P 500 Total Return Index as follows and is used as the underlying equities component index.
𝑆𝑃500 𝐸𝑥𝑐𝑒𝑠𝑠 𝑅𝑒𝑡𝑢𝑟𝑛𝑡 = (𝑆𝑃500 𝑇𝑅 𝐼𝑛𝑑𝑒𝑥𝑡𝑆𝑃500 𝑇𝑅 𝐼𝑛𝑑𝑒𝑥𝑡−1
− 1) − (𝐼𝑛𝑡𝑒𝑟𝑒𝑠𝑡𝑅𝑎𝑡𝑒𝑡−1 ∗𝑁𝑢𝑚𝐷𝑎𝑦𝑠𝑡
360)
𝑆𝑃500 𝐸𝑥𝑐𝑒𝑠𝑠 𝑅𝑒𝑡𝑢𝑟𝑛 𝐼𝑛𝑑𝑒𝑥𝑡 = 𝑆𝑃500 𝐸𝑥𝑐𝑒𝑠𝑠 𝑅𝑒𝑡𝑢𝑟𝑛 𝐼𝑛𝑑𝑒𝑥𝑡−1 ∗ (1 + 𝑆𝑃500 𝐸𝑥𝑐𝑒𝑠𝑠 𝑅𝑒𝑡𝑢𝑟𝑛𝑡)
where:
𝐼𝑛𝑡𝑒𝑟𝑒𝑠𝑡𝑅𝑎𝑡𝑒 = Effective Federal Funds Rate. To calculate the target allocation for each asset class, the index:
1. Uses an exponentially weighted model to calculate the realized variance of each underlying component index and the realized covariance between them.
2. Adjusts the underlying component index weights based on the maximum leverage of 150%.
3. Uses a 5% target volatility.
4. Uses a short- and long-term decay factor of 94% and 97%, respectively, to calculate the volatilities.
As part of the daily rebalancing, the following are calculated:
1. The short- and long-term variance and covariance numbers for all three underlying component indices as defined in Index Level Calculations on the following pages.
2. The weights for each of the three underlying component indices (A) are calculated using the following formula:
𝑊𝐿,𝑡𝐴 =
(𝑉𝑎𝑟𝑖𝑎𝑛𝑐𝑒𝐿,𝑡𝐴 )
−1/2
∑ (𝑉𝑎𝑟𝑖𝑎𝑛𝑐𝑒𝐿,𝑡𝐵 )
−1/2𝐵
3. The realized volatility of the underlying component indices using the following formula:
𝑅𝑒𝑎𝑙𝑖𝑧𝑒𝑑𝑉𝑜𝑙𝑎𝑡𝑖𝑙𝑖𝑡𝑦𝑡 = √252 ∙ max(𝑃𝑜𝑟𝑡𝑓𝑜𝑙𝑖𝑜𝑉𝑎𝑟𝐿,𝑡 , 𝑃𝑜𝑟𝑡𝑓𝑜𝑙𝑖𝑜𝑉𝑎𝑟𝑆,𝑡)
where:
𝑃𝑜𝑟𝑡𝑓𝑜𝑙𝑖𝑜𝑉𝑎𝑟𝐿,𝑡 = 𝑊𝐿,𝑡𝐸𝑞2
∗ 𝑉𝑎𝑟𝑖𝑎𝑛𝑐𝑒𝐿,𝑡𝐸𝑞+𝑊𝐿,𝑡
𝐹𝐼2 ∗ 𝑉𝑎𝑟𝑖𝑎𝑛𝑐𝑒𝐿,𝑡𝐹𝐼 +𝑊𝐿,𝑡
𝐶𝑜𝑚2∗ 𝑉𝑎𝑟𝑖𝑎𝑛𝑐𝑒𝐿,𝑡
𝐶𝑜𝑚 +
2 ∗ 𝐶𝑜𝑣𝑎𝑟𝑖𝑎𝑛𝑐𝑒𝐿,𝑡𝐸𝑞,𝐹𝐼
𝑊𝐿,𝑡𝐸𝑞𝑊𝐿,𝑡
𝐹𝐼 + 2 ∗ 𝐶𝑜𝑣𝑎𝑟𝑖𝑎𝑛𝑐𝑒𝐿,𝑡𝐸𝑞,𝐶𝑜𝑚
𝑊𝐿,𝑡𝐸𝑞𝑊𝐿,𝑡
𝐶𝑜𝑚 +
2 ∗ 𝐶𝑜𝑣𝑎𝑟𝑖𝑎𝑛𝑐𝑒𝐿,𝑡𝐹𝐼,𝐶𝑜𝑚𝑊𝐿,𝑡
𝐹𝐼𝑊𝐿,𝑡𝐶𝑜𝑚

S&P Dow Jones Indices: S&P MARC 5% Index Methodology 4
𝑃𝑜𝑟𝑡𝑓𝑜𝑙𝑖𝑜𝑉𝑎𝑟𝑆,𝑡 = 𝑊𝐿,𝑡𝐸𝑞2
∗ 𝑉𝑎𝑟𝑖𝑎𝑛𝑐𝑒𝑆,𝑡𝐸𝑞+𝑊𝐿,𝑡
𝐹𝐼2 ∗ 𝑉𝑎𝑟𝑖𝑎𝑛𝑐𝑒𝑆,𝑡𝐹𝐼 +𝑊𝐿,𝑡
𝐶𝑜𝑚2∗ 𝑉𝑎𝑟𝑖𝑎𝑛𝑐𝑒𝑆,𝑡
𝐶𝑜𝑚 +
2 ∗ 𝐶𝑜𝑣𝑎𝑟𝑖𝑎𝑛𝑐𝑒𝑆,𝑡𝐸𝑞,𝐹𝐼
𝑊𝐿,𝑡𝐸𝑞𝑊𝐿,𝑡
𝐹𝐼 + 2 ∗ 𝐶𝑜𝑣𝑎𝑟𝑖𝑎𝑛𝑐𝑒𝑆,𝑡𝐸𝑞,𝐶𝑜𝑚
𝑊𝐿,𝑡𝐸𝑞𝑊𝐿,𝑡
𝐶𝑜𝑚 +
2 ∗ 𝐶𝑜𝑣𝑎𝑟𝑖𝑎𝑛𝑐𝑒𝑆,𝑡𝐹𝐼,𝐶𝑜𝑚𝑊𝐿,𝑡
𝐹𝐼𝑊𝐿,𝑡𝐶𝑜𝑚
4. The total return and excess return index values as described in Index Level Calculations below.
Index Level Calculations
On any business day t when the index is calculated, the excess return and total return index values are calculated using the following formulas:
𝐸𝑥𝑐𝑒𝑠𝑠 𝑅𝑒𝑡𝑢𝑟𝑛𝑡 =∑𝐴𝑑𝑗𝑊𝑡−2 ∗ 𝑊𝑡−2𝐴 ∗ (
𝐼𝑛𝑑𝑒𝑥𝑡𝐴
𝐼𝑛𝑑𝑒𝑥𝑡−1𝐴 − 1)
𝐴
𝑇𝑜𝑡𝑎𝑙 𝑅𝑒𝑡𝑢𝑟𝑛𝑡 = 𝐸𝑥𝑐𝑒𝑠𝑠 𝑅𝑒𝑡𝑢𝑟𝑛𝑡 + (𝐼𝑛𝑡𝑒𝑟𝑒𝑠𝑡𝑅𝑎𝑡𝑒𝑡−1 ∗𝑁𝑢𝑚𝐷𝑎𝑦𝑠𝑡
360)
𝐼𝑛𝑑𝑒𝑥𝐸𝑅𝑡 = 𝐼𝑛𝑑𝑒𝑥𝐸𝑅𝑡−1 ∗ (1 + 𝐸𝑥𝑐𝑒𝑠𝑠 𝑅𝑒𝑡𝑢𝑟𝑛𝑡) 𝐼𝑛𝑑𝑒𝑥𝑇𝑅𝑡 = 𝐼𝑛𝑑𝑒𝑥𝑇𝑅𝑡−1 ∗ (1 + 𝑇𝑜𝑡𝑎𝑙 𝑅𝑒𝑡𝑢𝑟𝑛𝑡)
where:
𝐴𝑑𝑗𝑊𝑡−2 = 𝑀𝑖𝑛(𝑀𝑎𝑥 𝐿𝑒𝑣𝑒𝑟𝑎𝑔𝑒,𝑇𝑎𝑟𝑔𝑒𝑡 𝑉𝑜𝑙𝑎𝑡𝑖𝑙𝑖𝑡𝑦
𝑅𝑒𝑎𝑙𝑖𝑧𝑒𝑑 𝑉𝑜𝑙𝑎𝑡𝑖𝑙𝑖𝑡𝑦𝑡−2)
𝑊𝑡𝐴 = The weight of the respective underlying component index (A) as of time t.
𝐼𝑛𝑑𝑒𝑥𝑡𝐴 = The excess return index level of the respective underlying component index A as
of time t.
𝐼𝑛𝑡𝑒𝑟𝑒𝑠𝑡𝑅𝑎𝑡𝑒𝑡−1 = Effective Federal Funds Rate. A 360-day year is assumed for the interest calculations in accordance with U.S. banking practices.
𝑁𝑢𝑚𝐷𝑎𝑦𝑠𝑡 = The number of calendar days between day t-1 and t. Exponentially Weighted Variance and Covariance. On any business day t when the index is calculated, the index calculates the realized short- and long-term variances and covariances of the underlying component indices. The calculations are based on exponentially weighted moving averages, and are as follows:
𝑉𝑎𝑟𝑖𝑎𝑛𝑐𝑒𝑆,𝑡𝐴 = The short-term variance for index A, at time t, is calculated as:
𝑉𝑎𝑟𝑖𝑎𝑛𝑐𝑒𝑆,𝑡𝐴 =
{
𝜆𝑆𝑉𝑎𝑟𝑖𝑎𝑛𝑐𝑒𝑆,𝑡−1𝐴 + (1 − 𝜆𝑆) [𝑙𝑛 (
𝐼𝑛𝑑𝑒𝑥𝑡𝐴
𝐼𝑛𝑑𝑒𝑥𝑡−1𝐴 )]
2
𝑖𝑓 𝑡 > 𝑇0
∑𝛼𝑆,𝑖,𝑚
𝑊𝐹𝑆[𝑙𝑛 (
𝐼𝑛𝑑𝑒𝑥𝑖𝐴
𝐼𝑛𝑑𝑒𝑥𝑖−1𝐴 )]
2𝑇0𝑖=𝑚+1 𝑖𝑓 𝑡 = 𝑇0
(1a)
𝑉𝑎𝑟𝑖𝑎𝑛𝑐𝑒𝐿,𝑡𝐴 = The long-term variance for index A, at time t, is calculated as:
𝑉𝑎𝑟𝑖𝑎𝑛𝑐𝑒𝐿,𝑡𝐴 =
{
𝜆𝐿𝑉𝑎𝑟𝑖𝑎𝑛𝑐𝑒𝐿,𝑡−1𝐴 + (1 − 𝜆𝐿) [𝑙𝑛 (
𝐼𝑛𝑑𝑒𝑥𝑡𝐴
𝐼𝑛𝑑𝑒𝑥𝑡−1𝐴 )]
2
𝑖𝑓 𝑡 > 𝑇0
∑𝛼𝐿,𝑖,𝑚
𝑊𝐹𝐿[𝑙𝑛 (
𝐼𝑛𝑑𝑒𝑥𝑖𝐴
𝐼𝑛𝑑𝑒𝑥𝑖−1𝐴 )]
2𝑇0𝑖=𝑚+1 𝑖𝑓 𝑡 = 𝑇0
(1b)
S&P Dow Jones Indices: S&P MARC 5% Index Methodology 5
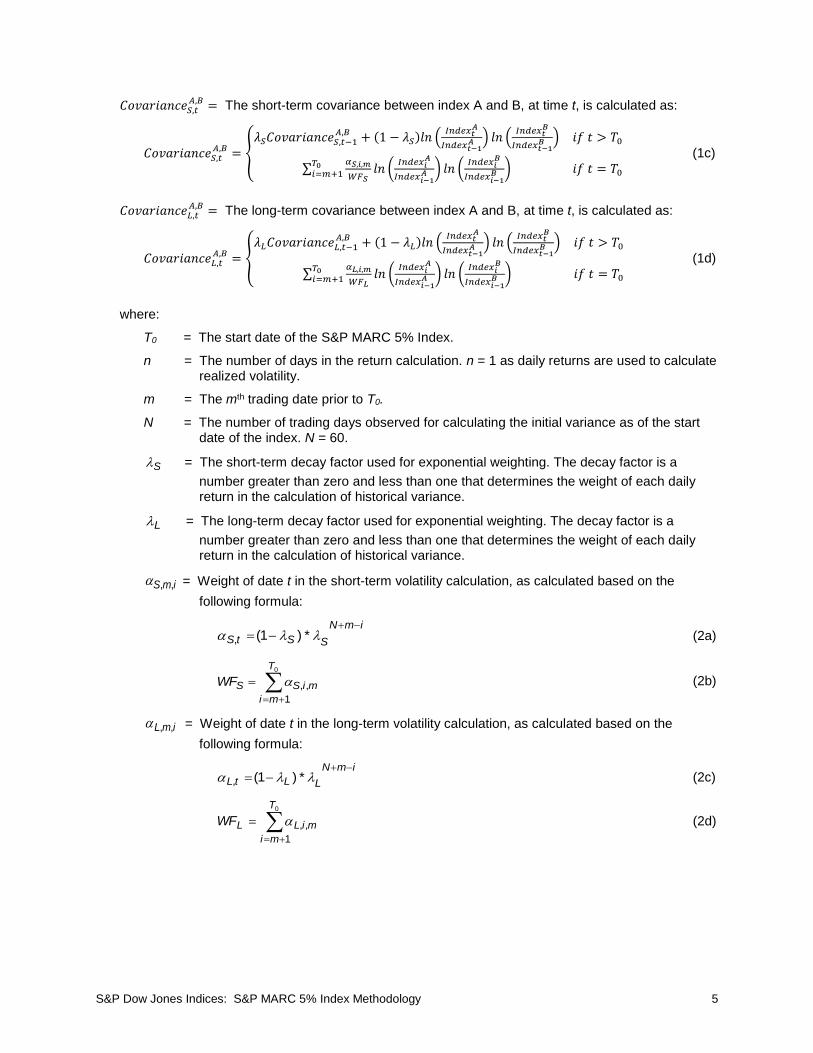
𝐶𝑜𝑣𝑎𝑟𝑖𝑎𝑛𝑐𝑒𝑆,𝑡𝐴,𝐵 = The short-term covariance between index A and B, at time t, is calculated as:
𝐶𝑜𝑣𝑎𝑟𝑖𝑎𝑛𝑐𝑒𝑆,𝑡𝐴,𝐵 = {
𝜆𝑆𝐶𝑜𝑣𝑎𝑟𝑖𝑎𝑛𝑐𝑒𝑆,𝑡−1𝐴,𝐵 + (1 − 𝜆𝑆)𝑙𝑛 (
𝐼𝑛𝑑𝑒𝑥𝑡𝐴
𝐼𝑛𝑑𝑒𝑥𝑡−1𝐴 ) 𝑙𝑛 (
𝐼𝑛𝑑𝑒𝑥𝑡𝐵
𝐼𝑛𝑑𝑒𝑥𝑡−1𝐵 ) 𝑖𝑓 𝑡 > 𝑇0
∑𝛼𝑆,𝑖,𝑚
𝑊𝐹𝑆
𝑇0𝑖=𝑚+1 𝑙𝑛 (
𝐼𝑛𝑑𝑒𝑥𝑖𝐴
𝐼𝑛𝑑𝑒𝑥𝑖−1𝐴 ) 𝑙𝑛 (
𝐼𝑛𝑑𝑒𝑥𝑖𝐵
𝐼𝑛𝑑𝑒𝑥𝑖−1𝐵 ) 𝑖𝑓 𝑡 = 𝑇0
(1c)
𝐶𝑜𝑣𝑎𝑟𝑖𝑎𝑛𝑐𝑒𝐿,𝑡𝐴,𝐵 = The long-term covariance between index A and B, at time t, is calculated as:
𝐶𝑜𝑣𝑎𝑟𝑖𝑎𝑛𝑐𝑒𝐿,𝑡𝐴,𝐵 = {
𝜆𝐿𝐶𝑜𝑣𝑎𝑟𝑖𝑎𝑛𝑐𝑒𝐿,𝑡−1𝐴,𝐵 + (1 − 𝜆𝐿)𝑙𝑛 (
𝐼𝑛𝑑𝑒𝑥𝑡𝐴
𝐼𝑛𝑑𝑒𝑥𝑡−1𝐴 ) 𝑙𝑛 (
𝐼𝑛𝑑𝑒𝑥𝑡𝐵
𝐼𝑛𝑑𝑒𝑥𝑡−1𝐵 ) 𝑖𝑓 𝑡 > 𝑇0
∑𝛼𝐿,𝑖,𝑚
𝑊𝐹𝐿
𝑇0𝑖=𝑚+1 𝑙𝑛 (
𝐼𝑛𝑑𝑒𝑥𝑖𝐴
𝐼𝑛𝑑𝑒𝑥𝑖−1𝐴 ) 𝑙𝑛 (
𝐼𝑛𝑑𝑒𝑥𝑖𝐵
𝐼𝑛𝑑𝑒𝑥𝑖−1𝐵 ) 𝑖𝑓 𝑡 = 𝑇0
(1d)
where:
T0 = The start date of the S&P MARC 5% Index.
n = The number of days in the return calculation. n = 1 as daily returns are used to calculate realized volatility.
m = The mth trading date prior to T0.
N = The number of trading days observed for calculating the initial variance as of the start date of the index. N = 60.
S = The short-term decay factor used for exponential weighting. The decay factor is a
number greater than zero and less than one that determines the weight of each daily return in the calculation of historical variance.
L = The long-term decay factor used for exponential weighting. The decay factor is a
number greater than zero and less than one that determines the weight of each daily return in the calculation of historical variance.
imS ,, = Weight of date t in the short-term volatility calculation, as calculated based on the
following formula:
imN
SStS
*)1(, (2a)
0
1
,,
T
mi
miSSWF (2b)
imL ,, = Weight of date t in the long-term volatility calculation, as calculated based on the
following formula:
imN
LLtL
*)1(, (2c)
0
1
,,
T
mi
miLLWF (2d)
S&P Dow Jones Indices: S&P MARC 5% Index Methodology 6
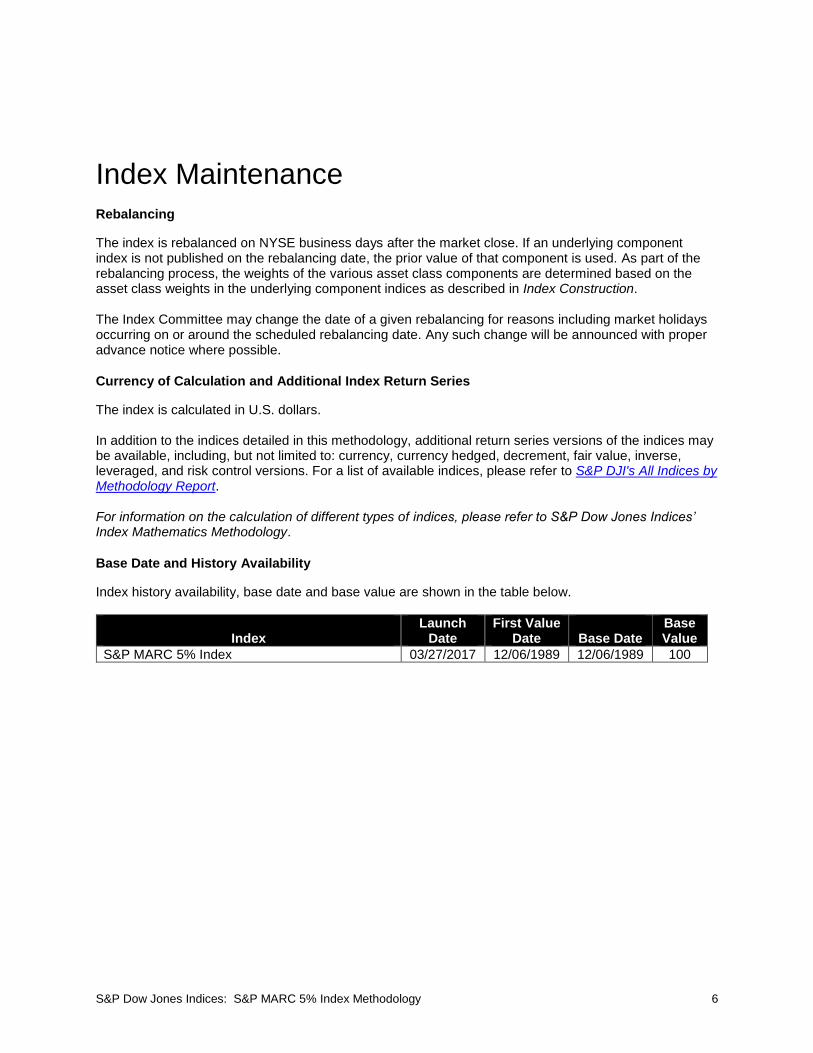
Index Maintenance
Rebalancing
The index is rebalanced on NYSE business days after the market close. If an underlying component index is not published on the rebalancing date, the prior value of that component is used. As part of the rebalancing process, the weights of the various asset class components are determined based on the asset class weights in the underlying component indices as described in Index Construction. The Index Committee may change the date of a given rebalancing for reasons including market holidays occurring on or around the scheduled rebalancing date. Any such change will be announced with proper advance notice where possible.
Currency of Calculation and Additional Index Return Series
The index is calculated in U.S. dollars. In addition to the indices detailed in this methodology, additional return series versions of the indices may be available, including, but not limited to: currency, currency hedged, decrement, fair value, inverse, leveraged, and risk control versions. For a list of available indices, please refer to S&P DJI's All Indices by Methodology Report. For information on the calculation of different types of indices, please refer to S&P Dow Jones Indices’ Index Mathematics Methodology.
Base Date and History Availability
Index history availability, base date and base value are shown in the table below.
Index
Launch Date
First Value Date
Base Date
Base Value
S&P MARC 5% Index 03/27/2017 12/06/1989 12/06/1989 100
S&P Dow Jones Indices: S&P MARC 5% Index Methodology 7
Index Governance
Index Committee
S&P Dow Jones Indices’ Factor Indices Index Committee maintains the index. The Committee meets regularly. At each meeting, the Committee reviews matters that may affect index constituents, statistics comparing the composition of the index to the market, and any significant market events. In addition, the Index Committee may revise index policy covering rules for selecting constituents, treatment of dividends, share counts or other matters. S&P Dow Jones Indices’ considers information about changes to its indices and related matters to be potentially market moving and material. Therefore, all Index Committee discussions are confidential. S&P Dow Jones Indices’ Index Committees reserve the right to make exceptions when applying the methodology if the need arises. In any scenario where the treatment differs from the general rules stated in this document or supplemental documents, clients will receive sufficient notice, whenever possible. In addition to the daily governance of indices and maintenance of index methodologies, at least once within any 12-month period, the Index Committee reviews the methodology to ensure the indices continue to achieve the stated objectives, and that the data and methodology remain effective. In certain instances, S&P Dow Jones Indices may publish a consultation inviting comments from external parties. For information on Quality Assurance and Internal Reviews of Methodology, please refer to S&P Dow Jones Indices’ Equity Indices Policies & Practices Methodology.
S&P Dow Jones Indices: S&P MARC 5% Index Methodology 8
Index Policy
Holiday Schedule
The index is calculated on all U.S. equity market business days. A complete holiday schedule for the year is available at www.spdji.com.
Unexpected Exchange Closures
For information on Unexpected Exchange Closures, please refer to S&P Dow Jones Indices’ Equity Indices Policies & Practices Methodology.
Rebalancing
The Index Committee may change the date of a given rebalancing for reasons including market holidays occurring on or around the scheduled rebalancing date. Any such change will be announced with proper advance notice where possible.
Recalculation Policy
For information on the recalculation policy, please refer to S&P Dow Jones Indices’ Equity Indices Policies & Practices Methodology. For information on Calculations and Pricing Disruptions, Expert Judgment and Data Hierarchy, please refer to S&P Dow Jones Indices’ Equity Indices Policies & Practices Methodology.
Contact Information
For questions regarding an index, please contact: [email protected].
S&P Dow Jones Indices: S&P MARC 5% Index Methodology 9
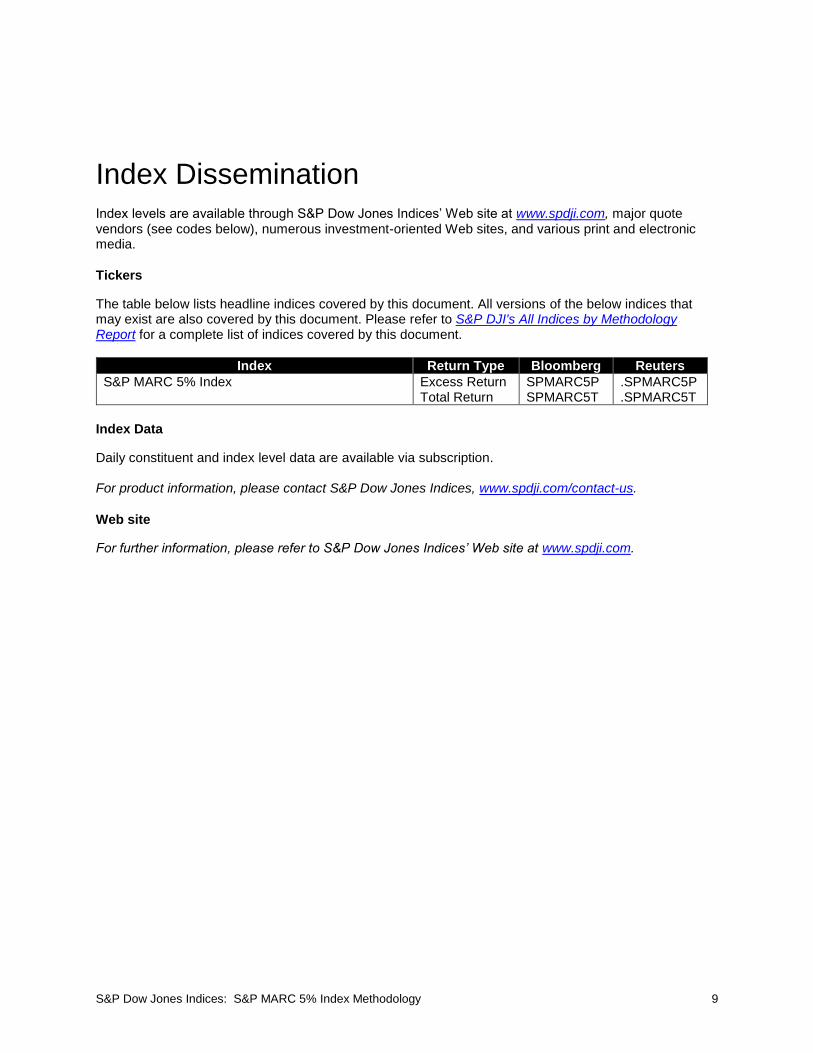
Index Dissemination Index levels are available through S&P Dow Jones Indices’ Web site at www.spdji.com, major quote vendors (see codes below), numerous investment-oriented Web sites, and various print and electronic media.
Tickers
The table below lists headline indices covered by this document. All versions of the below indices that may exist are also covered by this document. Please refer to S&P DJI's All Indices by Methodology Report for a complete list of indices covered by this document.
Index Return Type Bloomberg Reuters
S&P MARC 5% Index Excess Return SPMARC5P .SPMARC5P Total Return SPMARC5T .SPMARC5T
Index Data
Daily constituent and index level data are available via subscription. For product information, please contact S&P Dow Jones Indices, www.spdji.com/contact-us.
Web site
For further information, please refer to S&P Dow Jones Indices’ Web site at www.spdji.com.
S&P Dow Jones Indices: S&P MARC 5% Index Methodology 10
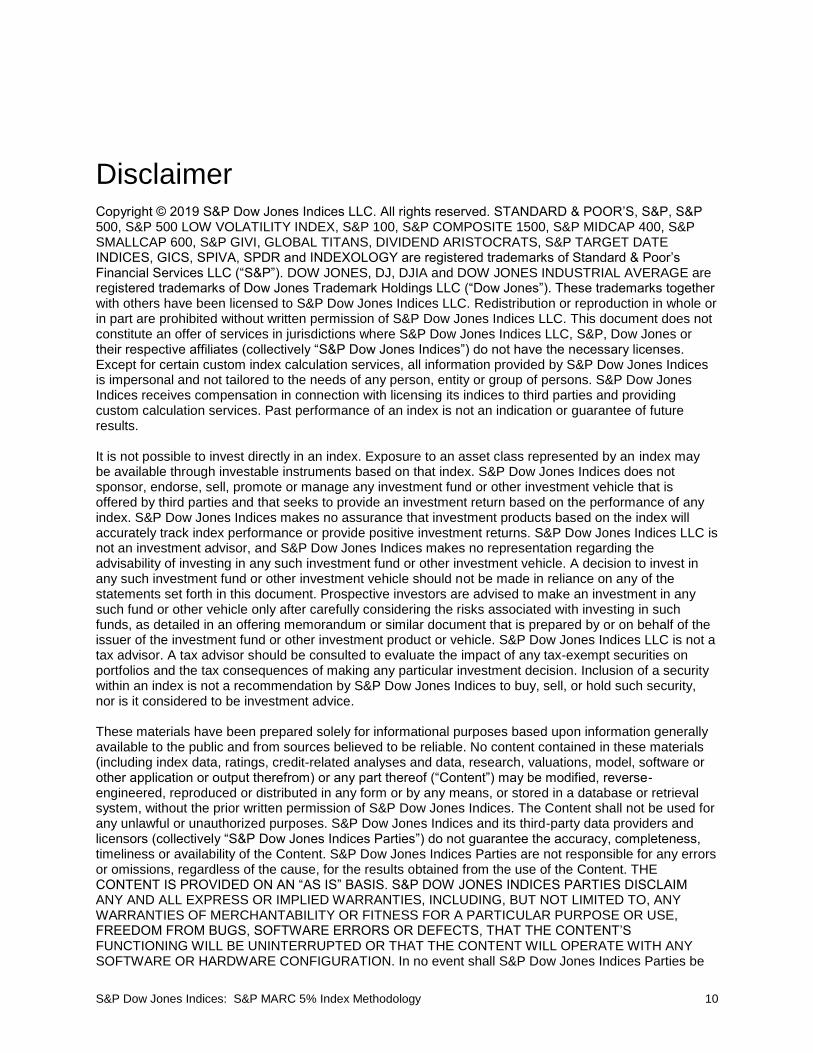
Disclaimer Copyright © 2019 S&P Dow Jones Indices LLC. All rights reserved. STANDARD & POOR’S, S&P, S&P 500, S&P 500 LOW VOLATILITY INDEX, S&P 100, S&P COMPOSITE 1500, S&P MIDCAP 400, S&P SMALLCAP 600, S&P GIVI, GLOBAL TITANS, DIVIDEND ARISTOCRATS, S&P TARGET DATE INDICES, GICS, SPIVA, SPDR and INDEXOLOGY are registered trademarks of Standard & Poor’s Financial Services LLC (“S&P”). DOW JONES, DJ, DJIA and DOW JONES INDUSTRIAL AVERAGE are registered trademarks of Dow Jones Trademark Holdings LLC (“Dow Jones”). These trademarks together with others have been licensed to S&P Dow Jones Indices LLC. Redistribution or reproduction in whole or in part are prohibited without written permission of S&P Dow Jones Indices LLC. This document does not constitute an offer of services in jurisdictions where S&P Dow Jones Indices LLC, S&P, Dow Jones or their respective affiliates (collectively “S&P Dow Jones Indices”) do not have the necessary licenses. Except for certain custom index calculation services, all information provided by S&P Dow Jones Indices is impersonal and not tailored to the needs of any person, entity or group of persons. S&P Dow Jones Indices receives compensation in connection with licensing its indices to third parties and providing custom calculation services. Past performance of an index is not an indication or guarantee of future results. It is not possible to invest directly in an index. Exposure to an asset class represented by an index may be available through investable instruments based on that index. S&P Dow Jones Indices does not sponsor, endorse, sell, promote or manage any investment fund or other investment vehicle that is offered by third parties and that seeks to provide an investment return based on the performance of any index. S&P Dow Jones Indices makes no assurance that investment products based on the index will accurately track index performance or provide positive investment returns. S&P Dow Jones Indices LLC is not an investment advisor, and S&P Dow Jones Indices makes no representation regarding the advisability of investing in any such investment fund or other investment vehicle. A decision to invest in any such investment fund or other investment vehicle should not be made in reliance on any of the statements set forth in this document. Prospective investors are advised to make an investment in any such fund or other vehicle only after carefully considering the risks associated with investing in such funds, as detailed in an offering memorandum or similar document that is prepared by or on behalf of the issuer of the investment fund or other investment product or vehicle. S&P Dow Jones Indices LLC is not a tax advisor. A tax advisor should be consulted to evaluate the impact of any tax-exempt securities on portfolios and the tax consequences of making any particular investment decision. Inclusion of a security within an index is not a recommendation by S&P Dow Jones Indices to buy, sell, or hold such security, nor is it considered to be investment advice. These materials have been prepared solely for informational purposes based upon information generally available to the public and from sources believed to be reliable. No content contained in these materials (including index data, ratings, credit-related analyses and data, research, valuations, model, software or other application or output therefrom) or any part thereof (“Content”) may be modified, reverse-engineered, reproduced or distributed in any form or by any means, or stored in a database or retrieval system, without the prior written permission of S&P Dow Jones Indices. The Content shall not be used for any unlawful or unauthorized purposes. S&P Dow Jones Indices and its third-party data providers and licensors (collectively “S&P Dow Jones Indices Parties”) do not guarantee the accuracy, completeness, timeliness or availability of the Content. S&P Dow Jones Indices Parties are not responsible for any errors or omissions, regardless of the cause, for the results obtained from the use of the Content. THE CONTENT IS PROVIDED ON AN “AS IS” BASIS. S&P DOW JONES INDICES PARTIES DISCLAIM ANY AND ALL EXPRESS OR IMPLIED WARRANTIES, INCLUDING, BUT NOT LIMITED TO, ANY WARRANTIES OF MERCHANTABILITY OR FITNESS FOR A PARTICULAR PURPOSE OR USE, FREEDOM FROM BUGS, SOFTWARE ERRORS OR DEFECTS, THAT THE CONTENT’S FUNCTIONING WILL BE UNINTERRUPTED OR THAT THE CONTENT WILL OPERATE WITH ANY SOFTWARE OR HARDWARE CONFIGURATION. In no event shall S&P Dow Jones Indices Parties be
S&P Dow Jones Indices: S&P MARC 5% Index Methodology 11
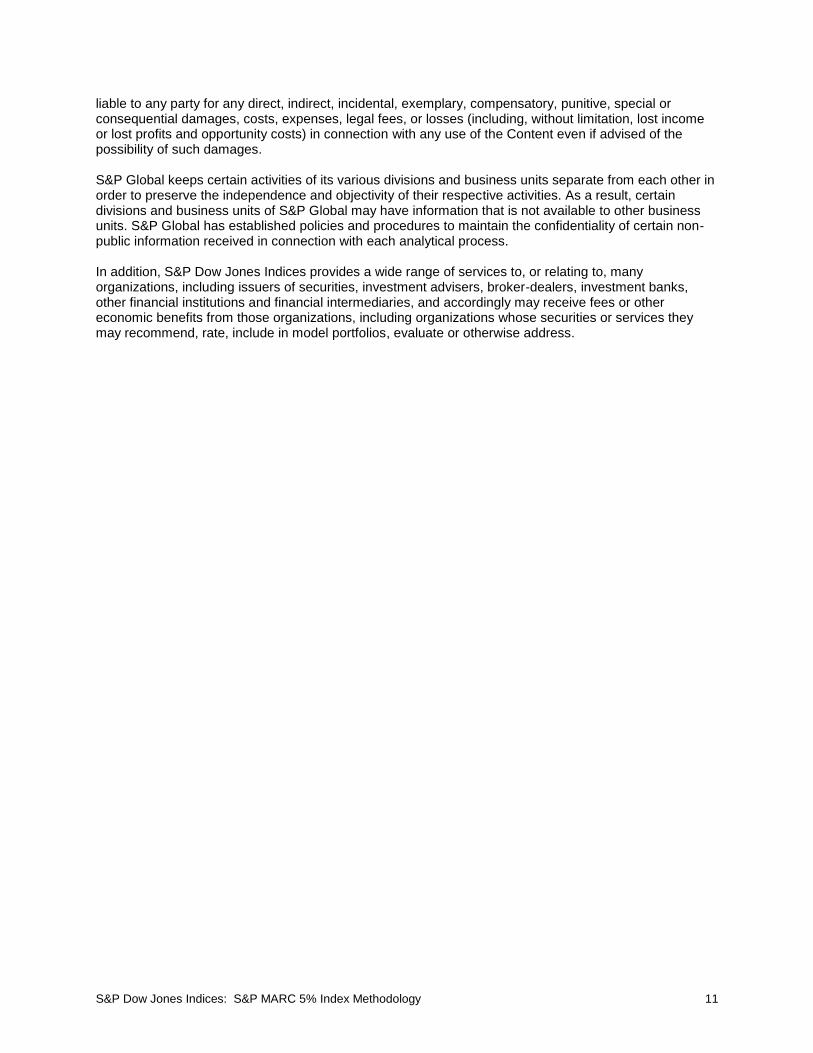
liable to any party for any direct, indirect, incidental, exemplary, compensatory, punitive, special or consequential damages, costs, expenses, legal fees, or losses (including, without limitation, lost income or lost profits and opportunity costs) in connection with any use of the Content even if advised of the possibility of such damages. S&P Global keeps certain activities of its various divisions and business units separate from each other in order to preserve the independence and objectivity of their respective activities. As a result, certain divisions and business units of S&P Global may have information that is not available to other business units. S&P Global has established policies and procedures to maintain the confidentiality of certain non-public information received in connection with each analytical process. In addition, S&P Dow Jones Indices provides a wide range of services to, or relating to, many organizations, including issuers of securities, investment advisers, broker-dealers, investment banks, other financial institutions and financial intermediaries, and accordingly may receive fees or other economic benefits from those organizations, including organizations whose securities or services they may recommend, rate, include in model portfolios, evaluate or otherwise address.


![INDEX [] · INDEX CZECH REPUBLIC 1. Svíčková p.5 2. Moravský vrabec p.6 3. Hovězí vývar p.7 GERMANY 1. Bratkartoffeln p.8 2. Hackfleischklößchen p.9](https://static.fdocuments.in/doc/165x107/5e06d4d76dcdcc29d374a6fe/index-index-czech-republic-1-svkov-p5-2-moravsk-vrabec-p6-3-hovz.jpg)
