Soybean row spacing, plant densities and N benefits …department/deptdocs.nsf/ba3468a2a...Title...
57
Soybean row spacing, plant densities, and N benefits to following crops Francis J. Larney 1 , Tram N.T. Thai 1,4 , Manjula S. Bandara 2 , Doon G. Pauly 3 , James E. Thomas 4 , and Danny G. LeRoy 5 1 Agriculture & Agri-Food Canada, Lethbridge, AB 2 Alberta Agriculture & Forestry, Brooks, AB 3 Alberta Agriculture & Forestry, Lethbridge, AB 4 Dept. of Biological Sciences, University of Lethbridge, Lethbridge, AB 5 Dept. of Economics, University of Lethbridge, Lethbridge, AB Agronomy Update, January 17-18, 2017, Lethbridge, AB
Transcript of Soybean row spacing, plant densities and N benefits …department/deptdocs.nsf/ba3468a2a...Title...

Soybean row spacing, plant densities, and N
benefits to following crops
Francis J. Larney1, Tram N.T. Thai1,4, Manjula S. Bandara2, Doon G. Pauly3, James E. Thomas4, and Danny G. LeRoy5
1Agriculture & Agri-Food Canada, Lethbridge, AB
2Alberta Agriculture & Forestry, Brooks, AB 3Alberta Agriculture & Forestry, Lethbridge, AB
4Dept. of Biological Sciences, University of Lethbridge, Lethbridge, AB 5Dept. of Economics, University of Lethbridge, Lethbridge, AB
Agronomy Update, January 17-18, 2017, Lethbridge, AB

Soybean in Alberta
• Acreage increasing
• Best yields at 116-121 days to maturity
• >130 days to maturity = risk of frost damage
• Threshold CHU = 2,200
• New crushing plant, Granum, AB
• Crushing capacity for 22,000 ha soybean
• Target yields of ~3,300 kg/ha (50 bu/ac)
• Replace dry bean on irrigated rotations?
• Future yields could be pushed to 4,000 kg/ha (60 bu/ac)
1
Year
No. 2
2014
2015
Soybean agronomy expt. Experimental design
5 main effects

1 2
Year Site
No. 2 2
2014 Bow Island
2015 Lethbridge
Soybean agronomy expt. Experimental design
5 main effects

1 2 3
Year Site Genotype
No. 2 2 2
2014 Bow Island Co-op F045R*
2015 Lethbridge NSC Tilston*
*Roundup Ready®
Soybean agronomy expt. Experimental design
5 main effects

1 2 3 4
Year Site Genotype Row spacing,
cm
No. 2 2 2 2
2014 Bow Island Co-op F045R* 17.5
2015 Lethbridge NSC Tilston* 35
*Roundup Ready®
Soybean agronomy expt. Experimental design
5 main effects

1 2 3 4 5
Year Site Genotype Row spacing,
cm
Seeding density,
seeds m-2
No. 2 2 2 2 3
2014 Bow Island Co-op F045R* 17.5 30
2015 Lethbridge NSC Tilston* 35 50
80
*Roundup Ready®
Soybean agronomy expt. Experimental design
5 main effects

1 2 3 4 5
Year Site Genotype Row spacing,
cm
Seeding density,
seeds m-2
No. 2 2 2 2 3
2014 Bow Island Co-op F045R* 17.5 30
2015 Lethbridge NSC Tilston* 35 50
80
26 possible interaction effects 2 ×2 ×2 ×2 ×3 = 48 treatment combinations
*Roundup Ready®
Soybean agronomy expt. Experimental design
5 main effects

What did we measure?
1. Plant density
2. Days to flowering
3. Plant height at flowering
4. Days to maturity
5. Plant height at maturity
6. Lowest pod height
During growing season:

What did we measure?
1. Plant density
2. Days to flowering
3. Plant height at flowering
4. Days to maturity
5. Plant height at maturity
6. Lowest pod height
1. Pods plant-1
2. Seeds plant-1
3. Thousand seed weight
4. Seed (grain) yield
5. “Straw” yield
6. Harvest index
During growing season: Yield components:

What did we measure?
1. Plant density
2. Days to flowering
3. Plant height at flowering
4. Days to maturity
5. Plant height at maturity
6. Lowest pod height
1. Pods plant-1
2. Seeds plant-1
3. Thousand seed weight
4. Seed (grain) yield
5. “Straw” yield
6. Harvest index
1. Grain N concentration
2. Straw N concentration
3. Grain N uptake
4. Straw N uptake
5. Total (grain + straw) N uptake
During growing season: Yield components:
Nitrogen parameters:
Total: 17 parameters

Year
Seeds plant-1
2014 64b
2015 72a
Occurred across all sites,
genotypes, row spacings,
and seeding densities
Significant main effects: year and site (Not overruled by a significant interaction)
1 of 17 parameters

Year Site
Seeds plant-1 Plant density, plants m2
2014 64b Bow Island 46a
2015 72a Lethbridge 43b
Occurred across all sites,
genotypes, row spacings,
and seeding densities
Occurred across all years, genotypes,
row spacings, and seeding densities
Significant main effects: year and site (Not overruled by a significant interaction)
1 of 17 parameters
Year Site
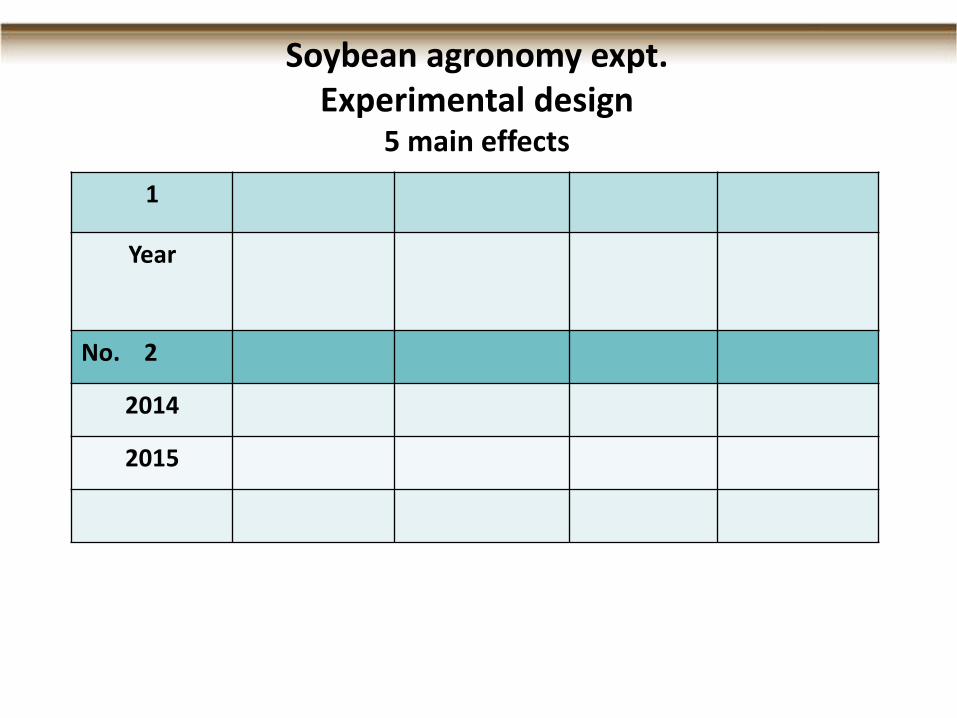
Seeds plant-1 Plant density, plants m2 Emerg, %
2014 64b Bow Island 46a 86%
2015 72a Lethbridge 43b 81%
Occurred across all sites,
genotypes, row spacings,
and seeding densities
Occurred across all years, genotypes,
row spacings, and seeding densities
Significant main effects: year and site (Not overruled by a significant interaction)
1 of 17 parameters

Pods plant-1
Seeds plant-1
Straw N conc, %
Total N uptake, kg ha-1
Co-op F045R 28b 64b 0.76a 196a
NSC Tilston 30a 71a 0.64b 182b
Occurred across all years, sites, row spacings, and seeding densities
Significant main effect: genotype (Not overruled by a significant interaction)
4 of 17 parameters

Lowest pod ht., cm
Seeds plant-1
Harvest index
17.5 cm (narrow) 6.0b 69a 0.37b
35 cm (wide) 6.4a 66b 0.38a
Occurred across all years, sites, genotypes, and seeding densities
Significant main effect: row spacing (Not overruled by a significant interaction)
3 of 17 parameters

Days to maturity
Straw N conc., %
Straw N uptake, kg ha-1
Total N uptake, kg ha-1
30 seeds m2 122a 0.68b 28b 163c
50 seeds m2
122ab 0.68b 30b 185b
80 seeds m2
121b 0.74a 40a 219a
Occurred across all years, sites, genotypes, and row spacings
Significant main effect: seeding density (Not overruled by a significant interaction)
4 of 17 parameters

Significant main effects (not overruled by interaction) Year 1 Site 1 Genotype 4 Row spacing 3 Seeding density 4
TOTAL 13
17 parameters ×5 main effects = 85
13/85 = 15% 85% of main effects overruled by significant interaction(s) Have to interpret all these interactions!

Let’s look at significant interactions: Days to maturity
Significant 2-way interaction: year x site
Occurred across all genotypes, row spacings and seeding densities
The behaviour of year depends on
which site we are looking at:
Year Bow Island Lethbridge
2014 118a 127a
2015 115b 127a
Difference 3 days 0 days
Within columns, means with different letter are significantly different from each other
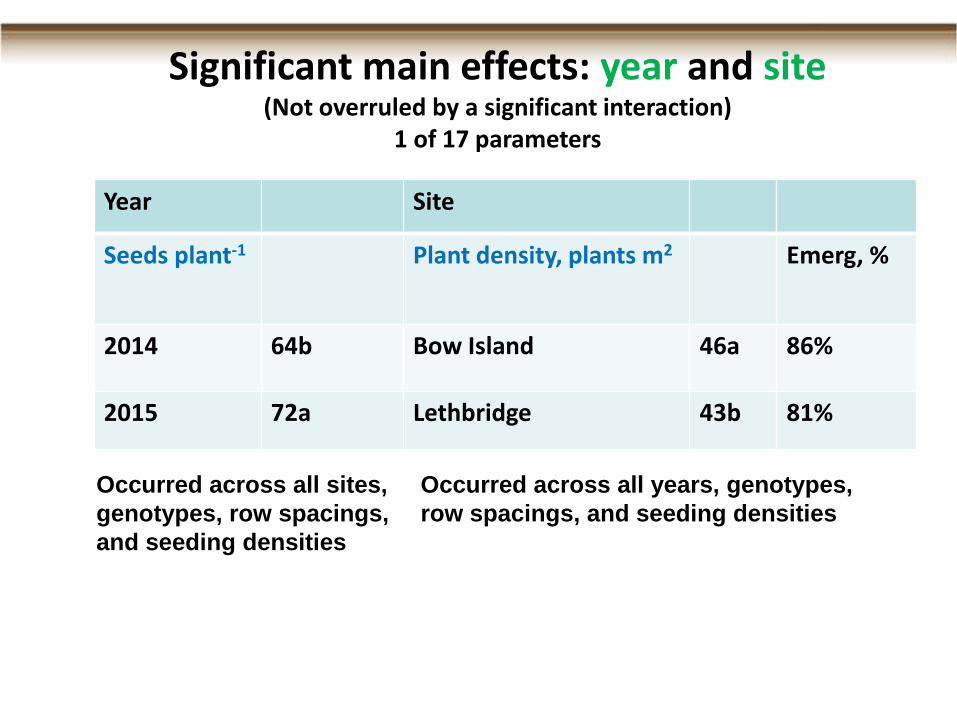
Let’s look at significant interactions: Days to maturity
Significant 2-way interaction: year x site
Occurred across all genotypes, row spacings and seeding densities
The behaviour of year depends on
which site we are looking at: The behaviour of site depends on
which year we are looking at:
Site 2014 2015
Bow Island 118b 115b
Lethbridge 127a 127a
Difference 9 days 12 days
Year Bow Island Lethbridge
2014 118a 127a
2015 115b 127a
Difference 3 days 0 days
Within columns, means with different letter are significantly different from each other

Let’s look at significant interactions: Days to maturity
The behaviour of site depends on which genotype x row spacing combination
we are looking at: While maturity was always earlier at Bow Island, widest gap
occurred for Co-op F045R narrow row: 13 d vs. 10-11 d for the others D
ays
to
ma
turi
ty
100
105
110
115
120
125
130
135 Bow Island
Lethbridge
Co-op F045R NSC Tilston
17.5 cm 35 cm 17.5 cm 35 cm
117
130
117
128
115
125
115
125
a
b
a
bb
a
b
a
Significant 3-way interaction: site x genotype x row spacing
occurred across all years and seeding densities

Let’s look at significant interactions: Days to maturity
The behaviour of genotype depends on which site x row spacing combination we are looking
at: While maturity was always earlier for NSC Tilston, the widest gap occurred for narrow row
spacing at Lethbridge: 5 d vs. 2-3 d for the others D
ays t
o m
atu
rity
100
105
110
115
120
125
130
135
Co-op F045R
NSC Tilston
Bow Island Lethbridge
17.5 cm 35 cm 17.5 cm 35 cm
117 117115
130
125
128
115
125
ab
ab
b
a
ba
Significant 3-way interaction: site x genotype x row spacing
occurred across all years and seeding densities
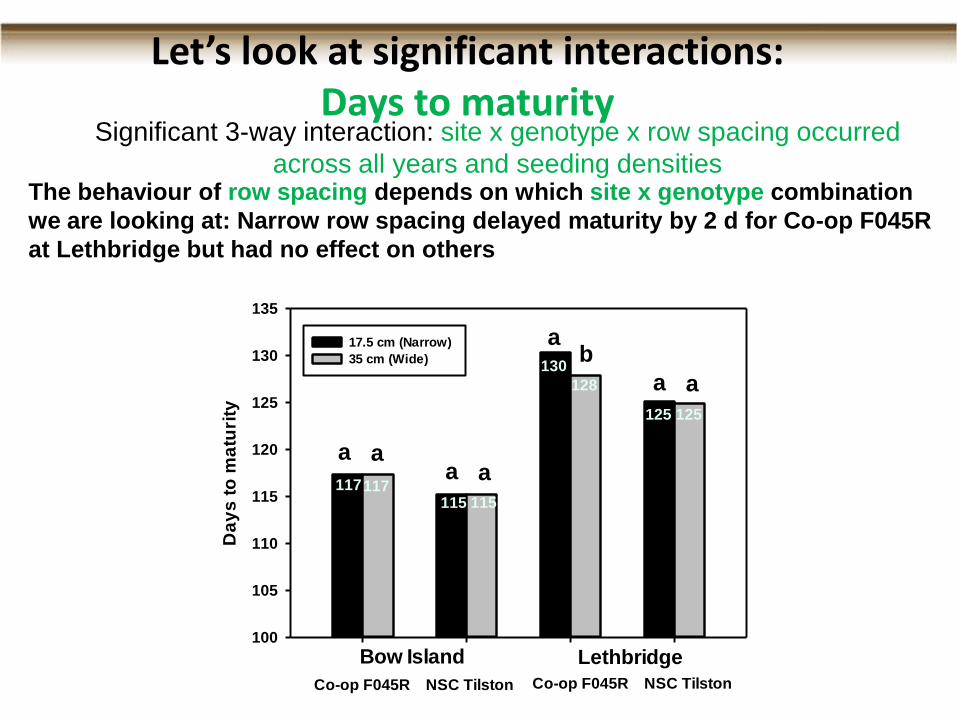
Let’s look at significant interactions: Days to maturity
Significant 3-way interaction: site x genotype x row spacing occurred
across all years and seeding densities The behaviour of row spacing depends on which site x genotype combination
we are looking at: Narrow row spacing delayed maturity by 2 d for Co-op F045R
at Lethbridge but had no effect on others D
ay
s t
o m
atu
rity
100
105
110
115
120
125
130
135
17.5 cm (Narrow)
35 cm (Wide)
Bow Island Lethbridge
Co-op F045R NSC Tilston Co-op F045R NSC Tilston
117117115 115
130
128
125 125
a aa a
a a
ab

Let’s look at significant interactions: Grain yield (kg ha-1)
Significant 2-way interaction: site x seeding density
Occurred across all years, genotypes, and row spacings
The behaviour of site depends on
which seeding density we are looking
at: yields just as good at Lethbridge
except at 30 seeds m2
Seeding density, seeds m2
20 30 40 50 60 70 80 90
Gra
in y
ield
, kg
ha
-1
2200
2400
2600
2800
3000
3200
Bow Island
Lethbridge
a
b
a
a
a
a

Let’s look at significant interactions: Grain yield (kg ha-1)
Significant 2-way interaction: site x seeding density
Occurred across all years, genotypes, and row spacings
The behaviour of seeding density
depends on which site we are looking
at: wider yield spread at Lethbridge
The behaviour of site depends on
which seeding density we are looking
at: yields just as good at Lethbridge
except at 30 seeds m2
Seeding density, seeds m2
20 30 40 50 60 70 80 90
Gra
in y
ield
, kg
ha
-1
2200
2400
2600
2800
3000
3200
Bow Island
Lethbridge
a
b
a
a
a
a
Gra
in y
ield
, k
g h
a-1
0
500
1000
1500
2000
2500
3000
350030 seeds m2
50
80
c
b
a
c
a
b
Bow Island Lethbridge
736 kg/ha
565 kg/ha
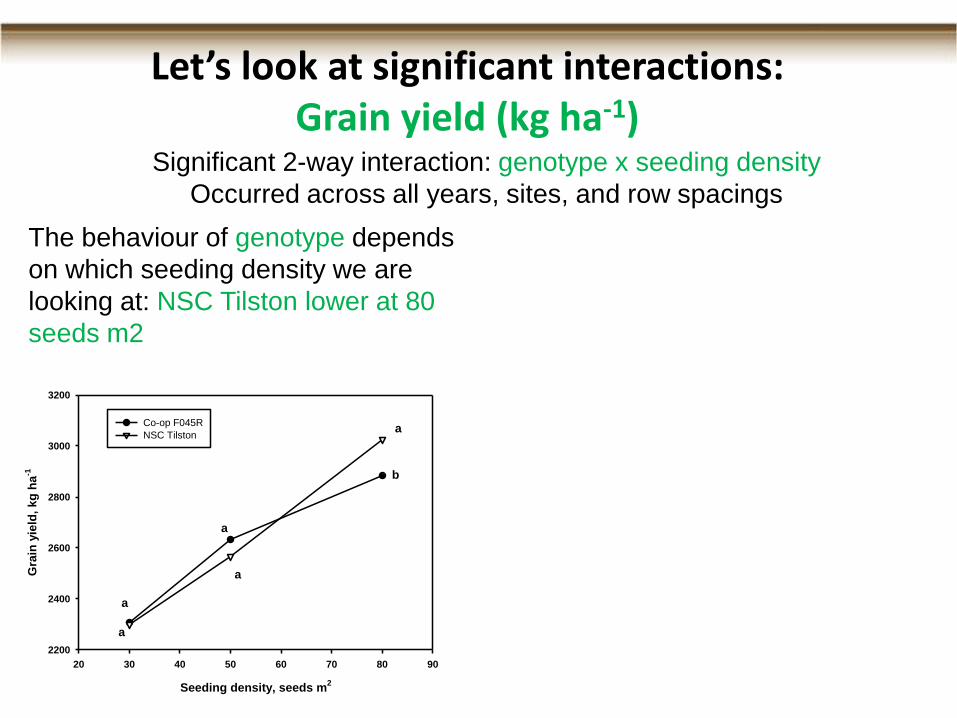
Let’s look at significant interactions: Grain yield (kg ha-1)
Significant 2-way interaction: genotype x seeding density
Occurred across all years, sites, and row spacings
The behaviour of genotype depends
on which seeding density we are
looking at: NSC Tilston lower at 80
seeds m2
Seeding density, seeds m2
20 30 40 50 60 70 80 90
Gra
in y
ield
, kg
ha
-1
2200
2400
2600
2800
3000
3200
Co-op F045R
NSC Tilston
a
a
a
a
a
b
Gra
in y
ield
, kg
ha
-1
0
500
1000
1500
2000
2500
3000
350030 seeds m2
50
80
c
b
a
c
a
b
Co-op F045R NSC Tilston
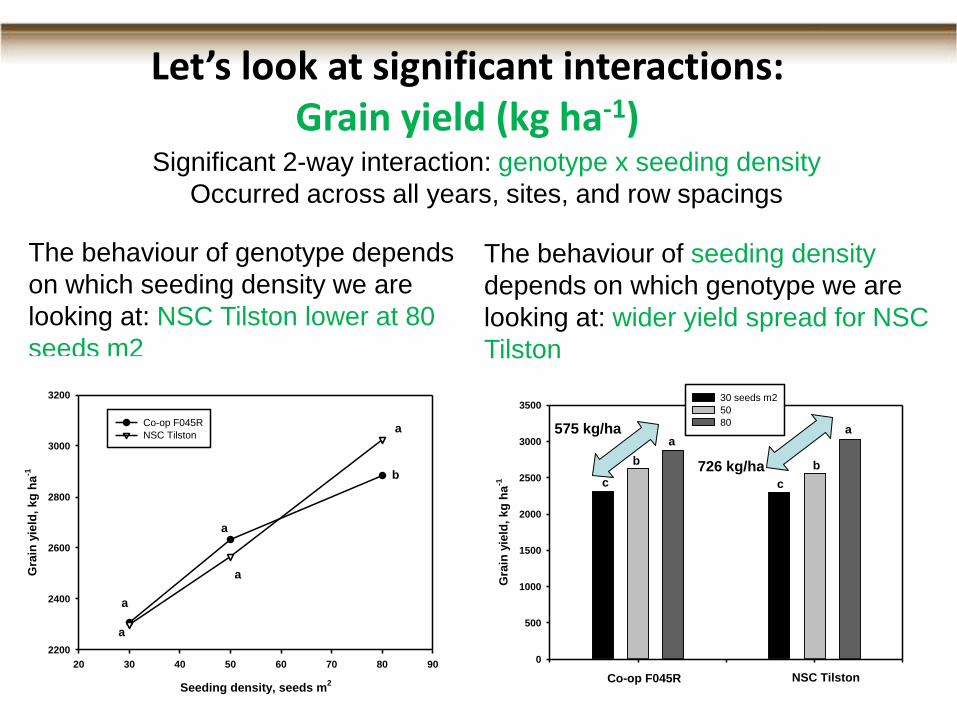
Let’s look at significant interactions: Grain yield (kg ha-1)
Significant 2-way interaction: genotype x seeding density
Occurred across all years, sites, and row spacings
The behaviour of genotype depends
on which seeding density we are
looking at: NSC Tilston lower at 80
seeds m2
The behaviour of seeding density
depends on which genotype we are
looking at: wider yield spread for NSC
Tilston
575 kg/ha
726 kg/ha
Seeding density, seeds m2
20 30 40 50 60 70 80 90
Gra
in y
ield
, kg
ha
-1
2200
2400
2600
2800
3000
3200
Co-op F045R
NSC Tilston
a
a
a
a
a
b

N Credit Estimates for Soybean vs. Dry Bean What is an N credit? Soybean and dry bean, being legumes, increase the overall
supply of soil N, via biological N fixation, so that less N fertilizer should be
required for following crops.
Year 1
Barley (non–legume)
Soybean (legume)
Dry bean (legume)
Zero N fertilizer
Year 2 (Reference crop)
Wheat
Wheat
Wheat
Six N rates:
0, 30, 60, 90, 120, 150 kg/ha

N rate, kg/ha
0 30 60 90 120 150 180
Wh
ea
t y
ield
, k
g/h
a
0
1000
2000
3000
4000
5000
After barley
Bow Island: Wheat yield N response in Year 2

N rate, kg/ha
0 30 60 90 120 150 180
Wh
ea
t y
ield
, k
g/h
a
0
1000
2000
3000
4000
5000
After barley
After soybean
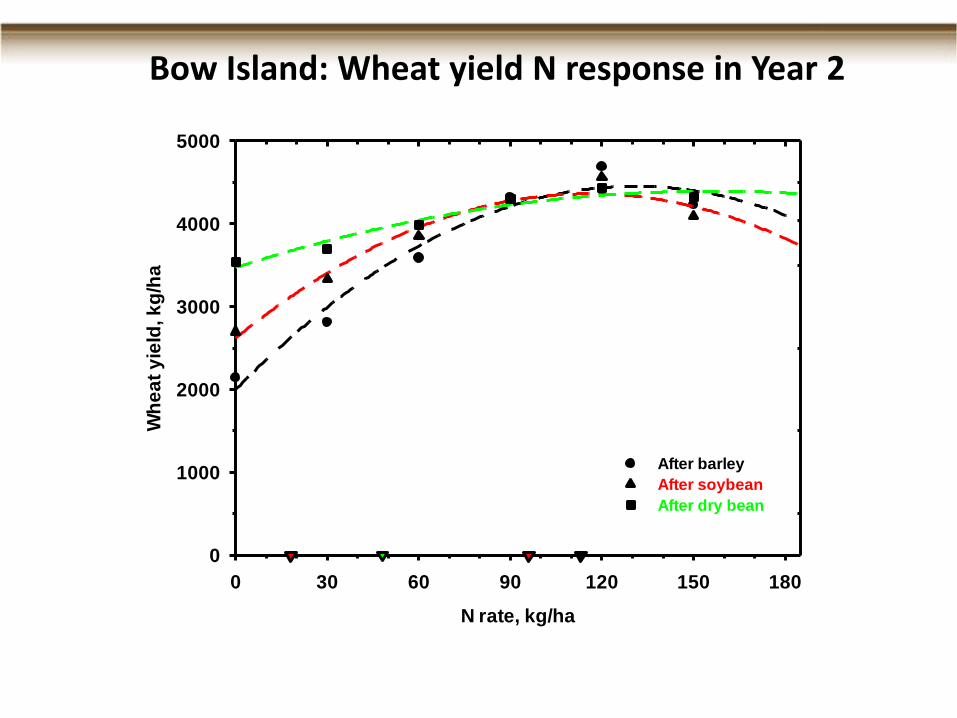
Bow Island: Wheat yield N response in Year 2
N rate, kg/ha
0 30 60 90 120 150 180
Wh
ea
t y
ield
, k
g/h
a
0
1000
2000
3000
4000
5000
After barley
After soybean
After dry bean
Bow Island: Wheat yield N response in Year 2

N rate, kg/ha
0 30 60 90 120 150 180
Wh
ea
t y
ield
, k
g/h
a
0
1000
2000
3000
4000
5000
After barley
After soybean
After dry bean
Estimating N credit – traditional method What N rate following barley produces a yield equivalent to the
unfertilized (0 N) wheat yield following soybean?

N rate, kg/ha
0 30 60 90 120 150 180
Wh
ea
t y
ield
, k
g/h
a
0
1000
2000
3000
4000
5000
After barley
After soybean
After dry bean
Estimating N credit – traditional method What N rate following barley produces a yield equivalent to the
unfertilized (0 N) wheat yield following soybean?
N rate, kg/ha
0 30 60 90 120 150 180
Wh
ea
t y
ield
, k
g/h
a
0
1000
2000
3000
4000
5000
After barley
After soybean
After dry bean
18
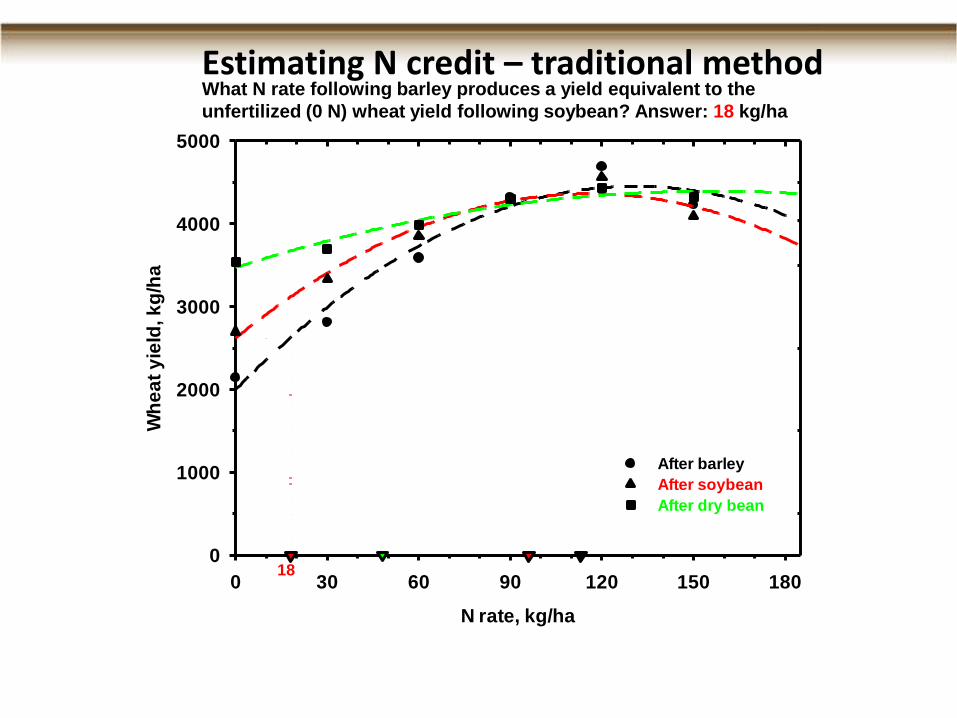
Estimating N credit – traditional method What N rate following barley produces a yield equivalent to the
unfertilized (0 N) wheat yield following soybean? Answer: 18 kg/ha

N rate, kg/ha
0 30 60 90 120 150 180
Wh
ea
t y
ield
, k
g/h
a
0
1000
2000
3000
4000
5000
After barley
After soybean
After dry bean
18
Estimating N credit – traditional method What N rate following barley produces a yield equivalent to the
unfertilized (0 N) wheat yield following dry bean?

N rate, kg/ha
0 30 60 90 120 150 180
Wh
ea
t y
ield
, k
g/h
a
0
1000
2000
3000
4000
5000
After barley
After soybean
After dry bean
18
Estimating N credit – traditional method What N rate following barley produces a yield equivalent to the
unfertilized (0 N) wheat yield following dry bean?

N rate, kg/ha
0 30 60 90 120 150 180
Wh
ea
t y
ield
, k
g/h
a
0
1000
2000
3000
4000
5000
After barley
After soybean
After dry bean
18 48
Estimating N credit – traditional method What N rate following barley produces a yield equivalent to the
unfertilized (0 N) wheat yield following dry bean? Answer: 48 kg/ha

N rate, kg/ha
0 30 60 90 120 150 180
Wh
ea
t y
ield
, k
g/h
a
0
1000
2000
3000
4000
5000
After barley
After soybean
After dry bean
18 48 113
Economic Optimum N Rate (EONR) = point where additional fertilizer N still
returns a sufficient barley yield increase to cover the extra fertilizer cost
Estimating N credit – difference method

N rate, kg/ha
0 30 60 90 120 150 180
Wh
ea
t y
ield
, k
g/h
a
0
1000
2000
3000
4000
5000
After barley
After soybean
After dry bean
18 48 113
Estimating N credit – difference method Economic Optimum N Rate (EONR) = point where additional fertilizer N still
returns a sufficient barley yield increase to cover the extra fertilizer cost

N rate, kg/ha
0 30 60 90 120 150 180
Wh
ea
t y
ield
, k
g/h
a
0
1000
2000
3000
4000
5000
After barley
After soybean
After dry bean
4407
18 48 96 113
Estimating N credit – difference method Economic Optimum N Rate (EONR) = point where additional fertilizer N still
returns a sufficient soybean yield increase to cover the extra fertilizer cost

N rate, kg/ha
0 30 60 90 120 150 180
Wh
ea
t y
ield
, k
g/h
a
0
1000
2000
3000
4000
5000
After barley
After soybean
After dry bean
4407
18 48 96 113
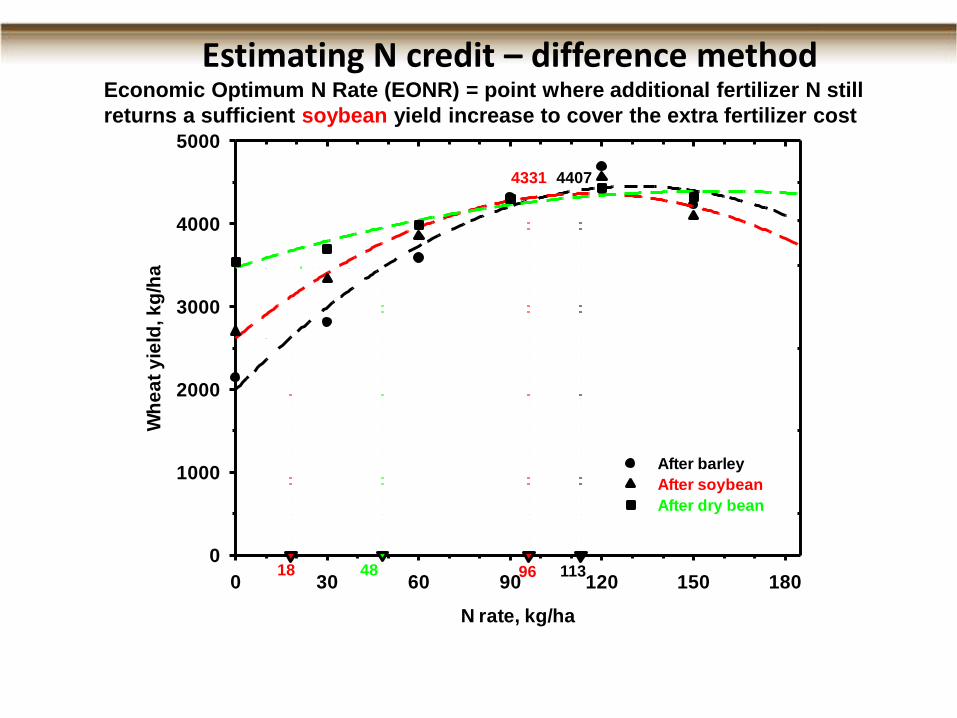
Estimating N credit – difference method Economic Optimum N Rate (EONR) = point where additional fertilizer N still
returns a sufficient soybean yield increase to cover the extra fertilizer cost
N rate, kg/ha
0 30 60 90 120 150 180
Wh
ea
t y
ield
, k
g/h
a
0
1000
2000
3000
4000
5000
After barley
After soybean
After dry bean
4407 4331
18 48 96 113
Estimating N credit – difference method Economic Optimum N Rate (EONR) = point where additional fertilizer N still
returns a sufficient soybean yield increase to cover the extra fertilizer cost

N rate, kg/ha
0 30 60 90 120 150 180
Wh
ea
t y
ield
, k
g/h
a
0
1000
2000
3000
4000
5000
After barley
After soybean
After dry bean
4407 4331
18 48 96 90
113
Estimating N credit – difference method Economic Optimum N Rate (EONR) = point where additional fertilizer N still
returns a sufficient dry bean yield increase to cover the extra fertilizer cost

N rate, kg/ha
0 30 60 90 120 150 180
Wh
eat
yie
ld,
kg
/ha
0
1000
2000
3000
4000
5000
After barley
After soybean
After dry bean
4407 4331 4229
18 48 96 90
113
Estimating N credit – difference method Economic Optimum N Rate (EONR) = point where additional fertilizer N still
returns a sufficient dry bean yield increase to cover the extra fertilizer cost
N rate, kg/ha
0 30 60 90 120 150 180
Wh
eat
yie
ld,
kg
/ha
0
1000
2000
3000
4000
5000
After barley
After soybean
After dry bean
4407 4331 4229
18 48 96 90
113
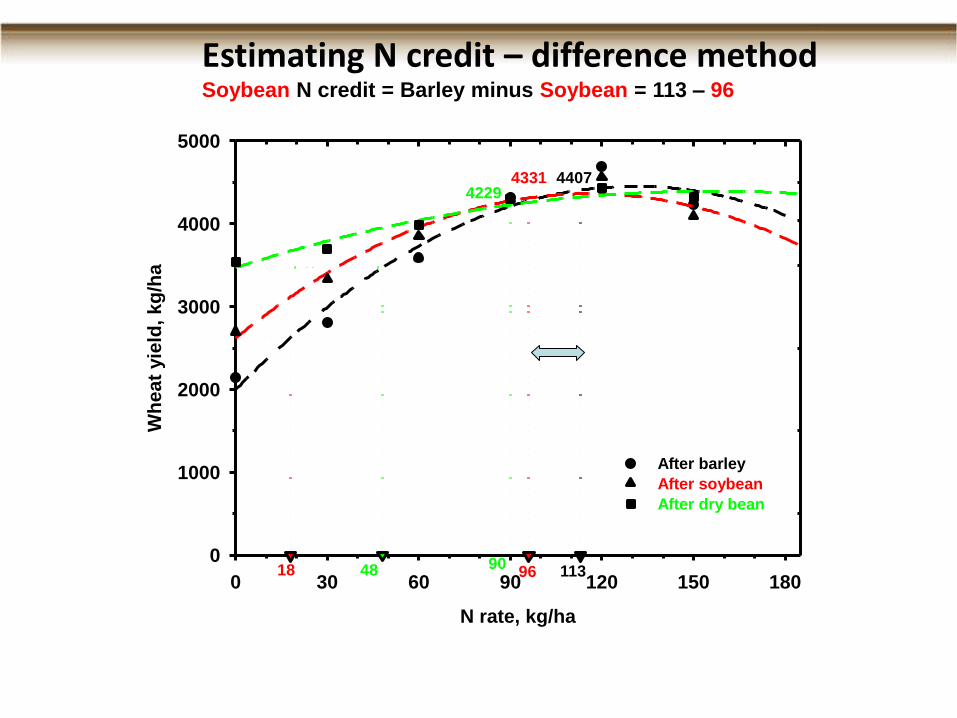
Estimating N credit – difference method Soybean N credit = Barley minus Soybean = 113 – 96

N rate, kg/ha
0 30 60 90 120 150 180
Wh
eat
yie
ld,
kg
/ha
0
1000
2000
3000
4000
5000
After barley
After soybean
After dry bean
4407 4331 4229
17
18 48 96 90
113
Estimating N credit – difference method Soybean N credit = Barley minus Soybean = 113 – 96 = 17

N rate, kg/ha
0 30 60 90 120 150 180
Wh
eat
yie
ld,
kg
/ha
0
1000
2000
3000
4000
5000
After barley
After soybean
After dry bean
4407 4331 4229
17
18 48 96 90
113
Estimating N credit – difference method Dry bean N credit = Barley minus Dry bean = 113 – 90 =

N rate, kg/ha
0 30 60 90 120 150 180
Wh
eat
yie
ld,
kg
/ha
0
1000
2000
3000
4000
5000
After barley
After soybean
After dry bean
4407 4331 4229
17
23
18 48 96 90
113
Estimating N credit – difference method Dry bean N credit = Barley minus Dry bean = 113 – 90 = 23

Soybean Dry bean
Traditional method
Bow Island 18
Lethbridge 25
Mean 23
N credit (kg/ha) comparison: soybean vs. dry bean

Soybean Dry bean
Traditional method
Bow Island 18 48
Lethbridge 25 48
Mean 23 48
N credit (kg/ha) comparison: soybean vs. dry bean

Soybean Dry bean
Traditional method
Bow Island 18 48
Lethbridge 25 48
Mean 23 48
Difference method (Economic Optimum N Rate, EONR)
Bow Island 17
Lethbridge 16
Mean 17
N credit (kg/ha) comparison: soybean vs. dry bean

Soybean Dry bean
Traditional method
Bow Island 18 48
Lethbridge 25 48
Mean 23 48
Difference method (Economic Optimum N Rate, EONR)
Bow Island 17 23
Lethbridge 16 65
Mean 17 44
N credit (kg/ha) comparison: soybean vs. dry bean

Soybean Dry bean
Traditional method
Bow Island 18 48
Lethbridge 25 48
Mean 23 48
Difference method (Economic Optimum N Rate, EONR)
Bow Island 17 23
Lethbridge 16 65
Mean 17 44
N credit (kg/ha) comparison: soybean vs. dry bean
Dry bean results in an N credit 2 to 2.5 times
greater than soybean


AAFC-Lethbridge: Tony Curtis, Kyle Shade, Newton
Lupwayi, Brett Hill
AF, Lethbridge: Allan Middleton, Pat Pfiffner, Chris
Hietamaa, Colin Enns, Darryle Thiessen,
AF, Brooks: Art Kruger
ACKNOWLEDGEMENTS