Rutmanee Ongsakul (AIT/CPWF-Mekong) Sonali Senaratna Sellamuttu (IWMI/CPWF-Mekong)

STATISTICAL TABLES 27
Statistical TablesEconomic and social statistics on the countries and areas of the world, with particular reference to children’s well-being.
Overview ................................................................................................................ 28
General note on the data ...................................................................................... 28
Child mortality estimates ...................................................................................... 29
Under-five mortality rankings ............................................................................... 30
Regional classification ........................................................................................... 32
Notes on specific tables ........................................................................................ 33
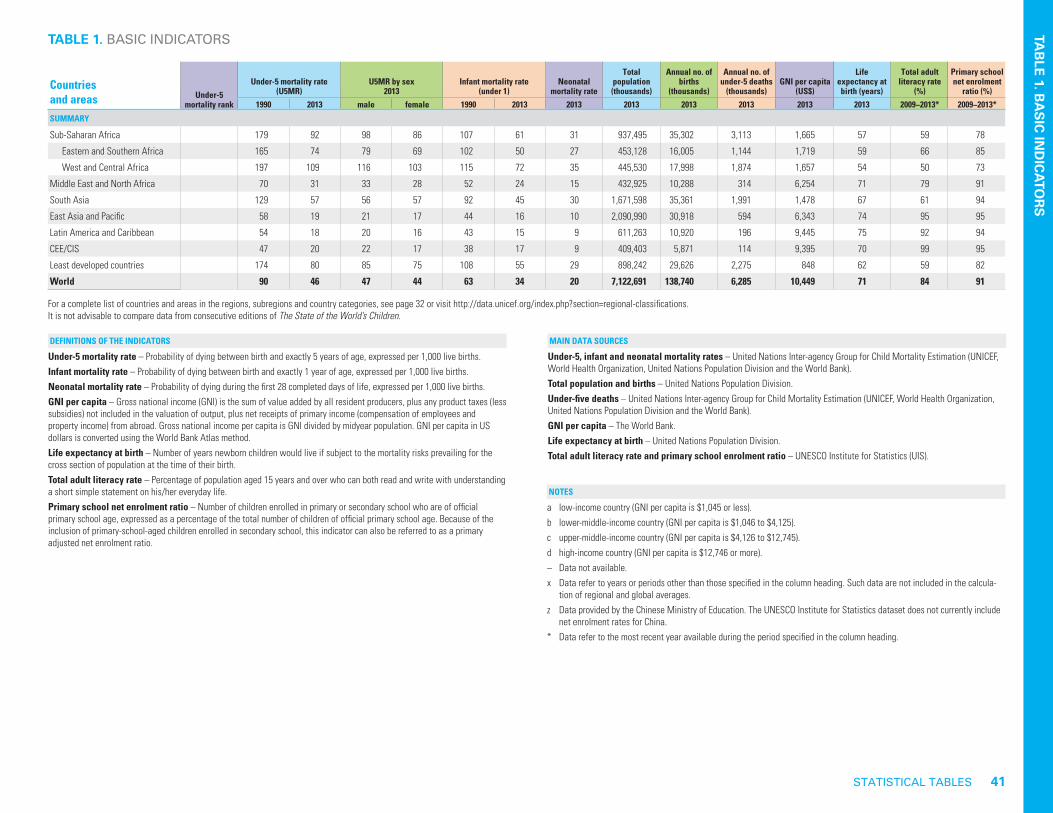
TABLES 1 Basic indicators ............................................................................................. 36
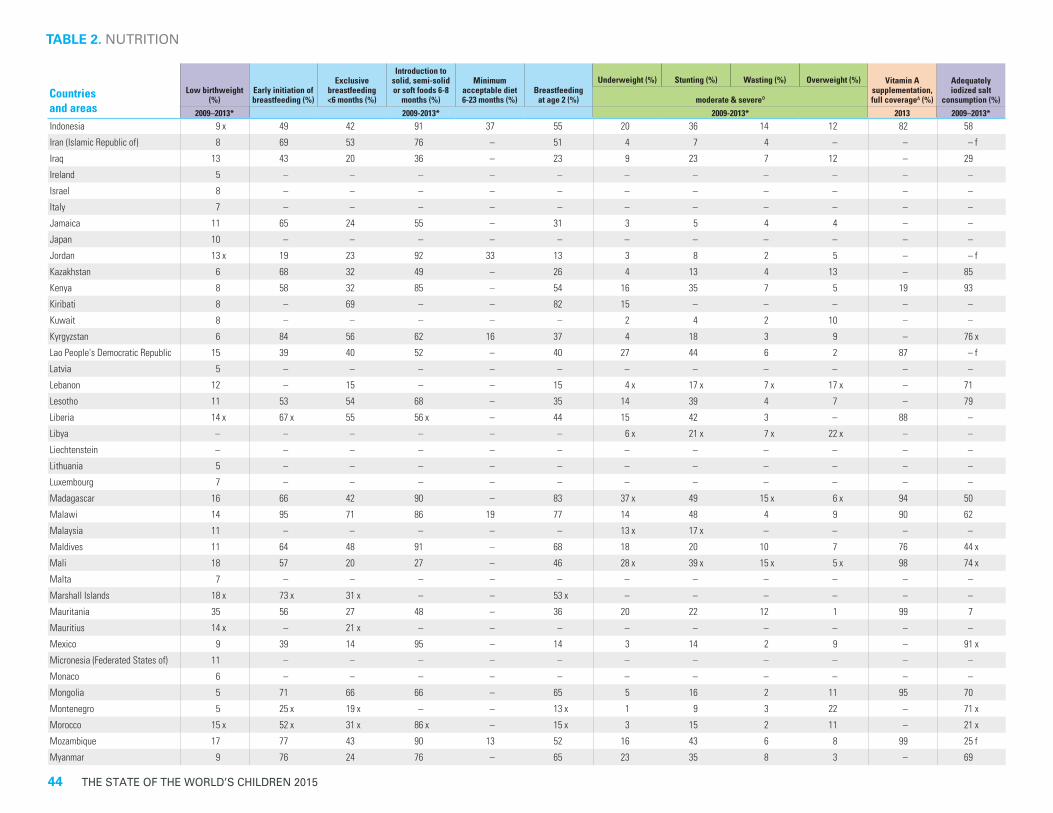
2 Nutrition ......................................................................................................... 42
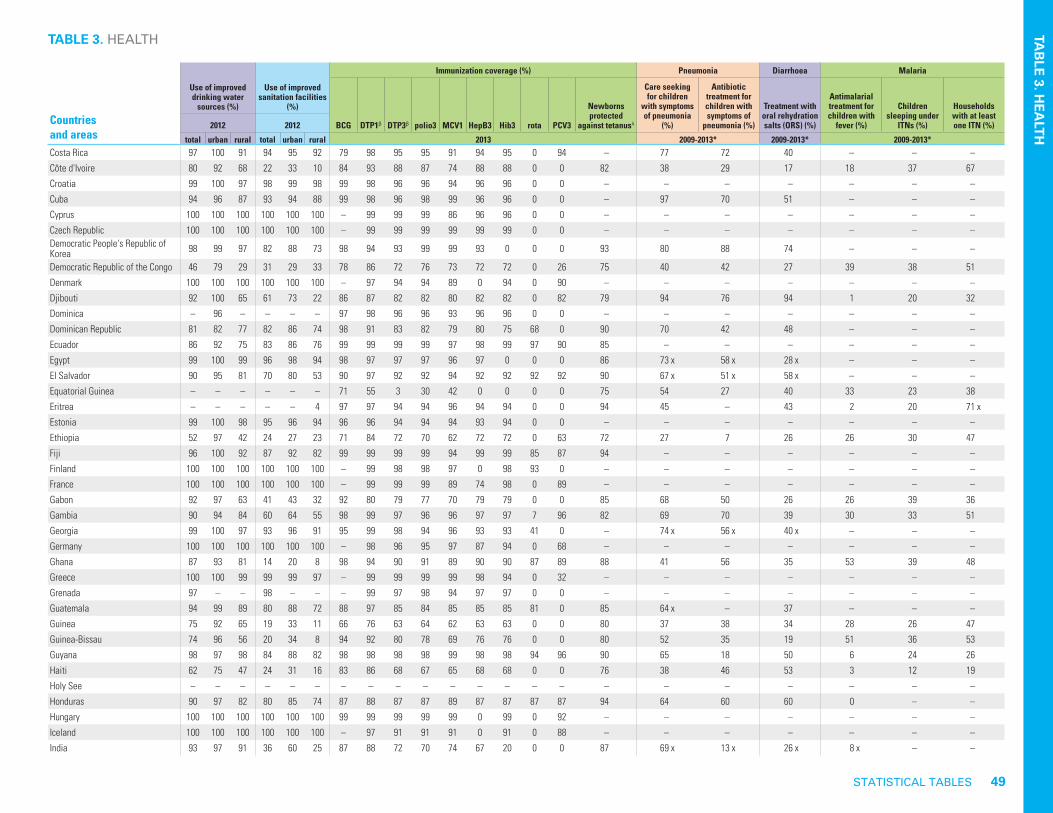
3 Health ............................................................................................................. 48
4 HIV/AIDS ........................................................................................................ 54
5 Education ....................................................................................................... 60
6 Demographic indicators ............................................................................... 66
7 Economic indicators ..................................................................................... 72
8 Women ........................................................................................................... 78
9 Child protection ............................................................................................. 84
10 The rate of progress ..................................................................................... 90
11 Adolescents ................................................................................................... 96
12 Disparities by residence ..............................................................................102
13 Disparities by household wealth ................................................................108
14 Early childhood development ..................................................................... 114
STATIS
TICA
L TAB
LES
Explanation of symbols The following symbols are common across all tables:
– Data are not available. x Data refer to years or periods other than those specified in the column heading. Such
data are not included in the calculation of regional and global averages, unless otherwise noted.
y Data differ from the standard definition or refer to only part of a country. If they fall within the noted reference period, such data are included in the calculation of regional and global averages.
* Data refer to the most recent year available during the period specified in the column heading.
** Excludes China.
Sources and years for specific data points are available at <data.unicef.org>. Symbols that appear in specific tables are explained in the footnotes to those tables.
28 THE STATE OF THE WORLD’S CHILDREN 2015
OverviewThis reference guide presents the most recent key statistics on child survival, development and protection for the world’s countries, areas and regions.
The statistical tables in this volume support UNICEF’s focus on progress and results towards internationally agreed-upon goals and compacts relating to children’s rights and development.
UNICEF is the lead agency responsible for monitoring the child-related goals of the Millennium Declaration as well as the Millennium Development Goals (MDGs) and indicators. UNICEF is also a key partner in the United Nations’ work on monitoring these targets and indicators.
Efforts have been made to maximize the comparability of statistics across countries and over time. Nevertheless, data used at the country level may differ in terms of the methods used to collect data or arrive at estimates, and in terms of the populations covered. Furthermore, data presented here are subject to evolving methodologies, revisions of time series data (e.g., immunization, maternal mortality ratios) and changing regional classifications. Also, data comparable from one year to the next are unavailable for some indicators. It is therefore not advisable to compare data from consecutive editions of The State of the World’s Children.
The numbers presented in this reference guide are available online at <www.unicef.org/sowc2015> and via the UNICEF global statistical databases at <data.unicef.org>. Please refer to these websites for the latest tables and for any updates or corrigenda subsequent to printing.
General note on the dataData presented in the following statistical tables are derived from the UNICEF global databases and are accompanied by definitions, sources and, where necessary, additional footnotes. The tables draw on inter-agency estimates and nationally repre-sentative household surveys such as Multiple Indicator Cluster Surveys (MICS) and Demographic and Health Surveys (DHS). In addition, data from administrative sources and other United Nations organizations have been used.
Data presented in this year’s statistical tables generally reflect information available as of August 2014. Given the time nec-essary to collect, analyze and report nationally representative data, the data presented in the tables may not always reflect the current situation. This is especially the case in countries and areas recently experiencing crises, where the situation of chil-dren and women can deteriorate rapidly. More detailed infor-mation on methodology and data sources is available at <data.unicef.org>.
This volume includes the latest population estimates and pro-jections from World Population Prospects: The 2012 revision and World Urbanization Prospects: The 2014 revision (United Nations Department of Economic and Social Affairs, Popula-tion Division). Data quality is likely to be adversely affected for countries that have recently suffered disasters, especially where basic country infrastructure has been fragmented or where major population movements have occurred.
Multiple Indicator Cluster Surveys (MICS): UNICEF assists countries in collecting and analyzing data in order to fill data gaps for monitoring the situation of children and women through its international household survey initiative, the Multiple Indicator Cluster Surveys (MICS). Since 1995, about 250 surveys have been completed in more than 100 countries and areas. The fifth round of MICS, involving more than 45 surveys to date, is under way.
MICS are among the largest sources of data for monitoring progress towards internationally agreed-upon development goals for children, including the MDGs. More information is available at <data.unicef.org>.

STATISTICAL TABLES 29
STATIS
TICA
L TAB
LES
Child mortality estimatesEach year, in The State of the World’s Children, UNICEF reports a series of mortality estimates for children – including the annual neonatal mortality rate, infant mortality rate, the under-five mortality rate (total, male and female) and the number of under-five deaths – for at least two reference years. These figures represent the best estimates available at the time of printing and are based on the work of the United Nations Inter-agency Group for Child Mortality Estimation (IGME), which includes UNICEF, the World Health Organization (WHO), the World Bank and the United Nations Population Division. IGME mortality estimates are updated annually through a detailed review of all newly available data points, which often results in adjustments to previously reported estimates. As a result, consecutive editions of The State of the World’s Children should not be used for analysing mortality trends over time. Comparable global and regional under-five mortality estimates for the period 1970–2013 are presented on page 90–95. Country-specific mortality indicators for 1970–2013, based on the most recent IGME estimates, are presented in Table 10 (for the years 1970, 1990, 2000 and 2013) and are available at <data.unicef.org/child-mortality/under-five> and <www.childmortality.org>.
Under-five mortality rate (per 1,000 live births)
UNICEF Region 1970 1975 1980 1985 1990 1995 2000 2005 2010 2013
Sub-Saharan Africa 246 219 201 187 179 172 156 129 103 92
Eastern and Southern Africa 212 193 188 174 165 157 140 112 85 74
West and Central Africa 279 249 220 205 197 190 175 149 122 109
Middle East and North Africa 205 165 126 90 70 60 50 42 34 31
South Asia 213 195 171 149 129 112 94 77 64 57
East Asia and Pacific 117 94 76 63 58 51 41 30 23 19
Latin America and Caribbean 119 102 84 68 54 43 32 25 23 18
CEE/CIS 97 74 69 56 47 48 37 29 22 20
Least developed countries 243 230 211 190 174 158 139 113 91 80
World 147 129 117 100 90 85 76 63 51 46
Under-five deaths (millions)
UNICEF Region 1970 1975 1980 1985 1990 1995 2000 2005 2010 2013
Sub-Saharan Africa 3.2 3.2 3.4 3.6 3.8 4.0 4.1 3.8 3.3 3.1
Eastern and Southern Africa 1.3 1.4 1.5 1.6 1.7 1.7 1.8 1.5 1.3 1.1
West and Central Africa 1.7 1.8 1.8 1.9 2.0 2.2 2.2 2.1 2.0 1.9
Middle East and North Africa 1.3 1.1 1.0 0.8 0.6 0.5 0.4 0.4 0.3 0.3
South Asia 5.9 5.7 5.6 5.1 4.7 4.0 3.5 2.8 2.2 2.0
East Asia and Pacific 4.8 3.6 2.4 2.5 2.5 1.6 1.2 0.9 0.7 0.6
Latin America and Caribbean 1.2 1.1 1.0 0.8 0.6 0.5 0.4 0.3 0.2 0.2
CEE/CIS 0.6 0.5 0.5 0.4 0.4 0.3 0.2 0.2 0.1 0.1
Least developed countries 3.3 3.5 3.6 3.6 3.6 3.5 3.4 2.9 2.5 2.3
World 17.3 15.5 13.9 13.3 12.7 10.9 9.7 8.2 6.9 6.3

30 THE STATE OF THE WORLD’S CHILDREN 2015
Angola 167 1Sierra Leone 161 2Chad 148 3Somalia 146 4Central African Republic 139 5Guinea-Bissau 124 6Mali 123 7Democratic Republic of the Congo 119 8Nigeria 117 9Niger 104 10Guinea 101 11Côte d'Ivoire 100 12South Sudan 99 13Burkina Faso 98 14Lesotho 98 14Afghanistan 97 16Equatorial Guinea 96 17Cameroon 95 18Mauritania 90 19Zimbabwe 89 20Mozambique 87 21Zambia 87 21Pakistan 86 23Benin 85 24Togo 85 24Burundi 83 26Swaziland 80 27Comoros 78 28Ghana 78 28Sudan 77 30Gambia 74 31Haiti 73 32Kenya 71 33Lao People's Democratic Republic 71 33
UNDER-FIVE MORTALITY RANKINGSThe following list ranks countries and areas in descending order of their estimated 2013 under-five mortality rate (U5MR), a critical indicator of the well-being of children. Countries and areas are listed alphabetically in the tables on the following pages.
Countries and areas
Under-5 mortality rate (2013)
Value Rank
HIGHEST UNDER-5 MORTALITY RATE
Liberia 71 33Djibouti 70 36Malawi 68 37Uganda 66 38Ethiopia 64 39Papua New Guinea 61 40Kiribati 58 41Gabon 56 42Madagascar 56 42Senegal 55 44Timor-Leste 55 44Turkmenistan 55 44India 53 47Rwanda 52 48United Republic of Tanzania 52 48Myanmar 51 50Sao Tome and Principe 51 50Yemen 51 50Eritrea 50 53Namibia 50 53Congo 49 55Tajikistan 48 56Botswana 47 57South Africa 44 58Uzbekistan 43 59Bangladesh 41 60Nepal 40 61Bolivia (Plurinational State of) 39 62Cambodia 38 63Marshall Islands 38 63Guyana 37 65Nauru 37 65Bhutan 36 67Micronesia (Federated States of) 36 67Azerbaijan 34 69
Iraq 34 69Mongolia 32 71Guatemala 31 72Morocco 30 73Philippines 30 73Solomon Islands 30 73Indonesia 29 76Tuvalu 29 76Dominican Republic 28 78Democratic People's Republic of Korea 27 79Cabo Verde 26 80Algeria 25 81Niue 25 81Fiji 24 83Kyrgyzstan 24 83Nicaragua 24 83Viet Nam 24 83Ecuador 23 87Suriname 23 87Egypt 22 89Honduras 22 89Paraguay 22 89State of Palestine 22 89Trinidad and Tobago 21 93Jordan 19 94Saint Vincent and the Grenadines 19 94Turkey 19 94Palau 18 97Panama 18 97Samoa 18 97Belize 17 100Colombia 17 100Iran (Islamic Republic of) 17 100Jamaica 17 100Peru 17 100
Countries and areas
Under-5 mortality rate (2013)
Value Rank Countries and areas
Under-5 mortality rate (2013)
Value Rank

STATISTICAL TABLES 31
STATIS
TICA
L TAB
LES
Vanuatu 17 100Armenia 16 106El Salvador 16 106Kazakhstan 16 106Saudi Arabia 16 106Albania 15 110Libya 15 110Mexico 15 110Republic of Moldova 15 110Saint Lucia 15 110Syrian Arab Republic 15 110Tunisia 15 110Venezuela (Bolivarian Republic of) 15 110Barbados 14 118Brazil 14 118Mauritius 14 118Seychelles 14 118Argentina 13 122Bahamas 13 122China 13 122Georgia 13 122Thailand 13 122Bulgaria 12 127Grenada 12 127Romania 12 127Tonga 12 127Dominica 11 131Oman 11 131Uruguay 11 131Brunei Darussalam 10 134Costa Rica 10 134Kuwait 10 134Maldives 10 134Russian Federation 10 134Saint Kitts and Nevis 10 134
Sri Lanka 10 134Ukraine 10 134Antigua and Barbuda 9 142Cook Islands 9 142Lebanon 9 142Malaysia 9 142Chile 8 146Latvia 8 146Qatar 8 146United Arab Emirates 8 146Bosnia and Herzegovina 7 150Serbia 7 150Slovakia 7 150The former Yugoslav Republic of Mace-donia
7 150
United States 7 150Bahrain 6 155Cuba 6 155Hungary 6 155Malta 6 155New Zealand 6 155Belarus 5 160Canada 5 160Croatia 5 160Lithuania 5 160Montenegro 5 160Poland 5 160United Kingdom 5 160Australia 4 167Austria 4 167Belgium 4 167Cyprus 4 167Czech Republic 4 167Denmark 4 167France 4 167
Germany 4 167Greece 4 167Ireland 4 167Israel 4 167Italy 4 167Monaco 4 167Netherlands 4 167Portugal 4 167Republic of Korea 4 167Spain 4 167Switzerland 4 167Andorra 3 185Estonia 3 185Finland 3 185Japan 3 185Norway 3 185San Marino 3 185Singapore 3 185Slovenia 3 185Sweden 3 185Iceland 2 194Luxembourg 2 194Holy See - -Liechtenstein - -
Countries and areas
Under-5 mortality rate (2013)
Value Rank Countries and areas
Under-5 mortality rate (2013)
Value Rank Countries and areas
Under-5 mortality rate (2013)
Value Rank
LOWEST UNDER-5 MORTALITY RATE
ABOUT 17,000 CHILDREN UNDER FIVE YEARS OLD STILL DIE EVERY DAY.
32 THE STATE OF THE WORLD’S CHILDREN 2015
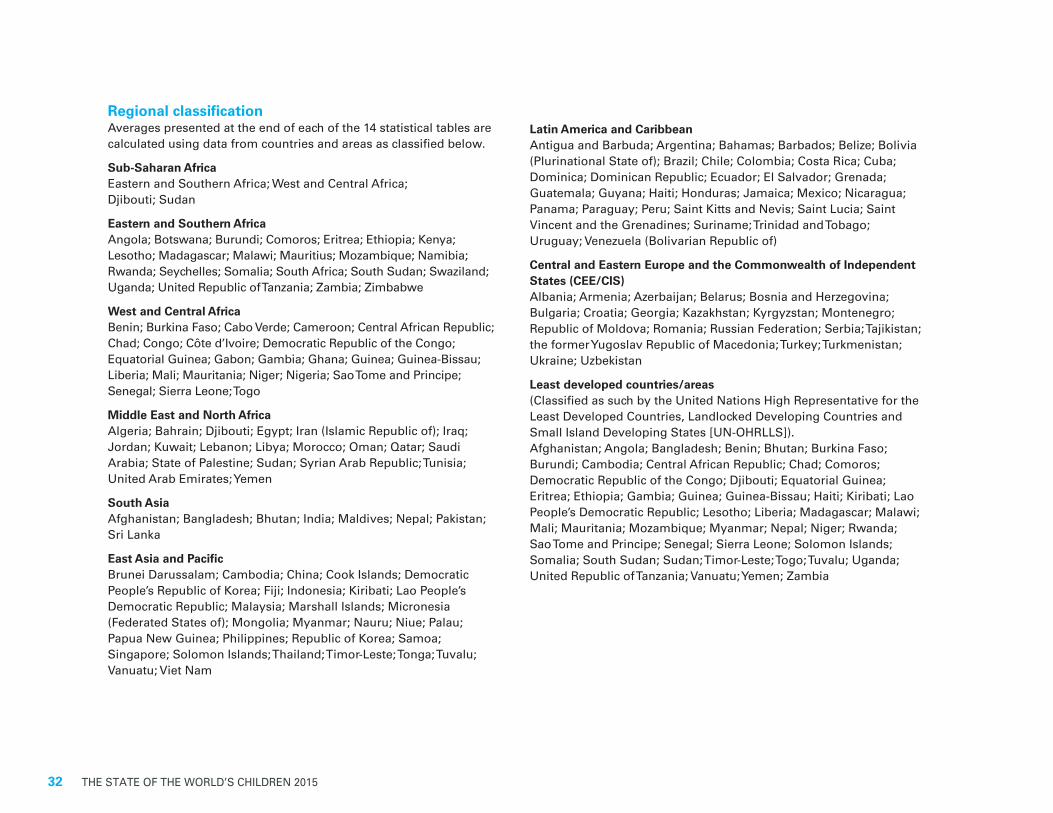
Regional classificationAverages presented at the end of each of the 14 statistical tables are calculated using data from countries and areas as classified below.
Sub-Saharan AfricaEastern and Southern Africa; West and Central Africa; Djibouti; Sudan
Eastern and Southern AfricaAngola; Botswana; Burundi; Comoros; Eritrea; Ethiopia; Kenya; Lesotho; Madagascar; Malawi; Mauritius; Mozambique; Namibia; Rwanda; Seychelles; Somalia; South Africa; South Sudan; Swaziland; Uganda; United Republic of Tanzania; Zambia; Zimbabwe
West and Central AfricaBenin; Burkina Faso; Cabo Verde; Cameroon; Central African Republic; Chad; Congo; Côte d’Ivoire; Democratic Republic of the Congo; Equatorial Guinea; Gabon; Gambia; Ghana; Guinea; Guinea-Bissau; Liberia; Mali; Mauritania; Niger; Nigeria; Sao Tome and Principe; Senegal; Sierra Leone; Togo
Middle East and North AfricaAlgeria; Bahrain; Djibouti; Egypt; Iran (Islamic Republic of); Iraq; Jordan; Kuwait; Lebanon; Libya; Morocco; Oman; Qatar; Saudi Arabia; State of Palestine; Sudan; Syrian Arab Republic; Tunisia; United Arab Emirates; Yemen
South AsiaAfghanistan; Bangladesh; Bhutan; India; Maldives; Nepal; Pakistan; Sri Lanka
East Asia and PacificBrunei Darussalam; Cambodia; China; Cook Islands; Democratic People’s Republic of Korea; Fiji; Indonesia; Kiribati; Lao People’s Democratic Republic; Malaysia; Marshall Islands; Micronesia (Federated States of); Mongolia; Myanmar; Nauru; Niue; Palau; Papua New Guinea; Philippines; Republic of Korea; Samoa; Singapore; Solomon Islands; Thailand; Timor-Leste; Tonga; Tuvalu; Vanuatu; Viet Nam
Latin America and CaribbeanAntigua and Barbuda; Argentina; Bahamas; Barbados; Belize; Bolivia (Plurinational State of); Brazil; Chile; Colombia; Costa Rica; Cuba; Dominica; Dominican Republic; Ecuador; El Salvador; Grenada; Guatemala; Guyana; Haiti; Honduras; Jamaica; Mexico; Nicaragua; Panama; Paraguay; Peru; Saint Kitts and Nevis; Saint Lucia; Saint Vincent and the Grenadines; Suriname; Trinidad and Tobago; Uruguay; Venezuela (Bolivarian Republic of)
Central and Eastern Europe and the Commonwealth of Independent States (CEE/CIS)Albania; Armenia; Azerbaijan; Belarus; Bosnia and Herzegovina; Bulgaria; Croatia; Georgia; Kazakhstan; Kyrgyzstan; Montenegro; Republic of Moldova; Romania; Russian Federation; Serbia; Tajikistan; the former Yugoslav Republic of Macedonia; Turkey; Turkmenistan; Ukraine; Uzbekistan
Least developed countries/areas(Classified as such by the United Nations High Representative for the Least Developed Countries, Landlocked Developing Countries and Small Island Developing States [UN-OHRLLS]). Afghanistan; Angola; Bangladesh; Benin; Bhutan; Burkina Faso; Burundi; Cambodia; Central African Republic; Chad; Comoros; Democratic Republic of the Congo; Djibouti; Equatorial Guinea; Eritrea; Ethiopia; Gambia; Guinea; Guinea-Bissau; Haiti; Kiribati; Lao People’s Democratic Republic; Lesotho; Liberia; Madagascar; Malawi; Mali; Mauritania; Mozambique; Myanmar; Nepal; Niger; Rwanda; Sao Tome and Principe; Senegal; Sierra Leone; Solomon Islands; Somalia; South Sudan; Sudan; Timor-Leste; Togo; Tuvalu; Uganda; United Republic of Tanzania; Vanuatu; Yemen; Zambia

STATISTICAL TABLES 33
STATIS
TICA
L TAB
LES
Notes on specific tablesTABLE 2. NUTRITIONUnderweight, stunting, wasting and overweight: UNICEF, WHO and the World Bank have continued a process to harmonize anthropo-metric data used for computation and estimation of regional and global averages and trend analysis. As part of this process, regional and global averages for underweight, stunting, wasting and over-weight prevalences are derived from a model described in M. de Onis et al., ‘Methodology for Estimating Regional and Global Trends of Child Malnutrition’ (International Journal of Epidemiology, vol. 33, 2004, pp. 1260–1270). Owing to differences in data sources (i.e., new empirical data are incorporated as made available) and estimation methodology, these regional average prevalence estimates may not be comparable to the averages published in previous editions of The State of the World’s Children.
Vitamin A supplementation: Emphasizing the importance for chil-dren of receiving two annual doses of vitamin A (spaced 4–6 months apart), this report presents only full coverage of vitamin A supple-mentation. In the absence of a direct method to measure this indi-cator, full coverage is reported as the lower coverage estimate from semesters 1 and 2 in a given year.
TABLE 3. HEALTHWater and sanitation: The drinking water and sanitation coverage es-timates in this report come from the WHO/UNICEF Joint Monitoring Programme for Water Supply and Sanitation (JMP). These are the official United Nations estimates for measuring progress towards the MDG target for drinking water and sanitation. Full details of the JMP methodology can be found at <data.unicef.org> and <www.wssinfo.org>. As the JMP estimates use linear regression applied to data from household surveys and censuses, and additional data become available between each issue of estimates, successive JMP estimates should not be compared.
Immunization: This report presents WHO and UNICEF estimates of national immunization coverage. These are official United Nations estimates for measuring progress towards the MDG indicator for measles-containing vaccine coverage. Since 2000, the estimates are updated once annually in July, following a consultation
process wherein countries are provided draft reports for review and comment. As the system incorporates new empirical data, each annual revision supersedes prior data releases, and coverage levels from earlier revisions are not comparable. A more detailed explanation of the process can be found at <data.unicef.org/child-health/immunization>.
Regional averages for the six reported antigens are computed as follows:• For BCG, regional averages include only those countries where
BCG is included in the national routine immunization schedule. • For DPT, polio, measles, HepB, Hib, PCV and rotavirus vaccines,
regional averages include all countries, as these vaccines are universally recommended by WHO.
• For protection at birth (PAB) from tetanus, regional averages include only the countries where maternal and neonatal tetanus is endemic.
TABLE 4. HIV/AIDSIn 2013, the Joint United Nations Programme on HIV/AIDS (UNAIDS) released new global, regional and country-level HIV and AIDS esti-mates for 2012 that reflect key changes in WHO HIV treatment guide-lines for adults and children and for prevention of mother-to-child transmission of HIV, in addition to improvements in assumptions of the probability of HIV transmission from mother to child and net sur-vival rates for infected children. Furthermore, there are also more reli-able data available from population-based surveys, expanded national sentinel surveillance systems and programme service statistics in a number of countries. Based on the refined methodology, UNAIDS has retrospectively generated new estimates of HIV prevalence, the num-ber of people living with HIV and those needing treatment, AIDS-re-lated deaths, new HIV infections and the number of children whose parents have died due to all causes including AIDS for past years. Only new estimates should be used for trend analysis. The new HIV and AIDS estimates included in this table are also published in the UNAIDS Report on the Global AIDS Epidemic, 2013. Overall, the global and regional figures published in The State of the World’s Children

34 THE STATE OF THE WORLD’S CHILDREN 2015
2014 In Numbers are not comparable to estimates previously pub-lished. More information on HIV and AIDS estimates, methodology and updates can be found at <www.unaids.org>.
Tested for HIV in the last 12 months and received results has been added to Table 4 beginning in this edition in response to increasing demand. This critical indicator is defined as “the percentage of young men and women (aged 15–24) who were tested for HIV in that past 12 months and who received the results of the most recent test” and data come from Demographic and Health Surveys (DHS), Multiple Indicator Cluster Surveys (MICS), AIDS Indicator Surveys (AIS) and other national household surveys.
TABLE 5. EDUCATION Out of School: In this edition two indicators are added to Table 5: number and rate of out-of-school children of primary school age. The indicators represent the absolute number and percentage of children in the official primary school age range who are not en-rolled in either primary or secondary schools. Children enrolled in pre-primary education are excluded and considered out of school. For both the data source is UNESCO Institute for Statistics.
TABLE 8. WOMENMaternal mortality ratio (adjusted): The table presents the ‘ad-justed’ maternal mortality ratios for the year 2013, as published in 2014 by the Maternal Mortality Estimation Inter-agency Group (MMEIG), composed of WHO, UNICEF, the United Nations Popula-tion Fund (UNFPA), The World Bank, and the United Nations Popula-tion Division, together with independent technical experts. To derive these estimates, the inter-agency group used a dual approach: mak-ing adjustments to correct for misclassification and underreporting in existing estimates of maternal mortality from civil registration systems, and using a model to generate estimates for countries without reliable national-level estimates of maternal mortality. These ‘adjusted’ estimates should not be compared with previous inter-agency estimates. The full report – with complete country and regional estimates for the years 1990, 1995, 2000, 2005 and 2013, in addition to details on the methodology – can be found at <data.unicef.org/maternal-health/maternal-mortality>.
TABLE 9. CHILD PROTECTIONBirth Registration: Changes in the definition of birth registration were made from the second and third rounds of MICS (MICS2 and MICS3) to the fourth round (MICS4). In order to allow for compara-bility with later rounds, data from MICS2 and MICS3 on birth regis-tration were recalculated according to the MICS4 indicator definition. Therefore, the recalculated data presented here may differ from esti-mates included in MICS2 and MICS3 national reports.
Child labour: The prevalence rates of child labour presented in the table vary widely across countries due to significant differences in survey methodology, questionnaire content, national definitions and thresholds used to establish child labour prevalence. Only a limited number of countries have produced child labour prevalence data based on international standards and classifications. Data from the fourth round of MICS (MICS4, 2009–2012) included in the table have been recalculated according to the indicator definition used in MICS3 surveys, to ensure cross-country comparability. In this definition, the activities of fetching water or collecting firewood are classified as household chores rather than as an economic activity. Under this approach, a child aged 5–14 would have to be engaged in fetching water or collecting firewood for at least 28 hours per week to be con-sidered as a child labourer.
Female genital mutilation/cutting (FGM/C): Data on the prevalence of FGM/C among girls aged 0–14 were recalculated for technical reasons and may differ from that presented in original DHS and MICS country reports. For further details, refer to Female Genital Mutilation/Cutting: A statistical overview and exploration of the dynamics of change, UNICEF, New York, 2013. Regional estimates on the prevalence of FGM/C and attitudes towards the practice are based on available data from only practising countries and therefore reflect the situation among those living in affected countries within the region, and not the region as a whole, as there are some non-practising countries in the region as well.
Violent discipline: Estimates used in UNICEF publications and in MICS country reports prior to 2010 were calculated using household weights that did not take into account the last-stage selection of chil-dren for the administration of the child discipline module in MICS
STATISTICAL TABLES 35
STATIS
TICA
L TAB
LES
surveys. (A random selection of one child aged 2–14 is undertaken for the administration of the child discipline module.) In January 2010, it was decided that more accurate estimates are produced by using a household weight that takes the last-stage selection into ac-count. MICS3 data were recalculated using this approach. All UNICEF publications produced after 2010, including The State of the World’s Children 2014 In Numbers, use the revised estimates.
TABLE 10. THE RATE OF PROGRESSUnder-five mortality is used as the principal indicator of progress in child well-being. In 1970, about 17.3 million children under 5 years old were dying every year. In 2013, by comparison, the estimated number of children who died before their fifth birthday stood at 6.3 million – highlighting a significant long-term decline in the global number of under-five deaths.
U5MR has several advantages as a gauge of child well-being: • First, U5MR measures an end result of the development process
rather than an ‘input’ such as school enrolment level, per capita calorie availability or number of doctors per thousand population – all of which are means to an end.
• Second, U5MR is known to be the result of a wide variety of inputs: for example, antibiotics to treat pneumonia; insecticide-treated mos-quito nets to prevent malaria; the nutritional well-being and health knowledge of mothers; the level of immunization and oral rehydra-tion therapy use; the availability of maternal and child health ser-vices, including antenatal care; income and food availability in the family; the availability of safe drinking water and basic sanitation; and the overall safety of the child’s environment.
• Third, U5MR is less susceptible to the fallacy of the average than, for example, per capita gross national income (GNI). This is be-cause the natural scale does not allow the children of the rich to be one thousand times more likely to survive, even if the human made scale does permit them to have one thousand times as much income. In other words, it is much more difficult for a wealthy minority to affect a nation’s U5MR, and this indicator therefore presents a more accurate, if far from perfect, picture of the health status of the majority of children and of society as a whole.
The speed of progress in reducing U5MR can be assessed by calculating its annual rate of reduction (ARR). Unlike the comparison of absolute changes, ARR measures relative changes that reflect differences compared with the starting value.
As lower levels of under-five mortality are reached, the same absolute reduction represents a greater percentage reduction. ARR therefore shows a higher rate of progress for a 10-point absolute reduction, for example, if that reduction happens at a lower level of under-five mortality versus a higher level over the same time period. A 10-point decrease in U5MR from 100 in 1990 to 90 in 2013 represents a reduction of 10 per cent, corresponding to an ARR of about 0.5 per cent, whereas the same 10-point decrease from 20 to 10 over the same period represents a reduction of 50 per cent, or an ARR of 3 per cent. (A negative value for the percentage reduction indicates an increase in U5MR during the period specified.) When used in conjunction with gross domestic product (GDP) growth rates, U5MR and its rate of reduction can therefore give a picture of the progress being made by any country, area or region, over any period of time, towards the satisfaction of some of the most essential human needs.
As Table 10 shows, there is no fixed relationship between the ARR of U5MR and the annual rate of growth in per capita GDP. Comparing these two indicators helps shed light on the relationship between economic advances and human development.
Finally, the table gives the total fertility rate for each country and area and the corresponding ARR. It is clear that many of the nations that have achieved significant reductions in their U5MR have also achieved significant reductions in fertility.
36 THE STATE OF THE WORLD’S CHILDREN 2015
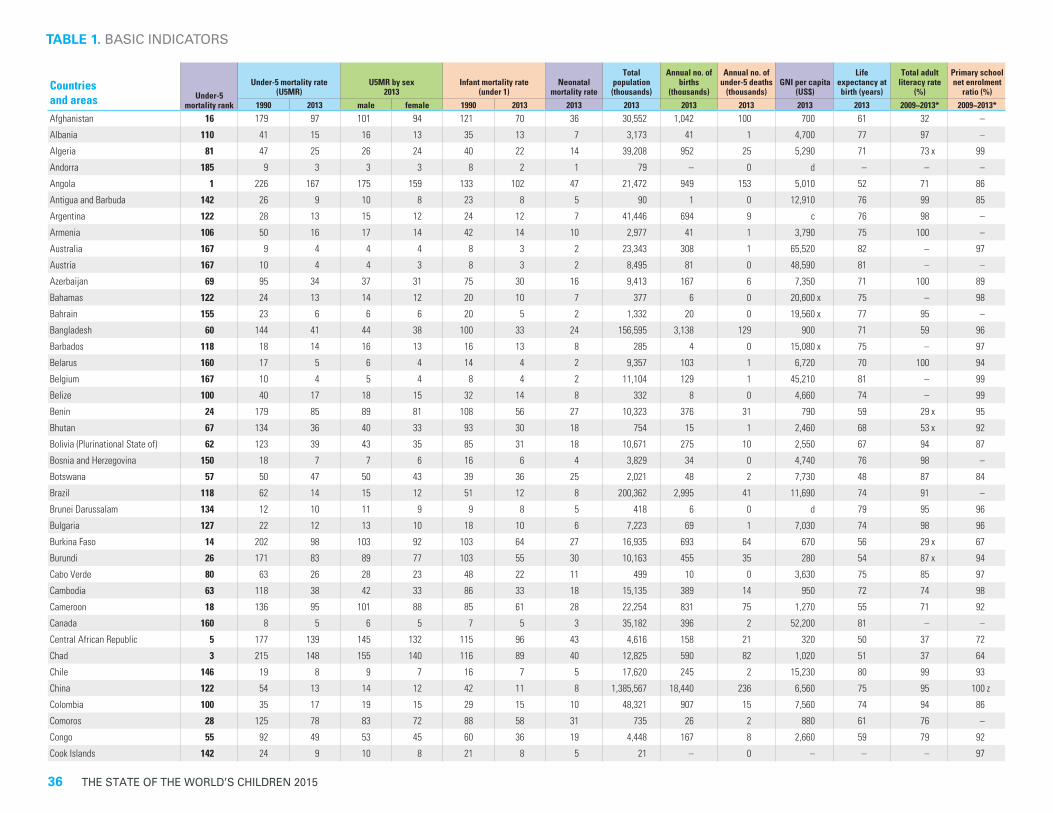
Countries and areas Under-5
mortality rank
Under-5 mortality rate (U5MR)
U5MR by sex2013
Infant mortality rate (under 1)
Neonatal mortality rate
Total population (thousands)
Annual no. of births
(thousands)
Annual no. of under-5 deaths
(thousands)GNI per capita
(US$)
Life expectancy at birth (years)
Total adult literacy rate
(%)
Primary school net enrolment
ratio (%)1990 2013 male female 1990 2013 2013 2013 2013 2013 2013 2013 2009−2013* 2009−2013*
Afghanistan 16 179 97 101 94 121 70 36 30,552 1,042 100 700 61 32 –
Albania 110 41 15 16 13 35 13 7 3,173 41 1 4,700 77 97 –
Algeria 81 47 25 26 24 40 22 14 39,208 952 25 5,290 71 73 x 99
Andorra 185 9 3 3 3 8 2 1 79 – 0 d – – –
Angola 1 226 167 175 159 133 102 47 21,472 949 153 5,010 52 71 86
Antigua and Barbuda 142 26 9 10 8 23 8 5 90 1 0 12,910 76 99 85
Argentina 122 28 13 15 12 24 12 7 41,446 694 9 c 76 98 –
Armenia 106 50 16 17 14 42 14 10 2,977 41 1 3,790 75 100 –
Australia 167 9 4 4 4 8 3 2 23,343 308 1 65,520 82 – 97
Austria 167 10 4 4 3 8 3 2 8,495 81 0 48,590 81 – –
Azerbaijan 69 95 34 37 31 75 30 16 9,413 167 6 7,350 71 100 89
Bahamas 122 24 13 14 12 20 10 7 377 6 0 20,600 x 75 – 98
Bahrain 155 23 6 6 6 20 5 2 1,332 20 0 19,560 x 77 95 –
Bangladesh 60 144 41 44 38 100 33 24 156,595 3,138 129 900 71 59 96
Barbados 118 18 14 16 13 16 13 8 285 4 0 15,080 x 75 – 97
Belarus 160 17 5 6 4 14 4 2 9,357 103 1 6,720 70 100 94
Belgium 167 10 4 5 4 8 4 2 11,104 129 1 45,210 81 – 99
Belize 100 40 17 18 15 32 14 8 332 8 0 4,660 74 – 99
Benin 24 179 85 89 81 108 56 27 10,323 376 31 790 59 29 x 95
Bhutan 67 134 36 40 33 93 30 18 754 15 1 2,460 68 53 x 92
Bolivia (Plurinational State of) 62 123 39 43 35 85 31 18 10,671 275 10 2,550 67 94 87
Bosnia and Herzegovina 150 18 7 7 6 16 6 4 3,829 34 0 4,740 76 98 –
Botswana 57 50 47 50 43 39 36 25 2,021 48 2 7,730 48 87 84
Brazil 118 62 14 15 12 51 12 8 200,362 2,995 41 11,690 74 91 –
Brunei Darussalam 134 12 10 11 9 9 8 5 418 6 0 d 79 95 96
Bulgaria 127 22 12 13 10 18 10 6 7,223 69 1 7,030 74 98 96
Burkina Faso 14 202 98 103 92 103 64 27 16,935 693 64 670 56 29 x 67
Burundi 26 171 83 89 77 103 55 30 10,163 455 35 280 54 87 x 94
Cabo Verde 80 63 26 28 23 48 22 11 499 10 0 3,630 75 85 97
Cambodia 63 118 38 42 33 86 33 18 15,135 389 14 950 72 74 98
Cameroon 18 136 95 101 88 85 61 28 22,254 831 75 1,270 55 71 92
Canada 160 8 5 6 5 7 5 3 35,182 396 2 52,200 81 – –
Central African Republic 5 177 139 145 132 115 96 43 4,616 158 21 320 50 37 72
Chad 3 215 148 155 140 116 89 40 12,825 590 82 1,020 51 37 64
Chile 146 19 8 9 7 16 7 5 17,620 245 2 15,230 80 99 93
China 122 54 13 14 12 42 11 8 1,385,567 18,440 236 6,560 75 95 100 z
Colombia 100 35 17 19 15 29 15 10 48,321 907 15 7,560 74 94 86
Comoros 28 125 78 83 72 88 58 31 735 26 2 880 61 76 –
Congo 55 92 49 53 45 60 36 19 4,448 167 8 2,660 59 79 92
Cook Islands 142 24 9 10 8 21 8 5 21 – 0 – – – 97
TABLE 1. BASIC INDICATORS

STATISTICAL TABLES 37
Costa Rica 134 17 10 11 9 14 8 6 4,872 74 1 9,550 80 97 93
Côte d'Ivoire 12 152 100 109 91 104 71 38 20,316 745 72 1,380 51 41 62
Croatia 160 13 5 5 4 11 4 3 4,290 41 0 13,330 77 99 99
Cuba 155 13 6 7 5 11 5 3 11,266 107 1 5,890 x 79 100 97
Cyprus 167 11 4 4 3 10 3 2 1,141 13 0 26,390 x 80 99 98
Czech Republic 167 15 4 4 3 13 3 2 10,702 118 0 18,060 78 – –Democratic People's Republic of Korea 79 43 27 30 24 33 22 15 24,895 358 10 a 70 100 x –
Democratic Republic of the Congo 8 176 119 126 111 115 86 38 67,514 2,889 320 400 50 61 x –
Denmark 167 9 4 4 3 7 3 2 5,619 64 0 61,110 79 – 98
Djibouti 36 119 70 76 63 92 57 31 873 24 2 b 62 – 58
Dominica 131 17 11 12 10 14 10 8 72 – 0 6,760 – – 96
Dominican Republic 78 60 28 31 25 46 24 16 10,404 217 6 5,620 73 90 89
Ecuador 87 57 23 25 20 44 19 11 15,738 328 7 5,510 76 93 97
Egypt 89 85 22 23 21 63 19 12 82,056 1,901 42 3,160 71 74 97
El Salvador 106 60 16 17 14 46 14 7 6,340 128 2 3,720 73 85 95
Equatorial Guinea 17 184 96 101 90 124 69 33 757 27 2 14,320 53 95 62
Eritrea 53 151 50 55 45 93 36 18 6,333 233 11 490 63 70 34
Estonia 185 20 3 4 3 17 3 2 1,287 14 0 17,370 74 100 97
Ethiopia 39 205 64 70 58 122 44 28 94,101 3,113 196 470 64 39 x –
Fiji 83 30 24 26 21 25 20 10 881 18 0 4,430 70 – 99
Finland 185 7 3 3 2 6 2 1 5,426 61 0 47,110 81 – 99
France 167 9 4 5 4 7 4 2 64,291 792 3 42,250 82 – 99
Gabon 42 93 56 61 51 60 39 23 1,672 53 3 10,650 63 82 –
Gambia 31 170 74 79 69 80 49 28 1,849 79 6 510 59 52 74
Georgia 122 47 13 15 11 41 12 10 4,341 58 1 3,570 74 100 99
Germany 167 9 4 4 4 7 3 2 82,727 702 3 46,100 81 – 100
Ghana 28 128 78 84 72 80 52 29 25,905 800 62 1,760 61 71 82
Greece 167 13 4 5 4 11 4 3 11,128 108 0 22,530 81 97 100
Grenada 127 22 12 13 11 18 11 6 106 2 0 7,460 73 – 97
Guatemala 72 81 31 34 28 60 26 15 15,468 480 15 3,340 72 78 95
Guinea 11 238 101 106 95 140 65 33 11,745 434 42 460 56 25 76
Guinea-Bissau 6 225 124 133 114 133 78 44 1,704 64 7 520 54 57 71
Guyana 65 61 37 41 32 47 30 20 800 16 1 3,750 66 85 75
Haiti 32 145 73 79 67 100 55 25 10,317 265 19 810 63 49 x –
Holy See – – – – – – – – 1 – – – – – –
Honduras 89 59 22 25 20 46 19 12 8,098 209 5 2,180 74 85 94
Hungary 155 19 6 6 6 17 5 4 9,955 98 1 12,410 x 75 99 97
Iceland 194 6 2 2 2 5 2 1 330 5 0 43,930 82 – 99
India 47 126 53 51 55 88 41 29 1,252,140 25,595 1,340 1,570 66 63 x 99
TABLE 1. BASIC INDICATORS
TAB
LE 1. BA
SIC
IND
ICATO
RS
Countries and areas Under-5
mortality rank
Under-5 mortality rate (U5MR)
U5MR by sex2013
Infant mortality rate (under 1)
Neonatal mortality rate
Total population (thousands)
Annual no. of births
(thousands)
Annual no. of under-5 deaths
(thousands)GNI per capita
(US$)
Life expectancy at birth (years)
Total adult literacy rate
(%)
Primary school net enrolment
ratio (%)1990 2013 male female 1990 2013 2013 2013 2013 2013 2013 2013 2009−2013* 2009−2013*

38 THE STATE OF THE WORLD’S CHILDREN 2015
Indonesia 76 84 29 33 26 62 25 14 249,866 4,691 136 3,580 71 93 95
Iran (Islamic Republic of) 100 57 17 18 16 44 14 10 77,447 1,455 25 5,780 74 84 100
Iraq 69 53 34 37 31 42 28 19 33,765 1,052 35 6,710 69 79 –
Ireland 167 9 4 4 3 8 3 2 4,627 71 0 39,110 x 81 – 100
Israel 167 12 4 4 4 10 3 2 7,733 157 1 34,120 82 98 97
Italy 167 10 4 4 3 8 3 2 60,990 560 2 34,400 82 99 99
Jamaica 100 30 17 19 15 25 14 10 2,784 50 1 5,220 74 87 –
Japan 185 6 3 3 3 5 2 1 127,144 1,062 3 46,140 84 – 100
Jordan 94 37 19 20 18 30 16 11 7,274 193 4 4,950 74 98 97
Kazakhstan 106 53 16 19 14 45 15 9 16,441 337 5 11,380 67 100 99
Kenya 33 99 71 75 66 64 48 26 44,354 1,550 106 930 62 72 x 83
Kiribati 41 95 58 63 53 69 45 22 102 2 0 2,620 69 – –
Kuwait 134 17 10 10 9 14 8 5 3,369 69 1 44,940 x 74 96 –
Kyrgyzstan 83 66 24 27 21 55 22 13 5,548 151 4 1,200 68 99 98
Lao People's Democratic Republic 33 162 71 77 65 111 54 29 6,770 181 13 1,460 68 73 x 96
Latvia 146 20 8 9 8 17 7 5 2,050 23 0 14,060 x 72 100 98
Lebanon 142 32 9 10 9 27 8 5 4,822 64 1 9,870 80 90 x 96
Lesotho 14 86 98 105 91 70 73 44 2,074 57 6 1,550 49 76 82
Liberia 33 248 71 76 66 165 54 26 4,294 152 10 410 61 43 x 41
Libya 110 42 15 16 13 36 12 9 6,202 129 2 c 75 90 –
Liechtenstein – – – – – – – – 37 – – d – – 99
Lithuania 160 17 5 5 4 13 4 3 3,017 34 0 13,820 x 72 100 98
Luxembourg 194 9 2 2 2 7 2 1 530 6 0 71,810 x 81 – 95
Madagascar 42 161 56 60 52 98 40 21 22,925 797 43 440 65 64 –
Malawi 37 245 68 72 63 143 44 23 16,363 652 41 270 55 61 97
Malaysia 142 17 9 9 8 14 7 4 29,717 525 5 10,400 75 93 –
Maldives 134 94 10 11 9 68 8 6 345 8 0 5,600 78 98 x 95
Mali 7 254 123 129 117 131 78 40 15,302 723 82 670 55 34 73
Malta 155 11 6 7 6 10 5 4 429 4 0 19,730 x 80 92 x 95
Marshall Islands 63 50 38 42 33 39 31 16 53 – 0 4,200 – – 100
Mauritania 19 118 90 98 82 78 67 35 3,890 133 12 1,060 62 46 x 70
Mauritius 118 23 14 16 13 20 13 9 1,244 14 0 9,300 74 89 98
Mexico 110 46 15 16 13 37 13 7 122,332 2,252 33 9,940 78 94 98
Micronesia (Federated States of) 67 55 36 40 33 43 30 16 104 2 0 3,430 69 – –
Monaco 167 8 4 4 3 6 3 2 38 – 0 d – – –
Mongolia 71 108 32 38 26 77 26 13 2,839 64 2 3,770 68 98 98
Montenegro 160 17 5 6 5 15 5 4 621 7 0 7,260 75 98 98
Morocco 73 81 30 34 27 64 26 18 33,008 750 24 3,030 71 67 97
Mozambique 21 237 87 92 82 158 62 30 25,834 1,005 83 590 50 51 86
Myanmar 50 109 51 55 45 78 40 26 53,259 917 46 a 65 93 –
TABLE 1. BASIC INDICATORS
Countries and areas Under-5
mortality rank
Under-5 mortality rate (U5MR)
U5MR by sex2013
Infant mortality rate (under 1)
Neonatal mortality rate
Total population (thousands)
Annual no. of births
(thousands)
Annual no. of under-5 deaths
(thousands)GNI per capita
(US$)
Life expectancy at birth (years)
Total adult literacy rate
(%)
Primary school net enrolment
ratio (%)1990 2013 male female 1990 2013 2013 2013 2013 2013 2013 2013 2009−2013* 2009−2013*

STATISTICAL TABLES 39
Namibia 53 74 50 54 46 50 35 22 2,303 60 3 5,840 64 76 x 89
Nauru 65 58 37 40 33 45 30 20 10 – 0 – – – 76
Nepal 61 142 40 42 37 99 32 23 27,797 584 23 730 68 57 98
Netherlands 167 8 4 4 4 7 3 3 16,759 179 1 47,440 81 – 99
New Zealand 155 11 6 7 6 9 5 3 4,506 62 0 35,520 x 81 – 99
Nicaragua 83 67 24 26 21 51 20 12 6,080 138 3 1,780 75 78 x 93
Niger 10 327 104 108 100 138 60 28 17,831 890 86 410 58 15 64
Nigeria 9 213 117 124 111 126 74 37 173,615 7,173 804 2,760 53 51 x 66
Niue 81 14 25 27 22 12 21 12 1 – 0 – – – –
Norway 185 9 3 3 2 7 2 2 5,043 63 0 102,610 82 – 99
Oman 131 39 11 12 10 32 10 7 3,632 74 1 25,250 x 77 87 97
Pakistan 23 139 86 89 82 106 69 42 182,143 4,599 394 1,380 67 55 72
Palau 97 36 18 19 16 31 15 9 21 – 0 10,970 – 100 –
Panama 97 31 18 20 16 26 15 8 3,864 75 1 10,700 78 94 92
Papua New Guinea 40 89 61 66 57 65 47 24 7,321 212 13 2,010 62 63 87
Paraguay 89 46 22 24 20 37 19 12 6,802 162 3 4,040 72 94 83
Peru 100 80 17 18 15 57 13 8 30,376 599 10 6,390 75 94 96
Philippines 73 59 30 33 26 41 24 14 98,394 2,404 71 3,270 69 95 x 89
Poland 160 17 5 6 5 15 5 3 38,217 413 2 12,960 76 100 97
Portugal 167 15 4 4 3 12 3 2 10,608 92 0 20,670 80 94 99
Qatar 146 21 8 9 7 18 7 4 2,169 23 0 85,550 78 97 –
Republic of Korea 167 7 4 4 3 6 3 2 49,263 472 2 25,920 82 – 99
Republic of Moldova 110 32 15 17 14 27 13 8 3,487 42 1 2,460 69 99 91
Romania 127 38 12 13 11 31 11 7 21,699 223 3 9,060 74 99 86
Russian Federation 134 26 10 11 9 22 9 5 142,834 1,686 17 13,860 68 100 97
Rwanda 48 152 52 56 48 93 37 20 11,777 414 22 620 64 66 99
Saint Kitts and Nevis 134 29 10 11 9 23 8 7 54 – 0 13,460 – – 84
Saint Lucia 110 23 15 16 13 19 13 9 182 3 0 7,090 75 – 83
Saint Vincent and the Grenadines 94 25 19 21 17 21 17 12 109 2 0 6,580 72 – 99
Samoa 97 31 18 20 16 26 16 8 190 5 0 3,430 73 99 96
San Marino 185 11 3 3 3 10 3 1 31 – 0 d – – 93
Sao Tome and Principe 50 110 51 55 47 70 37 19 193 7 0 1,470 66 70 x 97
Saudi Arabia 106 44 16 17 14 35 13 9 28,829 561 9 26,200 75 94 94
Senegal 44 141 55 60 50 71 44 23 14,133 534 29 1,070 63 52 79
Serbia 150 28 7 7 6 24 6 4 9,511 93 1 5,730 74 98 93
Seychelles 118 17 14 15 13 14 12 9 93 2 0 12,530 73 92 94
Sierra Leone 2 268 161 169 152 158 107 44 6,092 223 34 680 46 44 –
Singapore 185 8 3 3 3 6 2 1 5,412 54 0 54,040 82 96 –
Slovakia 150 18 7 8 6 16 6 4 5,450 58 0 17,200 x 75 – –
TABLE 1. BASIC INDICATORS
Countries and areas Under-5
mortality rank
Under-5 mortality rate (U5MR)
U5MR by sex2013
Infant mortality rate (under 1)
Neonatal mortality rate
Total population (thousands)
Annual no. of births
(thousands)
Annual no. of under-5 deaths
(thousands)GNI per capita
(US$)
Life expectancy at birth (years)
Total adult literacy rate
(%)
Primary school net enrolment
ratio (%)1990 2013 male female 1990 2013 2013 2013 2013 2013 2013 2013 2009−2013* 2009−2013*
TAB
LE 1. BA
SIC
IND
ICATO
RS

40 THE STATE OF THE WORLD’S CHILDREN 2015
TABLE 1. BASIC INDICATORS
Slovenia 185 10 3 3 3 9 2 2 2,072 21 0 22,830 x 80 100 98
Solomon Islands 73 39 30 33 27 32 25 13 561 17 1 1,610 68 – –
Somalia 4 180 146 152 139 108 90 46 10,496 461 65 a 55 – –
South Africa 58 61 44 48 39 47 33 15 52,776 1,099 47 7,190 57 94 90
South Sudan 13 253 99 104 94 150 64 39 11,296 406 39 1,120 55 – 41
Spain 167 11 4 4 4 9 4 3 46,927 488 2 29,180 82 98 100
Sri Lanka 134 21 10 10 9 18 8 6 21,273 380 4 3,170 74 91 94
State of Palestine 89 43 22 24 20 35 19 12 4,326 132 3 2,810 x 73 96 93
Sudan 30 128 77 81 71 80 51 30 37,964 1,275 94 1,130 62 73 52
Suriname 87 48 23 25 20 41 20 12 539 10 0 9,260 71 95 92
Swaziland 27 74 80 85 75 55 56 30 1,250 37 3 3,080 49 83 –
Sweden 185 7 3 3 3 6 2 2 9,571 115 0 59,130 82 – 99
Switzerland 167 8 4 5 4 7 4 3 8,078 84 0 80,950 x 83 – 99
Syrian Arab Republic 110 37 15 16 13 30 12 8 21,898 532 8 b 75 85 99
Tajikistan 56 108 48 53 42 85 41 22 8,208 271 13 990 67 100 99
Thailand 122 37 13 15 11 30 11 8 67,011 687 9 5,370 74 96 96The former Yugoslav Republic of Macedonia 150 37 7 7 6 33 6 4 2,107 23 0 4,800 75 98 92
Timor-Leste 44 172 55 59 50 130 46 24 1,133 41 2 3,580 68 58 92
Togo 24 146 85 91 78 90 56 30 6,817 248 20 530 57 60 93 x
Tonga 127 23 12 13 11 19 10 6 105 3 0 4,490 73 99 x 90
Trinidad and Tobago 93 31 21 23 19 27 19 15 1,341 19 0 15,760 70 99 99
Tunisia 110 52 15 16 14 41 13 9 10,997 190 3 4,360 76 80 100
Turkey 94 74 19 21 17 56 17 11 74,933 1,261 25 10,950 75 95 95
Turkmenistan 44 91 55 63 47 73 47 23 5,240 112 6 6,880 65 100 –
Tuvalu 76 57 29 32 26 44 24 13 10 – 0 6,630 – – –
Uganda 38 179 66 72 60 107 44 22 37,579 1,626 102 510 59 73 91
Ukraine 134 20 10 11 9 17 9 5 45,239 490 5 3,960 69 100 98
United Arab Emirates 146 17 8 9 7 14 7 5 9,346 132 1 38,620 x 77 90 x 98
United Kingdom 160 9 5 5 4 8 4 3 63,136 770 4 39,110 81 – 100
United Republic of Tanzania 48 167 52 55 48 101 36 21 49,253 1,931 95 630 62 68 98 x
United States 150 11 7 8 6 9 6 4 320,051 4,230 29 53,670 79 – 93
Uruguay 131 23 11 12 10 20 10 6 3,407 49 1 15,180 77 98 100
Uzbekistan 59 71 43 48 37 59 37 14 28,934 622 26 1,900 68 99 91
Vanuatu 100 33 17 19 15 27 15 9 253 7 0 3,130 72 83 –
Venezuela (Bolivarian Republic of) 110 30 15 17 13 25 13 8 30,405 601 9 12,550 75 96 94
Viet Nam 83 51 24 27 20 37 19 13 91,680 1,424 33 1,730 76 94 98
Yemen 50 125 51 55 47 88 40 24 24,407 760 38 1,330 63 66 87
Zambia 21 193 87 93 82 115 56 29 14,539 625 51 1,480 58 61 x 98
Zimbabwe 20 75 89 95 82 50 55 39 14,150 446 39 820 60 84 –
Countries and areas Under-5
mortality rank
Under-5 mortality rate (U5MR)
U5MR by sex2013
Infant mortality rate (under 1)
Neonatal mortality rate
Total population (thousands)
Annual no. of births
(thousands)
Annual no. of under-5 deaths
(thousands)GNI per capita
(US$)
Life expectancy at birth (years)
Total adult literacy rate
(%)
Primary school net enrolment
ratio (%)1990 2013 male female 1990 2013 2013 2013 2013 2013 2013 2013 2009−2013* 2009−2013*
STATISTICAL TABLES 41
TABLE 1. BASIC INDICATORS
DEFINITIONS OF THE INDICATORS
Under-5 mortality rate – Probability of dying between birth and exactly 5 years of age, expressed per 1,000 live births.Infant mortality rate – Probability of dying between birth and exactly 1 year of age, expressed per 1,000 live births.Neonatal mortality rate – Probability of dying during the first 28 completed days of life, expressed per 1,000 live births.GNI per capita – Gross national income (GNI) is the sum of value added by all resident producers, plus any product taxes (less subsidies) not included in the valuation of output, plus net receipts of primary income (compensation of employees and property income) from abroad. Gross national income per capita is GNI divided by midyear population. GNI per capita in US dollars is converted using the World Bank Atlas method.Life expectancy at birth – Number of years newborn children would live if subject to the mortality risks prevailing for the cross section of population at the time of their birth.Total adult literacy rate – Percentage of population aged 15 years and over who can both read and write with understanding a short simple statement on his/her everyday life.Primary school net enrolment ratio – Number of children enrolled in primary or secondary school who are of official primary school age, expressed as a percentage of the total number of children of official primary school age. Because of the inclusion of primary-school-aged children enrolled in secondary school, this indicator can also be referred to as a primary adjusted net enrolment ratio.
MAIN DATA SOURCES
NOTES
Under-5, infant and neonatal mortality rates – United Nations Inter-agency Group for Child Mortality Estimation (UNICEF, World Health Organization, United Nations Population Division and the World Bank).Total population and births – United Nations Population Division.Under-five deaths – United Nations Inter-agency Group for Child Mortality Estimation (UNICEF, World Health Organization, United Nations Population Division and the World Bank).GNI per capita – The World Bank.Life expectancy at birth – United Nations Population Division.Total adult literacy rate and primary school enrolment ratio – UNESCO Institute for Statistics (UIS).
a low-income country (GNI per capita is $1,045 or less).b lower-middle-income country (GNI per capita is $1,046 to $4,125).c upper-middle-income country (GNI per capita is $4,126 to $12,745).d high-income country (GNI per capita is $12,746 or more).– Data not available.x Data refer to years or periods other than those specified in the column heading. Such data are not included in the calcula-
tion of regional and global averages. z Data provided by the Chinese Ministry of Education. The UNESCO Institute for Statistics dataset does not currently include
net enrolment rates for China.* Data refer to the most recent year available during the period specified in the column heading.
For a complete list of countries and areas in the regions, subregions and country categories, see page 32 or visit http://data.unicef.org/index.php?section=regional-classifications.It is not advisable to compare data from consecutive editions of The State of the World’s Children.
SUMMARY
Sub-Saharan Africa 179 92 98 86 107 61 31 937,495 35,302 3,113 1,665 57 59 78
Eastern and Southern Africa 165 74 79 69 102 50 27 453,128 16,005 1,144 1,719 59 66 85
West and Central Africa 197 109 116 103 115 72 35 445,530 17,998 1,874 1,657 54 50 73
Middle East and North Africa 70 31 33 28 52 24 15 432,925 10,288 314 6,254 71 79 91
South Asia 129 57 56 57 92 45 30 1,671,598 35,361 1,991 1,478 67 61 94
East Asia and Pacific 58 19 21 17 44 16 10 2,090,990 30,918 594 6,343 74 95 95
Latin America and Caribbean 54 18 20 16 43 15 9 611,263 10,920 196 9,445 75 92 94
CEE/CIS 47 20 22 17 38 17 9 409,403 5,871 114 9,395 70 99 95
Least developed countries 174 80 85 75 108 55 29 898,242 29,626 2,275 848 62 59 82
World 90 46 47 44 63 34 20 7,122,691 138,740 6,285 10,449 71 84 91
Countries and areas Under-5
mortality rank
Under-5 mortality rate (U5MR)
U5MR by sex2013
Infant mortality rate (under 1)
Neonatal mortality rate
Total population (thousands)
Annual no. of births
(thousands)
Annual no. of under-5 deaths
(thousands)GNI per capita
(US$)
Life expectancy at birth (years)
Total adult literacy rate
(%)
Primary school net enrolment
ratio (%)1990 2013 male female 1990 2013 2013 2013 2013 2013 2013 2013 2009−2013* 2009−2013*
TAB
LE 1. BA
SIC
IND
ICATO
RS

42 THE STATE OF THE WORLD’S CHILDREN 2015
Countries and areas
Low birthweight (%)
Early initiation of breastfeeding (%)
Exclusive breastfeeding<6 months (%)
Introduction to solid, semi-solid or soft foods 6-8
months (%)
Minimum acceptable diet 6-23 months (%)
Breastfeeding at age 2 (%)
Underweight (%) Stunting (%) Wasting (%) Overweight (%) Vitamin A supplementation, full coverage∆ (%)
Adequately iodized salt
consumption (%)moderate & severeࡌ
2009–2013* 2009-2013* 2009-2013* 2013 2009–2013*Afghanistan – 54 – – – 54 x 33 x 59 x 9 x 5 x 97 20
Albania – 43 39 78 – 31 6 23 9 23 – 75
Algeria 6 x 50 x 7 x – – 22 x 4 x 16 x 4 x 13 x – 61 x
Andorra – – – – – – – – – – – –
Angola 12 x 55 x – – – – 16 x 29 x 8 x – 48 45 x
Antigua and Barbuda 6 – – – – – – – – – – –
Argentina 7 53 33 93 – 29 2 x 8 x 1 x 10 x – –
Armenia 8 36 35 75 32 23 5 21 4 17 – 97 x
Australia 6 – – – – – – – – – – –
Austria 7 – – – – – – – – – – –
Azerbaijan 10 x 32 x 12 x 83 x – 16 x 8 x 27 x 7 x 14 x 87 w 54 x
Bahamas 12 – – – – – – – – – – –
Bahrain 10 – – – – – – – – – – –
Bangladesh 22 x 47 64 62 21 90 37 41 16 2 97 58
Barbados 12 40 20 – – – – – – – – 17
Belarus 5 53 19 64 – 12 1 x 5 x 2 x 10 x – 85
Belgium 7 – – – – – – – – – – –
Belize 11 62 15 69 – 35 6 19 3 8 – –
Benin 15 x 50 33 59 16 68 20 x 45 x 8 x 11 x 99 86
Bhutan 10 59 49 67 – 66 13 34 6 8 45 – f
Bolivia (Plurinational State of) 6 x 64 x 60 x 83 x – 40 x 5 x 27 x 1 x 9 x 40 – f
Bosnia and Herzegovina 5 42 19 71 – 12 2 9 2 17 – 62 x,y
Botswana 13 x 40 x 20 x – – 6 x 11 x 31 x 7 x 11 x 83 65 x
Brazil 9 43 x 39 x 94 x – 26 x 2 x 7 x 2 x 7 x – 96 x
Brunei Darussalam 12 – – – – – – – – – – –
Bulgaria 9 – – – – – 2 x 9 x 3 x 14 x – 92
Burkina Faso 14 42 38 57 3 80 24 33 11 – 99 34 x,f
Burundi 13 74 69 70 9 79 29 58 6 3 75 – f
Cabo Verde 6 x 73 x 60 x – – 13 x – – – – – 75 x
Cambodia 11 66 74 88 24 43 29 41 11 2 90 – f
Cameroon 11 x 40 20 70 – 24 15 33 6 7 99 85
Canada 6 – – – – – – – – – – –
Central African Republic 14 44 34 60 – 32 24 41 7 2 40 65
Chad 20 29 3 46 – 59 30 39 16 3 91 54
Chile 6 – – – – – 1 2 0 10 – –
China – 41 x 28 x – – 9 x 3 9 2 7 – 97 y
Colombia 10 57 43 86 – 33 3 13 1 5 – –
Comoros 25 x 34 12 81 6 57 17 32 11 11 – 77 x,f
Congo 13 x 24 21 90 – 17 12 25 6 4 – 73 x,f
Cook Islands – – – – – – – – – – – –
TABLE 2. NUTRITION

STATISTICAL TABLES 43
TABLE 2. NUTRITION
Costa Rica 7 60 33 86 – 28 1 6 1 8 – –
Côte d'Ivoire 17 x 31 12 64 5 38 16 30 8 3 99 30 x,f
Croatia 5 – – – – – – – – – – –
Cuba 5 77 49 77 – 17 3 x 7 x 2 x – – 88 x
Cyprus 12 x – – – – – – – – – – –
Czech Republic 8 – – – – – 2 x 3 x 5 x 4 x – –Democratic People's Republic of Korea 6 28 69 66 – 22 15 28 4 – 98 25
Democratic Republic of the Congo 10 43 37 52 – 53 24 44 9 5 98 59
Denmark 5 – – – – – – – – – – –
Djibouti 10 x 55 x 1 x 35 x – 18 x 30 34 22 8 66 0 x
Dominica 11 – – – – – – – – – – –
Dominican Republic 11 x 65 x 7 81 x – 14 3 x 10 x 2 x 8 x – – f
Ecuador 9 55 40 x 74 – 19 6 25 2 – – –
Egypt 13 x 56 x 53 x 69 x – 35 x 7 x 31 x 8 x 21 x – 78 x
El Salvador 9 33 x 31 x – – 54 x 7 x 21 x 2 x 6 x – 62 x
Equatorial Guinea 13 x 21 7 76 11 5 6 26 3 10 – – f
Eritrea 14 x 93 69 40 x 29 y 73 39 50 15 2 37 68 x
Estonia 5 – – – – – – – – – – –
Ethiopia 20 x 52 52 49 4 82 29 44 10 2 79 20 x,f
Fiji 10 x 57 x 40 x – – – 5 x 8 x 6 x 5 x – –
Finland 4 – – – – – – – – – – –
France 7 – – – – – – – – – – –
Gabon 14 x 32 6 82 4 4 7 18 3 8 – – f
Gambia 10 52 34 34 – 31 17 23 10 2 – 22
Georgia 7 69 55 – – 17 1 11 2 20 – 100
Germany 7 – – – – – 1 x 1 x 1 x 4 x – –
Ghana 11 46 46 75 31 37 13 23 6 3 96 35
Greece 10 – – – – – – – – – – –
Grenada 9 – – – – – – – – – – –
Guatemala 11 56 50 – – 46 13 48 1 5 13 – f
Guinea 12 x 17 21 43 4 66 19 31 10 4 – – f
Guinea-Bissau 11 55 38 43 – 65 18 32 6 3 97 12
Guyana 14 43 33 81 – 49 11 20 5 7 – 10
Haiti 23 47 40 87 14 31 12 22 5 4 13 3 x,f
Holy See – – – – – – – – – – – –
Honduras 10 64 31 70 54 43 7 23 1 5 59 –
Hungary 9 – – – – – – – – – – –
Iceland 4 – – – – – – – – – – –
India 28 x 41 x 46 x 56 x – 77 x 44 x 48 x 20 x 2 x 53 71
TAB
LE 2. NU
TRITIO
N
Countries and areas
Low birthweight (%)
Early initiation of breastfeeding (%)
Exclusive breastfeeding<6 months (%)
Introduction to solid, semi-solid or soft foods 6-8
months (%)
Minimum acceptable diet 6-23 months (%)
Breastfeeding at age 2 (%)
Underweight (%) Stunting (%) Wasting (%) Overweight (%) Vitamin A supplementation, full coverage∆ (%)
Adequately iodized salt
consumption (%)moderate & severeࡌ
2009–2013* 2009-2013* 2009-2013* 2013 2009–2013*
44 THE STATE OF THE WORLD’S CHILDREN 2015
Indonesia 9 x 49 42 91 37 55 20 36 14 12 82 58
Iran (Islamic Republic of) 8 69 53 76 – 51 4 7 4 – – – f
Iraq 13 43 20 36 – 23 9 23 7 12 – 29
Ireland 5 – – – – – – – – – – –
Israel 8 – – – – – – – – – – –
Italy 7 – – – – – – – – – – –
Jamaica 11 65 24 55 – 31 3 5 4 4 – –
Japan 10 – – – – – – – – – – –
Jordan 13 x 19 23 92 33 13 3 8 2 5 – – f
Kazakhstan 6 68 32 49 – 26 4 13 4 13 – 85
Kenya 8 58 32 85 – 54 16 35 7 5 19 93
Kiribati 8 – 69 – – 82 15 – – – – –
Kuwait 8 – – – – – 2 4 2 10 – –
Kyrgyzstan 6 84 56 62 16 37 4 18 3 9 – 76 x
Lao People's Democratic Republic 15 39 40 52 – 40 27 44 6 2 87 – f
Latvia 5 – – – – – – – – – – –
Lebanon 12 – 15 – – 15 4 x 17 x 7 x 17 x – 71
Lesotho 11 53 54 68 – 35 14 39 4 7 – 79
Liberia 14 x 67 x 55 56 x – 44 15 42 3 – 88 –
Libya – – – – – – 6 x 21 x 7 x 22 x – –
Liechtenstein – – – – – – – – – – – –
Lithuania 5 – – – – – – – – – – –
Luxembourg 7 – – – – – – – – – – –
Madagascar 16 66 42 90 – 83 37 x 49 15 x 6 x 94 50
Malawi 14 95 71 86 19 77 14 48 4 9 90 62
Malaysia 11 – – – – – 13 x 17 x – – – –
Maldives 11 64 48 91 – 68 18 20 10 7 76 44 x
Mali 18 57 20 27 – 46 28 x 39 x 15 x 5 x 98 74 x
Malta 7 – – – – – – – – – – –
Marshall Islands 18 x 73 x 31 x – – 53 x – – – – – –
Mauritania 35 56 27 48 – 36 20 22 12 1 99 7
Mauritius 14 x – 21 x – – – – – – – – –
Mexico 9 39 14 95 – 14 3 14 2 9 – 91 x
Micronesia (Federated States of) 11 – – – – – – – – – – –
Monaco 6 – – – – – – – – – – –
Mongolia 5 71 66 66 – 65 5 16 2 11 95 70
Montenegro 5 25 x 19 x – – 13 x 1 9 3 22 – 71 x
Morocco 15 x 52 x 31 x 86 x – 15 x 3 15 2 11 – 21 x
Mozambique 17 77 43 90 13 52 16 43 6 8 99 25 f
Myanmar 9 76 24 76 – 65 23 35 8 3 – 69
TABLE 2. NUTRITION
Countries and areas
Low birthweight (%)
Early initiation of breastfeeding (%)
Exclusive breastfeeding<6 months (%)
Introduction to solid, semi-solid or soft foods 6-8
months (%)
Minimum acceptable diet 6-23 months (%)
Breastfeeding at age 2 (%)
Underweight (%) Stunting (%) Wasting (%) Overweight (%) Vitamin A supplementation, full coverage∆ (%)
Adequately iodized salt
consumption (%)moderate & severeࡌ
2009–2013* 2009-2013* 2009-2013* 2013 2009–2013*

STATISTICAL TABLES 45
TABLE 2. NUTRITION
Namibia 16 x 71 x 24 x 91 x – 28 x 18 x 30 x 8 x 5 x 63 57 x
Nauru 27 x 76 x 67 x – – 65 x 5 x 24 x 1 x 3 x – –
Nepal 18 45 70 66 – 93 29 41 11 2 99 80
Netherlands 6 – – – – – – – – – – –
New Zealand 6 – – – – – – – – – – –
Nicaragua 8 76 x 31 x – – 43 x 6 x 23 x 2 x 6 x – 97 x
Niger 27 x 53 23 – 6 50 38 43 19 3 96 19
Nigeria 15 33 17 67 10 35 31 36 18 5 70 80
Niue – – – – – – – – – – – –
Norway 5 – – – – – – – – – – –
Oman 10 85 x – – – 73 x 9 10 7 2 96 w – f
Pakistan 32 x 18 38 66 15 56 32 45 11 5 – 69
Palau 7 – – – – – – – – – 0 –
Panama 8 – – – – – 4 x 19 x 1 x – – –
Papua New Guinea 11 x – 56 x – – 72 x 28 50 14 14 – 92 x
Paraguay 6 47 x 24 x – – 14 x 3 x 18 x 1 x 7 x – 93 y
Peru 7 56 72 82 – 54 y 4 18 1 7 – 88
Philippines 21 x 54 x 34 x 90 x – 34 x 20 30 8 5 89 45 x
Poland 6 – – – – – – – – – – –
Portugal 9 – – – – – – – – – – –
Qatar 8 – – – – – – – – – – –
Republic of Korea 4 x – – – – – 1 3 1 7 – –
Republic of Moldova 6 65 36 62 – 12 3 x 11 x 6 x 9 x – 44
Romania 8 – 16 x – – – 4 x 13 x 4 x 8 x – 74 x
Russian Federation 6 – – – – – – – – – – – f
Rwanda 7 71 85 79 17 84 12 44 3 7 0 87 x,f
Saint Kitts and Nevis 10 – – – – – – – – – – – f
Saint Lucia 10 50 – – – – 3 3 4 6 – 46
Saint Vincent and the Grenadines 11 – – – – – – – – – – –
Samoa 10 88 51 – – 74 – – – – – –
San Marino 10 – – – – – – – – – – –
Sao Tome and Principe 10 45 51 74 – 20 14 32 11 12 67 65
Saudi Arabia 9 – – – – – 5 x 9 x 12 x 6 x – –
Senegal 19 48 39 67 9 51 17 19 9 2 99 43
Serbia 6 8 14 84 – 15 2 7 4 16 – 32 x
Seychelles – – – – – – – – – – – –
Sierra Leone 11 45 32 25 – 48 21 45 9 10 99 63
Singapore 10 – – – – – 3 x 4 x 4 x 3 x – –
Slovakia 8 – – – – – – – – – – –
Slovenia 6 – – – – – – – – – – –
TAB
LE 2. NU
TRITIO
N
Countries and areas
Low birthweight (%)
Early initiation of breastfeeding (%)
Exclusive breastfeeding<6 months (%)
Introduction to solid, semi-solid or soft foods 6-8
months (%)
Minimum acceptable diet 6-23 months (%)
Breastfeeding at age 2 (%)
Underweight (%) Stunting (%) Wasting (%) Overweight (%) Vitamin A supplementation, full coverage∆ (%)
Adequately iodized salt
consumption (%)moderate & severeࡌ
2009–2013* 2009-2013* 2009-2013* 2013 2009–2013*

46 THE STATE OF THE WORLD’S CHILDREN 2015
TABLE 2. NUTRITION
Solomon Islands 13 x 75 x 74 x – – 67 x 12 x 33 x 4 x 3 x – –
Somalia – 26 x 9 x 16 x – 35 x 33 x 42 x 13 x 5 x – 4 y
South Africa – 61 x 8 x – – 31 x 9 x 24 x 5 x – 42 w –
South Sudan – 48 45 21 – 38 28 31 23 6 66 45
Spain 8 – – – – – – – – – – –
Sri Lanka 17 x 80 x 76 x – – 84 x 26 15 21 1 92 92 x
State of Palestine 9 62 29 61 – 13 4 11 3 5 – 77
Sudan – – 41 51 – 40 32 35 16 – 0 10
Suriname 14 45 3 47 – 15 6 9 5 4 – –
Swaziland 9 55 44 66 – 11 6 31 1 11 31 52
Sweden 5 – – – – – – – – – – –
Switzerland 7 – – – – – – – – – – –
Syrian Arab Republic 10 46 43 – – 25 10 28 12 18 – 79 x
Tajikistan 10 x 50 34 49 20 50 13 27 10 7 93 39
Thailand 11 46 12 75 – 18 9 16 7 11 – 71 The former Yugoslav Republic of Macedonia 6 21 23 41 – 13 1 5 2 12 – 94 x,y
Timor-Leste 12 x 82 52 82 – 33 45 58 19 6 40 60 x
Togo 11 46 62 44 – 64 17 30 5 2 61 32
Tonga – 79 52 – – 30 – – – – – –
Trinidad and Tobago 12 41 x 13 x 83 x – 22 x 4 x 5 x 5 x 5 x – 28 x
Tunisia 7 40 9 27 – 19 2 10 3 14 – 97 x
Turkey 11 x 39 x 42 x – – 22 x 2 x 12 x 1 x – – 69 x
Turkmenistan 5 18 x 13 x – – 27 x 11 x 28 x 7 x – – 75 x,f
Tuvalu 6 x 15 x 35 x – – 51 x 2 x 10 x 3 x 6 x – –
Uganda 12 53 63 67 – 46 14 34 5 4 65 87 x,f
Ukraine 5 66 20 43 – 22 1 x 4 x 0 x – – 21
United Arab Emirates 6 – – – – – – – – – – –
United Kingdom 7 – – – – – – – – – – –
United Republic of Tanzania 8 49 50 92 – 51 14 35 7 – 92 56
United States 8 – – – – – 1 2 1 6 – –
Uruguay 8 – – – – – 4 11 1 7 – –
Uzbekistan 5 x 67 x 26 x 47 x – 38 x 4 x 20 x 5 x 13 x 99 53 x
Vanuatu 10 x 72 x 40 x 68 x – 32 x 12 x 26 x 6 x 5 x – 23 x
Venezuela (Bolivarian Republic of) 9 – – – – – 3 13 4 6 – –
Viet Nam 5 40 17 50 – 19 12 23 4 5 – 45
Yemen 32 30 x 10 – – 45 36 47 13 2 87 30 x
Zambia 11 x 57 x 61 x 94 x – 42 x 15 x 46 x 6 x 8 x 93 64 x
Zimbabwe 11 65 31 86 11 20 10 32 3 6 34 – f
Countries and areas
Low birthweight (%)
Early initiation of breastfeeding (%)
Exclusive breastfeeding<6 months (%)
Introduction to solid, semi-solid or soft foods 6-8
months (%)
Minimum acceptable diet 6-23 months (%)
Breastfeeding at age 2 (%)
Underweight (%) Stunting (%) Wasting (%) Overweight (%) Vitamin A supplementation, full coverage∆ (%)
Adequately iodized salt
consumption (%)moderate & severeࡌ
2009–2013* 2009-2013* 2009-2013* 2013 2009–2013*

STATISTICAL TABLES 47
TABLE 2. NUTRITION
SUMMARY
Sub-Saharan Africa 13 47 36 65 10 51 21 37 9 6 73 59
Eastern and Southern Africa 11 60 51 73 – 62 18 39 7 5 67 –
West and Central Africa 14 39 25 60 10 44 23 36 11 6 85 65
Middle East and North Africa – – 34 – – 36 7 18 8 10 – –
South Asia 28 39 47 58 – 75 32 38 15 4 60 69
East Asia and Pacific – 44 30 79 ** – 21 5 12 4 6 85 86
Latin America and Caribbean 9 49 32 88 – 27 3 11 1 7 – –
CEE/CIS 6 – – – – – 2 11 1 16 – –
Least developed countries 14 53 46 62 – 63 22 37 9 4 81 50
World 16 ** 44 38 65 ** – 49 15 25 8 6 69 75
DEFINITIONS OF THE INDICATORS
Low birthweight – Percentage of infants weighing less than 2,500 grams at birth.Early initiation of breastfeeding – Percentage of infants who are put to the breast within one hour of birth.Exclusive breastfeeding <6 months – Percentage of children aged 0–5 months who are fed exclusively with breast milk in the 24 hours prior to the survey.Introduction of solid, semi-solid or soft foods (6–8 months) – Percentage of children aged 6–8 months who received solid, semi-solid or soft foods in the 24 hours prior to the survey.Minimum acceptable diet (6-23 months) – Percentage of breastfed children aged 6–23 months who had at least the minimum dietary diversity and the minimum meal frequency during the previous day AND percentage of non-breastfed children aged 6–23 months who received at least 2 milk feedings and had at least the minimum dietary diversity not including milk feeds and the minimum meal frequency during the previous day.Breastfeeding at age 2 – Percentage of children aged 20–23 months who received breast milk in the 24 hours prior to the survey.Underweight – Moderate and severe: Percentage of children aged 0–59 months who are below minus two standard deviations from median weight-for-age of the World Health Organization (WHO) Child Growth Standards.Stunting – Moderate and severe: Percentage of children aged 0–59 months who are below minus two standard deviations from median height-for-age of the WHO Child Growth Standards.Wasting – Moderate and severe: Percentage of children aged 0–59 months who are below minus two standard deviations from median weight-for-height of the WHO Child Growth Standards.Overweight – Moderate and severe: Percentage of children aged 0-59 months who are above two standard deviations from median weight-for-height of the WHO Child Growth Standards. Vitamin A supplementation, full coverage – The estimated percentage of children aged 6–59 months reached with 2 doses of vitamin A supplements approximately 4-6 months apart in a given calendar year.Adequately iodized salt consumption – Percentage of households consuming adequately iodized salt (15 parts per million or more).
MAIN DATA SOURCES
NOTES
Low birthweight – Demographic and Health Surveys (DHS), Multiple Indicator Cluster Surveys (MICS), other national household surveys, data from routine reporting systems, UNICEF and WHO.Infant and young child feeding – DHS, MICS, other national household surveys and UNICEF.Underweight, stunting, wasting and overweight – DHS, MICS, other national household surveys, WHO and UNICEF.Vitamin A supplementation – UNICEF.Adequately iodized salt consumption – DHS, MICS, other national household surveys and UNICEF.
– Data not available.w Identifies countries with national vitamin A supplementation programmes targeted towards a reduced age range. Coverage
figure is reported as targeted.x Data refer to years or periods other than those specified in the column heading. Such data are not included in the calcula-
tion of regional and global averages, with the exception of 2005-2006 and 2007-2008 data from India, and 2008 data from China. Estimates from data years prior to 2000 are not displayed.
y Data differ from the standard definition or refer to only part of a country. If they fall within the noted reference period, such data are included in the calculation of regional and global averages.
U Full coverage with vitamin A supplements is reported as the lower percentage of 2 annual coverage points (i.e., lower point between semester 1 (January–June) and semester 2 (July–December) of 2013). Data are only presented for VAS priority countries; thus aggregates are only based on and representative of these priority countries.
Regional averages for underweight (moderate and severe), stunting (moderate and severe), wasting (moderate and severe) ࡌand overweight (moderate and severe) are estimated using statistical modeling of data from the UNICEF-WHO-World Bank Joint Global Nutrition Database, 2013 revision (completed September 2014). For more information: http://data.unicef.org/resources/2013/webapps/nutrition
f The most recent survey for this country uses an indicator definition that is not in line with the international standard. If available, a previous data point which conforms to the standard definition is presented instead.
* Data refer to the most recent year available during the period specified in the column heading.** Excludes China.
TAB
LE 2. NU
TRITIO
N
For a complete list of countries and areas in the regions, subregions and country categories, see page 32 or visit http://data.unicef.org/index.php?section=regional-classifications.It is not advisable to compare data from consecutive editions of The State of the World’s Children.
Countries and areas
Low birthweight (%)
Early initiation of breastfeeding (%)
Exclusive breastfeeding<6 months (%)
Introduction to solid, semi-solid or soft foods 6-8
months (%)
Minimum acceptable diet 6-23 months (%)
Breastfeeding at age 2 (%)
Underweight (%) Stunting (%) Wasting (%) Overweight (%) Vitamin A supplementation, full coverage∆ (%)
Adequately iodized salt
consumption (%)moderate & severeࡌ
2009–2013* 2009-2013* 2009-2013* 2013 2009–2013*

48 THE STATE OF THE WORLD’S CHILDREN 2015
Countries and areas
Use of improved drinking water
sources (%)
Use of improved sanitation facilities
(%)
Immunization coverage (%) Pneumonia Diarrhoea Malaria
BCG DTP1ǃ DTP3ǃ polio3 MCV1 HepB3 Hib3 rota PCV3
Newborns protected
against tetanusNJ
Care seeking for children
with symptoms of pneumonia
(%)
Antibiotic treatment for children with symptoms of
pneumonia (%)
Treatment with oral rehydration salts (ORS) (%)
Antimalarial treatment for children with
fever (%)
Children sleeping under
ITNs (%)
Households with at least one ITN (%)2012 2012
total urban rural total urban rural 2013 2009-2013* 2009-2013* 2009-2013*Afghanistan 64 90 56 29 47 23 75 86 71 71 75 71 71 0 0 65 61 64 53 – – –Albania 96 97 94 91 95 86 99 99 99 99 99 99 99 0 99 87 70 60 54 – – –Algeria 84 85 79 95 98 88 99 99 95 95 95 95 95 0 0 90 76 64 34 – – –Andorra 100 100 100 100 100 100 – 98 96 96 95 94 96 0 0 – – – – – – –Angola 54 68 34 60 87 20 85 97 93 80 91 93 93 0 9 75 – – – 28 26 35Antigua and Barbuda 98 – – – – – – 99 99 98 98 98 99 0 0 – – – – – – –Argentina 99 99 95 97 97 99 99 93 87 87 91 87 87 0 81 – 94 45 18 – – –Armenia 100 100 100 91 96 81 99 97 95 96 97 95 95 33 0 – 57 36 33 – – –Australia 100 100 100 100 100 100 – 92 91 91 94 91 91 84 91 – – – – – – –Austria 100 100 100 100 100 100 – 93 83 83 76 83 83 61 0 – – – – – – –Azerbaijan 80 88 71 82 86 78 98 95 93 96 98 93 93 0 0 – 36 x – 21 x 1 x 1 x –Bahamas 98 – – 92 – – – 99 97 97 92 97 97 0 97 99 – – – – – –Bahrain 100 – – 99 – – – 99 99 99 99 99 99 97 99 94 – – – – – –Bangladesh 85 86 84 57 55 58 99 99 97 97 93 97 97 0 0 94 43 87 78 1 – –Barbados 100 – – – – – – 93 87 88 90 87 87 0 75 – – – – – – –Belarus 100 100 99 94 94 95 99 99 98 98 99 98 23 0 0 – 93 77 45 – – –Belgium 100 100 100 100 100 100 – 99 99 99 92 98 92 86 93 – – – – – – –Belize 99 98 100 91 94 88 99 96 95 95 99 95 95 0 0 88 82 71 23 – – –Benin 76 85 69 14 25 5 88 85 69 71 63 78 78 0 69 93 31 29 50 38 70 80Bhutan 98 99 97 47 75 31 97 97 97 97 94 97 97 0 0 83 74 49 61 – – –Bolivia (Plurinational State of) 88 96 72 46 57 24 99 98 94 95 95 94 94 93 0 76 62 64 x 35 x – – –Bosnia and Herzegovina 100 100 99 95 99 92 96 95 92 87 94 92 87 0 0 – 87 76 36 – – –Botswana 97 99 93 64 78 42 99 98 96 96 94 96 96 78 65 92 14 x 37 x 49 x – – –Brazil 98 100 85 81 87 49 99 99 95 99 99 95 95 89 93 93 50 x – – – – –Brunei Darussalam – – – – – – 99 96 90 90 99 99 90 0 0 95 – – – – – –Bulgaria 99 100 99 100 100 100 97 96 95 95 94 95 95 0 94 – – – – – – –Burkina Faso 82 97 76 19 50 7 96 94 88 89 82 88 88 9 0 88 56 47 21 35 47 57Burundi 75 92 73 47 43 48 95 98 96 96 98 96 96 0 96 85 55 43 38 25 54 63Cabo Verde 89 91 86 65 75 47 94 93 93 93 91 93 93 0 0 92 – – – – – –Cambodia 71 94 66 37 82 25 93 95 92 77 90 92 92 0 0 91 64 39 34 0 4 x 5 xCameroon 74 94 52 45 62 27 82 95 89 88 83 89 89 0 88 85 30 45 17 23 21 36Canada 100 100 99 100 100 99 – 98 96 96 95 75 96 0 77 – – – – – – –Central African Republic 68 90 54 22 44 7 37 35 23 23 25 23 23 0 23 66 30 31 16 34 36 47Chad 51 72 45 12 31 6 62 55 48 56 59 48 48 0 0 50 26 31 13 43 10 42Chile 99 100 91 99 100 89 98 92 91 90 90 90 90 0 79 – – – – – – –China 92 98 85 65 74 56 99 99 99 99 99 99 0 0 0 – – – – – – –Colombia 91 97 74 80 85 66 85 97 91 91 92 91 91 87 87 79 64 – 54 – – 3 xComoros – – 97 – – – 78 85 83 82 82 83 83 0 0 85 38 21 38 27 41 59Congo 75 96 39 15 20 6 92 90 69 67 65 69 69 0 69 83 52 59 28 25 26 27Cook Islands 100 – – 97 – – 98 98 98 98 97 98 98 0 0 – – – – – – –
TABLE 3. HEALTH
STATISTICAL TABLES 49
TABLE 3. HEALTH
Costa Rica 97 100 91 94 95 92 79 98 95 95 91 94 95 0 94 – 77 72 40 – – –Côte d'Ivoire 80 92 68 22 33 10 84 93 88 87 74 88 88 0 0 82 38 29 17 18 37 67Croatia 99 100 97 98 99 98 99 98 96 96 94 96 96 0 0 – – – – – – –Cuba 94 96 87 93 94 88 99 98 96 98 99 96 96 0 0 – 97 70 51 – – –Cyprus 100 100 100 100 100 100 – 99 99 99 86 96 96 0 0 – – – – – – –Czech Republic 100 100 100 100 100 100 – 99 99 99 99 99 99 0 0 – – – – – – –Democratic People's Republic of Korea 98 99 97 82 88 73 98 94 93 99 99 93 0 0 0 93 80 88 74 – – –
Democratic Republic of the Congo 46 79 29 31 29 33 78 86 72 76 73 72 72 0 26 75 40 42 27 39 38 51Denmark 100 100 100 100 100 100 – 97 94 94 89 0 94 0 90 – – – – – – –Djibouti 92 100 65 61 73 22 86 87 82 82 80 82 82 0 82 79 94 76 94 1 20 32Dominica – 96 – – – – 97 98 96 96 93 96 96 0 0 – – – – – – –Dominican Republic 81 82 77 82 86 74 98 91 83 82 79 80 75 68 0 90 70 42 48 – – –Ecuador 86 92 75 83 86 76 99 99 99 99 97 98 99 97 90 85 – – – – – –Egypt 99 100 99 96 98 94 98 97 97 97 96 97 0 0 0 86 73 x 58 x 28 x – – –El Salvador 90 95 81 70 80 53 90 97 92 92 94 92 92 92 92 90 67 x 51 x 58 x – – –Equatorial Guinea – – – – – – 71 55 3 30 42 0 0 0 0 75 54 27 40 33 23 38Eritrea – – – – – 4 97 97 94 94 96 94 94 0 0 94 45 – 43 2 20 71 xEstonia 99 100 98 95 96 94 96 96 94 94 94 93 94 0 0 – – – – – – –Ethiopia 52 97 42 24 27 23 71 84 72 70 62 72 72 0 63 72 27 7 26 26 30 47Fiji 96 100 92 87 92 82 99 99 99 99 94 99 99 85 87 94 – – – – – –Finland 100 100 100 100 100 100 – 99 98 98 97 0 98 93 0 – – – – – – –France 100 100 100 100 100 100 – 99 99 99 89 74 98 0 89 – – – – – – –Gabon 92 97 63 41 43 32 92 80 79 77 70 79 79 0 0 85 68 50 26 26 39 36Gambia 90 94 84 60 64 55 98 99 97 96 96 97 97 7 96 82 69 70 39 30 33 51Georgia 99 100 97 93 96 91 95 99 98 94 96 93 93 41 0 – 74 x 56 x 40 x – – –Germany 100 100 100 100 100 100 – 98 96 95 97 87 94 0 68 – – – – – – –Ghana 87 93 81 14 20 8 98 94 90 91 89 90 90 87 89 88 41 56 35 53 39 48Greece 100 100 99 99 99 97 – 99 99 99 99 98 94 0 32 – – – – – – –Grenada 97 – – 98 – – – 99 97 98 94 97 97 0 0 – – – – – – –Guatemala 94 99 89 80 88 72 88 97 85 84 85 85 85 81 0 85 64 x – 37 – – –Guinea 75 92 65 19 33 11 66 76 63 64 62 63 63 0 0 80 37 38 34 28 26 47Guinea-Bissau 74 96 56 20 34 8 94 92 80 78 69 76 76 0 0 80 52 35 19 51 36 53Guyana 98 97 98 84 88 82 98 98 98 98 99 98 98 94 96 90 65 18 50 6 24 26Haiti 62 75 47 24 31 16 83 86 68 67 65 68 68 0 0 76 38 46 53 3 12 19Holy See – – – – – – – – – – – – – – – – – – – – – –Honduras 90 97 82 80 85 74 87 88 87 87 89 87 87 87 87 94 64 60 60 0 – –Hungary 100 100 100 100 100 100 99 99 99 99 99 0 99 0 92 – – – – – – –Iceland 100 100 100 100 100 100 – 97 91 91 91 0 91 0 88 – – – – – – –India 93 97 91 36 60 25 87 88 72 70 74 67 20 0 0 87 69 x 13 x 26 x 8 x – –
TAB
LE 3. HEA
LTH
Countries and areas
Use of improved drinking water
sources (%)
Use of improved sanitation facilities
(%)
Immunization coverage (%) Pneumonia Diarrhoea Malaria
BCG DTP1ǃ DTP3ǃ polio3 MCV1 HepB3 Hib3 rota PCV3
Newborns protected
against tetanusNJ
Care seeking for children
with symptoms of pneumonia
(%)
Antibiotic treatment for children with symptoms of
pneumonia (%)
Treatment with oral rehydration salts (ORS) (%)
Antimalarial treatment for children with
fever (%)
Children sleeping under
ITNs (%)
Households with at least one ITN (%)2012 2012
total urban rural total urban rural 2013 2009-2013* 2009-2013* 2009-2013*

50 THE STATE OF THE WORLD’S CHILDREN 2015
Indonesia 85 93 76 59 71 46 98 98 85 86 84 85 4 0 0 85 75 39 39 1 3 x 3 xIran (Islamic Republic of) 96 98 92 89 93 82 99 98 98 98 98 99 0 0 0 95 76 63 61 – – –Iraq 85 94 69 85 86 82 90 82 68 70 63 66 68 52 0 72 74 67 23 1 x 0 x –Ireland 100 100 100 99 100 98 42 98 96 96 93 95 95 0 91 – – – – – – –Israel 100 100 100 100 100 100 – 95 94 94 97 98 94 0 92 – – – – – – –Italy 100 100 100 – – – – 99 97 97 90 97 96 0 55 – – – – – – –Jamaica 93 97 89 80 78 82 93 97 93 86 94 93 93 0 0 80 82 59 64 – – –Japan 100 100 100 100 100 100 93 99 98 99 95 0 0 0 0 – – – – – – –Jordan 96 97 90 98 98 98 98 99 98 98 97 98 98 0 0 90 77 87 20 – – –Kazakhstan 93 99 86 97 97 98 95 99 98 98 99 99 98 0 52 – 81 87 62 – – –Kenya 62 82 55 30 31 29 79 82 76 82 93 83 83 0 75 73 56 50 39 23 47 56Kiribati 67 87 51 40 51 31 86 95 95 91 91 95 95 0 0 – 81 51 62 – – –Kuwait 99 99 99 100 100 100 99 99 99 99 99 99 99 0 99 95 – – – – – –Kyrgyzstan 88 97 82 92 92 92 98 98 97 97 99 97 97 0 0 – 62 x 45 x 35 – – –Lao People's Democratic Republic 72 84 65 65 90 50 82 89 87 86 82 87 87 0 0 90 54 57 42 2 43 50Latvia 98 100 96 – – – 96 96 95 95 96 95 95 0 88 – – – – – – –Lebanon 100 100 100 – 100 – – 84 81 75 79 81 81 0 0 – 74 x – 44 x – – –Lesotho 81 93 77 30 37 27 87 97 96 95 92 96 96 0 0 83 66 – 51 – – –Liberia 75 87 63 17 28 6 87 97 89 88 74 89 89 0 0 91 62 x – 53 x 57 37 50Libya – – – 97 97 96 99 99 98 98 98 98 98 0 0 – – – – – – –Liechtenstein – – – – – – – – – – – – – – – – – – – – – –Lithuania 96 99 89 94 99 85 98 97 93 93 93 93 93 0 0 – – – – – – –Luxembourg 100 100 100 100 100 100 – 99 99 99 95 94 98 89 95 – – – – – – –Madagascar 50 78 35 14 19 11 77 80 74 73 63 74 74 0 92 78 41 33 15 20 77 80Malawi 85 95 83 10 22 8 96 96 89 89 88 89 89 81 89 89 70 30 x 69 33 56 55Malaysia 100 100 99 96 96 95 99 99 97 97 95 96 97 0 0 90 – – – – – –Maldives 99 100 98 99 97 100 99 99 99 99 99 99 58 0 0 95 22 x – 57 – – –Mali 67 91 54 22 35 15 87 82 74 81 72 74 74 0 74 85 42 44 11 32 46 77Malta 100 100 100 100 100 100 – 99 99 99 99 94 99 0 0 – – – – – – –Marshall Islands 95 93 98 76 84 56 93 73 36 36 70 41 21 45 22 – – – 38 x – – –Mauritania 50 52 48 27 51 9 95 95 80 80 80 80 80 0 1 80 43 30 19 20 19 46Mauritius 100 100 100 91 92 90 99 99 98 98 99 98 98 0 0 95 – – – – – –Mexico 95 96 91 85 87 79 91 90 83 83 89 82 83 81 84 88 – – 52 – – –Micronesia (Federated States of) 89 95 87 57 85 49 70 98 81 81 91 83 68 33 61 – – – – – – –Monaco 100 100 – 100 100 – 89 99 99 99 99 99 99 0 0 – – – – – – –Mongolia 85 95 61 56 65 35 99 98 98 98 97 98 98 0 0 – 87 73 31 – – –Montenegro 98 100 95 90 92 87 93 98 94 94 88 90 94 0 0 – 89 x 57 x 16 x – – –Morocco 84 98 64 75 85 63 99 99 99 99 99 99 99 90 80 89 70 38 22 – – –Mozambique 49 80 35 21 44 11 93 93 78 78 85 78 78 0 45 83 50 12 55 30 36 51Myanmar 86 95 81 77 84 74 86 90 75 76 86 72 72 0 0 87 69 34 61 – 11 –
TABLE 3. HEALTH
Countries and areas
Use of improved drinking water
sources (%)
Use of improved sanitation facilities
(%)
Immunization coverage (%) Pneumonia Diarrhoea Malaria
BCG DTP1ǃ DTP3ǃ polio3 MCV1 HepB3 Hib3 rota PCV3
Newborns protected
against tetanusNJ
Care seeking for children
with symptoms of pneumonia
(%)
Antibiotic treatment for children with symptoms of
pneumonia (%)
Treatment with oral rehydration salts (ORS) (%)
Antimalarial treatment for children with
fever (%)
Children sleeping under
ITNs (%)
Households with at least one ITN (%)2012 2012
total urban rural total urban rural 2013 2009-2013* 2009-2013* 2009-2013*

STATISTICAL TABLES 51
TABLE 3. HEALTH
Namibia 92 98 87 32 56 17 94 94 89 89 82 89 89 0 0 83 53 x – 63 x 20 34 54Nauru 96 96 – 66 66 – 99 98 79 79 96 79 79 0 0 – 69 x 47 x 23 x – – –Nepal 88 90 88 37 51 34 97 94 92 92 88 92 92 0 0 82 50 7 39 1 – –Netherlands 100 100 100 100 100 100 – 99 97 97 96 95 97 0 96 – – – – – – –New Zealand 100 100 100 – – – – 93 92 92 92 93 92 0 93 – – – – – – –Nicaragua 85 98 68 52 63 37 98 99 98 99 99 98 98 98 98 81 58 x 89 65 2 x – –Niger 52 99 42 9 33 4 49 85 70 63 67 70 70 0 0 81 53 11 44 19 20 61Nigeria 64 79 49 28 31 25 80 63 58 67 59 63 46 0 0 60 35 37 34 33 17 50Niue 99 – – 100 – – 99 99 99 99 99 99 99 0 99 – – – – – – –Norway 100 100 100 100 100 100 – 99 94 94 93 0 95 0 93 – – – – – – –Oman 93 95 86 97 97 95 99 99 98 99 99 97 98 0 99 91 – – – – – –Pakistan 91 96 89 48 72 34 85 79 72 72 61 72 72 0 66 75 64 42 38 3 – 1Palau – 97 – 100 100 100 – 99 99 99 99 99 99 99 93 – – – – – – –Panama 94 97 87 73 80 52 95 93 80 81 92 80 80 87 48 – – – – – – –Papua New Guinea 40 88 33 19 56 13 88 88 68 69 70 68 68 0 0 65 63 x – – – – –Paraguay 94 100 83 80 96 53 90 93 86 80 92 86 86 83 73 85 – – – – – –Peru 87 91 72 73 81 45 95 97 88 71 85 88 88 86 85 85 59 48 31 – – –Philippines 92 92 91 74 79 69 91 98 94 88 90 94 94 28 0 80 50 x 42 x 55 0 x – –Poland – 100 – – 96 – 93 99 99 95 98 96 99 0 0 – – – – – – –Portugal 100 100 100 100 100 100 99 99 98 98 98 98 98 0 0 – – – – – – –Qatar 100 100 100 100 100 100 98 99 99 99 99 99 99 87 99 – – – – – – –Republic of Korea 98 100 88 100 100 100 99 99 99 99 99 99 0 0 0 – – – – – – –Republic of Moldova 97 99 94 87 89 84 96 96 90 92 91 91 89 65 0 – 79 82 42 – – –Romania – 99 – – – – 98 96 89 88 92 96 92 0 0 – – – – – – –Russian Federation 97 99 92 70 74 59 96 97 97 98 98 97 18 0 0 – – – – – – –Rwanda 71 81 68 64 61 64 99 99 98 98 97 98 98 99 98 85 50 13 x 29 12 74 83Saint Kitts and Nevis 98 – – – – – 94 99 96 96 99 97 97 0 0 – – – – – – –Saint Lucia 94 99 93 – – – 99 99 99 99 99 99 99 0 0 – – – – – – –Saint Vincent and the Grenadines 95 – – – – – 96 96 96 96 99 96 97 0 0 – – – – – – –Samoa 99 97 99 92 93 91 95 99 95 95 99 95 95 0 0 – – – 68 – – –San Marino – – – – – – – 72 69 69 74 69 69 0 0 – – – – – – –Sao Tome and Principe 97 99 94 34 41 23 97 99 97 97 91 97 97 0 97 – 75 60 49 8 56 61Saudi Arabia 97 – – 100 – – 99 98 98 98 98 98 98 84 98 – – – – – – –Senegal 74 92 60 52 67 40 97 96 92 89 84 92 92 0 0 91 53 – 17 6 46 73Serbia 99 99 99 97 99 96 97 98 95 97 92 91 92 0 0 – 90 82 36 – – –Seychelles 96 – – 97 – – 99 99 98 98 97 99 98 0 0 – – – – – – –Sierra Leone 60 87 42 13 22 7 99 98 92 92 83 92 92 0 92 87 72 58 85 48 49 64Singapore 100 100 – 100 100 – 99 98 97 97 95 97 0 0 0 – – – – – – –Slovakia 100 100 100 100 100 100 90 99 98 98 98 98 98 0 98 – – – – – – –Slovenia 100 100 99 100 100 100 – 98 95 95 94 0 95 0 0 – – – – – – –
TAB
LE 3. HEA
LTH
Countries and areas
Use of improved drinking water
sources (%)
Use of improved sanitation facilities
(%)
Immunization coverage (%) Pneumonia Diarrhoea Malaria
BCG DTP1ǃ DTP3ǃ polio3 MCV1 HepB3 Hib3 rota PCV3
Newborns protected
against tetanusNJ
Care seeking for children
with symptoms of pneumonia
(%)
Antibiotic treatment for children with symptoms of
pneumonia (%)
Treatment with oral rehydration salts (ORS) (%)
Antimalarial treatment for children with
fever (%)
Children sleeping under
ITNs (%)
Households with at least one ITN (%)2012 2012
total urban rural total urban rural 2013 2009-2013* 2009-2013* 2009-2013*
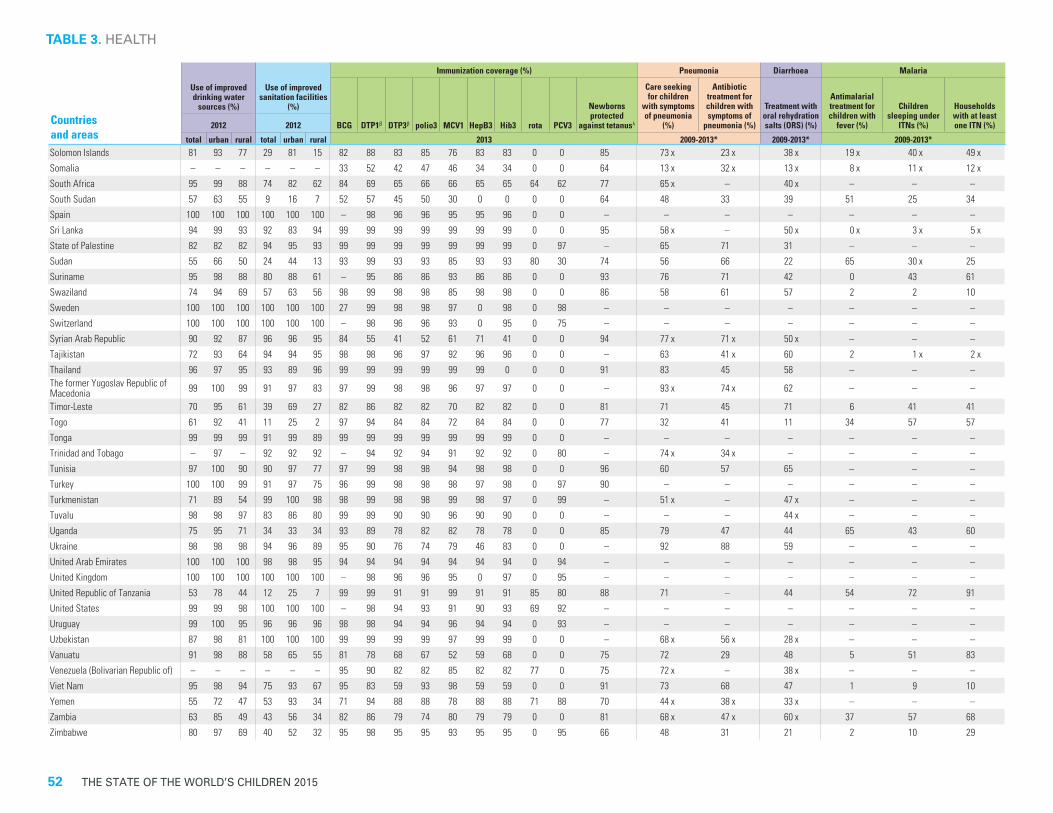
52 THE STATE OF THE WORLD’S CHILDREN 2015
TABLE 3. HEALTH
Solomon Islands 81 93 77 29 81 15 82 88 83 85 76 83 83 0 0 85 73 x 23 x 38 x 19 x 40 x 49 xSomalia – – – – – – 33 52 42 47 46 34 34 0 0 64 13 x 32 x 13 x 8 x 11 x 12 xSouth Africa 95 99 88 74 82 62 84 69 65 66 66 65 65 64 62 77 65 x – 40 x – – –South Sudan 57 63 55 9 16 7 52 57 45 50 30 0 0 0 0 64 48 33 39 51 25 34Spain 100 100 100 100 100 100 – 98 96 96 95 95 96 0 0 – – – – – – –Sri Lanka 94 99 93 92 83 94 99 99 99 99 99 99 99 0 0 95 58 x – 50 x 0 x 3 x 5 xState of Palestine 82 82 82 94 95 93 99 99 99 99 99 99 99 0 97 – 65 71 31 – – –Sudan 55 66 50 24 44 13 93 99 93 93 85 93 93 80 30 74 56 66 22 65 30 x 25Suriname 95 98 88 80 88 61 – 95 86 86 93 86 86 0 0 93 76 71 42 0 43 61Swaziland 74 94 69 57 63 56 98 99 98 98 85 98 98 0 0 86 58 61 57 2 2 10Sweden 100 100 100 100 100 100 27 99 98 98 97 0 98 0 98 – – – – – – –Switzerland 100 100 100 100 100 100 – 98 96 96 93 0 95 0 75 – – – – – – –Syrian Arab Republic 90 92 87 96 96 95 84 55 41 52 61 71 41 0 0 94 77 x 71 x 50 x – – –Tajikistan 72 93 64 94 94 95 98 98 96 97 92 96 96 0 0 – 63 41 x 60 2 1 x 2 xThailand 96 97 95 93 89 96 99 99 99 99 99 99 0 0 0 91 83 45 58 – – –The former Yugoslav Republic of Macedonia 99 100 99 91 97 83 97 99 98 98 96 97 97 0 0 – 93 x 74 x 62 – – –
Timor-Leste 70 95 61 39 69 27 82 86 82 82 70 82 82 0 0 81 71 45 71 6 41 41Togo 61 92 41 11 25 2 97 94 84 84 72 84 84 0 0 77 32 41 11 34 57 57Tonga 99 99 99 91 99 89 99 99 99 99 99 99 99 0 0 – – – – – – –Trinidad and Tobago – 97 – 92 92 92 – 94 92 94 91 92 92 0 80 – 74 x 34 x – – – –Tunisia 97 100 90 90 97 77 97 99 98 98 94 98 98 0 0 96 60 57 65 – – –Turkey 100 100 99 91 97 75 96 99 98 98 98 97 98 0 97 90 – – – – – –Turkmenistan 71 89 54 99 100 98 98 99 98 98 99 98 97 0 99 – 51 x – 47 x – – –Tuvalu 98 98 97 83 86 80 99 99 90 90 96 90 90 0 0 – – – 44 x – – –Uganda 75 95 71 34 33 34 93 89 78 82 82 78 78 0 0 85 79 47 44 65 43 60Ukraine 98 98 98 94 96 89 95 90 76 74 79 46 83 0 0 – 92 88 59 – – –United Arab Emirates 100 100 100 98 98 95 94 94 94 94 94 94 94 0 94 – – – – – – –United Kingdom 100 100 100 100 100 100 – 98 96 96 95 0 97 0 95 – – – – – – –United Republic of Tanzania 53 78 44 12 25 7 99 99 91 91 99 91 91 85 80 88 71 – 44 54 72 91United States 99 99 98 100 100 100 – 98 94 93 91 90 93 69 92 – – – – – – –Uruguay 99 100 95 96 96 96 98 98 94 94 96 94 94 0 93 – – – – – – –Uzbekistan 87 98 81 100 100 100 99 99 99 99 97 99 99 0 0 – 68 x 56 x 28 x – – –Vanuatu 91 98 88 58 65 55 81 78 68 67 52 59 68 0 0 75 72 29 48 5 51 83Venezuela (Bolivarian Republic of) – – – – – – 95 90 82 82 85 82 82 77 0 75 72 x – 38 x – – –Viet Nam 95 98 94 75 93 67 95 83 59 93 98 59 59 0 0 91 73 68 47 1 9 10Yemen 55 72 47 53 93 34 71 94 88 88 78 88 88 71 88 70 44 x 38 x 33 x – – –Zambia 63 85 49 43 56 34 82 86 79 74 80 79 79 0 0 81 68 x 47 x 60 x 37 57 68Zimbabwe 80 97 69 40 52 32 95 98 95 95 93 95 95 0 95 66 48 31 21 2 10 29
Countries and areas
Use of improved drinking water
sources (%)
Use of improved sanitation facilities
(%)
Immunization coverage (%) Pneumonia Diarrhoea Malaria
BCG DTP1ǃ DTP3ǃ polio3 MCV1 HepB3 Hib3 rota PCV3
Newborns protected
against tetanusNJ
Care seeking for children
with symptoms of pneumonia
(%)
Antibiotic treatment for children with symptoms of
pneumonia (%)
Treatment with oral rehydration salts (ORS) (%)
Antimalarial treatment for children with
fever (%)
Children sleeping under
ITNs (%)
Households with at least one ITN (%)2012 2012
total urban rural total urban rural 2013 2009-2013* 2009-2013* 2009-2013*

STATISTICAL TABLES 53
TABLE 3. HEALTH
SUMMARY
Sub-Saharan Africa 64 85 53 29 41 23 82 82 74 76 74 75 72 15 35 75 45 36 33 34 36 54 Eastern and Southern Africa 65 88 55 33 52 26 83 87 79 79 79 78 78 21 53 79 52 28 37 34 45 58 West and Central Africa 65 84 50 26 34 20 80 77 69 73 68 71 64 4 19 72 39 38 29 33 28 53Middle East and North Africa 88 94 79 84 92 71 94 94 90 91 89 91 57 32 25 84 70 62 36 – – –South Asia 91 95 89 40 61 30 88 88 75 73 75 71 37 0 8 85 65 25 33 7 – –East Asia and Pacific 91 97 85 68 77 58 97 98 93 95 95 93 17 2 0 86 ** 74 ** 46 ** 47 ** 1 ** – –Latin America and Caribbean 94 97 82 82 87 63 94 95 89 89 92 89 89 73 71 87 60 – 46 – – –CEE/CIS 96 99 90 85 87 81 97 97 95 95 96 93 71 1 28 90 – – – – – –Least developed countries 67 84 60 36 48 31 84 89 80 80 79 80 80 14 31 80 50 42 41 30 41 56World 89 96 82 64 80 47 90 91 84 84 84 81 52 14 25 82 ** 60 ** 35 ** 36 ** 18 ** – –
DEFINITIONS OF THE INDICATORS
Population using improved drinking water sources – Percentage of the population using any of the following as their main drinking water source: drinking water supply piped into dwelling, plot, yard or neighbor’s yard; public tap or standpipe; tube well or borehole; protected dug well; protected spring; rainwater; bottled water plus one of the previous sources as their secondary source.Population using improved sanitation facilities – Percentage of the population using any of the following sanitation facilities, not shared with other households: flush or pour-flush latrine connected to a piped sewerage system, septic tank or pit latrine; ventilated improved pit latrine; pit latrine with a slab; composting toilet.EPI – Expanded Programme on Immunization: The first diseases targeted by the EPI were diphtheria, pertussis (whooping cough) and tetanus (DPT); measles; poliomyelitis; and tuberculosis (TB). Additional vaccines have been added to the original six recommended in 1974 and include vaccines to protect against hepatitis B (HepB), and Haemophilus influenzae type b (Hib). Pneumococcal conjugate vaccine (PCV) and rotavirus vaccine, also recommended by the WHO, are increasingly being added to national schedules.BCG – Percentage of live births who received bacille Calmette-Guérin (vaccine against tuberculosis).DTP1 – Percentage of surviving infants who received their first dose of diphtheria, pertussis and tetanus vaccine.DTP3 – Percentage of surviving infants who received three doses of diphtheria, pertussis and tetanus vaccine.Polio3 – Percentage of surviving infants who received three doses of the polio vaccine.MCV1 – Percentage of surviving infants who received the first dose of the measles-containing vaccine.HepB3 – Percentage of surviving infants who received three doses of hepatitis B vaccine.Hib3 – Percentage of surviving infants who received three doses of Haemophilus influenzae type b vaccine.rota – Percentage of surviving infants who received the last dose of rotavirus vaccine as recommended.PCV3 – Percentage of surviving infants who received three doses of pneumococcal conjugate vaccine.Newborns protected against tetanus – Percentage of newborns protected at birth against tetanus.Care-seeking for children with symptoms of pneumonia – Percentage of children under age 5 with symptoms of pneumonia (cough and fast or difficult breathing due to a problem in the chest) in the two weeks preceding the survey for whom advice or treatment was sought from a health facility or provider.Antibiotic treatment for children with symptoms of pneumonia – Percentage of children under age 5 with symptoms of pneumonia (cough and fast or difficult breathing due to a problem in the chest) in the two weeks preceding the survey who received antibiotics. NB: This indicator refers to antibiotic treatment among children whose caretakers report symptoms that are consistent with pneumonia. These children have not been medically diagnosed and thus this indicator should be interpreted with caution.Diarrhoea treatment with oral rehydration salts (ORS) – Percentage of children under age 5 who had diarrhoea in the two weeks preceding the survey and who received oral rehydration salts (ORS packets or pre-packaged ORS fluids). Antimalarial treatment among febrile children – Percentage of children under age 5 who were ill with fever in the two weeks preceding the survey and received any antimalarial medicine. NB: This indicator refers to antimalarial treatment among all febrile
MAIN DATA SOURCES
NOTES
Use of improved drinking water sources and improved sanitation facilities – WHO/UNICEF Joint Monitoring Programme for Water Supply and Sanitation (JMP).
Immunization – UNICEF and WHO.
Care-seeking and treatment for symptoms of pneumonia – Demographic and Health Surveys (DHS), Multiple Indicator Cluster Surveys (MICS) and other national household surveys.
Diarrhoea treatment – DHS, MICS and other national household surveys.
Malaria prevention and treatment – DHS, MICS, Malaria Indicator Surveys (MIS) and other national household surveys.
children, rather than among confirmed malaria cases, and thus should be interpreted with caution. For more information, please refer to http://data.unicef.org/resources/household-survey-indicators-for-malaria-control-2013-edition pg. 55.Children sleeping under ITNs – Percentage of children under age 5 who slept under an insecticide-treated mosquito net the night prior to the survey.Households with at least one ITN – Percentage of households with at least one insecticide-treated mosquito net.
− Data not available.
x Data refer to years or periods other than those specified in the column heading. Such data are not included in the calculation of regional and global averages, with the exception of 2005-2006 data from India and 2006 data from Brazil. Estimates from data years prior to 2000 are not displayed.
ǃ Coverage for DPT1 should be at least as high as DPT3. Discrepancies where DPT1 coverage is less than DPT3 reflect deficiencies in the data collection and reporting process. UNICEF and WHO are working with national and territorial systems to eliminate these discrepancies.
NJ WHO and UNICEF have employed a model to calculate the percentage of births that can be considered as protected against tetanus because pregnant women were given two doses or more of tetanus toxoid (TT) vaccine. The model aims to improve the accuracy of this indicator by capturing or including other potential scenarios where women might be protected (e.g., women who receive doses of TT in supplemental immunization activities). A fuller explanation of the methodology can be found at <data.unicef.org>.
* Data refer to the most recent year available during the period specified in the column heading.
** Excludes China.
TAB
LE 3. HEA
LTH
For a complete list of countries and areas in the regions, subregions and country categories, see page 32 or visit http://data.unicef.org/index.php?section=regional-classifications.It is not advisable to compare data from consecutive editions of The State of the World’s Children.
Countries and areas
Use of improved drinking water
sources (%)
Use of improved sanitation facilities
(%)
Immunization coverage (%) Pneumonia Diarrhoea Malaria
BCG DTP1ǃ DTP3ǃ polio3 MCV1 HepB3 Hib3 rota PCV3
Newborns protected
against tetanusNJ
Care seeking for children
with symptoms of pneumonia
(%)
Antibiotic treatment for children with symptoms of
pneumonia (%)
Treatment with oral rehydration salts (ORS) (%)
Antimalarial treatment for children with
fever (%)
Children sleeping under
ITNs (%)
Households with at least one ITN (%)2012 2012
total urban rural total urban rural 2013 2009-2013* 2009-2013* 2009-2013*

54 THE STATE OF THE WORLD’S CHILDREN 2015
Countries and areas
Adult HIV prevalence
(%)2013
People of all ages living with HIV (thousands)
2013
Mother–to–child transmission
Paediatric infections Prevention among young people (aged 15-24) HIV testing Orphans
Women living with HIV
(thousands)2013
Children living
with HIV (thousands)
2013
HIV prevalence among young people (%)
2013
Comprehensive knowledge of HIV (%)
2009–2013*
Condom use among young people with
multiple partners (%)2009–2013*
Young people who were tested for HIV in the last 12 months and
received results (%)2009–2013*
Children orphaned by AIDS
(thousands)2013
Children orphaned due to all
causes (thousands)
2013
Orphan school
attendance ratio (%)
estimate estimate low high estimate estimate total male female male female male female male female estimate estimate 2009–2013*Afghanistan <0.1 5 2 17 2 <0.5 <0.1 <0.1 <0.1 – 2 – – – – – – –Albania <0.1 <1.0 <0.5 1 <0.2 – <0.1 <0.1 <0.1 22 36 55 – 1 0 – – –Algeria 0.1 25 13 43 12 1 <0.1 <0.1 <0.1 – 13 x – – – – – – –Andorra – – – – – – – – – – – – – – – – – –Angola 2.4 250 180 340 130 29 0.9 0.6 1.2 32 25 – – – – 120 1,100 85Antigua and Barbuda – – – – – – – – – 53 46 – – – – – – –Argentina – – – – – – – – – – 40 – – – – – – –Armenia 0.2 4 2 6 <1.0 – <0.1 <0.1 <0.1 9 16 86 – 0 3 – – –Australia 0.2 28 26 34 3 – <0.1 <0.1 <0.1 – – – – – – – – –Austria – – – – – – – – – – – – – – – – – –Azerbaijan 0.2 9 7 12 3 <0.2 0.1 0.1 <0.1 5 x 5 x 29 x – – – – – –Bahamas 3.2 8 7 8 4 <0.2 1.6 1.4 1.9 – – – – – – – – –Bahrain – – – – – – – – – – – – – – – – – –Bangladesh <0.1 10 4 97 3 <0.5 <0.1 <0.1 <0.1 14 12 – – – – – – 84 xBarbados 0.9 2 1 2 <0.5 – 0.3 0.4 0.3 – – – – – – – – –Belarus 0.5 25 24 27 11 – 0.4 0.3 0.5 51 56 73 64 p 19 24 – – –Belgium – – – – – – – – – – – – – – – – – –Belize 1.5 3 3 4 1 <0.5 0.6 0.6 0.6 – 43 – 26 x,p – 25 – – –Benin 1.1 74 69 80 39 8 0.3 0.2 0.4 31 25 44 35 5 14 40 450 84Bhutan 0.1 <1.0 <0.5 2 <0.5 – <0.1 <0.1 0.1 – 21 – – – 8 – – –Bolivia (Plurinational State of) 0.3 15 8 33 5 1 0.1 0.1 <0.1 28 x 22 x 41 x – 2 – – – –Bosnia and Herzegovina – – – – – – – – – 47 48 67 – 1 0 – – –Botswana 21.9 320 310 340 180 11 4.7 3.5 6.0 – – – – – – 96 130 –Brazil 0.6 730 660 810 210 – 0.3 0.4 0.2 – – – – – – – – –Brunei Darussalam – – – – – – – – – – – – – – – – – –Bulgaria – – – – – – – – – – – – – – – – – –Burkina Faso 0.9 110 100 130 56 18 0.4 0.4 0.5 36 31 75 65 7 12 120 990 101Burundi 1 83 76 91 39 18 0.2 0.1 0.2 47 45 – – 11 18 73 740 82Cabo Verde 0.5 2 1 2 <1.0 <0.2 0.3 0.2 0.3 – – – – – – – – –Cambodia 0.7 75 41 130 39 5 0.2 0.2 0.2 44 44 – – 5 8 – – 86Cameroon 4.3 600 560 650 300 94 1.5 1.0 1.9 34 29 67 47 13 21 510 1,500 91 xCanada – – – – – – – – – – – – – – – – – –Central African Republic 3.8 120 110 130 60 17 1.2 0.9 1.5 25 17 47 34 13 19 110 320 88Chad 2.5 210 170 250 100 34 0.7 0.5 0.9 – 10 – 57 p – 4 160 980 117Chile 0.3 38 23 59 5 – 0.1 0.2 <0.1 – – – – – – – – –China – – – – – – – – – – – – – – – – – –Colombia 0.5 140 110 180 35 – 0.2 0.3 0.2 – 24 – 39 – 11 – – –Comoros – – – – – – – – – 24 19 52 – 4 3 – – –Congo 2.5 69 64 75 35 13 0.9 0.7 1.2 28 14 51 45 6 12 64 220 100Cook Islands – – – – – – – – – – – – – – – – – –
TABLE 4. HIV/AIDS

STATISTICAL TABLES 55
TABLE 4. HIV/AIDS
Costa Rica 0.2 8 5 9 1 – <0.1 0.1 <0.1 – 33 – 55 – 14 – – –Côte d'Ivoire 2.7 370 330 410 170 72 0.9 0.7 1.0 25 16 57 34 8 14 400 1,300 66Croatia – – – – – – – – – – – – – – – – – –Cuba 0.2 16 14 18 4 – 0.2 0.2 <0.1 – 54 – 66 – 30 – – –Cyprus <0.1 <0.5 <0.5 <1.0 <0.2 – <0.1 <0.1 <0.1 – – – – – – – – –Czech Republic <0.1 3 3 4 <0.5 – <0.1 <0.1 <0.1 – – – – – – – – –Democratic People's Republic of Korea – – – – – – – – – – 8 – – – – – – –
Democratic Republic of the Congo 1.1 440 370 520 220 66 0.4 0.3 0.5 – 15 22 11 – 7 350 4,000 74Denmark 0.2 6 5 7 2 – <0.1 <0.1 <0.1 – – – – – – – – –Djibouti 0.9 6 5 8 3 1 <0.1 <0.1 0.1 – 18 x – – – – 8 42 –Dominica – – – – – – – – – 48 56 – – – – – – –Dominican Republic 0.7 46 33 59 22 – 0.2 0.2 0.2 34 x 41 x 57 40 10 x 18 x – – 77 xEcuador 0.4 37 26 64 11 <1.0 0.2 0.3 0.2 – – – – – – – – –Egypt <0.1 7 5 12 2 <0.5 <0.1 <0.1 <0.1 18 x 5 x – – – – – – –El Salvador 0.5 21 14 39 9 <1.0 0.3 0.2 0.3 – 27 x – – – – – – –Equatorial Guinea – – – – – – – – – 18 19 36 19 16 35 – – –Eritrea 0.6 18 14 22 9 3 0.2 0.2 0.2 34 25 70 2 – – 21 180 –Estonia 1.3 9 7 11 3 – 0.7 0.8 0.5 – – – – – – – – –Ethiopia 1.2 790 720 890 370 200 0.4 0.4 0.5 34 24 47 – 20 21 900 4,000 90Fiji 0.1 <1.0 <0.5 <1.0 <0.5 – <0.1 <0.1 <0.1 – – – – – – – – –Finland – – – – – – – – – – – – – – – – – –France – – – – – – – – – – – – – – – – – –Gabon 3.9 41 36 46 25 4 1.2 0.4 1.9 36 30 77 56 12 30 21 66 101Gambia 1.2 13 9 18 7 2 0.3 0.2 0.4 – 33 51 p – – – 7 83 106Georgia 0.3 6 5 8 1 <0.1 0.2 0.3 <0.1 – – – – – 5 – – –Germany – – – – – – – – – – – – – – – – – –Ghana 1.3 220 170 300 110 35 0.4 0.3 0.4 39 37 39 27 5 12 180 990 76 xGreece – – – – – – – – – – – – – – – – – –Grenada – – – – – – – – – 60 65 – – – – – – –Guatemala 0.6 53 13 300 19 3 0.3 0.3 0.3 24 22 74 27 p – – – – –Guinea 1.7 130 110 140 68 13 0.6 0.4 0.8 34 23 54 37 3 5 49 670 71Guinea-Bissau 3.7 41 37 47 21 6 1.3 0.9 1.7 – 15 – 50 – 7 21 120 109Guyana 1.4 8 4 13 4 – 0.8 0.6 0.9 47 54 76 – 18 29 – – –Haiti 2 140 130 150 74 13 0.7 0.6 0.9 28 35 62 52 9 17 100 340 96Holy See – – – – – – – – – – – – – – – – – –Honduras 0.5 24 20 30 9 2 0.2 0.2 0.2 35 33 59 38 7 13 – – 91Hungary – – – – – – – – – – – – – – – – – –Iceland – – – – – – – – – – – – – – – – – –India 0.3 2,100 1,700 2,700 750 140 – – – 36 x 20 x 32 x 17 x,p 1 x 1 x – – 72 x
TAB
LE 4. HIV
/AID
SCountries and areas
Adult HIV prevalence
(%)2013
People of all ages living with HIV (thousands)
2013
Mother–to–child transmission
Paediatric infections Prevention among young people (aged 15-24) HIV testing Orphans
Women living with HIV
(thousands)2013
Children living
with HIV (thousands)
2013
HIV prevalence among young people (%)
2013
Comprehensive knowledge of HIV (%)
2009–2013*
Condom use among young people with
multiple partners (%)2009–2013*
Young people who were tested for HIV in the last 12 months and
received results (%)2009–2013*
Children orphaned by AIDS
(thousands)2013
Children orphaned due to all
causes (thousands)
2013
Orphan school
attendance ratio (%)
estimate estimate low high estimate estimate total male female male female male female male female estimate estimate 2009–2013*

56 THE STATE OF THE WORLD’S CHILDREN 2015
Indonesia 0.5 640 420 1,000 240 25 0.4 0.4 0.5 10 y 11 y – – – – – – –Iran (Islamic Republic of) 0.1 70 47 110 19 2 <0.1 0.1 <0.1 – 20 y – – – – – – –Iraq – – – – – – – – – – 4 – – – 0 – – 94Ireland – – – – – – – – – – – – – – – – – –Israel – – – – – – – – – – – – – – – – – –Italy 0.3 120 110 140 13 – <0.1 0.1 <0.1 – – – – – – – – –Jamaica 1.8 30 25 35 11 <1.0 0.8 0.9 0.6 36 y 43 y 76 49 49 69 – – –Japan – – – – – – – – – – – – – – – – – –Jordan – – – – – – – – – – 9 – – – – – – 80Kazakhstan – – – – – – – – – 34 36 76 74 15 21 – – –Kenya 6 1,600 1,500 1,700 820 190 2.2 1.7 2.8 55 47 67 37 19 28 1,100 2,500 –Kiribati – – – – – – – – – 49 44 30 2 p – – – – –Kuwait – – – – – – – – – – – – – – – – – –Kyrgyzstan 0.2 8 7 10 1 <0.2 0.2 0.3 <0.1 24 20 76 – 1 12 – – –Lao People's Democratic Republic 0.2 6 4 8 2 <1.0 <0.1 <0.1 <0.1 28 24 – – 2 2 – – 80Latvia – – – – – – – – – – – – – – – – – –Lebanon – – – – – – – – – – – – – – – – – –Lesotho 22.9 360 350 380 190 36 8.1 5.8 10.5 29 39 60 45 17 40 150 220 98Liberia 1.1 30 25 36 15 5 0.3 0.2 0.4 27 x 21 x 32 26 2 x 2 x 40 200 85 xLibya – – – – – – – – – – – – – – – – – –Liechtenstein – – – – – – – – – – – – – – – – – –Lithuania – – – – – – – – – – – – – – – – – –Luxembourg – – – – – – – – – – – – – – – – – –Madagascar 0.4 54 46 64 21 8 0.2 0.2 0.2 26 23 7 9 2 3 – – 74Malawi 10.3 1,000 970 1,100 500 170 3.1 2.4 3.8 45 42 41 31 28 64 790 1,200 97Malaysia 0.4 86 66 120 10 <1.0 <0.1 0.2 <0.1 – – – – – – – – –Maldives <0.1 <0.1 <0.1 <0.1 <0.1 – <0.1 <0.1 <0.1 – 35 y – – – – – – –Mali 0.9 97 80 120 49 16 0.2 0.2 0.3 – 15 – 27 2 x 4 x 79 1,100 92Malta – – – – – – – – – – – – – – – – – –Marshall Islands – – – – – – – – – 39 x 27 x 23 x,p 9 x,p – – – – –Mauritania – – – – – – – – – – 6 – – – – – – 100 pMauritius 1.1 10 9 11 3 – 0.2 0.2 0.2 – – – – – – – – –Mexico 0.2 180 140 230 36 2 <0.1 0.1 <0.1 – – – – – – – – –Micronesia (Federated States of) – – – – – – – – – – – – – – – – – –Monaco – – – – – – – – – – – – – – – – – –Mongolia <0.1 <1.0 <0.5 <1.0 <0.1 – <0.1 <0.1 <0.1 29 32 69 – 13 17 – – 102Montenegro – – – – – – – – – – – – – – – – – –Morocco 0.2 31 22 42 10 <1.0 <0.1 0.1 <0.1 – – – – – – – – –Mozambique 10.8 1,600 1,400 1,800 820 190 4.4 2.7 6.1 52 30 41 38 11 26 810 2,100 91Myanmar 0.6 190 170 220 63 11 0.2 0.2 0.3 – 32 – – – – – – –
TABLE 4. HIV/AIDS
Countries and areas
Adult HIV prevalence
(%)2013
People of all ages living with HIV (thousands)
2013
Mother–to–child transmission
Paediatric infections Prevention among young people (aged 15-24) HIV testing Orphans
Women living with HIV
(thousands)2013
Children living
with HIV (thousands)
2013
HIV prevalence among young people (%)
2013
Comprehensive knowledge of HIV (%)
2009–2013*
Condom use among young people with
multiple partners (%)2009–2013*
Young people who were tested for HIV in the last 12 months and received results (%)
2009–2013*
Children orphaned by AIDS
(thousands)2013
Children orphaned due to all
causes (thousands)
2013
Orphan school
attendance ratio (%)
estimate estimate low high estimate estimate total male female male female male female male female estimate estimate 2009–2013*
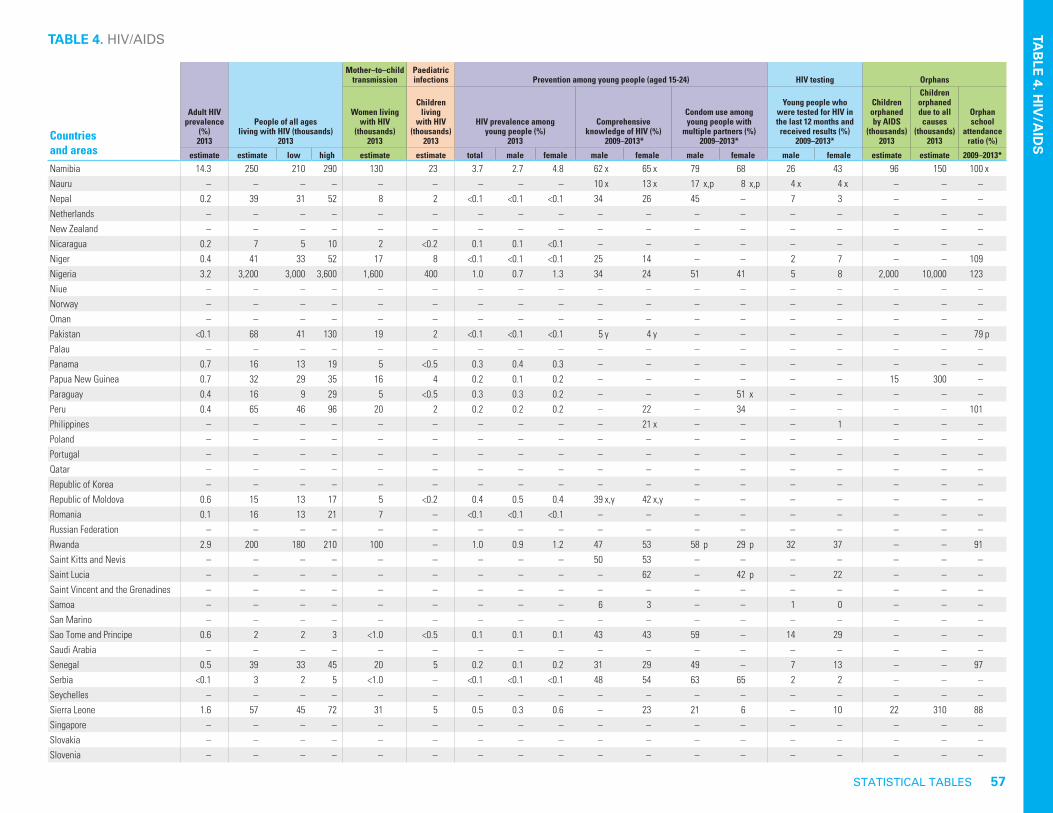
STATISTICAL TABLES 57
TABLE 4. HIV/AIDS
Namibia 14.3 250 210 290 130 23 3.7 2.7 4.8 62 x 65 x 79 68 26 43 96 150 100 xNauru – – – – – – – – – 10 x 13 x 17 x,p 8 x,p 4 x 4 x – – –Nepal 0.2 39 31 52 8 2 <0.1 <0.1 <0.1 34 26 45 – 7 3 – – –Netherlands – – – – – – – – – – – – – – – – – –New Zealand – – – – – – – – – – – – – – – – – –Nicaragua 0.2 7 5 10 2 <0.2 0.1 0.1 <0.1 – – – – – – – – –Niger 0.4 41 33 52 17 8 <0.1 <0.1 <0.1 25 14 – – 2 7 – – 109Nigeria 3.2 3,200 3,000 3,600 1,600 400 1.0 0.7 1.3 34 24 51 41 5 8 2,000 10,000 123Niue – – – – – – – – – – – – – – – – – –Norway – – – – – – – – – – – – – – – – – –Oman – – – – – – – – – – – – – – – – – –Pakistan <0.1 68 41 130 19 2 <0.1 <0.1 <0.1 5 y 4 y – – – – – – 79 pPalau – – – – – – – – – – – – – – – – – –Panama 0.7 16 13 19 5 <0.5 0.3 0.4 0.3 – – – – – – – – –Papua New Guinea 0.7 32 29 35 16 4 0.2 0.1 0.2 – – – – – – 15 300 –Paraguay 0.4 16 9 29 5 <0.5 0.3 0.3 0.2 – – – 51 x – – – – –Peru 0.4 65 46 96 20 2 0.2 0.2 0.2 – 22 – 34 – – – – 101Philippines – – – – – – – – – – 21 x – – – 1 – – –Poland – – – – – – – – – – – – – – – – – –Portugal – – – – – – – – – – – – – – – – – –Qatar – – – – – – – – – – – – – – – – – –Republic of Korea – – – – – – – – – – – – – – – – – –Republic of Moldova 0.6 15 13 17 5 <0.2 0.4 0.5 0.4 39 x,y 42 x,y – – – – – – –Romania 0.1 16 13 21 7 – <0.1 <0.1 <0.1 – – – – – – – – –Russian Federation – – – – – – – – – – – – – – – – – –Rwanda 2.9 200 180 210 100 – 1.0 0.9 1.2 47 53 58 p 29 p 32 37 – – 91Saint Kitts and Nevis – – – – – – – – – 50 53 – – – – – – –Saint Lucia – – – – – – – – – – 62 – 42 p – 22 – – –Saint Vincent and the Grenadines – – – – – – – – – – – – – – – – – –Samoa – – – – – – – – – 6 3 – – 1 0 – – –San Marino – – – – – – – – – – – – – – – – – –Sao Tome and Principe 0.6 2 2 3 <1.0 <0.5 0.1 0.1 0.1 43 43 59 – 14 29 – – –Saudi Arabia – – – – – – – – – – – – – – – – – –Senegal 0.5 39 33 45 20 5 0.2 0.1 0.2 31 29 49 – 7 13 – – 97Serbia <0.1 3 2 5 <1.0 – <0.1 <0.1 <0.1 48 54 63 65 2 2 – – –Seychelles – – – – – – – – – – – – – – – – – –Sierra Leone 1.6 57 45 72 31 5 0.5 0.3 0.6 – 23 21 6 – 10 22 310 88Singapore – – – – – – – – – – – – – – – – – –Slovakia – – – – – – – – – – – – – – – – – –Slovenia – – – – – – – – – – – – – – – – – –
TAB
LE 4. HIV
/AID
SCountries and areas
Adult HIV prevalence
(%)2013
People of all ages living with HIV (thousands)
2013
Mother–to–child transmission
Paediatric infections Prevention among young people (aged 15-24) HIV testing Orphans
Women living with HIV
(thousands)2013
Children living
with HIV (thousands)
2013
HIV prevalence among young people (%)
2013
Comprehensive knowledge of HIV (%)
2009–2013*
Condom use among young people with
multiple partners (%)2009–2013*
Young people who were tested for HIV in the last 12 months and
received results (%)2009–2013*
Children orphaned by AIDS
(thousands)2013
Children orphaned due to all
causes (thousands)
2013
Orphan school
attendance ratio (%)
estimate estimate low high estimate estimate total male female male female male female male female estimate estimate 2009–2013*

58 THE STATE OF THE WORLD’S CHILDREN 2015
TABLE 4. HIV/AIDS
Solomon Islands – – – – – – – – – 35 x 29 x 39 x 18 x – – – – –Somalia 0.5 32 21 51 14 5 0.2 0.2 0.2 – 4 x – – – – 30 630 78 xSouth Africa 19.1 6,300 6,000 6,500 3,500 360 8.6 4.0 13.1 23 25 – – – – 2,400 3,600 98 xSouth Sudan 2.2 150 59 350 79 18 0.8 0.6 1.1 – 10 – 7 – – 100 570 78Spain 0.4 150 130 160 34 – <0.1 0.1 <0.1 – – – – – – – – –Sri Lanka <0.1 3 2 5 <1.0 – <0.1 <0.1 <0.1 – – – – – – – – –State of Palestine – – – – – – – – – – 7 – – – – – – –Sudan 0.2 49 34 70 22 5 0.2 0.1 0.2 11 5 – – – – – – 96Suriname 0.9 3 3 4 2 – 0.3 0.3 0.3 – 42 – 39 – 21 – – –Swaziland 27.4 200 200 210 110 17 9.8 7.1 12.4 54 58 85 69 23 37 73 100 99Sweden – – – – – – – – – – – – – – – – – –Switzerland 0.4 20 15 27 6 – – – – – – – – – – – – –Syrian Arab Republic – – – – – – – – – – 7 x – – – – – – –Tajikistan 0.3 14 10 20 4 <1.0 0.1 0.1 <0.1 – 9 – – – 5 – – 81Thailand 1.1 440 400 470 190 8 0.3 0.3 0.3 – 56 – – – 10 – – 94 x,pThe former Yugoslav Republic of Macedonia <0.1 <0.2 <0.2 <0.5 <0.1 – <0.1 <0.1 <0.1 – 27 x – – – – – – –
Timor-Leste – – – – – – – – – 20 12 – – – – – – 75Togo 2.3 110 67 190 54 21 0.6 0.4 0.7 42 33 63 59 p 9 15 95 360 86Tonga – – – – – – – – – 14 12 – – – – – – –Trinidad and Tobago 1.7 14 13 15 7 <0.5 0.8 0.6 0.9 – 54 x – 67 x – – – – –Tunisia <0.1 3 2 5 1 – <0.1 <0.1 <0.1 – 20 – – – 0 – – –Turkey – – – – – – – – – – – – – – – – – –Turkmenistan – – – – – – – – – – – – – – – – – –Tuvalu – – – – – – – – – 61 x 39 x – – 8 x 4 x – – –Uganda 7.4 1,600 1,500 1,700 790 190 3.3 2.4 4.2 39 39 31 24 24 40 1,000 2,400 87Ukraine 0.8 210 180 250 87 – 0.3 0.1 0.4 46 50 84 67 12 13 – – –United Arab Emirates – – – – – – – – – – – – – – – – – –United Kingdom 0.3 130 100 160 38 – 0.2 0.2 0.1 – – – – – – – – –United Republic of Tanzania 5 1,400 1,300 1,500 690 250 1.8 1.4 2.2 47 40 41 34 21 29 1,300 3,100 95United States – – – – – – – – – – – – – – – – – –Uruguay 0.7 14 10 21 3 – 0.3 0.5 0.2 – – – – – – – – –Uzbekistan 0.2 35 27 48 9 3 <0.1 <0.1 <0.1 – 31 x – – – – – – –Vanuatu – – – – – – – – – – 15 x – – – – – – –Venezuela (Bolivarian Republic of) 0.6 100 57 150 35 3 0.3 0.3 0.2 – – – – – – – – –Viet Nam 0.4 250 230 280 67 5 <0.1 <0.1 <0.1 – 51 – – – 6 – – –Yemen <0.1 6 3 15 2 <0.5 <0.1 <0.1 <0.1 – 2 x,y – – – – – – –Zambia 12.5 1,100 1,100 1,200 500 150 4.0 3.4 4.5 41 38 43 x 42 x,p 13 28 600 1,400 92Zimbabwe 15 1,400 1,300 1,400 720 170 5.3 4.1 6.6 47 52 51 39 p 14 30 890 1,100 92
Countries and areas
Adult HIV prevalence
(%)2013
People of all ages living with HIV (thousands)
2013
Mother–to–child transmission
Paediatric infections Prevention among young people (aged 15-24) HIV testing Orphans
Women living with HIV
(thousands)2013
Children living
with HIV (thousands)
2013
HIV prevalence among young people (%)
2013
Comprehensive knowledge of HIV (%)
2009–2013*
Condom use among young people with
multiple partners (%)2009–2013*
Young people who were tested for HIV in the last 12 months and
received results (%)2009–2013*
Children orphaned by AIDS
(thousands)2013
Children orphaned due to all
causes (thousands)
2013
Orphan school
attendance ratio (%)
estimate estimate low high estimate estimate total male female male female male female male female estimate estimate 2009–2013*

STATISTICAL TABLES 59
TABLE 4. HIV/AIDS
SUMMARY
Sub-Saharan Africa 4.6 24,700 23,500 26,100 12,800 2,900 1.7 1.1 2.2 35 27 46 33 13 18 15,200 52,000 96 Eastern and Southern Africa 7.3 18,500 17,700 19,500 9,700 2,000 2.7 1.8 3.7 39 33 45 30 18 28 10,700 26,000 89 West and Central Africa 2.2 6,200 5,700 6,700 3,100 870 0.7 0.5 0.9 33 22 47 35 6 10 4,500 26,000 103Middle East and North Africa 0.1 220 150 300 80 14 <0.1 <0.1 <0.1 – – – – – – 91 6,300 –South Asia 0.2 2,200 1,700 2,800 780 140 <0.1 <0.1 <0.1 30 17 33 17 1 1 590 39,000 73East Asia and Pacific 0.2 2,500 2,200 3,000 870 66 <0.1 <0.1 <0.1 – 27 ** – – – – 800 23,000 –Latin America and Caribbean 0.5 1,800 1,600 2,300 570 52 0.2 0.3 0.2 – – – – – – 720 8,400 –CEE/CIS 0.5 1,200 1,000 1,300 410 14 0.1 0.1 0.2 – – – – – – 220 7,700 –Least developed countries 1.9 10,700 9,900 11,600 5,200 1,600 0.7 0.6 0.9 30 23 41 – – 19 7,600 39,000 89World 0.8 35,000 33,200 37,200 16,000 3,200 0.3 0.3 0.4 30 ** 22 ** – – – – 17,700 140,000 –
DEFINITIONS OF THE INDICATORS
Adult HIV prevalence – Estimated percentage of adults (aged 15–49) living with HIV as of 2013.People living with HIV – Estimated number of people (all ages) living with HIV as of 2013.Women living with HIV – Estimated number of women (aged 15+) living with HIV as of 2013.Children living with HIV – Estimated number of children (aged 0–14) living with HIV as of 2013.HIV prevalence among young people – Estimated percentage of young men and women (aged 15–24) living with HIV as of 2013.Comprehensive knowledge of HIV – Percentage of young men and women (aged 15–24) who correctly identify the two major ways of preventing the sexual transmission of HIV (using condoms and limiting sex to one faithful, uninfected partner), who reject the two most common local misconceptions about HIV transmission and who know that a healthy-looking person can be HIV-positive.Condom use among young people with multiple partners – Among young people aged 15-24 who reporting having had more than one sexual partner in the past 12 months, the percentage who reported use of a condom the last time they had sex with any partner.Tested for HIV in the last 12 months and received results – Percentage of young men and women (aged 15–24) were tested for HIV in that past 12 months and who received the results of the most recent test.Children orphaned by AIDS – Estimated number of children (aged 0–17) who have lost one or both parents to AIDS as of 2013.Children orphaned due to all causes – Estimated number of children (aged 0–17) who have lost one or both parents due to any cause as of 2013.Orphan school attendance ratio – Percentage of children (aged 10–14) who have lost both biological parents and who are currently attending school as a percentage of non-orphaned children of the same age who live with at least one parent and who are attending school.
MAIN DATA SOURCES
NOTES
Estimated adult HIV prevalence – UNAIDS, The Gap Report, July 2014Estimated number of people living with HIV – UNAIDS, The Gap Report, July 2014Estimated number of women living with HIV – UNAIDS, The Gap Report, July 2014Estimated number of children living with HIV – UNAIDS, The Gap Report, July 2014HIV prevalence among young people – UNAIDS, The Gap Report, July 2014Comprehensive knowledge of HIV – AIDS Indicator Surveys (AIS), Demographic and Health Surveys (DHS), Multiple Indicator Cluster Surveys (MICS) and other national household surveys; HIV/AIDS Survey Indicators Database, www.measuredhs.com/hivdataCondom use among young people with multiple partners – AIS, DHS, MICS and other national household surveys; HIV/AIDS Survey Indicators Database, www.measuredhs.com/hivdataTested for HIV in the last 12 months and received results – AIS, DHS, MICS and other national household surveys; HIV/AIDS Survey Indicators Database, www.measuredhs.com/hivdataChildren orphaned by AIDS – UNAIDS, 2013 HIV and AIDS unpublished estimates, July 2014Children orphaned by all causes – UNAIDS, 2013 HIV and AIDS unpublished estimates, July 2014Orphan school attendance ratio – AIS, DHS, MICS and other national household surveys; HIV/AIDS Survey Indicators Database, www.measuredhs.com/hivdata
– Data not available.x Data refer to years or periods other than those specified in the column heading. Such data are not included in the calculation of regional and global averages,
with the exception of 2005-2006 data from India. Estimates from data years prior to 2000 are not displayed.y Data differ from the standard definition or refer to only part of a country. If they fall within the noted reference period, such data are included in the calculation of
regional and global averages.p Based on small denominators (typically 25-49 unweighted cases).* Data refer to the most recent year available during the period specified in the column heading.** Excludes China.
TAB
LE 4. HIV
/AID
S
For a complete list of countries and areas in the regions, subregions and country categories, see page 32 or visit http://data.unicef.org/index.php?section=regional-classifications.It is not advisable to compare data from consecutive editions of The State of the World’s Children.
Countries and areas
Adult HIV prevalence
(%)2013
People of all ages living with HIV (thousands)
2013
Mother–to–child transmission
Paediatric infections Prevention among young people (aged 15-24) HIV testing Orphans
Women living with HIV
(thousands)2013
Children living
with HIV (thousands)
2013
HIV prevalence among young people (%)
2013
Comprehensive knowledge of HIV (%)
2009–2013*
Condom use among young people with
multiple partners (%)2009–2013*
Young people who were tested for HIV in the last 12 months and
received results (%)2009–2013*
Children orphaned by AIDS
(thousands)2013
Children orphaned due to all
causes (thousands)
2013
Orphan school
attendance ratio (%)
estimate estimate low high estimate estimate total male female male female male female male female estimate estimate 2009–2013*

60 THE STATE OF THE WORLD’S CHILDREN 2015
Youth (15–24 years) literacy rate (%)
Number per 100 population
Pre-primary school participation Primary school participation Secondary school participation
Gross enrolment ratio (%)
Gross enrolment ratio (%)
Net enrolment ratio (%)
Net attendance ratio (%)
Out-of-school children of primary
school ageSurvival rate to
last primary grade (%)Net enrolment
ratio (%)Net attendance
ratio (%)
Countries and areas
2009–2013* 2013 2009–2012* 2009–2012* 2009–2013* 2008–2013* 2009-2013* 2009–2012* 2008–2013* 2009–2013* 2008–2013*
male femalemobile phones
internet users male female male female male female male female
rate (%)
number (000) admin. data survey data male female male female
Afghanistan 62 32 70 6 – – 121 87 – – 64 y 48 y – – – 84 – – 42 y 23 yAlbania 99 99 116 60 69 69 – – – – 90 91 – – 99 100 – – 84 82 Algeria 94 x 89 x 102 17 78 79 121 114 – – 97 x 96 x 1 25 93 93 x – – 57 x 65 xAndorra – – 81 94 – – – – – – – – – – – – – – – – Angola 80 66 62 19 70 103 171 110 97 74 77 75 14 513 32 83 x 15 12 21 17Antigua and Barbuda – – 127 63 91 86 101 95 87 84 – – 15 2 – – 72 85 – – Argentina 99 99 159 60 74 75 118 117 – – 98 99 – – 93 97 81 89 82 85 Armenia 100 100 112 46 44 60 96 110 – – 97 y 97 y – – 96 100 x 76 91 67 y 76 yAustralia – – 107 83 – – 105 105 97 97 – – 3 61 – – 85 86 – – Austria – – 156 81 104 103 101 101 – – – – – – 100 – – – – – Azerbaijan 100 100 108 59 25 25 99 97 90 88 74 x 72 x 11 54 98 100 x 88 86 83 x 82 xBahamas – – 76 72 – – 107 109 – – – – 2 1 89 – 80 86 – – Bahrain 99 98 166 90 50 50 – – – – 86 x 87 x – – 98 99 x 84 87 77 x 85 xBangladesh 78 82 67 7 26 25 111 118 94 98 77 81 4 621 66 94 x 44 51 43 47 Barbados – – 108 75 80 79 106 105 97 97 – – 3 1 93 – 84 96 – – Belarus 100 100 119 54 104 101 99 99 94 94 93 90 6 20 99 100 95 96 96 98 Belgium – – 111 82 119 118 104 103 99 99 – – 1 7 93 – – – – – Belize – – 53 32 48 47 122 119 98 100 94 95 1 0.4 91 97 70 75 50 61 Benin 55 x 31 x 93 5 18 19 130 116 – – 79 73 5 83 59 89 x – – 53 42 Bhutan 80 x 68 x 72 30 10 9 111 113 90 93 96 95 8 8 95 94 53 61 54 56 Bolivia (Plurinational State of) 99 99 98 40 51 51 95 94 87 87 97 97 13 194 86 96 68 69 78 75 Bosnia and Herzegovina 100 100 91 68 17 16 – – – – 98 98 – – 99 100 – – 90 93 Botswana 94 98 161 15 18 18 108 104 83 85 86 x 88 x 16 50 93 x – 56 x 65 x 36 x 44 xBrazil 98 99 135 52 – – – – – – 95 x 95 x – – 54 88 x – – 74 x 80 xBrunei Darussalam 100 100 112 65 92 91 96 95 96 95 – – 4 2 96 – 94 95 – – Bulgaria 98 98 145 53 86 85 100 99 96 97 – – 4 9 97 – 86 84 – – Burkina Faso 47 x 33 x 66 4 4 4 87 83 68 65 54 50 33 917 69 89 x 22 18 21 17 Burundi 90 x 88 x 25 1 8 8 138 137 94 94 85 84 6 81 44 82 x 20 17 20 14 Cabo Verde 98 98 100 38 75 75 117 107 99 96 – – 3 2 89 – 64 74 – – Cambodia 88 86 134 6 15 15 127 121 100 97 86 y 86 y 2 29 66 92 x 40 x 36 x 46 45 Cameroon 85 76 70 6 29 30 118 103 97 86 87 82 8 295 70 95 x – – 53 49 Canada – – 78 86 71 72 98 99 – – – – – – – – – – – – Central African Republic 49 27 29 4 6 6 109 81 81 64 78 68 28 194 47 81 18 10 23 15 Chad 54 44 36 2 2 1 108 82 72 56 55 48 36 770 38 89 – – 22 12 Chile 99 99 134 67 115 112 103 100 93 93 90 y 92 y 7 109 99 – 82 86 80 y 84 yChina 100 100 89 46 70 70 128 128 100 z 100 z 97 y 97 y – – 99 z – – – 87 y 88 yColombia 98 99 104 52 49 49 109 105 87 86 90 92 14 599 85 95 71 77 73 79 Comoros 86 87 47 7 24 x 23 x 123 112 – – 31 x 31 x – – – 19 x – – 10 x 11 xCongo 86 77 105 7 14 14 106 113 88 96 92 y 92 y 8 56 – 93 x – – 57 y 56 yCook Islands – – – – 93 97 107 109 – – – – 3 <0.1 – – 77 75 – –
TABLE 5. EDUCATION

STATISTICAL TABLES 61
TABLE 5. EDUCATION
Costa Rica 99 99 146 46 74 74 106 105 92 93 96 96 7 33 88 93 71 75 69 74 Côte d'Ivoire 58 39 95 3 5 5 102 87 67 56 72 y 64 y 38 1,142 82 90 x – – 33 y 25 yCroatia 100 100 115 67 64 62 97 97 98 100 – – 1 2 99 – 92 95 – – Cuba 100 100 18 26 110 109 100 99 96 97 – – 3 28 96 – 86 87 – – Cyprus 100 100 95 65 79 77 100 100 98 98 – – 2 1 – – 91 93 – – Czech Republic – – 131 74 104 101 100 101 – – – – – – 99 – – – – – Democratic People's Republic of Korea 100 x 100 x 10 – – – – – – – 99 99 – – – 100 – – 98 98
Democratic Republic of the Congo 79 x 53 x 44 2 4 4 118 104 – – 78 72 – – 71 75 – – 35 28 Denmark – – 127 95 103 100 102 101 98 99 – – 2 9 99 – 90 92 – – Djibouti – – 28 10 4 4 73 66 62 55 71 y 68 y 42 39 76 92 x 29 x 21 x 45 x 37 xDominica – – 130 59 93 97 121 117 95 97 – – 4 0.3 88 – 79 88 – – Dominican Republic 96 98 88 46 38 39 108 97 90 88 91 y 92 y 11 137 79 78 x 58 66 56 x 68 xEcuador 99 99 111 40 148 152 114 113 96 98 96 y 97 y 3 59 91 – 73 75 78 80 Egypt 92 86 122 50 28 27 116 111 – – 89 y 87 y 3 258 96 99 83 82 70 70 El Salvador 96 97 136 23 62 63 115 110 95 95 – – 5 41 84 – 61 62 – – Equatorial Guinea 98 99 67 16 73 73 92 90 62 62 61 x 60 x 38 38 72 – – – 23 x 22 xEritrea 93 89 6 1 13 13 46 39 36 32 57 y 56 y 66 518 69 – 28 23 23 x 21 xEstonia 100 100 160 80 94 91 98 98 96 97 – – 3 2 97 – 90 91 – – Ethiopia 63 x 47 x 27 2 – – – – – – 64 65 – – 37 84 x – – 16 16 Fiji – – 101 37 17 19 104 105 – – – – 1 1 97 – 79 88 – – Finland – – 172 92 71 70 100 100 99 99 – – 1 4 100 – 92 93 – – France – – 98 82 110 109 107 107 98 99 – – 1 43 – – 96 98 – – Gabon 87 89 215 9 35 36 167 162 – – 87 y 87 y – – – – – – 50 y 58 yGambia 73 66 100 14 29 30 83 87 71 76 61 64 26 75 83 95 – – 34 34 Georgia 100 100 115 43 – – 106 107 98 99 95 96 1 4 93 98 x – – 85 88 Germany – – 119 84 113 112 101 100 99 100 – – 0 13 96 – – – – – Ghana 88 83 108 12 112 115 113 106 84 81 72 74 18 653 72 x 100 53 50 40 44 Greece 99 99 117 60 78 79 102 102 99 100 – – 0 3 93 – 99 99 – – Grenada – – 126 35 95 102 105 102 96 99 – – 3 0.3 – – – – – – Guatemala 95 92 140 20 64 65 116 112 96 95 – – 5 110 71 – 48 45 – – Guinea 38 22 63 2 16 15 98 83 81 70 63 53 24 431 59 96 x 37 23 38 25 Guinea-Bissau 80 69 74 3 6 7 120 112 73 69 69 65 29 70 – 79 – – 27 20 Guyana 92 94 69 33 63 69 71 80 70 80 94 96 25 32 92 100 86 100 70 79 Haiti 74 x 70 x 69 11 – – – – – – 77 y 78 y – – – 88 – – 22 y 29 yHoly See – – – – – – – – – – – – – – – – – – – – Honduras 94 96 96 18 42 43 110 109 93 95 93 y 93 y 6 67 70 84 – – 43 y 52 yHungary 99 99 116 73 88 87 101 100 96 97 – – 3 13 98 – 92 92 – – Iceland – – 108 97 98 96 98 99 98 99 – – 1 0.4 97 – 88 89 – – India 88 x 74 x 71 15 57 60 111 114 – – 85 x 82 x 1 1,387 – 95 x – – 59 x 49 x
TAB
LE 5. EDU
CATIO
N
Youth (15–24 years) literacy rate (%)
Number per 100 population
Pre-primary school participation Primary school participation Secondary school participation
Gross enrolment ratio (%)
Gross enrolment ratio (%)
Net enrolment ratio (%)
Net attendance ratio (%)
Out-of-school children of primary
school ageSurvival rate to
last primary grade (%)Net enrolment
ratio (%)Net attendance
ratio (%)
Countries and areas
2009–2013* 2013 2009–2012* 2009–2012* 2009–2013* 2008–2013* 2009-2013* 2009–2012* 2008–2013* 2009–2013* 2008–2013*
male femalemobile phones
internet users male female male female male female male female
rate (%)
number (000) admin. data survey data male female male female
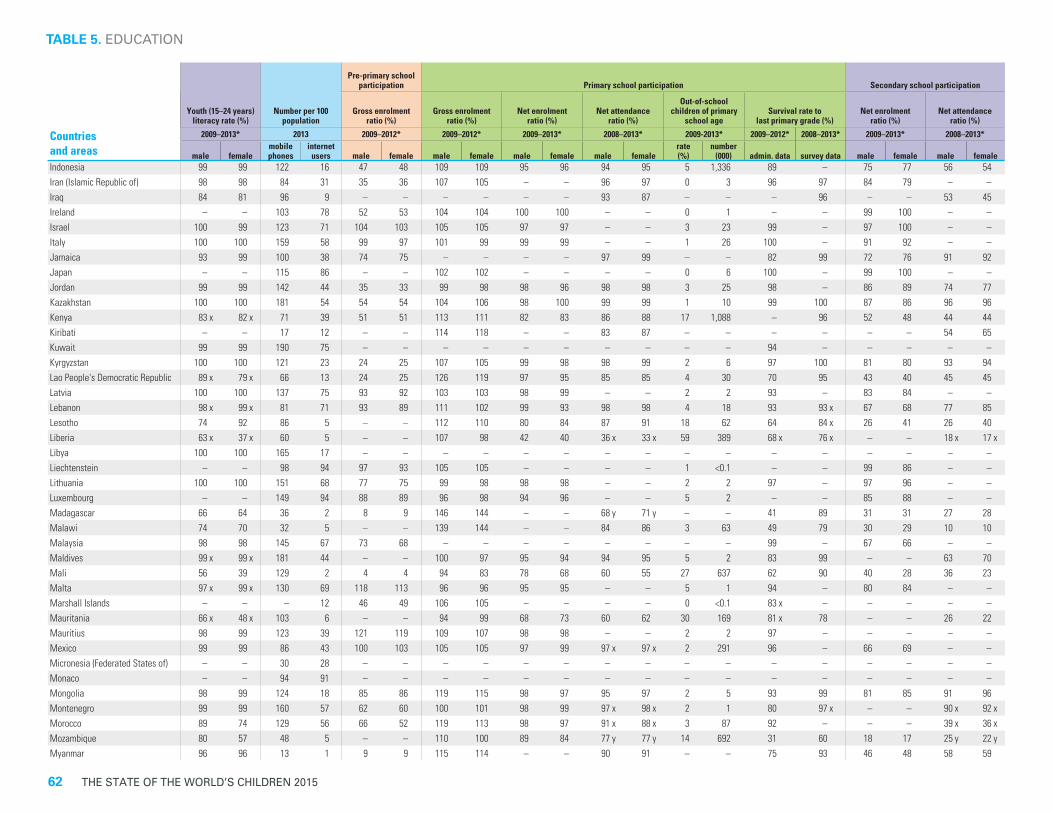
62 THE STATE OF THE WORLD’S CHILDREN 2015
Indonesia 99 99 122 16 47 48 109 109 95 96 94 95 5 1,336 89 – 75 77 56 54 Iran (Islamic Republic of) 98 98 84 31 35 36 107 105 – – 96 97 0 3 96 97 84 79 – – Iraq 84 81 96 9 – – – – – – 93 87 – – – 96 – – 53 45 Ireland – – 103 78 52 53 104 104 100 100 – – 0 1 – – 99 100 – – Israel 100 99 123 71 104 103 105 105 97 97 – – 3 23 99 – 97 100 – – Italy 100 100 159 58 99 97 101 99 99 99 – – 1 26 100 – 91 92 – – Jamaica 93 99 100 38 74 75 – – – – 97 99 – – 82 99 72 76 91 92 Japan – – 115 86 – – 102 102 – – – – 0 6 100 – 99 100 – – Jordan 99 99 142 44 35 33 99 98 98 96 98 98 3 25 98 – 86 89 74 77 Kazakhstan 100 100 181 54 54 54 104 106 98 100 99 99 1 10 99 100 87 86 96 96 Kenya 83 x 82 x 71 39 51 51 113 111 82 83 86 88 17 1,088 – 96 52 48 44 44 Kiribati – – 17 12 – – 114 118 – – 83 87 – – – – – – 54 65 Kuwait 99 99 190 75 – – – – – – – – – – 94 – – – – – Kyrgyzstan 100 100 121 23 24 25 107 105 99 98 98 99 2 6 97 100 81 80 93 94 Lao People's Democratic Republic 89 x 79 x 66 13 24 25 126 119 97 95 85 85 4 30 70 95 43 40 45 45 Latvia 100 100 137 75 93 92 103 103 98 99 – – 2 2 93 – 83 84 – – Lebanon 98 x 99 x 81 71 93 89 111 102 99 93 98 98 4 18 93 93 x 67 68 77 85 Lesotho 74 92 86 5 – – 112 110 80 84 87 91 18 62 64 84 x 26 41 26 40 Liberia 63 x 37 x 60 5 – – 107 98 42 40 36 x 33 x 59 389 68 x 76 x – – 18 x 17 xLibya 100 100 165 17 – – – – – – – – – – – – – – – – Liechtenstein – – 98 94 97 93 105 105 – – – – 1 <0.1 – – 99 86 – – Lithuania 100 100 151 68 77 75 99 98 98 98 – – 2 2 97 – 97 96 – – Luxembourg – – 149 94 88 89 96 98 94 96 – – 5 2 – – 85 88 – – Madagascar 66 64 36 2 8 9 146 144 – – 68 y 71 y – – 41 89 31 31 27 28 Malawi 74 70 32 5 – – 139 144 – – 84 86 3 63 49 79 30 29 10 10 Malaysia 98 98 145 67 73 68 – – – – – – – – 99 – 67 66 – – Maldives 99 x 99 x 181 44 – – 100 97 95 94 94 95 5 2 83 99 – – 63 70 Mali 56 39 129 2 4 4 94 83 78 68 60 55 27 637 62 90 40 28 36 23 Malta 97 x 99 x 130 69 118 113 96 96 95 95 – – 5 1 94 – 80 84 – – Marshall Islands – – – 12 46 49 106 105 – – – – 0 <0.1 83 x – – – – – Mauritania 66 x 48 x 103 6 – – 94 99 68 73 60 62 30 169 81 x 78 – – 26 22 Mauritius 98 99 123 39 121 119 109 107 98 98 – – 2 2 97 – – – – – Mexico 99 99 86 43 100 103 105 105 97 99 97 x 97 x 2 291 96 – 66 69 – – Micronesia (Federated States of) – – 30 28 – – – – – – – – – – – – – – – – Monaco – – 94 91 – – – – – – – – – – – – – – – – Mongolia 98 99 124 18 85 86 119 115 98 97 95 97 2 5 93 99 81 85 91 96 Montenegro 99 99 160 57 62 60 100 101 98 99 97 x 98 x 2 1 80 97 x – – 90 x 92 xMorocco 89 74 129 56 66 52 119 113 98 97 91 x 88 x 3 87 92 – – – 39 x 36 xMozambique 80 57 48 5 – – 110 100 89 84 77 y 77 y 14 692 31 60 18 17 25 y 22 yMyanmar 96 96 13 1 9 9 115 114 – – 90 91 – – 75 93 46 48 58 59
TABLE 5. EDUCATION
Youth (15–24 years) literacy rate (%)
Number per 100 population
Pre-primary school participation Primary school participation Secondary school participation
Gross enrolment ratio (%)
Gross enrolment ratio (%)
Net enrolment ratio (%)
Net attendance ratio (%)
Out-of-school children of primary
school ageSurvival rate to
last primary grade (%)Net enrolment
ratio (%)Net attendance
ratio (%)
Countries and areas
2009–2013* 2013 2009–2012* 2009–2012* 2009–2013* 2008–2013* 2009-2013* 2009–2012* 2008–2013* 2009–2013* 2008–2013*
male femalemobile phones
internet users male female male female male female male female
rate (%)
number (000) admin. data survey data male female male female

STATISTICAL TABLES 63
TABLE 5. EDUCATION
Namibia 83 x 91 x 110 14 – – 111 108 87 90 86 y 88 y 11 43 84 89 x – – 47 x 62 xNauru – – – – 86 71 93 96 75 77 97 y 98 y 24 0.3 – – 68 67 65 y 72 yNepal 89 77 71 13 83 81 134 145 98 97 96 91 2 82 55 95 x 58 60 74 66 Netherlands – – 114 94 91 91 106 105 99 99 – – 1 16 – – 90 91 – – New Zealand – – 106 83 90 93 98 99 98 99 – – 1 5 – – 97 97 – – Nicaragua 85 x 89 x 112 16 54 56 118 116 93 94 71 70 7 54 – 56 x 42 49 38 x 48 xNiger 35 15 39 2 6 6 77 65 69 58 55 46 36 1,049 69 92 15 10 21 13 Nigeria 76 x 58 x 73 38 13 13 88 81 71 60 62 y 57 y 34 8,709 79 97 – – 53 y 45 yNiue – – – 87 – – – – – – 100 100 – – – – – – – – Norway – – 116 95 99 99 99 100 99 100 – – 1 2 98 – 94 96 – – Oman 97 98 155 66 55 55 109 109 97 98 – – 3 7 94 – – – – – Pakistan 78 63 70 11 87 77 99 86 77 67 67 60 28 5,370 61 – 41 31 45 38 Palau 100 100 90 – – – – – – – – – – – – – – – – – Panama 98 97 163 43 65 65 102 99 92 92 – – 8 35 92 – 74 79 – – Papua New Guinea 67 76 41 7 101 x 99 x 119 109 90 83 – – 13 165 – – – – – – Paraguay 99 99 104 37 34 35 97 93 83 82 87 89 17 150 80 – 60 65 81 x 80 xPeru 99 99 98 39 78 78 100 99 96 96 97 97 4 129 74 87 77 77 81 82 Philippines 97 x 98 x 105 37 51 52 107 105 88 89 88 x 89 x 11 1,469 76 x 90 x 56 67 55 x 70 xPoland 100 100 150 63 78 78 101 101 97 97 – – 3 70 99 – 90 91 – – Portugal 99 99 113 62 87 85 107 105 98 99 – – 1 8 – – – – – – Qatar 99 100 153 85 72 75 – – – – – – – – – – 91 100 – – Republic of Korea – – 111 85 118 117 103 102 100 99 – – 1 22 99 – 96 96 – – Republic of Moldova 100 100 106 49 80 79 94 94 91 90 99 98 9 14 96 100 x 78 78 86 x 90 xRomania 99 99 106 50 77 78 95 93 86 85 – – 14 122 94 – 79 81 – – Russian Federation 100 100 153 61 92 90 100 101 97 98 – – 3 151 97 – – – – – Rwanda 77 78 57 9 13 14 132 135 – – 91 y 93 y 1 23 36 76 x – – 19 y 23 ySaint Kitts and Nevis – – 142 80 88 103 87 88 82 85 – – 16 1 74 – 84 88 – – Saint Lucia – – 116 35 61 62 89 86 83 83 100 99 17 4 90 100 81 84 91 92 Saint Vincent and the Grenadines – – 115 52 79 80 107 103 – – – – 1 0.1 69 – 84 87 – – Samoa 99 100 – 15 32 36 105 105 95 97 88 y 89 y 4 1 90 – 75 84 51 y 70 ySan Marino – – 117 51 106 108 94 93 93 93 – – 7 0.1 96 – 91 92 – – Sao Tome and Principe 83 x 77 x 65 23 49 51 120 116 97 97 94 94 3 1 66 84 – – 38 39 Saudi Arabia 99 99 176 61 – – 100 106 91 96 – – 6 216 99 – – – – – Senegal 74 59 93 21 13 15 81 87 77 82 60 63 21 439 61 90 – – 39 33 Serbia 99 99 119 52 56 56 93 93 93 93 98 99 7 22 98 99 90 91 88 90 Seychelles 99 99 147 50 112 107 104 110 – – – – 6 1 94 – 91 100 – – Sierra Leone 72 54 44 2 9 10 132 131 – – 73 76 – – – 93 – – 40 33 Singapore 100 100 156 73 – – – – – – – – – – 99 x – – – – – Slovakia – – 114 78 92 90 102 101 – – – – – – 98 – – – – – Slovenia 100 100 110 73 95 93 99 99 97 98 – – 2 2 99 – 93 94 – –
TAB
LE 5. EDU
CATIO
N
Youth (15–24 years) literacy rate (%)
Number per 100 population
Pre-primary school participation Primary school participation Secondary school participation
Gross enrolment ratio (%)
Gross enrolment ratio (%)
Net enrolment ratio (%)
Net attendance ratio (%)
Out-of-school children of primary
school ageSurvival rate to
last primary grade (%)Net enrolment
ratio (%)Net attendance
ratio (%)
Countries and areas
2009–2013* 2013 2009–2012* 2009–2012* 2009–2013* 2008–2013* 2009-2013* 2009–2012* 2008–2013* 2009–2013* 2008–2013*
male femalemobile phones
internet users male female male female male female male female
rate (%)
number (000) admin. data survey data male female male female
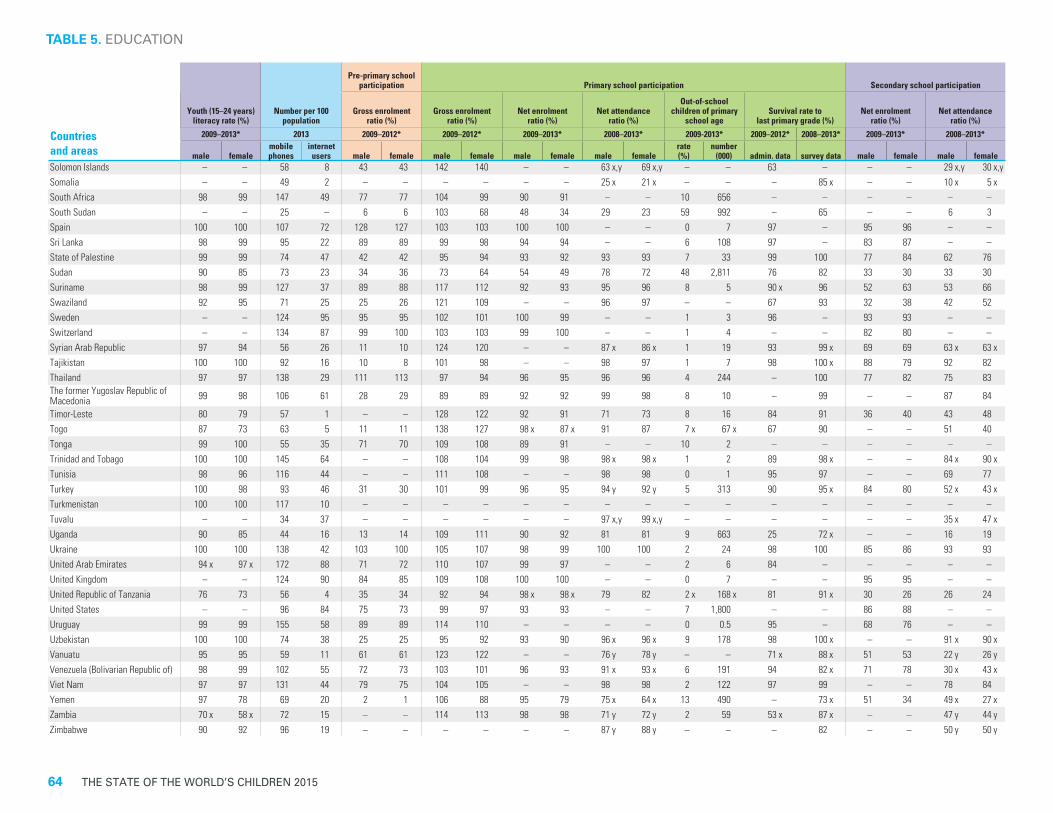
64 THE STATE OF THE WORLD’S CHILDREN 2015
TABLE 5. EDUCATION
Solomon Islands – – 58 8 43 43 142 140 – – 63 x,y 69 x,y – – 63 – – – 29 x,y 30 x,ySomalia – – 49 2 – – – – – – 25 x 21 x – – – 85 x – – 10 x 5 xSouth Africa 98 99 147 49 77 77 104 99 90 91 – – 10 656 – – – – – – South Sudan – – 25 – 6 6 103 68 48 34 29 23 59 992 – 65 – – 6 3 Spain 100 100 107 72 128 127 103 103 100 100 – – 0 7 97 – 95 96 – – Sri Lanka 98 99 95 22 89 89 99 98 94 94 – – 6 108 97 – 83 87 – – State of Palestine 99 99 74 47 42 42 95 94 93 92 93 93 7 33 99 100 77 84 62 76 Sudan 90 85 73 23 34 36 73 64 54 49 78 72 48 2,811 76 82 33 30 33 30 Suriname 98 99 127 37 89 88 117 112 92 93 95 96 8 5 90 x 96 52 63 53 66 Swaziland 92 95 71 25 25 26 121 109 – – 96 97 – – 67 93 32 38 42 52 Sweden – – 124 95 95 95 102 101 100 99 – – 1 3 96 – 93 93 – – Switzerland – – 134 87 99 100 103 103 99 100 – – 1 4 – – 82 80 – – Syrian Arab Republic 97 94 56 26 11 10 124 120 – – 87 x 86 x 1 19 93 99 x 69 69 63 x 63 xTajikistan 100 100 92 16 10 8 101 98 – – 98 97 1 7 98 100 x 88 79 92 82 Thailand 97 97 138 29 111 113 97 94 96 95 96 96 4 244 – 100 77 82 75 83 The former Yugoslav Republic of Macedonia 99 98 106 61 28 29 89 89 92 92 99 98 8 10 – 99 – – 87 84
Timor-Leste 80 79 57 1 – – 128 122 92 91 71 73 8 16 84 91 36 40 43 48 Togo 87 73 63 5 11 11 138 127 98 x 87 x 91 87 7 x 67 x 67 90 – – 51 40 Tonga 99 100 55 35 71 70 109 108 89 91 – – 10 2 – – – – – – Trinidad and Tobago 100 100 145 64 – – 108 104 99 98 98 x 98 x 1 2 89 98 x – – 84 x 90 xTunisia 98 96 116 44 – – 111 108 – – 98 98 0 1 95 97 – – 69 77 Turkey 100 98 93 46 31 30 101 99 96 95 94 y 92 y 5 313 90 95 x 84 80 52 x 43 xTurkmenistan 100 100 117 10 – – – – – – – – – – – – – – – –Tuvalu – – 34 37 – – – – – – 97 x,y 99 x,y – – – – – – 35 x 47 xUganda 90 85 44 16 13 14 109 111 90 92 81 81 9 663 25 72 x – – 16 19 Ukraine 100 100 138 42 103 100 105 107 98 99 100 100 2 24 98 100 85 86 93 93 United Arab Emirates 94 x 97 x 172 88 71 72 110 107 99 97 – – 2 6 84 – – – – – United Kingdom – – 124 90 84 85 109 108 100 100 – – 0 7 – – 95 95 – – United Republic of Tanzania 76 73 56 4 35 34 92 94 98 x 98 x 79 82 2 x 168 x 81 91 x 30 26 26 24 United States – – 96 84 75 73 99 97 93 93 – – 7 1,800 – – 86 88 – – Uruguay 99 99 155 58 89 89 114 110 – – – – 0 0.5 95 – 68 76 – – Uzbekistan 100 100 74 38 25 25 95 92 93 90 96 x 96 x 9 178 98 100 x – – 91 x 90 xVanuatu 95 95 59 11 61 61 123 122 – – 76 y 78 y – – 71 x 88 x 51 53 22 y 26 yVenezuela (Bolivarian Republic of) 98 99 102 55 72 73 103 101 96 93 91 x 93 x 6 191 94 82 x 71 78 30 x 43 xViet Nam 97 97 131 44 79 75 104 105 – – 98 98 2 122 97 99 – – 78 84 Yemen 97 78 69 20 2 1 106 88 95 79 75 x 64 x 13 490 – 73 x 51 34 49 x 27 xZambia 70 x 58 x 72 15 – – 114 113 98 98 71 y 72 y 2 59 53 x 87 x – – 47 y 44 yZimbabwe 90 92 96 19 – – – – – – 87 y 88 y – – – 82 – – 50 y 50 y
Youth (15–24 years) literacy rate (%)
Number per 100 population
Pre-primary school participation Primary school participation Secondary school participation
Gross enrolment ratio (%)
Gross enrolment ratio (%)
Net enrolment ratio (%)
Net attendance ratio (%)
Out-of-school children of primary
school ageSurvival rate to
last primary grade (%)Net enrolment
ratio (%)Net attendance
ratio (%)
Countries and areas
2009–2013* 2013 2009–2012* 2009–2012* 2009–2013* 2008–2013* 2009-2013* 2009–2012* 2008–2013* 2009–2013* 2008–2013*
male femalemobile phones
internet users male female male female male female male female
rate (%)
number (000) admin. data survey data male female male female
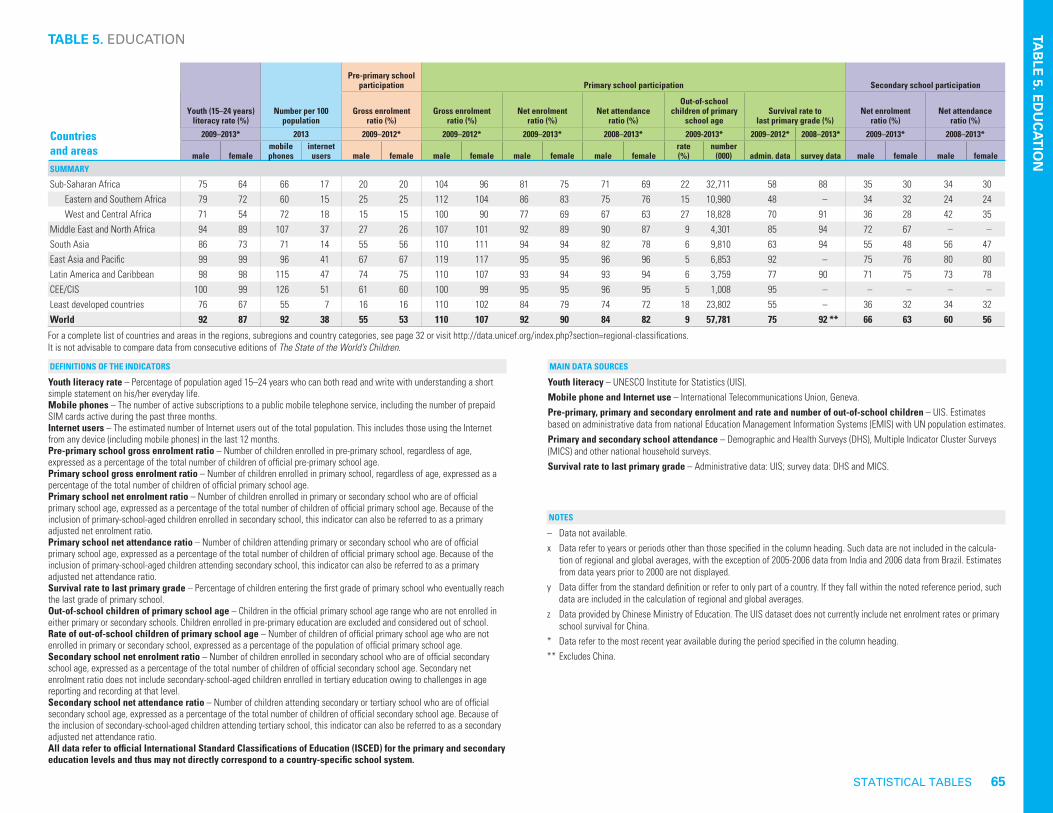
STATISTICAL TABLES 65
TABLE 5. EDUCATION
SUMMARY
Sub-Saharan Africa 75 64 66 17 20 20 104 96 81 75 71 69 22 32,711 58 88 35 30 34 30 Eastern and Southern Africa 79 72 60 15 25 25 112 104 86 83 75 76 15 10,980 48 – 34 32 24 24 West and Central Africa 71 54 72 18 15 15 100 90 77 69 67 63 27 18,828 70 91 36 28 42 35Middle East and North Africa 94 89 107 37 27 26 107 101 92 89 90 87 9 4,301 85 94 72 67 – –South Asia 86 73 71 14 55 56 110 111 94 94 82 78 6 9,810 63 94 55 48 56 47East Asia and Pacific 99 99 96 41 67 67 119 117 95 95 96 96 5 6,853 92 – 75 76 80 80Latin America and Caribbean 98 98 115 47 74 75 110 107 93 94 93 94 6 3,759 77 90 71 75 73 78CEE/CIS 100 99 126 51 61 60 100 99 95 95 96 95 5 1,008 95 – – – – –Least developed countries 76 67 55 7 16 16 110 102 84 79 74 72 18 23,802 55 – 36 32 34 32World 92 87 92 38 55 53 110 107 92 90 84 82 9 57,781 75 92 ** 66 63 60 56
DEFINITIONS OF THE INDICATORS
Youth literacy rate – Percentage of population aged 15–24 years who can both read and write with understanding a short simple statement on his/her everyday life.Mobile phones – The number of active subscriptions to a public mobile telephone service, including the number of prepaid SIM cards active during the past three months.Internet users – The estimated number of Internet users out of the total population. This includes those using the Internet from any device (including mobile phones) in the last 12 months.Pre-primary school gross enrolment ratio – Number of children enrolled in pre-primary school, regardless of age, expressed as a percentage of the total number of children of official pre-primary school age.Primary school gross enrolment ratio – Number of children enrolled in primary school, regardless of age, expressed as a percentage of the total number of children of official primary school age.Primary school net enrolment ratio – Number of children enrolled in primary or secondary school who are of official primary school age, expressed as a percentage of the total number of children of official primary school age. Because of the inclusion of primary-school-aged children enrolled in secondary school, this indicator can also be referred to as a primary adjusted net enrolment ratio.Primary school net attendance ratio – Number of children attending primary or secondary school who are of official primary school age, expressed as a percentage of the total number of children of official primary school age. Because of the inclusion of primary-school-aged children attending secondary school, this indicator can also be referred to as a primary adjusted net attendance ratio.Survival rate to last primary grade – Percentage of children entering the first grade of primary school who eventually reach the last grade of primary school. Out-of-school children of primary school age – Children in the official primary school age range who are not enrolled in either primary or secondary schools. Children enrolled in pre-primary education are excluded and considered out of school.Rate of out-of-school children of primary school age – Number of children of official primary school age who are not enrolled in primary or secondary school, expressed as a percentage of the population of official primary school age. Secondary school net enrolment ratio – Number of children enrolled in secondary school who are of official secondary school age, expressed as a percentage of the total number of children of official secondary school age. Secondary net enrolment ratio does not include secondary-school-aged children enrolled in tertiary education owing to challenges in age reporting and recording at that level. Secondary school net attendance ratio – Number of children attending secondary or tertiary school who are of official secondary school age, expressed as a percentage of the total number of children of official secondary school age. Because of the inclusion of secondary-school-aged children attending tertiary school, this indicator can also be referred to as a secondary adjusted net attendance ratio.All data refer to official International Standard Classifications of Education (ISCED) for the primary and secondary education levels and thus may not directly correspond to a country-specific school system.
MAIN DATA SOURCES
NOTES
Youth literacy – UNESCO Institute for Statistics (UIS).Mobile phone and Internet use – International Telecommunications Union, Geneva.Pre-primary, primary and secondary enrolment and rate and number of out-of-school children – UIS. Estimates based on administrative data from national Education Management Information Systems (EMIS) with UN population estimates.Primary and secondary school attendance – Demographic and Health Surveys (DHS), Multiple Indicator Cluster Surveys (MICS) and other national household surveys.Survival rate to last primary grade – Administrative data: UIS; survey data: DHS and MICS.
– Data not available.x Data refer to years or periods other than those specified in the column heading. Such data are not included in the calcula-
tion of regional and global averages, with the exception of 2005-2006 data from India and 2006 data from Brazil. Estimates from data years prior to 2000 are not displayed.
y Data differ from the standard definition or refer to only part of a country. If they fall within the noted reference period, such data are included in the calculation of regional and global averages.
z Data provided by Chinese Ministry of Education. The UIS dataset does not currently include net enrolment rates or primary school survival for China.
* Data refer to the most recent year available during the period specified in the column heading.** Excludes China.
TAB
LE 5. EDU
CATIO
N
For a complete list of countries and areas in the regions, subregions and country categories, see page 32 or visit http://data.unicef.org/index.php?section=regional-classifications.It is not advisable to compare data from consecutive editions of The State of the World’s Children.
Youth (15–24 years) literacy rate (%)
Number per 100 population
Pre-primary school participation Primary school participation Secondary school participation
Gross enrolment ratio (%)
Gross enrolment ratio (%)
Net enrolment ratio (%)
Net attendance ratio (%)
Out-of-school children of primary
school ageSurvival rate to
last primary grade (%)Net enrolment
ratio (%)Net attendance
ratio (%)
Countries and areas
2009–2013* 2013 2009–2012* 2009–2012* 2009–2013* 2008–2013* 2009-2013* 2009–2012* 2008–2013* 2009–2013* 2008–2013*
male femalemobile phones
internet users male female male female male female male female
rate (%)
number (000) admin. data survey data male female male female

66 THE STATE OF THE WORLD’S CHILDREN 2015
Countries and areas
Population (thousands)Population
annual growth rate (%) Crude death rate Crude birth rate Life expectancy
Total fertility
rate
Urbanized population
(%)
Average annual growth rate of urban population
(%)2013total under 18 under 5 1990-2013 2013-2030† 1970 1990 2013 1970 1990 2013 1970 1990 2013 2013 2013 1990-2013 2013-2030†
Afghanistan 30,552 16,536 4,905 4.2 2.1 28 16 8 53 50 34 37 49 61 4.9 26 5.7 3.7
Albania 3,173 833 198 -0.4 0.2 8 6 7 34 25 13 67 72 77 1.8 55 1.5 1.5
Algeria 39,208 12,817 4,557 1.7 1.3 17 6 6 47 32 24 50 67 71 2.8 70 3.0 1.9
Andorra 79 14 4 1.6 0.7 – – – – – – – – – – 86 1.2 0.3
Angola 21,472 11,619 4,021 3.2 2.8 27 23 14 52 53 44 37 41 52 5.9 42 5.4 4.3
Antigua and Barbuda 90 27 7 1.6 0.9 7 7 6 30 19 16 66 71 76 2.1 25 0.0 0.1
Argentina 41,446 12,076 3,434 1.0 0.7 9 8 8 23 22 17 66 72 76 2.2 91 1.3 0.8
Armenia 2,977 723 210 -0.8 0.0 6 8 9 23 22 14 70 68 75 1.7 63 -1.1 0.0
Australia 23,343 5,345 1,565 1.4 1.1 9 7 7 20 15 13 71 77 82 1.9 89 1.5 1.3
Austria 8,495 1,510 407 0.4 0.3 13 11 9 15 12 10 70 75 81 1.5 66 0.5 0.6
Azerbaijan 9,413 2,547 787 1.2 0.6 9 8 7 29 27 18 65 65 71 1.9 54 1.2 1.2
Bahamas 377 99 29 1.7 1.0 6 5 6 26 24 15 66 71 75 1.9 83 1.8 1.1
Bahrain 1,332 327 103 4.3 1.2 7 3 2 38 29 15 63 72 77 2.1 89 4.3 1.3
Bangladesh 156,595 56,666 15,128 1.6 1.0 19 10 6 47 35 20 48 60 71 2.2 33 3.8 2.8
Barbados 285 65 18 0.4 0.4 10 10 9 22 16 13 65 71 75 1.8 32 0.3 0.6
Belarus 9,357 1,716 521 -0.4 -0.6 9 11 16 16 14 11 71 71 70 1.5 76 0.2 -0.2
Belgium 11,104 2,252 655 0.5 0.3 12 11 10 14 12 12 71 76 81 1.9 98 0.5 0.3
Belize 332 133 38 2.5 1.9 8 5 4 42 36 23 66 71 74 2.7 44 2.2 2.0
Benin 10,323 5,099 1,657 3.2 2.4 24 14 9 47 46 36 42 54 59 4.8 43 4.1 3.4
Bhutan 754 256 71 1.5 1.0 26 13 7 49 38 20 37 52 68 2.2 37 5.0 2.5
Bolivia (Plurinational State of) 10,671 4,402 1,279 2.0 1.5 20 10 7 46 37 26 46 59 67 3.2 68 2.8 2.0
Bosnia and Herzegovina 3,829 769 162 -0.7 -0.2 7 10 10 23 15 9 66 67 76 1.3 39 -0.7 0.5
Botswana 2,021 811 232 1.6 0.9 13 7 17 46 35 24 55 63 48 2.6 57 3.0 1.4
Brazil 200,362 58,552 14,636 1.3 0.6 10 7 6 35 24 15 59 66 74 1.8 85 1.9 0.9
Brunei Darussalam 418 126 33 2.1 1.0 6 4 3 36 32 16 67 74 79 2.0 77 2.8 1.4
Bulgaria 7,223 1,184 344 -0.9 -0.9 9 13 16 16 12 10 71 71 74 1.5 73 -0.4 -0.5
Burkina Faso 16,935 8,859 2,983 2.8 2.6 25 17 11 47 47 41 39 49 56 5.6 28 5.9 4.9
Burundi 10,163 5,164 1,897 2.6 2.8 21 18 13 47 50 45 44 47 54 6.0 11 5.2 5.2
Cabo Verde 499 180 48 1.5 0.9 15 8 5 41 39 20 52 66 75 2.3 64 3.1 1.6
Cambodia 15,135 5,583 1,713 2.2 1.4 20 12 6 43 42 26 42 55 72 2.9 20 3.4 2.7
Cameroon 22,254 11,037 3,630 2.7 2.3 19 14 12 45 45 37 46 54 55 4.8 53 3.9 3.2
Canada 35,182 7,023 1,991 1.0 0.8 7 7 8 17 14 11 72 77 81 1.7 81 1.3 1.1
Central African Republic 4,616 2,148 674 2.0 1.8 23 19 15 43 41 34 42 46 50 4.4 39 2.3 2.8
Chad 12,825 7,092 2,457 3.3 2.9 23 19 14 47 51 46 41 46 51 6.3 22 3.6 3.9
Chile 17,620 4,532 1,224 1.3 0.7 10 6 6 29 23 14 62 74 80 1.8 89 1.5 0.8
China 1,385,567 301,233 90,187 0.8 0.3 8 7 7 35 23 13 63 69 75 1.7 53 3.8 1.8
Colombia 48,321 16,014 4,502 1.6 1.0 9 6 6 38 27 19 61 68 74 2.3 76 2.1 1.3
Comoros 735 354 116 2.5 2.1 18 12 9 45 38 35 48 56 61 4.7 28 2.5 2.8
Congo 4,448 2,170 738 2.7 2.5 14 12 10 43 38 38 53 55 59 5.0 65 3.5 3.0
Cook Islands 21 7 2 0.7 0.4 – – – – – – – – – – 74 1.8 0.7
TABLE 6. DEMOGRAPHIC INDICATORS

STATISTICAL TABLES 67
Costa Rica 4,872 1,397 363 2.0 1.0 7 4 4 33 27 15 67 76 80 1.8 75 3.8 1.7
Côte d'Ivoire 20,316 9,765 3,196 2.2 2.1 21 14 14 53 41 37 44 52 51 4.9 53 3.5 3.2
Croatia 4,290 786 215 -0.5 -0.4 10 11 12 15 12 10 68 72 77 1.5 58 -0.1 0.2
Cuba 11,266 2,254 529 0.3 -0.2 7 7 8 29 17 10 70 75 79 1.4 77 0.5 0.0
Cyprus 1,141 240 65 1.7 0.8 7 7 7 19 19 11 73 77 80 1.5 67 1.8 0.8
Czech Republic 10,702 1,875 601 0.2 0.2 12 12 11 16 12 11 70 72 78 1.6 73 0.0 0.3Democratic People's Republic of Korea 24,895 6,583 1,710 0.9 0.4 10 6 9 37 21 14 60 70 70 2.0 61 1.1 0.8
Democratic Republic of the Congo 67,514 34,914 11,907 2.9 2.5 20 18 15 47 48 43 44 47 50 5.9 41 4.2 3.7
Denmark 5,619 1,198 323 0.4 0.4 10 12 10 15 12 11 73 75 79 1.9 87 0.5 0.6
Djibouti 873 347 109 1.7 1.2 15 11 9 45 40 27 49 57 62 3.4 77 1.8 1.4
Dominica 72 22 6 0.1 0.4 – – – – – – – – – – 69 0.5 0.8
Dominican Republic 10,404 3,731 1,061 1.6 0.9 11 6 6 42 30 21 58 68 73 2.5 77 3.0 1.7
Ecuador 15,738 5,598 1,599 1.9 1.3 12 6 5 41 30 21 58 69 76 2.6 63 2.5 1.7
Egypt 82,056 30,122 9,268 1.6 1.3 16 8 6 41 31 23 52 65 71 2.8 43 1.6 1.8
El Salvador 6,340 2,344 635 0.7 0.5 13 7 7 43 32 20 56 66 73 2.2 66 2.0 1.1
Equatorial Guinea 757 341 115 3.1 2.4 25 20 13 39 47 35 40 47 53 4.8 40 3.6 3.0
Eritrea 6,333 3,118 1,060 2.9 2.6 22 15 7 47 45 37 41 48 63 4.7 22 4.3 4.5
Estonia 1,287 241 71 -0.9 -0.4 11 13 14 15 14 11 70 69 74 1.6 68 -1.1 -0.3
Ethiopia 94,101 47,034 14,249 2.9 2.2 21 18 8 48 47 33 43 47 64 4.5 19 4.6 4.4
Fiji 881 301 90 0.8 0.4 8 6 7 34 29 20 60 66 70 2.6 53 1.9 1.0
Finland 5,426 1,078 306 0.4 0.2 10 10 10 14 13 11 70 75 81 1.9 84 0.6 0.4
France 64,291 14,058 3,943 0.5 0.4 11 9 9 17 13 12 72 77 82 2.0 79 0.8 0.7
Gabon 1,672 747 243 2.5 2.1 20 11 9 37 37 32 47 61 63 4.1 87 3.5 2.2
Gambia 1,849 971 339 3.1 3.0 26 14 10 50 47 43 38 52 59 5.8 58 4.9 3.7
Georgia 4,341 922 298 -1.0 -0.6 10 9 12 19 17 13 67 70 74 1.8 53 -1.1 -0.1
Germany 82,727 13,288 3,475 0.1 -0.2 12 11 11 14 10 8 71 75 81 1.4 75 0.2 0.1
Ghana 25,905 11,601 3,677 2.5 1.8 16 11 9 47 39 31 49 57 61 3.9 53 4.1 2.8
Greece 11,128 1,950 566 0.4 -0.1 10 9 10 17 10 10 71 77 81 1.5 77 0.7 0.3
Grenada 106 34 10 0.4 0.1 9 9 7 28 28 19 64 69 73 2.2 36 0.7 0.4
Guatemala 15,468 7,298 2,250 2.4 2.2 15 9 5 44 39 31 52 62 72 3.8 51 3.3 3.1
Guinea 11,745 5,746 1,886 2.9 2.3 27 17 11 45 46 37 37 50 56 4.9 36 4.0 3.6
Guinea-Bissau 1,704 817 270 2.2 2.2 20 17 13 44 45 37 44 49 54 4.9 48 4.5 3.4
Guyana 800 338 84 0.4 0.4 10 9 7 34 23 20 59 62 66 2.5 28 0.2 1.1
Haiti 10,317 4,276 1,250 1.6 1.1 18 13 9 39 37 26 47 54 63 3.1 56 4.6 2.4
Holy See 1 0 0 0.2 0.0 – – – – – – – – – – 100 0.2 0.0
Honduras 8,098 3,391 997 2.2 1.7 15 7 5 47 38 26 53 67 74 3.0 54 3.4 2.6
Hungary 9,955 1,769 493 -0.2 -0.3 11 14 13 15 12 10 70 69 75 1.4 70 0.1 0.3
Iceland 330 82 24 1.1 0.9 7 7 6 21 17 15 74 78 82 2.1 94 1.3 1.0
India 1,252,140 435,384 121,293 1.6 1.0 16 11 8 38 31 20 49 59 66 2.5 32 2.6 2.2
TABLE 6. DEMOGRAPHIC INDICATORS
Countries and areas
Population (thousands)Population
annual growth rate (%) Crude death rate Crude birth rate Life expectancy
Total fertility
rate
Urbanized population
(%)
Average annual growth rate of urban population
(%)2013total under 18 under 5 1990-2013 2013-2030† 1970 1990 2013 1970 1990 2013 1970 1990 2013 2013 2013 1990-2013 2013-2030†
TAB
LE 6. DEM
OG
RA
PHIC
IND
ICATO
RS

68 THE STATE OF THE WORLD’S CHILDREN 2015
Indonesia 249,866 85,506 23,979 1.5 0.9 14 8 6 40 26 19 52 63 71 2.3 52 3.8 2.0
Iran (Islamic Republic of) 77,447 21,920 7,090 1.4 1.0 16 7 5 42 33 19 51 63 74 1.9 72 2.5 1.5
Iraq 33,765 15,752 4,909 2.9 2.4 12 6 5 46 38 31 58 68 69 4.0 69 2.8 2.7
Ireland 4,627 1,175 363 1.2 0.9 11 9 6 22 14 15 71 75 81 2.0 63 1.6 1.3
Israel 7,733 2,509 782 2.4 1.3 7 6 5 26 22 20 72 76 82 2.9 92 2.4 1.4
Italy 60,990 10,308 2,859 0.3 0.0 10 10 10 17 10 9 71 77 82 1.5 69 0.4 0.3
Jamaica 2,784 934 249 0.7 0.3 8 7 7 36 26 18 68 71 74 2.3 54 1.1 0.9
Japan 127,144 20,195 5,382 0.2 -0.3 7 7 10 19 10 8 72 79 84 1.4 92 0.9 0.0
Jordan 7,274 2,900 955 3.4 1.5 10 5 4 51 34 27 60 70 74 3.2 83 3.9 1.7
Kazakhstan 16,441 4,946 1,658 0.1 0.7 9 9 10 25 24 21 63 67 67 2.5 53 -0.2 1.0
Kenya 44,354 21,524 7,048 2.8 2.4 15 10 8 51 42 35 52 59 62 4.4 25 4.5 4.0
Kiribati 102 39 11 1.6 1.4 15 9 6 39 36 23 51 61 69 3.0 44 2.6 1.9
Kuwait 3,369 975 324 2.1 2.1 6 3 3 49 19 21 66 72 74 2.6 98 2.2 2.1
Kyrgyzstan 5,548 1,997 681 1.0 1.3 11 8 7 31 31 27 60 66 68 3.1 35 0.7 2.0
Lao People's Democratic Republic 6,770 2,859 880 2.0 1.5 18 13 6 43 43 27 46 54 68 3.0 36 5.8 3.5
Latvia 2,050 360 110 -1.1 -0.6 11 13 16 14 14 11 70 69 72 1.6 67 -1.3 -0.5
Lebanon 4,822 1,274 302 2.5 0.4 8 7 4 32 25 13 66 70 80 1.5 88 2.7 0.5
Lesotho 2,074 906 262 1.1 0.9 17 10 15 43 35 27 49 59 49 3.0 26 3.9 2.7
Liberia 4,294 2,119 686 3.1 2.3 24 18 9 49 45 35 39 47 61 4.8 49 2.6 3.2
Libya 6,202 2,143 641 1.6 1.1 13 5 4 47 29 21 56 68 75 2.4 78 1.8 1.4
Liechtenstein 37 7 2 1.1 0.7 – – – – – – – – – – 14 0.4 1.0
Lithuania 3,017 562 167 -0.9 -0.4 9 11 14 17 15 11 71 71 72 1.5 67 -1.0 -0.2
Luxembourg 530 113 31 1.4 1.1 12 10 8 13 12 12 70 75 81 1.7 90 1.9 1.3
Madagascar 22,925 11,303 3,606 3.0 2.7 21 15 7 48 45 35 45 51 65 4.5 34 4.6 4.2
Malawi 16,363 8,533 2,870 2.4 2.7 24 18 11 52 50 40 41 47 55 5.4 16 3.8 4.2
Malaysia 29,717 9,426 2,499 2.1 1.3 7 5 5 33 28 18 64 71 75 2.0 73 3.8 1.9
Maldives 345 120 37 2.0 1.4 21 9 3 50 41 22 44 61 78 2.3 43 4.3 2.9
Mali 15,302 8,247 2,951 2.8 3.1 32 20 13 49 48 47 32 46 55 6.8 38 5.0 4.7
Malta 429 79 20 0.6 0.1 9 7 8 16 16 9 71 75 80 1.4 95 0.8 0.2
Marshall Islands 53 19 5 0.5 0.6 – – – – – – – – – – 72 0.9 0.9
Mauritania 3,890 1,808 584 2.8 2.2 16 11 9 46 41 34 49 58 62 4.7 59 4.4 3.0
Mauritius 1,244 303 70 0.7 0.2 7 6 8 29 21 11 63 69 74 1.5 40 0.3 0.2
Mexico 122,332 41,942 11,292 1.5 0.9 10 5 5 43 28 18 61 71 78 2.2 79 1.9 1.2
Micronesia (Federated States of) 104 44 12 0.3 0.9 9 7 6 41 34 24 62 66 69 3.3 22 -0.3 1.4
Monaco 38 7 2 1.1 0.9 – – – – – – – – – – 100 1.1 0.9
Mongolia 2,839 916 309 1.1 1.0 15 10 7 44 32 23 55 60 68 2.4 70 2.1 1.8
Montenegro 621 142 39 0.0 -0.1 8 7 10 21 14 12 70 74 75 1.7 64 1.3 0.2
Morocco 33,008 11,010 3,422 1.3 1.0 14 7 6 43 30 23 53 65 71 2.7 59 2.1 1.7
Mozambique 25,834 13,393 4,399 2.8 2.4 25 20 14 48 43 39 39 44 50 5.2 32 3.8 3.5
Myanmar 53,259 16,096 4,406 1.0 0.6 15 10 9 40 27 17 51 59 65 1.9 33 2.3 2.1
TABLE 6. DEMOGRAPHIC INDICATORS
Countries and areas
Population (thousands)Population
annual growth rate (%) Crude death rate Crude birth rate Life expectancy
Total fertility
rate
Urbanized population
(%)
Average annual growth rate of urban population
(%)2013total under 18 under 5 1990-2013 2013-2030† 1970 1990 2013 1970 1990 2013 1970 1990 2013 2013 2013 1990-2013 2013-2030†
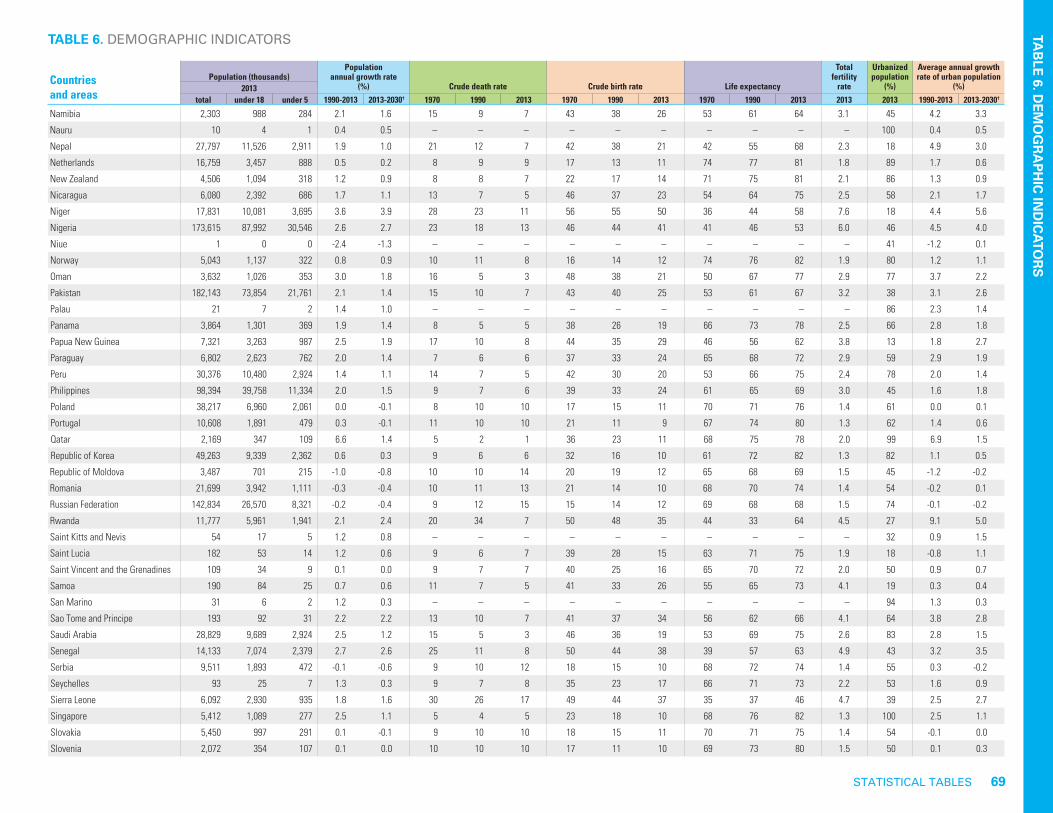
STATISTICAL TABLES 69
Namibia 2,303 988 284 2.1 1.6 15 9 7 43 38 26 53 61 64 3.1 45 4.2 3.3
Nauru 10 4 1 0.4 0.5 – – – – – – – – – – 100 0.4 0.5
Nepal 27,797 11,526 2,911 1.9 1.0 21 12 7 42 38 21 42 55 68 2.3 18 4.9 3.0
Netherlands 16,759 3,457 888 0.5 0.2 8 9 9 17 13 11 74 77 81 1.8 89 1.7 0.6
New Zealand 4,506 1,094 318 1.2 0.9 8 8 7 22 17 14 71 75 81 2.1 86 1.3 0.9
Nicaragua 6,080 2,392 686 1.7 1.1 13 7 5 46 37 23 54 64 75 2.5 58 2.1 1.7
Niger 17,831 10,081 3,695 3.6 3.9 28 23 11 56 55 50 36 44 58 7.6 18 4.4 5.6
Nigeria 173,615 87,992 30,546 2.6 2.7 23 18 13 46 44 41 41 46 53 6.0 46 4.5 4.0
Niue 1 0 0 -2.4 -1.3 – – – – – – – – – – 41 -1.2 0.1
Norway 5,043 1,137 322 0.8 0.9 10 11 8 16 14 12 74 76 82 1.9 80 1.2 1.1
Oman 3,632 1,026 353 3.0 1.8 16 5 3 48 38 21 50 67 77 2.9 77 3.7 2.2
Pakistan 182,143 73,854 21,761 2.1 1.4 15 10 7 43 40 25 53 61 67 3.2 38 3.1 2.6
Palau 21 7 2 1.4 1.0 – – – – – – – – – – 86 2.3 1.4
Panama 3,864 1,301 369 1.9 1.4 8 5 5 38 26 19 66 73 78 2.5 66 2.8 1.8
Papua New Guinea 7,321 3,263 987 2.5 1.9 17 10 8 44 35 29 46 56 62 3.8 13 1.8 2.7
Paraguay 6,802 2,623 762 2.0 1.4 7 6 6 37 33 24 65 68 72 2.9 59 2.9 1.9
Peru 30,376 10,480 2,924 1.4 1.1 14 7 5 42 30 20 53 66 75 2.4 78 2.0 1.4
Philippines 98,394 39,758 11,334 2.0 1.5 9 7 6 39 33 24 61 65 69 3.0 45 1.6 1.8
Poland 38,217 6,960 2,061 0.0 -0.1 8 10 10 17 15 11 70 71 76 1.4 61 0.0 0.1
Portugal 10,608 1,891 479 0.3 -0.1 11 10 10 21 11 9 67 74 80 1.3 62 1.4 0.6
Qatar 2,169 347 109 6.6 1.4 5 2 1 36 23 11 68 75 78 2.0 99 6.9 1.5
Republic of Korea 49,263 9,339 2,362 0.6 0.3 9 6 6 32 16 10 61 72 82 1.3 82 1.1 0.5
Republic of Moldova 3,487 701 215 -1.0 -0.8 10 10 14 20 19 12 65 68 69 1.5 45 -1.2 -0.2
Romania 21,699 3,942 1,111 -0.3 -0.4 10 11 13 21 14 10 68 70 74 1.4 54 -0.2 0.1
Russian Federation 142,834 26,570 8,321 -0.2 -0.4 9 12 15 15 14 12 69 68 68 1.5 74 -0.1 -0.2
Rwanda 11,777 5,961 1,941 2.1 2.4 20 34 7 50 48 35 44 33 64 4.5 27 9.1 5.0
Saint Kitts and Nevis 54 17 5 1.2 0.8 – – – – – – – – – – 32 0.9 1.5
Saint Lucia 182 53 14 1.2 0.6 9 6 7 39 28 15 63 71 75 1.9 18 -0.8 1.1
Saint Vincent and the Grenadines 109 34 9 0.1 0.0 9 7 7 40 25 16 65 70 72 2.0 50 0.9 0.7
Samoa 190 84 25 0.7 0.6 11 7 5 41 33 26 55 65 73 4.1 19 0.3 0.4
San Marino 31 6 2 1.2 0.3 – – – – – – – – – – 94 1.3 0.3
Sao Tome and Principe 193 92 31 2.2 2.2 13 10 7 41 37 34 56 62 66 4.1 64 3.8 2.8
Saudi Arabia 28,829 9,689 2,924 2.5 1.2 15 5 3 46 36 19 53 69 75 2.6 83 2.8 1.5
Senegal 14,133 7,074 2,379 2.7 2.6 25 11 8 50 44 38 39 57 63 4.9 43 3.2 3.5
Serbia 9,511 1,893 472 -0.1 -0.6 9 10 12 18 15 10 68 72 74 1.4 55 0.3 -0.2
Seychelles 93 25 7 1.3 0.3 9 7 8 35 23 17 66 71 73 2.2 53 1.6 0.9
Sierra Leone 6,092 2,930 935 1.8 1.6 30 26 17 49 44 37 35 37 46 4.7 39 2.5 2.7
Singapore 5,412 1,089 277 2.5 1.1 5 4 5 23 18 10 68 76 82 1.3 100 2.5 1.1
Slovakia 5,450 997 291 0.1 -0.1 9 10 10 18 15 11 70 71 75 1.4 54 -0.1 0.0
Slovenia 2,072 354 107 0.1 0.0 10 10 10 17 11 10 69 73 80 1.5 50 0.1 0.3
TABLE 6. DEMOGRAPHIC INDICATORS
Countries and areas
Population (thousands)Population
annual growth rate (%) Crude death rate Crude birth rate Life expectancy
Total fertility
rate
Urbanized population
(%)
Average annual growth rate of urban population
(%)2013total under 18 under 5 1990-2013 2013-2030† 1970 1990 2013 1970 1990 2013 1970 1990 2013 2013 2013 1990-2013 2013-2030†
TAB
LE 6. DEM
OG
RA
PHIC
IND
ICATO
RS

70 THE STATE OF THE WORLD’S CHILDREN 2015
TABLE 6. DEMOGRAPHIC INDICATORS
Solomon Islands 561 262 82 2.6 1.8 13 11 6 45 40 31 54 57 68 4.0 21 4.5 3.5
Somalia 10,496 5,678 1,957 2.2 2.8 23 20 12 46 48 44 41 45 55 6.6 39 3.4 4.0
South Africa 52,776 18,366 5,437 1.6 0.6 14 8 13 38 29 21 53 62 57 2.4 64 2.5 1.2
South Sudan 11,296 5,523 1,785 2.9 2.5 28 21 12 51 47 36 36 44 55 4.9 18 4.3 4.0
Spain 46,927 8,458 2,530 0.8 0.2 9 9 9 20 10 10 72 77 82 1.5 79 1.0 0.4
Sri Lanka 21,273 6,308 1,883 0.9 0.5 8 6 7 31 21 18 64 70 74 2.3 18 0.8 1.3
State of Palestine 4,326 2,051 615 3.2 2.3 13 5 3 50 45 30 56 68 73 4.0 75 3.6 2.6
Sudan 37,964 18,135 5,722 2.8 2.2 15 12 8 47 42 33 52 56 62 4.4 33 3.5 3.1
Suriname 539 177 47 1.2 0.7 9 7 7 37 23 18 63 67 71 2.3 66 1.3 0.7
Swaziland 1,250 562 170 1.6 1.1 18 10 14 49 43 30 48 59 49 3.3 21 1.3 1.6
Sweden 9,571 1,929 571 0.5 0.7 10 11 10 14 14 12 74 78 82 1.9 86 0.6 0.8
Switzerland 8,078 1,458 406 0.8 0.9 9 9 8 16 12 10 73 78 83 1.5 74 0.9 1.1
Syrian Arab Republic 21,898 9,085 2,588 2.5 1.8 11 5 4 46 36 24 59 70 75 3.0 57 3.1 2.5
Tajikistan 8,208 3,467 1,195 1.9 1.9 12 10 7 41 40 33 60 63 67 3.8 27 1.2 2.7
Thailand 67,011 14,862 3,635 0.7 0.0 10 6 8 38 19 10 60 70 74 1.4 48 2.9 1.7The former Yugoslav Republic of Macedonia 2,107 433 112 0.2 -0.1 8 8 10 24 18 11 66 71 75 1.4 57 0.1 0.3
Timor-Leste 1,133 616 190 1.8 1.9 23 16 6 42 43 36 40 48 68 5.9 31 3.6 3.4
Togo 6,817 3,292 1,094 2.6 2.3 19 12 11 48 43 36 47 56 57 4.6 39 3.9 3.5
Tonga 105 46 13 0.4 0.8 7 6 6 36 31 25 65 70 73 3.8 24 0.6 1.4
Trinidad and Tobago 1,341 330 97 0.4 -0.1 7 8 10 27 21 14 65 68 70 1.8 9 0.5 -0.5
Tunisia 10,997 3,051 925 1.3 0.8 14 6 6 41 27 17 51 69 76 2.0 66 1.9 1.1
Turkey 74,933 23,105 6,355 1.4 0.9 15 8 6 40 26 17 52 64 75 2.0 72 2.3 1.4
Turkmenistan 5,240 1,778 513 1.6 1.0 12 9 8 37 35 21 58 63 65 2.3 49 1.9 1.7
Tuvalu 10 4 1 0.4 0.5 – – – – – – – – – – 58 1.9 1.6
Uganda 37,579 20,774 7,115 3.3 3.1 17 17 9 49 50 43 49 48 59 5.9 15 4.8 5.2
Ukraine 45,239 7,865 2,532 -0.6 -0.7 9 13 17 15 13 11 71 70 69 1.5 69 -0.4 -0.4
United Arab Emirates 9,346 1,666 666 7.1 1.6 7 3 1 37 26 14 62 71 77 1.8 85 7.5 1.9
United Kingdom 63,136 13,311 3,969 0.4 0.5 12 11 9 15 14 12 72 76 81 1.9 82 0.6 0.7
United Republic of Tanzania 49,253 25,241 8,657 2.9 2.8 18 15 9 48 44 39 47 50 62 5.2 30 4.9 4.7
United States 320,051 75,478 20,785 1.0 0.7 10 9 8 17 16 13 71 75 79 2.0 81 1.3 0.9
Uruguay 3,407 901 244 0.4 0.3 10 10 9 21 18 14 69 73 77 2.0 95 0.7 0.4
Uzbekistan 28,934 9,995 2,977 1.5 1.0 10 7 7 39 34 21 63 67 68 2.3 36 1.0 1.7
Vanuatu 253 110 34 2.4 2.0 14 8 5 42 36 27 52 63 72 3.4 26 3.7 3.1
Venezuela (Bolivarian Republic of) 30,405 10,331 2,955 1.9 1.2 7 5 5 37 29 20 65 71 75 2.4 89 2.1 1.3
Viet Nam 91,680 25,078 7,138 1.2 0.6 11 6 6 37 29 16 60 71 76 1.7 32 3.3 2.3
Yemen 24,407 11,587 3,446 3.2 1.9 24 12 7 52 52 31 41 58 63 4.1 33 5.2 3.5
Zambia 14,539 7,763 2,656 2.7 3.2 17 19 10 49 44 43 49 44 58 5.7 40 2.8 4.3
Zimbabwe 14,150 6,581 2,042 1.3 2.1 13 9 9 48 37 31 55 59 60 3.5 33 1.8 2.3
Countries and areas
Population (thousands)Population
annual growth rate (%) Crude death rate Crude birth rate Life expectancy
Total fertility
rate
Urbanized population
(%)
Average annual growth rate of urban population
(%)2013total under 18 under 5 1990-2013 2013-2030† 1970 1990 2013 1970 1990 2013 1970 1990 2013 2013 2013 1990-2013 2013-2030†
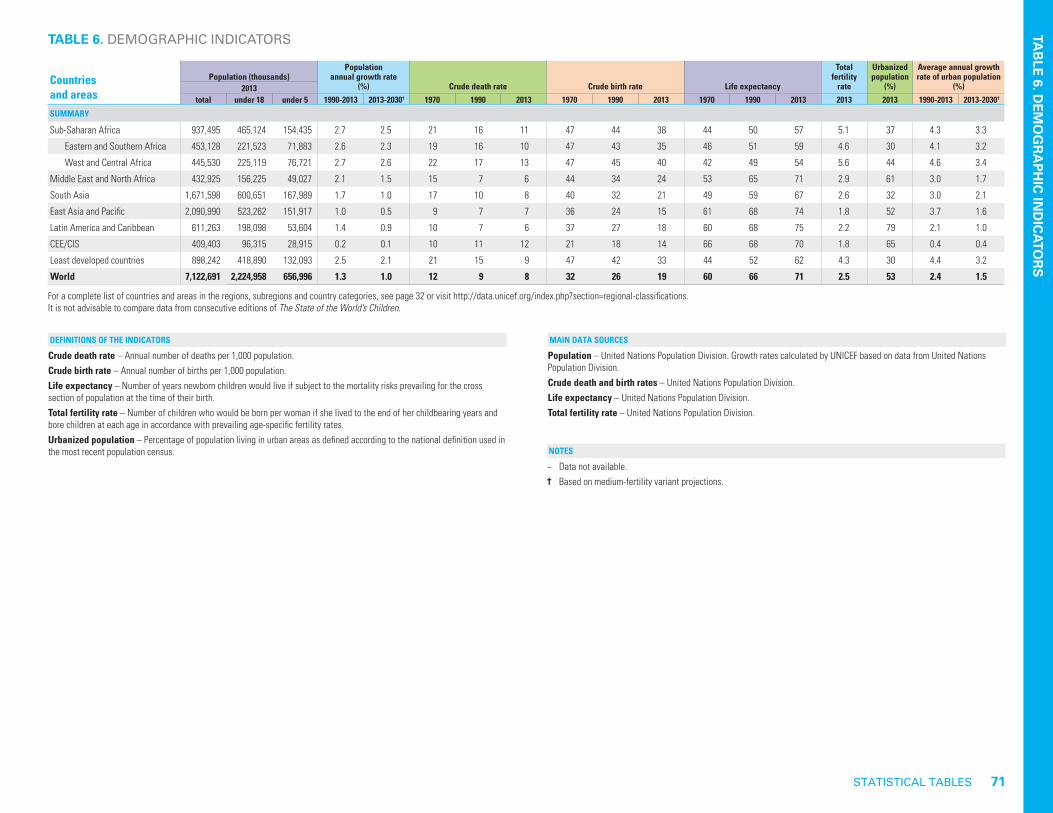
STATISTICAL TABLES 71
TABLE 6. DEMOGRAPHIC INDICATORS
DEFINITIONS OF THE INDICATORS
Crude death rate – Annual number of deaths per 1,000 population.Crude birth rate – Annual number of births per 1,000 population.Life expectancy – Number of years newborn children would live if subject to the mortality risks prevailing for the cross section of population at the time of their birth.Total fertility rate – Number of children who would be born per woman if she lived to the end of her childbearing years and bore children at each age in accordance with prevailing age-specific fertility rates.Urbanized population – Percentage of population living in urban areas as defined according to the national definition used in the most recent population census.
MAIN DATA SOURCES
NOTES
Population – United Nations Population Division. Growth rates calculated by UNICEF based on data from United Nations Population Division. Crude death and birth rates – United Nations Population Division.Life expectancy – United Nations Population Division.Total fertility rate – United Nations Population Division.
− Data not available.† Based on medium-fertility variant projections.
TAB
LE 6. DEM
OG
RA
PHIC
IND
ICATO
RS
For a complete list of countries and areas in the regions, subregions and country categories, see page 32 or visit http://data.unicef.org/index.php?section=regional-classifications.It is not advisable to compare data from consecutive editions of The State of the World’s Children.
Countries and areas
Population (thousands)Population
annual growth rate (%) Crude death rate Crude birth rate Life expectancy
Total fertility
rate
Urbanized population
(%)
Average annual growth rate of urban population
(%)2013total under 18 under 5 1990-2013 2013-2030† 1970 1990 2013 1970 1990 2013 1970 1990 2013 2013 2013 1990-2013 2013-2030†
SUMMARY
Sub-Saharan Africa 937,495 465,124 154,435 2.7 2.5 21 16 11 47 44 38 44 50 57 5.1 37 4.3 3.3
Eastern and Southern Africa 453,128 221,523 71,883 2.6 2.3 19 16 10 47 43 35 46 51 59 4.6 30 4.1 3.2
West and Central Africa 445,530 225,119 76,721 2.7 2.6 22 17 13 47 45 40 42 49 54 5.6 44 4.6 3.4
Middle East and North Africa 432,925 156,225 49,027 2.1 1.5 15 7 6 44 34 24 53 65 71 2.9 61 3.0 1.7
South Asia 1,671,598 600,651 167,989 1.7 1.0 17 10 8 40 32 21 49 59 67 2.6 32 3.0 2.1
East Asia and Pacific 2,090,990 523,262 151,917 1.0 0.5 9 7 7 36 24 15 61 68 74 1.8 52 3.7 1.6
Latin America and Caribbean 611,263 198,098 53,604 1.4 0.9 10 7 6 37 27 18 60 68 75 2.2 79 2.1 1.0
CEE/CIS 409,403 96,315 28,915 0.2 0.1 10 11 12 21 18 14 66 68 70 1.8 65 0.4 0.4
Least developed countries 898,242 418,890 132,093 2.5 2.1 21 15 9 47 42 33 44 52 62 4.3 30 4.4 3.2
World 7,122,691 2,224,958 656,996 1.3 1.0 12 9 8 32 26 19 60 66 71 2.5 53 2.4 1.5

72 THE STATE OF THE WORLD’S CHILDREN 2015
Countries and areas
GNI per capita (US$) GDP per capita average annual growth rate (%)
Average annual rate of inflation (%)
Population below
international poverty line of
US$1.25 per day (%)
Public spending as a % of GDP (2008-2012*) allocated to:
ODA inflow in millions US$
ODA inflow as a % of
recipient GNI2008–2013*
Debt service as a % of exports of goods and services
Share of household income(%, 2009-2012*)US$ PPP US$
2013 2013 1970–1990 1990-2013 1990-2013 2009-2012* health education military 2012 2012 2012 poorest 40% richest 20%Afghanistan 700 2,000 e – – – – 2 – 4 6,725 33 0 23 x 37 xAlbania 4,700 10,520 -0.6 x 5.8 12 1 x 3 – 1 342 3 5 20 x 43 xAlgeria 5,290 12,990 1.8 1.7 11 – 3 4 3 145 0 1 – –Andorra d – -1.3 2.5 x 3 x – 6 – – – – – – –Angola 5,010 6,770 – 4.3 170 43 2 3 4 242 0 6 15 49Antigua and Barbuda 12,910 20,070 7.9 x 1.3 3 – 3 2 – 2 0 – – –Argentina c – -0.8 2.3 10 1 5 6 1 179 0 13 13 49Armenia 3,790 8,140 – 6.3 39 3 2 3 4 273 3 21 22 40Australia 65,520 42,540 1.5 2.1 3 – 6 5 2 – – – – –Austria 48,590 43,810 2.5 1.7 2 – 9 6 1 – – – 22 x 38 xAzerbaijan 7,350 16,180 – 6.3 43 0 x 1 2 5 338 1 5 20 x 42 xBahamas 20,600 x 21,540 x 1.9 0.3 x 3 x – 3 – – – – – – –Bahrain 19,560 x 36,140 x -1.0 x 0.1 5 – 3 3 3 – – – – –Bangladesh 900 2,810 0.5 3.8 5 43 1 2 1 2,152 2 3 21 41Barbados 15,080 x 15,080 x 1.7 1.3 x 3 x – 4 6 – – – – – –Belarus 6,720 16,940 – 5.0 99 0 4 5 1 103 0 8 23 36Belgium 45,210 40,280 2.2 1.4 2 – 8 7 1 – – – 22 x 41 xBelize 4,660 8,160 3.1 2.0 1 – 4 7 1 25 2 10 – –Benin 790 1,780 0.4 1.1 5 47 x 2 4 1 511 7 – 18 x 46 xBhutan 2,460 7,210 7.0 x 5.4 7 2 3 5 – 161 9 17 18 46Bolivia (Plurinational State of) 2,550 5,750 -1.2 1.8 7 16 x 4 7 1 659 3 5 9 x 59 xBosnia and Herzegovina 4,740 9,820 – 7.4 x 5 x 0 x 7 – 1 571 3 13 18 x 43 xBotswana 7,730 15,500 8.0 2.8 9 – 4 9 3 74 1 1 – –Brazil 11,690 14,750 2.3 1.7 42 6 4 6 2 1,288 0 15 10 59Brunei Darussalam d – -2.2 x -0.4 5 – 2 3 2 – – – – –Bulgaria 7,030 15,200 3.4 x 3.4 32 0 x 4 4 2 – – 12 23 x 37 xBurkina Faso 670 1,560 1.4 2.9 3 45 3 3 1 1,159 11 – 18 47Burundi 280 820 1.2 -1.5 14 81 x 5 6 2 523 21 5 21 x 43 xCabo Verde 3,630 6,220 3.7 x 6.7 1 21 x 3 5 1 246 14 4 13 x 56 xCambodia 950 2,890 – 6.0 x 4 x 19 1 3 2 807 6 1 19 44Cameroon 1,270 2,660 3.4 0.5 3 10 x 2 3 1 596 2 3 17 x 46 xCanada 52,200 42,590 2.0 1.7 2 – 8 5 1 – – – 20 x 40 xCentral African Republic 320 600 -1.3 0.6 2 63 x 2 1 3 227 10 – 10 x 61 xChad 1,020 2,000 -0.9 3.4 7 62 x 1 2 2 479 4 – 16 x 47 xChile 15,230 21,030 1.5 3.4 6 1 3 5 2 126 0 – 12 58China 6,560 11,850 6.5 9.4 5 12 3 – 2 -194 0 2 15 47Colombia 7,560 11,890 1.9 1.7 12 8 5 4 3 764 0 20 10 60Comoros 880 1,560 0.0 x -0.7 4 46 x 3 8 – 69 12 – 8 x 68 xCongo 2,660 4,720 3.3 0.5 8 54 x 1 6 1 139 1 – 13 x 53 xCook Islands – – – – – – – – – – – – – –
TABLE 7. ECONOMIC INDICATORS

STATISTICAL TABLES 73
TABLE 7. ECONOMIC INDICATORS
Costa Rica 9,550 13,570 0.7 2.7 11 3 7 6 – 33 0 16 12 56Côte d'Ivoire 1,380 2,900 -1.7 -0.4 5 24 x 2 5 2 2,636 11 – 16 x 48 xCroatia 13,330 20,370 – 2.8 x 4 x 0 x 7 4 2 – – – 20 x 42 xCuba 5,890 x 18,520 x 3.9 3.1 x 4 x – 10 13 3 88 – – – –Cyprus 26,390 x 29,570 x 5.9 x 1.7 x 3 x – 3 7 2 – – – – –Czech Republic 18,060 25,530 – 2.6 5 – 6 5 1 – – – – –Democratic People's Republic of Korea a – – – – – – – – 98 – – – –
Democratic Republic of the Congo 400 680 -2.1 -1.9 181 88 x 3 3 1 2,859 11 3 14 x 51 xDenmark 61,110 44,440 2.0 1.2 2 – 10 9 1 – – – – –Djibouti b – – 0.2 3 19 x 6 – 4 147 – 8 17 x 46 xDominica 6,760 9,800 5.2 x 1.9 3 – 4 – – 26 5 7 – –Dominican Republic 5,620 11,150 2.1 3.9 10 2 3 2 1 261 0 10 14 53Ecuador 5,510 10,310 1.7 1.3 4 5 3 4 3 149 0 9 12 54Egypt 3,160 10,850 4.4 2.9 8 2 x 2 4 2 1,807 1 4 22 x 40 xEl Salvador 3,720 7,490 -1.9 2.2 4 9 4 3 1 230 1 11 13 53Equatorial Guinea 14,320 23,240 -2.3 x 19.9 7 – 4 – 4 14 0 – – –Eritrea 490 1,180 e – -1.1 x 14 x – 1 – – 134 4 – – –Estonia 17,370 24,230 – 5.4 x 7 x 1 x 5 5 2 – – – 19 x 43 xEthiopia 470 1,350 – 3.6 8 31 3 5 1 3,261 8 7 20 42Fiji 4,430 7,610 0.6 1.2 4 6 2 4 1 107 3 1 16 50Finland 47,110 38,480 2.9 2.2 2 – 7 7 1 – – – 24 x 37 xFrance 42,250 37,580 2.1 1.1 2 – 9 6 2 – – – – –Gabon 10,650 17,220 0.7 -0.7 6 5 x 2 – 1 73 0 – 16 x 48 xGambia 510 1,620 0.7 0.4 5 34 x 3 4 – 139 16 5 14 x 53 xGeorgia 3,570 7,040 3.1 3.1 56 18 2 2 3 662 4 17 15 48Germany 46,100 44,540 2.3 1.3 1 – 9 5 1 – – – 23 x 37 xGhana 1,760 3,880 -2.0 2.8 25 29 x 3 8 0 1,808 5 4 15 x 49 xGreece 22,530 25,630 1.3 1.7 5 – 6 – 2 – – – 19 x 41 xGrenada 7,460 11,120 4.2 x 2.4 4 – 3 – – 8 1 6 – –Guatemala 3,340 7,130 0.2 1.2 7 14 x 2 3 0 299 1 8 10 x 60 xGuinea 460 1,160 – 0.7 11 43 x 2 2 – 340 7 5 16 x 46 xGuinea-Bissau 520 1,240 0.9 -1.3 15 49 x 1 – 2 79 10 – 19 x 43 xGuyana 3,750 6,550 e -1.3 2.1 11 – 4 3 1 114 4 6 – –Haiti 810 1,710 – -0.6 x 12 x 62 x 1 – – 1,275 16 0 8 x 63 xHoly See – – – – – – – – – – – – – –Honduras 2,180 4,270 0.8 1.6 12 18 4 – 1 572 3 9 8 60Hungary 12,410 x 20,930 x 3.0 2.4 x 10 x 0 x 5 5 1 – – 82 21 x 40 xIceland 43,930 38,870 3.2 1.9 5 – 8 8 0 – – – – –India 1,570 5,350 2.0 5.0 6 33 1 3 2 1,668 0 6 21 43
Countries and areas
GNI per capita (US$) GDP per capita average annual growth rate (%)
Average annual rate of inflation (%)
Population below
international poverty line of
US$1.25 per day (%)
Public spending as a % of GDP (2008-2012*) allocated to:
ODA inflow in millions US$
ODA inflow as a % of
recipient GNI2008–2013*
Debt service as a % of exports of goods and services
Share of household income(%, 2009-2012*)US$ PPP US$
2013 2013 1970–1990 1990-2013 1990-2013 2009-2012* health education military 2012 2012 2012 poorest 40% richest 20%
TAB
LE 7. ECO
NO
MIC
IND
ICATO
RS

74 THE STATE OF THE WORLD’S CHILDREN 2015
Indonesia 3,580 9,260 4.5 2.8 14 16 1 4 1 68 0 16 18 46Iran (Islamic Republic of) 5,780 15,600 -2.5 2.8 20 2 x 3 4 2 149 0 – 17 x 45 xIraq 6,710 15,220 – 2.7 x 12 x 3 x 2 – 3 1,301 1 – 22 x 40 xIreland 39,110 x 35,090 x 2.8 3.8 3 – 6 6 1 – – – 19 x 42 xIsrael 34,120 32,140 1.9 1.9 5 – 5 6 6 – – – 16 x 45 xItaly 34,400 34,100 2.8 0.7 3 – 7 4 2 – – – 19 x 42 xJamaica 5,220 8,480 -1.3 0.4 x 14 x 0 x 3 6 1 21 0 26 14 x 52 xJapan 46,140 37,630 3.4 0.7 -1 – 8 4 1 – – – – –Jordan 4,950 11,660 2.5 x 2.6 4 0 6 – 4 1,417 5 5 20 44Kazakhstan 11,380 20,570 – 4.3 47 0 3 3 1 130 0 24 22 38Kenya 930 2,250 1.2 0.5 9 43 x 2 7 2 2,654 7 4 14 x 53 xKiribati 2,620 2,780 e -5.8 1.2 3 – 9 – – 65 25 – – –Kuwait 44,940 x 88,170 x -6.7 x 0.2 x 6 x – 2 – 3 – – – – –Kyrgyzstan 1,200 3,070 – 1.0 31 5 4 7 3 473 7 6 20 41Lao People's Democratic Republic 1,460 4,570 – 4.8 19 34 x 1 3 0 409 5 8 19 x 45 xLatvia 14,060 x 21,390 x 3.4 4.6 x 16 x 0 3 5 1 – – – 19 42Lebanon 9,870 17,390 e – 2.1 6 – 3 2 4 710 2 11 – –Lesotho 1,550 3,320 3.0 2.6 8 43 x 6 13 2 283 10 2 10 x 56 xLiberia 410 790 -4.1 5.6 28 84 x 5 3 1 571 36 – 17 x 45 xLibya c – – -0.5 x 14 x – 3 – 4 87 – – – –Liechtenstein d – 2.2 2.9 x 1 x – – 2 – – – – – –Lithuania 13,820 x 23,080 x – 3.9 x 19 x 0 x 5 5 1 – – – 18 x 44 xLuxembourg 71,810 x 59,750 x 2.6 2.2 3 – 6 – 1 – – – 21 x 39 xMadagascar 440 1,350 -2.4 -0.4 13 81 2 3 1 379 4 – 14 50Malawi 270 760 -0.1 0.7 25 62 6 5 1 1,175 28 2 16 50Malaysia 10,400 22,460 4.0 3.1 4 0 2 6 2 15 0 3 14 51Maldives 5,600 9,890 – 4.8 x 5 x 2 x 4 6 – 58 3 3 18 x 44 xMali 670 1,540 0.3 2.2 5 50 3 5 2 1,001 10 – 20 41Malta 19,730 x 26,400 x 6.0 2.3 x 3 x – 5 7 1 – – – – –Marshall Islands 4,200 4,620 e – 0.7 2 – 13 – – 76 36 – 5 75Mauritania 1,060 2,850 -1.1 1.3 8 23 x 2 4 3 408 11 – 16 x 47 xMauritius 9,300 17,220 3.2 x 3.5 6 – 2 3 0 178 2 2 – –Mexico 9,940 16,110 1.7 1.2 11 1 3 5 1 418 0 16 14 53Micronesia (Federated States of) 3,430 3,840 e – 0.7 2 31 x 12 – – 115 34 – 7 x 64 xMonaco d – 1.5 1.7 x 2 x – 4 2 – – – – – –Mongolia 3,770 8,810 – 3.9 23 – 4 5 1 449 5 4 18 x 44 xMontenegro 7,260 14,600 – 3.0 x 6 x 0 5 – 2 103 3 13 22 37Morocco 3,030 7,000 2.1 2.6 2 3 x 2 5 3 1,480 2 9 17 x 48 xMozambique 590 1,040 -1.1 x 4.2 15 60 x 3 – 1 2,097 15 2 14 x 51 xMyanmar a – 1.4 7.3 x 24 x – 0 1 – 504 – – – –
TABLE 7. ECONOMIC INDICATORS
Countries and areas
GNI per capita (US$) GDP per capita average annual growth rate (%)
Average annual rate of inflation (%)
Population below
international poverty line of
US$1.25 per day (%)
Public spending as a % of GDP (2008-2012*) allocated to:
ODA inflow in millions US$
ODA inflow as a % of
recipient GNI2008–2013*
Debt service as a % of exports of goods and services
Share of household income(%, 2009-2012*)US$ PPP US$
2013 2013 1970–1990 1990-2013 1990-2013 2009-2012* health education military 2012 2012 2012 poorest 40% richest 20%

STATISTICAL TABLES 75
TABLE 7. ECONOMIC INDICATORS
Namibia 5,840 9,590 -2.1 x 2.2 8 32 x 5 8 4 265 2 – 8 x 69 xNauru – – – – – – – – – – – – – –Nepal 730 2,260 1.2 2.3 7 25 2 5 2 770 4 3 20 41Netherlands 47,440 43,210 1.6 1.7 2 – 10 6 1 – – – – –New Zealand 35,520 x 30,750 x 1.1 1.7 2 – 9 7 1 – – – – –Nicaragua 1,780 4,440 -3.7 2.0 17 12 x 4 5 0 532 5 9 16 x 47 xNiger 410 910 -1.9 -0.1 4 44 x 3 4 1 902 14 – 20 x 43 xNigeria 2,760 5,600 -2.3 3.4 20 68 2 – 1 1,916 0 0 12 54Niue – – – – – – – – – – – – – –Norway 102,610 66,520 3.2 1.7 4 – 9 7 2 – – – 24 x 37 xOman 25,250 x 52,170 x 3.2 2.1 5 – 2 4 9 – – – – –Pakistan 1,380 4,920 2.6 1.9 11 21 x 1 2 3 2,019 1 5 23 x 40 xPalau 10,970 14,540 e – 0.0 x 4 x – 7 – – 15 7 – – –Panama 10,700 19,290 0.2 3.6 3 7 5 3 – 51 0 9 11 56Papua New Guinea 2,010 2,430 e -1.0 0.5 7 – 4 – 1 665 4 7 – –Paraguay 4,040 7,640 3.7 0.6 10 7 3 5 1 104 0 6 11 56Peru 6,390 11,360 -0.6 3.4 9 5 3 3 1 394 0 12 12 53Philippines 3,270 7,820 0.6 2.1 6 18 2 3 1 5 0 6 15 50Poland 12,960 22,300 – 4.3 9 0 5 5 2 – – – 20 41Portugal 20,670 25,350 2.5 1.3 3 – 7 6 2 – – – – –Qatar 85,550 123,860 – 1.1 x 9 x – 2 2 2 – – – – –Republic of Korea 25,920 33,440 7.5 4.4 3 – 4 5 3 – – – – –Republic of Moldova 2,460 5,190 1.8 x 0.5 34 0 5 8 0 473 6 11 20 41Romania 9,060 18,060 0.9 x 3.2 39 0 4 3 1 – – 26 23 36Russian Federation 13,860 23,200 – 2.5 46 0 3 4 3 – – – 16 47Rwanda 620 1,430 1.1 2.7 9 63 6 5 1 879 12 2 13 57Saint Kitts and Nevis 13,460 20,400 6.5 x 1.8 5 – 2 – – 22 3 – – –Saint Lucia 7,090 10,350 5.1 x 1.3 3 – 5 4 – 27 2 6 – –Saint Vincent and the Grenadines 6,580 10,610 3.3 3.1 3 – 4 5 – 9 1 15 – –Samoa 3,430 4,840 e – 2.5 5 – 4 6 – 121 19 3 – –San Marino d – 1.7 3.3 x 3 x – 6 – – – – – – –Sao Tome and Principe 1,470 2,950 – 2.5 x 14 x 28 x 3 9 – 49 19 5 14 x 56 xSaudi Arabia 26,200 53,780 -1.4 1.4 5 – 2 5 7 – – – – –Senegal 1,070 2,240 -0.6 1.1 3 30 3 6 2 1,080 8 – 16 47Serbia 5,730 12,020 – 1.6 20 x 0 6 5 2 1,090 3 30 21 38Seychelles 12,530 23,270 3.5 2.0 6 0 x 3 4 1 35 4 2 10 x 70 xSierra Leone 680 1,750 -0.7 1.3 18 52 2 3 0 443 13 1 20 44Singapore 54,040 76,850 5.9 3.5 1 – 2 3 3 – – – – –Slovakia 17,200 x 24,930 x – 3.7 x 6 x 0 6 4 1 – – – 24 36Slovenia 22,830 x 27,680 x – 3.0 x 11 x 0 x 7 6 1 – – – 21 x 39 x
Countries and areas
GNI per capita (US$) GDP per capita average annual growth rate (%)
Average annual rate of inflation (%)
Population below
international poverty line of
US$1.25 per day (%)
Public spending as a % of GDP (2008-2012*) allocated to:
ODA inflow in millions US$
ODA inflow as a % of
recipient GNI2008–2013*
Debt service as a % of exports of goods and services
Share of household income(%, 2009-2012*)US$ PPP US$
2013 2013 1970–1990 1990-2013 1990-2013 2009-2012* health education military 2012 2012 2012 poorest 40% richest 20%
TAB
LE 7. ECO
NO
MIC
IND
ICATO
RS
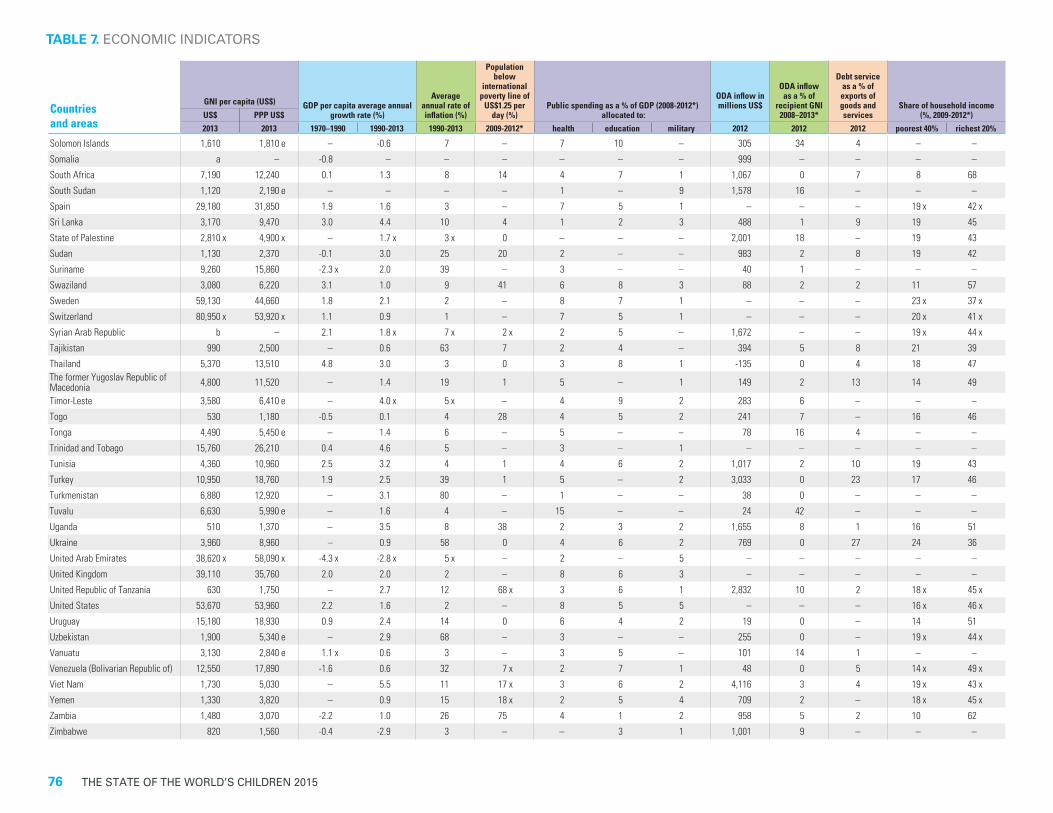
76 THE STATE OF THE WORLD’S CHILDREN 2015
TABLE 7. ECONOMIC INDICATORS
Solomon Islands 1,610 1,810 e – -0.6 7 – 7 10 – 305 34 4 – –Somalia a – -0.8 – – – – – – 999 – – – –South Africa 7,190 12,240 0.1 1.3 8 14 4 7 1 1,067 0 7 8 68South Sudan 1,120 2,190 e – – – – 1 – 9 1,578 16 – – –Spain 29,180 31,850 1.9 1.6 3 – 7 5 1 – – – 19 x 42 xSri Lanka 3,170 9,470 3.0 4.4 10 4 1 2 3 488 1 9 19 45State of Palestine 2,810 x 4,900 x – 1.7 x 3 x 0 – – – 2,001 18 – 19 43Sudan 1,130 2,370 -0.1 3.0 25 20 2 – – 983 2 8 19 42Suriname 9,260 15,860 -2.3 x 2.0 39 – 3 – – 40 1 – – –Swaziland 3,080 6,220 3.1 1.0 9 41 6 8 3 88 2 2 11 57Sweden 59,130 44,660 1.8 2.1 2 – 8 7 1 – – – 23 x 37 xSwitzerland 80,950 x 53,920 x 1.1 0.9 1 – 7 5 1 – – – 20 x 41 xSyrian Arab Republic b – 2.1 1.8 x 7 x 2 x 2 5 – 1,672 – – 19 x 44 xTajikistan 990 2,500 – 0.6 63 7 2 4 – 394 5 8 21 39Thailand 5,370 13,510 4.8 3.0 3 0 3 8 1 -135 0 4 18 47The former Yugoslav Republic of Macedonia 4,800 11,520 – 1.4 19 1 5 – 1 149 2 13 14 49
Timor-Leste 3,580 6,410 e – 4.0 x 5 x – 4 9 2 283 6 – – –Togo 530 1,180 -0.5 0.1 4 28 4 5 2 241 7 – 16 46Tonga 4,490 5,450 e – 1.4 6 – 5 – – 78 16 4 – –Trinidad and Tobago 15,760 26,210 0.4 4.6 5 – 3 – 1 – – – – –Tunisia 4,360 10,960 2.5 3.2 4 1 4 6 2 1,017 2 10 19 43Turkey 10,950 18,760 1.9 2.5 39 1 5 – 2 3,033 0 23 17 46Turkmenistan 6,880 12,920 – 3.1 80 – 1 – – 38 0 – – –Tuvalu 6,630 5,990 e – 1.6 4 – 15 – – 24 42 – – –Uganda 510 1,370 – 3.5 8 38 2 3 2 1,655 8 1 16 51Ukraine 3,960 8,960 – 0.9 58 0 4 6 2 769 0 27 24 36United Arab Emirates 38,620 x 58,090 x -4.3 x -2.8 x 5 x – 2 – 5 – – – – –United Kingdom 39,110 35,760 2.0 2.0 2 – 8 6 3 – – – – –United Republic of Tanzania 630 1,750 – 2.7 12 68 x 3 6 1 2,832 10 2 18 x 45 xUnited States 53,670 53,960 2.2 1.6 2 – 8 5 5 – – – 16 x 46 xUruguay 15,180 18,930 0.9 2.4 14 0 6 4 2 19 0 – 14 51Uzbekistan 1,900 5,340 e – 2.9 68 – 3 – – 255 0 – 19 x 44 xVanuatu 3,130 2,840 e 1.1 x 0.6 3 – 3 5 – 101 14 1 – –Venezuela (Bolivarian Republic of) 12,550 17,890 -1.6 0.6 32 7 x 2 7 1 48 0 5 14 x 49 xViet Nam 1,730 5,030 – 5.5 11 17 x 3 6 2 4,116 3 4 19 x 43 xYemen 1,330 3,820 – 0.9 15 18 x 2 5 4 709 2 – 18 x 45 xZambia 1,480 3,070 -2.2 1.0 26 75 4 1 2 958 5 2 10 62Zimbabwe 820 1,560 -0.4 -2.9 3 – – 3 1 1,001 9 – – –
Countries and areas
GNI per capita (US$) GDP per capita average annual growth rate (%)
Average annual rate of inflation (%)
Population below
international poverty line of
US$1.25 per day (%)
Public spending as a % of GDP (2008-2012*) allocated to:
ODA inflow in millions US$
ODA inflow as a % of
recipient GNI2008–2013*
Debt service as a % of exports of goods and services
Share of household income(%, 2009-2012*)US$ PPP US$
2013 2013 1970–1990 1990-2013 1990-2013 2009-2012* health education military 2012 2012 2012 poorest 40% richest 20%

STATISTICAL TABLES 77
TABLE 7. ECONOMIC INDICATORS
SUMMARY
Sub-Saharan Africa 1,665 3,280 -0.1 2.5 36 47 3 5 2 41,470 3 4 15 51 Eastern and Southern Africa 1,719 3,260 0.3 2.1 36 39 3 6 2 22,425 3 5 15 52 West and Central Africa 1,657 3,377 -0.8 2.9 23 61 – – – 17,916 2 1 14 52Middle East and North Africa 6,254 14,777 0.0 2.1 9 – 2 4 4 13,625 1 6 – –South Asia 1,478 5,007 2.0 4.6 7 33 1 3 3 14,040 1 5 21 43East Asia and Pacific 6,343 11,795 5.9 7.7 5 12 3 ** 5 ** 2 ** 8,098 0 3 16 47Latin America and Caribbean 9,445 13,761 1.4 1.8 24 4 4 6 1 7,783 0 14 12 56CEE/CIS 9,395 16,888 – 2.7 46 1 4 4 3 9,196 1 21 19 43Least developed countries 848 2,046 -0.2 3.2 46 40 2 4 2 42,986 6 4 19 45World 10,449 14,012 2.4 2.8 8 21 7 ** 5 ** 3 ** 93,083 0 9 17 47
DEFINITIONS OF THE INDICATORS
GNI per capita – Gross national income (GNI) is the sum of value added by all resident producers plus any product taxes (less subsidies) not included in the valuation of output plus net receipts of primary income (compensation of employees and property income) from abroad. Gross national income per capita is GNI divided by midyear population. GNI per capita in US dollars is converted using the World Bank Atlas method.GNI per capita (PPP US$) – GNI per capita converted to international dollars taking into account differences in price levels (purchasing power) between countries. Based on data from the International Comparison Programme.GDP per capita – Gross domestic product (GDP) is the sum of value added by all resident producers plus any product taxes (less subsidies) not included in the valuation of output. Gross domestic product per capita is GDP divided by midyear population. Growth is calculated from constant price GDP data in local currency.Population below international poverty line of US$1.25 per day – Percentage of the population living on less than US$1.25 per day at 2005 prices, adjusted for purchasing power parity. The new poverty threshold reflects revisions to purchasing power parity exchange rates based on the results of the 2005 International Comparison Programme. The revisions reveal that the cost of living is higher across the developing world than previously estimated. As a result of these revisions, poverty rates for individual countries cannot be compared with poverty rates reported in previous editions. More detailed information on the definition, methodology and sources of the data presented is available at <www.worldbank.org>.ODA – Net official development assistance.Debt service – Sum of interest payments and repayments of principal on external public and publicly guaranteed long-term debts.Share of household income – Percentage of income received by the 20 per cent of households with the highest income and by the 40 per cent of households with the lowest income.
MAIN DATA SOURCES
NOTES
GNI per capita – The World Bank.GDP per capita – The World Bank.Rate of inflation – The World Bank.Population below international poverty line of US$1.25 per day – The World Bank.Spending on health, education and military – The World Bank.ODA – Organisation for Economic Co-operation and Development.Debt service – The World Bank.Share of household income – The World Bank.
a low-income country (GNI per capita is $1,045 or less).b lower-middle-income country (GNI per capita is $1,046 to $4,125).c upper-middle-income country (GNI per capita is $4,126 to $12,745).d high-income country (GNI per capita is $12,746 or more).– Data not available.x Data refer to years or periods other than those specified in the column heading. Such data are not included in the calcula-
tion of regional and global averages.e Estimate is based on regression; other PPP figures are extrapolated from the 2011 International Comparison Programme
benchmark estimates. * Data refer to the most recent year available during the period specified in the column heading.** Excludes China.
TAB
LE 7. ECO
NO
MIC
IND
ICATO
RS
For a complete list of countries and areas in the regions, subregions and country categories, see page 32 or visit http://data.unicef.org/index.php?section=regional-classifications.It is not advisable to compare data from consecutive editions of The State of the World’s Children.
Countries and areas
GNI per capita (US$) GDP per capita average annual growth rate (%)
Average annual rate of inflation (%)
Population below
international poverty line of
US$1.25 per day (%)
Public spending as a % of GDP (2008-2012*) allocated to:
ODA inflow in millions US$
ODA inflow as a % of
recipient GNI2008–2013*
Debt service as a % of exports of goods and services
Share of household income(%, 2009-2012*)US$ PPP US$
2013 2013 1970–1990 1990-2013 1990-2013 2009-2012* health education military 2012 2012 2012 poorest 40% richest 20%

78 THE STATE OF THE WORLD’S CHILDREN 2015
Countries and areas
Life expectancy:
females as a % of males
Adult literacy rate: females
as a % of males
Enrolment ratios: females as a % of males
Survival rate to the last grade of primary: females as a % of males
Contraceptive prevalence (%)
Antenatal care (%) Delivery care (%) Maternal mortality ratio†
At least one visit
At least four visits
Skilled attendant at birth
Institutional delivery C-section 2009-2013* 2013
Primary GER
Secondary GER
2013 2009-2013* 2009-2013* 2009-2013* 2009-2013* 2009-2013* 2009-2013* Reported AdjustedLifetime risk of
maternal death (1 in:)Afghanistan 104 39 72 55 – 21 48 15 39 33 4 330 400 49
Albania 108 98 – 95 x 101 69 97 67 99 97 19 6 21 2,800
Algeria 105 79 x 94 104 104 56 93 68 97 97 16 – 89 380
Andorra – – – – – – – – – – – – – –
Angola 106 72 64 65 73 – 80 x – 47 x 46 x – – 460 35
Antigua and Barbuda 107 101 93 115 – – 100 x – 100 – – 0 x – –
Argentina 110 100 99 111 104 78 x 98 90 98 99 28 x 35 69 630
Armenia 109 100 114 121 99 55 99 93 100 99 13 19 29 1,800
Australia 106 – 100 95 – 72 x 98 x 92 x – 99 x 31 x – 6 9,000
Austria 106 – 100 96 101 70 – – – – 24 x – 4 19,200
Azerbaijan 109 100 98 99 101 51 x 77 x 45 x 99 78 x 5 x 15 26 1,800
Bahamas 108 – 102 105 96 45 x 98 x – 99 – – 40 37 1,400
Bahrain 102 95 – 102 97 – 100 x – 100 – – – 22 2,000
Bangladesh 102 88 106 114 114 62 53 25 34 33 21 210 170 250
Barbados 107 – 99 112 – – 100 x – 100 – – 60 52 1,100
Belarus 118 100 100 96 101 63 100 100 100 100 25 1 1 45,200
Belgium 107 – 99 97 102 70 – – – – 18 x – 6 8,700
Belize 109 – 97 105 95 55 96 83 96 94 28 42 45 750
Benin 105 45 x 89 61 96 13 84 58 81 87 5 400 x 340 59
Bhutan 101 59 x 102 106 108 66 97 77 65 63 12 150 120 340
Bolivia (Plurinational State of) 107 95 98 100 100 61 x 86 x 72 x 84 71 19 x 310 x 200 140
Bosnia and Herzegovina 107 97 – – 99 46 87 84 100 100 14 6 8 9,700
Botswana 97 101 97 106 x 104 x 53 x 94 x 73 x 95 x 99 – 160 170 200
Brazil 110 101 – – – 81 x 98 90 98 98 54 65 69 780
Brunei Darussalam 105 96 98 101 97 – 99 – 100 100 – – 27 1,900
Bulgaria 110 99 99 96 99 69 x – – 100 93 31 3 5 12,400
Burkina Faso 102 59 x 95 81 111 16 94 34 66 66 2 340 400 44
Burundi 107 95 x 99 73 117 22 99 33 60 60 4 500 740 22
Cabo Verde 111 89 91 119 99 61 x 98 x 72 x 78 x 76 11 x 10 53 740
Cambodia 108 80 95 85 x 108 51 89 59 72 61 4 210 170 180
Cameroon 104 83 88 86 102 23 85 62 64 61 4 780 590 34
Canada 105 – 101 98 – 74 x 100 x 99 x 100 x 99 x 26 x – 11 5,200
Central African Republic 108 48 74 51 96 15 68 38 54 53 5 540 x 880 27
Chad 103 59 76 46 85 5 53 23 23 16 2 1,100 x 980 15
Chile 107 100 97 104 101 58 x – – 100 100 50 17 22 2,400
China 103 95 100 102 – 85 x 95 – 100 99 36 25 32 1,800
Colombia 110 100 97 109 105 79 97 89 99 99 46 71 83 500
Comoros 105 88 91 96 – 19 92 49 82 76 10 170 350 58
Congo 105 84 107 87 – 45 93 79 93 92 6 430 410 48
Cook Islands – – 101 100 – 31 100 x – 100 x 100 – 0 – –
TABLE 8. WOMEN

STATISTICAL TABLES 79
TABLE 8. WOMEN
Costa Rica 106 100 99 105 103 76 98 90 98 98 26 23 38 1,400
Côte d'Ivoire 103 59 85 – 94 18 91 44 59 57 3 610 720 29
Croatia 109 99 100 104 101 – – – 100 – 19 7 13 5,200
Cuba 105 100 99 100 102 74 100 100 100 100 – 39 80 970
Cyprus 105 99 100 102 – – 99 x – – 100 x – – 10 6,600
Czech Republic 108 – 101 100 100 86 x – – 100 – 20 x 2 5 12,100Democratic People's Republic of Korea 111 100 x – – – 71 100 94 100 95 13 77 x 87 630
Democratic Republic of the Congo 107 60 x 88 59 88 17 89 45 80 75 7 550 x 730 23
Denmark 106 – 99 101 101 – – – – – 21 x – 5 12,000
Djibouti 105 – 90 77 88 19 88 23 87 87 11 380 230 130
Dominica – – 97 107 95 – 100 x – 100 – – 110 – –
Dominican Republic 109 100 91 112 109 72 99 95 x 99 99 42 x 110 100 360
Ecuador 108 98 100 102 104 73 x 84 x 58 x 91 92 26 x 70 87 420
Egypt 107 81 96 98 101 60 x 74 x 66 x 79 x 72 x 28 x 50 45 710
El Salvador 114 94 96 100 104 73 x 94 x 78 x 100 84 30 42 69 600
Equatorial Guinea 106 94 98 – 100 13 91 67 68 67 7 310 290 72
Eritrea 108 76 84 80 94 8 89 57 34 34 3 490 380 52
Estonia 115 100 101 99 99 63 x – – 100 x – – 14 11 5,700
Ethiopia 105 59 x – – 116 29 43 19 10 10 2 680 420 52
Fiji 109 – 101 111 103 44 100 x 94 100 99 – 59 59 620
Finland 108 – 99 105 101 – 100 x – – 100 16 x – 4 15,100
France 109 – 100 101 – 76 x 100 x – – – 21 x – 12 4,300
Gabon 103 94 97 – – 31 95 78 89 90 10 320 240 94
Gambia 105 70 104 95 98 13 98 72 57 56 3 730 x 430 39
Georgia 110 100 101 – 92 53 98 84 100 100 37 23 41 1,300
Germany 106 – 100 95 – 66 x 100 x – – – 29 x – 7 11,000
Ghana 103 83 94 90 91 x 34 96 87 68 67 11 450 x 380 66
Greece 106 98 100 97 101 76 x – – – – – – 5 12,000
Grenada 107 – 97 103 – 54 x 100 x – 99 – – 60 23 1,800
Guatemala 110 85 97 91 99 54 93 – 52 51 16 110 140 170
Guinea 103 33 84 – 86 6 85 57 45 40 2 720 650 30
Guinea-Bissau 106 63 93 – – 14 93 68 43 41 2 410 x 560 36
Guyana 108 106 113 115 105 43 92 79 92 89 13 86 x 250 150
Haiti 106 84 x – – – 35 90 67 37 36 6 630 x 380 80
Holy See – – – – – – – – – – – – – –
Honduras 107 99 100 122 110 73 97 89 83 83 19 73 120 260
Hungary 111 100 99 98 100 – – – 99 – 31 x 10 14 5,000
Iceland 104 – 101 101 100 – – – – – 17 x – 4 11,500
India 105 68 x 102 94 – 55 x 74 x 37 x 52 x 47 x 9 x 180 190 190
TAB
LE 8. WO
MEN
Countries and areas
Life expectancy:
females as a % of males
Adult literacy rate: females
as a % of males
Enrolment ratios: females as a % of males
Survival rate to the last grade of primary: females as a % of males
Contraceptive prevalence (%)
Antenatal care (%) Delivery care (%) Maternal mortality ratio†
At least one visit
At least four visits
Skilled attendant at birth
Institutional delivery C-section 2009-2013* 2013
Primary GER
Secondary GER
2013 2009-2013* 2009-2013* 2009-2013* 2009-2013* 2009-2013* 2009-2013* Reported AdjustedLifetime risk of
maternal death (1 in:)

80 THE STATE OF THE WORLD’S CHILDREN 2015
Indonesia 106 94 100 103 – 62 96 88 83 63 12 360 190 220
Iran (Islamic Republic of) 105 89 99 94 101 77 97 94 x 96 95 46 25 x 23 2,000
Iraq 111 84 – – – 53 78 50 91 77 22 35 67 340
Ireland 105 – 100 102 – 65 x 100 x – 100 x 100 x 25 x – 9 5,500
Israel 105 98 100 102 99 – – – – – – – 2 17,400
Italy 107 100 99 99 99 – 99 x 68 x – 99 x 40 x – 4 17,100
Jamaica 107 112 – 106 103 72 x 98 86 99 99 21 81 80 540
Japan 109 – 100 100 100 54 x – – – 100 x – – 6 12,100
Jordan 105 99 98 103 102 61 99 95 100 99 28 19 50 580
Kazakhstan 119 100 101 97 100 51 99 87 100 100 16 14 26 1,500
Kenya 106 86 x 98 90 – 46 92 47 44 43 6 490 x 400 53
Kiribati 109 – 104 111 x – 22 88 71 80 66 10 33 130 260
Kuwait 103 99 – – 102 – 100 x – 100 x – – – 14 2,600
Kyrgyzstan 113 99 98 100 101 36 97 84 99 99 6 49 75 390
Lao People's Democratic Republic 104 77 x 95 87 103 50 54 37 42 38 4 360 220 130
Latvia 116 100 99 97 99 – 92 x – 100 x – – 20 13 4,600
Lebanon 105 92 x 91 101 106 54 96 x – 98 x – – – 16 3,900
Lesotho 101 130 97 140 139 47 92 70 62 59 7 1,200 490 64
Liberia 103 44 x 92 82 85 x 11 x 79 x 66 x 46 x 37 x 4 x 990 x 640 31
Libya 105 87 – – – 42 x 93 x – 100 x – – – 15 2,700
Liechtenstein – – 101 83 – – – – – – – – – –
Lithuania 118 100 99 96 100 63 x 100 x – 100 x – – 6 11 5,900
Luxembourg 106 – 102 103 – – – – 100 x 100 x 29 x – 11 5,300
Madagascar 105 91 99 95 106 40 82 51 44 38 2 480 440 47
Malawi 100 71 104 90 94 46 95 46 71 73 5 680 510 34
Malaysia 106 95 – 97 101 49 x 97 – 99 99 – 26 29 1,600
Maldives 103 100 x 97 – – 35 99 85 99 95 32 140 x 31 1,200
Mali 100 57 88 72 94 10 75 35 56 56 4 460 x 550 26
Malta 106 103 x 100 104 101 – 100 x – – 100 x – – 9 8,300
Marshall Islands – – 99 103 91 x 45 x 81 x 77 x 99 85 x 9 x 110 – –
Mauritania 105 62 x 105 85 102 x 11 84 48 65 65 10 630 320 66
Mauritius 110 94 99 104 100 76 x – – 98 x 98 x – 22 x 73 900
Mexico 106 98 100 108 102 73 98 93 96 94 46 42 49 900
Micronesia (Federated States of) 103 – – – – 55 80 x – 100 87 x 11 x 160 96 320
Monaco – – – – – – – – – – – – – –
Mongolia 112 100 97 103 101 55 99 81 99 99 21 51 68 560
Montenegro 106 98 101 101 102 39 x 97 x – 100 100 – 13 x 7 8,900
Morocco 105 76 95 86 99 67 77 55 74 73 16 110 120 300
Mozambique 103 54 91 89 93 12 91 51 54 55 4 410 480 41
Myanmar 107 95 99 105 107 46 83 73 x 71 36 – 320 x 200 250
TABLE 8. WOMEN
Countries and areas
Life expectancy:
females as a % of males
Adult literacy rate: females
as a % of males
Enrolment ratios: females as a % of males
Survival rate to the last grade of primary: females as a % of males
Contraceptive prevalence (%)
Antenatal care (%) Delivery care (%) Maternal mortality ratio†
At least one visit
At least four visits
Skilled attendant at birth
Institutional delivery C-section 2009-2013* 2013
Primary GER
Secondary GER
2013 2009-2013* 2009-2013* 2009-2013* 2009-2013* 2009-2013* 2009-2013* Reported AdjustedLifetime risk of
maternal death (1 in:)
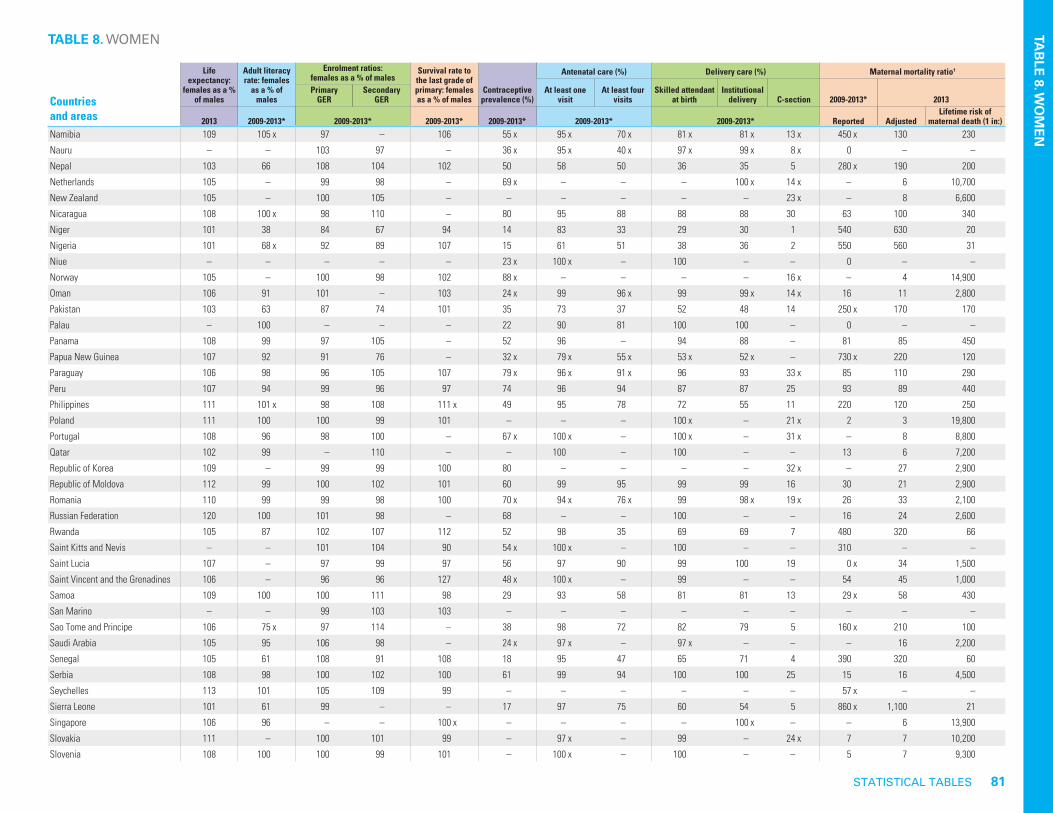
STATISTICAL TABLES 81
TABLE 8. WOMEN
Namibia 109 105 x 97 – 106 55 x 95 x 70 x 81 x 81 x 13 x 450 x 130 230
Nauru – – 103 97 – 36 x 95 x 40 x 97 x 99 x 8 x 0 – –
Nepal 103 66 108 104 102 50 58 50 36 35 5 280 x 190 200
Netherlands 105 – 99 98 – 69 x – – – 100 x 14 x – 6 10,700
New Zealand 105 – 100 105 – – – – – – 23 x – 8 6,600
Nicaragua 108 100 x 98 110 – 80 95 88 88 88 30 63 100 340
Niger 101 38 84 67 94 14 83 33 29 30 1 540 630 20
Nigeria 101 68 x 92 89 107 15 61 51 38 36 2 550 560 31
Niue – – – – – 23 x 100 x – 100 – – 0 – –
Norway 105 – 100 98 102 88 x – – – – 16 x – 4 14,900
Oman 106 91 101 – 103 24 x 99 96 x 99 99 x 14 x 16 11 2,800
Pakistan 103 63 87 74 101 35 73 37 52 48 14 250 x 170 170
Palau – 100 – – – 22 90 81 100 100 – 0 – –
Panama 108 99 97 105 – 52 96 – 94 88 – 81 85 450
Papua New Guinea 107 92 91 76 – 32 x 79 x 55 x 53 x 52 x – 730 x 220 120
Paraguay 106 98 96 105 107 79 x 96 x 91 x 96 93 33 x 85 110 290
Peru 107 94 99 96 97 74 96 94 87 87 25 93 89 440
Philippines 111 101 x 98 108 111 x 49 95 78 72 55 11 220 120 250
Poland 111 100 100 99 101 – – – 100 x – 21 x 2 3 19,800
Portugal 108 96 98 100 – 67 x 100 x – 100 x – 31 x – 8 8,800
Qatar 102 99 – 110 – – 100 – 100 – – 13 6 7,200
Republic of Korea 109 – 99 99 100 80 – – – – 32 x – 27 2,900
Republic of Moldova 112 99 100 102 101 60 99 95 99 99 16 30 21 2,900
Romania 110 99 99 98 100 70 x 94 x 76 x 99 98 x 19 x 26 33 2,100
Russian Federation 120 100 101 98 – 68 – – 100 – – 16 24 2,600
Rwanda 105 87 102 107 112 52 98 35 69 69 7 480 320 66
Saint Kitts and Nevis – – 101 104 90 54 x 100 x – 100 – – 310 – –
Saint Lucia 107 – 97 99 97 56 97 90 99 100 19 0 x 34 1,500
Saint Vincent and the Grenadines 106 – 96 96 127 48 x 100 x – 99 – – 54 45 1,000
Samoa 109 100 100 111 98 29 93 58 81 81 13 29 x 58 430
San Marino – – 99 103 103 – – – – – – – – –
Sao Tome and Principe 106 75 x 97 114 – 38 98 72 82 79 5 160 x 210 100
Saudi Arabia 105 95 106 98 – 24 x 97 x – 97 x – – – 16 2,200
Senegal 105 61 108 91 108 18 95 47 65 71 4 390 320 60
Serbia 108 98 100 102 100 61 99 94 100 100 25 15 16 4,500
Seychelles 113 101 105 109 99 – – – – – – 57 x – –
Sierra Leone 101 61 99 – – 17 97 75 60 54 5 860 x 1,100 21
Singapore 106 96 – – 100 x – – – – 100 x – – 6 13,900
Slovakia 111 – 100 101 99 – 97 x – 99 – 24 x 7 7 10,200
Slovenia 108 100 100 99 101 – 100 x – 100 – – 5 7 9,300
TAB
LE 8. WO
MEN
Countries and areas
Life expectancy:
females as a % of males
Adult literacy rate: females
as a % of males
Enrolment ratios: females as a % of males
Survival rate to the last grade of primary: females as a % of males
Contraceptive prevalence (%)
Antenatal care (%) Delivery care (%) Maternal mortality ratio†
At least one visit
At least four visits
Skilled attendant at birth
Institutional delivery C-section 2009-2013* 2013
Primary GER
Secondary GER
2013 2009-2013* 2009-2013* 2009-2013* 2009-2013* 2009-2013* 2009-2013* Reported AdjustedLifetime risk of
maternal death (1 in:)

82 THE STATE OF THE WORLD’S CHILDREN 2015
TABLE 8. WOMEN
Solomon Islands 104 – 98 94 108 35 x 74 x 65 x 86 x 85 x 6 x 150 130 180
Somalia 106 – – – – 15 x 26 x 6 x 33 x 9 x – 1,000 x 850 18
South Africa 107 97 95 103 – 60 x 97 x 87 x 91 x 89 x 21 x 400 x 140 300
South Sudan 104 – 66 – – 4 40 17 19 12 1 2,100 x 730 28
Spain 108 99 99 101 99 66 x – – – – 26 x – 4 15,100
Sri Lanka 109 97 100 106 107 68 x 99 x 93 x 99 x 98 x 24 x 31 29 1,400
State of Palestine 105 95 99 110 99 53 98 94 99 98 17 – 47 500
Sudan 106 80 89 92 92 9 74 47 23 21 7 220 360 60
Suriname 109 99 96 131 122 x 48 91 67 91 92 19 83 130 330
Swaziland 97 98 90 97 – 65 97 77 82 80 12 590 x 310 94
Sweden 105 – 100 98 100 – 100 x – – – – – 4 13,600
Switzerland 106 – 100 97 – – – – – – 30 x – 6 12,300
Syrian Arab Republic 108 87 97 100 101 54 88 64 96 78 26 65 x 49 630
Tajikistan 110 100 98 90 102 28 79 53 87 77 4 33 44 530
Thailand 109 100 97 106 – 79 98 93 100 100 32 12 x 26 2,900The former Yugoslav Republic of Macedonia 106 98 100 99 – 40 99 94 98 98 25 4 7 10,200
Timor-Leste 105 83 95 102 104 22 84 55 29 22 2 570 270 66
Togo 103 65 92 – 92 15 72 55 59 67 9 – 450 46
Tonga 108 100 x 99 97 – 34 98 70 98 98 17 36 120 220
Trinidad and Tobago 111 99 97 – 106 43 x 96 x – 100 97 x – – 84 640
Tunisia 106 82 98 105 101 63 98 85 99 99 27 – 46 1,000
Turkey 110 93 99 95 98 73 x 92 x 74 x 91 x 90 x 37 x 29 x 20 2,300
Turkmenistan 114 100 – – – 62 x 98 x 83 x 97 x 95 x 3 x 7 61 640
Tuvalu – – – – – 31 x 97 x 67 x 98 x 93 x 7 x 0 – –
Uganda 104 78 102 83 97 30 93 48 57 57 5 440 360 44
Ukraine 118 100 102 98 101 65 99 87 99 99 12 16 x 23 2,900
United Arab Emirates 103 102 x 97 – 100 – 100 x – 100 x 100 – 0 x 8 5,800
United Kingdom 105 – 100 100 – 84 – – – – 26 x – 8 6,900
United Republic of Tanzania 105 81 103 88 113 34 88 43 49 50 5 450 410 44
United States 106 – 98 100 – 76 – – – – 31 x 13 x 28 1,800
Uruguay 109 101 97 114 103 78 x 96 x 90 x 100 – 34 x 10 14 3,500
Uzbekistan 110 100 97 98 101 65 x 99 x – 100 x 97 x – 22 36 1,100
Vanuatu 106 96 99 100 94 x 49 76 52 89 89 12 86 x 86 320
Venezuela (Bolivarian Republic of) 108 100 98 109 109 – 94 x – 96 95 x – 72 110 360
Viet Nam 113 95 101 – – 78 94 60 93 92 20 67 49 1,100
Yemen 104 61 83 65 – 28 x 47 x 14 x 36 x 24 x 9 x 370 x 270 88
Zambia 106 72 x 99 – 95 x 41 x 94 x 60 x 47 x 48 x 3 x 480 280 59
Zimbabwe 103 91 – – – 59 90 65 66 65 5 530 470 53
Countries and areas
Life expectancy:
females as a % of males
Adult literacy rate: females
as a % of males
Enrolment ratios: females as a % of males
Survival rate to the last grade of primary: females as a % of males
Contraceptive prevalence (%)
Antenatal care (%) Delivery care (%) Maternal mortality ratio†
At least one visit
At least four visits
Skilled attendant at birth
Institutional delivery C-section 2009-2013* 2013
Primary GER
Secondary GER
2013 2009-2013* 2009-2013* 2009-2013* 2009-2013* 2009-2013* 2009-2013* Reported AdjustedLifetime risk of
maternal death (1 in:)

STATISTICAL TABLES 83
TABLE 8. WOMEN
SUMMARY
Sub-Saharan Africa 104 75 92 84 100 23 76 45 47 46 4 – 510 38
Eastern and Southern Africa 105 81 94 91 105 33 77 39 42 41 4 – 420 49
West and Central Africa 103 66 90 77 98 17 76 50 53 51 4 – 590 30
Middle East and North Africa 106 83 94 95 98 58 86 59 79 75 23 – 110 300
South Asia 105 69 100 93 106 53 71 35 50 45 10 – 190 190
East Asia and Pacific 105 95 99 101 102 64 ** 94 80 ** 93 87 28 – 74 720
Latin America and Caribbean 109 99 97 107 105 75 97 90 93 91 43 – 85 510
CEE/CIS 115 99 100 97 101 63 – – 99 – – – 27 1,900
Least developed countries 104 76 93 87 102 35 74 38 47 44 6 – 440 51
World 106 91 97 97 103 55 ** 82 51 ** 68 63 16 – 210 190
DEFINITIONS OF THE INDICATORS
Life expectancy – Number of years newborn children would live if subject to the mortality risks prevailing for the cross section of population at the time of their birth.Adult literacy rate – Percentage of the population aged 15 years and over who can both read and write with understanding a short, simple statement on his/her everyday life.Primary gross enrolment ratio (GER) – Total enrolment in primary school, regardless of age, expressed as a percentage of the official primary-school-aged population.Secondary gross enrolment ratio (GER) – Total enrolment in secondary school, regardless of age, expressed as a percentage of the official secondary-school-aged population.Survival rate to last grade of primary – Percentage of children entering the first grade of primary school who eventually reach the last grade (administrative data).Contraceptive prevalence – Percentage of women (aged 15–49) in union currently using any contraceptive method.Antenatal care – Percentage of women (aged 15–49) attended at least once during pregnancy by skilled health personnel (doctor, nurse or midwife) and the percentage attended by any provider at least four times.Skilled attendant at birth – Percentage of births attended by skilled heath personnel (doctor, nurse or midwife).Institutional delivery – Percentage of women (aged 15–49) who gave birth in a health facility.C-section – Percentage of births delivered by Caesarean section. NB: C-section rates between 5 per cent and 15 per cent expected with adequate levels of emergency obstetric care.Maternal mortality ratio – Number of deaths of women from pregnancy-related causes per 100,000 live births during the same time period. The ‘reported’ column shows country-reported figures that are not adjusted for under-reporting and misclassification. For the ‘adjusted’ column, see note below (†). Maternal mortality ratio values have been rounded according to the following scheme: <100, no rounding; 100–999, rounded to nearest 10; and >1,000, rounded to nearest 100.Lifetime risk of maternal death – Lifetime risk of maternal death takes into account both the probability of becoming pregnant and the probability of dying as a result of that pregnancy, accumulated across a woman’s reproductive years. Lifetime risk values have been rounded according to the following scheme: <100, no rounding; 100–999, rounded to nearest 10; and >1,000, rounded to nearest 100.
MAIN DATA SOURCES
NOTES
Life expectancy – United Nations Population Division.Adult literacy rate – UNESCO Institute for Statistics (UIS).Primary and secondary school enrolment – UIS.Survival rate to last grade of primary – UIS.Contraceptive prevalence – DHS, MICS and other nationally representative sources; United Nations Population Division.Antenatal care – DHS, MICS and other nationally representative sources.Skilled attendant at birth – DHS, MICS and other nationally representative sources.Institutional delivery – DHS, MICS and other nationally representative sources.C-section – DHS, MICS and other nationally representative sources.Maternal mortality ratio (reported) – Nationally representative sources, including household surveys and vital registration.Maternal mortality ratio (adjusted) – United Nations Maternal Mortality Estimation Inter-agency Group (WHO, UNICEF, UNFPA, The World Bank and the United Nations Population Division).Lifetime risk of maternal death – United Nations Maternal Mortality Estimation Inter-agency Group (WHO, UNICEF, UNFPA, The World Bank and the United Nations Population Division).
− Data not available.x Data refer to years or periods other than those specified in the column heading. Such data are not included in the calcula-
tion of regional and global averages, with the exception of 2005-2006 and 2007-2008 data from India, and 2006 data from Brazil. Estimates from data years prior to 2000 are not displayed.
* Data refer to the most recent year available during the period specified in the column heading.** Excludes China.† The maternal mortality data in the column headed ‘reported’ refer to data reported by national authorities. The data in the
column headed ‘adjusted’ refer to the 2013 United Nations inter-agency maternal mortality estimates that were released in May 2014. Periodically, the United Nations Maternal Mortality Estimation Inter-agency Group (WHO, UNICEF, UNFPA The World Bank and the United Nations Population Division) produces internationally comparable sets of maternal mortality data that account for the well-documented problems of under-reporting and misclassification of maternal deaths, including also estimates for countries with no data. Please note that owing to an evolving methodology, these values are not comparable with previously reported maternal mortality ratio ‘adjusted’ values. Comparable time series on maternal mortality ratios for the years 1990, 1995, 2000, 2005 and 2013 are available at < http://data.unicef.org/maternal-health/maternal-mortality >.
TAB
LE 8. WO
MEN
For a complete list of countries and areas in the regions, subregions and country categories, see page 32 or visit http://data.unicef.org/index.php?section=regional-classifications.It is not advisable to compare data from consecutive editions of The State of the World’s Children.
Countries and areas
Life expectancy:
females as a % of males
Adult literacy rate: females
as a % of males
Enrolment ratios: females as a % of males
Survival rate to the last grade of primary: females as a % of males
Contraceptive prevalence (%)
Antenatal care (%) Delivery care (%) Maternal mortality ratio†
At least one visit
At least four visits
Skilled attendant at birth
Institutional delivery C-section 2009-2013* 2013
Primary GER
Secondary GER
2013 2009-2013* 2009-2013* 2009-2013* 2009-2013* 2009-2013* 2009-2013* Reported AdjustedLifetime risk of
maternal death (1 in:)

84 THE STATE OF THE WORLD’S CHILDREN 2015
Countries and areas
Child labour (%)+
2005–2013*Child marriage (%)
2005–2013*
Birth registration
(%)++
2005–2013*
Female genital mutilation/cutting (%)+
2004-2013* Justification of wife-beating (%)
2005–2013*Violent discipline (%)+
2005–2013*prevalence attitudes
total male female married by 15 married by 18 total womena girlsb support for the
practicec male female total male femaleAfghanistan 10 11 10 15 40 37 – – – – 90 74 75 74
Albania 5 y 6 y 4 y 0 10 99 – – – 36 30 77 81 73
Algeria 5 y 6 y 4 y 0 2 99 – – – – 68 88 89 87
Andorra – – – – – 100 v – – – – – – – –
Angola 24 x 22 x 25 x – – 36 x – – – – – – – –
Antigua and Barbuda – – – – – – – – – – – – – –
Argentina 4 5 4 – – 100 y – – – – 2 72 74 71
Armenia 4 5 3 0 7 100 – – – 20 9 70 72 67
Australia – – – – – 100 v – – – – – – – –
Austria – – – – – 100 v – – – – – – – –
Azerbaijan 7 y 8 y 5 y 1 12 94 – – – 58 49 77 80 74
Bahamas – – – – – – – – – – – – – –
Bahrain 5 x 6 x 3 x – – – – – – – – – – –
Bangladesh 13 18 8 29 65 31 – – – – 33 y – – –
Barbados – – – – – – – – – – 3 75 78 72
Belarus 1 1 2 0 3 100 y – – – 4 4 65 y 67 y 62 y
Belgium – – – – – 100 v – – – – – – – –
Belize 6 7 5 3 26 95 – – – – 9 71 71 70
Benin 15 15 16 11 32 80 7 0 2 15 16 – – –
Bhutan 3 3 3 6 26 100 – – – – 68 – – –
Bolivia (Plurinational State of) 26 y 28 y 24 y 3 22 76 y – – – – 16 – – –
Bosnia and Herzegovina 5 7 4 0 4 100 – – – 6 5 55 60 50
Botswana 9 y 11 y 7 y – – 72 – – – – – – – –
Brazil 8 y 11 y 6 y 11 36 93 y – – – – – – – –
Brunei Darussalam – – – – – – – – – – – – – –
Bulgaria – – – – – 100 v – – – – – – – –
Burkina Faso 39 42 36 10 52 77 76 13 9 34 44 83 84 82
Burundi 26 26 27 3 20 75 – – – 44 73 – – –
Cabo Verde 6 y – – 3 18 91 – – – 16 y 17 – – –
Cambodia 18 y 19 y 17 y 2 18 62 – – – 22 y 46 y – – –
Cameroon 42 43 40 13 38 61 1 1 y 7 39 47 93 93 93
Canada – – – – – 100 v – – – – – – – –
Central African Republic 29 27 30 29 68 61 24 1 11 75 80 92 92 92
Chad 26 25 28 29 68 16 44 18 y 38 – 62 84 85 84
Chile 7 y – – – – 99 y – – – – – – – –
China – – – – – – – – – – – – – –
Colombia 10 y 13 y 7 y 6 23 97 – – – – – – – –
Comoros 22 20 24 10 32 87 – – – 17 39 – – –
Congo 18 18 19 6 33 91 – – – 62 y 73 y 87 87 86
Cook Islands – – – – – – – – – – – – – –
TABLE 9. CHILD PROTECTION

STATISTICAL TABLES 85
TABLE 9. CHILD PROTECTION
Costa Rica 4 4 5 7 21 100 – – – – 4 46 52 39
Côte d'Ivoire 26 25 28 10 33 65 38 10 14 42 48 91 91 91
Croatia – – – – – – – – – – – – – –
Cuba – – – 9 40 100 y – – – – – – – –
Cyprus – – – – – 100 v – – – – – – – –
Czech Republic – – – – – 100 v – – – – – – – –Democratic People's Republic of Korea – – – – – 100 – – – – – – – –
Democratic Republic of the Congo 15 13 17 9 39 28 – – – – 76 92 92 91
Denmark – – – – – 100 v – – – – – – – –
Djibouti 8 8 8 2 5 92 93 49 y 37 – – 72 73 71
Dominica – – – – – – – – – – – – – –
Dominican Republic 13 18 8 12 41 81 – – – – 4 67 69 65
Ecuador 9 y – – 4 x 22 x 90 – – – – – – – –
Egypt 9 y 14 y 4 y 2 17 99 y 91 17 54 – 39 y 91 92 90
El Salvador 9 y 13 y 4 y 5 25 99 – – – – – – – –
Equatorial Guinea 28 x 28 x 28 x 9 30 54 – – – 52 53 – – –
Eritrea – – – 13 41 – 83 33 12 45 51 – – –
Estonia – – – – – 100 v – – – – – – – –
Ethiopia 27 31 24 16 41 7 74 24 31 45 68 – – –
Fiji – – – – – – – – – – – 72 y – –
Finland – – – – – 100 v – – – – – – – –
France – – – – – 100 v – – – – – – – –
Gabon 13 15 12 6 22 90 – – – 40 50 – – –
Gambia 19 21 18 7 36 53 76 56 64 – 75 90 90 91
Georgia 18 20 17 1 14 100 – – – – 7 67 70 63
Germany – – – – – 100 v – – – – – – – –
Ghana 34 34 34 5 21 63 4 1 2 26 y 44 94 94 94
Greece – – – – – 100 v – – – – – – – –
Grenada – – – – – – – – – – – – – –
Guatemala 26 y 35 y 16 y 7 30 97 – – – – – – – –
Guinea 28 29 27 21 52 58 97 46 76 66 92 – – –
Guinea-Bissau 38 40 36 7 22 24 50 39 y 34 – 40 y 82 82 81
Guyana 16 17 16 6 23 88 – – – 19 16 76 79 74
Haiti 24 25 24 3 18 80 – – – 15 17 85 85 84
Holy See – – – – – – – – – – – – – –
Honduras 14 y 22 y 6 y 8 34 94 – – – 10 12 – – –
Hungary – – – – – 100 v – – – – – – – –
Iceland – – – – – 100 v – – – – – – – –
India 12 12 12 18 47 84 y – – – 42 47 – – –
TAB
LE 9. CH
ILD PR
OTEC
TION
Countries and areas
Child labour (%)+
2005–2013*Child marriage (%)
2005–2013*
Birth registration
(%)++
2005–2013*
Female genital mutilation/cutting (%)+
2004-2013* Justification of wife-beating (%)
2005–2013*Violent discipline (%)+
2005–2013*prevalence attitudes
total male female married by 15 married by 18 total womena girlsb support for the
practicec male female total male female

86 THE STATE OF THE WORLD’S CHILDREN 2015
Indonesia 7 y 8 y 6 y 3 17 67 – – – 18 y 35 – – –
Iran (Islamic Republic of) 11 y 13 y 10 y 3 17 99 y – – – – – – – –
Iraq 5 5 4 5 24 99 8 3 y 5 – 51 79 81 77
Ireland – – – – – 100 v – – – – – – – –
Israel – – – – – 100 v – – – – – – – –
Italy – – – – – 100 v – – – – – – – –
Jamaica 3 4 3 1 8 98 – – – – 5 85 87 82
Japan – – – – – 100 v – – – – – – – –
Jordan 2 y 3 y 0 y 0 8 99 – – – – 70 y 90 91 89
Kazakhstan 2 2 2 0 6 100 – – – 17 12 49 54 45
Kenya 26 x 27 x 25 x 6 26 60 27 8 y 10 44 53 – – –
Kiribati – – – 3 20 94 – – – 60 76 81 y – –
Kuwait – – – – – – – – – – – – – –
Kyrgyzstan 4 4 3 0 8 98 – – – 50 34 54 y 58 y 49 y
Lao People's Democratic Republic 10 y 9 y 11 y 9 35 75 – – – 49 58 76 77 74
Latvia – – – – – 100 v – – – – – – – –
Lebanon 2 3 1 1 6 100 – – – – 10 y 82 82 82
Lesotho 23 x 25 x 21 x 2 19 45 – – – 48 37 – – –
Liberia 21 21 21 11 38 4 y 66 – 45 30 59 90 90 90
Libya – – – – – – – – – – – – – –
Liechtenstein – – – – – 100 v – – – – – – – –
Lithuania – – – – – 100 v – – – – – – – –
Luxembourg – – – – – 100 v – – – – – – – –
Madagascar 23 y 23 y 23 y 12 41 83 – – – 46 y 45 – – –
Malawi 26 25 26 12 50 2 y – – – 13 13 – – –
Malaysia – – – – – – – – – – – – – –
Maldives – – – 0 4 93 – – – 14 y 31 y – – –
Mali 21 22 21 15 55 81 89 74 y 73 – 87 – – –
Malta – – – – – 100 v – – – – – – – –
Marshall Islands – – – 6 26 96 – – – 58 56 – – –
Mauritania 15 14 15 14 34 59 69 54 41 – 38 87 87 87
Mauritius – – – – – – – – – – – – – –
Mexico 6 y 7 y 5 y 5 23 93 y – – – – – – – –
Micronesia (Federated States of) – – – – – – – – – – – – – –
Monaco – – – – – 100 v – – – – – – – –
Mongolia 10 10 11 0 5 99 – – – 9 y 10 46 48 43
Montenegro 10 12 8 0 5 99 – – – – 11 63 64 61
Morocco 8 9 8 3 x 16 x 94 y – – – – 64 x 91 92 90
Mozambique 22 21 24 14 48 48 – – – 20 23 – – –
Myanmar – – – – – 72 – – – – – – – –
TABLE 9. CHILD PROTECTION
Countries and areas
Child labour (%)+
2005–2013*Child marriage (%)
2005–2013*
Birth registration
(%)++
2005–2013*
Female genital mutilation/cutting (%)+
2004-2013* Justification of wife-beating (%)
2005–2013*Violent discipline (%)+
2005–2013*prevalence attitudes
total male female married by 15 married by 18 total womena girlsb support for the
practicec male female total male female

STATISTICAL TABLES 87
TABLE 9. CHILD PROTECTION
Namibia – – – 2 9 78 y – – – 41 35 – – –
Nauru – – – 2 27 83 – – – – – – – –
Nepal 34 y 30 y 38 y 10 41 42 – – – 22 23 – – –
Netherlands – – – – – 100 v – – – – – – – –
New Zealand – – – – – 100 v – – – – – – – –
Nicaragua 15 x 18 x 11 x 10 41 85 – – – – 14 y – – –
Niger 31 31 30 28 76 64 2 2 y 6 27 60 82 82 81
Nigeria 25 24 25 17 43 30 25 17 23 25 35 91 91 90
Niue – – – – – – – – – – – – – –
Norway – – – – – 100 v – – – – – – – –
Oman – – – – – – – – – – – – – –
Pakistan – – – 3 21 34 – – – 32 y 42 y – – –
Palau – – – – – – – – – – – – – –
Panama 6 y 8 y 3 y – – – – – – – – – – –
Papua New Guinea – – – 2 21 – – – – – – – – –
Paraguay 28 y 32 y 24 y – 18 x 76 y – – – – – – – –
Peru 34 y 31 y 36 y 3 19 96 y – – – – – – – –
Philippines 11 y 14 y 8 y 2 14 90 – – – – 14 – – –
Poland – – – – – 100 v – – – – – – – –
Portugal 3 x,y 4 x,y 3 x,y – – 100 v – – – – – – – –
Qatar – – – – – – – – – – – – – –
Republic of Korea – – – – – – – – – – – – – –
Republic of Moldova 16 20 12 1 19 100 – – – 13 11 76 77 74
Romania 1 x 1 x 1 x – – – – – – – – – – –
Russian Federation – – – – – 100 v – – – – – – – –
Rwanda 29 27 30 1 8 63 – – – 25 56 – – –
Saint Kitts and Nevis – – – – – – – – – – – – – –
Saint Lucia 4 5 3 1 8 92 – – – – 7 68 71 64
Saint Vincent and the Grenadines – – – – – – – – – – – – – –
Samoa – – – – – 48 – – – 46 61 – – –
San Marino – – – – – 100 v – – – – – – – –
Sao Tome and Principe 8 8 7 5 34 75 – – – 22 20 – – –
Saudi Arabia – – – – – – – – – – – – – –
Senegal 15 19 10 12 33 73 26 18 17 25 60 – – –
Serbia 4 5 4 1 5 99 – – – 7 y 3 67 70 64
Seychelles – – – – – – – – – – – – – –
Sierra Leone 26 27 25 18 44 78 90 13 66 – 73 82 81 82
Singapore – – – – – – – – – – – – – –
Slovakia – – – – – 100 v – – – – – – – –
Slovenia – – – – – 100 v – – – – – – – –
TAB
LE 9. CH
ILD PR
OTEC
TION
Countries and areas
Child labour (%)+
2005–2013*Child marriage (%)
2005–2013*
Birth registration
(%)++
2005–2013*
Female genital mutilation/cutting (%)+
2004-2013* Justification of wife-beating (%)
2005–2013*Violent discipline (%)+
2005–2013*prevalence attitudes
total male female married by 15 married by 18 total womena girlsb support for the
practicec male female total male female

88 THE STATE OF THE WORLD’S CHILDREN 2015
TABLE 9. CHILD PROTECTION
Solomon Islands – – – 3 22 – – – – 65 69 72 y – –
Somalia 49 45 54 8 45 3 98 46 y 65 – 76 y – – –
South Africa – – – 1 x 6 x 85 y – – – – – – – –
South Sudan – – – 9 52 35 – – – – 79 – – –
Spain – – – – – 100 v – – – – – – – –
Sri Lanka – – – 2 12 97 – – – – 53 y – – –
State of Palestine 6 7 4 2 21 99 – – – – – 93 94 92
Sudan – – – 7 33 59 88 37 42 – 47 – – –
Suriname 4 4 4 5 19 99 – – – – 13 86 87 85
Swaziland 7 8 7 1 7 50 – – – 23 y 28 89 90 88
Sweden – – – – – 100 v – – – – – – – –
Switzerland – – – – – 100 v – – – – – – – –
Syrian Arab Republic 4 5 3 3 13 96 – – – – – 89 90 88
Tajikistan 10 9 11 0 12 88 – – – – 60 78 80 75
Thailand 8 8 8 4 22 99 y – – – – 13 – – –The former Yugoslav Republic of Macedonia 13 12 13 1 7 100 – – – – 15 69 71 67
Timor-Leste 4 x 4 x 4 x 3 19 55 – – – 81 86 – – –
Togo 28 28 29 6 25 78 4 0 2 – 43 93 94 93
Tonga – – – – 6 – – – – 21 29 – – –
Trinidad and Tobago 1 1 1 2 8 97 – – – – 8 77 78 77
Tunisia 2 3 2 0 2 99 – – – – 30 93 94 92
Turkey 6 y 8 y 4 y 3 14 94 – – – – 25 – – –
Turkmenistan – – – – – – – – – – – – – –
Tuvalu – – – 0 10 50 – – – 73 70 – – –
Uganda 16 y 17 y 16 y 10 40 30 1 1 9 44 58 – – –
Ukraine 2 3 2 0 9 100 – – – 9 3 61 68 55
United Arab Emirates – – – – – 100 y – – – – – – – –
United Kingdom – – – – – 100 v – – – – – – – –
United Republic of Tanzania 21 y 23 y 19 y 7 37 16 15 3 y 6 38 54 – – –
United States – – – – – 100 v – – – – – – – –
Uruguay 8 y 8 y 8 y – – 100 y – – – – – – – –
Uzbekistan – – – 0 7 100 – – – 61 x 70 x – – –
Vanuatu – – – 3 21 43 y – – – 60 60 84 83 84
Venezuela (Bolivarian Republic of) 8 x 9 x 6 x – – 81 y – – – – – – – –
Viet Nam 7 7 7 1 9 95 – – – – 36 74 76 71
Yemen 23 21 24 12 32 17 y 19 15 41 x – – 95 95 95
Zambia 41 y 42 y 40 y 9 42 14 – – – 49 62 – – –
Zimbabwe – – – 4 31 49 – – – 34 40 – – –
Countries and areas
Child labour (%)+
2005–2013*Child marriage (%)
2005–2013*
Birth registration
(%)++
2005–2013*
Female genital mutilation/cutting (%)+
2004-2013* Justification of wife-beating (%)
2005–2013*Violent discipline (%)+
2005–2013*prevalence attitudes
total male female married by 15 married by 18 total womena girlsb support for the
practicec male female total male female

STATISTICAL TABLES 89
TABLE 9. CHILD PROTECTION
SUMMARY
Sub-Saharan Africa 25 25 25 12 40 41 39 17 23 35 52 – – –
Eastern and Southern Africa 25 27 24 10 37 36 44 14 20 40 55 – – –
West and Central Africa 25 25 25 14 42 45 31 17 23 30 50 90 90 90
Middle East and North Africa 9 11 7 3 18 87 – – – – – 89 90 88
South Asia 12 13 12 17 45 71 – – – 41 46 – – –
East Asia and Pacific 8 ** 10 ** 7 ** 2 ** 16 ** 79 ** – – – – 29 ** – – –
Latin America and Caribbean 11 13 9 7 29 92 – – – – – – – –
CEE/CIS 5 7 4 1 10 98 – – – – – – – –
Least developed countries 22 23 21 15 45 39 – – – – 52 – – –
World 13 ** 13 ** 12 ** 8 ** 27 ** 72 ** – – – – 32 ** – – –
DEFINITIONS OF THE INDICATORS
Child labour – Percentage of children 5–14 years old involved in child labour at the moment of the survey. A child is considered to be involved in child labour under the following conditions: (a) children 5–11 years old who, during the reference week, did at least one hour of economic activity or at least 28 hours of household chores, or (b) children 12–14 years old who, during the reference week, did at least 14 hours of economic activity or at least 28 hours of household chores.Child marriage – Percentage of women 20–24 years old who were first married or in union before they were 15 years old and percentage of women 20-24 years old who were first married or in union before they were 18 years old.Birth registration – Percentage of children less than 5 years old who were registered at the moment of the survey. The numerator of this indicator includes children whose birth certificate was seen by the interviewer or whose mother or caretaker says the birth has been registered.Female genital mutilation/cutting (FGM/C) – (a) Women: percentage of women 15–49 years old who have undergone FGM/C; (b) girls: percentage of girls 0-14 years old who have undergone FGM/C (as reported by their mothers); (c) support for the practice: percentage of women 15-49 years old who have heard about FGM/C and think the practice should continue.Justification of wife-beating – Percentage of women and men 15–49 years old who consider a husband to be justified in hitting or beating his wife for at least one of the specified reasons, i.e., if his wife burns the food, argues with him, goes out without telling him, neglects the children or refuses sexual relations.Violent discipline – Percentage of children 2–14 years old who experience any violent discipline (psychological aggression and/or physical punishment).
MAIN DATA SOURCES
NOTES
Child labour – Demographic and Health Surveys (DHS), Multiple Indicator Cluster Surveys (MICS) and other national surveys.Child marriage – DHS, MICS and other national surveys.Birth registration – DHS, MICS, other national surveys, censuses and vital registration systems.Female genital mutilation/cutting – DHS, MICS and other national surveys.Justification of wife-beating – DHS, MICS and other national surveys.Violent discipline – DHS, MICS and other national surveys.
– Data not available.v Estimates of 100% were assumed given that civil registration systems in these countries are complete and all vital events
(including births) are registered. Source: United Nations, Department of Economic and Social Affairs, Statistics Division, Population and Vital Statistics Report, Series A Vol. LXV, New York, 2013.
x Data refer to years or periods other than those specified in the column heading. Such data are not included in the calculation of regional and global averages.
y Data differ from the standard definition or refer to only part of a country. If they fall within the noted reference period, such data are included in the calculation of regional and global averages.
+ A more detailed explanation of the methodology and the changes in calculating these estimates can be found in the General Note on the Data, page 28.
++ Changes in the definition of birth registration were made from the second and third rounds of MICS (MICS2 and MICS3) to the fourth round (MICS4). In order to allow for comparability with later rounds, data from MICS2 and MICS3 on birth registration were recalculated according to the MICS4 indicator definition. Therefore, the recalculated data presented here may differ from estimates included in MICS2 and MICS3 national reports.
* Data refer to the most recent year available during the period specified in the column heading.
TAB
LE 9. CH
ILD PR
OTEC
TION
For a complete list of countries and areas in the regions, subregions and country categories, see page 32 or visit http://data.unicef.org/index.php?section=regional-classifications.It is not advisable to compare data from consecutive editions of The State of the World’s Children.
Countries and areas
Child labour (%)+
2005–2013*Child marriage (%)
2005–2013*
Birth registration
(%)++
2005–2013*
Female genital mutilation/cutting (%)+
2004-2013* Justification of wife-beating (%)
2005–2013*Violent discipline (%)+
2005–2013*prevalence attitudes
total male female married by 15 married by 18 total womena girlsb support for the
practicec male female total male female
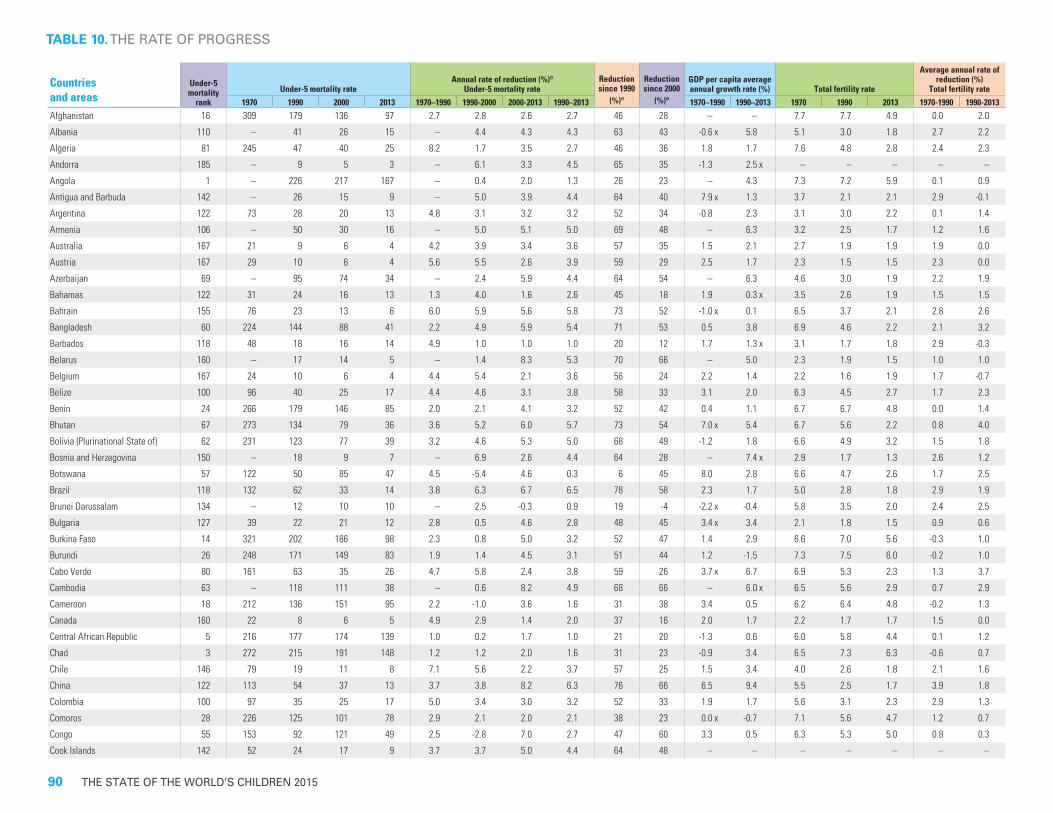
90 THE STATE OF THE WORLD’S CHILDREN 2015
Countries and areas
Under-5 mortality
rankUnder-5 mortality rate
Annual rate of reduction (%)ࡌUnder-5 mortality rate
Reduction since 1990
ࡌ(%)
Reduction since 2000
ࡌ(%)
GDP per capita average annual growth rate (%) Total fertility rate
Average annual rate of reduction (%)
Total fertility rate1970 1990 2000 2013 1970–1990 1990-2000 2000-2013 1990–2013 1970–1990 1990–2013 1970 1990 2013 1970-1990 1990-2013
Afghanistan 16 309 179 136 97 2.7 2.8 2.6 2.7 46 28 – – 7.7 7.7 4.9 0.0 2.0
Albania 110 – 41 26 15 – 4.4 4.3 4.3 63 43 -0.6 x 5.8 5.1 3.0 1.8 2.7 2.2
Algeria 81 245 47 40 25 8.2 1.7 3.5 2.7 46 36 1.8 1.7 7.6 4.8 2.8 2.4 2.3
Andorra 185 – 9 5 3 – 6.1 3.3 4.5 65 35 -1.3 2.5 x – – – – –
Angola 1 – 226 217 167 – 0.4 2.0 1.3 26 23 – 4.3 7.3 7.2 5.9 0.1 0.9
Antigua and Barbuda 142 – 26 15 9 – 5.0 3.9 4.4 64 40 7.9 x 1.3 3.7 2.1 2.1 2.9 -0.1
Argentina 122 73 28 20 13 4.8 3.1 3.2 3.2 52 34 -0.8 2.3 3.1 3.0 2.2 0.1 1.4
Armenia 106 – 50 30 16 – 5.0 5.1 5.0 69 48 – 6.3 3.2 2.5 1.7 1.2 1.6
Australia 167 21 9 6 4 4.2 3.9 3.4 3.6 57 35 1.5 2.1 2.7 1.9 1.9 1.9 0.0
Austria 167 29 10 6 4 5.6 5.5 2.6 3.9 59 29 2.5 1.7 2.3 1.5 1.5 2.3 0.0
Azerbaijan 69 – 95 74 34 – 2.4 5.9 4.4 64 54 – 6.3 4.6 3.0 1.9 2.2 1.9
Bahamas 122 31 24 16 13 1.3 4.0 1.6 2.6 45 18 1.9 0.3 x 3.5 2.6 1.9 1.5 1.5
Bahrain 155 76 23 13 6 6.0 5.9 5.6 5.8 73 52 -1.0 x 0.1 6.5 3.7 2.1 2.8 2.6
Bangladesh 60 224 144 88 41 2.2 4.9 5.9 5.4 71 53 0.5 3.8 6.9 4.6 2.2 2.1 3.2
Barbados 118 48 18 16 14 4.9 1.0 1.0 1.0 20 12 1.7 1.3 x 3.1 1.7 1.8 2.9 -0.3
Belarus 160 – 17 14 5 – 1.4 8.3 5.3 70 66 – 5.0 2.3 1.9 1.5 1.0 1.0
Belgium 167 24 10 6 4 4.4 5.4 2.1 3.6 56 24 2.2 1.4 2.2 1.6 1.9 1.7 -0.7
Belize 100 96 40 25 17 4.4 4.6 3.1 3.8 58 33 3.1 2.0 6.3 4.5 2.7 1.7 2.3
Benin 24 266 179 146 85 2.0 2.1 4.1 3.2 52 42 0.4 1.1 6.7 6.7 4.8 0.0 1.4
Bhutan 67 273 134 79 36 3.6 5.2 6.0 5.7 73 54 7.0 x 5.4 6.7 5.6 2.2 0.8 4.0
Bolivia (Plurinational State of) 62 231 123 77 39 3.2 4.6 5.3 5.0 68 49 -1.2 1.8 6.6 4.9 3.2 1.5 1.8
Bosnia and Herzegovina 150 – 18 9 7 – 6.9 2.6 4.4 64 28 – 7.4 x 2.9 1.7 1.3 2.6 1.2
Botswana 57 122 50 85 47 4.5 -5.4 4.6 0.3 6 45 8.0 2.8 6.6 4.7 2.6 1.7 2.5
Brazil 118 132 62 33 14 3.8 6.3 6.7 6.5 78 58 2.3 1.7 5.0 2.8 1.8 2.9 1.9
Brunei Darussalam 134 – 12 10 10 – 2.5 -0.3 0.9 19 -4 -2.2 x -0.4 5.8 3.5 2.0 2.4 2.5
Bulgaria 127 39 22 21 12 2.8 0.5 4.6 2.8 48 45 3.4 x 3.4 2.1 1.8 1.5 0.9 0.6
Burkina Faso 14 321 202 186 98 2.3 0.8 5.0 3.2 52 47 1.4 2.9 6.6 7.0 5.6 -0.3 1.0
Burundi 26 248 171 149 83 1.9 1.4 4.5 3.1 51 44 1.2 -1.5 7.3 7.5 6.0 -0.2 1.0
Cabo Verde 80 161 63 35 26 4.7 5.8 2.4 3.8 59 26 3.7 x 6.7 6.9 5.3 2.3 1.3 3.7
Cambodia 63 – 118 111 38 – 0.6 8.2 4.9 68 66 – 6.0 x 6.5 5.6 2.9 0.7 2.9
Cameroon 18 212 136 151 95 2.2 -1.0 3.6 1.6 31 38 3.4 0.5 6.2 6.4 4.8 -0.2 1.3
Canada 160 22 8 6 5 4.9 2.9 1.4 2.0 37 16 2.0 1.7 2.2 1.7 1.7 1.5 0.0
Central African Republic 5 216 177 174 139 1.0 0.2 1.7 1.0 21 20 -1.3 0.6 6.0 5.8 4.4 0.1 1.2
Chad 3 272 215 191 148 1.2 1.2 2.0 1.6 31 23 -0.9 3.4 6.5 7.3 6.3 -0.6 0.7
Chile 146 79 19 11 8 7.1 5.6 2.2 3.7 57 25 1.5 3.4 4.0 2.6 1.8 2.1 1.6
China 122 113 54 37 13 3.7 3.8 8.2 6.3 76 66 6.5 9.4 5.5 2.5 1.7 3.9 1.8
Colombia 100 97 35 25 17 5.0 3.4 3.0 3.2 52 33 1.9 1.7 5.6 3.1 2.3 2.9 1.3
Comoros 28 226 125 101 78 2.9 2.1 2.0 2.1 38 23 0.0 x -0.7 7.1 5.6 4.7 1.2 0.7
Congo 55 153 92 121 49 2.5 -2.8 7.0 2.7 47 60 3.3 0.5 6.3 5.3 5.0 0.8 0.3
Cook Islands 142 52 24 17 9 3.7 3.7 5.0 4.4 64 48 – – – – – – –
TABLE 10. THE RATE OF PROGRESS

STATISTICAL TABLES 91
Costa Rica 134 76 17 13 10 7.5 2.5 2.4 2.5 43 27 0.7 2.7 5.0 3.2 1.8 2.3 2.5
Côte d'Ivoire 12 241 152 146 100 2.3 0.4 2.9 1.8 34 32 -1.7 -0.4 7.9 6.4 4.9 1.1 1.2
Croatia 160 – 13 8 5 – 4.3 4.7 4.5 65 46 – 2.8 x 2.0 1.7 1.5 0.9 0.5
Cuba 155 43 13 8 6 5.9 4.6 2.3 3.3 53 26 3.9 3.1 x 4.0 1.8 1.4 4.2 0.8
Cyprus 167 – 11 7 4 – 5.4 4.5 4.9 68 45 5.9 x 1.7 x 2.6 2.4 1.5 0.4 2.2
Czech Republic 167 – 15 7 4 – 7.9 4.7 6.1 75 45 – 2.6 2.0 1.8 1.6 0.6 0.7Democratic People's Republic of Korea 79 – 43 60 27 – -3.2 6.0 2.0 37 54 – – 4.3 2.3 2.0 3.2 0.6
Democratic Republic of the Congo 8 267 176 176 119 2.1 0.0 3.0 1.7 33 33 -2.1 -1.9 6.2 7.1 5.9 -0.7 0.8
Denmark 167 17 9 6 4 3.1 4.6 3.6 4.1 61 38 2.0 1.2 2.1 1.7 1.9 1.2 -0.6
Djibouti 36 – 119 101 70 – 1.6 2.8 2.3 41 31 – 0.2 6.8 6.1 3.4 0.6 2.5
Dominica 131 64 17 16 11 6.6 0.8 2.5 1.8 34 28 5.2 x 1.9 – – – – –
Dominican Republic 78 121 60 41 28 3.5 3.7 2.9 3.3 53 32 2.1 3.9 6.2 3.5 2.5 2.9 1.4
Ecuador 87 138 57 34 23 4.4 5.1 3.2 4.0 60 34 1.7 1.3 6.1 3.8 2.6 2.4 1.7
Egypt 89 240 85 45 22 5.2 6.4 5.5 5.9 74 51 4.4 2.9 5.9 4.4 2.8 1.6 2.0
El Salvador 106 155 60 32 16 4.8 6.1 5.6 5.8 74 52 -1.9 2.2 6.2 4.0 2.2 2.3 2.6
Equatorial Guinea 17 – 184 142 96 – 2.6 3.0 2.8 48 33 -2.3 x 19.9 5.7 5.9 4.8 -0.2 0.9
Eritrea 53 217 151 89 50 1.8 5.2 4.5 4.8 67 44 – -1.1 x 6.7 6.5 4.7 0.1 1.4
Estonia 185 – 20 11 3 – 6.1 9.0 7.7 83 69 – 5.4 x 2.1 1.9 1.6 0.4 0.8
Ethiopia 39 240 205 146 64 0.8 3.4 6.3 5.0 69 56 – 3.6 7.0 7.2 4.5 -0.2 2.1
Fiji 83 55 30 24 24 3.1 2.1 0.3 1.0 21 3 0.6 1.2 4.5 3.4 2.6 1.5 1.2
Finland 185 16 7 4 3 4.4 4.4 3.9 4.1 61 40 2.9 2.2 1.9 1.7 1.9 0.3 -0.3
France 167 18 9 5 4 3.5 5.1 1.9 3.3 53 22 2.1 1.1 2.5 1.8 2.0 1.8 -0.5
Gabon 42 – 93 85 56 – 0.9 3.2 2.2 39 34 0.7 -0.7 5.1 5.4 4.1 -0.3 1.2
Gambia 31 302 170 119 74 2.9 3.6 3.7 3.6 57 38 0.7 0.4 6.1 6.1 5.8 0.0 0.3
Georgia 122 – 47 36 13 – 2.8 7.7 5.6 72 63 3.1 3.1 2.6 2.2 1.8 0.9 0.8
Germany 167 26 9 5 4 5.5 4.5 2.5 3.4 54 28 2.3 1.3 2.0 1.4 1.4 2.0 -0.2
Ghana 28 201 128 101 78 2.3 2.4 2.0 2.1 39 23 -2.0 2.8 7.0 5.6 3.9 1.1 1.6
Greece 167 38 13 8 4 5.5 4.7 4.4 4.5 65 44 1.3 1.7 2.4 1.4 1.5 2.5 -0.3
Grenada 127 – 22 16 12 – 3.3 2.3 2.7 47 26 4.2 x 2.4 4.6 3.8 2.2 0.9 2.5
Guatemala 72 174 81 51 31 3.9 4.6 3.8 4.2 62 39 0.2 1.2 6.2 5.6 3.8 0.6 1.7
Guinea 11 326 238 170 101 1.6 3.3 4.0 3.7 58 41 – 0.7 6.2 6.6 4.9 -0.3 1.3
Guinea-Bissau 6 277 225 181 124 1.0 2.2 2.9 2.6 45 31 0.9 -1.3 6.1 6.6 4.9 -0.5 1.3
Guyana 65 74 61 49 37 0.9 2.3 2.2 2.2 40 25 -1.3 2.1 5.1 2.5 2.5 3.6 -0.1
Haiti 32 249 145 104 73 2.7 3.3 2.8 3.0 50 30 – -0.6 x 5.8 5.4 3.1 0.3 2.4
Holy See – – – – – – – – – – – – – – – – – –
Honduras 89 146 59 38 22 4.5 4.4 4.2 4.3 62 42 0.8 1.6 7.3 5.1 3.0 1.7 2.3
Hungary 155 43 19 11 6 4.0 5.3 4.7 4.9 68 46 3.0 2.4 x 2.0 1.8 1.4 0.5 1.1
Iceland 194 16 6 4 2 4.5 4.7 5.0 4.8 67 48 3.2 1.9 3.0 2.2 2.1 1.7 0.2
India 47 213 126 91 53 2.6 3.2 4.2 3.8 58 42 2.0 5.0 5.5 3.9 2.5 1.7 1.9
TABLE 10. THE RATE OF PROGRESS
Countries and areas
Under-5 mortality
rankUnder-5 mortality rate
Annual rate of reduction (%)ࡌUnder-5 mortality rate
Reduction since 1990
ࡌ(%)
Reduction since 2000
ࡌ(%)
GDP per capita average annual growth rate (%) Total fertility rate
Average annual rate of reduction (%)
Total fertility rate1970 1990 2000 2013 1970–1990 1990-2000 2000-2013 1990–2013 1970–1990 1990–2013 1970 1990 2013 1970-1990 1990-2013
TAB
LE 10. THE R
ATE OF PR
OG
RES
S
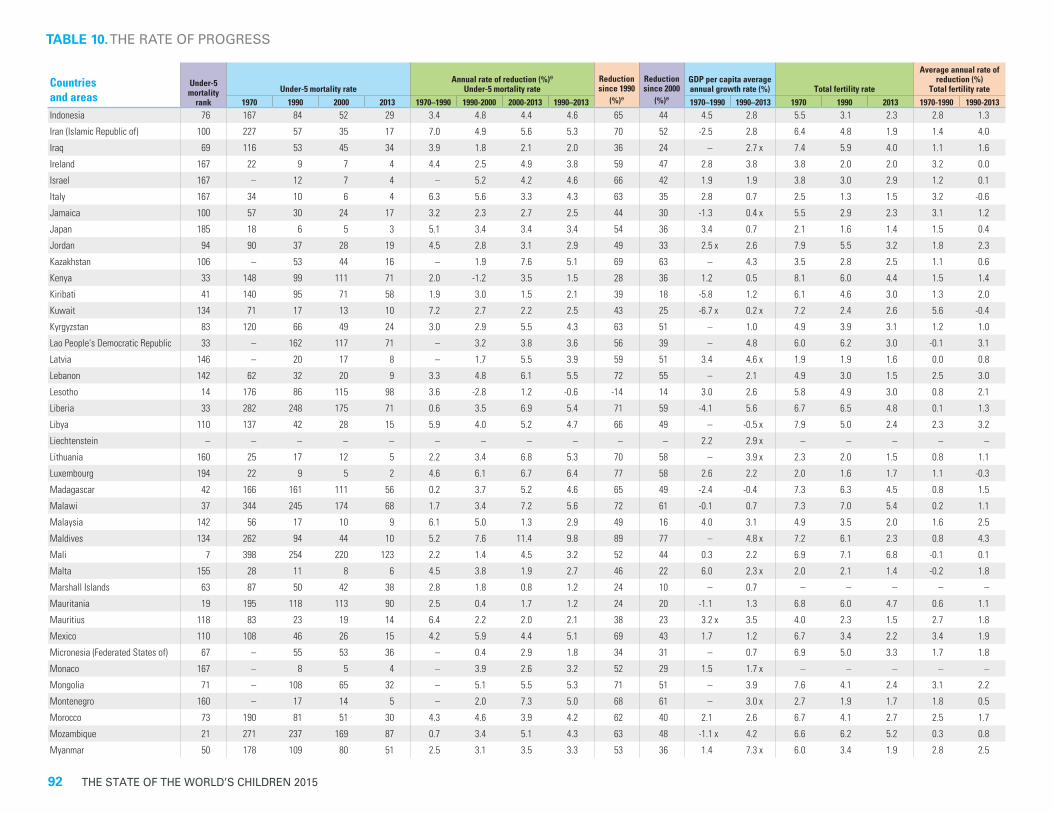
92 THE STATE OF THE WORLD’S CHILDREN 2015
Indonesia 76 167 84 52 29 3.4 4.8 4.4 4.6 65 44 4.5 2.8 5.5 3.1 2.3 2.8 1.3
Iran (Islamic Republic of) 100 227 57 35 17 7.0 4.9 5.6 5.3 70 52 -2.5 2.8 6.4 4.8 1.9 1.4 4.0
Iraq 69 116 53 45 34 3.9 1.8 2.1 2.0 36 24 – 2.7 x 7.4 5.9 4.0 1.1 1.6
Ireland 167 22 9 7 4 4.4 2.5 4.9 3.8 59 47 2.8 3.8 3.8 2.0 2.0 3.2 0.0
Israel 167 – 12 7 4 – 5.2 4.2 4.6 66 42 1.9 1.9 3.8 3.0 2.9 1.2 0.1
Italy 167 34 10 6 4 6.3 5.6 3.3 4.3 63 35 2.8 0.7 2.5 1.3 1.5 3.2 -0.6
Jamaica 100 57 30 24 17 3.2 2.3 2.7 2.5 44 30 -1.3 0.4 x 5.5 2.9 2.3 3.1 1.2
Japan 185 18 6 5 3 5.1 3.4 3.4 3.4 54 36 3.4 0.7 2.1 1.6 1.4 1.5 0.4
Jordan 94 90 37 28 19 4.5 2.8 3.1 2.9 49 33 2.5 x 2.6 7.9 5.5 3.2 1.8 2.3
Kazakhstan 106 – 53 44 16 – 1.9 7.6 5.1 69 63 – 4.3 3.5 2.8 2.5 1.1 0.6
Kenya 33 148 99 111 71 2.0 -1.2 3.5 1.5 28 36 1.2 0.5 8.1 6.0 4.4 1.5 1.4
Kiribati 41 140 95 71 58 1.9 3.0 1.5 2.1 39 18 -5.8 1.2 6.1 4.6 3.0 1.3 2.0
Kuwait 134 71 17 13 10 7.2 2.7 2.2 2.5 43 25 -6.7 x 0.2 x 7.2 2.4 2.6 5.6 -0.4
Kyrgyzstan 83 120 66 49 24 3.0 2.9 5.5 4.3 63 51 – 1.0 4.9 3.9 3.1 1.2 1.0
Lao People's Democratic Republic 33 – 162 117 71 – 3.2 3.8 3.6 56 39 – 4.8 6.0 6.2 3.0 -0.1 3.1
Latvia 146 – 20 17 8 – 1.7 5.5 3.9 59 51 3.4 4.6 x 1.9 1.9 1.6 0.0 0.8
Lebanon 142 62 32 20 9 3.3 4.8 6.1 5.5 72 55 – 2.1 4.9 3.0 1.5 2.5 3.0
Lesotho 14 176 86 115 98 3.6 -2.8 1.2 -0.6 -14 14 3.0 2.6 5.8 4.9 3.0 0.8 2.1
Liberia 33 282 248 175 71 0.6 3.5 6.9 5.4 71 59 -4.1 5.6 6.7 6.5 4.8 0.1 1.3
Libya 110 137 42 28 15 5.9 4.0 5.2 4.7 66 49 – -0.5 x 7.9 5.0 2.4 2.3 3.2
Liechtenstein – – – – – – – – – – – 2.2 2.9 x – – – – –
Lithuania 160 25 17 12 5 2.2 3.4 6.8 5.3 70 58 – 3.9 x 2.3 2.0 1.5 0.8 1.1
Luxembourg 194 22 9 5 2 4.6 6.1 6.7 6.4 77 58 2.6 2.2 2.0 1.6 1.7 1.1 -0.3
Madagascar 42 166 161 111 56 0.2 3.7 5.2 4.6 65 49 -2.4 -0.4 7.3 6.3 4.5 0.8 1.5
Malawi 37 344 245 174 68 1.7 3.4 7.2 5.6 72 61 -0.1 0.7 7.3 7.0 5.4 0.2 1.1
Malaysia 142 56 17 10 9 6.1 5.0 1.3 2.9 49 16 4.0 3.1 4.9 3.5 2.0 1.6 2.5
Maldives 134 262 94 44 10 5.2 7.6 11.4 9.8 89 77 – 4.8 x 7.2 6.1 2.3 0.8 4.3
Mali 7 398 254 220 123 2.2 1.4 4.5 3.2 52 44 0.3 2.2 6.9 7.1 6.8 -0.1 0.1
Malta 155 28 11 8 6 4.5 3.8 1.9 2.7 46 22 6.0 2.3 x 2.0 2.1 1.4 -0.2 1.8
Marshall Islands 63 87 50 42 38 2.8 1.8 0.8 1.2 24 10 – 0.7 – – – – –
Mauritania 19 195 118 113 90 2.5 0.4 1.7 1.2 24 20 -1.1 1.3 6.8 6.0 4.7 0.6 1.1
Mauritius 118 83 23 19 14 6.4 2.2 2.0 2.1 38 23 3.2 x 3.5 4.0 2.3 1.5 2.7 1.8
Mexico 110 108 46 26 15 4.2 5.9 4.4 5.1 69 43 1.7 1.2 6.7 3.4 2.2 3.4 1.9
Micronesia (Federated States of) 67 – 55 53 36 – 0.4 2.9 1.8 34 31 – 0.7 6.9 5.0 3.3 1.7 1.8
Monaco 167 – 8 5 4 – 3.9 2.6 3.2 52 29 1.5 1.7 x – – – – –
Mongolia 71 – 108 65 32 – 5.1 5.5 5.3 71 51 – 3.9 7.6 4.1 2.4 3.1 2.2
Montenegro 160 – 17 14 5 – 2.0 7.3 5.0 68 61 – 3.0 x 2.7 1.9 1.7 1.8 0.5
Morocco 73 190 81 51 30 4.3 4.6 3.9 4.2 62 40 2.1 2.6 6.7 4.1 2.7 2.5 1.7
Mozambique 21 271 237 169 87 0.7 3.4 5.1 4.3 63 48 -1.1 x 4.2 6.6 6.2 5.2 0.3 0.8
Myanmar 50 178 109 80 51 2.5 3.1 3.5 3.3 53 36 1.4 7.3 x 6.0 3.4 1.9 2.8 2.5
TABLE 10. THE RATE OF PROGRESS
Countries and areas
Under-5 mortality
rankUnder-5 mortality rate
Annual rate of reduction (%)ࡌUnder-5 mortality rate
Reduction since 1990
ࡌ(%)
Reduction since 2000
ࡌ(%)
GDP per capita average annual growth rate (%) Total fertility rate
Average annual rate of reduction (%)
Total fertility rate1970 1990 2000 2013 1970–1990 1990-2000 2000-2013 1990–2013 1970–1990 1990–2013 1970 1990 2013 1970-1990 1990-2013

STATISTICAL TABLES 93
Namibia 53 98 74 76 50 1.4 -0.3 3.2 1.7 32 34 -2.1 x 2.2 6.5 5.2 3.1 1.1 2.3
Nauru 65 – 58 41 37 – 3.3 0.9 2.0 36 11 – – – – – – –
Nepal 61 271 142 82 40 3.2 5.5 5.6 5.6 72 52 1.2 2.3 6.0 5.2 2.3 0.7 3.5
Netherlands 167 16 8 6 4 3.2 2.9 3.4 3.2 52 35 1.6 1.7 2.4 1.6 1.8 2.2 -0.5
New Zealand 155 21 11 7 6 3.1 4.1 1.2 2.5 44 15 1.1 1.7 3.1 2.1 2.1 2.0 0.0
Nicaragua 83 174 67 40 24 4.8 5.1 4.1 4.5 65 42 -3.7 2.0 6.9 4.8 2.5 1.9 2.8
Niger 10 325 327 227 104 0.0 3.7 6.0 5.0 68 54 -1.9 -0.1 7.4 7.8 7.6 -0.2 0.1
Nigeria 9 287 213 188 117 1.5 1.3 3.6 2.6 45 37 -2.3 3.4 6.5 6.5 6.0 0.0 0.4
Niue 81 – 14 23 25 – -5.2 -0.4 -2.5 -78 -6 – – – – – – –
Norway 185 16 9 5 3 3.1 5.9 4.1 4.9 68 42 3.2 1.7 2.5 1.9 1.9 1.5 -0.2
Oman 131 229 39 17 11 8.8 8.7 2.8 5.4 71 31 3.2 2.1 7.3 7.2 2.9 0.1 4.0
Pakistan 23 188 139 113 86 1.5 2.1 2.1 2.1 38 24 2.6 1.9 6.6 6.0 3.2 0.5 2.8
Palau 97 – 36 27 18 – 3.0 3.2 3.1 52 34 – 0.0 x – – – – –
Panama 97 68 31 26 18 3.9 1.8 2.9 2.4 42 31 0.2 3.6 5.2 3.1 2.5 2.6 1.0
Papua New Guinea 40 144 89 78 61 2.4 1.3 1.9 1.6 31 22 -1.0 0.5 6.2 4.8 3.8 1.2 1.0
Paraguay 89 78 46 34 22 2.6 3.2 3.3 3.2 53 35 3.7 0.6 5.7 4.5 2.9 1.2 2.0
Peru 100 164 80 40 17 3.6 7.0 6.7 6.8 79 58 -0.6 3.4 6.3 3.8 2.4 2.5 2.0
Philippines 73 84 59 40 30 1.8 3.8 2.2 2.9 49 25 0.6 2.1 6.3 4.3 3.0 1.9 1.5
Poland 160 36 17 9 5 3.7 6.2 4.5 5.2 70 44 – 4.3 2.2 2.0 1.4 0.4 1.6
Portugal 167 68 15 7 4 7.7 7.1 4.9 5.9 74 47 2.5 1.3 3.0 1.5 1.3 3.3 0.7
Qatar 146 66 21 12 8 5.7 5.2 3.2 4.0 61 34 – 1.1 x 6.9 4.0 2.0 2.7 3.0
Republic of Korea 167 52 7 6 4 10.0 1.5 3.8 2.8 48 39 7.5 4.4 4.5 1.6 1.3 5.2 0.9
Republic of Moldova 110 – 32 31 15 – 0.5 5.3 3.2 52 50 1.8 x 0.5 2.6 2.4 1.5 0.3 2.2
Romania 127 66 38 27 12 2.8 3.3 6.2 5.0 68 56 0.9 x 3.2 2.9 1.9 1.4 2.1 1.3
Russian Federation 134 45 26 23 10 2.7 1.1 6.4 4.1 61 56 – 2.5 2.0 1.9 1.5 0.3 0.8
Rwanda 48 217 152 182 52 1.8 -1.8 9.6 4.7 66 71 1.1 2.7 8.2 7.3 4.5 0.6 2.1
Saint Kitts and Nevis 134 70 29 18 10 4.5 4.9 4.2 4.5 64 42 6.5 x 1.8 – – – – –
Saint Lucia 110 75 23 18 15 6.0 2.3 1.6 1.9 36 19 5.1 x 1.3 6.1 3.4 1.9 2.9 2.5
Saint Vincent and the Grenadines 94 81 25 22 19 5.9 1.1 1.2 1.1 23 14 3.3 3.1 6.0 3.0 2.0 3.6 1.7
Samoa 97 – 31 22 18 – 3.5 1.4 2.3 42 17 – 2.5 7.2 5.1 4.1 1.7 0.9
San Marino 185 – 11 6 3 – 6.8 4.4 5.5 72 44 1.7 3.3 x – – – – –
Sao Tome and Principe 50 88 110 89 51 -1.1 2.1 4.3 3.4 54 43 – 2.5 x 6.5 5.4 4.1 0.9 1.2
Saudi Arabia 106 – 44 23 16 – 6.6 3.0 4.5 65 32 -1.4 1.4 7.3 5.8 2.6 1.1 3.4
Senegal 44 290 141 137 55 3.6 0.3 7.0 4.1 61 60 -0.6 1.1 7.3 6.6 4.9 0.5 1.3
Serbia 150 – 28 13 7 – 7.8 5.1 6.3 76 48 – 1.6 2.4 2.1 1.4 0.6 1.9
Seychelles 118 72 17 14 14 7.4 1.5 0.0 0.7 14 0 3.5 2.0 5.8 2.7 2.2 3.7 1.0
Sierra Leone 2 339 268 232 161 1.2 1.5 2.8 2.2 40 31 -0.7 1.3 6.7 6.5 4.7 0.1 1.4
Singapore 185 27 8 4 3 6.3 6.5 2.7 4.4 64 30 5.9 3.5 3.2 1.7 1.3 3.1 1.3
Slovakia 150 – 18 12 7 – 4.1 3.8 3.9 59 39 – 3.7 x 2.5 2.0 1.4 1.0 1.6
TABLE 10. THE RATE OF PROGRESS
Countries and areas
Under-5 mortality
rankUnder-5 mortality rate
Annual rate of reduction (%)ࡌUnder-5 mortality rate
Reduction since 1990
ࡌ(%)
Reduction since 2000
ࡌ(%)
GDP per capita average annual growth rate (%) Total fertility rate
Average annual rate of reduction (%)
Total fertility rate1970 1990 2000 2013 1970–1990 1990-2000 2000-2013 1990–2013 1970–1990 1990–2013 1970 1990 2013 1970-1990 1990-2013
TAB
LE 10. THE R
ATE OF PR
OG
RES
S
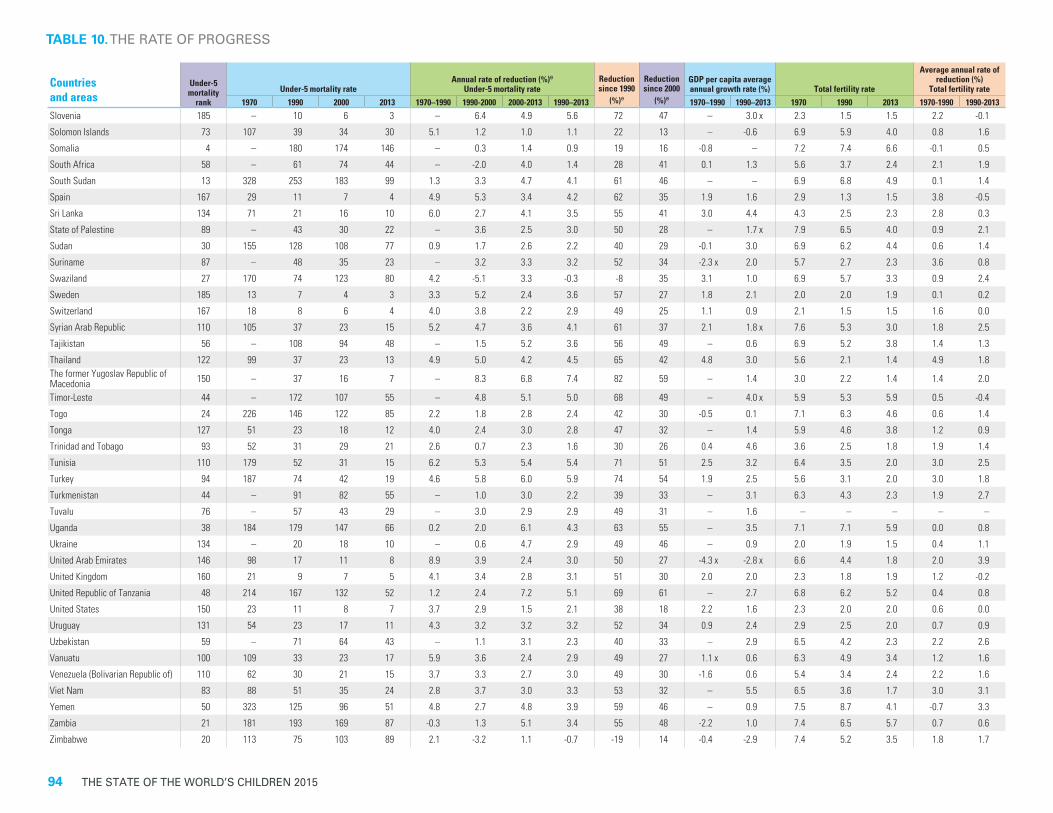
94 THE STATE OF THE WORLD’S CHILDREN 2015
TABLE 10. THE RATE OF PROGRESS
Slovenia 185 – 10 6 3 – 6.4 4.9 5.6 72 47 – 3.0 x 2.3 1.5 1.5 2.2 -0.1
Solomon Islands 73 107 39 34 30 5.1 1.2 1.0 1.1 22 13 – -0.6 6.9 5.9 4.0 0.8 1.6
Somalia 4 – 180 174 146 – 0.3 1.4 0.9 19 16 -0.8 – 7.2 7.4 6.6 -0.1 0.5
South Africa 58 – 61 74 44 – -2.0 4.0 1.4 28 41 0.1 1.3 5.6 3.7 2.4 2.1 1.9
South Sudan 13 328 253 183 99 1.3 3.3 4.7 4.1 61 46 – – 6.9 6.8 4.9 0.1 1.4
Spain 167 29 11 7 4 4.9 5.3 3.4 4.2 62 35 1.9 1.6 2.9 1.3 1.5 3.8 -0.5
Sri Lanka 134 71 21 16 10 6.0 2.7 4.1 3.5 55 41 3.0 4.4 4.3 2.5 2.3 2.8 0.3
State of Palestine 89 – 43 30 22 – 3.6 2.5 3.0 50 28 – 1.7 x 7.9 6.5 4.0 0.9 2.1
Sudan 30 155 128 108 77 0.9 1.7 2.6 2.2 40 29 -0.1 3.0 6.9 6.2 4.4 0.6 1.4
Suriname 87 – 48 35 23 – 3.2 3.3 3.2 52 34 -2.3 x 2.0 5.7 2.7 2.3 3.6 0.8
Swaziland 27 170 74 123 80 4.2 -5.1 3.3 -0.3 -8 35 3.1 1.0 6.9 5.7 3.3 0.9 2.4
Sweden 185 13 7 4 3 3.3 5.2 2.4 3.6 57 27 1.8 2.1 2.0 2.0 1.9 0.1 0.2
Switzerland 167 18 8 6 4 4.0 3.8 2.2 2.9 49 25 1.1 0.9 2.1 1.5 1.5 1.6 0.0
Syrian Arab Republic 110 105 37 23 15 5.2 4.7 3.6 4.1 61 37 2.1 1.8 x 7.6 5.3 3.0 1.8 2.5
Tajikistan 56 – 108 94 48 – 1.5 5.2 3.6 56 49 – 0.6 6.9 5.2 3.8 1.4 1.3
Thailand 122 99 37 23 13 4.9 5.0 4.2 4.5 65 42 4.8 3.0 5.6 2.1 1.4 4.9 1.8The former Yugoslav Republic of Macedonia 150 – 37 16 7 – 8.3 6.8 7.4 82 59 – 1.4 3.0 2.2 1.4 1.4 2.0
Timor-Leste 44 – 172 107 55 – 4.8 5.1 5.0 68 49 – 4.0 x 5.9 5.3 5.9 0.5 -0.4
Togo 24 226 146 122 85 2.2 1.8 2.8 2.4 42 30 -0.5 0.1 7.1 6.3 4.6 0.6 1.4
Tonga 127 51 23 18 12 4.0 2.4 3.0 2.8 47 32 – 1.4 5.9 4.6 3.8 1.2 0.9
Trinidad and Tobago 93 52 31 29 21 2.6 0.7 2.3 1.6 30 26 0.4 4.6 3.6 2.5 1.8 1.9 1.4
Tunisia 110 179 52 31 15 6.2 5.3 5.4 5.4 71 51 2.5 3.2 6.4 3.5 2.0 3.0 2.5
Turkey 94 187 74 42 19 4.6 5.8 6.0 5.9 74 54 1.9 2.5 5.6 3.1 2.0 3.0 1.8
Turkmenistan 44 – 91 82 55 – 1.0 3.0 2.2 39 33 – 3.1 6.3 4.3 2.3 1.9 2.7
Tuvalu 76 – 57 43 29 – 3.0 2.9 2.9 49 31 – 1.6 – – – – –
Uganda 38 184 179 147 66 0.2 2.0 6.1 4.3 63 55 – 3.5 7.1 7.1 5.9 0.0 0.8
Ukraine 134 – 20 18 10 – 0.6 4.7 2.9 49 46 – 0.9 2.0 1.9 1.5 0.4 1.1
United Arab Emirates 146 98 17 11 8 8.9 3.9 2.4 3.0 50 27 -4.3 x -2.8 x 6.6 4.4 1.8 2.0 3.9
United Kingdom 160 21 9 7 5 4.1 3.4 2.8 3.1 51 30 2.0 2.0 2.3 1.8 1.9 1.2 -0.2
United Republic of Tanzania 48 214 167 132 52 1.2 2.4 7.2 5.1 69 61 – 2.7 6.8 6.2 5.2 0.4 0.8
United States 150 23 11 8 7 3.7 2.9 1.5 2.1 38 18 2.2 1.6 2.3 2.0 2.0 0.6 0.0
Uruguay 131 54 23 17 11 4.3 3.2 3.2 3.2 52 34 0.9 2.4 2.9 2.5 2.0 0.7 0.9
Uzbekistan 59 – 71 64 43 – 1.1 3.1 2.3 40 33 – 2.9 6.5 4.2 2.3 2.2 2.6
Vanuatu 100 109 33 23 17 5.9 3.6 2.4 2.9 49 27 1.1 x 0.6 6.3 4.9 3.4 1.2 1.6
Venezuela (Bolivarian Republic of) 110 62 30 21 15 3.7 3.3 2.7 3.0 49 30 -1.6 0.6 5.4 3.4 2.4 2.2 1.6
Viet Nam 83 88 51 35 24 2.8 3.7 3.0 3.3 53 32 – 5.5 6.5 3.6 1.7 3.0 3.1
Yemen 50 323 125 96 51 4.8 2.7 4.8 3.9 59 46 – 0.9 7.5 8.7 4.1 -0.7 3.3
Zambia 21 181 193 169 87 -0.3 1.3 5.1 3.4 55 48 -2.2 1.0 7.4 6.5 5.7 0.7 0.6
Zimbabwe 20 113 75 103 89 2.1 -3.2 1.1 -0.7 -19 14 -0.4 -2.9 7.4 5.2 3.5 1.8 1.7
Countries and areas
Under-5 mortality
rankUnder-5 mortality rate
Annual rate of reduction (%)ࡌUnder-5 mortality rate
Reduction since 1990
ࡌ(%)
Reduction since 2000
ࡌ(%)
GDP per capita average annual growth rate (%) Total fertility rate
Average annual rate of reduction (%)
Total fertility rate1970 1990 2000 2013 1970–1990 1990-2000 2000-2013 1990–2013 1970–1990 1990–2013 1970 1990 2013 1970-1990 1990-2013

STATISTICAL TABLES 95
SUMMARY
Sub-Saharan Africa 246 179 156 92 1.6 1.4 4.0 2.9 48 41 -0.1 2.5 6.7 6.3 5.1 0.3 1.0
Eastern and Southern Africa 212 165 140 74 1.2 1.6 4.9 3.5 55 47 0.3 2.1 6.9 6.1 4.6 0.6 1.2
West and Central Africa 279 197 175 109 1.7 1.2 3.6 2.6 44 38 -0.8 2.9 6.6 6.6 5.6 0.0 0.7
Middle East and North Africa 205 70 50 31 5.4 3.3 3.8 3.6 56 39 0.0 2.1 6.7 5.0 2.9 1.5 2.4
South Asia 213 129 94 57 2.5 3.2 3.9 3.6 56 40 2.0 4.6 5.7 4.2 2.6 1.6 2.1
East Asia and Pacific 117 58 41 19 3.5 3.5 5.9 4.8 67 53 5.9 7.7 5.5 2.7 1.8 3.6 1.7
Latin America and Caribbean 119 54 32 18 4.0 5.1 4.5 4.8 67 44 1.4 1.8 5.3 3.2 2.2 2.5 1.7
CEE/CIS 97 47 37 20 3.6 2.3 5.0 3.8 59 48 – 2.7 2.8 2.3 1.8 0.9 1.2
Least developed countries 243 174 139 80 1.7 2.2 4.3 3.4 54 43 -0.2 3.2 6.8 6.0 4.3 0.6 1.4
World 147 90 76 46 2.4 1.7 3.9 3.0 49 40 2.4 2.8 4.7 3.3 2.5 1.8 1.2
TABLE 10. THE RATE OF PROGRESS
DEFINITIONS OF THE INDICATORS
Under-5 mortality rate – Probability of dying between birth and exactly 5 years of age, expressed per 1,000 live births.Reduction since 1990 – Percentage reduction in the under-five mortality rate (U5MR) from 1990 to 2013. The United Nations Millennium Declaration in 2000 established a goal of a two-thirds (67 per cent) reduction in U5MR from 1990 to 2015. This indicator provides a current assessment of progress towards this goal.GDP per capita – Gross domestic product (GDP) is the sum of value added by all resident producers plus any product taxes (less subsidies) not included in the valuation of output. Gross domestic product per capita is GDP divided by midyear population. Growth is calculated from constant price GDP data in local currency.Total fertility rate – Number of children who would be born per woman if she lived to the end of her childbearing years and bore children at each age in accordance with prevailing age-specific fertility rates.
MAIN DATA SOURCES
NOTES
Under-5 mortality rate – United Nations Inter-agency Group for Child Mortality Estimation (UNICEF, World Health Organization, United Nations Population Division and the World Bank).GDP per capita – The World Bank.Total fertility rate – United Nations Population Division.
– Data not available.
.A negative value indicates an increase in the under-five mortality rate ࡌx Data refer to years or periods other than those specified in the column heading. Such data are not included in the calcula-
tion of regional and global averages.
TAB
LE 10. THE R
ATE OF PR
OG
RES
S
For a complete list of countries and areas in the regions, subregions and country categories, see page 32 or visit http://data.unicef.org/index.php?section=regional-classifications.It is not advisable to compare data from consecutive editions of The State of the World’s Children.
Countries and areas
Under-5 mortality
rankUnder-5 mortality rate
Annual rate of reduction (%)ࡌUnder-5 mortality rate
Reduction since 1990
ࡌ(%)
Reduction since 2000
ࡌ(%)
GDP per capita average annual growth rate (%) Total fertility rate
Average annual rate of reduction (%)
Total fertility rate1970 1990 2000 2013 1970–1990 1990-2000 2000-2013 1990–2013 1970–1990 1990–2013 1970 1990 2013 1970-1990 1990-2013

96 THE STATE OF THE WORLD’S CHILDREN 2015
Countries and areas
Adolescent populationAdolescents currently married/ in union (%)
2005-2013* Births by
age 18 (%)Adolescent
birth rate
Justification of wife-beating among adolescents (%)
2005-2013*
Use of mass media among adolescents (%)
2005-2013*
Lower secondary
school gross enrolment ratio
Upper secondary
school gross enrolment ratio
Comprehensive knowledge of HIV
among adolescents (%)2009-2013*
Aged 10-19 (thousands)
Proportion of total
population (%)2013 2013 male female 2009-2013* 2008-2012* male female male female 2009-2012* male female
Afghanistan 8,058 26 – 20 26 90 – 84 – – 63 43 – 2
Albania 554 17 1 8 3 12 x 37 24 97 99 93 x 83 21 36
Algeria 6,221 16 – 2 1 4 x – 66 – – 128 62 – 12 x
Andorra – – – – – 5 – – – – – – – –
Angola 5,062 24 – – – 188 – – – – 39 23 26 24
Antigua and Barbuda 16 17 – – – 67 x – – – – 114 93 55 40
Argentina 6,696 16 – – 12 70 – 2 – – 114 70 – 36
Armenia 401 13 1 8 2 28 21 8 94 92 94 99 4 10
Australia 2,934 13 – – – 15 – – – – 111 182 – –
Austria 906 11 – – – 9 – – – – 100 96 – –
Azerbaijan 1,451 15 0 10 4 x 47 63 39 97 95 92 119 2 x 3 x
Bahamas 59 16 – – – 40 x – – – – 98 88 – –
Bahrain 164 12 – – – 14 – – – – 94 97 – –
Bangladesh 32,274 21 2 45 40 128 – 33 y – 57 y 71 41 – 11
Barbados 37 13 – – – 49 x – 5 – – 106 103 – –
Belarus 937 10 1 7 3 x 21 3 3 – – 102 116 53 51
Belgium 1,225 11 – – – 9 – – – – 120 101 – –
Belize 71 21 – 15 17 93 x – 11 – – 96 60 – 39
Benin 2,395 23 2 14 23 98 16 15 67 59 59 31 27 26
Bhutan 146 19 – 15 15 59 – 70 – – 86 50 – 22
Bolivia (Plurinational State of) 2,326 22 4 13 20 x 89 x – 17 100 97 91 70 24 x 20 x
Bosnia and Herzegovina 529 14 0 1 – 14 5 1 100 100 – 74 41 42
Botswana 443 22 – – – 51 x – – – – 90 68 x – –
Brazil 34,389 17 1 4 – 65 – – – – – – – –
Brunei Darussalam 71 17 – – – 17 – – – – 110 107 – –
Bulgaria 651 9 – 2 y – 42 – – – – 87 99 – –
Burkina Faso 4,027 24 2 32 28 136 40 39 61 55 36 11 31 29
Burundi 2,219 22 1 9 11 65 56 74 83 69 39 15 45 43
Cabo Verde 106 21 2 8 22 x 92 x 24 23 88 88 115 72 – –
Cambodia 2,980 20 2 10 7 30 24 42 73 76 63 28 x 41 43
Cameroon 5,163 23 2 24 30 128 43 50 77 66 60 36 30 26
Canada 4,034 11 – – – 14 – – – – 100 105 – –
Central African Republic 1,061 23 11 55 45 229 83 79 – – 24 9 26 17
Chad 3,125 24 – 48 47 203 – 59 55 x 24 x 26 17 – 10
Chile 2,669 15 – – – 52 – – – – 98 85 – –
China 168,684 12 – 2 – 6 – – – – 104 77 – –
Colombia 8,796 18 – 14 20 85 x – – – – 101 76 – 21
Comoros 161 22 8 16 – 70 17 43 79 67 75 71 21 18
Congo 976 22 3 19 30 147 76 y 73 y 56 68 64 38 25 16
Cook Islands – – – – – 56 – – – – 99 74 – –
TABLE 11. ADOLESCENTS

STATISTICAL TABLES 97
TABLE 11. ADOLESCENTS
Costa Rica 826 17 – 15 9 67 – 3 – – 121 79 – 29
Côte d'Ivoire 4,685 23 1 21 31 125 51 51 73 62 – 31 21 15
Croatia 462 11 – – – 12 – – – – 102 95 – –
Cuba 1,408 12 – 20 9 54 – – – – 100 81 – 54
Cyprus 148 13 – – – 4 – – – – 99 93 – –
Czech Republic 969 9 – – – 11 – – – – 104 90 – – Democratic People's Republic of Korea 3,905 16 – – – 1 – – – – – – – 7
Democratic Republic of the Congo 15,819 23 – 25 25 135 – 72 55 43 55 37 – 13
Denmark 693 12 – – – 5 – – – – 118 131 – –
Djibouti 178 20 – 3 – 21 – – – – 51 35 – 16 x
Dominica – – – – – 47 x – – – – 106 91 39 49
Dominican Republic 2,000 19 – 17 25 x 96 x – 7 98 98 84 72 33 x 39 x
Ecuador 2,992 19 – 16 x – 100 x – – – – 96 77 – –
Egypt 15,338 19 – 13 7 x 50 x – 50 y – 97 y 101 71 16 x 3 x
El Salvador 1,396 22 – 21 – 63 – – – – 90 48 – –
Equatorial Guinea 159 21 5 22 42 128 x 56 57 91 91 – – 12 17
Eritrea 1,386 22 1 17 19 85 x 60 51 70 54 43 20 32 22
Estonia 127 10 – – – 16 – – – – 101 113 – –
Ethiopia 23,581 25 2 19 22 87 51 64 42 38 – – 32 24
Fiji 157 18 – – – 31 x – – – – 98 76 – –
Finland 610 11 – – – 8 – – – – 99 116 – –
France 7,785 12 – – – 9 – – – – 107 113 – –
Gabon 358 21 1 14 28 115 47 58 95 94 – – 35 29
Gambia 430 23 – 24 23 88 – 74 – – 66 48 – 33
Georgia 481 11 – 11 6 40 – 5 – – 110 81 – –
Germany 7,970 10 – – – 8 – – – – 100 104 – –
Ghana 5,659 22 1 7 16 70 x 37 53 93 87 82 40 34 35
Greece 1,055 9 – – – 10 – – – – 104 112 – –
Grenada 19 18 – – – 53 x – – – – 121 89 67 59
Guatemala 3,613 23 – 20 22 92 – – – – 71 56 24 20
Guinea 2,698 23 1 33 40 154 63 89 55 53 45 28 29 20
Guinea-Bissau 384 23 – 19 33 137 – 39 y – – – – – 12
Guyana 179 22 1 16 16 97 x 25 18 94 94 104 96 45 53
Haiti 2,255 22 2 12 13 65 22 24 85 80 – – 25 32
Holy See – – – – – – – – – – – – – –
Honduras 1,801 22 5 23 22 99 18 15 98 94 75 71 33 29
Hungary 1,021 10 – – – 18 – – – – 101 102 – –
Iceland 44 13 – – – 11 – – – – 97 117 – –
India 239,441 19 5 30 22 x 39 47 45 88 72 86 55 35 x 19 x
TAB
LE 11. AD
OLES
CEN
TS
Countries and areas
Adolescent populationAdolescents currently married/ in union (%)
2005-2013* Births by
age 18 (%)Adolescent
birth rate
Justification of wife-beating among adolescents (%)
2005-2013*
Use of mass media among adolescents (%)
2005-2013*
Lower secondary
school gross enrolment ratio
Upper secondary
school gross enrolment ratio
Comprehensive knowledge of HIV
among adolescents (%)2009-2013*
Aged 10-19 (thousands)
Proportion of total
population (%)2013 2013 male female 2009-2013* 2008-2012* male female male female 2009-2012* male female
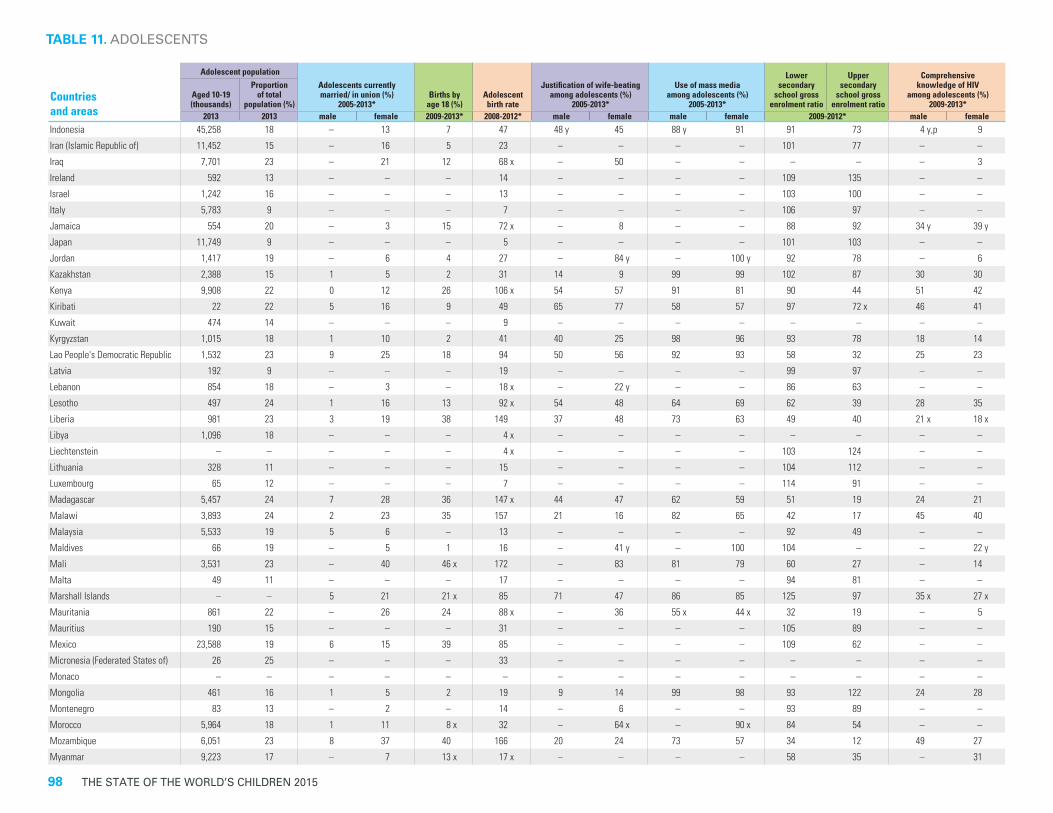
98 THE STATE OF THE WORLD’S CHILDREN 2015
Indonesia 45,258 18 – 13 7 47 48 y 45 88 y 91 91 73 4 y,p 9
Iran (Islamic Republic of) 11,452 15 – 16 5 23 – – – – 101 77 – –
Iraq 7,701 23 – 21 12 68 x – 50 – – – – – 3
Ireland 592 13 – – – 14 – – – – 109 135 – –
Israel 1,242 16 – – – 13 – – – – 103 100 – –
Italy 5,783 9 – – – 7 – – – – 106 97 – –
Jamaica 554 20 – 3 15 72 x – 8 – – 88 92 34 y 39 y
Japan 11,749 9 – – – 5 – – – – 101 103 – –
Jordan 1,417 19 – 6 4 27 – 84 y – 100 y 92 78 – 6
Kazakhstan 2,388 15 1 5 2 31 14 9 99 99 102 87 30 30
Kenya 9,908 22 0 12 26 106 x 54 57 91 81 90 44 51 42
Kiribati 22 22 5 16 9 49 65 77 58 57 97 72 x 46 41
Kuwait 474 14 – – – 9 – – – – – – – –
Kyrgyzstan 1,015 18 1 10 2 41 40 25 98 96 93 78 18 14
Lao People's Democratic Republic 1,532 23 9 25 18 94 50 56 92 93 58 32 25 23
Latvia 192 9 – – – 19 – – – – 99 97 – –
Lebanon 854 18 – 3 – 18 x – 22 y – – 86 63 – –
Lesotho 497 24 1 16 13 92 x 54 48 64 69 62 39 28 35
Liberia 981 23 3 19 38 149 37 48 73 63 49 40 21 x 18 x
Libya 1,096 18 – – – 4 x – – – – – – – –
Liechtenstein – – – – – 4 x – – – – 103 124 – –
Lithuania 328 11 – – – 15 – – – – 104 112 – –
Luxembourg 65 12 – – – 7 – – – – 114 91 – –
Madagascar 5,457 24 7 28 36 147 x 44 47 62 59 51 19 24 21
Malawi 3,893 24 2 23 35 157 21 16 82 65 42 17 45 40
Malaysia 5,533 19 5 6 – 13 – – – – 92 49 – –
Maldives 66 19 – 5 1 16 – 41 y – 100 104 – – 22 y
Mali 3,531 23 – 40 46 x 172 – 83 81 79 60 27 – 14
Malta 49 11 – – – 17 – – – – 94 81 – –
Marshall Islands – – 5 21 21 x 85 71 47 86 85 125 97 35 x 27 x
Mauritania 861 22 – 26 24 88 x – 36 55 x 44 x 32 19 – 5
Mauritius 190 15 – – – 31 – – – – 105 89 – –
Mexico 23,588 19 6 15 39 85 – – – – 109 62 – –
Micronesia (Federated States of) 26 25 – – – 33 – – – – – – – –
Monaco – – – – – – – – – – – – – –
Mongolia 461 16 1 5 2 19 9 14 99 98 93 122 24 28
Montenegro 83 13 – 2 – 14 – 6 – – 93 89 – –
Morocco 5,964 18 1 11 8 x 32 – 64 x – 90 x 84 54 – –
Mozambique 6,051 23 8 37 40 166 20 24 73 57 34 12 49 27
Myanmar 9,223 17 – 7 13 x 17 x – – – – 58 35 – 31
TABLE 11. ADOLESCENTS
Countries and areas
Adolescent populationAdolescents currently married/ in union (%)
2005-2013* Births by
age 18 (%)Adolescent
birth rate
Justification of wife-beating among adolescents (%)
2005-2013*
Use of mass media among adolescents (%)
2005-2013*
Lower secondary
school gross enrolment ratio
Upper secondary
school gross enrolment ratio
Comprehensive knowledge of HIV
among adolescents (%)2009-2013*
Aged 10-19 (thousands)
Proportion of total
population (%)2013 2013 male female 2009-2013* 2008-2012* male female male female 2009-2012* male female

STATISTICAL TABLES 99
TABLE 11. ADOLESCENTS
Namibia 533 23 0 5 17 x 74 x 44 38 86 88 – – 59 x 62 x
Nauru – – 9 18 22 x 81 – – 89 86 78 58 8 x 8 x
Nepal 6,452 23 7 29 19 87 27 24 86 76 88 47 33 25
Netherlands 2,007 12 – – – 5 – – – – 137 123 – –
New Zealand 601 13 – – – 25 – – – – 105 138 – –
Nicaragua 1,309 22 – 24 28 x 92 – 19 y – 95 x 79 54 – –
Niger 4,138 23 3 61 48 206 41 54 35 44 22 7 21 12
Nigeria 38,841 22 1 29 29 122 25 33 54 50 46 41 29 22
Niue – – – – – 16 – – – – – – – –
Norway 641 13 – – – 7 – – – – 99 123 – –
Oman 559 15 – – – 12 – – – – 98 97 – –
Pakistan 39,831 22 2 14 8 48 33 y 53 y 59 y 49 y 49 27 5 y,p 1 y
Palau – – – – – 27 – – – – – – – –
Panama 699 18 – – – 81 – – – – 89 79 – –
Papua New Guinea 1,639 22 3 15 14 x 65 x – – – – 73 22 – –
Paraguay 1,403 21 – 11 x – 63 x – – – – 80 59 – –
Peru 5,804 19 – 11 15 67 – – – 92 100 74 – 21
Philippines 21,111 21 – 10 8 53 x – 15 – 94 87 76 – 19 x
Poland 3,979 10 – – – 14 – – – – 98 97 – –
Portugal 1,095 10 – – – 13 – – – – 119 106 – –
Qatar 183 8 – – – 20 – – – – 101 102 – –
Republic of Korea 6,138 12 – – – 2 – – – – 100 95 – –
Republic of Moldova 396 11 1 10 4 26 14 13 99 98 88 90 – –
Romania 2,203 10 – – – 35 – – – – 92 98 – –
Russian Federation 13,764 10 – – – 26 – – – – 94 98 – –
Rwanda 2,876 24 – 4 5 41 35 56 88 73 37 25 44 49
Saint Kitts and Nevis – – – – – 75 x – – – – 99 87 55 54
Saint Lucia 32 17 – 4 – 50 x – 15 – 99 91 91 – 58
Saint Vincent and the Grenadines 20 18 – – – 70 – – – – 110 88 – –
Samoa 42 22 1 7 5 39 50 58 97 97 103 78 5 2
San Marino – – – – – 1 – – – – 94 95 – –
Sao Tome and Principe 41 21 1 20 25 110 x 25 23 96 95 101 26 39 39
Saudi Arabia 4,714 16 – – – 7 x – – – – 118 110 – –
Senegal 3,244 23 1 24 18 80 31 61 86 81 40 x 17 x 28 26
Serbia 1,154 12 1 5 3 19 6 2 99 100 98 86 43 53
Seychelles 14 15 – – – 70 – – – – 102 100 – –
Sierra Leone 1,393 23 – 23 38 125 – 63 66 51 66 – – 23
Singapore 697 13 – – – 3 – – – – – – – –
Slovakia 572 11 – – – 23 – – – – 98 90 – –
Slovenia 189 9 – – – 5 – – – – 95 99 – –
TAB
LE 11. AD
OLES
CEN
TS
Countries and areas
Adolescent populationAdolescents currently married/ in union (%)
2005-2013* Births by
age 18 (%)Adolescent
birth rate
Justification of wife-beating among adolescents (%)
2005-2013*
Use of mass media among adolescents (%)
2005-2013*
Lower secondary
school gross enrolment ratio
Upper secondary
school gross enrolment ratio
Comprehensive knowledge of HIV
among adolescents (%)2009-2013*
Aged 10-19 (thousands)
Proportion of total
population (%)2013 2013 male female 2009-2013* 2008-2012* male female male female 2009-2012* male female

100 THE STATE OF THE WORLD’S CHILDREN 2015
TABLE 11. ADOLESCENTS
Solomon Islands 127 23 0 13 15 x 62 73 72 71 54 72 29 26 x 29 x
Somalia 2,521 24 – 25 – 123 x – 75 y – – – – – 3 x
South Africa 9,555 18 2 x 4 x 15 x 54 x – – – – 111 96 – –
South Sudan 2,644 23 – 40 28 38 – 72 – – 17 – – 8
Spain 4,330 9 – – – 10 – – – – 123 146 – –
Sri Lanka 3,262 15 – 9 4 x 24 x – 54 y – 88 y 99 100 – –
State of Palestine 1,069 25 – 12 17 67 – – – – 86 73 – 5
Sudan 8,731 23 – 24 14 102 – 52 – – 49 28 10 4
Suriname 99 18 – 12 – 66 x – 19 – 99 90 79 – 40
Swaziland 297 24 0 4 22 89 34 42 94 89 69 47 52 56
Sweden 1,060 11 – – – 6 – – – – 100 97 – –
Switzerland 856 11 – – – 3 – – – – 110 87 – –
Syrian Arab Republic 4,772 22 – 10 9 x 75 x – – – – 93 41 – 6 x
Tajikistan 1,698 21 – 13 2 47 – 47 – 89 95 67 – 7
Thailand 8,941 13 – 16 13 43 x – 10 – – 99 76 – 57 The former Yugoslav Republic of Macedonia 265 13 – 4 2 60 – 14 – – 89 77 – 23 x
Timor-Leste 316 28 0 8 9 54 x 72 81 61 62 62 50 15 11
Togo 1,532 22 0 12 17 88 – 41 – – 68 36 36 33
Tonga 24 22 – – – 30 – – – – – – – –
Trinidad and Tobago 175 13 – 6 – 36 x – 10 – – 97 – – 49 x
Tunisia 1,654 15 – 1 1 7 – 27 – 98 116 75 – 15
Turkey 12,886 17 – 10 8 x 32 – 30 y – – 101 75 – –
Turkmenistan 978 19 – – 2 x 21 x – – – 96 x – – – –
Tuvalu – – 2 8 3 x 42 x 83 69 89 95 – – 57 x 31 x
Uganda 9,201 24 2 20 33 146 52 62 88 82 34 15 36 36
Ukraine 4,198 9 0 7 4 28 2 2 97 96 99 95 37 43
United Arab Emirates 766 8 – – – 34 – – – – – – – –
United Kingdom 7,196 11 – – – 22 – – – – 106 88 – –
United Republic of Tanzania 11,170 23 4 18 28 128 x 39 52 79 70 46 10 42 37
United States 42,854 13 – – – 34 – – – – 98 89 – –
Uruguay 516 15 – – – 60 x – – – – 110 71 – –
Uzbekistan 5,560 19 – 5 2 x 26 x 63 x 63 x – – 95 129 – 27 x
Vanuatu 53 21 4 11 13 66 63 56 58 58 67 47 – 14 x
Venezuela (Bolivarian Republic of) 5,562 18 – 16 x – 101 – – – – 92 76 – –
Viet Nam 14,307 16 – 8 3 38 – 35 97 94 92 – – 51
Yemen 6,057 25 – 13 – 80 x – – – – 57 37 – 2 x,y
Zambia 3,475 24 1 18 34 x 151 x 55 61 80 71 68 – 38 36
Zimbabwe 3,357 24 1 23 21 112 48 48 59 53 – – 42 46
Countries and areas
Adolescent populationAdolescents currently married/ in union (%)
2005-2013* Births by
age 18 (%)Adolescent
birth rate
Justification of wife-beating among adolescents (%)
2005-2013*
Use of mass media among adolescents (%)
2005-2013*
Lower secondary
school gross enrolment ratio
Upper secondary
school gross enrolment ratio
Comprehensive knowledge of HIV
among adolescents (%)2009-2013*
Aged 10-19 (thousands)
Proportion of total
population (%)2013 2013 male female 2009-2013* 2008-2012* male female male female 2009-2012* male female

STATISTICAL TABLES 101
TABLE 11. ADOLESCENTS
SUMMARY
Sub-Saharan Africa 215,007 23 2 24 27 124 40 52 65 58 49 32 32 25
Eastern and Southern Africa 104,492 23 3 20 26 113 46 55 69 61 51 30 38 32
West and Central Africa 101,606 23 1 28 29 133 34 50 61 56 48 34 29 21
Middle East and North Africa 79,366 18 – 14 7 – – 53 – – 92 62 – –
South Asia 329,532 20 4 29 22 51 45 45 84 67 80 50 30 15
East Asia and Pacific 291,246 14 – 6 7 ** 16 – 33 ** 89 ** 91 ** 96 71 – 26 **
Latin America and Caribbean 111,311 18 3 11 – 74 – – – – 98 76 – –
CEE/CIS 52,054 13 – 8 – 30 – 21 – – 96 90 – –
Least developed countries 204,418 23 3 26 29 119 – 52 66 59 52 29 32 22
World 1,184,507 17 3 ** 16 20 ** 50 37 ** 36 ** 86 ** 81 ** 85 62 29 ** 20 **
DEFINITIONS OF THE INDICATORS
Adolescents currently married/ in union – Percentage of boys and girls aged 15–19 who are currently married or in union. This indicator is meant to provide a snapshot of the current marital status of boys and girls in this age group. However, it is worth noting that those not married at the time of the survey are still exposed to the risk of marrying before they exit adolescence.Births by age 18 – Percentage of women aged 20–24 who gave birth before age 18. This standardized indicator from population-based surveys captures levels of fertility among adolescents up to the age of 18. Note that the data are based on the answers of women aged 20–24, whose risk of giving birth before the age of 18 is behind them.Adolescent birth rate – Number of births per 1,000 adolescent girls aged 15–19.Justification of wife-beating among adolescents – The percentage of boys and girls aged 15–19 who consider a husband to be justified in hitting or beating his wife for at least one of the specified reasons: if his wife burns the food, argues with him, goes out without telling him, neglects the children or refuses sexual relations.Use of mass media among adolescents – The percentage of boys and girls aged 15–19 who make use of at least one of the following types of information media at least once a week: newspaper, magazine, television or radio.Lower secondary school gross enrolment ratio – Number of children enrolled in lower secondary school, regardless of age, expressed as a percentage of the total number of children of official lower secondary school age.Upper secondary school gross enrolment ratio – Number of children enrolled in upper secondary school, regardless of age, expressed as a percentage of the total number of children of official upper secondary school age.Comprehensive knowledge of HIV among adolescents – Percentage of young men and women aged 15–19 who correctly identify the two major ways of preventing the sexual transmission of HIV (using condoms and limiting sex to one faithful, uninfected partner), who reject the two most common local misconceptions about HIV transmission and who know that a healthy-looking person can be HIV-positive.
MAIN DATA SOURCES
NOTES
Adolescent population – United Nations Population Division.Adolescents currently married/ in union – Demographic and Health Surveys (DHS), Multiple Indicator Cluster Surveys (MICS) and other national surveys.Births by age 18 – DHS, MICS and other national surveys.Adolescent birth rate – United Nations Population Division.Justification of wife-beating among adolescents – DHS, MICS and other national surveys.Use of mass media among adolescents – AIDS Indicator Surveys (AIS), DHS, MICS and other national surveys.Gross enrolment ratio – UNESCO Institute for Statistics (UIS).Comprehensive knowledge of HIV among adolescents – AIS, DHS, MICS, and other national household surveys; HIV/AIDS Survey Indicators Database, <www.measuredhs.com/hivdata>.
– Data not available.x Data refer to years or periods other than those specified in the column heading. Such data are not included in the calculation of
regional and global averages, with the exception of 2005-2006 data from India. Estimates from data years prior to 2000 are not displayed.
y Data differ from the standard definition or refer to only part of a country. If they fall within the noted reference period, such data are included in the calculation of regional and global averages.
p Based on small denominators (typically 25-49 unweighted cases).* Data refer to the most recent year available during the period specified in the column heading.** Excludes China.
TAB
LE 11. AD
OLES
CEN
TS
For a complete list of countries and areas in the regions, subregions and country categories, see page 32 or visit http://data.unicef.org/index.php?section=regional-classifications.It is not advisable to compare data from consecutive editions of The State of the World’s Children.
Countries and areas
Adolescent populationAdolescents currently married/ in union (%)
2005-2013* Births by
age 18 (%)Adolescent
birth rate
Justification of wife-beating among adolescents (%)
2005-2013*
Use of mass media among adolescents (%)
2005-2013*
Lower secondary
school gross enrolment ratio
Upper secondary
school gross enrolment ratio
Comprehensive knowledge of HIV
among adolescents (%)2009-2013*
Aged 10-19 (thousands)
Proportion of total
population (%)2013 2013 male female 2009-2013* 2008-2012* male female male female 2009-2012* male female

102 THE STATE OF THE WORLD’S CHILDREN 2015
Countries and areas
Birth registration (%)++
2005–2013*Skilled attendant at birth (%)
2009–2013*
Underweight prevalence in children under 5 (%)
2009–2013*
Diarrhoea treatment with oral rehydration salts (ORS) (%)
2009-2013*
Primary school net attendance ratio
2008-2013*
Comprehensive knowledge of HIV/AIDS (%)
Females 15-242009-2013*
Use of improved sanitation facilities (%)
2012
urban rural
ratio of urban to
rural urban rural
ratio of urban to
rural urban rural
ratio of rural to urban urban rural
ratio of urban to
rural urban rural
ratio of urban to
rural urban rural
ratio of urban to
rural urban rural
ratio of urban to
ruralAfghanistan 60 33 1.8 74 31 2.4 – – – 48 54 0.9 78 y 54 y 1.4 y 5 1 4.9 47 23 2.0Albania 99 98 1.0 100 99 1.0 5 7 1.4 – – – 90 91 1.0 51 26 2.0 95 86 1.1Algeria 100 99 1.0 98 95 1.0 3 x 4 x 1.3 x 34 33 1.0 98 x 95 x 1.0 x 16 x 10 x 1.7 x 98 88 1.1Andorra – – – – – – – – – – – – – – – – – – 100 100 1.0Angola 40 x 26 x 1.5 x 71 x 26 x 2.8 x 14 x 18 x 1.3 x – – – 85 67 1.3 – – – 87 20 4.3Antigua and Barbuda – – – – – – – – – – – – – – – – – – – – –Argentina – – – – – – – – – – – – – – – – – – 97 99 1.0Armenia 99 100 1.0 100 99 1.0 3 8 2.4 – – – 97 y 98 y 1.0 y 16 16 1.0 96 81 1.2Australia – – – – – – – – – – – – – – – – – – 100 100 1.0Austria – – – – – – – – – – – – – – – – – – 100 100 1.0Azerbaijan 96 92 1.0 97 x 80 x 1.2 x 5 x 12 x 2.6 x – – – 74 x 72 x 1.0 x 7 x 2 x 3.3 x 86 78 1.1Bahamas – – – – – – – – – – – – – – – – – – – – –Bahrain – – – – – – – – – – – – – – – – – – – – –Bangladesh 35 29 1.2 55 28 2.0 28 39 1.4 84 76 1.1 77 80 1.0 – – – 55 58 1.0Barbados – – – – – – – – – – – – – – – – – – – – –Belarus – – – 100 100 1.0 1 x 2 x 1.5 x – – – 91 93 1.0 56 57 1.0 94 95 1.0Belgium – – – – – – – – – – – – – – – – – – 100 100 1.0Belize 95 96 1.0 98 95 1.0 5 7 1.2 – – – 98 92 1.1 55 33 1.7 94 88 1.1Benin 87 76 1.1 90 75 1.2 16 x 22 x 1.4 x 54 47 1.1 84 72 1.2 29 20 1.5 25 5 5.0Bhutan 100 100 1.0 90 54 1.6 10 14 1.3 64 60 1.1 98 94 1.0 32 15 2.1 75 31 2.4Bolivia (Plurinational State of) 79 y 72 y 1.1 y 94 67 1.4 3 x 6 x 2.3 x 38 x 32 x 1.2 x 98 96 1.0 32 x 9 x 3.5 x 57 24 2.4Bosnia and Herzegovina 99 100 1.0 100 100 1.0 2 1 0.7 – – – 97 98 1.0 50 47 1.1 99 92 1.1Botswana 78 67 1.2 99 x 90 x 1.1 x 10 x 11 x 1.1 x 47 x 51 x 0.9 x 89 x 85 x 1.0 x – – – 78 42 1.9Brazil – – – 98 x 94 x 1.0 x 2 x 2 x 0.9 x – – – – – – – – – 87 49 1.8Brunei Darussalam – – – – – – – – – – – – – – – – – – – – –Bulgaria – – – – – – 2 x 1 x 0.6 x – – – – – – – – – 100 100 1.0Burkina Faso 93 74 1.3 93 61 1.5 19 28 1.5 31 19 1.6 83 45 1.8 – – – 50 7 7.5Burundi 87 74 1.2 88 58 1.5 19 30 1.6 33 38 0.9 91 84 1.1 59 43 1.4 43 48 0.9Cabo Verde – – – 91 x 64 x 1.4 x – – – – – – – – – – – – 75 47 1.6Cambodia 74 60 1.2 95 67 1.4 20 31 1.5 33 34 1.0 96 93 1.0 55 41 1.3 82 25 3.2Cameroon 81 48 1.7 87 47 1.9 8 21 2.8 27 12 2.2 94 78 1.2 37 18 2.1 62 27 2.3Canada – – – – – – – – – – – – – – – – – – 100 99 1.0Central African Republic 78 52 1.5 83 38 2.2 23 24 1.0 23 12 2.0 86 66 1.3 19 16 1.2 44 7 6.0Chad 42 9 4.9 60 12 5.1 22 33 1.5 27 10 2.8 71 47 1.5 18 7 2.6 31 6 4.9Chile – – – 100 x 99 x 1.0 x – – – – – – 91 y 92 y 1.0 y – – – 100 89 1.1China – – – 100 100 1.0 1 4 3.4 – – – 97 y 96 y 1.0 y – – – 74 56 1.3Colombia 97 95 1.0 98 86 1.1 3 5 1.6 57 49 1.2 91 91 1.0 26 17 1.5 85 66 1.3Comoros 90 87 1.0 92 79 1.2 14 18 1.3 40 37 1.1 41 x 29 x 1.4 x 24 17 1.4 – – –Congo 95 85 1.1 98 84 1.2 9 16 1.7 31 22 1.4 92 y 92 y 1.0 y 16 10 1.5 20 6 3.5Cook Islands – – – – – – – – – – – – – – – – – – – – –
TABLE 12. DISPARITIES BY RESIDENCE

STATISTICAL TABLES 103
TABLE 12. DISPARITIES BY RESIDENCE
Costa Rica 100 99 1.0 99 97 1.0 1 2 1.7 43 35 1.2 97 95 1.0 37 27 1.4 95 92 1.0Côte d'Ivoire 85 54 1.6 84 45 1.9 12 18 1.4 22 14 1.5 73 y 65 y 1.1 y 22 8 2.7 33 10 3.3Croatia – – – – – – – – – – – – – – – – – – 99 98 1.0Cuba 100 y 100 y 1.0 y – – – – – – 54 37 1.4 – – – 55 49 1.1 94 88 1.1Cyprus – – – – – – – – – – – – – – – – – – 100 100 1.0Czech Republic – – – – – – – – – – – – – – – – – – 100 100 1.0Democratic People's Republic of Korea 100 100 1.0 100 100 1.0 13 27 2.0 75 73 1.0 100 99 1.0 11 4 2.8 88 73 1.2
Democratic Republic of the Congo 24 29 0.8 96 75 1.3 17 27 1.6 26 27 1.0 86 70 1.2 21 12 1.7 29 33 0.9Denmark – – – – – – – – – – – – – – – – – – 100 100 1.0Djibouti 92 84 1.1 98 55 1.8 26 40 1.5 – – – – – – 18 x 9 x 2.0 x 73 22 3.4Dominica – – – – – – – – – – – – – – – – – – – – –Dominican Republic – – – 99 97 1.0 3 x 4 x 1.2 x 48 48 1.0 95 y 95 y 1.0 y 42 x 37 x 1.2 x 86 74 1.2Ecuador 89 92 1.0 98 x 99 x 1.0 x 5 x 8 x 1.7 x – – – 97 y 96 y 1.0 y – – – 86 76 1.1Egypt 99 y 99 y 1.0 y 90 x 72 x 1.2 x 7 x 7 x 1.0 x 28 x 29 x 1.0 x 90 y 87 y 1.0 y 7 x 3 x 2.3 x 98 94 1.0El Salvador 99 99 1.0 97 x 94 x 1.0 x 4 x 9 x 1.9 x 60 x 56 x 1.1 x – – – – – – 80 53 1.5Equatorial Guinea 60 47 1.3 86 53 1.6 5 6 1.3 55 27 2.0 – – – 27 9 2.9 – – –Eritrea – – – 74 17 4.4 27 44 1.7 51 41 1.2 79 y 47 y 1.7 y 32 20 1.7 – 4 –Estonia – – – – – – – – – – – – – – – – – – 96 94 1.0Ethiopia 29 5 5.9 51 4 12.7 17 31 1.8 45 24 1.9 86 61 1.4 38 19 2.0 27 23 1.2Fiji – – – – – – 5 x 5 x 1.1 x – – – – – – – – – 92 82 1.1Finland – – – – – – – – – – – – – – – – – – 100 100 1.0France – – – – – – – – – – – – – – – – – – 100 100 1.0Gabon 89 91 1.0 93 69 1.3 6 9 1.5 27 21 1.3 87 y 89 y 1.0 y 32 15 2.2 43 32 1.3Gambia 54 52 1.0 77 41 1.9 12 21 1.8 39 39 1.0 75 54 1.4 41 24 1.7 64 55 1.2Georgia 100 100 1.0 99 x 98 x 1.0 x 1 1 1.6 44 x 36 x 1.2 x 97 95 1.0 – – – 96 91 1.1Germany – – – – – – – – – – – – – – – – – – 100 100 1.0Ghana 72 55 1.3 88 54 1.6 11 16 1.5 37 34 1.1 80 68 1.2 42 30 1.4 20 8 2.4Greece – – – – – – – – – – – – – – – – – – 99 97 1.0Grenada – – – – – – – – – – – – – – – – – – – – –Guatemala 96 97 1.0 77 37 2.1 8 16 1.9 38 37 1.0 – – – 32 14 2.2 88 72 1.2Guinea 83 49 1.7 84 32 2.7 11 22 2.0 46 30 1.5 84 47 1.8 32 16 2.0 33 11 2.9Guinea-Bissau 30 21 1.4 69 29 2.4 13 21 1.6 28 13 2.1 84 57 1.5 22 8 2.8 34 8 3.9Guyana 91 87 1.0 98 90 1.1 8 12 1.6 – – – 96 94 1.0 72 47 1.5 88 82 1.1Haiti 85 77 1.1 59 25 2.4 9 13 1.5 56 51 1.1 86 y 73 y 1.2 y 41 29 1.4 31 16 1.9Holy See – – – – – – – – – – – – – – – – – – – – –Honduras 95 93 1.0 94 73 1.3 5 9 1.9 59 61 1.0 94 y 92 y 1.0 y 42 23 1.9 85 74 1.2Hungary – – – – – – – – – – – – – – – – – – 100 100 1.0Iceland – – – – – – – – – – – – – – – – – – 100 100 1.0India – – – 76 x 43 x 1.7 x 34 x 47 x 1.4 x 33 x 24 x 1.4 x 88 x 82 x 1.1 x 33 x 14 x 2.4 x 60 25 2.4
Countries and areas
Birth registration (%)++
2005–2013*Skilled attendant at birth (%)
2009–2013*
Underweight prevalence in children under 5 (%)
2009–2013*
Diarrhoea treatment with oral rehydration salts (ORS) (%)
2009-2013*
Primary school net attendance ratio
2008-2013*
Comprehensive knowledge of HIV/AIDS (%)
Females 15-242009-2013*
Use of improved sanitation facilities (%)
2012
urban rural
ratio of urban to
rural urban rural
ratio of urban to
rural urban rural
ratio of rural to urban urban rural
ratio of urban to
rural urban rural
ratio of urban to
rural urban rural
ratio of urban to
rural urban rural
ratio of urban to
rural
TAB
LE 12. DIS
PAR
ITIES BY
RES
IDEN
CE

104 THE STATE OF THE WORLD’S CHILDREN 2015
TABLE 12. DISPARITIES BY RESIDENCE
Indonesia 76 58 1.3 92 75 1.2 17 23 1.4 41 37 1.1 95 94 1.0 14 x,y 9 x,y 1.6 x,y 71 46 1.6Iran (Islamic Republic of) 99 y 98 y 1.0 y 98 93 1.1 – – – 64 58 1.1 97 95 1.0 – – – 93 82 1.1Iraq 99 99 1.0 94 85 1.1 8 9 1.0 25 19 1.3 94 84 1.1 4 1 3.7 86 82 1.1Ireland – – – – – – – – – – – – – – – – – – 100 98 1.0Israel – – – – – – – – – – – – – – – – – – 100 100 1.0Italy – – – – – – – – – – – – – – – – – – – – –Jamaica 98 98 1.0 100 98 1.0 5 3 0.5 – – – 98 98 1.0 – – – 78 82 1.0Japan – – – – – – – – – – – – – – – – – – 100 100 1.0Jordan 99 100 1.0 100 100 1.0 3 2 0.7 20 23 0.9 98 98 1.0 8 11 0.7 98 98 1.0Kazakhstan 100 100 1.0 100 100 1.0 4 3 0.8 – – – 99 99 1.0 40 31 1.3 97 98 1.0Kenya 76 57 1.3 75 37 2.0 11 18 1.6 40 39 1.0 94 86 1.1 57 45 1.3 31 29 1.1Kiribati 95 93 1.0 84 77 1.1 – – – – – – – – – 45 43 1.1 51 31 1.7Kuwait – – – – – – – – – – – – – – – – – – 100 100 1.0Kyrgyzstan 99 98 1.0 100 99 1.0 4 4 1.0 – – – 98 99 1.0 26 16 1.7 92 92 1.0Lao People's Democratic Republic 88 71 1.2 80 31 2.6 16 29 1.8 65 40 1.6 95 83 1.1 39 18 2.2 90 50 1.8Latvia – – – – – – – – – – – – – – – – – – – – –Lebanon – – – – – – – – – – – – – – – – – – 100 – –Lesotho 43 46 1.0 88 54 1.6 13 14 1.0 57 50 1.1 93 88 1.0 44 36 1.2 37 27 1.4Liberia 5 y 3 y 1.9 y 79 x 32 x 2.4 x 18 x 21 x 1.2 x 57 x 52 x 1.1 x 56 x 22 x 2.6 x 26 x 15 x 1.8 x 28 6 4.8Libya – – – – – – – – – – – – – – – – – – 97 96 1.0Liechtenstein – – – – – – – – – – – – – – – – – – – – –Lithuania – – – – – – – – – – – – – – – – – – 99 85 1.2Luxembourg – – – – – – – – – – – – – – – – – – 100 100 1.0Madagascar 97 81 1.2 78 39 2.0 31 x 38 x 1.2 x 16 14 1.1 86 y 66 y 1.3 y 44 18 2.5 19 11 1.7Malawi – – – 84 69 1.2 11 14 1.3 72 69 1.0 93 84 1.1 56 38 1.5 22 8 2.8Malaysia – – – – – – – – – – – – – – – – – – 96 95 1.0Maldives 93 92 1.0 99 93 1.1 12 20 1.7 – – – 94 94 1.0 43 y 32 y 1.4 y 97 100 1.0Mali 92 77 1.2 86 47 1.8 21 x 31 x 1.5 x 17 10 1.8 80 50 1.6 19 12 1.5 35 15 2.4Malta – – – – – – – – – – – – – – – – – – 100 100 1.0Marshall Islands 96 96 1.0 97 x 68 x 1.4 x – – – 39 x 37 x 1.1 x – – – 33 x 12 x 2.7 x 84 56 1.5Mauritania 75 49 1.5 88 49 1.8 16 30 1.8 26 14 2.0 72 55 1.3 9 4 2.7 51 9 5.5Mauritius – – – – – – – – – – – – – – – – – – 92 90 1.0Mexico 98 y 82 y 1.2 y 98 87 1.1 2 5 2.1 54 48 1.1 – – – – – – 87 79 1.1Micronesia (Federated States of) – – – – – – – – – – – – – – – – – – 85 49 1.7Monaco – – – – – – – – – – – – – – – – – – 100 – –Mongolia 99 99 1.0 99 98 1.0 3 7 2.6 35 26 1.4 97 94 1.0 36 21 1.7 65 35 1.8Montenegro 99 99 1.0 100 x 98 x 1.0 x 2 x 2 x 0.8 x – – – 97 x 98 x 1.0 x – – – 92 87 1.1Morocco 97 y 91 y 1.1 y 92 55 1.7 2 4 2.5 23 21 1.1 96 x 83 x 1.2 x – – – 85 63 1.3Mozambique 51 47 1.1 80 44 1.8 11 18 1.7 65 50 1.3 86 y 74 y 1.2 y 40 24 1.6 44 11 4.1Myanmar 94 64 1.5 90 63 1.4 19 24 1.3 72 56 1.3 93 89 1.0 – – – 84 74 1.1
Countries and areas
Birth registration (%)++
2005–2013*Skilled attendant at birth (%)
2009–2013*
Underweight prevalence in children under 5 (%)
2009–2013*
Diarrhoea treatment with oral rehydration salts (ORS) (%)
2009-2013*
Primary school net attendance ratio
2008-2013*
Comprehensive knowledge of HIV/AIDS (%)
Females 15-242009-2013*
Use of improved sanitation facilities (%)
2012
urban rural
ratio of urban to
rural urban rural
ratio of urban to
rural urban rural
ratio of rural to urban urban rural
ratio of urban to
rural urban rural
ratio of urban to
rural urban rural
ratio of urban to
rural urban rural
ratio of urban to
rural
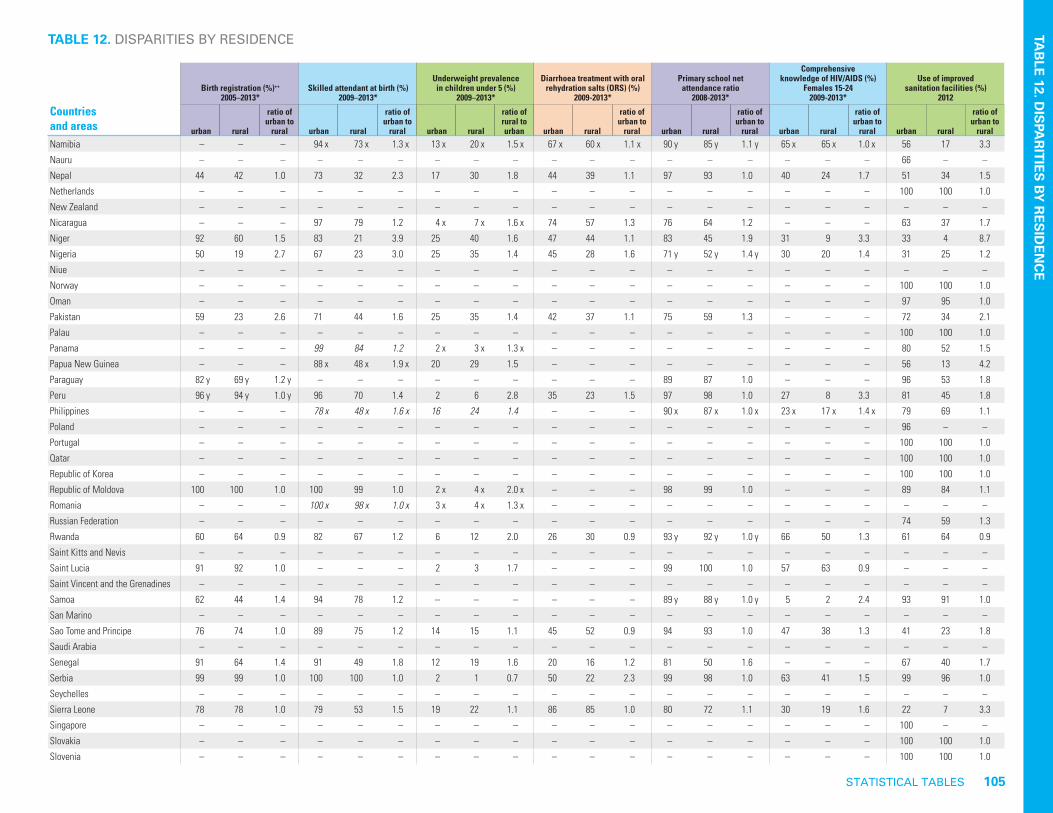
STATISTICAL TABLES 105
TABLE 12. DISPARITIES BY RESIDENCE
Namibia – – – 94 x 73 x 1.3 x 13 x 20 x 1.5 x 67 x 60 x 1.1 x 90 y 85 y 1.1 y 65 x 65 x 1.0 x 56 17 3.3Nauru – – – – – – – – – – – – – – – – – – 66 – –Nepal 44 42 1.0 73 32 2.3 17 30 1.8 44 39 1.1 97 93 1.0 40 24 1.7 51 34 1.5Netherlands – – – – – – – – – – – – – – – – – – 100 100 1.0New Zealand – – – – – – – – – – – – – – – – – – – – –Nicaragua – – – 97 79 1.2 4 x 7 x 1.6 x 74 57 1.3 76 64 1.2 – – – 63 37 1.7Niger 92 60 1.5 83 21 3.9 25 40 1.6 47 44 1.1 83 45 1.9 31 9 3.3 33 4 8.7Nigeria 50 19 2.7 67 23 3.0 25 35 1.4 45 28 1.6 71 y 52 y 1.4 y 30 20 1.4 31 25 1.2Niue – – – – – – – – – – – – – – – – – – – – –Norway – – – – – – – – – – – – – – – – – – 100 100 1.0Oman – – – – – – – – – – – – – – – – – – 97 95 1.0Pakistan 59 23 2.6 71 44 1.6 25 35 1.4 42 37 1.1 75 59 1.3 – – – 72 34 2.1Palau – – – – – – – – – – – – – – – – – – 100 100 1.0Panama – – – 99 84 1.2 2 x 3 x 1.3 x – – – – – – – – – 80 52 1.5Papua New Guinea – – – 88 x 48 x 1.9 x 20 29 1.5 – – – – – – – – – 56 13 4.2Paraguay 82 y 69 y 1.2 y – – – – – – – – – 89 87 1.0 – – – 96 53 1.8Peru 96 y 94 y 1.0 y 96 70 1.4 2 6 2.8 35 23 1.5 97 98 1.0 27 8 3.3 81 45 1.8Philippines – – – 78 x 48 x 1.6 x 16 24 1.4 – – – 90 x 87 x 1.0 x 23 x 17 x 1.4 x 79 69 1.1Poland – – – – – – – – – – – – – – – – – – 96 – –Portugal – – – – – – – – – – – – – – – – – – 100 100 1.0Qatar – – – – – – – – – – – – – – – – – – 100 100 1.0Republic of Korea – – – – – – – – – – – – – – – – – – 100 100 1.0Republic of Moldova 100 100 1.0 100 99 1.0 2 x 4 x 2.0 x – – – 98 99 1.0 – – – 89 84 1.1Romania – – – 100 x 98 x 1.0 x 3 x 4 x 1.3 x – – – – – – – – – – – –Russian Federation – – – – – – – – – – – – – – – – – – 74 59 1.3Rwanda 60 64 0.9 82 67 1.2 6 12 2.0 26 30 0.9 93 y 92 y 1.0 y 66 50 1.3 61 64 0.9Saint Kitts and Nevis – – – – – – – – – – – – – – – – – – – – –Saint Lucia 91 92 1.0 – – – 2 3 1.7 – – – 99 100 1.0 57 63 0.9 – – –Saint Vincent and the Grenadines – – – – – – – – – – – – – – – – – – – – –Samoa 62 44 1.4 94 78 1.2 – – – – – – 89 y 88 y 1.0 y 5 2 2.4 93 91 1.0San Marino – – – – – – – – – – – – – – – – – – – – –Sao Tome and Principe 76 74 1.0 89 75 1.2 14 15 1.1 45 52 0.9 94 93 1.0 47 38 1.3 41 23 1.8Saudi Arabia – – – – – – – – – – – – – – – – – – – – –Senegal 91 64 1.4 91 49 1.8 12 19 1.6 20 16 1.2 81 50 1.6 – – – 67 40 1.7Serbia 99 99 1.0 100 100 1.0 2 1 0.7 50 22 2.3 99 98 1.0 63 41 1.5 99 96 1.0Seychelles – – – – – – – – – – – – – – – – – – – – –Sierra Leone 78 78 1.0 79 53 1.5 19 22 1.1 86 85 1.0 80 72 1.1 30 19 1.6 22 7 3.3Singapore – – – – – – – – – – – – – – – – – – 100 – –Slovakia – – – – – – – – – – – – – – – – – – 100 100 1.0Slovenia – – – – – – – – – – – – – – – – – – 100 100 1.0
Countries and areas
Birth registration (%)++
2005–2013*Skilled attendant at birth (%)
2009–2013*
Underweight prevalence in children under 5 (%)
2009–2013*
Diarrhoea treatment with oral rehydration salts (ORS) (%)
2009-2013*
Primary school net attendance ratio
2008-2013*
Comprehensive knowledge of HIV/AIDS (%)
Females 15-242009-2013*
Use of improved sanitation facilities (%)
2012
urban rural
ratio of urban to
rural urban rural
ratio of urban to
rural urban rural
ratio of rural to urban urban rural
ratio of urban to
rural urban rural
ratio of urban to
rural urban rural
ratio of urban to
rural urban rural
ratio of urban to
rural
TAB
LE 12. DIS
PAR
ITIES BY
RES
IDEN
CE
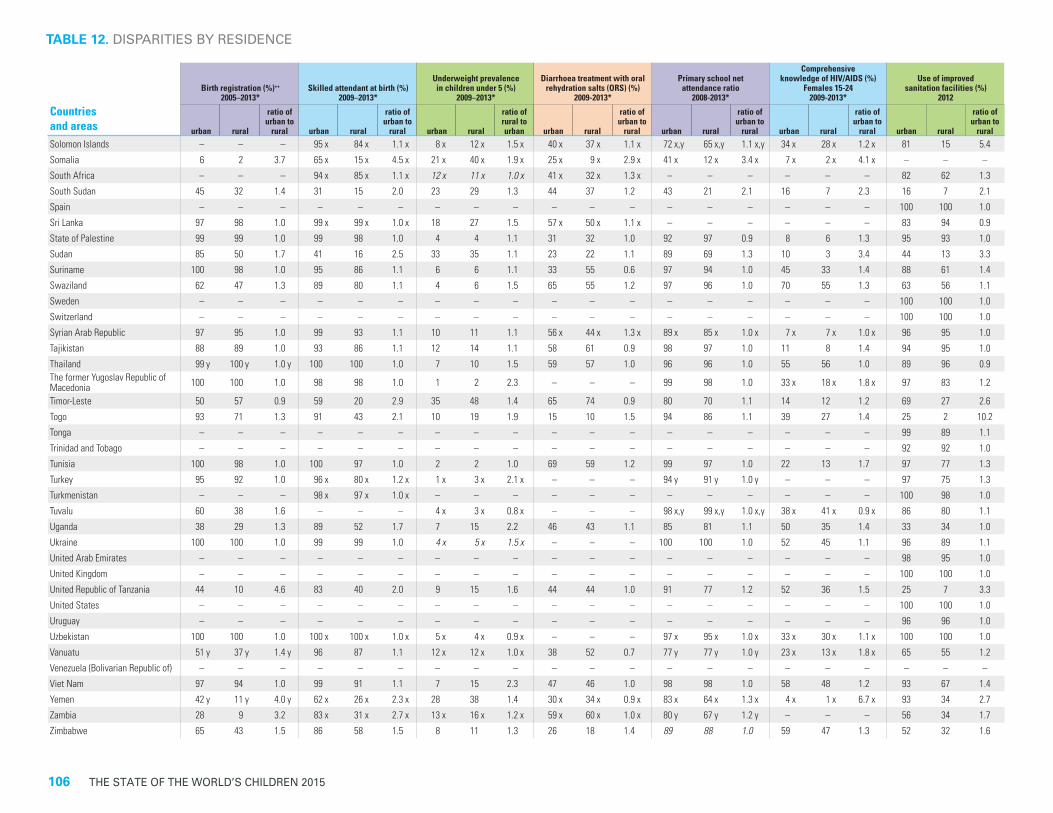
106 THE STATE OF THE WORLD’S CHILDREN 2015
TABLE 12. DISPARITIES BY RESIDENCE
Solomon Islands – – – 95 x 84 x 1.1 x 8 x 12 x 1.5 x 40 x 37 x 1.1 x 72 x,y 65 x,y 1.1 x,y 34 x 28 x 1.2 x 81 15 5.4Somalia 6 2 3.7 65 x 15 x 4.5 x 21 x 40 x 1.9 x 25 x 9 x 2.9 x 41 x 12 x 3.4 x 7 x 2 x 4.1 x – – –South Africa – – – 94 x 85 x 1.1 x 12 x 11 x 1.0 x 41 x 32 x 1.3 x – – – – – – 82 62 1.3South Sudan 45 32 1.4 31 15 2.0 23 29 1.3 44 37 1.2 43 21 2.1 16 7 2.3 16 7 2.1Spain – – – – – – – – – – – – – – – – – – 100 100 1.0Sri Lanka 97 98 1.0 99 x 99 x 1.0 x 18 27 1.5 57 x 50 x 1.1 x – – – – – – 83 94 0.9State of Palestine 99 99 1.0 99 98 1.0 4 4 1.1 31 32 1.0 92 97 0.9 8 6 1.3 95 93 1.0Sudan 85 50 1.7 41 16 2.5 33 35 1.1 23 22 1.1 89 69 1.3 10 3 3.4 44 13 3.3Suriname 100 98 1.0 95 86 1.1 6 6 1.1 33 55 0.6 97 94 1.0 45 33 1.4 88 61 1.4Swaziland 62 47 1.3 89 80 1.1 4 6 1.5 65 55 1.2 97 96 1.0 70 55 1.3 63 56 1.1Sweden – – – – – – – – – – – – – – – – – – 100 100 1.0Switzerland – – – – – – – – – – – – – – – – – – 100 100 1.0Syrian Arab Republic 97 95 1.0 99 93 1.1 10 11 1.1 56 x 44 x 1.3 x 89 x 85 x 1.0 x 7 x 7 x 1.0 x 96 95 1.0Tajikistan 88 89 1.0 93 86 1.1 12 14 1.1 58 61 0.9 98 97 1.0 11 8 1.4 94 95 1.0Thailand 99 y 100 y 1.0 y 100 100 1.0 7 10 1.5 59 57 1.0 96 96 1.0 55 56 1.0 89 96 0.9The former Yugoslav Republic of Macedonia 100 100 1.0 98 98 1.0 1 2 2.3 – – – 99 98 1.0 33 x 18 x 1.8 x 97 83 1.2
Timor-Leste 50 57 0.9 59 20 2.9 35 48 1.4 65 74 0.9 80 70 1.1 14 12 1.2 69 27 2.6Togo 93 71 1.3 91 43 2.1 10 19 1.9 15 10 1.5 94 86 1.1 39 27 1.4 25 2 10.2Tonga – – – – – – – – – – – – – – – – – – 99 89 1.1Trinidad and Tobago – – – – – – – – – – – – – – – – – – 92 92 1.0Tunisia 100 98 1.0 100 97 1.0 2 2 1.0 69 59 1.2 99 97 1.0 22 13 1.7 97 77 1.3Turkey 95 92 1.0 96 x 80 x 1.2 x 1 x 3 x 2.1 x – – – 94 y 91 y 1.0 y – – – 97 75 1.3Turkmenistan – – – 98 x 97 x 1.0 x – – – – – – – – – – – – 100 98 1.0Tuvalu 60 38 1.6 – – – 4 x 3 x 0.8 x – – – 98 x,y 99 x,y 1.0 x,y 38 x 41 x 0.9 x 86 80 1.1Uganda 38 29 1.3 89 52 1.7 7 15 2.2 46 43 1.1 85 81 1.1 50 35 1.4 33 34 1.0Ukraine 100 100 1.0 99 99 1.0 4 x 5 x 1.5 x – – – 100 100 1.0 52 45 1.1 96 89 1.1United Arab Emirates – – – – – – – – – – – – – – – – – – 98 95 1.0United Kingdom – – – – – – – – – – – – – – – – – – 100 100 1.0United Republic of Tanzania 44 10 4.6 83 40 2.0 9 15 1.6 44 44 1.0 91 77 1.2 52 36 1.5 25 7 3.3United States – – – – – – – – – – – – – – – – – – 100 100 1.0Uruguay – – – – – – – – – – – – – – – – – – 96 96 1.0Uzbekistan 100 100 1.0 100 x 100 x 1.0 x 5 x 4 x 0.9 x – – – 97 x 95 x 1.0 x 33 x 30 x 1.1 x 100 100 1.0Vanuatu 51 y 37 y 1.4 y 96 87 1.1 12 x 12 x 1.0 x 38 52 0.7 77 y 77 y 1.0 y 23 x 13 x 1.8 x 65 55 1.2Venezuela (Bolivarian Republic of) – – – – – – – – – – – – – – – – – – – – –Viet Nam 97 94 1.0 99 91 1.1 7 15 2.3 47 46 1.0 98 98 1.0 58 48 1.2 93 67 1.4Yemen 42 y 11 y 4.0 y 62 x 26 x 2.3 x 28 38 1.4 30 x 34 x 0.9 x 83 x 64 x 1.3 x 4 x 1 x 6.7 x 93 34 2.7Zambia 28 9 3.2 83 x 31 x 2.7 x 13 x 16 x 1.2 x 59 x 60 x 1.0 x 80 y 67 y 1.2 y – – – 56 34 1.7Zimbabwe 65 43 1.5 86 58 1.5 8 11 1.3 26 18 1.4 89 88 1.0 59 47 1.3 52 32 1.6
Countries and areas
Birth registration (%)++
2005–2013*Skilled attendant at birth (%)
2009–2013*
Underweight prevalence in children under 5 (%)
2009–2013*
Diarrhoea treatment with oral rehydration salts (ORS) (%)
2009-2013*
Primary school net attendance ratio
2008-2013*
Comprehensive knowledge of HIV/AIDS (%)
Females 15-242009-2013*
Use of improved sanitation facilities (%)
2012
urban rural
ratio of urban to
rural urban rural
ratio of urban to
rural urban rural
ratio of rural to urban urban rural
ratio of urban to
rural urban rural
ratio of urban to
rural urban rural
ratio of urban to
rural urban rural
ratio of urban to
rural

STATISTICAL TABLES 107
TABLE 12. DISPARITIES BY RESIDENCE
DEFINITIONS OF THE INDICATORS
Birth registration – Percentage of children under age 5 who were registered at the moment of the survey. This includes children whose birth certificate was seen by the interviewer or whose mother or caretaker says the birth has been registered.Skilled attendant at birth – Percentage of births attended by skilled health personnel (doctor, nurse or midwife).Underweight prevalence in children under 5 – Percentage of children under age 5 who are below minus two standard deviations from median weight-for-age of the World Health Organization (WHO) Child Growth Standards.Diarrhoea treatment with oral rehydration salts (ORS) – Percentage of children under age 5 who had diarrhoea in the two weeks preceding the survey and who received oral rehydration salts (ORS packets or pre-packaged ORS fluids). Primary school net attendance ratio – Number of children attending primary or secondary school who are of official primary school age, expressed as a percentage of the total number of children of official primary school age. Because of the inclusion of primary-school-aged children attending secondary school, this indicator can also be referred to as a primary adjusted net attendance ratio.Comprehensive knowledge of HIV – Percentage of young women aged 15–24 who correctly identify the two major ways of preventing the sexual transmission of HIV (using condoms and limiting sex to one faithful, uninfected partner), who reject the two most common local misconceptions about HIV transmission and who know that a healthy-looking person can be HIV-positive.Use of improved sanitation facilities – Percentage of the population using any of the following sanitation facilities, not shared with other households: flush or pour-flush latrine connected to a piped sewerage system, septic tank or pit latrine; ventilated improved pit latrine; pit latrine with a slab; composting toilet.
MAIN DATA SOURCES
NOTES
Birth registration – Demographic and Health Surveys (DHS), Multiple Indicator Cluster Surveys (MICS), other national surveys, censuses and vital registration systems.Skilled attendant at birth – DHS, MICS and other nationally representative sources.Underweight prevalence in children under 5 – DHS, MICS, other national household surveys, WHO and UNICEF.Diarrhoea treatment with oral rehydration salts (ORS) – DHS, MICS and other national household surveys.Primary school attendance ratio – DHS, MICS and other national household surveys.Comprehensive knowledge of HIV – DHS, MICS, AIDS Indicator Surveys (AIS) and other national household surveys; HIV/AIDS Survey Indicators Database, <www.measuredhs.com/hivdata>.Use of improved sanitation facilities – WHO/UNICEF Joint Monitoring Programme for Water Supply and Sanitation (JMP).
Italicized data are from different sources than the data presented for the same indicators in other tables of the report: Table 2 (Nutrition – Underweight prevalence), Table 3 (Health – Diarrhoea treatment), Table 4 (HIV/AIDS – Comprehensive knowledge of HIV), Table 5 (Education – Primary school participation) and Table 8 (Women – Skilled attendant at birth).
– Data not available.x Data refer to years or periods other than those specified in the column heading. Such data are not included in the calculation of
regional and global averages, with the exception of 2005-2006 data from India. Estimates from data years prior to 2000 are not displayed.
y Data differ from the standard definition or refer to only part of a country. If they fall within the noted reference period, such data are included in the calculation of regional and global averages.
++ Changes in the definition of birth registration were made from the second and third rounds of MICS (MICS2 and MICS3) to the fourth round (MICS4). In order to allow for comparability with later rounds, data from MICS2 and MICS3 on birth registration were recalculated according to the MICS4 indicator definition. Therefore, the recalculated data presented here may differ from estimates included in MICS2 and MICS3 national reports.
* Data refer to the most recent year available during the period specified in the column heading.** Excludes China.
SUMMARY
Sub-Saharan Africa 57 34 1.7 77 37 2.1 18 26 1.5 38 31 1.2 82 66 1.2 33 23 1.4 41 23 1.8 Eastern and Southern Africa 49 30 1.7 74 35 2.1 12 21 1.8 43 36 1.2 87 73 1.2 47 30 1.6 52 26 2.0 West and Central Africa 59 38 1.6 79 40 2.0 19 29 1.5 36 26 1.4 78 58 1.4 28 17 1.7 34 20 1.7Middle East and North Africa 95 78 1.2 91 62 1.5 – – – 39 31 1.3 93 83 1.1 – – – 92 71 1.3South Asia – – – 73 41 1.8 32 44 1.4 39 31 1.2 85 78 1.1 32 14 2.3 61 30 2.0East Asia and Pacific 83 ** 71 ** 1.2 ** 98 92 1.1 6 12 2.0 47 ** 44 ** 1.1 ** 96 95 1.0 – – – 77 58 1.3Latin America and Caribbean 95 88 1.1 95 71 1.3 – – – 52 45 1.1 – – – – – – 87 63 1.4CEE/CIS 97 96 1.0 – – – – – – – – – 95 95 1.0 – – – 87 81 1.1Least developed countries 54 35 1.5 76 38 2.0 19 28 1.5 46 40 1.1 84 70 1.2 32 21 1.5 48 31 1.6World 79 ** 50 ** 1.6 ** 86 53 1.6 15 28 1.9 41 ** 33 ** 1.3 ** 89 79 1.1 – 20 ** – 80 47 1.7
TAB
LE 12. DIS
PAR
ITIES BY
RES
IDEN
CE
For a complete list of countries and areas in the regions, subregions and country categories, see page 32 or visit http://data.unicef.org/index.php?section=regional-classifications.It is not advisable to compare data from consecutive editions of The State of the World’s Children.
Countries and areas
Birth registration (%)++
2005–2013*Skilled attendant at birth (%)
2009–2013*
Underweight prevalence in children under 5 (%)
2009–2013*
Diarrhoea treatment with oral rehydration salts (ORS) (%)
2009-2013*
Primary school net attendance ratio
2008-2013*
Comprehensive knowledge of HIV/AIDS (%)
Females 15-242009-2013*
Use of improved sanitation facilities (%)
2012
urban rural
ratio of urban to
rural urban rural
ratio of urban to
rural urban rural
ratio of rural to urban urban rural
ratio of urban to
rural urban rural
ratio of urban to
rural urban rural
ratio of urban to
rural urban rural
ratio of urban to
rural
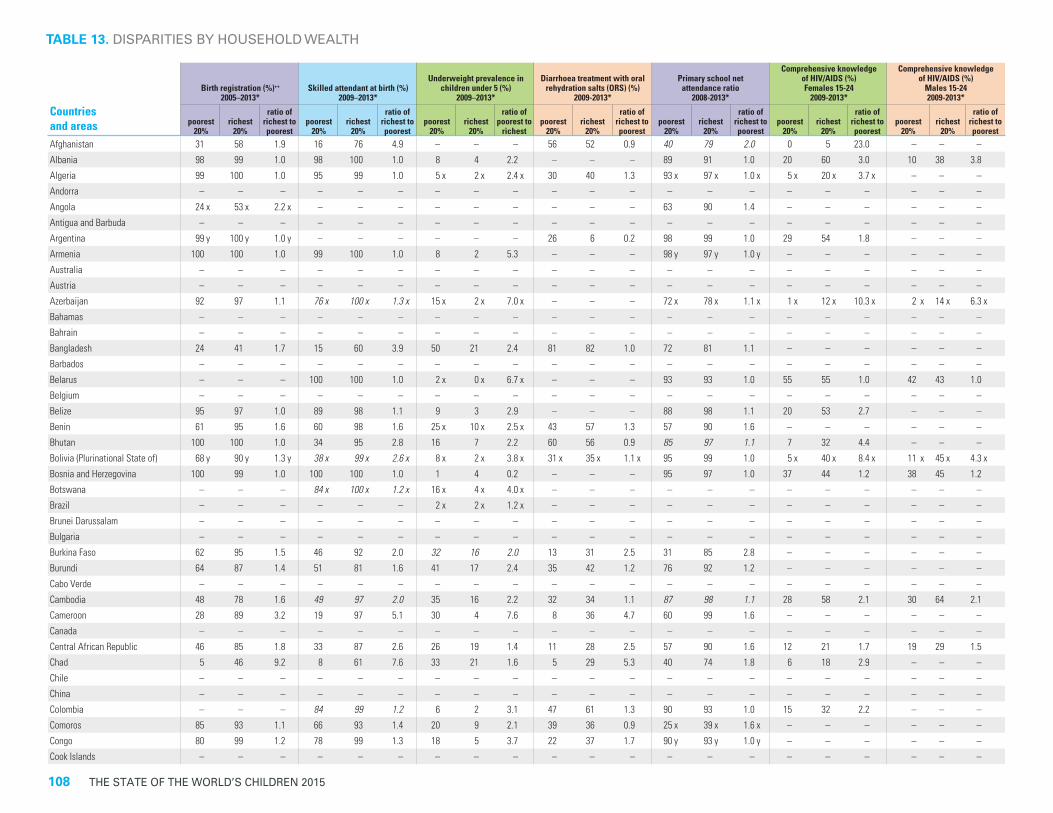
108 THE STATE OF THE WORLD’S CHILDREN 2015
Countries and areas
Birth registration (%)++
2005–2013*Skilled attendant at birth (%)
2009–2013*
Underweight prevalence in children under 5 (%)
2009–2013*
Diarrhoea treatment with oral rehydration salts (ORS) (%)
2009-2013*
Primary school net attendance ratio
2008-2013*
Comprehensive knowledge of HIV/AIDS (%)Females 15-24
2009-2013*
Comprehensive knowledge of HIV/AIDS (%)
Males 15-242009-2013*
poorest 20%
richest 20%
ratio of richest to poorest
poorest 20%
richest 20%
ratio of richest to poorest
poorest 20%
richest 20%
ratio of poorest to
richestpoorest
20%richest
20%
ratio of richest to poorest
poorest 20%
richest 20%
ratio of richest to poorest
poorest 20%
richest 20%
ratio of richest to poorest
poorest 20%
richest 20%
ratio of richest to poorest
Afghanistan 31 58 1.9 16 76 4.9 – – – 56 52 0.9 40 79 2.0 0 5 23.0 – – –Albania 98 99 1.0 98 100 1.0 8 4 2.2 – – – 89 91 1.0 20 60 3.0 10 38 3.8Algeria 99 100 1.0 95 99 1.0 5 x 2 x 2.4 x 30 40 1.3 93 x 97 x 1.0 x 5 x 20 x 3.7 x – – –Andorra – – – – – – – – – – – – – – – – – – – – –Angola 24 x 53 x 2.2 x – – – – – – – – – 63 90 1.4 – – – – – –Antigua and Barbuda – – – – – – – – – – – – – – – – – – – – –Argentina 99 y 100 y 1.0 y – – – – – – 26 6 0.2 98 99 1.0 29 54 1.8 – – –Armenia 100 100 1.0 99 100 1.0 8 2 5.3 – – – 98 y 97 y 1.0 y – – – – – –Australia – – – – – – – – – – – – – – – – – – – – –Austria – – – – – – – – – – – – – – – – – – – – –Azerbaijan 92 97 1.1 76 x 100 x 1.3 x 15 x 2 x 7.0 x – – – 72 x 78 x 1.1 x 1 x 12 x 10.3 x 2 x 14 x 6.3 xBahamas – – – – – – – – – – – – – – – – – – – – –Bahrain – – – – – – – – – – – – – – – – – – – – –Bangladesh 24 41 1.7 15 60 3.9 50 21 2.4 81 82 1.0 72 81 1.1 – – – – – –Barbados – – – – – – – – – – – – – – – – – – – – –Belarus – – – 100 100 1.0 2 x 0 x 6.7 x – – – 93 93 1.0 55 55 1.0 42 43 1.0Belgium – – – – – – – – – – – – – – – – – – – – –Belize 95 97 1.0 89 98 1.1 9 3 2.9 – – – 88 98 1.1 20 53 2.7 – – –Benin 61 95 1.6 60 98 1.6 25 x 10 x 2.5 x 43 57 1.3 57 90 1.6 – – – – – –Bhutan 100 100 1.0 34 95 2.8 16 7 2.2 60 56 0.9 85 97 1.1 7 32 4.4 – – –Bolivia (Plurinational State of) 68 y 90 y 1.3 y 38 x 99 x 2.6 x 8 x 2 x 3.8 x 31 x 35 x 1.1 x 95 99 1.0 5 x 40 x 8.4 x 11 x 45 x 4.3 xBosnia and Herzegovina 100 99 1.0 100 100 1.0 1 4 0.2 – – – 95 97 1.0 37 44 1.2 38 45 1.2Botswana – – – 84 x 100 x 1.2 x 16 x 4 x 4.0 x – – – – – – – – – – – –Brazil – – – – – – 2 x 2 x 1.2 x – – – – – – – – – – – –Brunei Darussalam – – – – – – – – – – – – – – – – – – – – –Bulgaria – – – – – – – – – – – – – – – – – – – – –Burkina Faso 62 95 1.5 46 92 2.0 32 16 2.0 13 31 2.5 31 85 2.8 – – – – – –Burundi 64 87 1.4 51 81 1.6 41 17 2.4 35 42 1.2 76 92 1.2 – – – – – –Cabo Verde – – – – – – – – – – – – – – – – – – – – –Cambodia 48 78 1.6 49 97 2.0 35 16 2.2 32 34 1.1 87 98 1.1 28 58 2.1 30 64 2.1Cameroon 28 89 3.2 19 97 5.1 30 4 7.6 8 36 4.7 60 99 1.6 – – – – – –Canada – – – – – – – – – – – – – – – – – – – – –Central African Republic 46 85 1.8 33 87 2.6 26 19 1.4 11 28 2.5 57 90 1.6 12 21 1.7 19 29 1.5Chad 5 46 9.2 8 61 7.6 33 21 1.6 5 29 5.3 40 74 1.8 6 18 2.9 – – –Chile – – – – – – – – – – – – – – – – – – – – –China – – – – – – – – – – – – – – – – – – – – –Colombia – – – 84 99 1.2 6 2 3.1 47 61 1.3 90 93 1.0 15 32 2.2 – – –Comoros 85 93 1.1 66 93 1.4 20 9 2.1 39 36 0.9 25 x 39 x 1.6 x – – – – – –Congo 80 99 1.2 78 99 1.3 18 5 3.7 22 37 1.7 90 y 93 y 1.0 y – – – – – –Cook Islands – – – – – – – – – – – – – – – – – – – – –
TABLE 13. DISPARITIES BY HOUSEHOLD WEALTH

STATISTICAL TABLES 109
TABLE 13. DISPARITIES BY HOUSEHOLD WEALTH
Costa Rica 99 100 1.0 97 99 1.0 – – – – – – 94 98 1.0 20 54 2.7 – – –Côte d'Ivoire 44 90 2.0 35 91 2.6 21 10 2.1 6 24 3.7 57 y 80 y 1.4 y – – – – – –Croatia – – – – – – – – – – – – – – – – – – – – –Cuba – – – – – – – – – – – – – – – – – – – – –Cyprus – – – – – – – – – – – – – – – – – – – – –Czech Republic – – – – – – – – – – – – – – – – – – – – –Democratic People's Republic of Korea – – – – – – – – – – – – – – – – – – – – –
Democratic Republic of the Congo 25 27 1.1 69 99 1.4 29 12 2.3 28 26 0.9 65 92 1.4 8 24 2.8 – – –Denmark – – – – – – – – – – – – – – – – – – – – –Djibouti – – – – – – – – – – – – – – – – – – – – –Dominica – – – – – – – – – – – – – – – – – – – – –Dominican Republic – – – 95 x 99 x 1.0 x 5 x 1 x 4.4 x – – – 92 y 98 y 1.1 y 31 x 46 x 1.5 x 21 x 41 x 2.0 xEcuador – – – 99 x 98 x 1.0 x – – – – – – – – – – – – – – –Egypt 99 y 100 y 1.0 y 55 x 97 x 1.8 x 8 x 5 x 1.4 x 34 x 23 x 0.7 x 83 y 93 y 1.1 y 2 x 9 x 4.9 x 9 x 28 x 3.1 xEl Salvador 98 99 1.0 91 x 98 x 1.1 x 12 x 1 x 12.9 x – – – – – – – – – – – –Equatorial Guinea 60 60 1.0 48 88 1.8 9 4 2.0 – – – – – – – – – – – –Eritrea – – – 9 90 10.5 48 15 3.2 42 50 1.2 31 y 84 y 2.7 y 9 37 4.3 21 43 2.0Estonia – – – – – – – – – – – – – – – – – – – – –Ethiopia 3 18 7.0 2 46 26.8 36 15 2.4 18 45 2.5 52 86 1.7 – – – – – –Fiji – – – – – – – – – – – – – – – – – – – – –Finland – – – – – – – – – – – – – – – – – – – – –France – – – – – – – – – – – – – – – – – – – – –Gabon 92 86 0.9 74 95 1.3 10 2 5.5 24 19 0.8 85 y 86 y 1.0 y – – – – – –Gambia 46 61 1.3 34 58 1.7 24 10 2.5 43 32 0.7 47 82 1.7 20 48 2.4 – – –Georgia 99 100 1.0 95 x 99 x 1.0 x 3 x 1 x 3.0 x – – – 92 96 1.0 – – – – – –Germany – – – – – – – – – – – – – – – – – – – – –Ghana 47 82 1.7 39 98 2.5 20 6 3.2 44 27 0.6 61 86 1.4 18 53 2.9 19 49 2.6Greece – – – – – – – – – – – – – – – – – – – – –Grenada – – – – – – – – – – – – – – – – – – – – –Guatemala – – – 20 95 4.7 21 3 6.5 39 51 1.3 – – – 5 41 7.8 – – –Guinea 38 89 2.4 19 92 4.9 20 5 4.1 25 49 1.9 32 89 2.8 – – – – – –Guinea-Bissau 17 35 2.0 23 82 3.6 22 11 2.1 16 37 2.3 52 87 1.7 6 25 4.3 – – –Guyana 84 92 1.1 81 96 1.2 16 4 3.8 – – – 91 97 1.1 37 72 2.0 25 65 2.6Haiti 71 92 1.3 10 78 8.1 18 4 4.7 52 62 1.2 66 y 92 y 1.4 y – – – – – –Holy See – – – – – – – – – – – – – – – – – – – – –Honduras 92 95 1.0 58 98 1.7 13 3 4.1 63 52 0.8 89 y 94 y 1.1 y – – – – – –Hungary – – – – – – – – – – – – – – – – – – – – –Iceland – – – – – – – – – – – – – – – – – – – – –India – – – 24 x 85 x 3.6 x 57 x 20 x 2.9 x 19 x 43 x 2.3 x 70 x 96 x 1.4 x 4 x 45 x 11.7 x 15 x 55 x 3.8 x
Countries and areas
Birth registration (%)++
2005–2013*Skilled attendant at birth (%)
2009–2013*
Underweight prevalence in children under 5 (%)
2009–2013*
Diarrhoea treatment with oral rehydration salts (ORS) (%)
2009-2013*
Primary school net attendance ratio
2008-2013*
Comprehensive knowledge of HIV/AIDS (%)Females 15-24
2009-2013*
Comprehensive knowledge of HIV/AIDS (%)
Males 15-242009-2013*
poorest 20%
richest 20%
ratio of richest to poorest
poorest 20%
richest 20%
ratio of richest to poorest
poorest 20%
richest 20%
ratio of poorest to
richestpoorest
20%richest
20%
ratio of richest to poorest
poorest 20%
richest 20%
ratio of richest to poorest
poorest 20%
richest 20%
ratio of richest to poorest
poorest 20%
richest 20%
ratio of richest to poorest
TAB
LE 13. DIS
PAR
ITIES BY
HO
US
EHO
LD W
EALTH

110 THE STATE OF THE WORLD’S CHILDREN 2015
TABLE 13. DISPARITIES BY HOUSEHOLD WEALTH
Countries and areas
Birth registration (%)++
2005–2013*Skilled attendant at birth (%)
2009–2013*
Underweight prevalence in children under 5 (%)
2009–2013*
Diarrhoea treatment with oral rehydration salts (ORS) (%)
2009-2013*
Primary school net attendance ratio
2008-2013*
Comprehensive knowledge of HIV/AIDS (%)Females 15-24
2009-2013*
Comprehensive knowledge of HIV/AIDS (%)
Males 15-242009-2013*
poorest 20%
richest 20%
ratio of richest to poorest
poorest 20%
richest 20%
ratio of richest to poorest
poorest 20%
richest 20%
ratio of poorest to
richestpoorest
20%richest
20%
ratio of richest to poorest
poorest 20%
richest 20%
ratio of richest to poorest
poorest 20%
richest 20%
ratio of richest to poorest
poorest 20%
richest 20%
ratio of richest to poorest
Indonesia 41 88 2.2 58 97 1.7 28 14 2.0 39 34 0.9 91 97 1.1 – – – – – –Iran (Islamic Republic of) – – – – – – – – – – – – – – – – – – – – –Iraq 98 100 1.0 82 96 1.2 9 8 1.1 19 22 1.1 79 98 1.2 1 8 7.2 – – –Ireland – – – – – – – – – – – – – – – – – – – – –Israel – – – – – – – – – – – – – – – – – – – – –Italy – – – – – – – – – – – – – – – – – – – – –Jamaica 96 100 1.0 97 100 1.0 – – – – – – 98 99 1.0 – – – – – –Japan – – – – – – – – – – – – – – – – – – – – –Jordan 98 100 1.0 99 100 1.0 5 0 13.0 22 21 1.0 97 99 1.0 – – – – – –Kazakhstan 100 100 1.0 100 100 1.0 4 4 1.2 – – – 99 100 1.0 25 44 1.8 13 49 3.8Kenya 48 80 1.7 20 81 4.0 25 9 2.8 40 37 0.9 72 96 1.3 29 61 2.1 42 68 1.6Kiribati 93 94 1.0 76 93 1.2 18 8 2.2 – – – – – – 42 49 1.2 38 51 1.3Kuwait – – – – – – – – – – – – – – – – – – – – –Kyrgyzstan 99 99 1.0 99 100 1.0 5 3 1.4 – – – 99 97 1.0 – – – – – –Lao People's Democratic Republic 66 93 1.4 11 91 8.4 37 12 3.0 35 69 2.0 71 97 1.4 6 41 6.5 12 43 3.6Latvia – – – – – – – – – – – – – – – – – – – – –Lebanon – – – – – – – – – – – – – – – – – – – – –Lesotho 42 49 1.2 35 90 2.6 18 9 1.9 – – – 83 94 1.1 26 48 1.8 14 45 3.3Liberia 1 y 7 y 6.1 y 26 x 81 x 3.2 x 21 x 13 x 1.6 x 41 x 64 x 1.6 x 16 x 67 x 4.1 x 14 x 29 x 2.1 x 17 x 37 x 2.2 xLibya – – – – – – – – – – – – – – – – – – – – –Liechtenstein – – – – – – – – – – – – – – – – – – – – –Lithuania – – – – – – – – – – – – – – – – – – – – –Luxembourg – – – – – – – – – – – – – – – – – – – – –Madagascar 72 94 1.3 27 73 2.7 40 x 24 x 1.7 x 11 17 1.6 54 y 82 y 1.5 y 10 40 4.1 13 41 3.2Malawi – – – 63 89 1.4 17 13 1.3 67 73 1.1 75 96 1.3 34 55 1.6 35 54 1.5Malaysia – – – – – – – – – – – – – – – – – – – – –Maldives 92 94 1.0 89 99 1.1 24 11 2.3 – – – 94 94 1.0 23 48 2.0 – – –Mali 65 96 1.5 31 90 2.9 31 x 17 x 1.8 x 8 16 2.1 36 85 2.4 9 19 2.0 – – –Malta – – – – – – – – – – – – – – – – – – – – –Marshall Islands 92 98 1.1 68 x 99 x 1.5 x – – – – – – – – – 12 x 39 x 3.3 x 37 x 58 x 1.6 xMauritania 33 84 2.6 27 96 3.6 36 10 3.8 9 33 3.8 45 83 1.9 2 12 7.9 – – –Mauritius – – – – – – – – – – – – – – – – – – – – –Mexico – – – – – – – – – – – – – – – – – – – – –Micronesia (Federated States of) – – – – – – – – – – – – – – – – – – – – –Monaco – – – – – – – – – – – – – – – – – – – – –Mongolia 99 99 1.0 98 99 1.0 5 1 5.6 24 50 2.1 93 98 1.1 17 42 2.5 12 48 4.1Montenegro 96 100 1.0 98 x 100 x 1.0 x 4 x 1 x 4.1 x – – – 92 x 100 x 1.1 x – – – – – –Morocco – – – 38 96 2.5 7 1 6.1 14 23 1.7 77 x 97 x 1.3 x – – – – – –Mozambique 42 60 1.4 32 90 2.8 23 6 3.6 41 70 1.7 67 y 91 y 1.4 y – – – – – –Myanmar 50 96 1.9 51 96 1.9 33 14 2.5 52 75 1.4 81 95 1.2 – – – – – –

STATISTICAL TABLES 111
TABLE 13. DISPARITIES BY HOUSEHOLD WEALTH
Countries and areas
Birth registration (%)++
2005–2013*Skilled attendant at birth (%)
2009–2013*
Underweight prevalence in children under 5 (%)
2009–2013*
Diarrhoea treatment with oral rehydration salts (ORS) (%)
2009-2013*
Primary school net attendance ratio
2008-2013*
Comprehensive knowledge of HIV/AIDS (%)Females 15-24
2009-2013*
Comprehensive knowledge of HIV/AIDS (%)
Males 15-242009-2013*
poorest 20%
richest 20%
ratio of richest to poorest
poorest 20%
richest 20%
ratio of richest to poorest
poorest 20%
richest 20%
ratio of poorest to
richestpoorest
20%richest
20%
ratio of richest to poorest
poorest 20%
richest 20%
ratio of richest to poorest
poorest 20%
richest 20%
ratio of richest to poorest
poorest 20%
richest 20%
ratio of richest to poorest
TAB
LE 13. DIS
PAR
ITIES BY
HO
US
EHO
LD W
EALTH
Namibia – – – 60 x 98 x 1.6 x 22 x 7 x 3.1 x 50 x 59 x 1.2 x – – – 61 x 69 x 1.1 x 55 x 67 x 1.2 xNauru 71 88 1.2 97 x 98 x 1.0 x 7 x 3 x 2.7 x – – – – – – 13 x 10 x 0.8 x – 25 x –Nepal 36 52 1.5 11 82 7.6 40 10 4.0 39 36 0.9 91 99 1.1 – – – – – –Netherlands – – – – – – – – – – – – – – – – – – – – –New Zealand – – – – – – – – – – – – – – – – – – – – –Nicaragua – – – 42 x 99 x 2.4 x 9 x 1 x 6.6 x – – – – – – – – – – – –Niger 50 89 1.8 12 71 6.0 14 26 0.5 34 49 1.4 35 81 2.3 6 30 5.0 6 42 7.2Nigeria 7 65 9.7 6 85 15.0 42 16 2.7 20 53 2.6 27 y 70 y 2.6 y 15 33 2.2 23 43 1.9Niue – – – – – – – – – – – – – – – – – – – – –Norway – – – – – – – – – – – – – – – – – – – – –Oman – – – – – – – – – – – – – – – – – – – – –Pakistan 5 71 14.3 30 85 2.9 48 16 3.1 34 48 1.4 39 87 2.2 – – – – – –Palau – – – – – – – – – – – – – – – – – – – – –Panama – – – – – – – – – – – – – – – – – – – – –Papua New Guinea – – – – – – – – – – – – – – – – – – – – –Paraguay 67 y 89 y 1.3 y – – – – – – – – – – – – – – – – – –Peru 93 y 99 y 1.1 y 60 99 1.7 7 1 12.2 24 34 1.4 96 99 1.0 – – – – – –Philippines – – – 26 x 94 x 3.7 x – – – – – – 79 x 92 x 1.2 x 14 x 26 x 1.8 x – – –Poland – – – – – – – – – – – – – – – – – – – – –Portugal – – – – – – – – – – – – – – – – – – – – –Qatar – – – – – – – – – – – – – – – – – – – – –Republic of Korea – – – – – – – – – – – – – – – – – – – – –Republic of Moldova 99 100 1.0 98 99 1.0 5 x 1 x 8.2 x – – – 98 99 1.0 – – – – – –Romania – – – – – – – – – – – – – – – – – – – – –Russian Federation – – – – – – – – – – – – – – – – – – – – –Rwanda 58 64 1.1 61 86 1.4 16 5 3.0 22 37 1.7 87 y 96 y 1.1 y – – – – – –Saint Kitts and Nevis – – – – – – – – – – – – – – – – – – – – –Saint Lucia – – – – – – – – – – – – – – – – – – – – –Saint Vincent and the Grenadines – – – – – – – – – – – – – – – – – – – – –Samoa 31 63 2.1 66 95 1.4 – – – – – – 85 y 91 y 1.1 y 3 3 1.0 3 9 2.7San Marino – – – – – – – – – – – – – – – – – – – – –Sao Tome and Principe 74 86 1.1 74 93 1.3 18 7 2.6 – – – 88 97 1.1 27 56 2.0 39 55 1.4Saudi Arabia – – – – – – – – – – – – – – – – – – – – –Senegal 46 94 2.0 30 96 3.2 21 10 2.2 13 25 1.8 47 78 1.7 – – – – – –Serbia 97 100 1.0 99 100 1.0 3 2 1.4 – – – 96 98 1.0 28 69 2.4 28 66 2.4Seychelles – – – – – – – – – – – – – – – – – – – – –Sierra Leone 74 88 1.2 51 84 1.6 22 15 1.4 87 88 1.0 59 88 1.5 14 36 2.6 – – –Singapore – – – – – – – – – – – – – – – – – – – – –Slovakia – – – – – – – – – – – – – – – – – – – – –Slovenia – – – – – – – – – – – – – – – – – – – – –
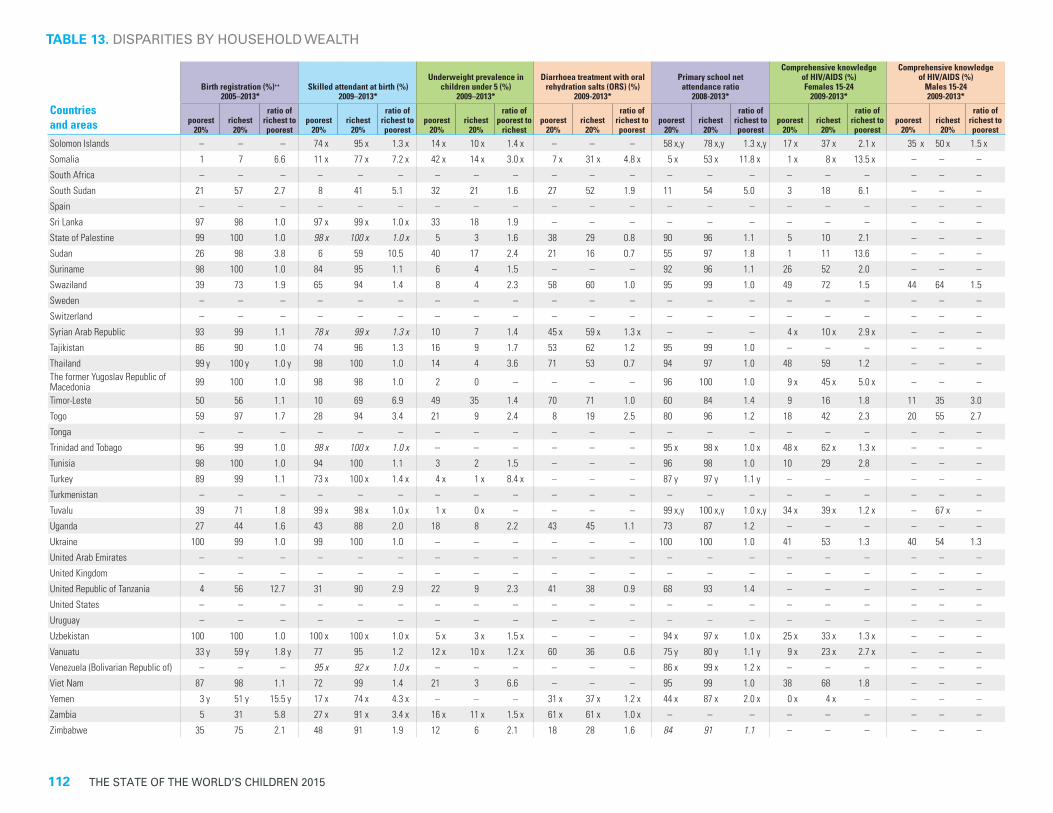
112 THE STATE OF THE WORLD’S CHILDREN 2015
TABLE 13. DISPARITIES BY HOUSEHOLD WEALTH
Countries and areas
Birth registration (%)++
2005–2013*Skilled attendant at birth (%)
2009–2013*
Underweight prevalence in children under 5 (%)
2009–2013*
Diarrhoea treatment with oral rehydration salts (ORS) (%)
2009-2013*
Primary school net attendance ratio
2008-2013*
Comprehensive knowledge of HIV/AIDS (%)Females 15-24
2009-2013*
Comprehensive knowledge of HIV/AIDS (%)
Males 15-242009-2013*
poorest 20%
richest 20%
ratio of richest to poorest
poorest 20%
richest 20%
ratio of richest to poorest
poorest 20%
richest 20%
ratio of poorest to
richestpoorest
20%richest
20%
ratio of richest to poorest
poorest 20%
richest 20%
ratio of richest to poorest
poorest 20%
richest 20%
ratio of richest to poorest
poorest 20%
richest 20%
ratio of richest to poorest
Solomon Islands – – – 74 x 95 x 1.3 x 14 x 10 x 1.4 x – – – 58 x,y 78 x,y 1.3 x,y 17 x 37 x 2.1 x 35 x 50 x 1.5 xSomalia 1 7 6.6 11 x 77 x 7.2 x 42 x 14 x 3.0 x 7 x 31 x 4.8 x 5 x 53 x 11.8 x 1 x 8 x 13.5 x – – –South Africa – – – – – – – – – – – – – – – – – – – – –South Sudan 21 57 2.7 8 41 5.1 32 21 1.6 27 52 1.9 11 54 5.0 3 18 6.1 – – –Spain – – – – – – – – – – – – – – – – – – – – –Sri Lanka 97 98 1.0 97 x 99 x 1.0 x 33 18 1.9 – – – – – – – – – – – –State of Palestine 99 100 1.0 98 x 100 x 1.0 x 5 3 1.6 38 29 0.8 90 96 1.1 5 10 2.1 – – –Sudan 26 98 3.8 6 59 10.5 40 17 2.4 21 16 0.7 55 97 1.8 1 11 13.6 – – –Suriname 98 100 1.0 84 95 1.1 6 4 1.5 – – – 92 96 1.1 26 52 2.0 – – –Swaziland 39 73 1.9 65 94 1.4 8 4 2.3 58 60 1.0 95 99 1.0 49 72 1.5 44 64 1.5Sweden – – – – – – – – – – – – – – – – – – – – –Switzerland – – – – – – – – – – – – – – – – – – – – –Syrian Arab Republic 93 99 1.1 78 x 99 x 1.3 x 10 7 1.4 45 x 59 x 1.3 x – – – 4 x 10 x 2.9 x – – –Tajikistan 86 90 1.0 74 96 1.3 16 9 1.7 53 62 1.2 95 99 1.0 – – – – – –Thailand 99 y 100 y 1.0 y 98 100 1.0 14 4 3.6 71 53 0.7 94 97 1.0 48 59 1.2 – – –The former Yugoslav Republic of Macedonia 99 100 1.0 98 98 1.0 2 0 – – – – 96 100 1.0 9 x 45 x 5.0 x – – –
Timor-Leste 50 56 1.1 10 69 6.9 49 35 1.4 70 71 1.0 60 84 1.4 9 16 1.8 11 35 3.0Togo 59 97 1.7 28 94 3.4 21 9 2.4 8 19 2.5 80 96 1.2 18 42 2.3 20 55 2.7Tonga – – – – – – – – – – – – – – – – – – – – –Trinidad and Tobago 96 99 1.0 98 x 100 x 1.0 x – – – – – – 95 x 98 x 1.0 x 48 x 62 x 1.3 x – – –Tunisia 98 100 1.0 94 100 1.1 3 2 1.5 – – – 96 98 1.0 10 29 2.8 – – –Turkey 89 99 1.1 73 x 100 x 1.4 x 4 x 1 x 8.4 x – – – 87 y 97 y 1.1 y – – – – – –Turkmenistan – – – – – – – – – – – – – – – – – – – – –Tuvalu 39 71 1.8 99 x 98 x 1.0 x 1 x 0 x – – – – 99 x,y 100 x,y 1.0 x,y 34 x 39 x 1.2 x – 67 x –Uganda 27 44 1.6 43 88 2.0 18 8 2.2 43 45 1.1 73 87 1.2 – – – – – –Ukraine 100 99 1.0 99 100 1.0 – – – – – – 100 100 1.0 41 53 1.3 40 54 1.3United Arab Emirates – – – – – – – – – – – – – – – – – – – – –United Kingdom – – – – – – – – – – – – – – – – – – – – –United Republic of Tanzania 4 56 12.7 31 90 2.9 22 9 2.3 41 38 0.9 68 93 1.4 – – – – – –United States – – – – – – – – – – – – – – – – – – – – –Uruguay – – – – – – – – – – – – – – – – – – – – –Uzbekistan 100 100 1.0 100 x 100 x 1.0 x 5 x 3 x 1.5 x – – – 94 x 97 x 1.0 x 25 x 33 x 1.3 x – – –Vanuatu 33 y 59 y 1.8 y 77 95 1.2 12 x 10 x 1.2 x 60 36 0.6 75 y 80 y 1.1 y 9 x 23 x 2.7 x – – –Venezuela (Bolivarian Republic of) – – – 95 x 92 x 1.0 x – – – – – – 86 x 99 x 1.2 x – – – – – –Viet Nam 87 98 1.1 72 99 1.4 21 3 6.6 – – – 95 99 1.0 38 68 1.8 – – –Yemen 3 y 51 y 15.5 y 17 x 74 x 4.3 x – – – 31 x 37 x 1.2 x 44 x 87 x 2.0 x 0 x 4 x – – – –Zambia 5 31 5.8 27 x 91 x 3.4 x 16 x 11 x 1.5 x 61 x 61 x 1.0 x – – – – – – – – –Zimbabwe 35 75 2.1 48 91 1.9 12 6 2.1 18 28 1.6 84 91 1.1 – – – – – –
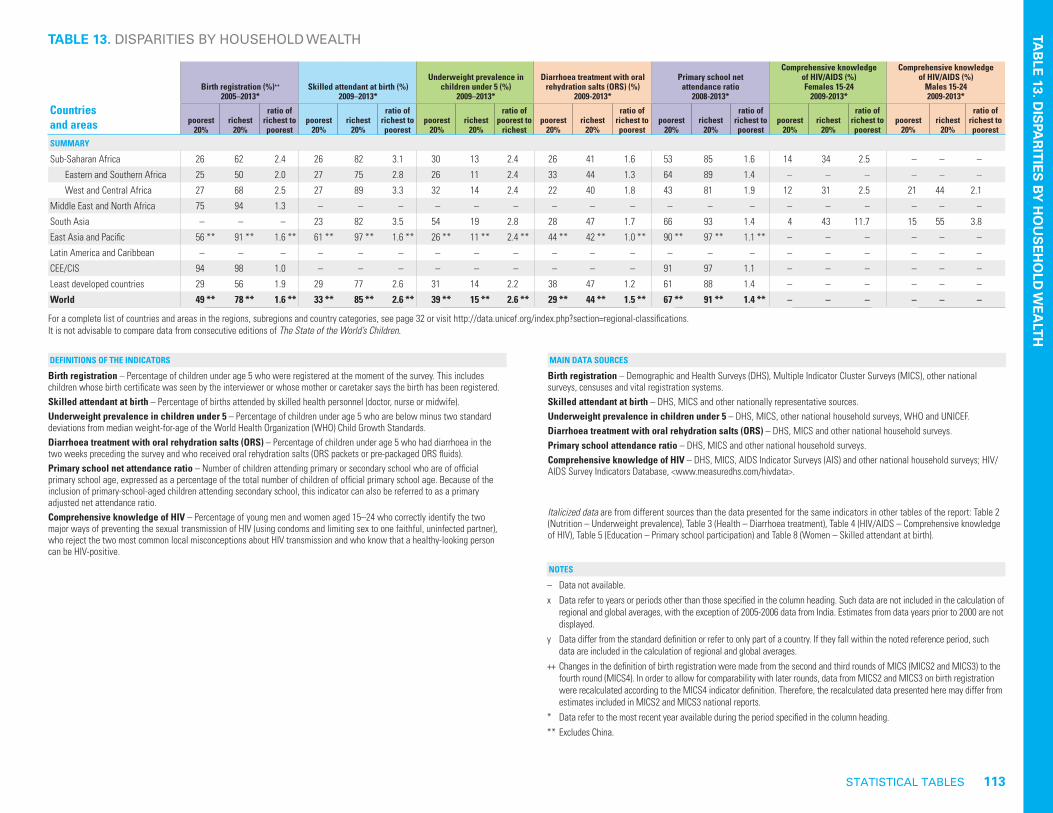
STATISTICAL TABLES 113
TABLE 13. DISPARITIES BY HOUSEHOLD WEALTH
DEFINITIONS OF THE INDICATORS
Birth registration – Percentage of children under age 5 who were registered at the moment of the survey. This includes children whose birth certificate was seen by the interviewer or whose mother or caretaker says the birth has been registered.Skilled attendant at birth – Percentage of births attended by skilled health personnel (doctor, nurse or midwife).Underweight prevalence in children under 5 – Percentage of children under age 5 who are below minus two standard deviations from median weight-for-age of the World Health Organization (WHO) Child Growth Standards.Diarrhoea treatment with oral rehydration salts (ORS) – Percentage of children under age 5 who had diarrhoea in the two weeks preceding the survey and who received oral rehydration salts (ORS packets or pre-packaged ORS fluids). Primary school net attendance ratio – Number of children attending primary or secondary school who are of official primary school age, expressed as a percentage of the total number of children of official primary school age. Because of the inclusion of primary-school-aged children attending secondary school, this indicator can also be referred to as a primary adjusted net attendance ratio.Comprehensive knowledge of HIV – Percentage of young men and women aged 15–24 who correctly identify the two major ways of preventing the sexual transmission of HIV (using condoms and limiting sex to one faithful, uninfected partner), who reject the two most common local misconceptions about HIV transmission and who know that a healthy-looking person can be HIV-positive.
MAIN DATA SOURCES
NOTES
Birth registration – Demographic and Health Surveys (DHS), Multiple Indicator Cluster Surveys (MICS), other national surveys, censuses and vital registration systems.Skilled attendant at birth – DHS, MICS and other nationally representative sources.Underweight prevalence in children under 5 – DHS, MICS, other national household surveys, WHO and UNICEF.Diarrhoea treatment with oral rehydration salts (ORS) – DHS, MICS and other national household surveys.Primary school attendance ratio – DHS, MICS and other national household surveys.Comprehensive knowledge of HIV – DHS, MICS, AIDS Indicator Surveys (AIS) and other national household surveys; HIV/AIDS Survey Indicators Database, <www.measuredhs.com/hivdata>.
Italicized data are from different sources than the data presented for the same indicators in other tables of the report: Table 2 (Nutrition – Underweight prevalence), Table 3 (Health – Diarrhoea treatment), Table 4 (HIV/AIDS – Comprehensive knowledge of HIV), Table 5 (Education – Primary school participation) and Table 8 (Women – Skilled attendant at birth).
– Data not available.x Data refer to years or periods other than those specified in the column heading. Such data are not included in the calculation of
regional and global averages, with the exception of 2005-2006 data from India. Estimates from data years prior to 2000 are not displayed.
y Data differ from the standard definition or refer to only part of a country. If they fall within the noted reference period, such data are included in the calculation of regional and global averages.
++ Changes in the definition of birth registration were made from the second and third rounds of MICS (MICS2 and MICS3) to the fourth round (MICS4). In order to allow for comparability with later rounds, data from MICS2 and MICS3 on birth registration were recalculated according to the MICS4 indicator definition. Therefore, the recalculated data presented here may differ from estimates included in MICS2 and MICS3 national reports.
* Data refer to the most recent year available during the period specified in the column heading.** Excludes China.
TAB
LE 13. DIS
PAR
ITIES BY
HO
US
EHO
LD W
EALTH
For a complete list of countries and areas in the regions, subregions and country categories, see page 32 or visit http://data.unicef.org/index.php?section=regional-classifications.It is not advisable to compare data from consecutive editions of The State of the World’s Children.
Countries and areas
Birth registration (%)++
2005–2013*Skilled attendant at birth (%)
2009–2013*
Underweight prevalence in children under 5 (%)
2009–2013*
Diarrhoea treatment with oral rehydration salts (ORS) (%)
2009-2013*
Primary school net attendance ratio
2008-2013*
Comprehensive knowledge of HIV/AIDS (%)Females 15-24
2009-2013*
Comprehensive knowledge of HIV/AIDS (%)
Males 15-242009-2013*
poorest 20%
richest 20%
ratio of richest to poorest
poorest 20%
richest 20%
ratio of richest to poorest
poorest 20%
richest 20%
ratio of poorest to
richestpoorest
20%richest
20%
ratio of richest to poorest
poorest 20%
richest 20%
ratio of richest to poorest
poorest 20%
richest 20%
ratio of richest to poorest
poorest 20%
richest 20%
ratio of richest to poorest
SUMMARY
Sub-Saharan Africa 26 62 2.4 26 82 3.1 30 13 2.4 26 41 1.6 53 85 1.6 14 34 2.5 – – – Eastern and Southern Africa 25 50 2.0 27 75 2.8 26 11 2.4 33 44 1.3 64 89 1.4 – – – – – – West and Central Africa 27 68 2.5 27 89 3.3 32 14 2.4 22 40 1.8 43 81 1.9 12 31 2.5 21 44 2.1Middle East and North Africa 75 94 1.3 – – – – – – – – – – – – – – – – – – South Asia – – – 23 82 3.5 54 19 2.8 28 47 1.7 66 93 1.4 4 43 11.7 15 55 3.8East Asia and Pacific 56 ** 91 ** 1.6 ** 61 ** 97 ** 1.6 ** 26 ** 11 ** 2.4 ** 44 ** 42 ** 1.0 ** 90 ** 97 ** 1.1 ** – – – – – – Latin America and Caribbean – – – – – – – – – – – – – – – – – – – – – CEE/CIS 94 98 1.0 – – – – – – – – – 91 97 1.1 – – – – – – Least developed countries 29 56 1.9 29 77 2.6 31 14 2.2 38 47 1.2 61 88 1.4 – – – – – – World 49 ** 78 ** 1.6 ** 33 ** 85 ** 2.6 ** 39 ** 15 ** 2.6 ** 29 ** 44 ** 1.5 ** 67 ** 91 ** 1.4 ** – – – – – –

114 THE STATE OF THE WORLD’S CHILDREN 2015
Countries and areas
Attendance in early childhood education2005-2013*
Adult support for learning ++
2005–2013*Father’s
support for learning ++
2005–2013*
Learning materials at home 2005-2013* Children left in inadequate care
2005-2013*Children’s books Playthings ++
total male femalepoorest
20%richest
20% total male femalepoorest
20%richest
20% totalpoorest
20%richest
20% totalpoorest
20%richest
20% total male femalepoorest
20%richest
20%Afghanistan 1 1 1 0 4 73 74 73 72 80 62 2 1 5 53 52 57 40 42 39 43 27Albania 40 39 42 26 60 86 85 87 68 96 53 32 16 52 53 57 48 13 14 11 9 16Argentina 63 61 66 46 85 84 83 85 73 95 57 61 40 83 61 58 63 8 9 8 10 5Bangladesh 15 14 15 11 16 61 61 60 42 85 53 – – – – – – – – – – –Belarus 88 86 89 75 91 96 94 97 90 99 68 92 83 96 79 77 79 4 4 4 4 5Belize 32 30 34 16 59 86 88 83 73 94 50 40 17 73 57 55 58 2 3 2 4 1Bhutan 10 10 10 3 27 54 52 57 40 73 51 6 1 24 52 36 60 14 13 15 17 7Bosnia and Herzegovina 13 12 14 2 31 95 95 96 87 100 76 56 39 73 56 58 60 2 2 2 3 1Botswana 18 – – – – – – – – – – – – – – – – – – – – –Burkina Faso 2 3 1 0 9 14 14 14 12 26 24 – – – – – – – – – – –Burundi 5 5 5 4 10 34 35 34 32 38 20 – – – – – – – – – – –Cameroon 30 29 31 4 67 62 64 61 47 72 35 4 0 13 41 30 57 31 30 32 38 19Central African Republic 5 5 6 2 17 74 74 74 70 78 42 1 0 3 49 41 51 61 60 62 58 60Chad 5 5 4 1 16 70 69 70 64 71 29 1 0 2 43 38 50 56 57 56 58 56Congo 16 y 16 y 15 y 2 y 47 y 56 y 53 y 58 y 64 y 58 y 26 y 1 y 0 y 5 y 39 y 24 y 51 y 37 y 38 y 36 y 38 y 38 yCosta Rica 18 17 18 8 40 68 69 66 54 88 52 37 13 70 73 68 74 4 4 4 6 3Côte d'Ivoire 5 5 5 1 15 50 50 51 55 57 40 5 3 13 39 44 35 59 60 58 62 51Democratic People's Republic of Korea 98 98 97 – – 91 88 93 – – 75 79 – – 47 – – 17 17 16 – –
Democratic Republic of the Congo 5 5 5 2 18 61 61 62 62 76 36 1 0 2 29 21 40 60 60 60 69 39Djibouti 14 12 16 – – 37 y 38 y 35 y – – 28 y 15 – – 24 – – 8 8 8 – –Gambia 18 17 19 12 32 48 49 47 50 55 21 1 0 4 42 28 50 21 22 19 25 18Georgia 66 65 67 53 83 84 84 83 67 94 33 51 y 26 y 69 y 38 41 41 8 y 9 y 8 y 4 y 10 yGhana 68 65 72 42 97 40 38 42 23 78 30 6 1 23 41 31 51 21 21 21 27 15Guinea-Bissau 10 10 10 4 26 – – – – – – – – – – – – – – – – –Guyana 49 48 50 33 78 89 88 89 77 99 52 54 28 86 65 67 60 11 13 10 19 6Honduras 19 17 21 13 28 48 47 49 28 75 59 11 1 34 78 74 81 4 5 4 8 2Indonesia 17 16 18 – – – – – – – – – – – – – – – – – – –Iran (Islamic Republic of) 20 y 19 y 22 y – – 70 y 69 y 70 y – – 60 y 36 y – – 67 y – – 15 y 15 y 15 y – –Iraq 4 4 4 1 10 58 58 59 40 78 55 5 1 16 34 34 32 8 8 7 9 8Jamaica 92 92 91 88 100 88 86 90 76 86 28 55 34 73 61 64 56 2 2 2 2 1Jordan 22 y 21 y 23 y 11 y 39 y 82 y 81 y 83 y 75 y 87 y 72 y 23 y 11 y 40 y 70 y 68 y 74 y 9 y 9 y 9 y 11 y 8 yKazakhstan 37 36 38 19 61 92 92 91 84 96 49 48 24 76 45 40 49 4 4 4 5 4Kyrgyzstan 19 21 17 7 47 88 90 85 86 99 54 76 76 85 57 59 54 11 12 9 11 6Lao People's Democratic Republic 23 21 25 5 73 57 58 57 42 87 52 5 1 24 41 29 50 14 15 13 20 8Lebanon 62 63 60 – – 56 y 58 y 54 y – – 74 y 29 – – 16 y – – 9 8 10 – –Mali 10 10 10 1 40 29 27 30 28 44 14 0 0 2 40 33 49 33 33 33 33 36Mauritania 14 14 14 2 41 55 54 55 55 64 28 – – – 40 42 39 26 27 26 24 25Mongolia 58 56 60 25 80 57 54 60 42 71 39 23 6 48 68 74 62 9 9 8 10 6Montenegro 29 28 30 6 62 97 96 98 88 100 79 77 50 92 39 49 33 6 8 5 11 3Morocco 39 36 41 6 78 35 y 34 y 35 y 16 y 59 y 58 y 21 y 9 y 52 y 14 y 19 y 7 y 11 – – – –Mozambique – – – – – 47 45 48 48 50 20 3 2 10 – – – 33 33 32 – –
TABLE 14. EARLY CHILDHOOD DEVELOPMENT
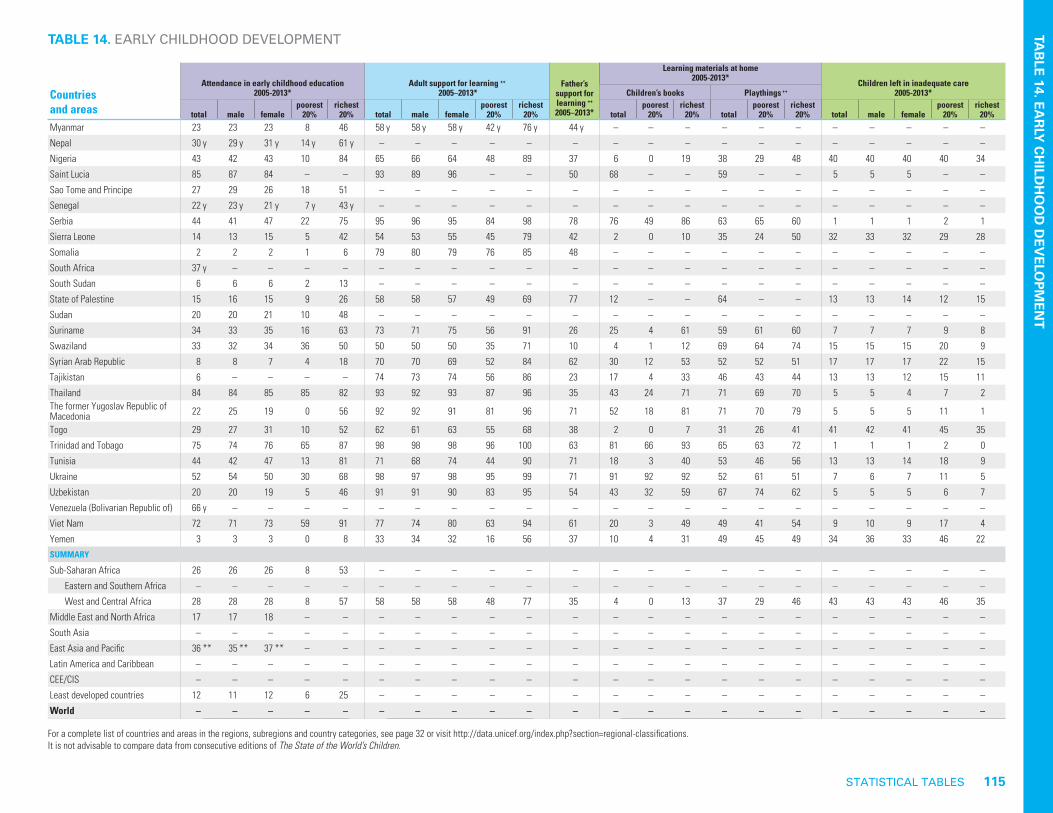
STATISTICAL TABLES 115
TABLE 14. EARLY CHILDHOOD DEVELOPMENT
Myanmar 23 23 23 8 46 58 y 58 y 58 y 42 y 76 y 44 y – – – – – – – – – – –Nepal 30 y 29 y 31 y 14 y 61 y – – – – – – – – – – – – – – – – –Nigeria 43 42 43 10 84 65 66 64 48 89 37 6 0 19 38 29 48 40 40 40 40 34Saint Lucia 85 87 84 – – 93 89 96 – – 50 68 – – 59 – – 5 5 5 – –Sao Tome and Principe 27 29 26 18 51 – – – – – – – – – – – – – – – – –Senegal 22 y 23 y 21 y 7 y 43 y – – – – – – – – – – – – – – – – –Serbia 44 41 47 22 75 95 96 95 84 98 78 76 49 86 63 65 60 1 1 1 2 1Sierra Leone 14 13 15 5 42 54 53 55 45 79 42 2 0 10 35 24 50 32 33 32 29 28Somalia 2 2 2 1 6 79 80 79 76 85 48 – – – – – – – – – – –South Africa 37 y – – – – – – – – – – – – – – – – – – – – –South Sudan 6 6 6 2 13 – – – – – – – – – – – – – – – – –State of Palestine 15 16 15 9 26 58 58 57 49 69 77 12 – – 64 – – 13 13 14 12 15Sudan 20 20 21 10 48 – – – – – – – – – – – – – – – – –Suriname 34 33 35 16 63 73 71 75 56 91 26 25 4 61 59 61 60 7 7 7 9 8Swaziland 33 32 34 36 50 50 50 50 35 71 10 4 1 12 69 64 74 15 15 15 20 9Syrian Arab Republic 8 8 7 4 18 70 70 69 52 84 62 30 12 53 52 52 51 17 17 17 22 15Tajikistan 6 – – – – 74 73 74 56 86 23 17 4 33 46 43 44 13 13 12 15 11Thailand 84 84 85 85 82 93 92 93 87 96 35 43 24 71 71 69 70 5 5 4 7 2The former Yugoslav Republic of Macedonia 22 25 19 0 56 92 92 91 81 96 71 52 18 81 71 70 79 5 5 5 11 1
Togo 29 27 31 10 52 62 61 63 55 68 38 2 0 7 31 26 41 41 42 41 45 35Trinidad and Tobago 75 74 76 65 87 98 98 98 96 100 63 81 66 93 65 63 72 1 1 1 2 0Tunisia 44 42 47 13 81 71 68 74 44 90 71 18 3 40 53 46 56 13 13 14 18 9Ukraine 52 54 50 30 68 98 97 98 95 99 71 91 92 92 52 61 51 7 6 7 11 5Uzbekistan 20 20 19 5 46 91 91 90 83 95 54 43 32 59 67 74 62 5 5 5 6 7Venezuela (Bolivarian Republic of) 66 y – – – – – – – – – – – – – – – – – – – – –Viet Nam 72 71 73 59 91 77 74 80 63 94 61 20 3 49 49 41 54 9 10 9 17 4Yemen 3 3 3 0 8 33 34 32 16 56 37 10 4 31 49 45 49 34 36 33 46 22SUMMARY
Sub-Saharan Africa 26 26 26 8 53 – – – – – – – – – – – – – – – – – Eastern and Southern Africa – – – – – – – – – – – – – – – – – – – – – – West and Central Africa 28 28 28 8 57 58 58 58 48 77 35 4 0 13 37 29 46 43 43 43 46 35Middle East and North Africa 17 17 18 – – – – – – – – – – – – – – – – – – –South Asia – – – – – – – – – – – – – – – – – – – – – –East Asia and Pacific 36 ** 35 ** 37 ** – – – – – – – – – – – – – – – – – – –Latin America and Caribbean – – – – – – – – – – – – – – – – – – – – – –CEE/CIS – – – – – – – – – – – – – – – – – – – – – –Least developed countries 12 11 12 6 25 – – – – – – – – – – – – – – – – –World – – – – – – – – – – – – – – – – – – – – – –
For a complete list of countries and areas in the regions, subregions and country categories, see page 32 or visit http://data.unicef.org/index.php?section=regional-classifications.It is not advisable to compare data from consecutive editions of The State of the World’s Children.
Countries and areas
Attendance in early childhood education2005-2013*
Adult support for learning ++
2005–2013*Father’s
support for learning ++
2005–2013*
Learning materials at home 2005-2013* Children left in inadequate care
2005-2013*Children’s books Playthings ++
total male femalepoorest
20%richest
20% total male femalepoorest
20%richest
20% totalpoorest
20%richest
20% totalpoorest
20%richest
20% total male femalepoorest
20%richest
20%
TAB
LE 14. EAR
LY C
HILD
HO
OD
DEV
ELOPM
ENT

116 THE STATE OF THE WORLD’S CHILDREN 2015
TABLE 14. EARLY CHILDHOOD DEVELOPMENT
DEFINITIONS OF THE INDICATORS
Attendance in early childhood education – Percentage of children 36–59 months old who are attending an early childhood education programme.Adult support for learning – Percentage of children 36–59 months old with whom an adult has engaged in four or more of the following activities to promote learning and school readiness in the past 3 days: a) reading books to the child, b) telling stories to the child, c) singing songs to the child, d) taking the child outside the home, e) playing with the child, and f) spending time with the child naming, counting or drawing things.Father’s support for learning – Percentage of children 36–59 months old whose father has engaged in one or more of the following activities to promote learning and school readiness in the past 3 days: a) reading books to the child, b) telling stories to the child, c) singing songs to the child, d) taking the child outside the home, e) playing with the child, and f) spending time with the child naming, counting or drawing things.Learning materials at home: Children’s books – Percentage of children 0–59 months old who have three or more children’s books at home.Learning materials at home: Playthings – Percentage of children 0–59 months old with two or more of the following playthings at home: household objects or objects found outside (sticks, rocks, animals, shells, leaves etc.), homemade toys or toys that came from a store.Children left in inadequate care – Percentage of children 0–59 months old left alone or in the care of another child younger than 10 years of age for more than one hour at least once in the past week.
MAIN DATA SOURCES
NOTES
Attendance in early childhood education – Demographic and Health Surveys (DHS), Multiple Indicator Cluster Surveys (MICS) and other national surveys.Adult support for learning – DHS, MICS and other national surveys.Father’s support for learning – DHS, MICS and other national surveys.Learning materials at home: Children’s books – DHS, MICS and other national surveys.Learning materials at home: Playthings – DHS, MICS and other national surveys.Children left in inadequate care – DHS, MICS and other national surveys.
– Data not available.y Data differ from the standard definition or refer to only part of a country. If they fall within the noted reference period, such
data are included in the calculation of regional and global averages.* Data refer to the most recent year available during the period specified in the column heading.++ Changes in the definitions of several ECD indicators were made between the third and fourth round of MICS (MICS3 and
MICS4). In order to allow for comparability with MICS4, data from MICS3 for the adult support for learning, father’s support for learning and learning materials at home (playthings) indicators were recalculated according to MICS4 indicator defini-tions. Therefore, the recalculated data presented here will differ from estimates reported in MICS3 national reports.


Published by UNICEF Division of Communication 3 United Nations Plaza New York, NY 10017, USA [email protected] www.unicef.org http://data.unicef.org
ISBN: 978-92-806-4780-8
© United Nations Children’s Fund (UNICEF) November 2014
The State of the World’s Children 2015: Reimagine the Future: Innovation for Every Child digital report is available at <http://sowc2015.unicef.org>
Around the world, an innovation revolution for children is growing – often in the most unexpected places – and increasingly led by young people themselves.
Fueled by creativity, connectivity and collaboration, new ways of solving problems are emerging – in tech design studios and university laboratories, in development organizations and corporations, and in kitchens and community centres.
To mark the 25th anniversary of the Convention of the Rights of the Child, this edition of The State of the World’s Children highlights the work of remarkable young innovators who are already reimagining the future – and invites the world to join this rising movement to advance the rights of every child.
#EVERYchild