Sovereign Wealth Funds and Infrastructure: A Perspective … · Sovereign Wealth Funds and...
31
14 May 2010 – Bogotá Sovereign Wealth Funds and Infrastructure: A Perspective for Latin America Rolando Avendaño Javier Santiso OECD Development Centre Seminar on Infrastructure Financing in Latin America CAF-IFC-OECD
Transcript of Sovereign Wealth Funds and Infrastructure: A Perspective … · Sovereign Wealth Funds and...
14 May 2010 – Bogotá
Sovereign Wealth Funds and Infrastructure: A Perspective for Latin
America
Rolando AvendañoJavier Santiso
OECD Development Centre
Seminar on Infrastructure Financing in Latin AmericaCAF-IFC-OECD
Latin America’s Infrastructure needs in the long run 1
Sovereign Wealth Funds: New Investment Drivers2
Looking and Emerging Economies: Infrastructure and Commodities3
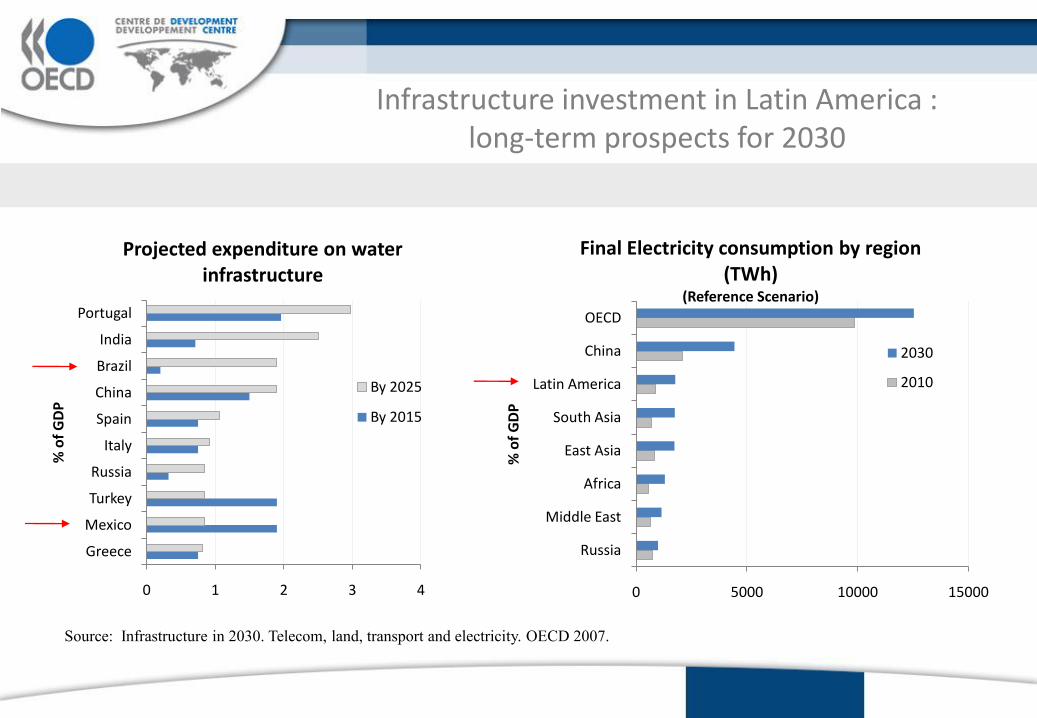
Infrastructure investment in Latin America : long-term prospects for 2030
0 1 2 3 4
Greece
Mexico
Turkey
Russia
Italy
Spain
China
Brazil
India
Portugal
% o
f G
DP
Projected expenditure on water infrastructure
By 2025
By 2015
0 5000 10000 15000
Russia
Middle East
Africa
East Asia
South Asia
Latin America
China
OECD
% o
f G
DP
Final Electricity consumption by region (TWh)
(Reference Scenario)
2030
2010
Source: Infrastructure in 2030. Telecom, land, transport and electricity. OECD 2007.
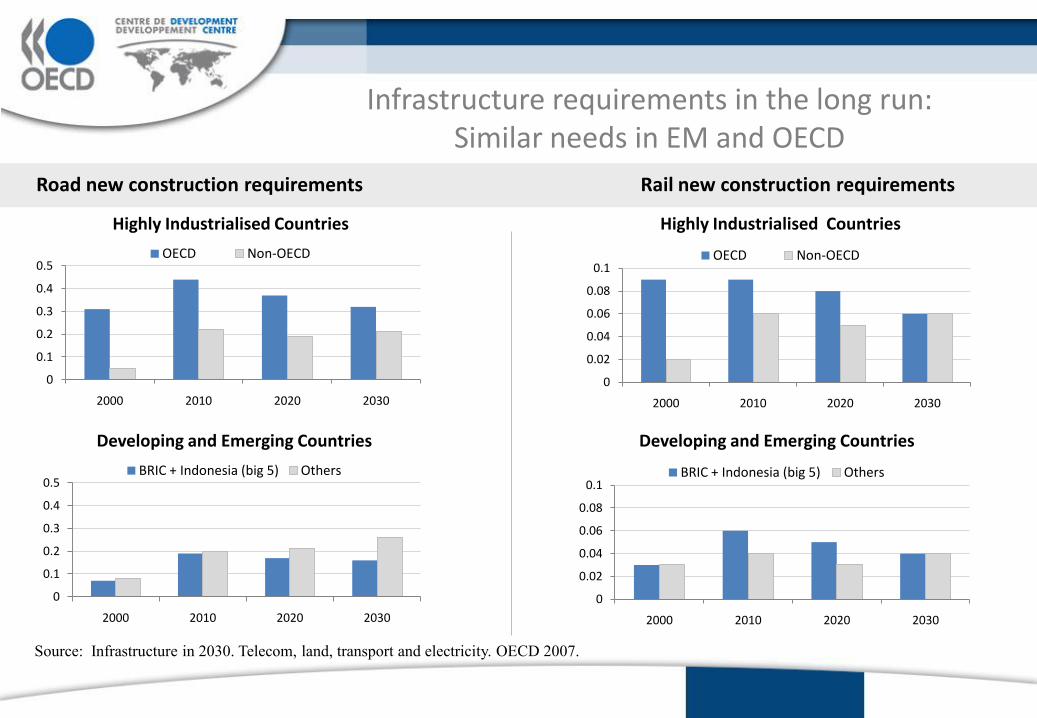
Infrastructure requirements in the long run:Similar needs in EM and OECD
0
0.1
0.2
0.3
0.4
0.5
2000 2010 2020 2030
Highly Industrialised Countries
OECD Non-OECD
0
0.1
0.2
0.3
0.4
0.5
2000 2010 2020 2030
Developing and Emerging Countries
BRIC + Indonesia (big 5) Others
0
0.02
0.04
0.06
0.08
0.1
2000 2010 2020 2030
Highly Industrialised Countries
OECD Non-OECD
0
0.02
0.04
0.06
0.08
0.1
2000 2010 2020 2030
Developing and Emerging Countries
BRIC + Indonesia (big 5) Others
Road new construction requirements Rail new construction requirements
Source: Infrastructure in 2030. Telecom, land, transport and electricity. OECD 2007.
Latin America’s Infrastructure needs in the long run 1
Sovereign Wealth Funds: New Investment Drivers2
Looking and Emerging Economies: Infrastructure and Commodities3
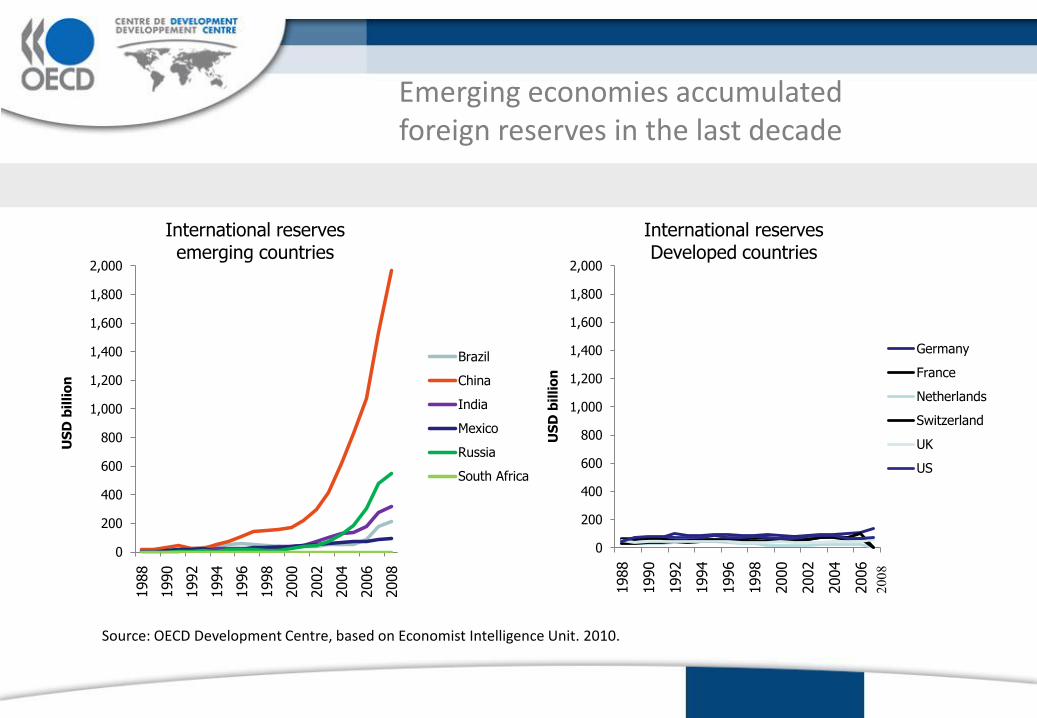
Emerging economies accumulated foreign reserves in the last decade
0
200
400
600
800
1,000
1,200
1,400
1,600
1,800
2,000
1988
1990
1992
1994
1996
1998
2000
2002
2004
2006
2008
US
D b
illi
on
International reserves emerging countries
Brazil
China
India
Mexico
Russia
South Africa
0
200
400
600
800
1,000
1,200
1,400
1,600
1,800
2,000
1988
1990
1992
1994
1996
1998
2000
2002
2004
2006
US
D b
illi
on
International reservesDeveloped countries
Germany
France
Netherlands
Switzerland
UK
US
Source: OECD Development Centre, based on Economist Intelligence Unit. 2010.
2008
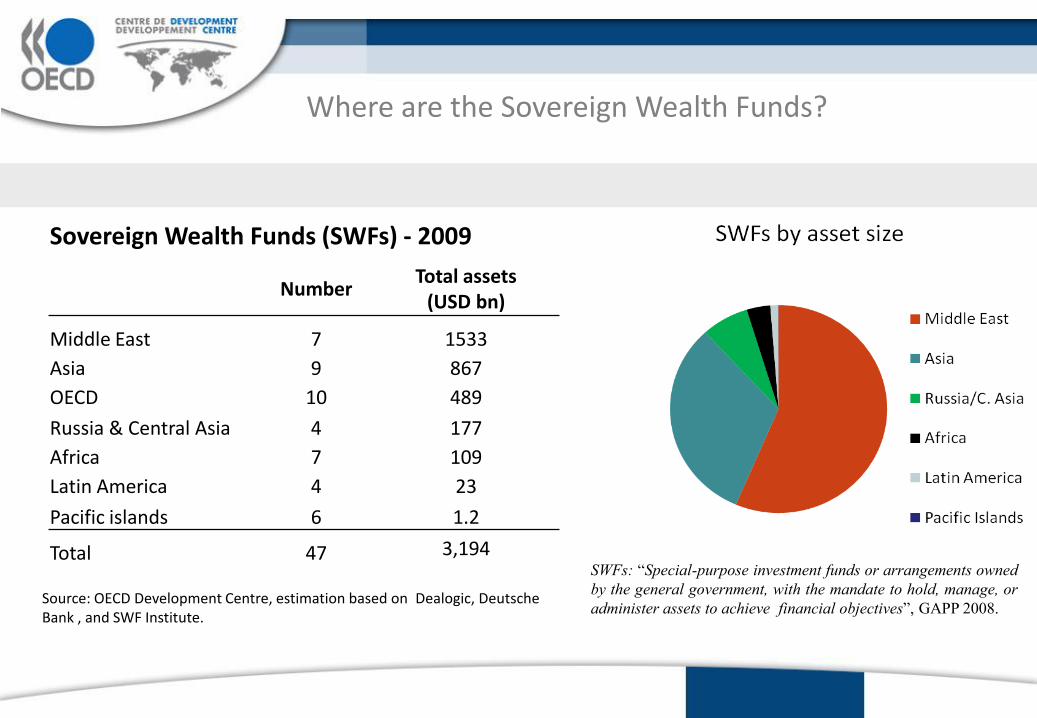
Where are the Sovereign Wealth Funds?
Sovereign Wealth Funds (SWFs) - 2009
NumberTotal assets
(USD bn)
Middle East 7 1533
Asia 9 867
OECD 10 489
Russia & Central Asia 4 177
Africa 7 109
Latin America 4 23
Pacific islands 6 1.2
Total 47 3,194
Source: OECD Development Centre, estimation based on Dealogic, Deutsche Bank , and SWF Institute.
SWFs: “Special-purpose investment funds or arrangements owned
by the general government, with the mandate to hold, manage, or
administer assets to achieve financial objectives”, GAPP 2008.
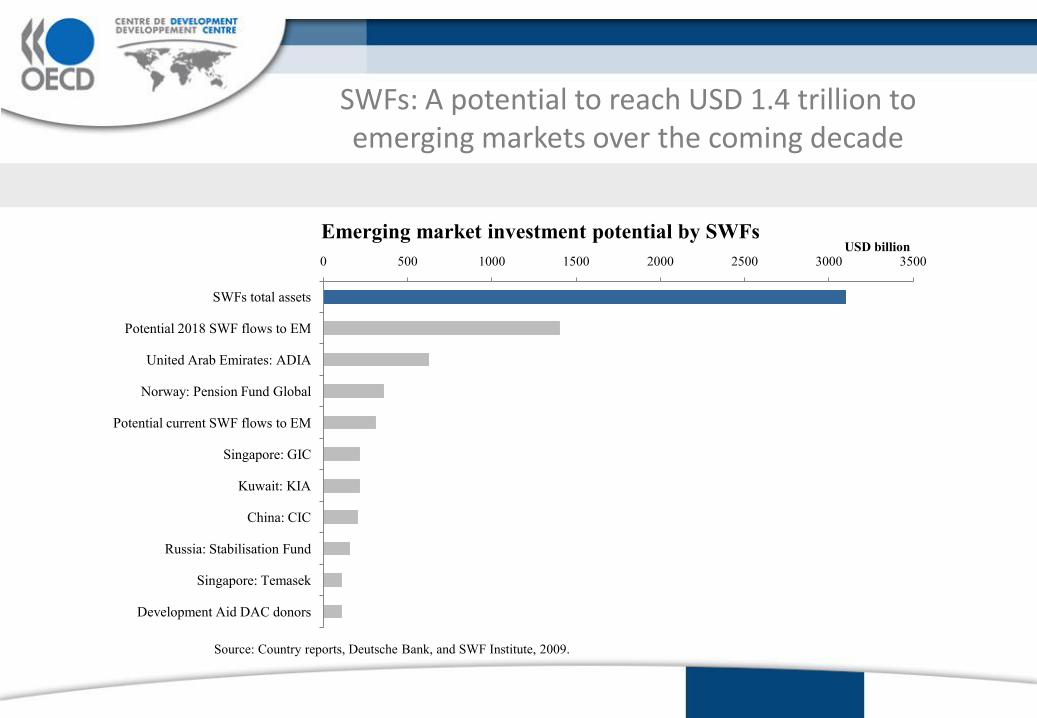
0 500 1000 1500 2000 2500 3000 3500
SWFs total assets
Potential 2018 SWF flows to EM
United Arab Emirates: ADIA
Norway: Pension Fund Global
Potential current SWF flows to EM
Singapore: GIC
Kuwait: KIA
China: CIC
Russia: Stabilisation Fund
Singapore: Temasek
Development Aid DAC donors
USD billionEmerging market investment potential by SWFs
Source: Country reports, Deutsche Bank, and SWF Institute, 2009.
SWFs: A potential to reach USD 1.4 trillion to emerging markets over the coming decade
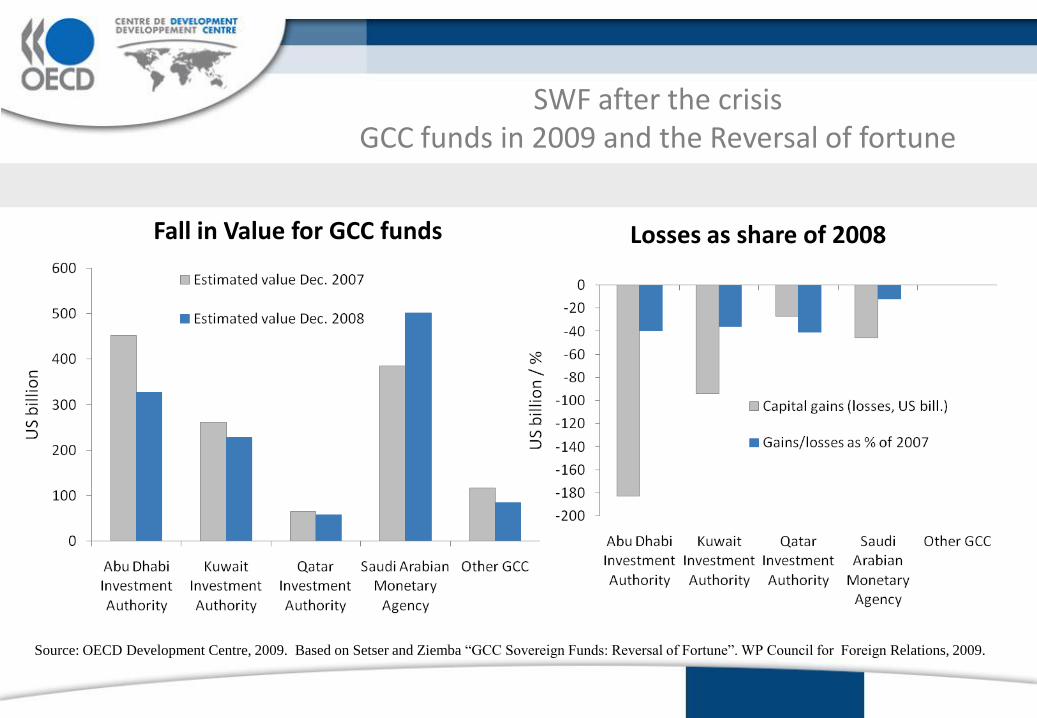
SWF after the crisis GCC funds in 2009 and the Reversal of fortune
Source: OECD Development Centre, 2009. Based on Setser and Ziemba “GCC Sovereign Funds: Reversal of Fortune”. WP Council for Foreign Relations, 2009.
Losses as share of 2008Fall in Value for GCC funds
-60
-50
-40
-30
-20
-10
0
Blackstone Bear StearsMorgan Stanley
Pe
rfo
rman
ce (
%)
China
-60
-50
-40
-30
-20
-10
0
10
AMD Citi Carlyle
Pe
rfo
rman
ce (
%)
Abu Dhabi
-60
-50
-40
-30
-20
-10
0
Blackstone Bear StearsMorgan Stanley
Pe
rfo
rman
ce (
%)
Dubai
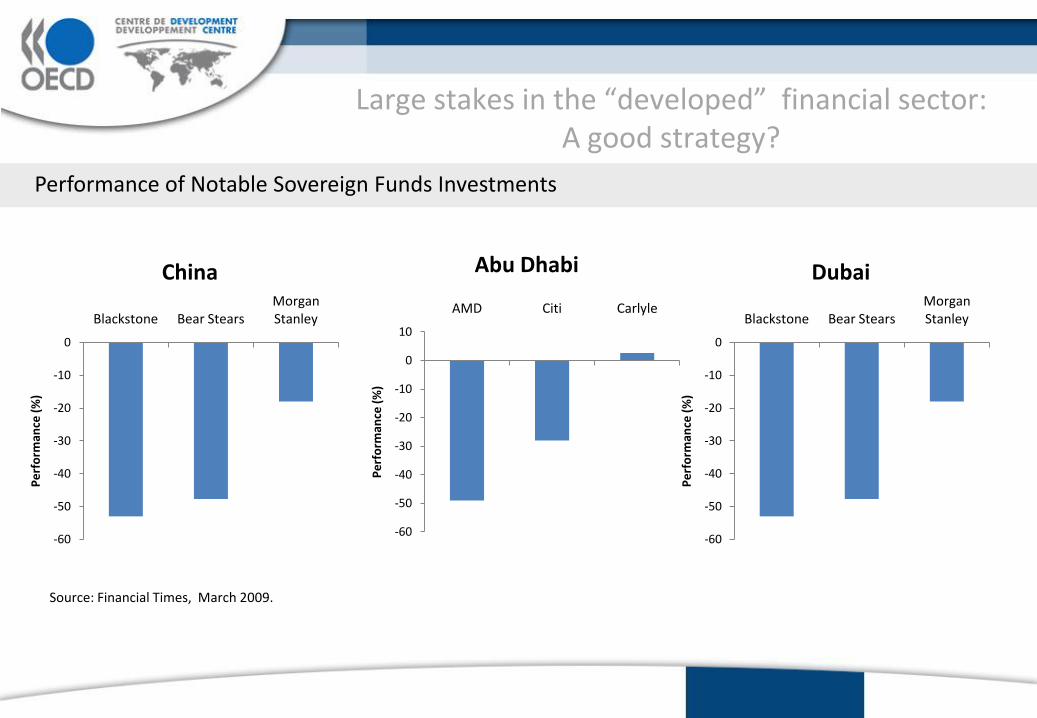
Source: Financial Times, March 2009.
Performance of Notable Sovereign Funds Investments
Large stakes in the “developed” financial sector: A good strategy?
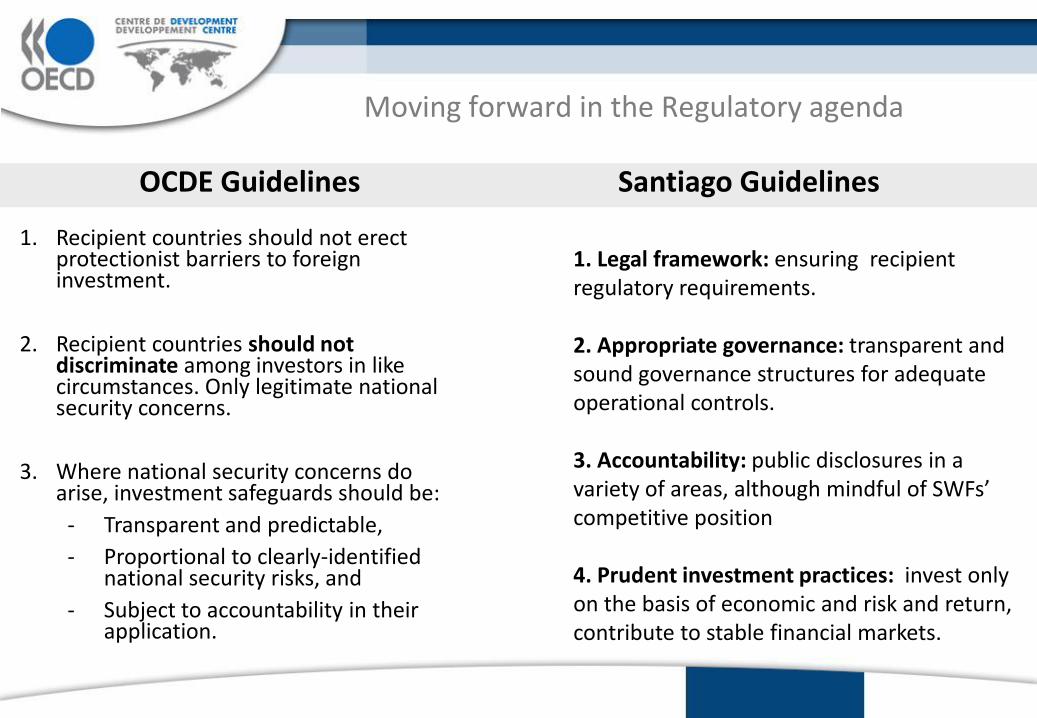
Moving forward in the Regulatory agenda
1. Legal framework: ensuring recipient regulatory requirements.
2. Appropriate governance: transparent and sound governance structures for adequateoperational controls.
3. Accountability: public disclosures in a variety of areas, although mindful of SWFs’ competitive position
4. Prudent investment practices: invest only on the basis of economic and risk and return, contribute to stable financial markets.
Santiago Guidelines
1. Recipient countries should not erect protectionist barriers to foreign investment.
2. Recipient countries should not discriminate among investors in like circumstances. Only legitimate national security concerns.
3. Where national security concerns do arise, investment safeguards should be:
- Transparent and predictable,
- Proportional to clearly-identified national security risks, and
- Subject to accountability in their application.
OCDE Guidelines
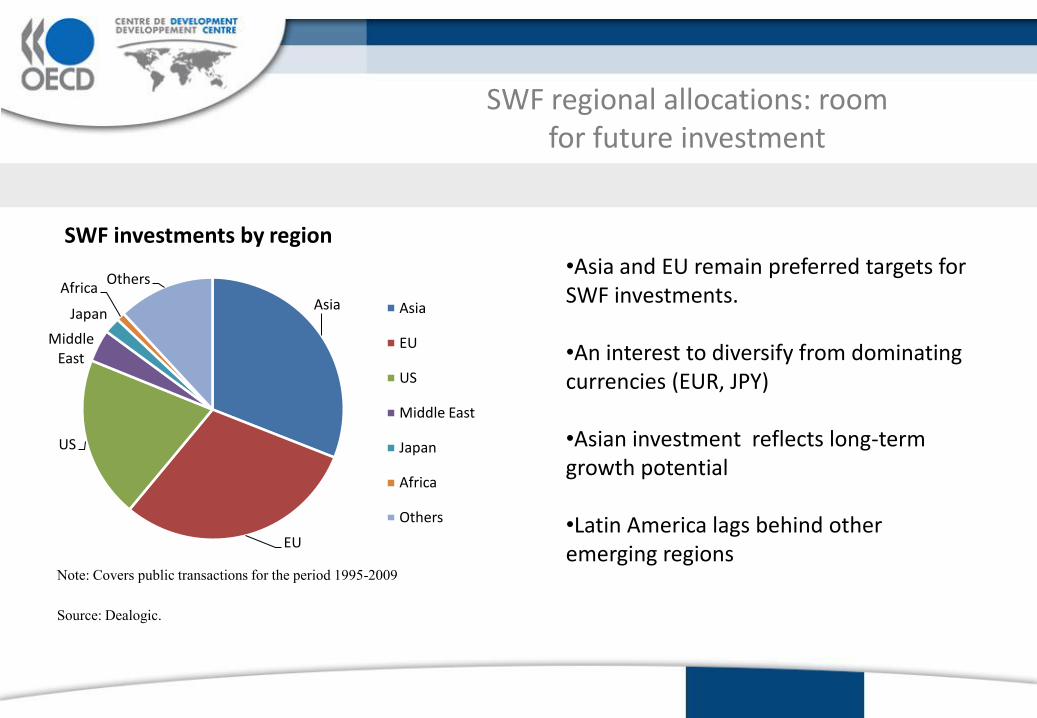
SWF regional allocations: room for future investment
Asia
EU
US
Middle East
Japan
AfricaOthers
Asia
EU
US
Middle East
Japan
Africa
Others
•Asia and EU remain preferred targets for SWF investments.
•An interest to diversify from dominating currencies (EUR, JPY)
•Asian investment reflects long-term growth potential
•Latin America lags behind other emerging regions
Note: Covers public transactions for the period 1995-2009
Source: Dealogic.
SWF investments by region
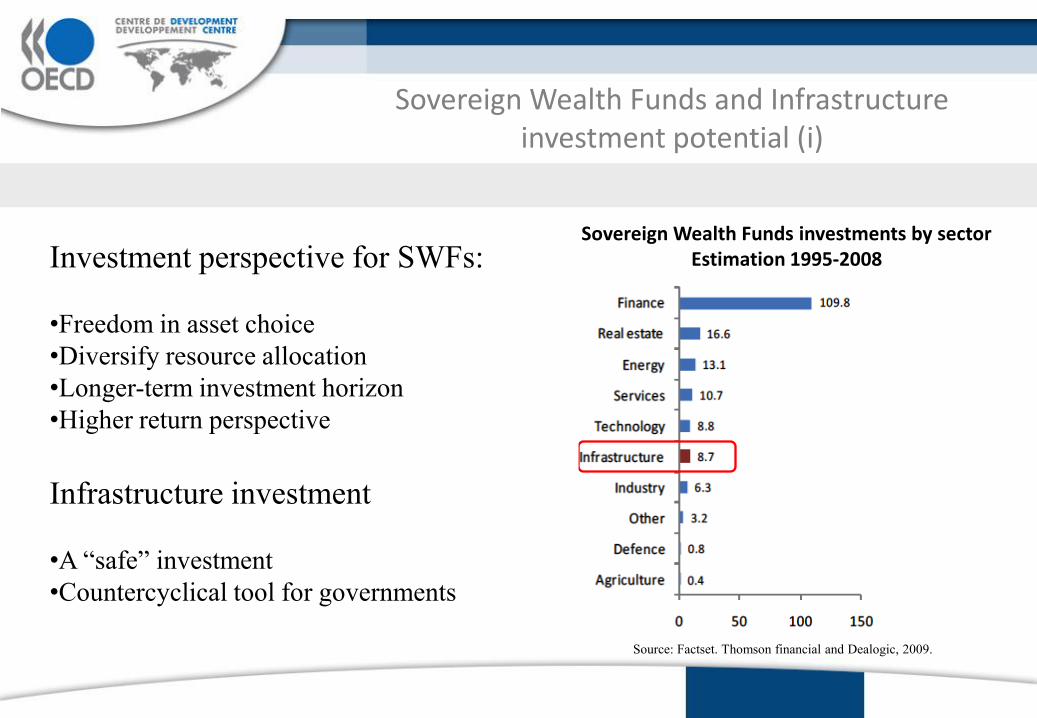
Sovereign Wealth Funds and Infrastructure investment potential (i)
Investment perspective for SWFs:
•Freedom in asset choice
•Diversify resource allocation
•Longer-term investment horizon
•Higher return perspective
Infrastructure investment
•A “safe” investment
•Countercyclical tool for governments
Source: Factset. Thomson financial and Dealogic, 2009.
Sovereign Wealth Funds investments by sectorEstimation 1995-2008
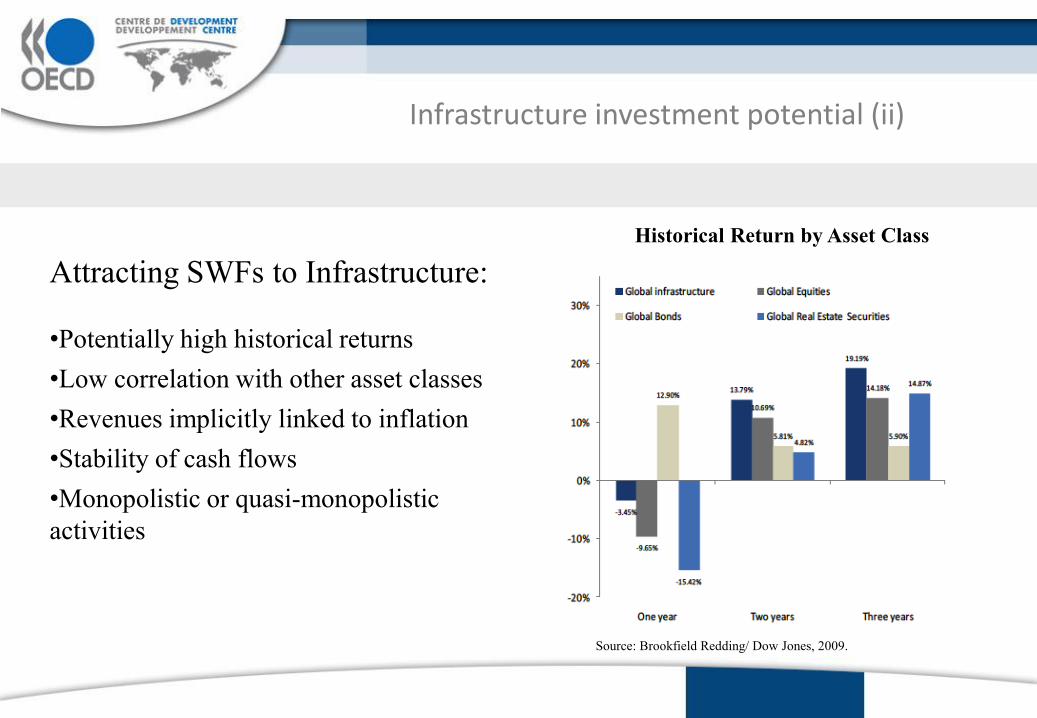
Infrastructure investment potential (ii)
Attracting SWFs to Infrastructure:
•Potentially high historical returns
•Low correlation with other asset classes
•Revenues implicitly linked to inflation
•Stability of cash flows
•Monopolistic or quasi-monopolistic
activities
Source: Brookfield Redding/ Dow Jones, 2009.
Historical Return by Asset Class
Looking at the data: SWFs and other Institutional investors
• Using data on equity holdings for a set of SWFs, we compare their investments to private mutual funds (index and actively managed).
• Source: FactSet and Thomson Financial on portfolio holdings of institutional and private funds. Mandatory filings with national regulatory agencies (e.g. 13 filings with SEC, share register with UK), annual reports and primary sources.
• SWFs: 22 funds – 14.000 holdings
• Mutual funds: 25 largest US funds – 11.600 holdings
• Period studied: 2006-2009
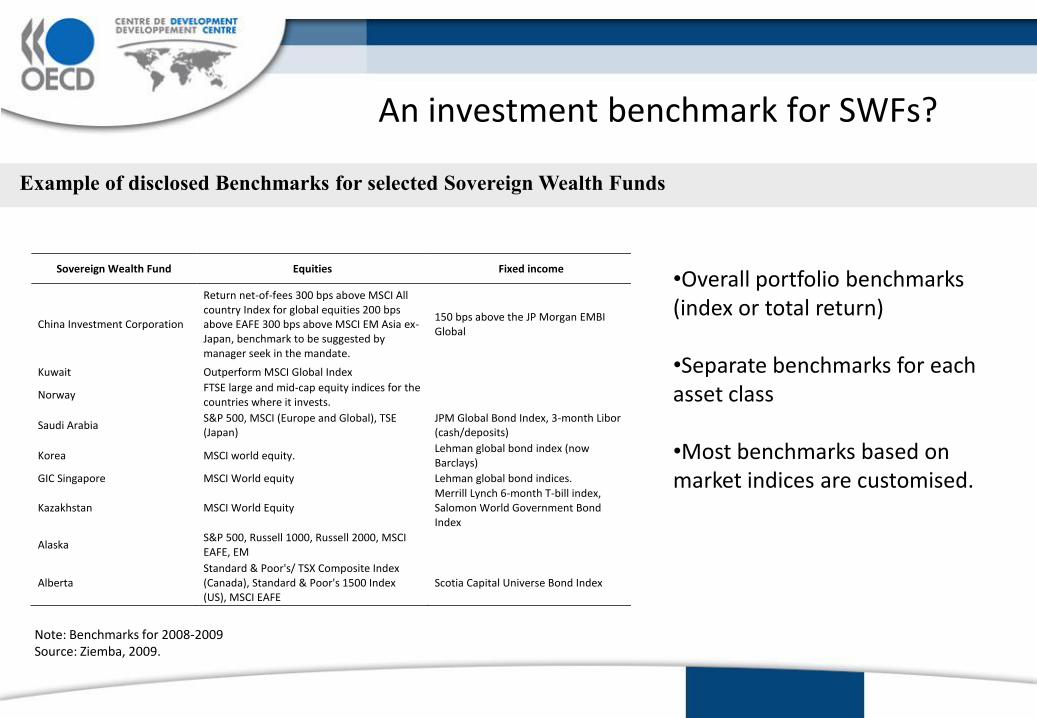
Sovereign Wealth Fund Equities Fixed income
China Investment Corporation
Return net-of-fees 300 bps above MSCI All country Index for global equities 200 bps above EAFE 300 bps above MSCI EM Asia ex-Japan, benchmark to be suggested by manager seek in the mandate.
150 bps above the JP Morgan EMBI Global
Kuwait Outperform MSCI Global Index
Norway FTSE large and mid-cap equity indices for the countries where it invests.
Saudi Arabia S&P 500, MSCI (Europe and Global), TSE (Japan)
JPM Global Bond Index, 3-month Libor (cash/deposits)
Korea MSCI world equity. Lehman global bond index (now Barclays)
GIC Singapore MSCI World equity Lehman global bond indices.
Kazakhstan MSCI World Equity Merrill Lynch 6-month T-bill index, Salomon World Government Bond Index
Alaska S&P 500, Russell 1000, Russell 2000, MSCI EAFE, EM
Alberta Standard & Poor's/ TSX Composite Index (Canada), Standard & Poor's 1500 Index (US), MSCI EAFE
Scotia Capital Universe Bond Index
Example of disclosed Benchmarks for selected Sovereign Wealth Funds
Note: Benchmarks for 2008-2009Source: Ziemba, 2009.
An investment benchmark for SWFs?
•Overall portfolio benchmarks (index or total return)
•Separate benchmarks for each asset class
•Most benchmarks based on market indices are customised.
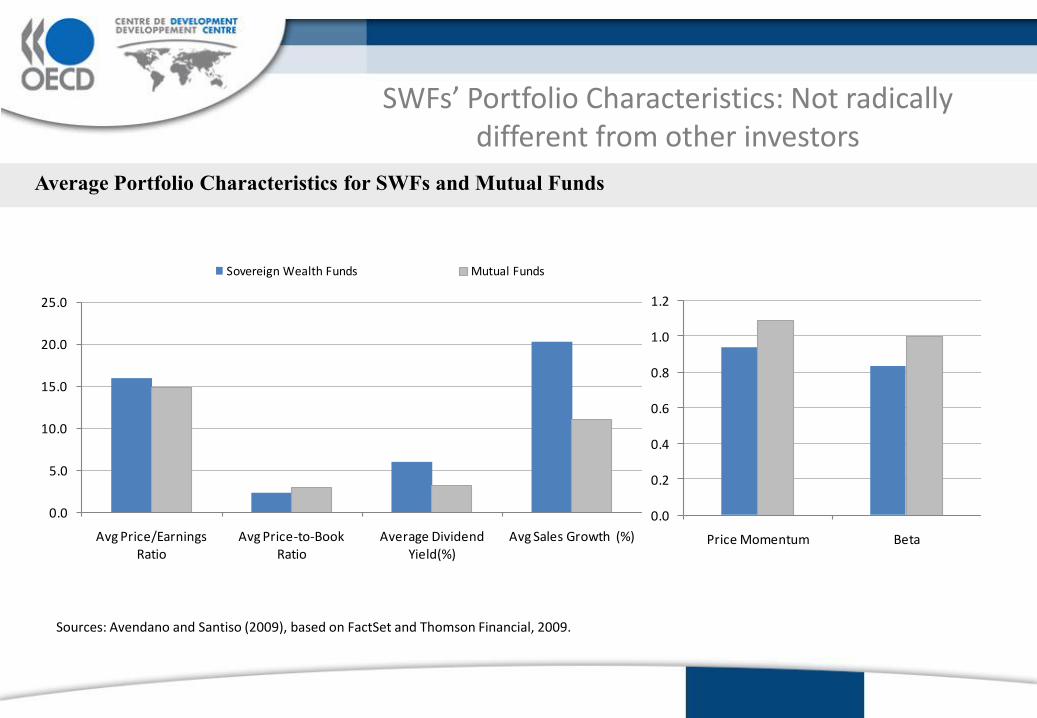
Average Portfolio Characteristics for SWFs and Mutual Funds
Sources: Avendano and Santiso (2009), based on FactSet and Thomson Financial, 2009.
0.0
5.0
10.0
15.0
20.0
25.0
Avg Price/Earnings Ratio
Avg Price-to-Book Ratio
Average Dividend Yield(%)
Avg Sales Growth (%)
Sovereign Wealth Funds Mutual Funds
0.0
0.2
0.4
0.6
0.8
1.0
1.2
Price Momentum Beta
SWFs’ Portfolio Characteristics: Not radically different from other investors
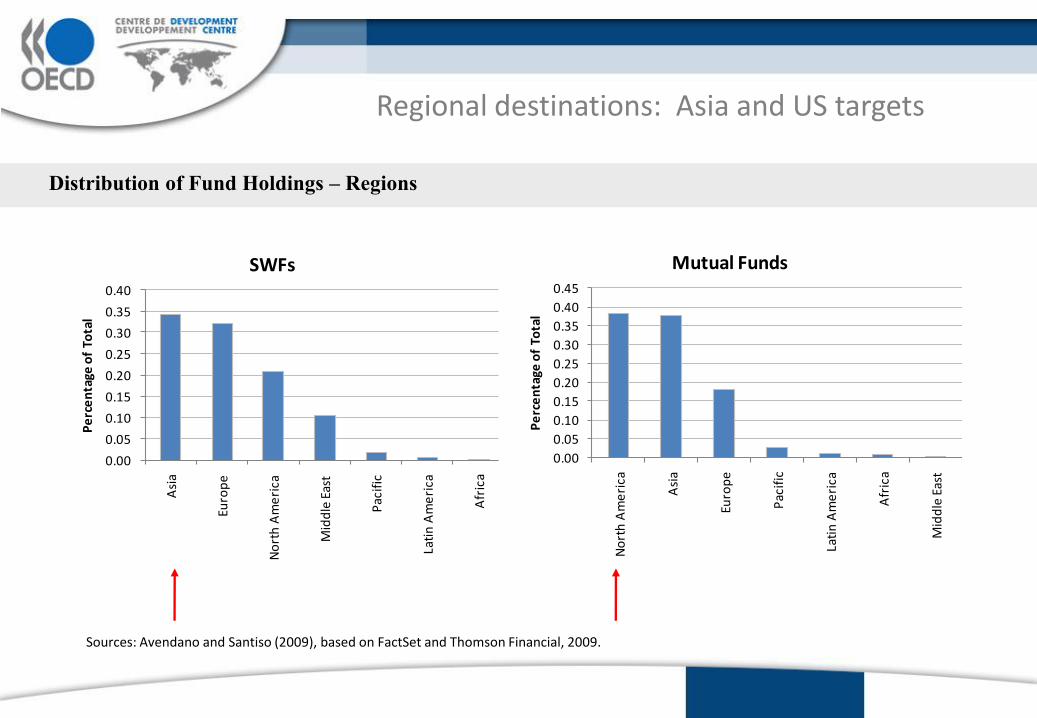
Distribution of Fund Holdings – Regions
0.00
0.05
0.10
0.15
0.20
0.25
0.30
0.35
0.40
Asi
a
Euro
pe
No
rth
Am
eri
ca
Mid
dle
Eas
t
Pac
ific
Lati
n A
me
rica
Afr
ica
Pe
rce
nta
ge o
f To
tal
SWFs
0.00
0.05
0.10
0.15
0.20
0.25
0.30
0.35
0.40
0.45
No
rth
Am
eri
ca
Asi
a
Euro
pe
Pac
ific
Lati
n A
me
rica
Afr
ica
Mid
dle
Eas
t
Pe
rce
nta
ge o
f To
tal
Mutual Funds
Regional destinations: Asia and US targets
Sources: Avendano and Santiso (2009), based on FactSet and Thomson Financial, 2009.
0.00
0.05
0.10
0.15
0.20
0.25
0.30
0.35
Fin
ance
Co
mm
un
icat
ion
s
Tran
spo
rtat
ion
Ene
rgy
Min
era
ls
Co
nsu
me
r D
ura
ble
s
Co
nsu
me
r N
on
-Du
rab
les
Uti
litie
s
He
alth
Te
chn
olo
gy
Ele
ctro
nic
Te
chn
olo
gy
Ind
ust
rial
Se
rvic
es
No
n-E
ne
rgy
Min
era
ls
Pro
du
cer
Man
ufa
ctu
rin
g
SWFs
0.000.050.100.150.200.250.300.350.40
Fin
ance
Ind
ust
rial
Se
rvic
es
He
alth
Te
chn
olo
gy
Ene
rgy
Min
era
ls
Co
nsu
me
r N
on
-Du
rab
les
Re
tail
Trad
e
Uti
litie
s
Co
nsu
me
r Se
rvic
es
Co
nsu
me
r D
ura
ble
s
Tech
no
logy
Se
rvic
es
Pro
du
cer
Man
ufa
ctu
rin
g
Co
mm
un
icat
ion
s
Mutual Funds
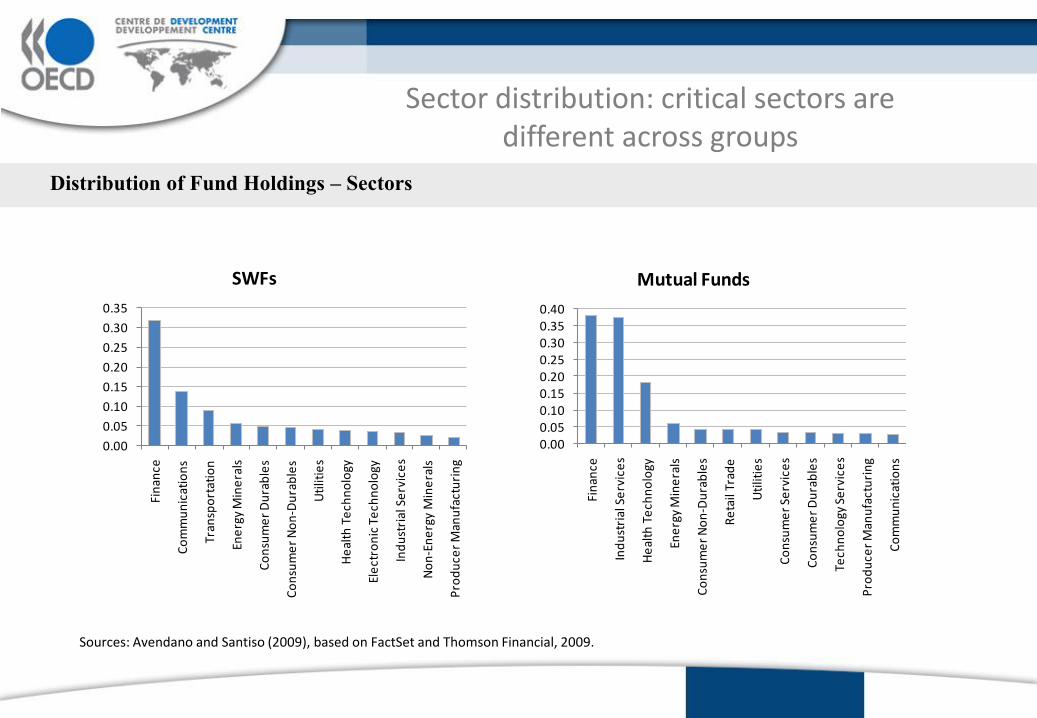
Distribution of Fund Holdings – Sectors
Sector distribution: critical sectors aredifferent across groups
Sources: Avendano and Santiso (2009), based on FactSet and Thomson Financial, 2009.
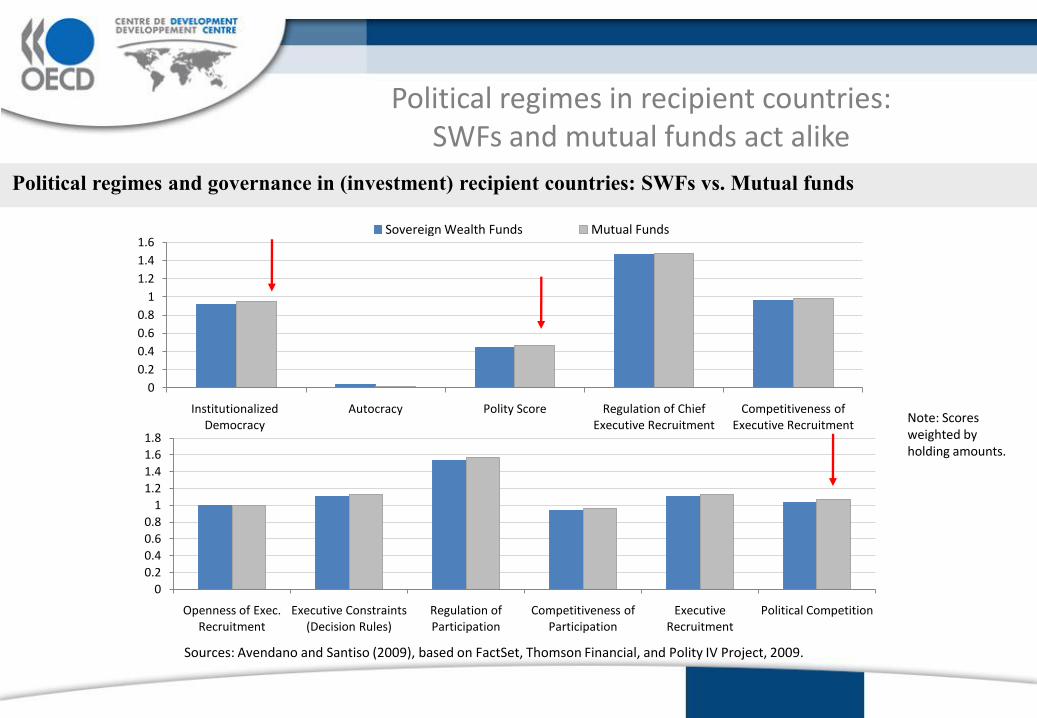
Political regimes in recipient countries:SWFs and mutual funds act alike
Sources: Avendano and Santiso (2009), based on FactSet, Thomson Financial, and Polity IV Project, 2009.
Political regimes and governance in (investment) recipient countries: SWFs vs. Mutual funds
0
0.2
0.4
0.6
0.8
1
1.2
1.4
1.6
Institutionalized Democracy
Autocracy Polity Score Regulation of Chief Executive Recruitment
Competitiveness of Executive Recruitment
Sovereign Wealth Funds Mutual Funds
0
0.2
0.4
0.6
0.8
1
1.2
1.4
1.6
1.8
Openness of Exec. Recruitment
Executive Constraints (Decision Rules)
Regulation of Participation
Competitiveness of Participation
Executive Recruitment
Political Competition
Note: Scores weighted by holding amounts.

Latin America’s Infrastructure needs in the long run 1
Sovereign Wealth Funds: New Investment Drivers2
Looking and Emerging Economies: Infrastructure and Commodities3
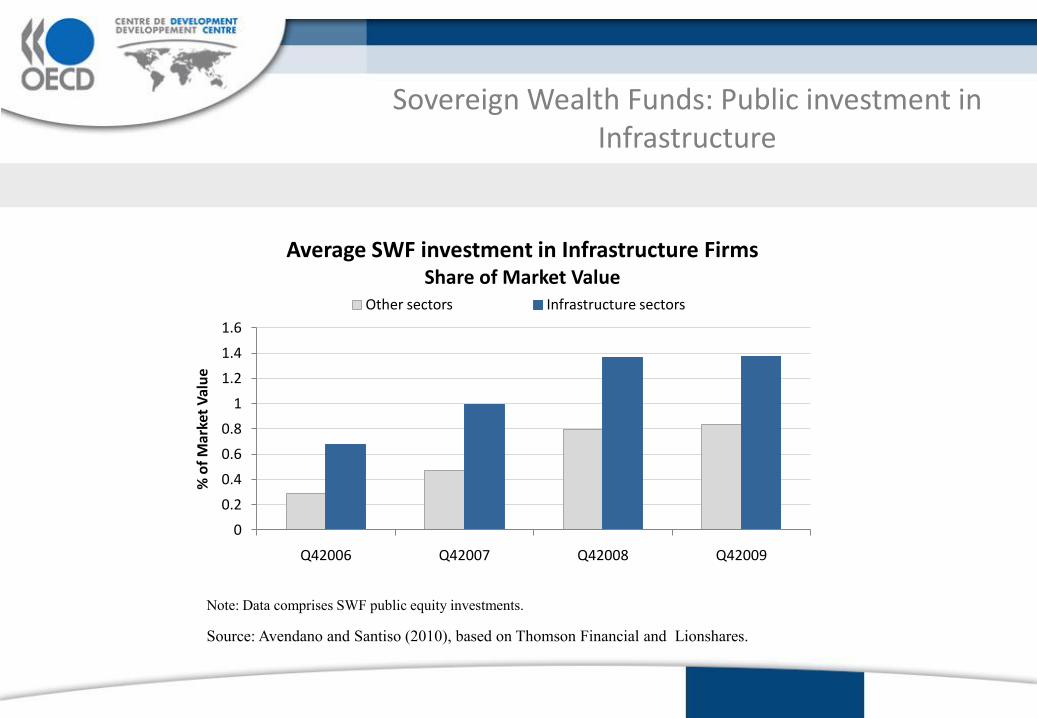
Sovereign Wealth Funds: Public investment in Infrastructure
Source: Avendano and Santiso (2010), based on Thomson Financial and Lionshares.
0
0.2
0.4
0.6
0.8
1
1.2
1.4
1.6
Q42006 Q42007 Q42008 Q42009
% o
f M
arke
t V
alu
e
Average SWF investment in Infrastructure FirmsShare of Market Value
Other sectors Infrastructure sectors
Note: Data comprises SWF public equity investments.
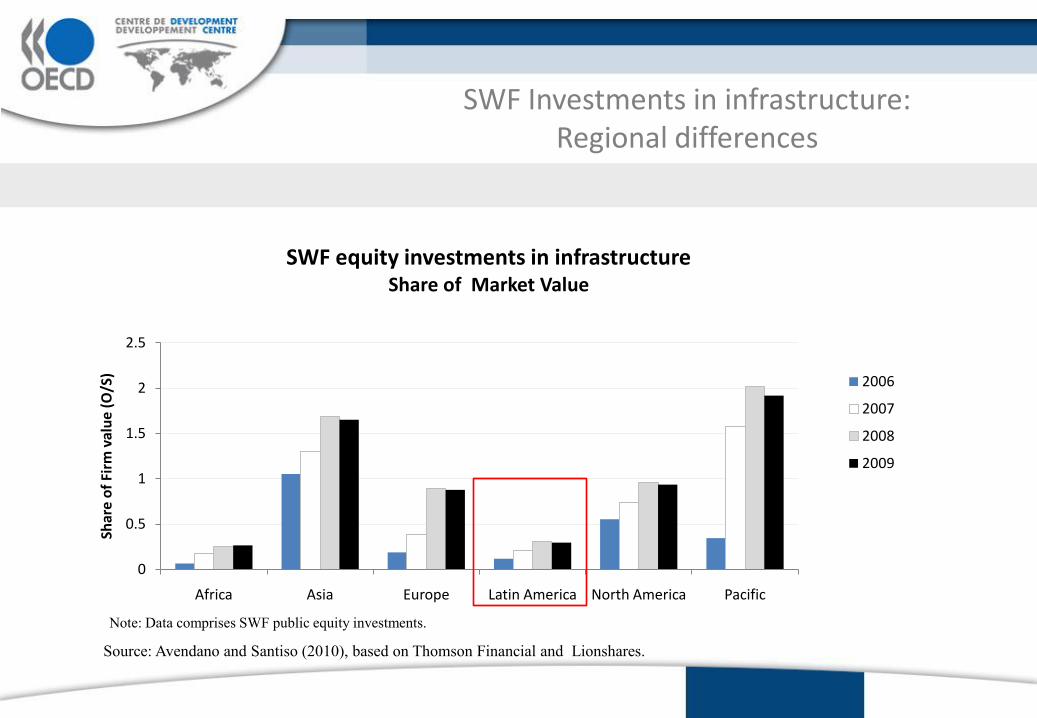
SWF Investments in infrastructure:Regional differences
0
0.5
1
1.5
2
2.5
Africa Asia Europe Latin America North America Pacific
Shar
e o
f Fi
rm v
alu
e (O
/S)
SWF equity investments in infrastructure Share of Market Value
2006
2007
2008
2009
Source: Avendano and Santiso (2010), based on Thomson Financial and Lionshares.
Note: Data comprises SWF public equity investments.
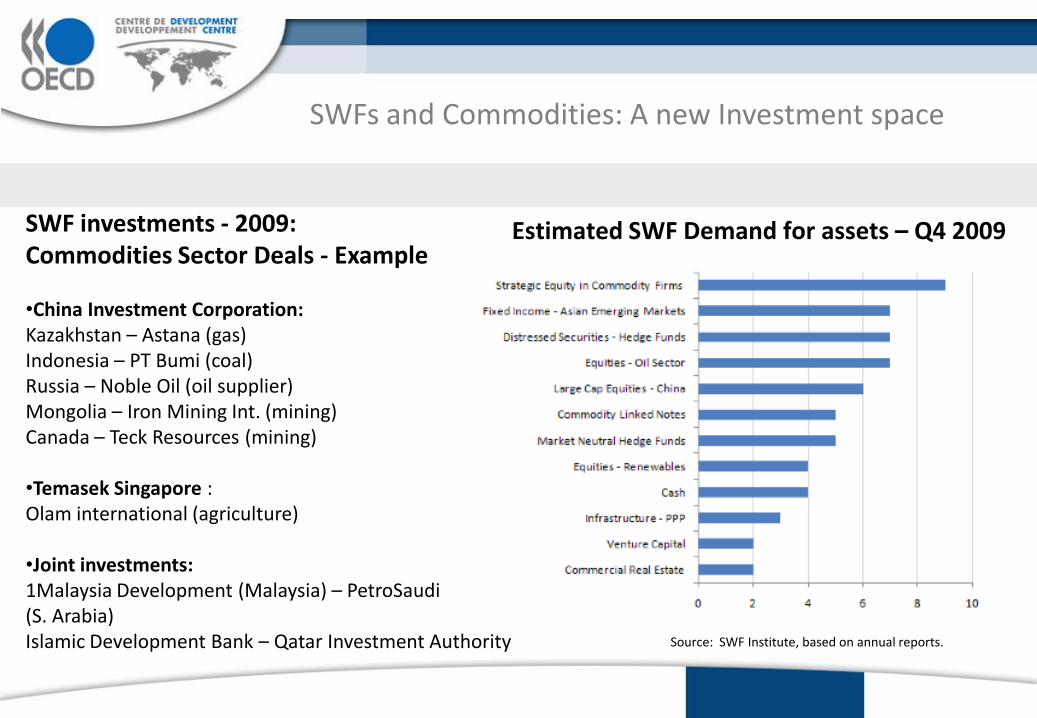
Estimated SWF Demand for assets – Q4 2009
Source: SWF Institute, based on annual reports.
SWFs and Commodities: A new Investment space
SWF investments - 2009:Commodities Sector Deals - Example
•China Investment Corporation:Kazakhstan – Astana (gas)Indonesia – PT Bumi (coal)Russia – Noble Oil (oil supplier)Mongolia – Iron Mining Int. (mining)Canada – Teck Resources (mining)
•Temasek Singapore :Olam international (agriculture)
•Joint investments:1Malaysia Development (Malaysia) – PetroSaudi(S. Arabia)Islamic Development Bank – Qatar Investment Authority
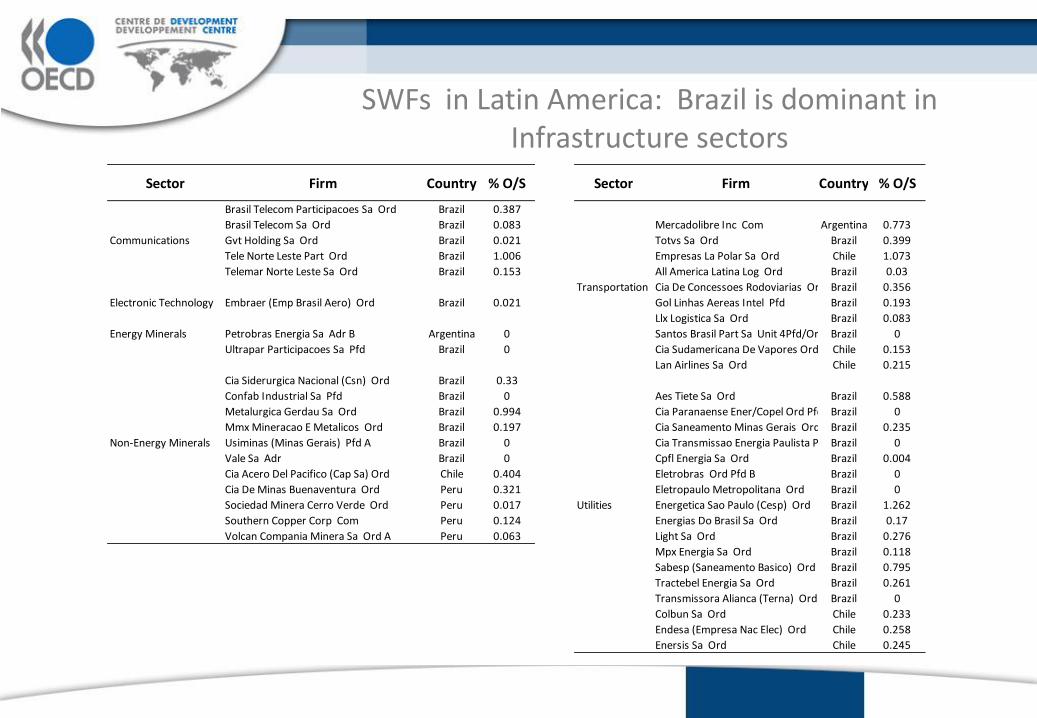
SWFs in Latin America: Brazil is dominant in Infrastructure sectors
Sector Firm Country % O/S Sector Firm Country % O/S
Brasil Telecom Participacoes Sa Ord Brazil 0.387
Brasil Telecom Sa Ord Brazil 0.083 Mercadolibre Inc Com Argentina 0.773
Communications Gvt Holding Sa Ord Brazil 0.021 Totvs Sa Ord Brazil 0.399
Tele Norte Leste Part Ord Brazil 1.006 Empresas La Polar Sa Ord Chile 1.073
Telemar Norte Leste Sa Ord Brazil 0.153 All America Latina Log Ord Brazil 0.03
Transportation Cia De Concessoes Rodoviarias Ord Brazil 0.356
Electronic Technology Embraer (Emp Brasil Aero) Ord Brazil 0.021 Gol Linhas Aereas Intel Pfd Brazil 0.193
Llx Logistica Sa Ord Brazil 0.083
Energy Minerals Petrobras Energia Sa Adr B Argentina 0 Santos Brasil Part Sa Unit 4Pfd/Ord Brazil 0
Ultrapar Participacoes Sa Pfd Brazil 0 Cia Sudamericana De Vapores Ord Chile 0.153
Lan Airlines Sa Ord Chile 0.215
Cia Siderurgica Nacional (Csn) Ord Brazil 0.33
Confab Industrial Sa Pfd Brazil 0 Aes Tiete Sa Ord Brazil 0.588
Metalurgica Gerdau Sa Ord Brazil 0.994 Cia Paranaense Ener/Copel Ord Pfd BBrazil 0
Mmx Mineracao E Metalicos Ord Brazil 0.197 Cia Saneamento Minas Gerais Ord Brazil 0.235
Non-Energy Minerals Usiminas (Minas Gerais) Pfd A Brazil 0 Cia Transmissao Energia Paulista Pfd Brazil 0
Vale Sa Adr Brazil 0 Cpfl Energia Sa Ord Brazil 0.004
Cia Acero Del Pacifico (Cap Sa) Ord Chile 0.404 Eletrobras Ord Pfd B Brazil 0
Cia De Minas Buenaventura Ord Peru 0.321 Eletropaulo Metropolitana Ord Brazil 0
Sociedad Minera Cerro Verde Ord Peru 0.017 Utilities Energetica Sao Paulo (Cesp) Ord Brazil 1.262
Southern Copper Corp Com Peru 0.124 Energias Do Brasil Sa Ord Brazil 0.17
Volcan Compania Minera Sa Ord A Peru 0.063 Light Sa Ord Brazil 0.276
Mpx Energia Sa Ord Brazil 0.118
Sabesp (Saneamento Basico) Ord Brazil 0.795
Tractebel Energia Sa Ord Brazil 0.261
Transmissora Alianca (Terna) Ord Brazil 0
Colbun Sa Ord Chile 0.233
Endesa (Empresa Nac Elec) Ord Chile 0.258
Enersis Sa Ord Chile 0.245
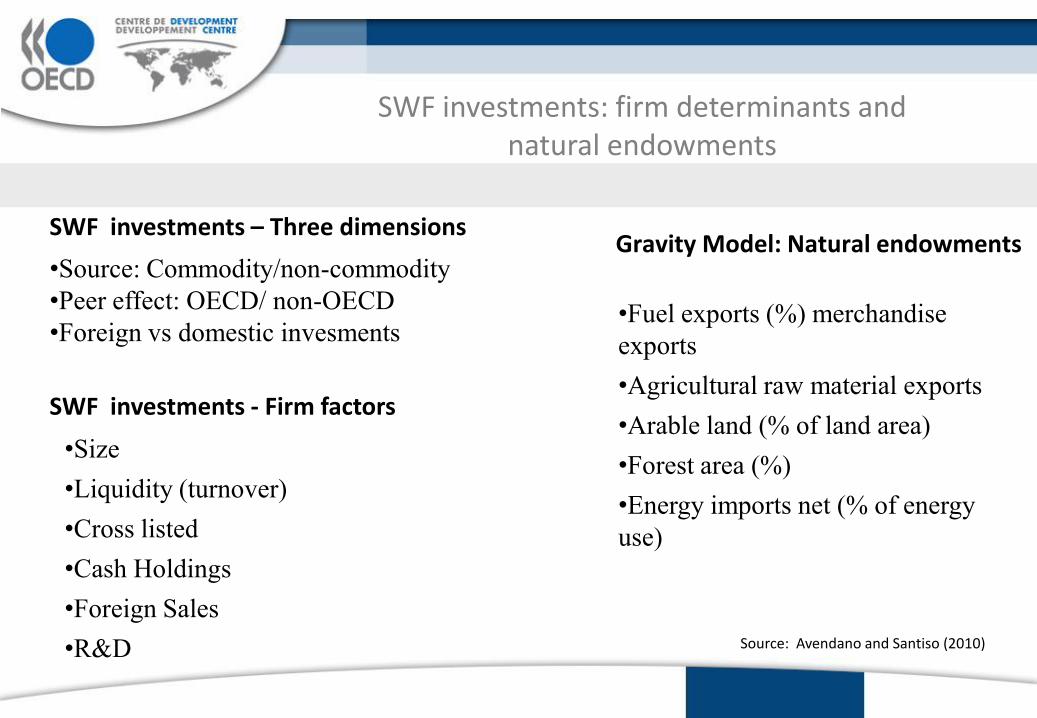
Gravity Model: Natural endowments
Source: Avendano and Santiso (2010)
SWF investments: firm determinants and natural endowments
SWF investments - Firm factors
•Fuel exports (%) merchandise
exports
•Agricultural raw material exports
•Arable land (% of land area)
•Forest area (%)
•Energy imports net (% of energy
use)
SWF investments – Three dimensions
•Size
•Liquidity (turnover)
•Cross listed
•Cash Holdings
•Foreign Sales
•R&D
•Source: Commodity/non-commodity
•Peer effect: OECD/ non-OECD
•Foreign vs domestic invesments
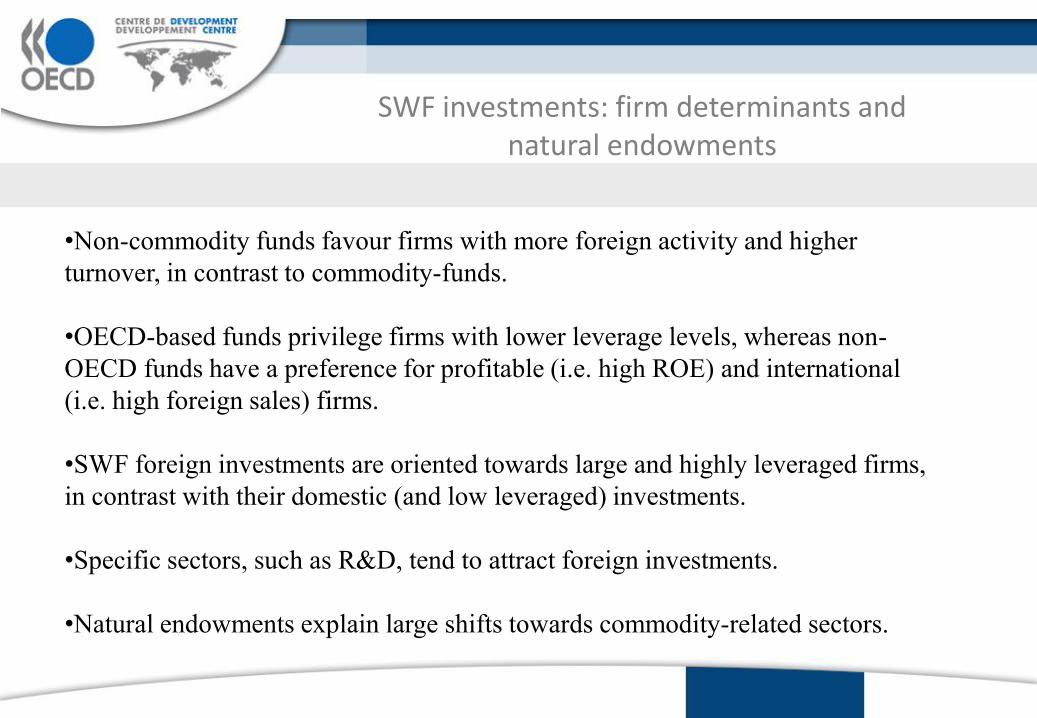
SWF investments: firm determinants and natural endowments
•Non-commodity funds favour firms with more foreign activity and higher
turnover, in contrast to commodity-funds.
•OECD-based funds privilege firms with lower leverage levels, whereas non-
OECD funds have a preference for profitable (i.e. high ROE) and international
(i.e. high foreign sales) firms.
•SWF foreign investments are oriented towards large and highly leveraged firms,
in contrast with their domestic (and low leveraged) investments.
•Specific sectors, such as R&D, tend to attract foreign investments.
•Natural endowments explain large shifts towards commodity-related sectors.
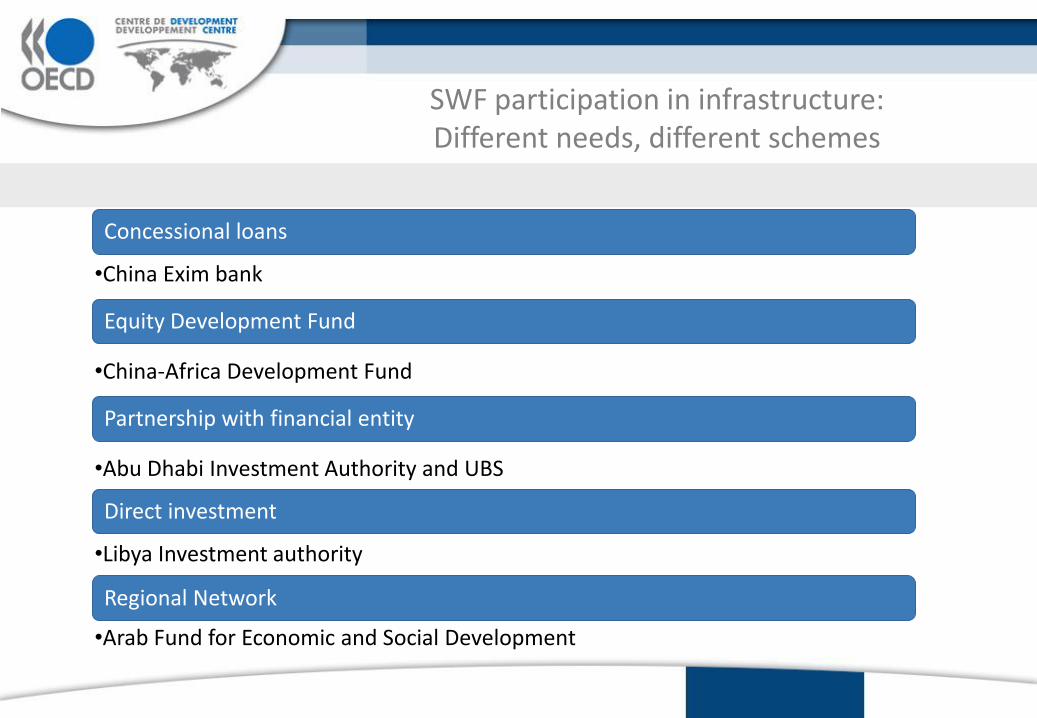
SWF participation in infrastructure: Different needs, different schemes
Concessional loans
•China Exim bank
Equity Development Fund
•China-Africa Development Fund
Partnership with financial entity
•Abu Dhabi Investment Authority and UBS
Direct investment
•Libya Investment authority
Regional Network
•Arab Fund for Economic and Social Development
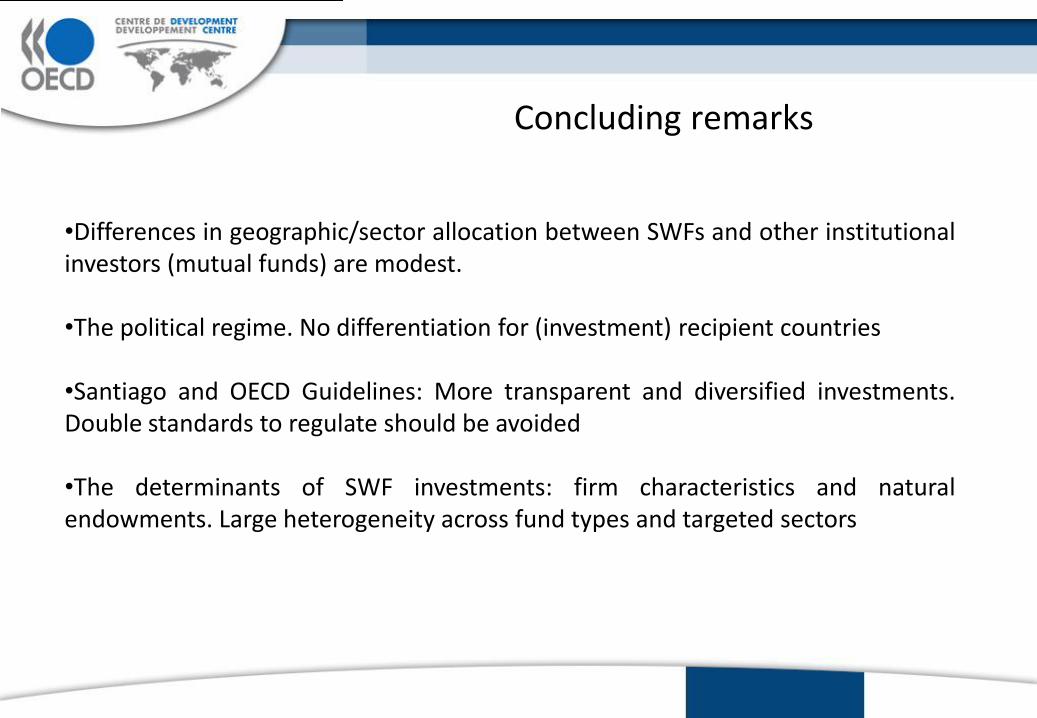
Concluding remarks
•Differences in geographic/sector allocation between SWFs and other institutionalinvestors (mutual funds) are modest.
•The political regime. No differentiation for (investment) recipient countries
•Santiago and OECD Guidelines: More transparent and diversified investments.Double standards to regulate should be avoided
•The determinants of SWF investments: firm characteristics and naturalendowments. Large heterogeneity across fund types and targeted sectors
Concluding remarks
•Financial crisis in 2008 allowed SWFs to re-consider their mandates and re-directtheir investments: “Flight to Quality” vs “Frontier Markets”
• Traditional arguments to attract investment in infrastructure remain valid forSWFs:
•Long term horizon•High returns•Diversified asset class
•SWF investments in Latin America’s infrastructure are modest, compared to otherregions. Between 2006-2009, the trend is increasing.
•SWFs, as other investors, want to reduce PPP-related risks