Sovereign Wealth Fund Investment Trends - Tufts … · Sovereign Wealth Fund Investment Trends...
41
Sovereign Wealth Fund Investment Trends Presented by Eliot Kalter, PhD President of EM Strategies, and Co-Head of SovereigNET, The Fletcher School, Tufts University January 2016
-
Upload
trankhuong -
Category
Documents
-
view
216 -
download
0
Transcript of Sovereign Wealth Fund Investment Trends - Tufts … · Sovereign Wealth Fund Investment Trends...
Sovereign Wealth Fund Investment Trends
Presented byEliot Kalter, PhD
President of EM Strategies, and Co-Head of SovereigNET, The Fletcher School, Tufts University
January 2016
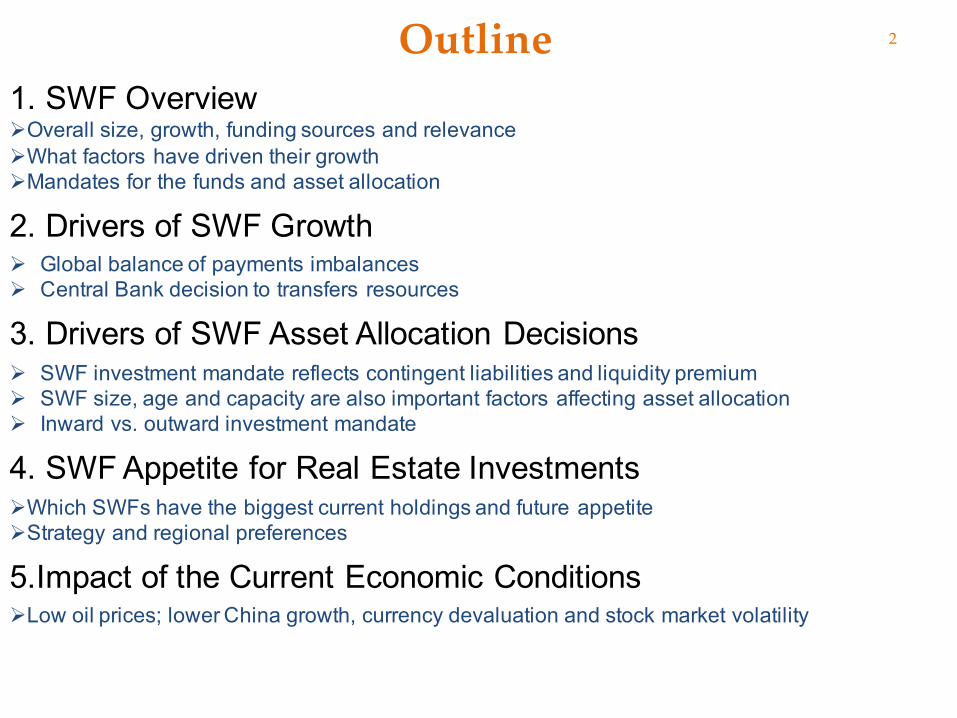
2Outline1. SWF OverviewØOverall size, growth, funding sources and relevanceØWhat factors have driven their growth ØMandates for the funds and asset allocation
2. Drivers of SWF GrowthØ Global balance of payments imbalances Ø Central Bank decision to transfers resources
3. Drivers of SWF Asset Allocation DecisionsØ SWF investment mandate reflects contingent liabilities and liquidity premium Ø SWF size, age and capacity are also important factors affecting asset allocationØ Inward vs. outward investment mandate
4. SWF Appetite for Real Estate InvestmentsØWhich SWFs have the biggest current holdings and future appetiteØStrategy and regional preferences
5.Impact of the Current Economic Conditions ØLow oil prices; lower China growth, currency devaluation and stock market volatility
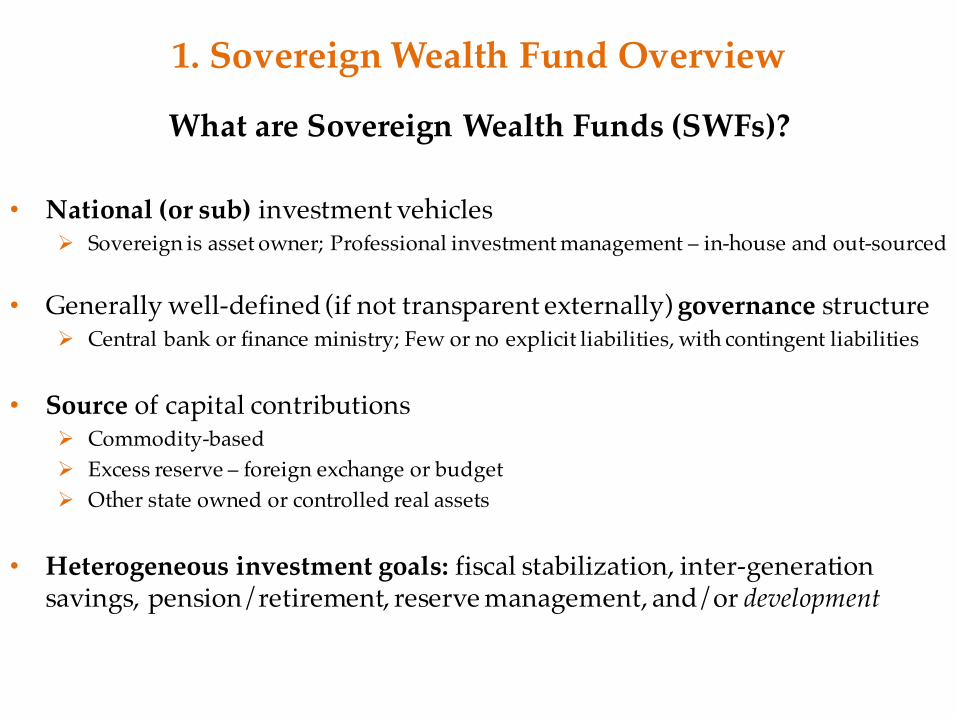
What are Sovereign Wealth Funds (SWFs)?
• National (or sub) investment vehicles Ø Sovereign is asset owner; Professional investment management – in-house and out-sourced
• Generally well-defined (if not transparent externally) governance structureØ Central bank or finance ministry; Few or no explicit liabilities, with contingent liabilities
• Source of capital contributionsØ Commodity-basedØ Excess reserve – foreign exchange or budgetØ Other state owned or controlled real assets
• Heterogeneous investment goals: fiscal stabilization, inter-generation savings, pension/retirement, reserve management, and/or development
1. Sovereign Wealth Fund Overview
4
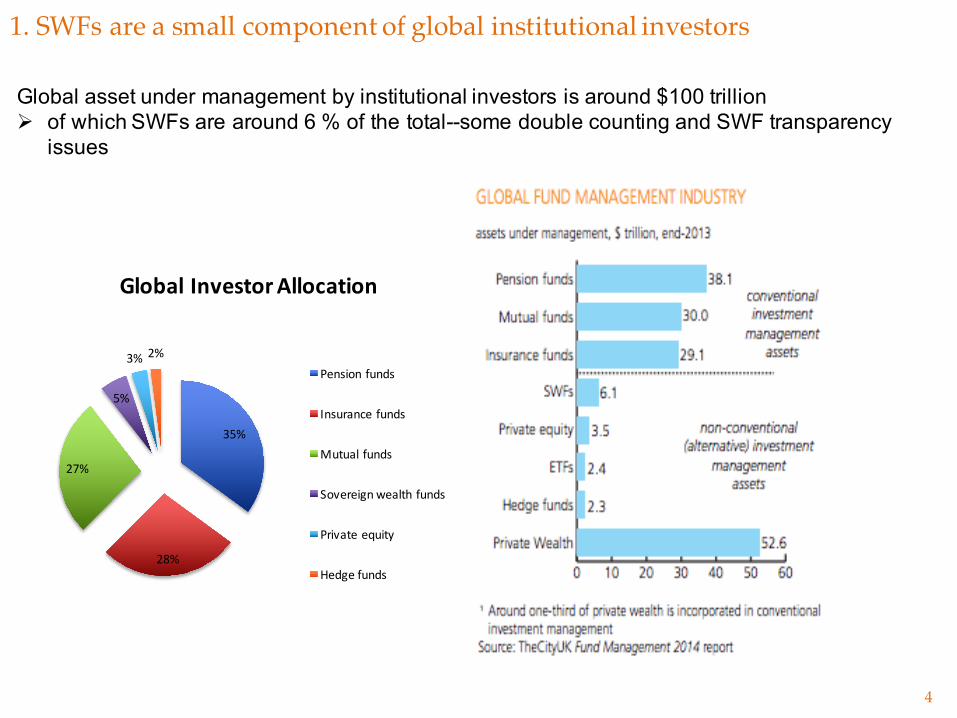
1. SWFs are a small component of global institutional investors
35%
28%
27%
5%
3% 2%
GlobalInvestorAllocation
Pensionfunds
Insurancefunds
Mutualfunds
Sovereignwealthfunds
Privateequity
Hedgefunds
Global asset under management by institutional investors is around $100 trillion Ø of which SWFs are around 6 % of the total--some double counting and SWF transparency
issues
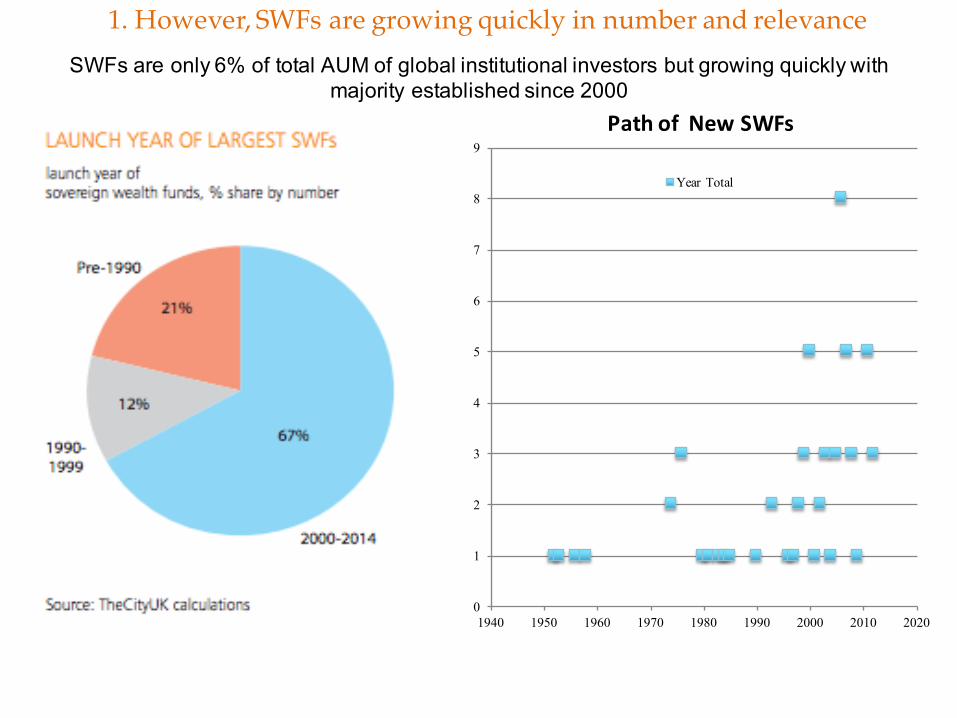
1. However, SWFs are growing quickly in number and relevance
0
1
2
3
4
5
6
7
8
9
1940 1950 1960 1970 1980 1990 2000 2010 2020
PathofNewSWFs
Year Total
SWFs are only 6% of total AUM of global institutional investors but growing quickly with majority established since 2000
6
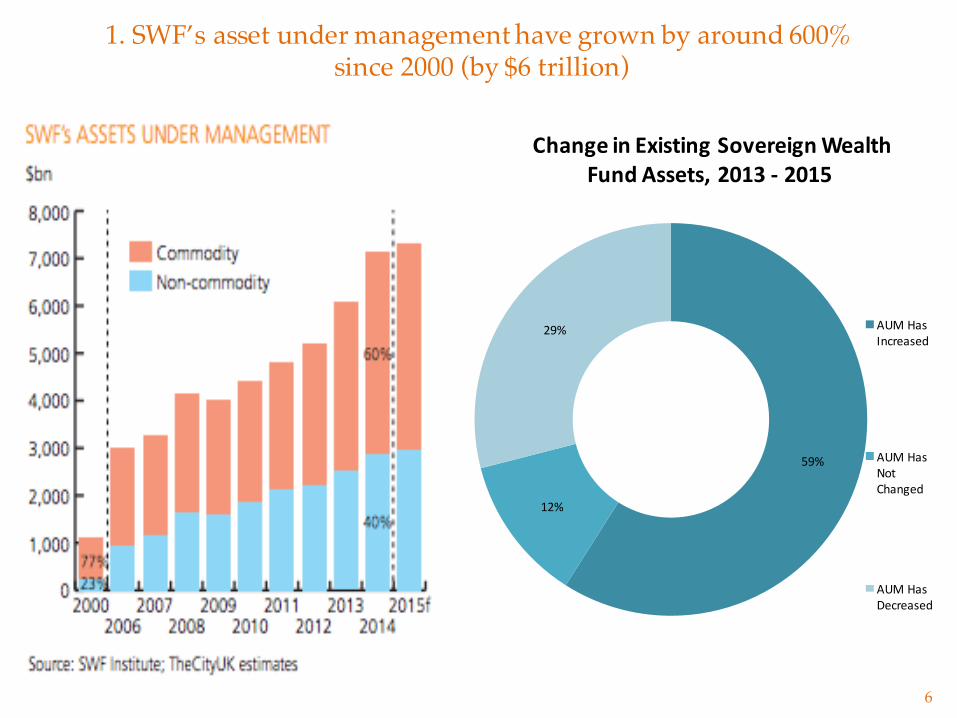
1. SWF’s asset under management have grown by around 600%since 2000 (by $6 trillion)
59%
12%
29%
ChangeinExistingSovereignWealthFundAssets,2013- 2015
AUMHasIncreased
AUMHasNotChanged
AUMHasDecreased
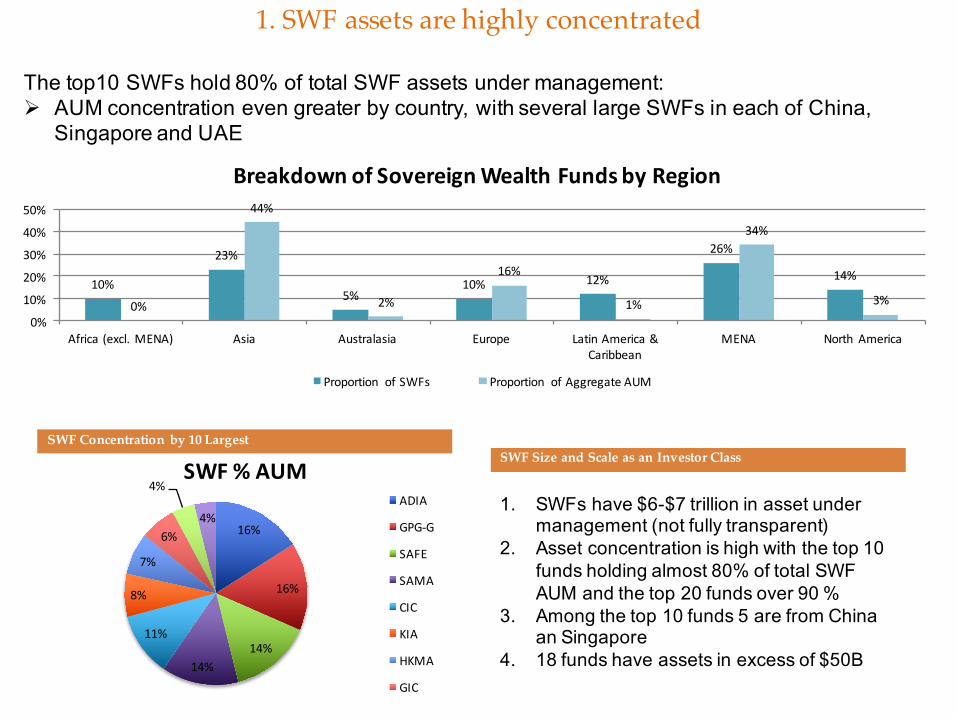
SWF Concentration by 10 LargestSWF Size and Scale as an Investor Class
16%
16%
14%14%
11%
8%
7%
6%
4%
4%
SWF%AUMADIA
GPG-G
SAFE
SAMA
CIC
KIA
HKMA
GIC
1. SWFs have $6-$7 trillion in asset under management (not fully transparent)
2. Asset concentration is high with the top 10 funds holding almost 80% of total SWF AUM and the top 20 funds over 90 %
3. Among the top 10 funds 5 are from China an Singapore
4. 18 funds have assets in excess of $50B
10%
23%
5%10% 12%
26%
14%
0%
44%
2%
16%
1%
34%
3%
0%
10%
20%
30%
40%
50%
Africa(excl.MENA) Asia Australasia Europe LatinAmerica&Caribbean
MENA North America
BreakdownofSovereignWealthFundsbyRegion
Proportion ofSWFs Proportion ofAggregateAUM
1. SWF assets are highly concentrated
The top10 SWFs hold 80% of total SWF assets under management:Ø AUM concentration even greater by country, with several large SWFs in each of China,
Singapore and UAE
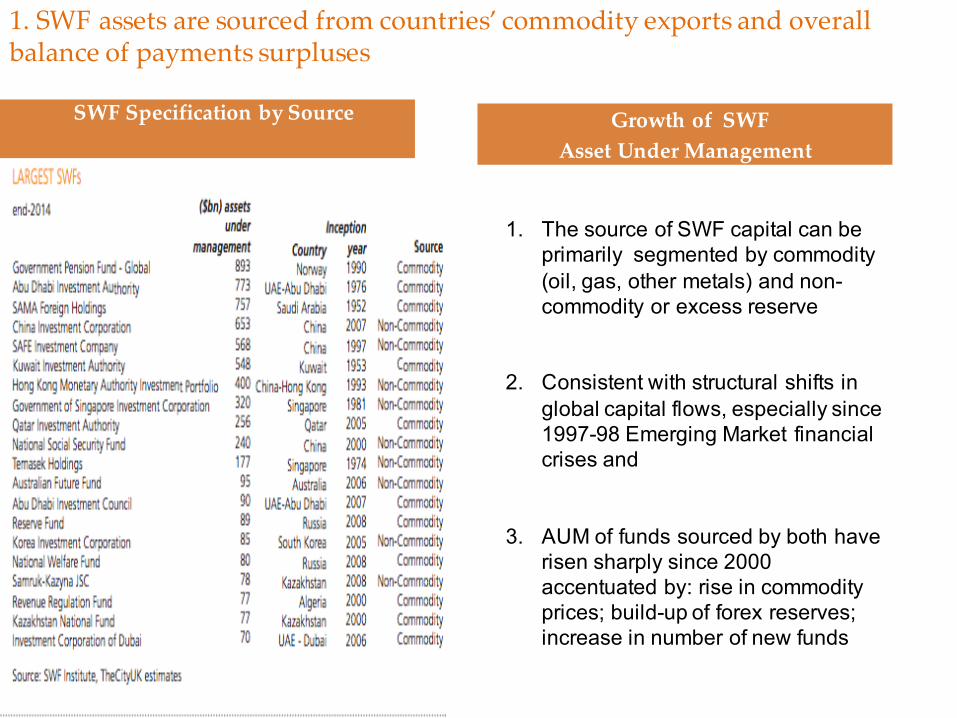
SWF Specification by Source Growth of SWF Asset Under Management
1. The source of SWF capital can be primarily segmented by commodity (oil, gas, other metals) and non-commodity or excess reserve
2. Consistent with structural shifts in global capital flows, especially since 1997-98 Emerging Market financial crises and
3. AUM of funds sourced by both have risen sharply since 2000 accentuated by: rise in commodity prices; build-up of forex reserves; increase in number of new funds
1. SWF assets are sourced from countries’ commodity exports and overall balance of payments surpluses
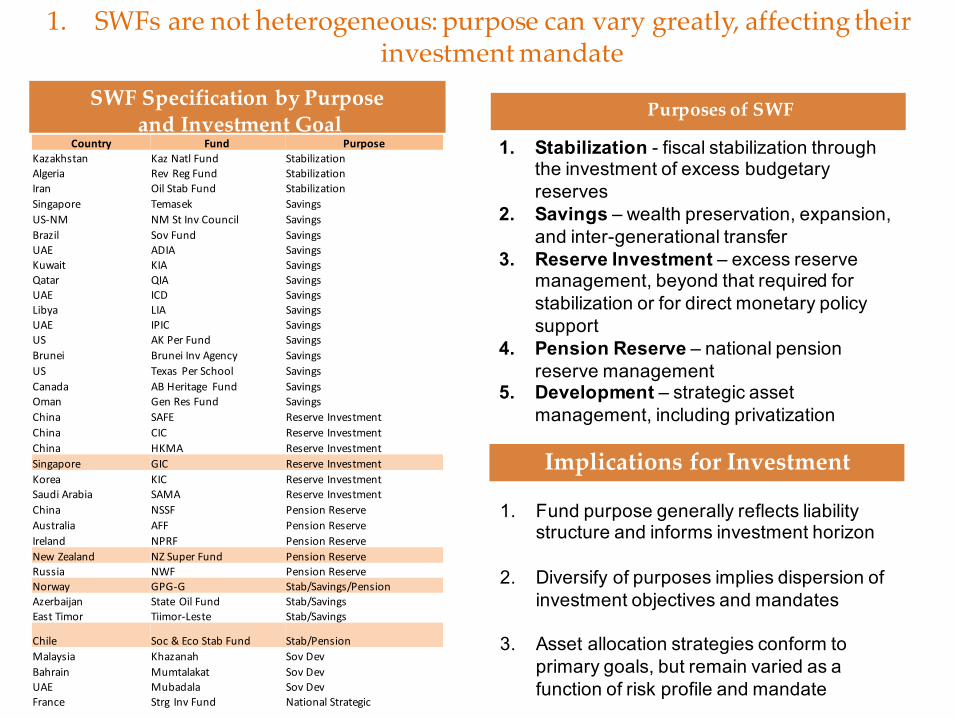
SWF Specification by Purposeand Investment Goal
Implications for Investment Strategy
Purposes of SWF
1. Fund purpose generally reflects liability structure and informs investment horizon
2. Diversify of purposes implies dispersion of investment objectives and mandates
3. Asset allocation strategies conform to primary goals, but remain varied as a function of risk profile and mandate
Country Fund PurposeKazakhstan KazNatlFund StabilizationAlgeria RevRegFund StabilizationIran OilStabFund StabilizationSingapore Temasek SavingsUS-NM NMStInvCouncil SavingsBrazil SovFund SavingsUAE ADIA SavingsKuwait KIA SavingsQatar QIA SavingsUAE ICD SavingsLibya LIA SavingsUAE IPIC SavingsUS AKPerFund SavingsBrunei BruneiInvAgency SavingsUS TexasPerSchool SavingsCanada ABHeritage Fund SavingsOman GenResFund SavingsChina SAFE Reserve InvestmentChina CIC Reserve InvestmentChina HKMA Reserve InvestmentSingapore GIC Reserve InvestmentKorea KIC Reserve InvestmentSaudiArabia SAMA Reserve InvestmentChina NSSF PensionReserveAustralia AFF PensionReserveIreland NPRF PensionReserveNewZealand NZSuperFund PensionReserveRussia NWF PensionReserveNorway GPG-G Stab/Savings/PensionAzerbaijan StateOilFund Stab/SavingsEastTimor Tiimor-Leste Stab/Savings
Chile Soc &EcoStabFund Stab/PensionMalaysia Khazanah SovDevBahrain Mumtalakat SovDevUAE Mubadala SovDevFrance Strg InvFund NationalStrategic
1. Stabilization - fiscal stabilization through the investment of excess budgetary reserves
2. Savings – wealth preservation, expansion, and inter-generational transfer
3. Reserve Investment – excess reserve management, beyond that required for stabilization or for direct monetary policy support
4. Pension Reserve – national pension reserve management
5. Development – strategic asset management, including privatization
1. SWFs are not heterogeneous: purpose can vary greatly, affecting their investment mandate
10
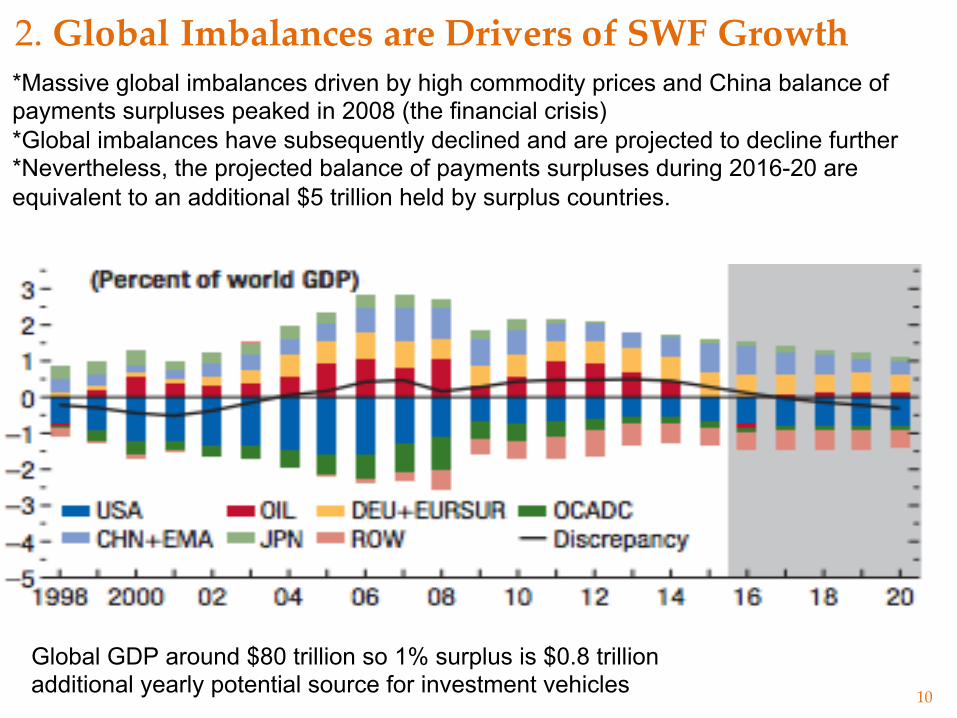
2. Global Imbalances are Drivers of SWF Growth
Global GDP around $80 trillion so 1% surplus is $0.8 trillion additional yearly potential source for investment vehicles
*Massive global imbalances driven by high commodity prices and China balance of payments surpluses peaked in 2008 (the financial crisis)*Global imbalances have subsequently declined and are projected to decline further*Nevertheless, the projected balance of payments surpluses during 2016-20 are equivalent to an additional $5 trillion held by surplus countries.
11
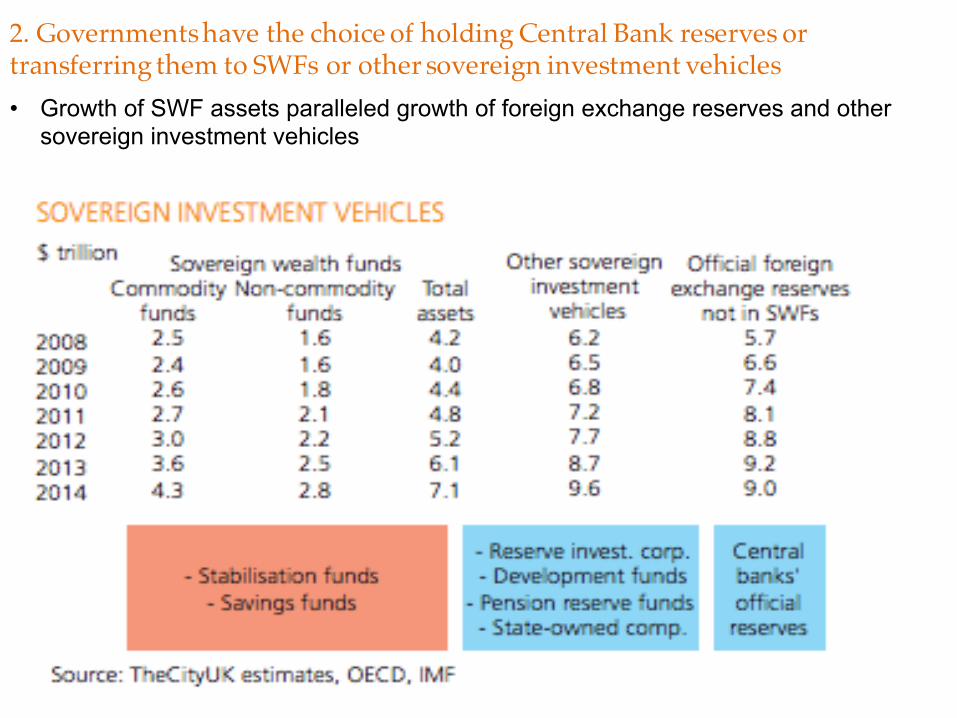
2. Governments have the choice of holding Central Bank reserves or transferring them to SWFs or other sovereign investment vehicles• Growth of SWF assets paralleled growth of foreign exchange reserves and other
sovereign investment vehicles
3. SWF Asset Allocation Decisions
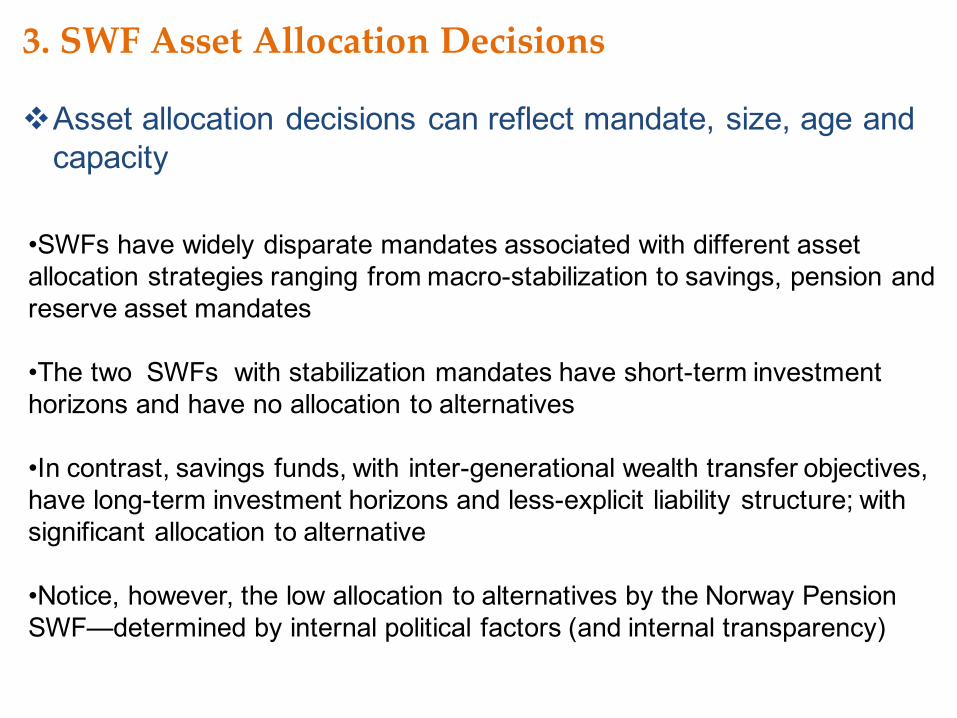
•SWFs have widely disparate mandates associated with different asset allocation strategies ranging from macro-stabilization to savings, pension and reserve asset mandates
•The two SWFs with stabilization mandates have short-term investment horizons and have no allocation to alternatives
•In contrast, savings funds, with inter-generational wealth transfer objectives, have long-term investment horizons and less-explicit liability structure; with significant allocation to alternative
•Notice, however, the low allocation to alternatives by the Norway Pension SWF—determined by internal political factors (and internal transparency)
vAsset allocation decisions can reflect mandate, size, age and capacity
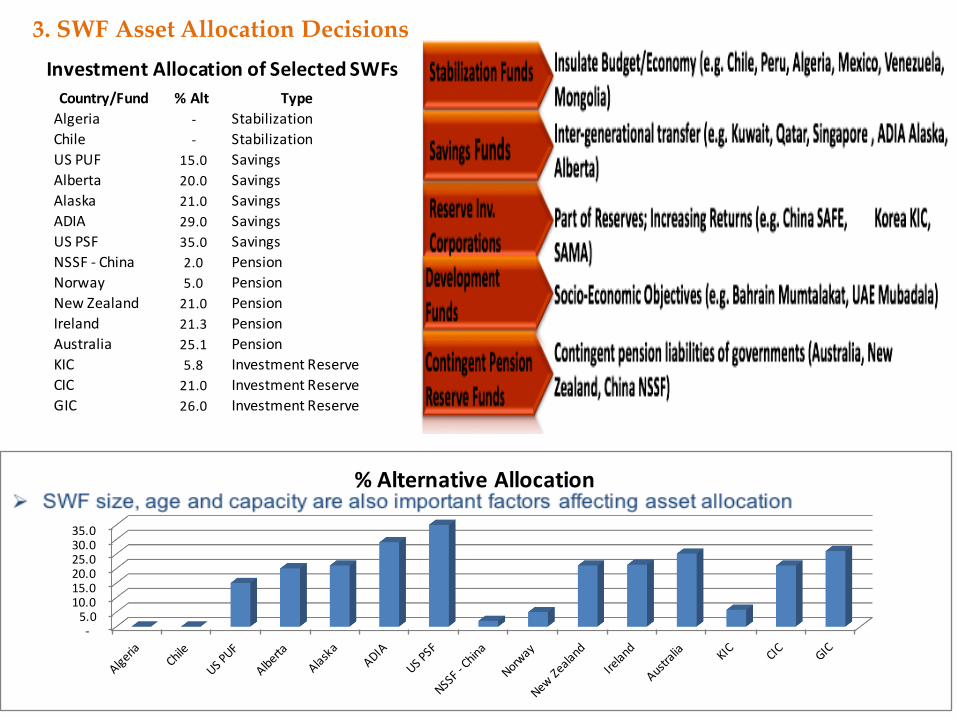
Country/Fund %Alt TypeAlgeria - StabilizationChile - StabilizationUSPUF 15.0 SavingsAlberta 20.0 SavingsAlaska 21.0 SavingsADIA 29.0 SavingsUSPSF 35.0 SavingsNSSF- China 2.0 PensionNorway 5.0 PensionNewZealand 21.0 PensionIreland 21.3 PensionAustralia 25.1 PensionKIC 5.8 InvestmentReserveCIC 21.0 InvestmentReserveGIC 26.0 InvestmentReserve
-5.0
10.015.020.025.030.035.0
%AlternativeAllocation
InvestmentAllocationofSelectedSWFs
3. SWF Asset Allocation Decisions
14
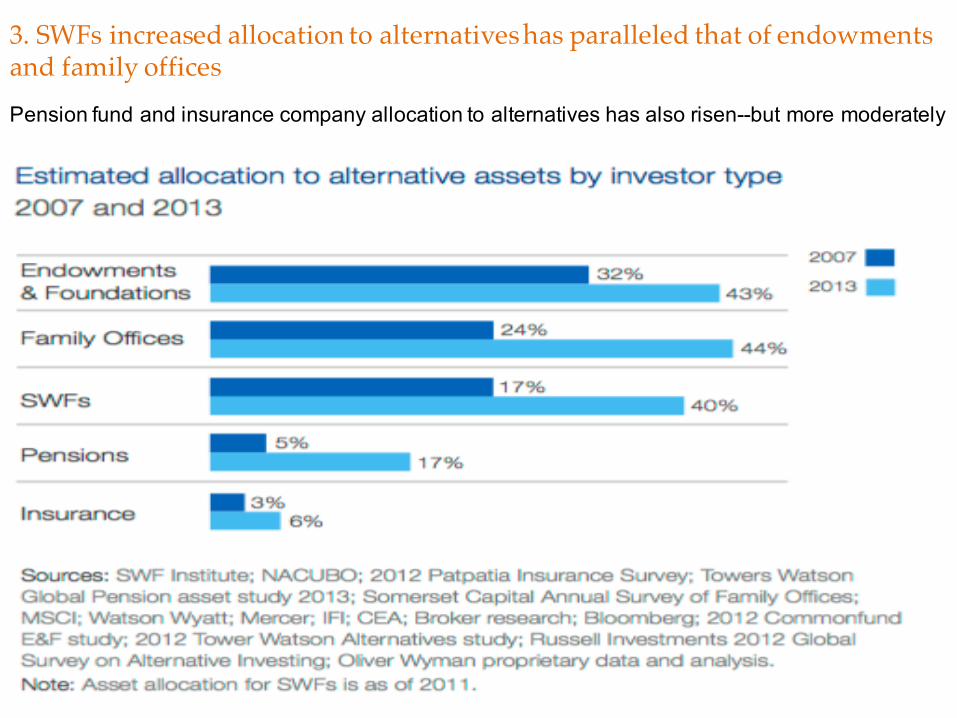
3. SWFs increased allocation to alternatives has paralleled that of endowments and family offices Pension fund and insurance company allocation to alternatives has also risen--but more moderately
15
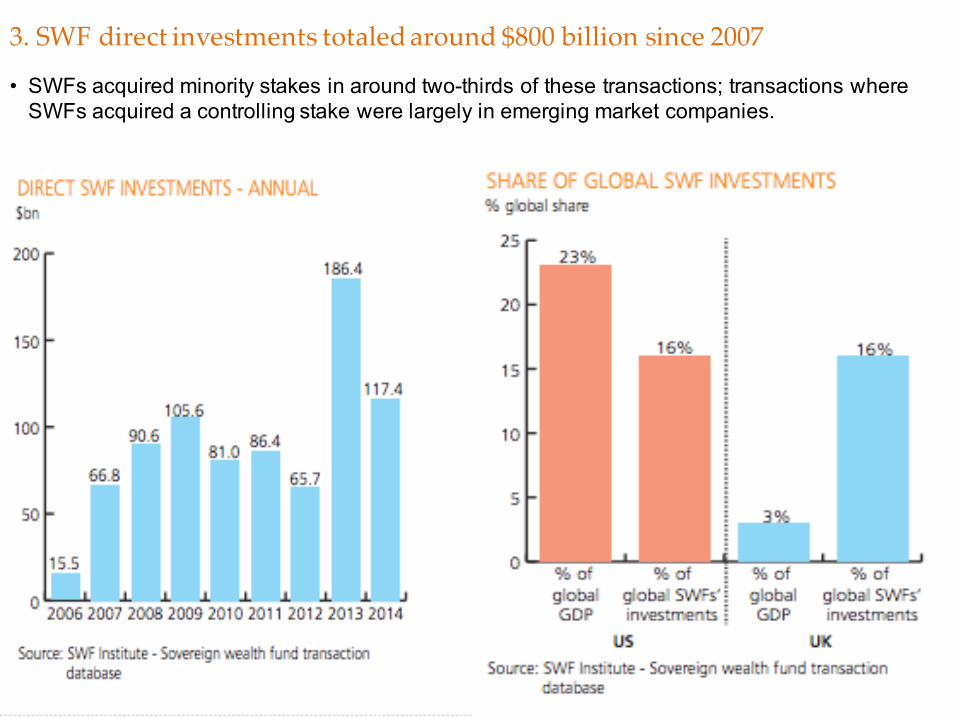
3. SWF direct investments totaled around $800 billion since 2007
• SWFs acquired minority stakes in around two-thirds of these transactions; transactions where SWFs acquired a controlling stake were largely in emerging market companies.
16
3. SWF allocation also must determine whether there will be an outbound vs. inward investment mandate
• SWF mandates: Stabilization, inter-generational wealth preservation, pension and reserveinvestment management
Ø Replace depleting natural resources with alternative sources of export proceedsØ Investment diversification of Sovereign reserves with higher risk-adjusted returns
• Investing abroad helps avoid Dutch DiseaseØ Capital inflows from resource sector can result in real appreciation of the country’s exchange
rate, reducing competitiveness of non-resource economyØ Uneven or distorted sectoral development of local economy with loss of employment and
sectoral diversificationØ Capture and manage accumulation of assets to reintegrate them into the domestic economy
based on absorptive capacity
Most SWFs have Outward Investment Mandates
v Augmentnationaldevelopment agenda;acceleratesocialandeconomicdevelopmentthrough focusedinvestmentprograms
v Attractcomplementarycapitalfromthemajorexternalfinancialandstrategicinvestorsv Catalyzeexternalinvestmentflowsandknowledge transferintokeyeconomicsectors
Internal Investment Mandate
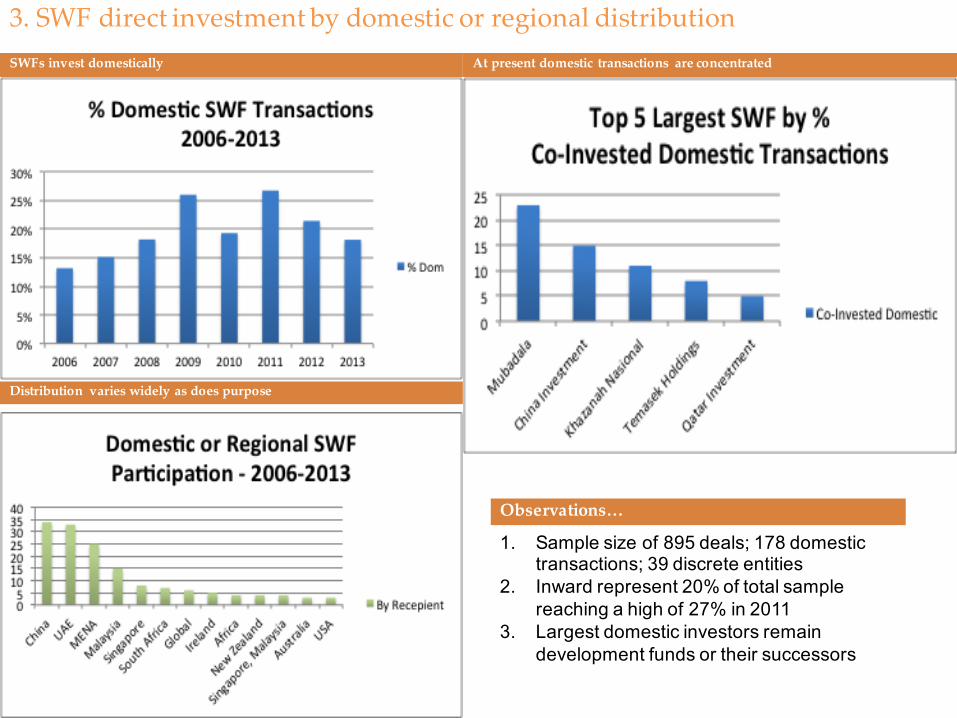
SWFs invest domestically At present domestic transactions are concentrated
Observations…
Distribution varies widely as does purpose
1. Sample size of 895 deals; 178 domestic transactions; 39 discrete entities
2. Inward represent 20% of total sample reaching a high of 27% in 2011
3. Largest domestic investors remain development funds or their successors
3. SWF direct investment by domestic or regional distribution
18
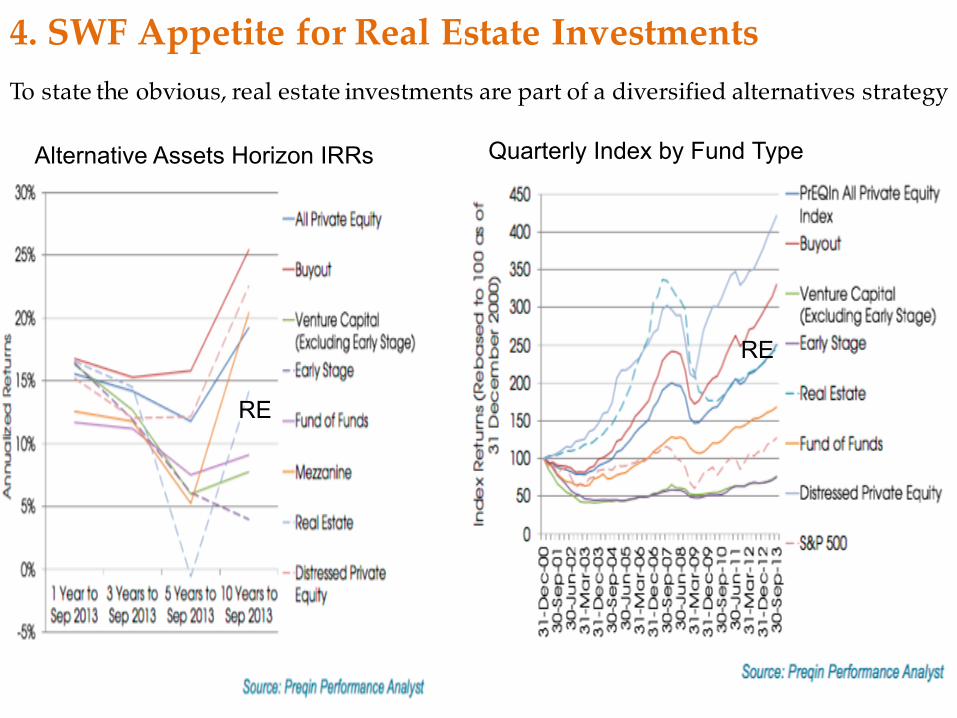
To state the obvious, real estate investments are part of a diversified alternatives strategy
Alternative Assets Horizon IRRs Quarterly Index by Fund Type
RE
RE
4. SWF Appetite for Real Estate Investments
19
82%86%
51%54%
57%
31%
N/A
81%
86%
47%
59% 60%
33%
24%
0%
10%
20%
30%
40%
50%
60%
70%
80%
90%
100%
Public Equities FixedIncome PrivateEquity RealEstate Infrastructure HedgeFunds PrivateDebt*
ProportionofSovereignW
ealthFunds
2013
2015
(Preqin data; in terms of assets under management)
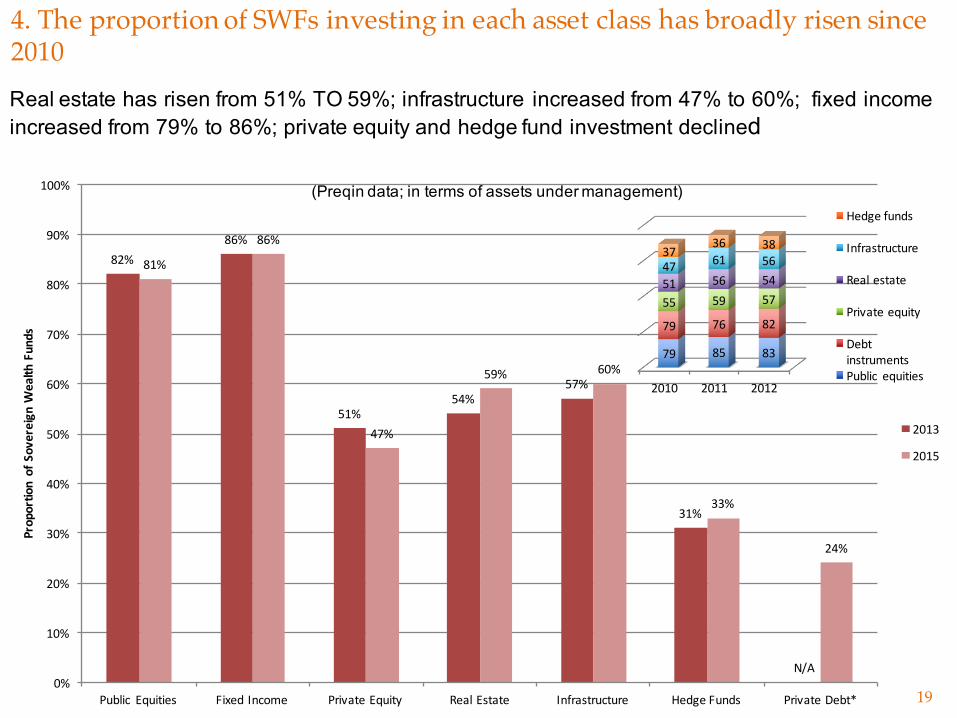
Real estate has risen from 51% TO 59%; infrastructure increased from 47% to 60%; fixed income increased from 79% to 86%; private equity and hedge fund investment declined
4. The proportion of SWFs investing in each asset class has broadly risen since 2010
2010 2011 2012
79 85 83
79 76 82
55 59 5751 56 5447 61 5637
36 38
Hedgefunds
Infrastructure
Realestate
Privateequity
DebtinstrumentsPublic equities
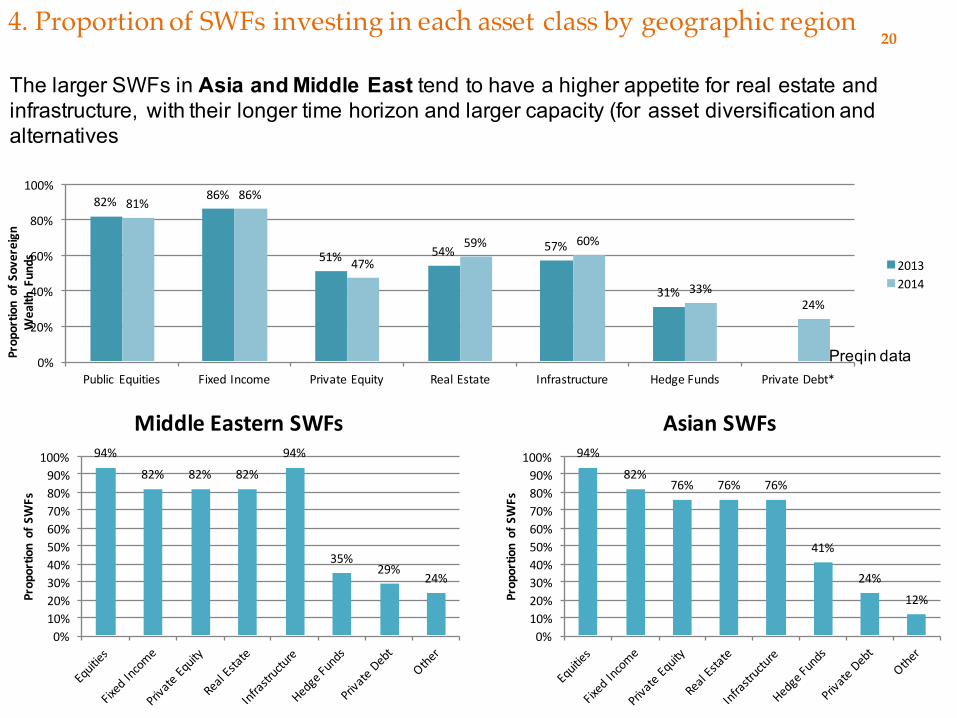
82% 86%
51% 54% 57%
31%
81%86%
47%59% 60%
33%24%
0%
20%
40%
60%
80%
100%
Public Equities FixedIncome PrivateEquity RealEstate Infrastructure HedgeFunds PrivateDebt*
ProportionofSovereign
WealthFunds 2013
2014
20
94%
82%76% 76% 76%
41%
24%
12%
0%10%20%30%40%50%60%70%80%90%
100%
ProportionofSWFs
AsianSWFs94%
82% 82% 82%
94%
35%29%
24%
0%10%20%30%40%50%60%70%80%90%
100%
ProportionofSWFs
MiddleEasternSWFs
Preqin data
The larger SWFs in Asia and Middle East tend to have a higher appetite for real estate and infrastructure, with their longer time horizon and larger capacity (for asset diversification and alternatives
4. Proportion of SWFs investing in each asset class by geographic region
21
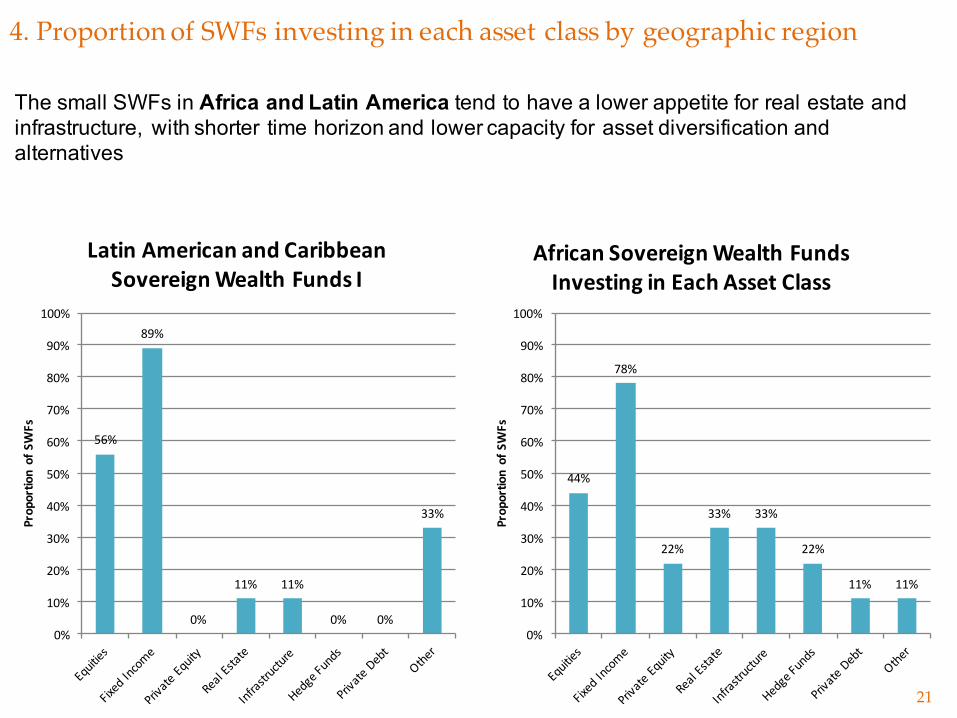
The small SWFs in Africa and Latin America tend to have a lower appetite for real estate and infrastructure, with shorter time horizon and lower capacity for asset diversification and alternatives
56%
89%
0%
11% 11%
0% 0%
33%
0%
10%
20%
30%
40%
50%
60%
70%
80%
90%
100%
ProportionofSWFs
LatinAmericanandCaribbeanSovereignWealthFundsI
44%
78%
22%
33% 33%
22%
11% 11%
0%
10%
20%
30%
40%
50%
60%
70%
80%
90%
100%
ProportionofSWFs
AfricanSovereignWealthFundsInvestinginEachAssetClass
4. Proportion of SWFs investing in each asset class by geographic region
22
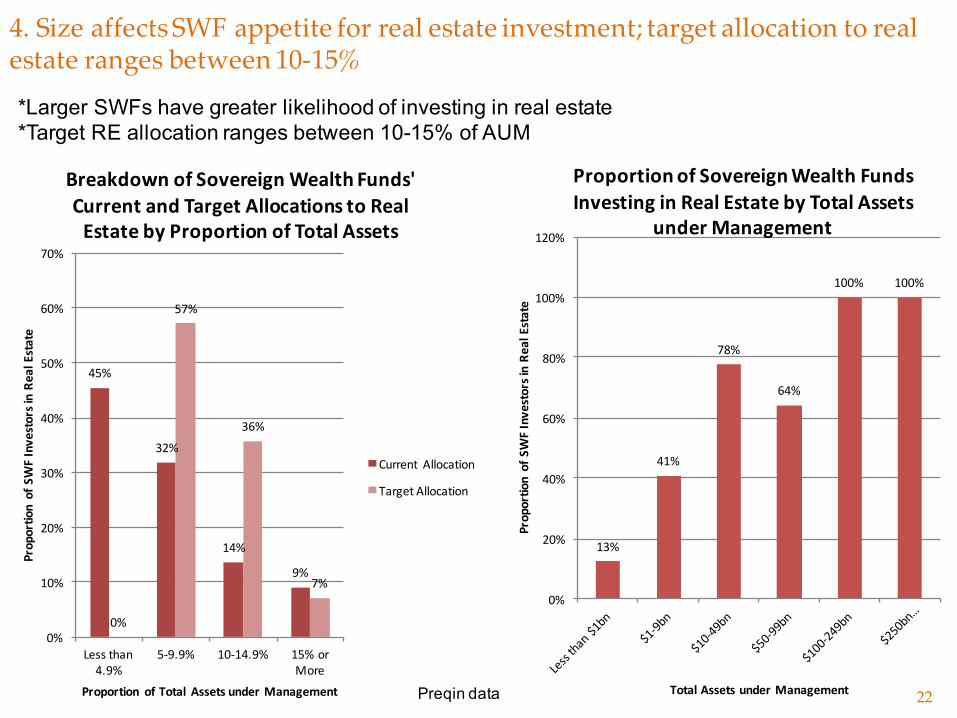
45%
32%
14%
9%
0%
57%
36%
7%
0%
10%
20%
30%
40%
50%
60%
70%
Lessthan4.9%
5-9.9% 10-14.9% 15%orMore
ProportionofSWFInvestorsinRe
alEstate
Proportion ofTotal AssetsunderManagement
BreakdownofSovereignWealthFunds'CurrentandTargetAllocationstoRealEstatebyProportionofTotalAssets
Current Allocation
TargetAllocation
13%
41%
78%
64%
100% 100%
0%
20%
40%
60%
80%
100%
120%
ProportionofSWFInvestorsinRe
alEstate
TotalAssetsunderManagement
ProportionofSovereignWealthFundsInvestinginRealEstatebyTotalAssets
underManagement
*Larger SWFs have greater likelihood of investing in real estate *Target RE allocation ranges between 10-15% of AUM
4. Size affects SWF appetite for real estate investment; target allocation to real estate ranges between 10-15%
Preqin data
23
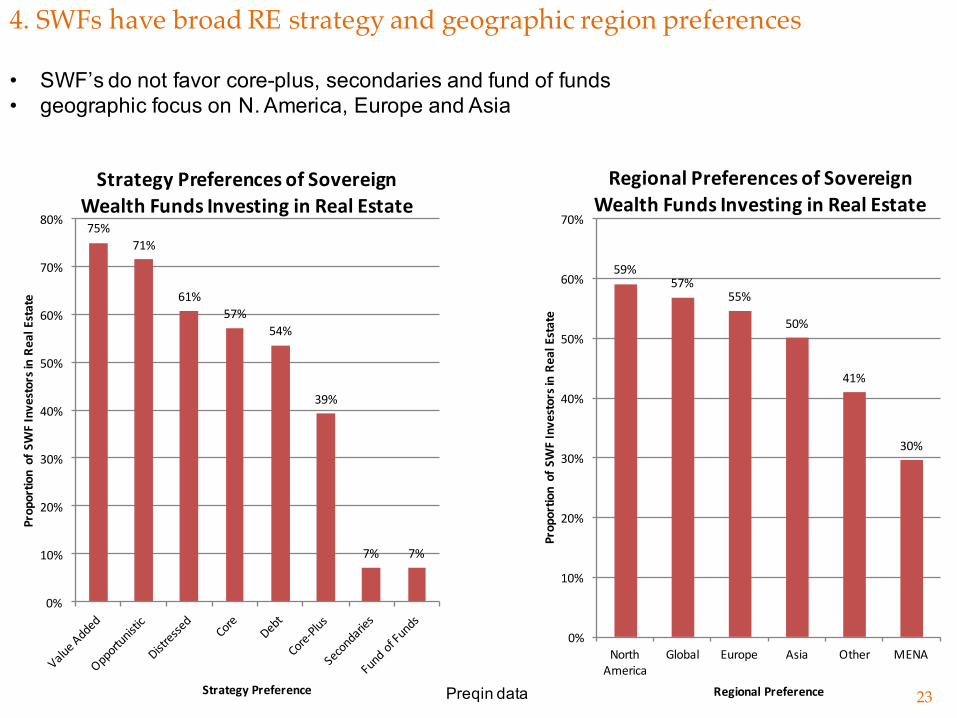
75%71%
61%57%
54%
39%
7% 7%
0%
10%
20%
30%
40%
50%
60%
70%
80%
ProportionofSWFInvestorsinRe
alEstate
StrategyPreference
StrategyPreferencesofSovereignWealthFundsInvestinginRealEstate
59%57%
55%
50%
41%
30%
0%
10%
20%
30%
40%
50%
60%
70%
NorthAmerica
Global Europe Asia Other MENA
ProportionofSWFInvestorsinRe
alEstate
RegionalPreference
RegionalPreferencesofSovereignWealthFundsInvestinginRealEstate
4. SWFs have broad RE strategy and geographic region preferences
Preqin data
• SWF’s do not favor core-plus, secondaries and fund of funds• geographic focus on N. America, Europe and Asia
24
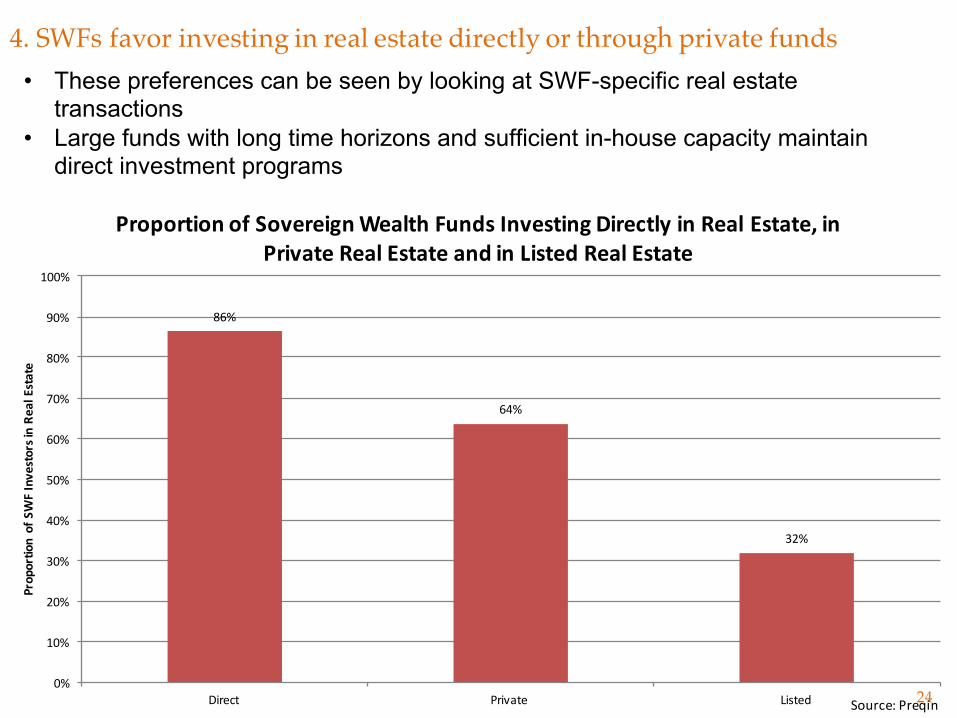
86%
64%
32%
0%
10%
20%
30%
40%
50%
60%
70%
80%
90%
100%
Direct Private Listed
ProportionofSWFInvestorsinRe
alEstate
ProportionofSovereignWealthFundsInvestingDirectlyinRealEstate,inPrivateRealEstateandinListedRealEstate
Source:Preqin
4. SWFs favor investing in real estate directly or through private funds• These preferences can be seen by looking at SWF-specific real estate
transactions • Large funds with long time horizons and sufficient in-house capacity maintain
direct investment programs
25
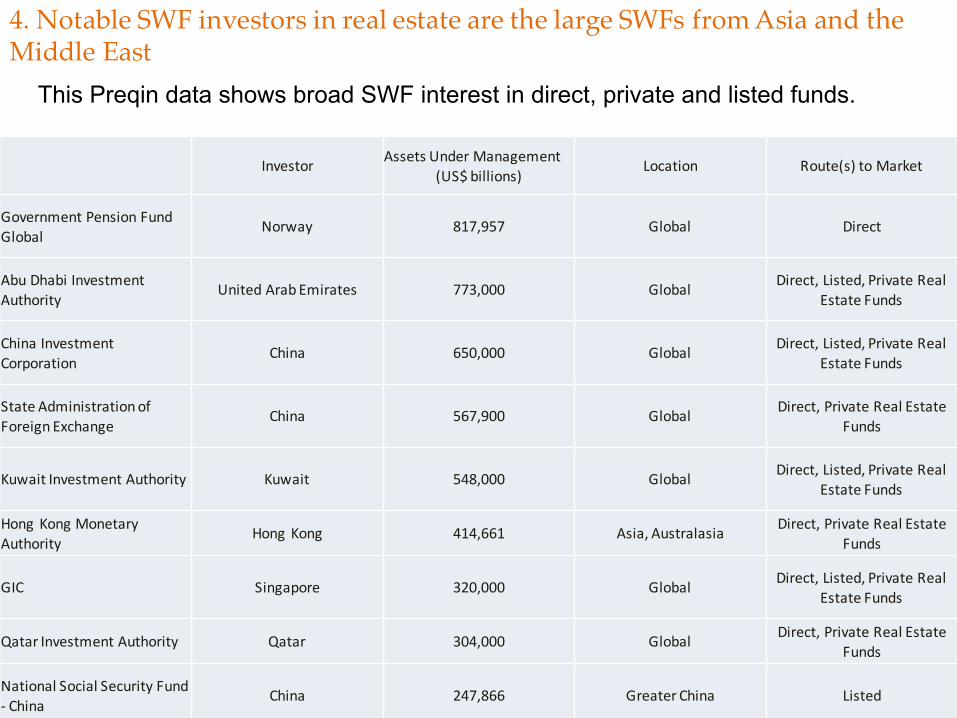
Investor Assets UnderManagement(US$billions)
Location Route(s)toMarket
GovernmentPensionFundGlobal
Norway 817,957 Global Direct
AbuDhabiInvestmentAuthority
UnitedArabEmirates 773,000 Global Direct,Listed,PrivateRealEstateFunds
ChinaInvestmentCorporation
China 650,000 Global Direct,Listed,PrivateRealEstateFunds
StateAdministrationofForeignExchange
China 567,900 Global Direct,PrivateRealEstateFunds
KuwaitInvestmentAuthority Kuwait 548,000 Global Direct,Listed,PrivateRealEstateFunds
HongKongMonetaryAuthority
HongKong 414,661 Asia,Australasia Direct,PrivateRealEstateFunds
GIC Singapore 320,000 Global Direct,Listed,PrivateRealEstateFunds
QatarInvestmentAuthority Qatar 304,000 Global Direct,PrivateRealEstateFunds
NationalSocialSecurityFund- China
China 247,866 GreaterChina Listed
4. Notable SWF investors in real estate are the large SWFs from Asia and the Middle East
This Preqin data shows broad SWF interest in direct, private and listed funds.
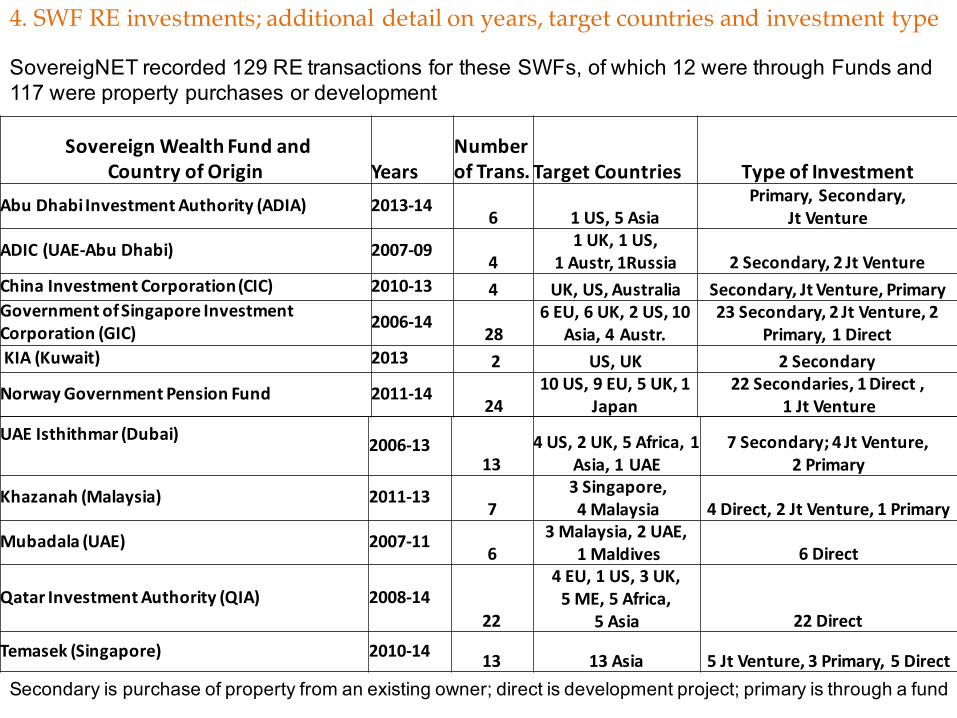
SovereignWealthFundandCountryofOrigin Years
NumberofTrans.TargetCountries TypeofInvestment
AbuDhabiInvestmentAuthority(ADIA) 2013-146 1US,5 Asia
Primary,Secondary,JtVenture
ADIC(UAE-Abu Dhabi) 2007-094
1UK,1US,1Austr, 1Russia 2Secondary,2JtVenture
ChinaInvestmentCorporation(CIC) 2010-13 4 UK,US,Australia Secondary,JtVenture,PrimaryGovernmentofSingaporeInvestmentCorporation(GIC) 2006-14
286EU,6UK, 2US,10
Asia,4Austr.23Secondary,2JtVenture,2
Primary,1DirectKIA(Kuwait) 2013 2 US,UK 2Secondary
NorwayGovernmentPensionFund 2011-1424
10US,9EU,5UK,1Japan
22Secondaries,1Direct,1JtVenture
4. SWF RE investments; additional detail on years, target countries and investment type
Secondary is purchase of property from an existing owner; direct is development project; primary is through a fund
UAE Isthithmar(Dubai) 2006-1313
4US,2 UK,5Africa,1Asia,1UAE
7Secondary; 4JtVenture,2Primary
Khazanah (Malaysia) 2011-137
3Singapore,4Malaysia 4Direct,2JtVenture, 1Primary
Mubadala (UAE) 2007-116
3 Malaysia,2UAE,1Maldives 6 Direct
QatarInvestmentAuthority(QIA) 2008-1422
4EU,1US,3UK,5ME,5Africa,
5Asia 22DirectTemasek (Singapore) 2010-14 13 13Asia 5 JtVenture,3Primary,5Direct
SovereigNET recorded 129 RE transactions for these SWFs, of which 12 were through Funds and 117 were property purchases or development
27
5. Impact of the Current Economic Conditions: Energy and China IMF: World Economic Outlook, October 2015• Activity in emerging market economies is projected to slow for the fifth year in a row
• In an environment of declining commodity prices, reduced capital flows to emerging markets and pressure on their currencies, and increasing financial market volatility, downside risks to the outlook have risen
• The weak commodity price outlook is estimated to subtract over percentage points annually from the average rate of economic growth in energy exporters over 2015–17
• In China, banks have only recently begun to address the growing asset quality challenges associated with rising weaknesses in key areas of the corporate sector.
• Pressures on sovereign ratings could intensify if contingent liabilities of state-owned enterprises have to be assumed by the sovereign, for example, from firms in the energy sector
Bottom Linev Continued low energy prices and weakening financial conditions would increase pressure on
energy-exporting countries to reduce transfers to SWFs or, in some cases, use SWF resources for inward budgetary financing.
v Energy-importing EM countries may also face financial pressures that could, to the smaller extent, affect the extent of their SWF investments
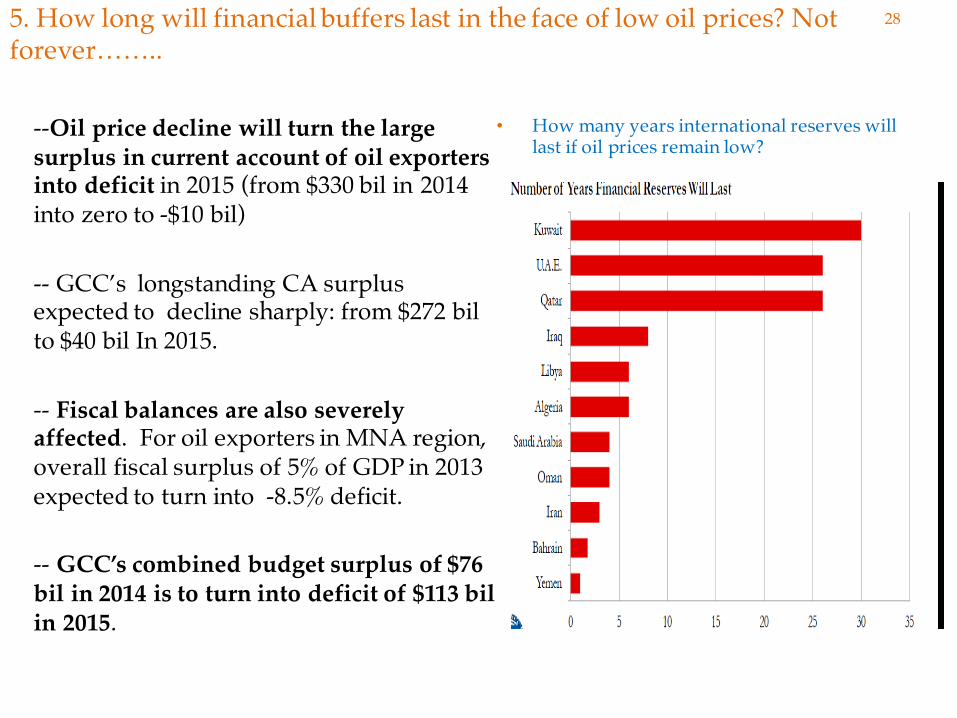
5. How long will financial buffers last in the face of low oil prices? Not forever……..
--Oil price decline will turn the large surplus in current account of oil exporters into deficit in 2015 (from $330 bil in 2014 into zero to -$10 bil)
-- GCC’s longstanding CA surplus expected to decline sharply: from $272 bil to $40 bil In 2015.
-- Fiscal balances are also severely affected. For oil exporters in MNA region, overall fiscal surplus of 5% of GDP in 2013 expected to turn into -8.5% deficit.
-- GCC’s combined budget surplus of $76 bil in 2014 is to turn into deficit of $113 bil in 2015.
• How many years international reserves will last if oil prices remain low?
28
29
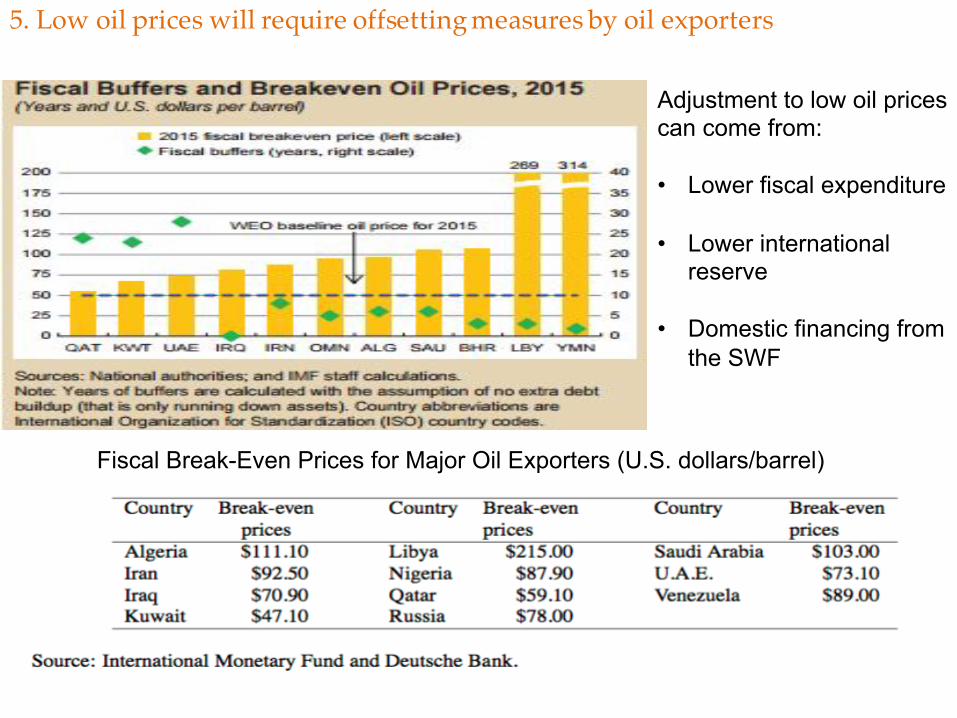
Fiscal Break-Even Prices for Major Oil Exporters (U.S. dollars/barrel)
5. Low oil prices will require offsetting measures by oil exporters
Adjustment to low oil prices can come from:
• Lower fiscal expenditure
• Lower international reserve
• Domestic financing from the SWF
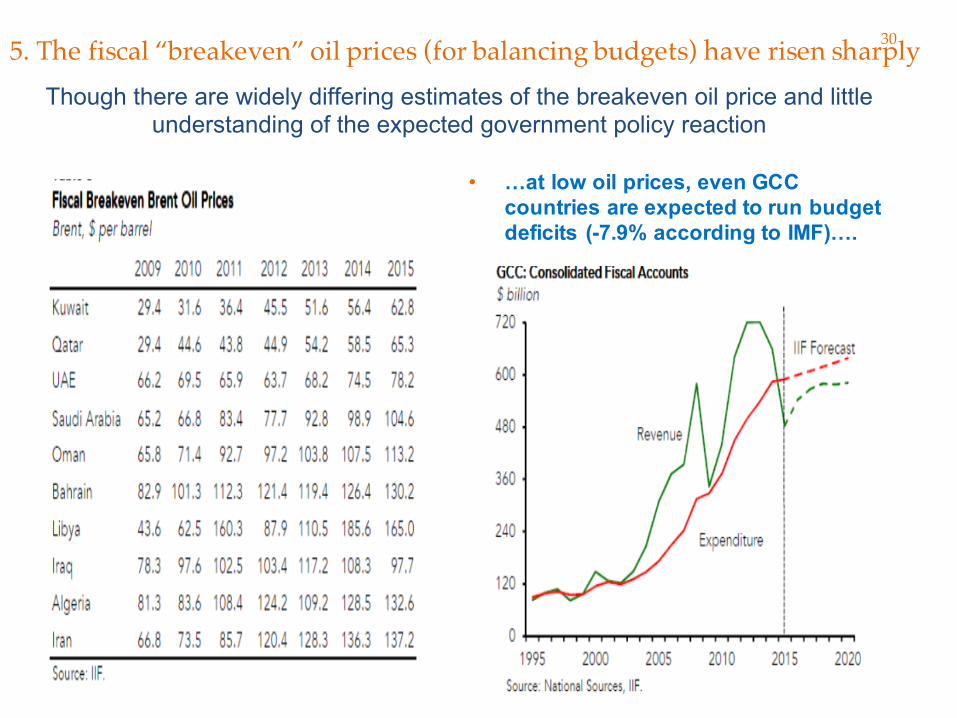
5. The fiscal “breakeven” oil prices (for balancing budgets) have risen sharply
• …at low oil prices, even GCC countries are expected to run budget deficits (-7.9% according to IMF)….
30
Though there are widely differing estimates of the breakeven oil price and little understanding of the expected government policy reaction
31
5. Continued low oil prices will cause a number of countries to exhaust their “fiscal buffers” without offsetting measures
• The low price environment is likely to test the relationship between governments in oil-exporting countries and their sovereign wealth funds.
• Absent cuts in public expenditures, governments will likely be transferring less revenue than before to these funds. At the same time, pressures to draw down on sovereign wealth funds’ assets will probably rise.
• Among Middle East oil exporters, only the United Arab Emirates, Qatar, and Kuwait’s fiscal buffers will last for over 25 years on current fiscal plans and oil price projections, according to our estimates.
• Bahrain and Yemen will exhaust them in the next two years, while most other countries will run out of buffers in four to seven years.
• This year, Saudi Arabia has already drawn $80 billion from its international reserves, including the sovereign fund.
• Russia's cushion is thinner still. At the current rate, its Reserve Fund and National Welfare Fund may be gone by 2018, first deputy finance minister Tatyana Nesterenko said this month.
32
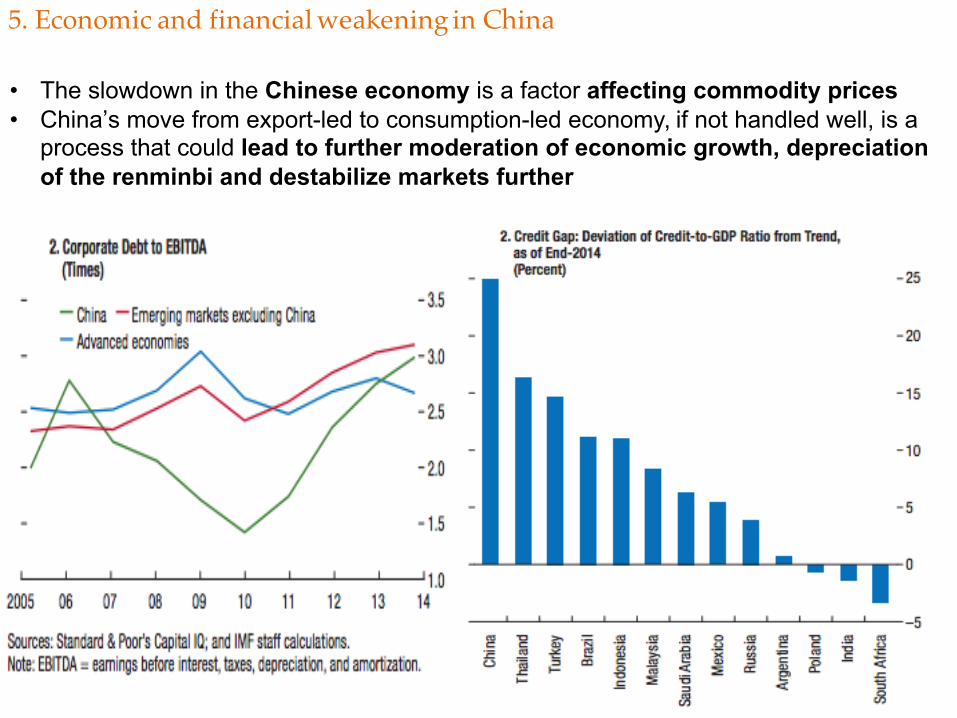
5. Economic and financial weakening in China
• The slowdown in the Chinese economy is a factor affecting commodity prices• China’s move from export-led to consumption-led economy, if not handled well, is a
process that could lead to further moderation of economic growth, depreciation of the renminbi and destabilize markets further
33
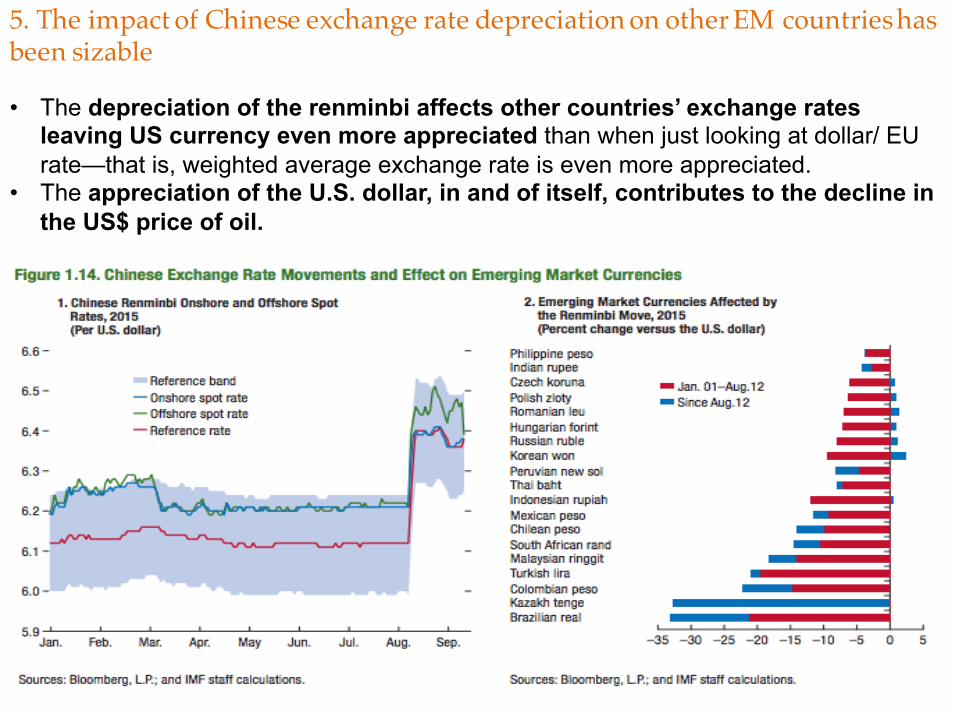
5. The impact of Chinese exchange rate depreciation on other EM countries has been sizable
• The depreciation of the renminbi affects other countries’ exchange rates leaving US currency even more appreciated than when just looking at dollar/ EU rate—that is, weighted average exchange rate is even more appreciated.
• The appreciation of the U.S. dollar, in and of itself, contributes to the decline in the US$ price of oil.
34
Concluding Thoughts
1. This was a pessimistic ending to an story that is basically optimistic; SWFs are increasingly looked to for meeting national and global policy needs
2. SWFs are more important than their size: they are growing quickly; heterogeneous—able to meet many differing purposes internal and external; they are long-term investors to meet countries’ long-term needs
3. SWFs are likely to continue to grow, but at a slower pace; the list of countries with SWFs will also grow, with countries such as Bolivia, Japan, Taiwan, Thailand, UK and Israel added to the list.
4. SWFs are ideally placed to invest in real estate with their international investment mandates and long-term horizons. Larger SWFs with inter-generational (savings) mandates (ie. ADIA, Qatar, GIC, Alaska) are ideally suited for real estate investments.
35
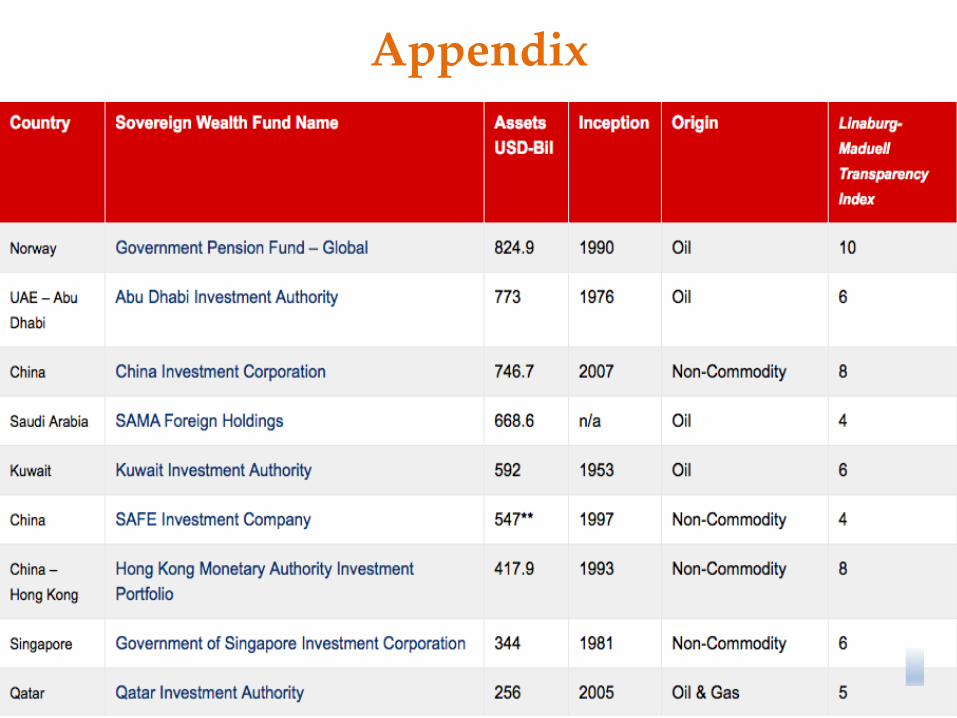
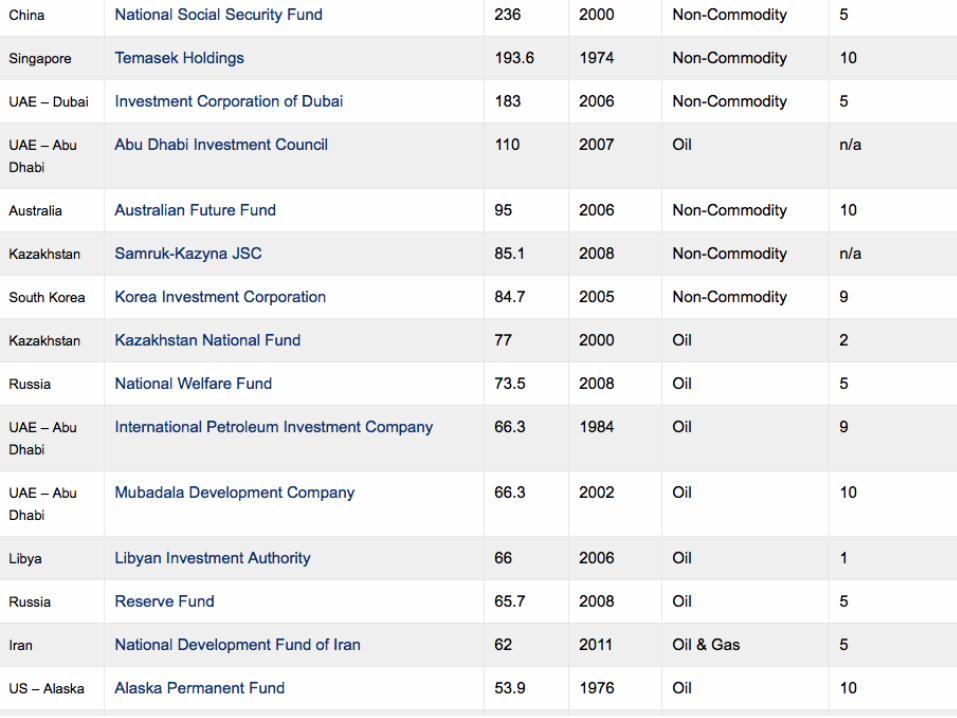
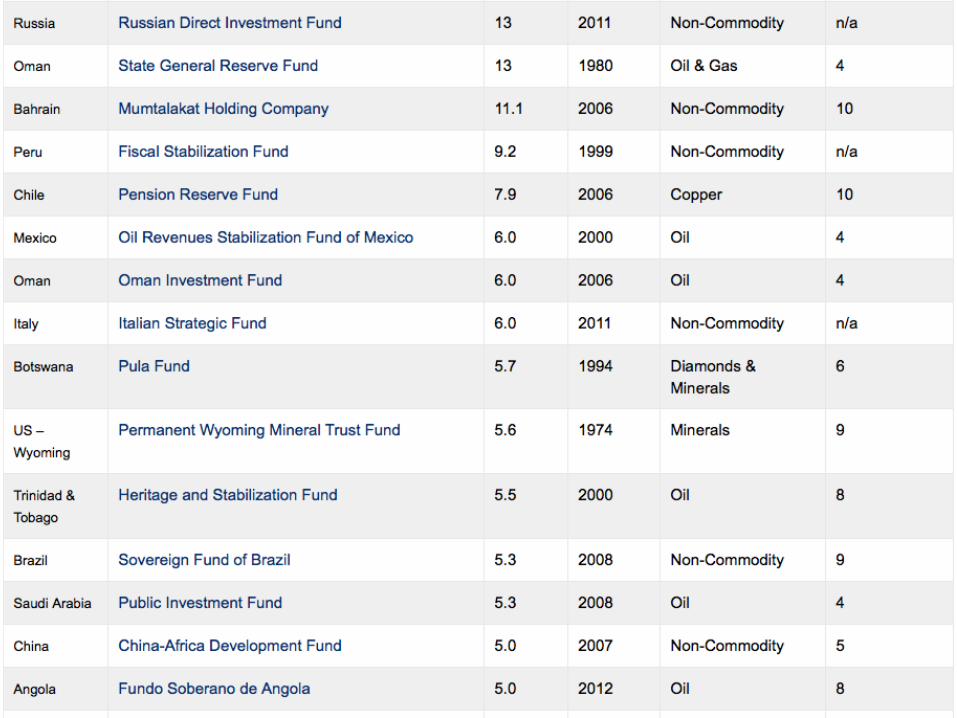
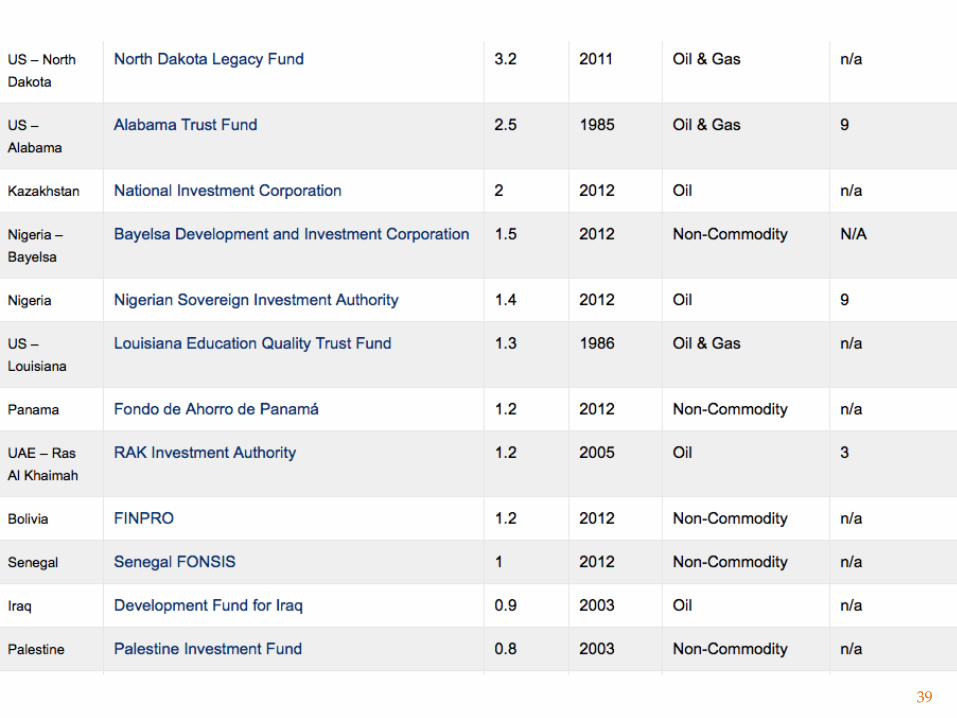
Appendix
36

37
38
39
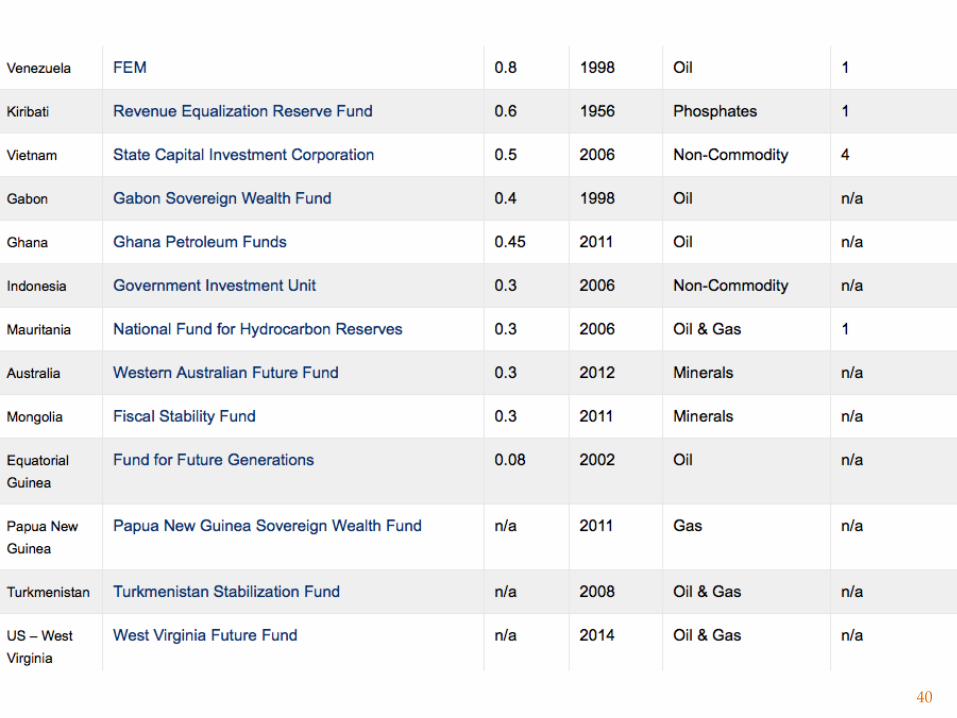
40
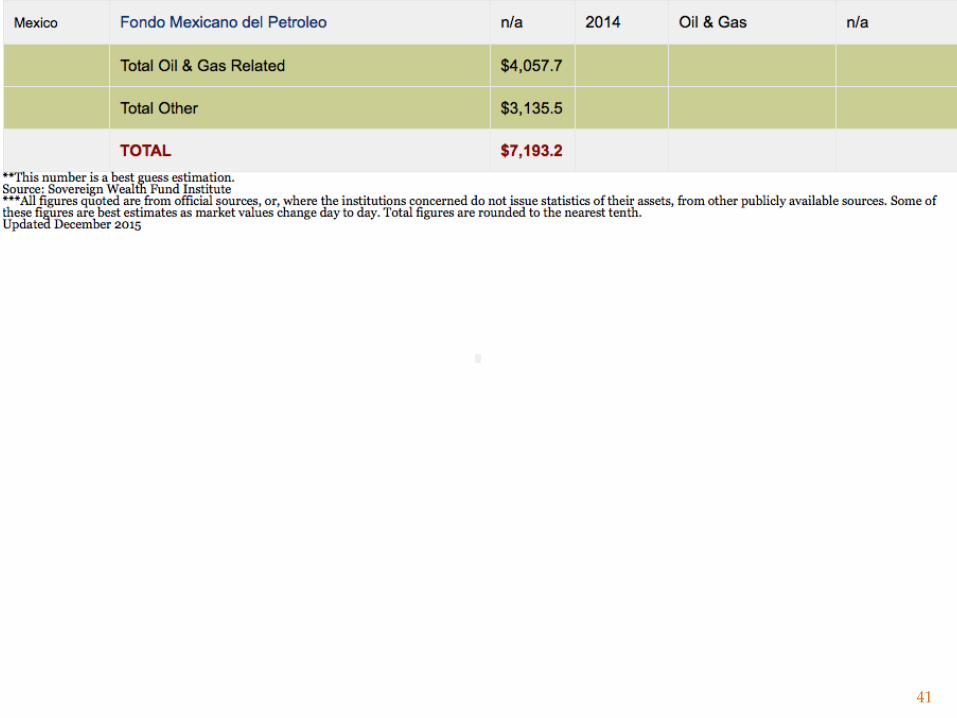
41