
Southwest Power Pool Annual Looking Forward Report · substantial economic benefits from the...
110
SPP-LF CONFIDENTIAL DRAFT April 11, 2014 Southwest Power Pool Annual Looking Forward Report Strategic Issues Facing the Electricity Business Craig R. Roach, Ph.D. Vincent Musco Sam Choi Andrew Gisselquist Prepared by: Boston Pacific Company, Inc. As an Independent Advisor to the SPP Board of Directors April 22, 2014 1100 New York Avenue, NW, Suite 490 East Washington, DC 20005 202-296-5520 www.bostonpacific.com
Transcript of Southwest Power Pool Annual Looking Forward Report · substantial economic benefits from the...
SPP-LF CONFIDENTIAL DRAFT April 11, 2014
Southwest Power Pool
Annual Looking Forward Report
Strategic Issues Facing the
Electricity Business
Craig R. Roach, Ph.D.
Vincent Musco
Sam Choi
Andrew Gisselquist
Prepared by:
Boston Pacific Company, Inc.
As an Independent Advisor to the
SPP Board of Directors
April 22, 2014
1100 New York Avenue, NW, Suite 490 East Washington, DC 20005 202-296-5520 www.bostonpacific.com
ii
TABLE OF CONTENTS
I. Executive Summary ............................................................................................................... 1
II. The Shale Gas Revolution (An Update) .............................................................................. 12
A. Latest Shale Gas Forecasts................................................................................................. 12
B. The Shale Revolution Continues to be an Economic Revolution ...................................... 19
C. Ongoing Review of Potential Environmental Impacts ...................................................... 20
D. LNG Export Updates ......................................................................................................... 26
III. EPA’s Continued Environmental Campaign ....................................................................... 28
A. Status of EPA Regulations on GHG Emissions ................................................................. 29
B. EPA Regulations on Other Air Emissions ......................................................................... 34
C. Update on U.S. GHG Emissions, Including Methane Emission Estimates ....................... 38
IV. Decentralization of the Grid and the Changing Utility Business Model ............................. 41
A. Decentralized Technology: Existential Threat, Complement, or Both? ............................ 42
B. Drivers of Demand for Decentralization: Cybersecurity, Weather, Rates ......................... 44
C. Developments in Supply of Distributed Technologies: Solar PV, Cogeneration,
Microgrids .......................................................................................................................... 46
D. Net Metering and Monthly Grid User Fees ....................................................................... 50
V. Fundamental Changes in Transmission Planning (Update
Based on New Information) ................................................................................................. 54
A. Right of First Refusal Out, Competitive Solicitations In ................................................... 55
B. More Flexibility for Merchant Developers ........................................................................ 58
C. Decentralization and Distributed Generation: Disruptive Impact on Transmission
Planning? ............................................................................................................................ 61
VI. A Possible Rise in Retail Rates ............................................................................................ 64
A. Significant Changes in Variables Driving Retail Rates ..................................................... 65
B. Aggregated Rate and Bill Data .......................................................................................... 68
C. Utilities Seeking Significant Rate Increases ...................................................................... 69
VII. Long-Term Demand Shock: Electric Vehicles (Short Update) ........................................... 72
VIII. An Introduction to Energy Storage ...................................................................................... 78
A. Formative Policy ................................................................................................................ 79
B. Energy Storage Technologies ............................................................................................ 80
C. Energy Storage Applications ............................................................................................. 86
IX. Anticipating New Science and Technology ......................................................................... 89
A. Parallels Between Nuclear and Wind Policy ..................................................................... 90

iii
B. A Carbon Tax Swap: Policy Choice Driving Technology................................................. 93
C. A New Story for Nuclear: SMRs? ..................................................................................... 98
LIST OF TABLES AND FIGURES........................................................................................... 102
GLOSSARY ............................................................................................................................... 104
iv
ABOUT BOSTON PACIFIC COMPANY, INC.
Boston Pacific Company, Inc. is a consulting and investment services firm, located in
Washington, D.C., specializing in the electricity and natural gas industries. For 27 years we have
provided information and insight to our clients who span the full range of stakeholders: state
regulatory commissions, regional transmission organizations, energy consumers, competitive
power producers, electric utilities, gas pipeline companies, and electric transmission companies.
We are nationally recognized experts on the electricity business as documented by our service as
expert witnesses throughout North America. Boston Pacific also is an industry leader in
designing and monitoring major power procurements of every type for state commissions across
the country, as well as open seasons for merchant transmission lines. In addition, Boston Pacific
has extensive, hands-on experience with a full range of power technologies including clean coal,
on- and off-shore wind, geothermal, waste-to-energy, solar photovoltaics, and natural gas-fired
combined-cycle. For 10 years, we have served as an independent advisor to the Board of
Directors of the Southwest Power Pool RTO on a full range of issues related to market design
and operation.
For more information on Boston Pacific, please visit us at www.bostonpacific.com.
DISCLAIMER
The data and analysis in this report are provided for informational purposes only and
shall not be considered or relied upon as market advice. Boston Pacific makes no representations
or warranties of any kind, express or implied, with respect to the accuracy or adequacy of the
information contained herein. Boston Pacific shall have no liability to recipients of this
information or third parties for the consequences arising from errors or discrepancies in this
information, for recipients’ or third parties’ reliance upon such information, or for any claim,
loss or damage of any kind or nature whatsoever arising out of or in connection with (1) the
deficiency or inadequacy of this information for any purpose, whether or not known or disclosed
to the authors, (2) any error or discrepancy in this information, (3) the use of this information, or
(4) any loss of business or other consequential loss or damage whether or not resulting from any
of the foregoing.
1
I. Executive Summary
his is the fourth year in which Boston Pacific Company, Inc. (Boston Pacific) has
prepared a separate Annual Looking Forward Report for the Southwest Power
Pool (SPP) Board of Directors. As with its predecessors, this report is intended to
contribute to the longer-term strategic planning by the board. To that end, we focus on broad
market and regulatory events that (1) potentially could have a significant impact on SPP’s
markets and/or (2) could require the board’s special attention.
Boston Pacific very much appreciates the input to and guidance for this report provided
by the board’s Oversight Committee.
A. The Shale Gas Revolution (An Update)
The shale gas revolution is important to the SPP Board because the price of natural gas is
typically the principal determinant of SPP energy market prices. So far, the revolution has
benefited ratepayers by keeping prices low. A key question for the board is whether the shale
gas revolution will continue benefiting SPP ratepayers and how long that benefit will last. The
overall message here is that the shale gas revolution is alive and well in terms of production and
reserves, but that the price for natural gas may rise more than previously forecast. Still, the
board should maintain a healthy skepticism when looking at the output of computer models,
T
2
which did not predict the rise of the shale gas revolution and may be similarly unreliable in
predicting its fall.
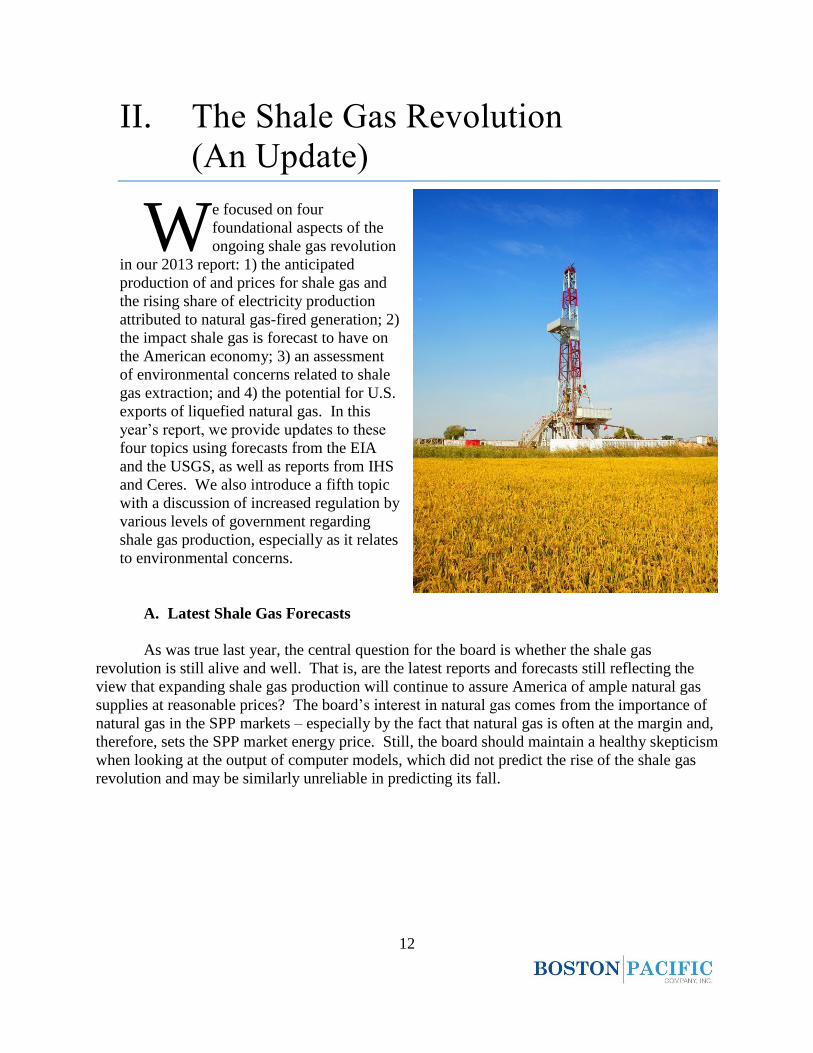
We focused on four foundational aspects of the ongoing shale gas revolution in our 2013
report: 1) the anticipated production of and prices for shale gas, and the share of electricity
production attributed to natural gas-fired generation; 2) the impact shale gas is forecast to have
on the American economy; 3) an assessment of environmental concerns related to shale gas
extraction; and 4) the potential for U.S. exports of liquefied natural gas (LNG). In this year’s
report, we provide updates to these four topics using forecasts from the Energy Information
Agency (EIA) and the U.S. Geological Survey (USGS), as well as reports from IHS Global
(IHS) and Ceres. We also introduce a fifth topic with a discussion of increased regulation by
various levels of government regarding shale gas production, especially as it relates to
environmental concerns.
As to the shale gas revolution being alive and well, note first that EIA forecasts natural
gas will provide 38 percent of America’s primary energy production in 2040, up from 31 percent
in EIA’s forecast a year ago. Moreover, 80 percent of the total will come from unconventional
sources and two-thirds of that will be from shale gas. In addition, the USGS increased its
estimate of shale gas resources by 10 percent in 2013 as compared to 2012. So, yes, based on
such reports, the revolution is alive and well.
As to prices, the EIA forecasts that the prices of natural gas in the near-term will be
higher than previously forecast due to rapid demand growth and a gradual increase in exports. In
2020 and 2030, the price in real terms is forecast to be $4.38/MMBtu and $6.03/MMBtu,
approximately 6 percent and 10 percent higher than last year’s forecast, respectively. Note that
EIA forecasts natural gas prices rising by a compound rate of 2.83 percent per year over the 2013
to 2040 period in real terms – that is, over and above economy-wide inflation. Note, too, that
recent events in the Northeast show that, despite abundant resources, natural gas prices are still
volatile; the recent “polar vortexes” increased spot gas prices in New York to more than
$100/MMBtu.
Turning to shale gas’s impact on the economy, in last year’s report we focused on the
substantial economic benefits from the production of shale gas, or the “upstream” part of the
business. In this year’s report we turn to IHS’s “A Manufacturing Renaissance,” the most recent
report in the firm’s series on economic impacts of the shale gas revolution, to explore the
downstream benefits. IHS finds that the shale gas revolution continues to benefit the U.S.
economy based on examples of new downstream industrial factories opening due to cheaper
natural gas prices, including a $1.7 billion facility by Dow Chemical in Louisiana and a $16 to
$21 billion plant by Sasol in Texas. In addition, IHS forecast increased production for various
industrial sectors due specifically to abundant and cheaper natural gas.
EPA continues to work on its major drinking water study that we discussed in some detail
in last year’s report; a draft release is scheduled for late 2014. Given that, we turn to another
aspect of water concerns in shale gas extraction – Ceres’ recent report analyzes hydraulic
fracturing and regional water supplies. Ceres finds that, “75 percent of [shale oil and gas] wells
3
are located in regions with medium of higher baseline water stress levels.”1 Ceres states,
“[g]iven projected sharp increases in production in the coming years and the potentially intense
nature of local water demands, competition and conflicts over water should be a growing
concern for companies, policy makers, and investors.”2
We reviewed reports released this past year that analyze possible seismic issues with
hydraulic fracturing processes. Current data indicate that the actual drilling is not a source of
concern, but that wastewater injection may be the source of surface-felt seismic activity. We
also briefly reviewed regulatory efforts at various government levels that could ultimately affect
how hydraulic fracturing is conducted in the U.S. These efforts include methane emissions
regulations in Colorado, the first of their kind on a state level in the nation. Colorado’s
regulations require devices to be installed that capture 95 percent of both volatile organic
compounds and methane emissions.
Finally, we conclude with updates to the U.S.’s efforts to increase LNG exports.
Currently, the U.S. is a net importer of natural gas. EIA predicts the U.S. will become a net
exporter of LNG by 2016. Further, by 2018, the U.S. will become a net exporter of natural gas
in total. As further evidence of interest in exports, note that the U.S. has approved permits for 32
of the 37 applications for LNG exports to Free Trade Agreement (FTA) nations.
B. EPA’s Continued Environmental Campaign
This chapter reviews the status of major Environmental Protection Agency (EPA)
regulations that affect the electricity sector, the so-called “campaign on coal.” These regulations
target greenhouse gas (GHG) emissions from new and existing units, emissions of ozone and
fine particulates, emissions of mercury and other heavy metals, cooling water intake structures,
and coal combustion residuals. EPA has entered into a new phase with these regulations.
Instead of identifying additional targets for regulation, work that was essentially completed in
President Obama’s first term, EPA is now focused on finalizing and implementing regulations
before the end of the president’s second term in order to secure the progress that it believes it has
already made.
The most influential of these regulations are likely to be those targeting GHG emissions.
Two such regulations are in development. Regulations on GHG emissions from new power
plants have already been proposed and are being finalized. These regulations set a federal
emissions limit for new coal-fired power plants of 1,100 lbs. CO2/MWh, which would prohibit
the construction of conventional coal plants that do not use carbon capture and sequestration
(CCS) technology. EPA plans to propose regulations on existing power plants by June 1, 2014.
These regulations occur under a different part of the Clean Air Act (CAA), so EPA will create
guidelines under which states will set emissions standards. Little is known for sure about the
form that these regulations will take, other than that EPA has stated that they will be less strict
1 Monika Freyman and Ryan Salmon, Hydraulic Fracturing & Water Stress: Growing Competitive Pressures for
Water, Ceres, May 2013, 5. 2 Ibid., 3.
4
than the regulations on new power plants and that EPA will consider the existing energy mix of
each state. These regulations could be either “source-based,” targeting emissions at each plant,
or “system-based,” which would target a broader range of actions, perhaps even a cap-and-trade
program, that would reduce emissions.
Other than the on-going development of regulations on GHG emissions, the major
developments this past year have involved the inevitable legal challenges that come with EPA
finalizing regulations. Since December 2013, at least three major court cases on EPA regulations
have been heard; one decision has been made in favor of EPA while rulings on the other two
cases are forthcoming. Additionally, potential legal challenges have already been raised with
respect to EPA’s two greenhouse gas regulations, described above, that are still under
development. It is not clear how all of these cases will turn out, but some challenges to EPA’s
regulations may slow the implementation of regulations or invalidate particular parts of
regulations. Importantly, however, at the moment, it appears that the basic legal frameworks that
provide EPA with the authority to regulate greenhouse gas emissions and other pollutants remain
firmly in place.
We conclude with an update on U.S. greenhouse gas emissions. These emissions,
especially in the electricity sector, peaked in 2007 and have since declined through 2012.3 As we
have stated in past Looking Forward Reports, it remains likely that the 2020 target for U.S.
greenhouse gas emissions set by the Obama administration will be met. At the same time, there
has been increased uncertainty this past year about the level of GHG emissions from natural gas
production and transport. Several studies have suggested that more methane, a potent
greenhouse gas, is emitted from natural gas production and transport than is currently estimated
by the EPA. This has raised questions in the media and in Congress about the life-cycle
emissions of natural gas-fired generation and how they compare to that from coal-fired
generation. If natural gas-fired generation is responsible for more GHG emissions than is
currently thought, it could lose its place as the favored “bridge fuel” to a low-carbon future and
face increased regulation. However, analyses indicate that this outcome is unlikely. Even if
these new studies are true, natural gas-fired generation will likely retain its place as a lower-
carbon alternative to coal-fired generation.
C. Decentralization of the Grid and the Changing Utility Business Model
The board has likely heard a lot recently about distributed generation, decentralization,
and a changing utility business model. Headlines, articles, and conference panels abound with
titles such as “Utilities Headed for a Cliff?” and “Distributed Energy Resources: Policy
Implications of Decentralization.” We go beyond the headlines to get more detailed information.
For our purposes, decentralized technologies include small generators of all technologies
connected to distribution system, cogeneration, energy storage, smart meter technology, and
microgrids. These technologies are already having an impact on the operation of the electric
3 The most recent available data is from 2012.
5
power grid and are projected to play a greater role going forward. In the extreme, decentralized
technologies could represent a competitive threat to the existing, centralized power grid; some
suggest the grid could be relegated to backing up distributed resources. Distributed generation
already has a significant foothold in the U.S., with approximately 12 million distributed
generation units with a total capacity of about 200 GW, 84 GW of which is cogeneration.4 North
America also has a current total microgrid capacity of 992 MW.5 However, to put these figures
in perspective, the U.S.’s current centralized generation capacity totals approximately 1,000
GW.6
At this point, there is no definitive answer to whether and to what extent distributed
technologies will represent a head-on competitive threat to the existing utility network model.
We present some credible studies on the matter, including a recent report by the Electric Power
Research Institute (EPRI), which suggests that decentralized technologies and the grid are
complements, not competitors. EPRI suggests that distributed energy customers derive
significant value from the grid, including reliability benefits and access to the marketplace; and
that the grid enjoys benefits from the integration of distributed energy resources, too, including
reliability benefits, better environmental performance, and avoided transmission investments. It
appears, too, that decentralized technology is already impacting transmission planning. Synapse
Energy Economics, for example, issued a report that contains claims that ISO New England fails
to account for distributed generation capacity in its analysis of grid needs and that will result in
New England ratepayers paying for transmission expansion projects that are not needed. EPRI,
too, echoes the theme of planning the grid in conjunction with distributed technologies. SPP, of
course, already includes distributed generation in its transmission planning.
Lastly, as SPP considers distributed resources in its planning, it should also be aware of
an emerging topic in states that offer net metering, which some claim provides subsidies to
distributed generation customers at the expense of non-distributed generation customers. Some
states are considering potential “monthly grid user fees” for distributed generation customers, in
which distributed generation customers pay a fee for access to grid services. We look at one
example – Arizona Public Service Company – that recently received state authority to charge its
customers with PV installations $0.70/kWh (roughly $4.90/month) for access to the grid.7 SPP
will want to pay attention to developments in grid access charges because, in net metering states
where grid access charges are low or zero, distributed generation penetration may be high, and
could have a larger impact on the networks in those areas.
4 U.S. Department of Energy, The Potential Benefits of Distributed Generation and Rate-Related Issues that May
Impede Their Expansion: A Study Pursuant to Section 1817 of the Energy Policy Act of 2005, February 2007, ii. 5 Peter Asmus, Alexander Lauderbaugh and Mackinnon Lawrence, “Executive Summary,” Market Data:
Microgrids: Forecasts for Commercial/Industrial, Community/Utility, Campus/Institutional, Military, and Remote
Microgrids: 2013-2020, Navigant Research, Q1 2013, 3. 6 Electric Power Research Institute, The Integrated Grid: Realizing the Full Value of Central and Distributed
Energy Resources, February 2014, 8. 7 Arizona Public Service Company, “Arizona Corporation Commission Sets New Direction for Net Metering
Policy,” APS website, last modified November 14, 2013,
http://www.aps.com/en/ourcompany/news/latestnews/Pages/arizona-corporation-commission-sets-new-direction-
for-net-metering-policy.aspx.
6
D. Fundamental Changes in Transmission Planning
One of SPP’s most important functions is planning and expanding the transmission grid.
In an update to a topic introduced in last year’s report, we look to three emerging events that
could impact transmission planning going forward. Two of these events are about opening
transmission expansion to competition – the goal of which is to produce a cheaper, better
transmission grid. The third event is being billed as the possible emergence of a disruptive
competitor to the grid.
The first event comes from the Federal Energy Regulatory Commission’s (FERC) now 3-
year-old Order No. 1000. In requiring transmission planners to remove the right of first refusal
from their tariffs, FERC took a positive step toward opening transmission to competition the way
the Public Utilities Regulatory Policies Act (PURPA) opened generation to competition in 1978.8
Also, with this directive, FERC has made transmission planners – like SPP – the arbiter of
competing transmission proposals from incumbent and non-incumbent developers. As we detail
in the body of the report, we think that the impact of FERC’s directives may be limited for now.
Adding transmission to the grid is more difficult than adding new generation to the grid because
transmission additions have a system-wide, complex impact that makes evaluation difficult.
Incumbent transmission owners may be judged to have an advantage – for now – over non-
incumbent developers; we have already seen an example in California of such an outcome for a
new line in Pacific Gas & Electric Company’s (PG&E) territory. Also, in selecting winners, SPP
and others could face challenges from losing bidders, especially since transmission project
evaluation cannot be boiled down to a simple “price only” solicitation and often relies on some
level of subjectivity.
The second event also involves improving the grid by encouraging more competition.
Merchant transmission has long been an option for non-incumbent investment in the grid.
However, while many projects have been proposed in recent years, few have been completed – a
testament to the long and difficult road faced by merchant developers. In 2013, FERC sought to
make that road an easier one by introducing new flexibility to the rates, terms, and conditions
merchant developers can negotiate with their customers. FERC’s action should create efficient
incentives for customers that could speed up the process for merchant developers. However,
some of merchant transmission’s most fundamental challenges – finding willing, creditworthy
customers, siting, etc. – remain outside the realm of FERC’s jurisdictional tools.
The third event we discuss is the challenge faced by transmission planners to incorporate
a new set of resources (e.g., distributed generation) into transmission plans. Decentralization and
distributed generation, as we discuss in Chapter III, have elements of a game-changing advance
akin to the new competition to land lines brought by cellular phones in the telecommunications
industry. The presumption is that decentralized power could allow customers to sidestep the grid
altogether. However, according to an ICF International (ICF) study on the issue, distributed
resources can help complement the grid by offsetting or deferring some transmission investment
if coordinated planning is used. We note examples from Vermont, New Hampshire and Maine
8 Craig R. Roach, Ph.D. et al., Southwest Power Pool Annual Looking Forward Report, Boston Pacific Company,
Inc., April 23, 2013, 34-35.
7
raised by ICF. As noted above, there is no consensus regarding if and when distributed
generation will represent a competitive threat to the existing network model, but, for now, it is
important to integrate distributed generation into transmission planning processes.
E. A Possible Rise in Retail Rates
In last year’s Looking Forward Report, we noted that conditions driving monthly
electricity bills could be worsening, which could mean higher electricity costs for SPP
ratepayers.9 We explained that electricity bills had enjoyed “favorable conditions” in recent
years but that going forward, conditions were likely to change. This may matter to SPP because
higher electricity rates can affect demand and, thereby, SPP’s planning. Further, to the extent
that transmission costs drive higher rates, SPP may anticipate pushback from customers who pay
those costs.
Specifically, we explained that a prolonged period of low natural gas prices, low interest
rates, and limited capital expenditures by utilities had helped keep bills down. Going forward,
we noted that (1) rising natural gas prices; (2) higher interest rates; (3) increases in utility capital
expenditures to upgrade the grid; (4) increases in utility capital expenditures to comply with
environmental regulations; and (5) underfunded liabilities in the form of pension obligations
could all contribute to higher retail rates. We explained, too, that demand for electricity was
expected to stay largely flat, but that monthly bills could increase nonetheless.
This year, our purpose was to check in on the status of retail electricity rates and bills by
looking at anecdotal data and forecasts for rates, bills, and variables that can drive electricity
costs. Generally, as explained in more detail in the body of the report, the evidence suggests a
mixed picture for electricity rates and by no means reveals a nationwide trend to higher rates and
monthly bills. The forecasts for some variables that drive utility costs continue to suggest an
upcoming rise in rates and bills. For example, natural gas prices are expected by EIA to have an
implied compound annual growth of 2.83 percent in real terms through 2040.10 However,
aggregate retail rate and bill data and forecasts indicate only modest increases to date. The
average residential bill in January 2013 increased 1.45 percent from the year prior,11 and U.S.
residential rates increased by 2.9 percent12 from 2012 to 2013. Going forward, EIA forecasts
only modest growth in average residential rates, including a rise in 2014 of 0.9 percent from
9 Ibid., 43-50. 10 U.S. Energy Information Administration, “Oil and Gas Supply, Reference case,” AEO2014 Early Release
Overview Interactive Table Viewer, accessed April 16, 2014,
http://www.eia.gov/oiaf/aeo/tablebrowser/#release=AEO2014ER&subject=8-AEO2014ER&table=14-
AEO2014ER®ion=0-0&cases=ref2014er-d102413a. Percentage (2.83) calculated by Boston Pacific. 11 Percent increase (1.45 percent) calculated by Boston Pacific using data from Edison Electric Institute, Typical
Bills and Average Rates Report for Winter 2013, cited in Florida Power & Light, “Residential Bills lower than
national average,” 2012; Edison Electric Institute, Typical Bills and Average Rates Report for Winter 2012, cited in
Florida Power & Light, “Residential customer bills 25 percent below the national average,” 2013. 12 Percent increase calculated by Boston Pacific using data from U.S. Energy Information Administration, “Average
Retail Price of Electricity to Ultimate Customers by End-Use Sector, by State, November 2013 and 2012 (Centers
per Kilowathour),” Electric Power Monthly, January 21, 2014, table 5.6.A.
8
2013 levels, another 1.7 percent in 2015, and by a total of 14.7 percent in 2040 from 2013 levels,
all in real terms.13
Additionally, we provide four anecdotal examples of utilities seeking or projecting rises
in retail rates and, potentially, monthly bills. Again, while this by no means indicates a wider
trend of rising rates, our purpose was to check up on real utilities across the U.S. to see if there
are any instances of significant rate changes.
F. Long-Term Demand Shock: Electric Vehicles
As a backdrop to this year’s chapter on electric vehicles (EV), it is useful to look back at
our previous reports’ findings and conclusions regarding electric vehicles. In the first annual
Looking Forward Report, we concluded that the potential for a demand shock in SPP, from a
nationwide adoption of 1 million EVs, was remote. Since then, we have been on the lookout for
evidence that would suggest otherwise. In the subsequent two years, we evaluated anecdotal
evidence, including advances in technology, changes in the economics of EVs, sales updates, and
the Chinese EV industry; we found no reason to change our viewpoint in either report.
In reassessing the issue for the 2014 report, the dramatic growth in Tesla Motor’s stock
price caught our eye. In less than a year, Tesla’s stock price has risen from $51 to $245 per
share, representing a 380 percent increase in less than a year.14 For a company that solely
produces EVs, one might say that its investors are betting on substantial growth in EV sales. If
we look at overall sales for EVs, data appears to confirm such growth. Annual EV sales grew 83
percent from 2012 to 2013.15
However, other data points provide a mixed picture. First, if we use the Obama
administration’s goal of having 1 million EVs on the road by 2015 as a benchmark for where
EVs should be to support “advanced technology vehicle manufacturing and adoption in the U.S.
…,”16 EVs are a long way off from the necessary pace – another 820,000 EVs would need to be
sold this year. In fact, the EIA tells us that this goal will not be achieved until 2021 or 2022.17
13 Percent increase calculated by Boston Pacific using data from U.S. Energy Information Administration,
“Electricity Supply, Disposition, Prices, and Emissions, Reference Case,” AEO2014 Early Release Overview
Interactive Table Viewer, accessed April 18, 2014,
http://www.eia.gov/oiaf/aeo/tablebrowser/#release=AEO2014ER&subject=6-AEO2014ER&table=8-
AEO2014ER®ion=0-0&cases=ref2014er-d102413a. 14 NASDAQ, “Tesla Historical Stock Prices,” NASDAQ website, accessed April 1, 2014,
http://www.nasdaq.com/symbol/tsla/historical. 15 Electric Drive Transport Association, “Electric Drive Sales Dashboard: Cumulative U.S. Plug-In Vehicle Sales,”
EDTA website, accessed April 18, 2014, http://www.electricdrive.org/index.php?ht=d/sp/i/20952/pid/20952. 16 Office of the Vice President, “Vice President Biden Announces Plan to Put One Million Advanced Technology
Vehicles on the Road by 2015,” the White House website, last modified January 26, 2011,
http://www.whitehouse.gov/the-press-office/2011/01/26/vice-president-biden-announces-plan-put-one-million-
advanced-technology-. 17 U.S. Energy Information Administration, “Light-Duty Vehicle Sales by Technology Type, United States,
Reference Case,” AEO2014 Early Release Overview Interactive Table Viewer, accessed April 16, 2014,
9
Additionally, the EIA forecasts that EVs will represent less than 2 percent of total vehicles in
2040, and that 78 percent of total vehicles will still run on gasoline.18 Other data on market
penetration and sales comparisons also indicate stiff competition from both hybrid electric and
gasoline internal combustion engine (ICE) vehicles.
We also examined other factors such as fuel efficiency, policy, and technology to see
what may be contributing to a less favorable outlook for EVs. Regarding fuel efficiency, by
2040, the EIA estimates that EVs will continue to extend their lead over other vehicle types in
fuel efficiency. However, gasoline ICE vehicles will experience the greatest percentage increase
in fuel efficiency.19 The current policy environment remains favorable for EVs with mandates
and subsidies from federal and state governments that call for higher efficiency vehicles and
provide tax credits for EVs. However, when we evaluated the current state of EV technology,
we found that EVs are still beset by range anxiety issues. Currently, range anxiety stems from
two primary issues: battery performance and infrastructure. A safety issue has been raised with
claims that that the leading battery technology (lithium-ion) for EVs is susceptible to catching on
fire. We note, however, that other battery alternatives with different chemistries are being
explored that do not carry the same fire risks of lithium-ion (Li-ion) batteries.
Based on the status of the EV industry, we reaffirm our conclusion from the 2011 Annual
Looking Forward Report that the emergence of EVs is not expected to have a major impact on
SPP in the foreseeable future.20
G. An Introduction to Energy Storage
Recently, there has been substantial discussion about energy storage in the media, as well
as in the investment, utility, and regulatory communities. That discussion indicates some
momentum for energy storage projects. California is seen as the place where energy storage may
achieve a foothold with an estimated $3 billion in contracts for new projects.21 Investment and
industry executives have both acknowledged that energy storage will become a reality in the near
future with battery storage being a primary focus. With this new, emerging momentum, we
thought it might be helpful to present an overview of energy storage, covering formative policy,
leading technologies, and the applications that energy storage may fill. We thought this primer
might help if the board begins to see proposals for storage, especially in the context of SPP’s
new ancillary services markets.
With respect to formative policy, two major policy actions that have taken place over the
past few years are seen as key drivers for growth in energy storage. First, FERC has recently
http://www.eia.gov/oiaf/aeo/tablebrowser/#release=AEO2014ER&subject=0-AEO2014ER&table=48-
AEO2014ER®ion=1-0&cases=ref2014er-d102413a. 18 Ibid. 19 Ibid. 20 Craig R. Roach, Ph.D. et al., Southwest Power Pool Annual Looking Forward Report, Boston Pacific Company,
Inc., April 15, 2011, 35. 21 Cassandra Sweet and Rebecca Smith, “For Storing Electricity, Utilities Push New Technologies,” Wall Street
Journal, February 27, 2014.
10
issued three orders that create new opportunities for grid energy storage. Second, last year,
California adopted the nation’s first energy storage mandate. The mandate requires California’s
three major regulated utilities to have a combined 1,325 MW of grid energy storage procured by
2020 that will help support investment of new projects.22
With respect to leading technologies, currently there is a wide range of energy storage
technologies being considered for commercial use. We focus on six leading technologies that
are either mature or have deployed projects that are currently operating at a grid-scale with
capacities greater than 1 MW. These technologies include pumped hydro storage, compressed
air energy storage, three types of battery storage, and flywheel energy storage. We discuss the
status and operational characteristics of each technology.
With respect to applications, there is a wide range of grid services that energy storage
systems may provide. However, many of these grid services are already provided by existing
grid resources, including generation, transmission, distribution, demand response, distributed
generation, or a combination thereof. We believe the value of energy storage lies in its unique
capability to deliver greater speed and accuracy for regulation and frequency response services.
Energy storage can be two times more effective than conventional fossil-fueled generation in
providing these services. While advances continue to be made in energy storage technologies, it
is still too early to tell how competitive energy storage will be compared to existing grid
resources.
H. Anticipating New Science and Technology
Most can agree that long-term strategic planning for the electricity business must
anticipate the potential for new (often-disruptive) science and technology to emerge. To wit,
most of the topics addressed in this report involve new technologies that have or may have major
impacts on the electricity market, in general, and on SPP markets, in particular. However, most
can also agree that the standard quantitative models do not do a good job at anticipating new
technology. The best (or worst) example is the failure of those models to predict the shale gas
revolution. A more qualitative, yet disciplined approach is needed.
Top historians such as Thomas P. Hughes and Richard F. Hirsch give at least two guiding
principles for this qualitative approach. First, new technology does not arrive unexpectedly,
which gives some hope that new technology can be anticipated. Second, new technology is not
all (or even primarily) about science and engineering because government policy, law,
economics, business strategy, and culture all collude to shape an industry, which shows how
complex it is to anticipate new technology. Given this, the heart of this qualitative approach
must involve weaving together all the many factors that drive new technology – here, that
approach is termed “strategic storytelling.”
22 Decision Adopting Energy Storage Procurement Framework and Design Program, Decision 13-10-040, Before the
Public Utilities Commission of California, October 17, 2013, 2.

11
Rather than define the approach in abstract, it is best just to jump into three varied
applications. The first application attempts to find parallels between the development of two
very different technologies – nuclear power and wind power. One parallel is that support for
each technology was justified primarily by one overarching goal, respectively. For nuclear
power, it was to win the Cold War by showing the technological superiority of capitalism. For
wind, it is to address global climate change. A second parallel is that both of these technologies
received substantial government policy support. For nuclear power, the support was in the form
of large cash subsides. For wind, the support comes from the combination of state mandates and
federal money (mostly through the production tax credit). A final possible parallel is that,
despite the heavy dependence on government support, each technology had to or will have to
meet a commercial test; that is, be an economically viable energy source independent of
subsidies. It is said that nuclear failed because it failed to pass this test; rather than being ‘too
cheap to meter,’ it became ‘too expensive to build.’ The difference with wind is that it has
continually had to pass a market test – the test of winning a contract in a state competitive
procurement or the test of winning dispatch in a Regional Transmission Organization (RTO)
energy market. The point is that wind may be in a far better position to leave the subsidies
behind because ongoing competition has driven price decreases and performance increases.
A second application addresses the question of whether a carbon tax is likely in the
future. One view is that it is only likely if it can be shaped by compromise into a ‘tax swap.’
That is, only if a tax is placed on carbon to discourage greenhouse gas emissions and the revenue
is used to fund tax reform. Also, it may be more likely if it leads to a ‘policy sweep’ – that is, if
the tax on carbon results in the repeal of some or all the many technology-specific subsidies now
used.
A third application addresses the question of the potential for a renaissance for nuclear
power based on new technology referred to as Small Modular Reactors (SMR). This new
technology is being funded with millions of dollars from the Department of Energy (DOE), but
the most important storyline is that it directly responds to at least two of the strategic failures of
nuclear power in the past: cost and safety.
12
II. The Shale Gas Revolution
(An Update)
e focused on four
foundational aspects of the
ongoing shale gas revolution
in our 2013 report: 1) the anticipated
production of and prices for shale gas and
the rising share of electricity production
attributed to natural gas-fired generation; 2)
the impact shale gas is forecast to have on
the American economy; 3) an assessment
of environmental concerns related to shale
gas extraction; and 4) the potential for U.S.
exports of liquefied natural gas. In this
year’s report, we provide updates to these
four topics using forecasts from the EIA
and the USGS, as well as reports from IHS
and Ceres. We also introduce a fifth topic
with a discussion of increased regulation by
various levels of government regarding
shale gas production, especially as it relates
to environmental concerns.
A. Latest Shale Gas Forecasts
As was true last year, the central question for the board is whether the shale gas
revolution is still alive and well. That is, are the latest reports and forecasts still reflecting the
view that expanding shale gas production will continue to assure America of ample natural gas
supplies at reasonable prices? The board’s interest in natural gas comes from the importance of
natural gas in the SPP markets – especially by the fact that natural gas is often at the margin and,
therefore, sets the SPP market energy price. Still, the board should maintain a healthy skepticism
when looking at the output of computer models, which did not predict the rise of the shale gas
revolution and may be similarly unreliable in predicting its fall.
W
13
1. Increased Gas Production
Current EIA data report that in 2013, the U.S. produced approximately 30.2 Tcf of
natural gas.23 The share of total natural gas production from unconventional sources has grown;
total natural gas production from unconventional sources was up from 49 percent in 2012, 45
percent in 2011, and 36 percent in 2010.24
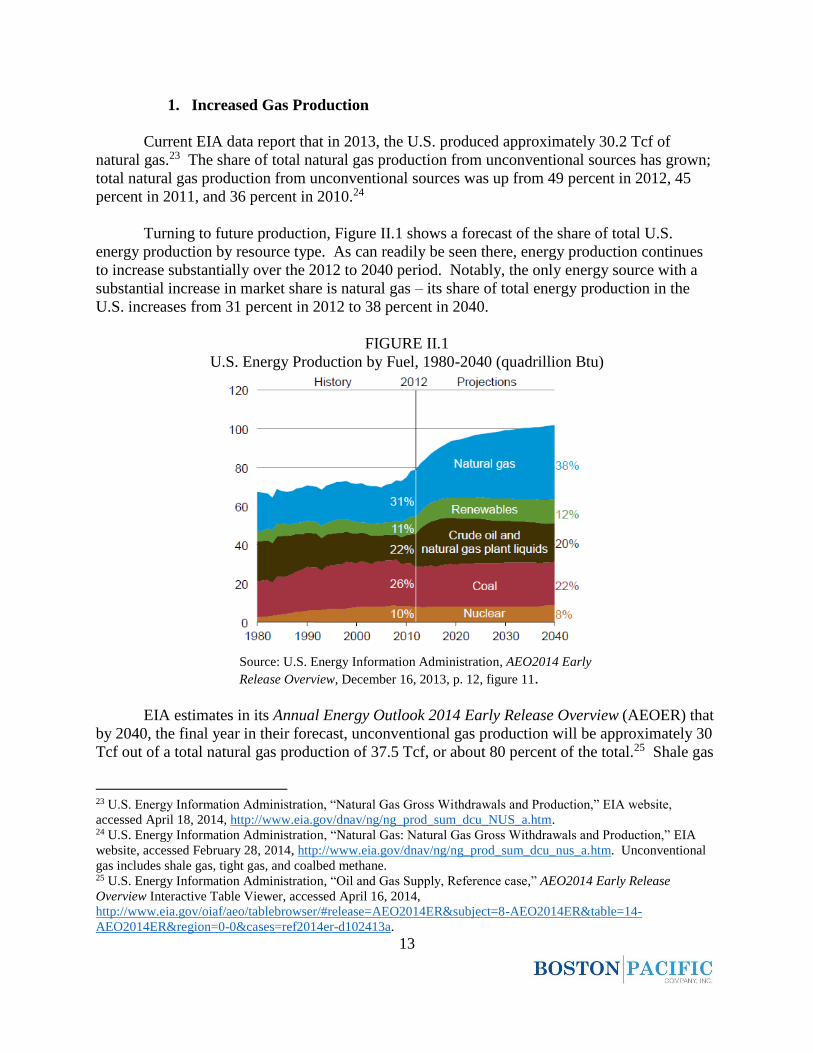
Turning to future production, Figure II.1 shows a forecast of the share of total U.S.
energy production by resource type. As can readily be seen there, energy production continues
to increase substantially over the 2012 to 2040 period. Notably, the only energy source with a
substantial increase in market share is natural gas – its share of total energy production in the
U.S. increases from 31 percent in 2012 to 38 percent in 2040.
FIGURE II.1
U.S. Energy Production by Fuel, 1980-2040 (quadrillion Btu)
Source: U.S. Energy Information Administration, AEO2014 Early
Release Overview, December 16, 2013, p. 12, figure 11.
EIA estimates in its Annual Energy Outlook 2014 Early Release Overview (AEOER) that
by 2040, the final year in their forecast, unconventional gas production will be approximately 30
Tcf out of a total natural gas production of 37.5 Tcf, or about 80 percent of the total.25 Shale gas
23 U.S. Energy Information Administration, “Natural Gas Gross Withdrawals and Production,” EIA website,
accessed April 18, 2014, http://www.eia.gov/dnav/ng/ng_prod_sum_dcu_NUS_a.htm. 24 U.S. Energy Information Administration, “Natural Gas: Natural Gas Gross Withdrawals and Production,” EIA
website, accessed February 28, 2014, http://www.eia.gov/dnav/ng/ng_prod_sum_dcu_nus_a.htm. Unconventional
gas includes shale gas, tight gas, and coalbed methane. 25 U.S. Energy Information Administration, “Oil and Gas Supply, Reference case,” AEO2014 Early Release
Overview Interactive Table Viewer, accessed April 16, 2014,
http://www.eia.gov/oiaf/aeo/tablebrowser/#release=AEO2014ER&subject=8-AEO2014ER&table=14-
AEO2014ER®ion=0-0&cases=ref2014er-d102413a.
14
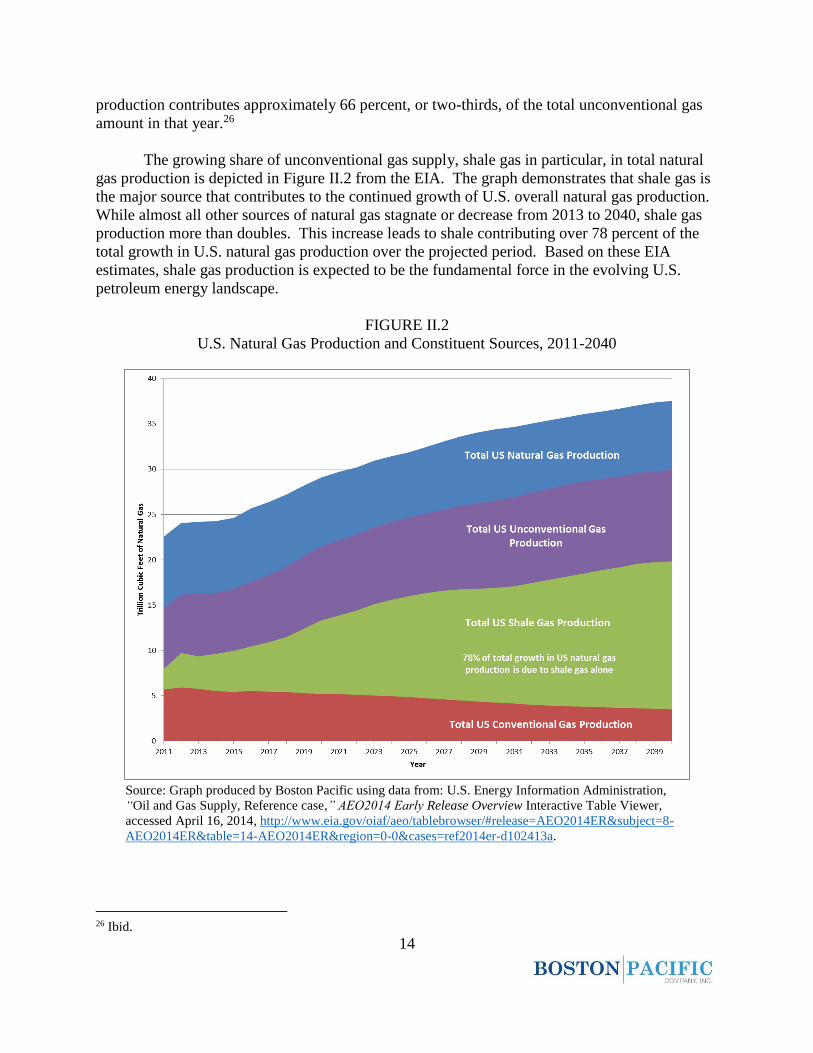
production contributes approximately 66 percent, or two-thirds, of the total unconventional gas
amount in that year.26
The growing share of unconventional gas supply, shale gas in particular, in total natural
gas production is depicted in Figure II.2 from the EIA. The graph demonstrates that shale gas is
the major source that contributes to the continued growth of U.S. overall natural gas production.
While almost all other sources of natural gas stagnate or decrease from 2013 to 2040, shale gas
production more than doubles. This increase leads to shale contributing over 78 percent of the
total growth in U.S. natural gas production over the projected period. Based on these EIA
estimates, shale gas production is expected to be the fundamental force in the evolving U.S.
petroleum energy landscape.
FIGURE II.2
U.S. Natural Gas Production and Constituent Sources, 2011-2040
Source: Graph produced by Boston Pacific using data from: U.S. Energy Information Administration,
“Oil and Gas Supply, Reference case,” AEO2014 Early Release Overview Interactive Table Viewer,
accessed April 16, 2014, http://www.eia.gov/oiaf/aeo/tablebrowser/#release=AEO2014ER&subject=8-
AEO2014ER&table=14-AEO2014ER®ion=0-0&cases=ref2014er-d102413a.
26 Ibid.
15
EIA’s projections are similar to IHS CERA’s 2013 estimates for the year 2035 that
Boston Pacific described in last year’s Looking Forward Report.27 That is, for 2040, EIA
forecasts two-thirds of total unconventional natural gas production will come from shale gas,
which matches IHS’s forecast for 2035. Their alignment serves as a sanity check.
It also is informative to see that EIA’s forecasts over the last several years reflect a
growing role for natural gas, in general, and shale gas, in particular. The cumulative natural gas
production projections for the years 2012 to 2040 from EIA’s most recent forecast, the 2014
AEOER, are 11 percent higher than the same period forecast in last year’s Annual Energy
Outlook (AEO) report, an increase EIA says is due to primarily shale gas production.28
In addition, USGS provides natural gas resource data that also demonstrates the
continued strengthening of the shale gas revolution. Updated annually, the National Assessment
of Oil and Gas Project maintains a database of “priority” basins, which represent “97% of the
discovered and undiscovered oil and gas resources of the United States.”29 The USGS estimates
in its most recent assessment, dated March 2013, that the U.S. has approximately 425 Tcf of total
shale gas resources,30 which is roughly a 10 percent increase from the previous year’s estimated
amount of 387 Tcf. 31
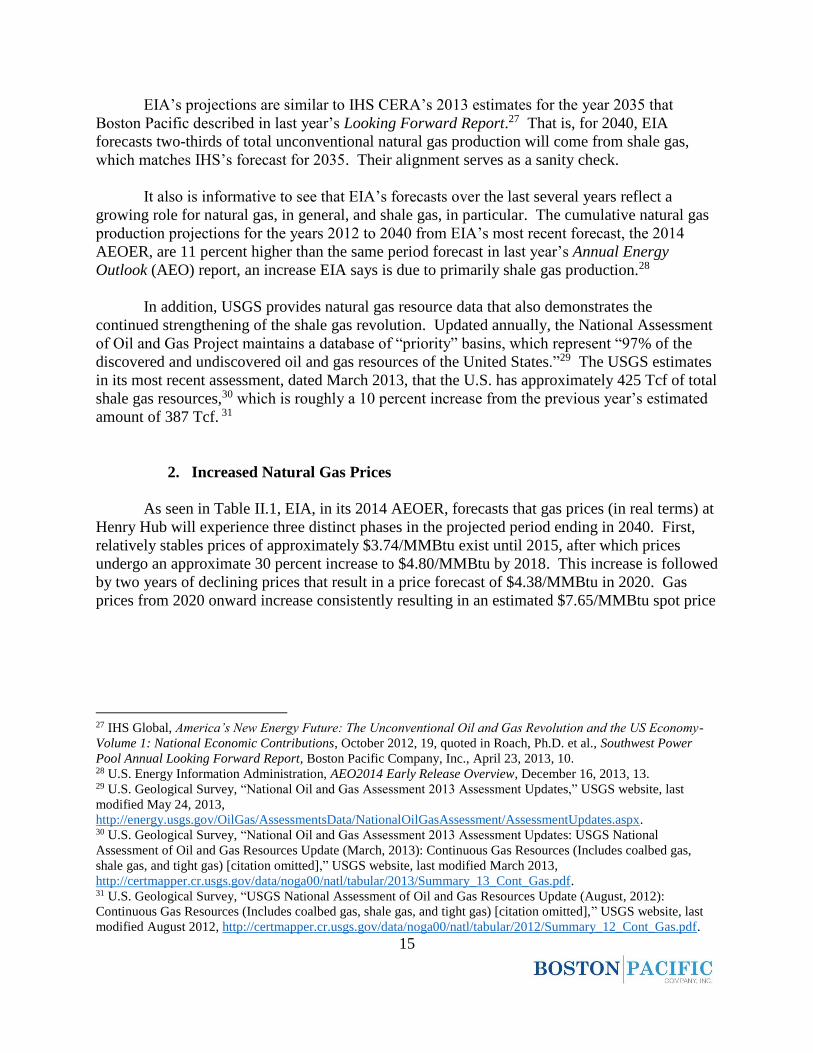
2. Increased Natural Gas Prices
As seen in Table II.1, EIA, in its 2014 AEOER, forecasts that gas prices (in real terms) at
Henry Hub will experience three distinct phases in the projected period ending in 2040. First,
relatively stables prices of approximately $3.74/MMBtu exist until 2015, after which prices
undergo an approximate 30 percent increase to $4.80/MMBtu by 2018. This increase is followed
by two years of declining prices that result in a price forecast of $4.38/MMBtu in 2020. Gas
prices from 2020 onward increase consistently resulting in an estimated $7.65/MMBtu spot price
27 IHS Global, America’s New Energy Future: The Unconventional Oil and Gas Revolution and the US Economy-
Volume 1: National Economic Contributions, October 2012, 19, quoted in Roach, Ph.D. et al., Southwest Power
Pool Annual Looking Forward Report, Boston Pacific Company, Inc., April 23, 2013, 10. 28 U.S. Energy Information Administration, AEO2014 Early Release Overview, December 16, 2013, 13. 29 U.S. Geological Survey, “National Oil and Gas Assessment 2013 Assessment Updates,” USGS website, last
modified May 24, 2013,
http://energy.usgs.gov/OilGas/AssessmentsData/NationalOilGasAssessment/AssessmentUpdates.aspx. 30 U.S. Geological Survey, “National Oil and Gas Assessment 2013 Assessment Updates: USGS National
Assessment of Oil and Gas Resources Update (March, 2013): Continuous Gas Resources (Includes coalbed gas,
shale gas, and tight gas) [citation omitted],” USGS website, last modified March 2013,
http://certmapper.cr.usgs.gov/data/noga00/natl/tabular/2013/Summary_13_Cont_Gas.pdf. 31 U.S. Geological Survey, “USGS National Assessment of Oil and Gas Resources Update (August, 2012):
Continuous Gas Resources (Includes coalbed gas, shale gas, and tight gas) [citation omitted],” USGS website, last
modified August 2012, http://certmapper.cr.usgs.gov/data/noga00/natl/tabular/2012/Summary_12_Cont_Gas.pdf.
16
in 2040.32 Overall, prices grow at an implied compound annual rate of 2.83 percent in real
terms.33
TABLE II.1
EIA Henry Hub Price Forecasts
Source: Boston Pacific table using data from U.S. Energy Information Administration, “Oil and Gas Supply, Reference case,”
AEO2014 Early Release Overview Interactive Table Viewer, accessed April 16, 2014,
http://www.eia.gov/oiaf/aeo/tablebrowser/#release=AEO2014ER&subject=8-AEO2014ER&table=14-
AEO2014ER®ion=0-0&cases=ref2014er-d102413a; U.S. Energy Information Administration, “Natural Gas Supply,
Disposition, and Prices, Reference Case,” Annual Energy Outlook 2013 with Projections to 2040 Interactive Table
Viewer, accessed April 18, 2014, http://www.eia.gov/oiaf/aeo/tablebrowser/#release=AEO2013&subject=8-
AEO2013&table=13-AEO2013®ion=0-0&cases=ref2013-d102312a.
Up to the year 2037, EIA’s 2014 AEOER Henry Hub price forecasts are higher than
those made in last year’s AEO. EIA explains the uptick, stating, “… price increases in the near
term [are] driven by faster growth of consumption in the industrial and electric power sectors
and, later, growing demand for export at LNG facilities.”34 The remaining three years in this
year’s forecast have a slower price growth due to a “sustained increase in production” of natural
gas, according to the EIA.35
Though long-term price forecasts can provide a broad idea of where prices may go, they
cannot predict abrupt changes and do not typically reflect real-world price volatilities. From
December 2013 to the middle of February 2014, two periods of particularly cold temperatures
and large amounts of precipitation (known as “polar vortexes”) occurred in the U.S. The first
“polar vortex” corresponded with Henry Hub price increases of nearly 10 percent in the week
that followed the precipitous drop in temperatures.36 The second extreme cold weather event led
to two even larger price spikes: first, prices increased by approximately 16 percent at the Henry
Hub two weeks after the storm, followed by about 20 percent two weeks later.37 For
comparative purposes, price fluctuations on a weekly basis surrounding these events varied no
32 U.S. Energy Information Administration, “Oil and Gas Supply, Reference case,” AEO2014 Early Release
Overview Interactive Table Viewer, accessed April 16, 2014,
http://www.eia.gov/oiaf/aeo/tablebrowser/#release=AEO2014ER&subject=8-AEO2014ER&table=14-
AEO2014ER®ion=0-0&cases=ref2014er-d102413a. 33 Ibid. Percentage (2.83) calculated by Boston Pacific. 34 U.S. Energy Information Administration, AEO2014 Early Release Overview, December 16, 2013, 7. 35 Ibid. 36 U.S. Energy Information Administration, “Natural Gas: Henry Hub Natural Gas Spot Price,” EIA website,
accessed March 12, 2014, http://www.eia.gov/dnav/ng/hist/rngwhhdd.htm. 37 Ibid.
2013 2014 2015 2016 2017 2018 2020 2025 2030 2035 2040
Implied Compound
Annual Growth
from 2013 - 2040
2014 AEOER Henry
Hub Spot Price
(2012 dollars/MMBtu) 3.60 3.74 3.74 4.14 4.40 4.80 4.38 5.23 6.03 6.92 7.65 2.83%
2013 AEO Henry Hub
Spot Price
(2011 dollars/MMBtu) 3.25 3.12 3.12 3.57 3.70 3.96 4.13 4.87 5.40 6.32 7.83 3.31%
17
more than 5 percent.38 Despite low prices, getting shale to markets is an issue. Regulators must
contend with natural gas spikes.
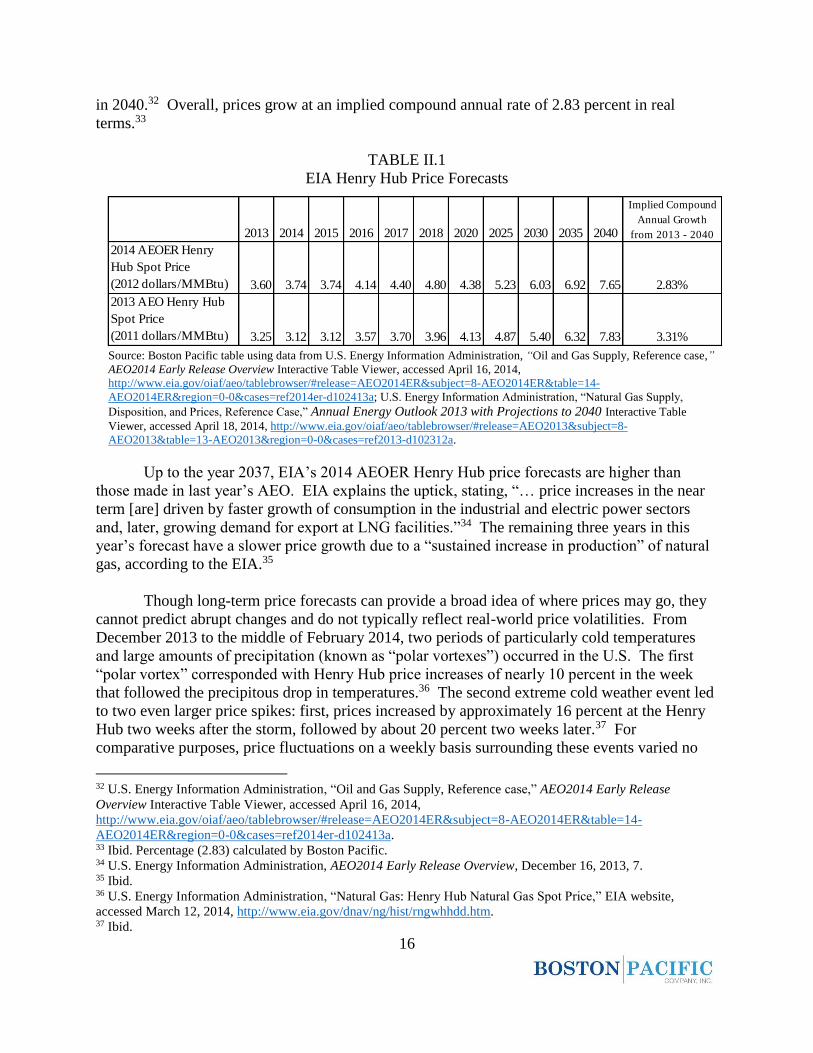
An example of even more extreme price volatility can be seen in New York City’s hub:
prices there increased by a factor of 10 due to the first bout of very cold weather, hitting levels
over $50/MMBtu.39 With the second round of extreme cold, prices exceeded $100/MMBtu for
the first time ever, where on January 21 prices reached a peak of $120.70/MMBtu.40 Figure II.3
graphs price volatility over the past year for three major city hubs, as well as for Henry Hub.
The impact sudden and extreme weather can have on gas prices is prominently visible. While
investigations are ongoing, transportation infrastructure deficiencies are suspected to the primary
reason for the price increases.
FIGURE II.3
U.S. Natural Gas Regional Spot Prices
Source: U.S. Energy Information Administration, Short-Term Energy Outlook Market Prices and
Uncertainty Report, February 11, 2014, p. 10, figure 13.
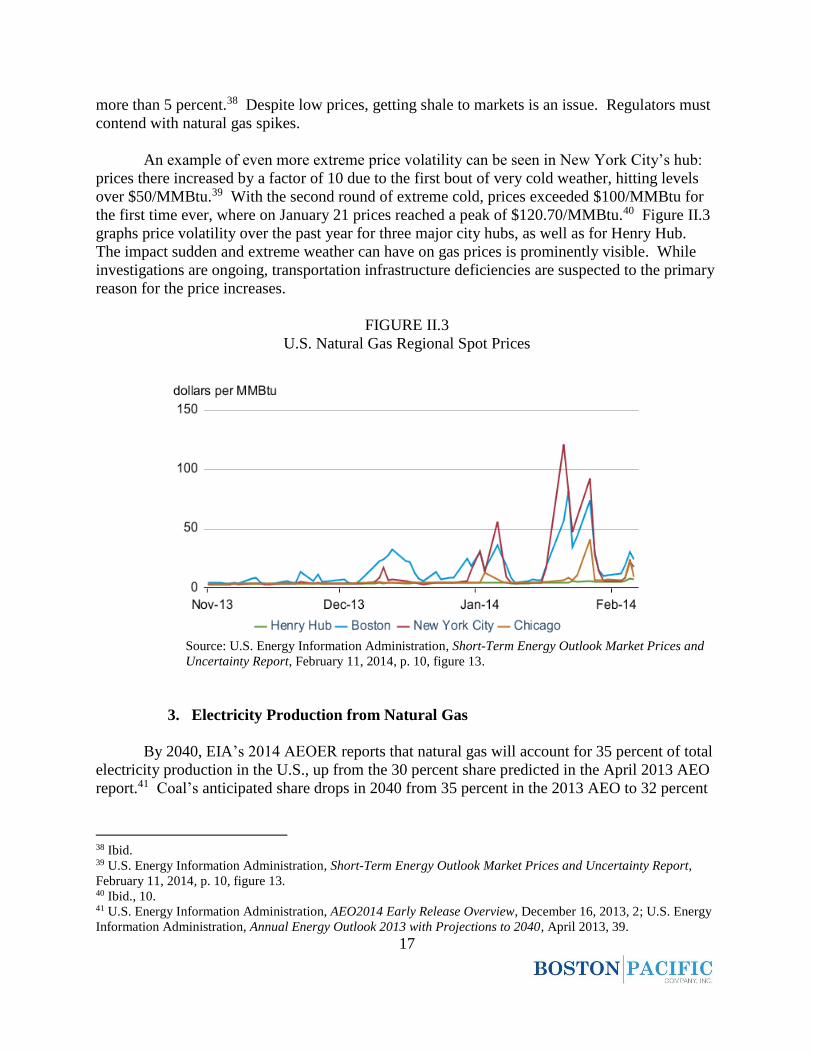
3. Electricity Production from Natural Gas
By 2040, EIA’s 2014 AEOER reports that natural gas will account for 35 percent of total
electricity production in the U.S., up from the 30 percent share predicted in the April 2013 AEO
report.41 Coal’s anticipated share drops in 2040 from 35 percent in the 2013 AEO to 32 percent
38 Ibid. 39 U.S. Energy Information Administration, Short-Term Energy Outlook Market Prices and Uncertainty Report,
February 11, 2014, p. 10, figure 13. 40 Ibid., 10. 41 U.S. Energy Information Administration, AEO2014 Early Release Overview, December 16, 2013, 2; U.S. Energy
Information Administration, Annual Energy Outlook 2013 with Projections to 2040, April 2013, 39.
18
in the 2014 AEOER.42 Within a single year, forecasts of natural gas-generated electricity’s
market share grew by 5 percent, a significant increase in which unconventional gas has a major
role. However, despite the decrease in percentage contribution, coal is forecast to still be a
significant generation resource. Figure II.4 graphs the change in market share for various fuel
sources. EIA claims that a “combination of slow growth in electricity demand, competitively
priced natural gas, programs encouraging renewable fuel use, and the implementation of
environmental rules dampens future coal use.”43
FIGURE II.4
Electricity Generation by Fuel, 1990-2040 (trillion kWh)
Source: U.S. Energy Information Administration, AEO2014 Early Release
Overview, December 16, 2013, p. 14, figure 13.
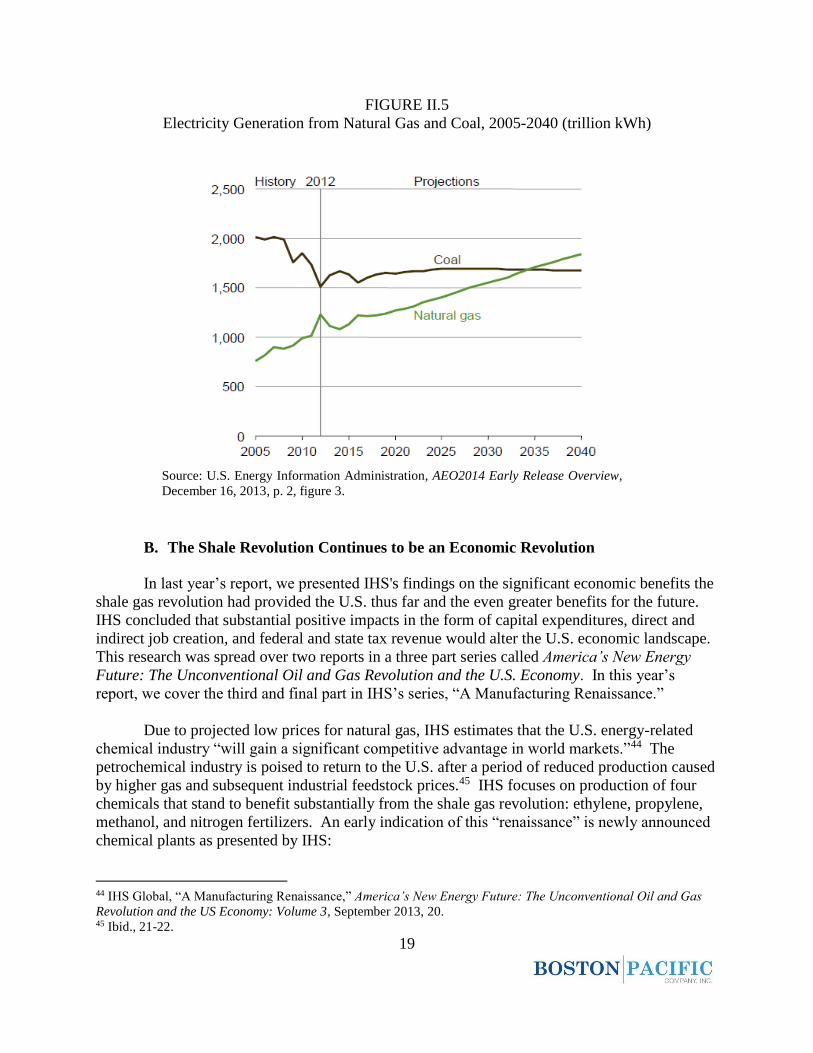
The EIA forecasts natural gas-generated electricity will become the largest resource for
supplying electricity in the U.S. in 2035 at the expense of coal. Figure II.5 graphs the year when
natural gas is projected to surpass coal and the relative amounts of electricity production by each
source.
42 U.S. Energy Information Administration, Annual Energy Outlook 2013 with Projections to 2040, April 2013, 39;
U.S. Energy Information Administration, AEO2014 Early Release Overview, December 16, 2013, 2. 43 U.S. Energy Information Administration, AEO2014 Early Release Overview, December 16, 2013, 14.
19
FIGURE II.5
Electricity Generation from Natural Gas and Coal, 2005-2040 (trillion kWh)
Source: U.S. Energy Information Administration, AEO2014 Early Release Overview,
December 16, 2013, p. 2, figure 3.
B. The Shale Revolution Continues to be an Economic Revolution
In last year’s report, we presented IHS's findings on the significant economic benefits the
shale gas revolution had provided the U.S. thus far and the even greater benefits for the future.
IHS concluded that substantial positive impacts in the form of capital expenditures, direct and
indirect job creation, and federal and state tax revenue would alter the U.S. economic landscape.
This research was spread over two reports in a three part series called America’s New Energy
Future: The Unconventional Oil and Gas Revolution and the U.S. Economy. In this year’s
report, we cover the third and final part in IHS’s series, “A Manufacturing Renaissance.”
Due to projected low prices for natural gas, IHS estimates that the U.S. energy-related
chemical industry “will gain a significant competitive advantage in world markets.”44 The
petrochemical industry is poised to return to the U.S. after a period of reduced production caused
by higher gas and subsequent industrial feedstock prices.45 IHS focuses on production of four
chemicals that stand to benefit substantially from the shale gas revolution: ethylene, propylene,
methanol, and nitrogen fertilizers. An early indication of this “renaissance” is newly announced
chemical plants as presented by IHS:
44 IHS Global, “A Manufacturing Renaissance,” America’s New Energy Future: The Unconventional Oil and Gas
Revolution and the US Economy: Volume 3, September 2013, 20. 45 Ibid., 21-22.
20
Sasol announced a new $16 to $21 billion dollar gas-to-liquids plant to be built in
Louisiana46;
“Dow Chemical Co. will create 150 permanent jobs and spend $1.7 billion to
build a hydrocarbon cracker [plant] in …Texas”47;
“The Canadian methanol company Methanex Corp. is relocating two $550 million
methanol plants from Chile to Geismar, Louisiana … The U.S. investment comes
as limited gas supplies in Chile have kept Methanex factories there operating
below capacity”48;
“Orascom Construction Industries of Egypt is building a new green field nitrogen
fertilizer plant in southeast Iowa to supply Corn Belt customers. The new plant
[is] the first world-scale, natural gas-based fertilizer plant built in the United
States in nearly 25 years …”49
In addition to the chemical industry “renaissance,” IHS estimates that the broad industrial
base will also benefit from the shale gas revolution. IHS claims, “[u]nconventional oil and
natural gas development is projected to increase industrial production by 2.8% in 2015, by 3.5%
in 2020, and by 3.9% in 2025.”50 Adding granularity, IHS estimates that specific industries such
as “Resins & Synthetic Material Manufacturing,” “Concrete & Product Manufacturing,” “Iron &
Steel Product Manufacturing,” and “Fabricated Metal Product Manufacturing” are projected to
gain additional “lift” when compared against historical growth rates.51 IHS concludes that, “ …
the overall contribution from lower natural gas prices, increased energy activity, and the second-
order economic impacts of the unconventional oil and gas revolution will improve the outlook of
the manufacturing sectors.”52
C. Ongoing Review of Potential Environmental Impacts
In last year’s Looking Forward Report, we addressed environmental concerns arising
from unconventional gas production.53 We split our environmental section into two major areas
of concern: emissions and water. From our research, we determined that, according to the
National Renewable Energy Laboratory, natural gas-fired electricity generation emits fewer
climate-changing emissions as compared to coal-fired generation when assessed across its full
fuel cycle. We reported that EPA claimed it did not yet know enough about shale gas
production’s potential impacts on water quality and had initiated a major study to get the
information it needed. Additionally, we briefly discussed how unconventional gas producers
were responding to increasing water scarcity issues as a result of drought conditions.
46 Ibid., 24. 47 Ibid., 27. 48 Ibid., 29. 49 Ibid., 30. 50 Ibid., 55. 51 Ibid., 55, 57. 52 Ibid., 56. 53 Roach, Ph.D. et al., Southwest Power Pool Annual Looking Forward Report, Boston Pacific Company, Inc.,
April 23, 2013, 14-17.
21
This year, we expand and update research on water impacts of unconventional gas
production from last year’s report. The EPA has not yet issued its draft report on water quality
impacts of shale gas extraction. Given that, we instead focus on water scarcity by reviewing
studies that provide additional perspectives and data on this issue. This year’s chapter will also
present findings from two reports that analyzed unconventional gas production’s potential for
inducing seismic activity. Finally, we will briefly review legislative and regulatory action
occurring at various levels of government that impact shale gas operations.
1. Water Scarcity Concerns
Again, the EPA is currently engaged in a comprehensive study of potential impacts of
hydraulic fracturing on drinking water resources. The EPA should produce a preliminary draft
of the report later this year. Obviously, any federal regulation of unconventional gas production
due to the resource’s impact on drinking water will likely arise from EPA’s conclusions.
Paralleling EPA’s ongoing research and scrutiny on water quality are the efforts to
further understand the complex relationship between unconventional gas production and water
scarcity. Ceres, a prominent non-profit that advocates for more sustainable business practices,
released a report last year that provided a comprehensive national inventory of hydraulic
fracturing operations and “the extent to which this activity is taking place in water stressed
regions.”54 Ceres utilized FracFocus.org and water stress indicator maps developed by the
World Resources Institute to develop the database.55 Setting the tone of the report, Ceres opens
with, “[g]iven projected sharp increases in production in the coming years and the potentially
intense nature of local water demands, competition and conflicts over water should be a growing
concern for companies, policymakers and investors.”56
As Ceres notes in its report, “[a]lthough water use for hydraulic fracturing is often less
than one or two percent of a state’s overall use, it can be much higher at the local level,
increasing competition for scarce supplies.”57 Though statewide water issues due to
unconventional gas activities are unlikely given the relative consumption, western states may
face stronger opposition from local communities where hydraulic fracturing efforts are prevalent.
When the continuing drought conditions in the western half of the country are considered as
well, these concerns become more pressing for decision makers.
54 Freyman and Salmon, Hydraulic Fracturing & Water Stress, Ceres, May 2013, 3. 55 Ibid. “FracFocus.org was launched in 2011 to serve as a voluntary national hydraulic fracturing chemical registry
and is managed by the Groundwater Protection Council and the Interstate Oil and gas Compact Commission … The
database provides the location of each well that was ‘fracked,’ the date it was fracked and the chemical additives and
total volume of water injected down the well … Since being launched, 10 states and two Canadian provinces have
opted to use FracFocus for regulatory reporting … Since disclosure to FracFocus is often still voluntary, the number
of wells and volume of water injected/used is underreported.” (Freyman and Salmon, Hydraulic Fracturing & Water
Stress, Ceres, May 2013, 4.) 56 Freyman and Salmon, Hydraulic Fracturing & Water Stress, Ceres, May 2013, 3. 57 Ibid., 5.
22
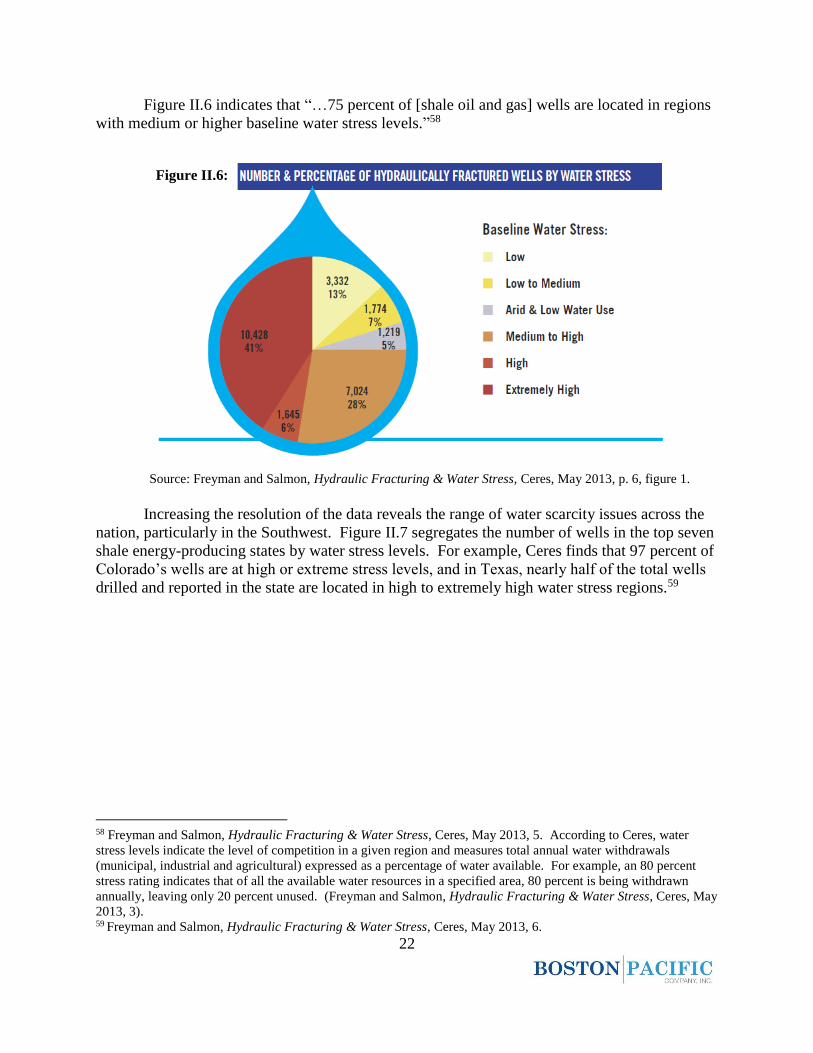
Figure II.6 indicates that “…75 percent of [shale oil and gas] wells are located in regions
with medium or higher baseline water stress levels.”58
Source: Freyman and Salmon, Hydraulic Fracturing & Water Stress, Ceres, May 2013, p. 6, figure 1.
Increasing the resolution of the data reveals the range of water scarcity issues across the
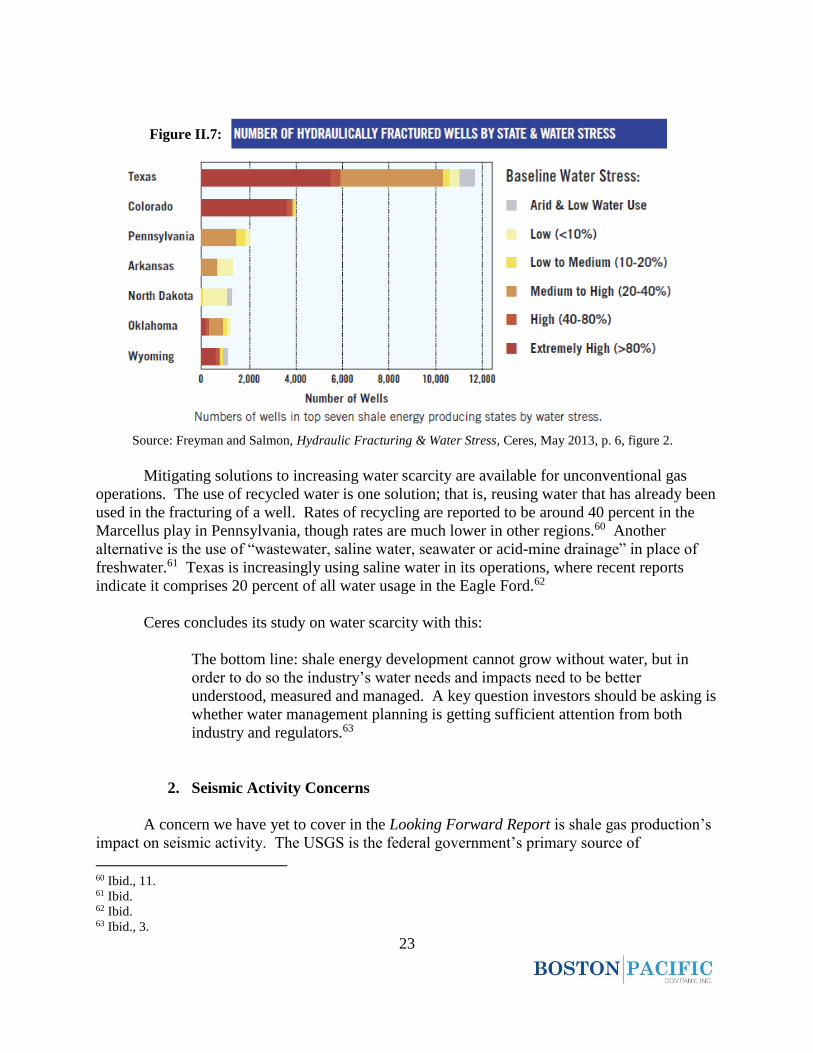
nation, particularly in the Southwest. Figure II.7 segregates the number of wells in the top seven
shale energy-producing states by water stress levels. For example, Ceres finds that 97 percent of
Colorado’s wells are at high or extreme stress levels, and in Texas, nearly half of the total wells
drilled and reported in the state are located in high to extremely high water stress regions.59
58 Freyman and Salmon, Hydraulic Fracturing & Water Stress, Ceres, May 2013, 5. According to Ceres, water
stress levels indicate the level of competition in a given region and measures total annual water withdrawals
(municipal, industrial and agricultural) expressed as a percentage of water available. For example, an 80 percent
stress rating indicates that of all the available water resources in a specified area, 80 percent is being withdrawn
annually, leaving only 20 percent unused. (Freyman and Salmon, Hydraulic Fracturing & Water Stress, Ceres, May
2013, 3). 59 Freyman and Salmon, Hydraulic Fracturing & Water Stress, Ceres, May 2013, 6.
Figure II.6:
23
Source: Freyman and Salmon, Hydraulic Fracturing & Water Stress, Ceres, May 2013, p. 6, figure 2.
Mitigating solutions to increasing water scarcity are available for unconventional gas
operations. The use of recycled water is one solution; that is, reusing water that has already been
used in the fracturing of a well. Rates of recycling are reported to be around 40 percent in the
Marcellus play in Pennsylvania, though rates are much lower in other regions.60 Another
alternative is the use of “wastewater, saline water, seawater or acid-mine drainage” in place of
freshwater.61 Texas is increasingly using saline water in its operations, where recent reports
indicate it comprises 20 percent of all water usage in the Eagle Ford.62
Ceres concludes its study on water scarcity with this:
The bottom line: shale energy development cannot grow without water, but in
order to do so the industry’s water needs and impacts need to be better
understood, measured and managed. A key question investors should be asking is
whether water management planning is getting sufficient attention from both
industry and regulators.63
2. Seismic Activity Concerns
A concern we have yet to cover in the Looking Forward Report is shale gas production’s
impact on seismic activity. The USGS is the federal government’s primary source of
60 Ibid., 11. 61 Ibid. 62 Ibid. 63 Ibid., 3.
Figure II.7:
24
information that would influence policy regarding hydraulic fracturing’s potential impacts on
seismic activity. Currently, the USGS is monitoring areas in the U.S. with possible links
between shale gas production and seismic activity. These efforts are ongoing and we report here
on the USGS’s work in Oklahoma, as well as a recent study from Durham University’s Energy
Institute.
According to the USGS, more than 200 magnitude 3.0 or greater earthquakes have
occurred in central Oklahoma since 2009 – an unusual increase that has warranted extra scrutiny
from both the USGS and the Oklahoma Geological Survey.64 USGS studies “show one to three
magnitude 3.0 earthquakes or larger occurred yearly from 1975 to 2008, while the average grew
to around 40 earthquakes per year from 2009 to mid-2013.”65 Analyses conducted by
seismologists indicated that they are not due to “random fluctuations in natural seismicity
rates.”66 Rather, “[t]he analysis suggests that a contributing factor to the increase in earthquakes
triggers may be from activities such as wastewater disposal [from hydraulic fracturing
operations] – a phenomenon known as injection-induced seismicity.”67 Scientists from both
federal and state scientific teams continue to monitor the situation.
Induced Seismicity and Hydraulic Fracturing for the Recovery of Hydrocarbons is a
study out of Durham University in England that analyzed the possibility of induced seismic
activity due to hydraulic fracturing.68 The study found that when faults are affected by hydraulic
fracturing activity, the majority of the resulting earthquake magnitudes “tend to be very low, and
do not exceed [a magnitude of one].”69 Though the report does mention the 2011 Eola Field
Oklahoma incident that produced earthquakes with magnitudes as high as 2.8, this incident was
said to be uncommon.70 The report states, “[i]t should be noted, however, that after hundreds of
thousands of fracturing operations, only three examples [one of which being Eola Field] of felt
seismicity have been documented. The likelihood of inducing felt seismicity by hydraulic
fracturing is thus extremely small but cannot be ruled out.”71
When reviewed together, these two studies from the USGS and Durham indicate that the
actual process of hydraulic fracturing in unconventional gas operations is not likely to be the
cause of noticeable seismic activity. Rather, research suggests that potentially damaging seismic
activity can result from wastewater injection.72
64 U.S. Geological Survey, “Earthquake Swarm Continues in Central Oklahoma,” USGS newsroom, last modified
October 22, 2013, http://www.usgs.gov/newsroom/article.asp?ID=3710&from=rss#.U1GAC1dmM1o. 65 Ibid. 66 Ibid. 67 Ibid. 68 Richard Davies et al., Induced Seismicity and Hydraulic Fracturing for the Recovery of Hydrocarbons, Durham
Energy Institute, April 2013. 69 Ibid., 16. 70 Ibid. 71 Ibid., 18. 72 A recent radiation leak from the Waste Isolation Pilot Plant uranium repository in New Mexico, which is
surrounded by “more than 100 operating oil and natural gas wells,” according to the director of the Nuclear Waste
Safety Program at Southwest Research and Information Center, resulted in some concern about the interaction of
hydraulic fracturing, its potential impact on seismic activity, and the location of the uranium repository. (Dahr
Jamail, “Radiation Leak at New Mexico Nuclear Waste Storage Site Highlights Problems,” Truthout website, last
25
3. Regulatory Efforts
Recently, governments ranging from federal to local levels have introduced legislation or
regulations that directly or indirectly impact shale gas operations. In February 2014, Colorado
successfully passed the nation’s first-ever rules that regulate methane emissions from hydraulic
fracturing wells.73 The legislation was a joint effort between the Environmental Defense Fund
and industry and state officials.74 Among the new requirements is one that requires companies to
install devices that capture 95 percent of emissions, both volatile organic compounds and
methane.75 They must also identify and control leaks from oil and gas equipment using special
equipment at least once a month.76 State officials estimate the new rules will reduce annual
emissions by 92,000 tons per year.77 As legislative efforts evolve in other levels of government
across the nation, these regulations may very well serve as a benchmark for compromises
negotiated by competing economic and environmental groups.
Other state and local governments are taking actions as well. For example, both
California and Illinois passed regulations on hydraulic fracturing that will permit operations to
begin within the respective states. Before permitting in California can begin, however, the state
will require studies be conducted that will report any potential air, water, and public health
impacts of fracking operations; these studies are expected to be completed in January 2015.78
Like California, Illinois’ regulations require disclosure of chemicals used in the fracturing fluid
and set guidelines for the management of wastewater.79 On the local level, four municipalities in
Colorado passed legislation that prohibit hydraulic fracturing activities for at least five years or
more.80 One of the municipalities additionally banned the transportation of wastewater produced
modified March 24, 2014, http://truth-out.org/news/item/22599-radiation-leak-at-new-mexico-nuclear-waste-
storage-site-highlights-problems.) 73 The amended regulations will become effective upon publication by the Secretary of State. Department of Public
Health and Environment, Regulation Number 7: Control of Ozone via Ozone Precursors and Control of
Hydrocarbons via Oil and Gas Emissions: 5 CCR 1001-5 (adopted by the Colorado Air Quality Control
Commission, unofficial draft, February 23, 2014). 74 Kiley Kroh, “Colorado Becomes the First State to Regulate Methane Emissions from Fracking,” Think Progress
website, last modified February 24, 2014, http://thinkprogress.org/climate/2014/02/24/3322651/colorado-methane-
fracking/. 75 Department of Public Health and Environment, Regulation Number 7: Control of Ozone via Ozone Precursors
and Control of Hydrocarbons via Oil and Gas Emissions: 5 CCR 1001-5 (adopted by the Colorado Air Quality
Control Commission, unofficial draft, February 23, 2014), 18. 76 Ibid., 15. 77 Kroh, “Colorado Becomes the First State to Regulate Methane Emissions From Fracking,” Think Progress
website, last modified February 24, 2014, http://thinkprogress.org/climate/2014/02/24/3322651/colorado-methane-
fracking/. 78 Oil and Gas: Well Simulation, California S.4, Chapter 313, September 20, 2013, paragraph 1,
http://leginfo.legislature.ca.gov/faces/billNavClient.xhtml?bill_id=201320140SB4&search_keywords. 79 Hydraulic Fracturing Regulatory Act, Illinois Public Act 098-0022, S. 1715,
http://www.ilga.gov/legislation/publicacts/98/PDF/098-0022.pdf. 80 For example, see Boulder County, “Final Official 2013 Coordinated Election Results for Boulder County Election
Day – November 5, 2013,” last modified November 13, 2013,
http://webpubapps.bouldercounty.org/clerk/voterresults2013/IssueResults.aspx?issue=all. See, also, Boulder
County, Ballot Content 2013: Boulder County Coordinated Election, November 5, 2013,
http://www.bouldercounty.org/elections/ballot/documents/2013%20coordinated%20ballot%20content.pdf.
26
from fracturing operations. Currently two of the municipalities’ efforts are being challenged in
state court on the grounds of state preemption. Similar efforts were attempted in Ohio, but
ultimately failed to pass.81
D. LNG Export Updates
Last year, we summarized a report by NERA Economic Consulting (NERA) for DOE,
which concluded that the U.S. would achieve net economic benefits if natural gas were to be
exported. In fact, in all of NERA’s scenarios, which included both low and high natural gas
production and export amounts, net economic benefits would be achieved. NERA concluded
that some negative effects would occur because LNG exports lowered “both real wages and the
return on capital in all other industries …”82 However, those negative effects were offset by
higher domestic natural gas prices, which increased income “in the form of higher export
revenues” and also increased income for households directly or indirectly involved in the
production of unconventional gas.83
In this year’s report, we report on U.S. LNG efforts, which have progressed since the
release of the NERA report. We discuss EIA projections that show how natural gas trade
balances might evolve as well as the status of U.S. LNG export permits. We will also briefly
review international shale gas developments and how U.S. LNG exports could be impacted.
Currently, the U.S is a net importer of natural gas.84 EIA predicts in the 2014 AEOER
that by 2016, the U.S. will be a net exporter of LNG and that “U.S. exports of [LNG] increase to
3.5 Tcf in 2029 and remain at that level through 2040.”85 In 2018, the U.S. will become an
overall net exporter of natural gas.86 This estimate for cumulative net LNG exports from 2012-
2040 is 160 percent higher than the same estimate provided in last year’s AEO, and EIA states
the increase is due to “increased use of LNG in markets outside America, strong domestic
production, and low U.S. natural gas prices relative to other global markets.”87 Figure II.8
graphs EIA’s predicted substantial growth in LNG exports.
81 For example, see vote on Section 122 in Mahoning County, “General Election: Summary Report: Final
Unofficial,” November 5, 2013, http://vote.mahoningcountyoh.gov/wp-content/uploads/2012/09/finalunn13g.pdf.
See, also, “Petition for Submission of Proposed Amendment to Charter,” Constitution of Ohio, Art. XVIII, Section 9
and 14; Revised Code 731.23-.41, 3503.06, accessed April 18, 2014,
http://www.protectyoungstown.org/uploads/1/2/4/0/12404661/youngstownrightsprint.pdf. 82 NERA Economic Consulting, Macroeconomic Impacts of LNG Exports from the United States, 2012, 7, quoted in
Roach, Ph.D. et al., Southwest Power Pool Annual Looking Forward Report, Boston Pacific Company, Inc., April
23, 2013, 19. 83 Ibid. 84 U.S. Energy Information Administration, “U.S. Natural Gas Exports and Re-Exports by Country,” EIA website,
accessed March 31, 2014, http://www.eia.gov/dnav/ng/ng_move_expc_s1_m.htm; U.S. Energy Information
Administration, “U.S. Natural Gas Imports by Country,” EIA website, accessed March 31, 2014,
http://www.eia.gov/dnav/ng/ng_move_impc_s1_m.htm. 85 U.S. Energy Information Administration, AEO2014 Early Release Overview, December 16, 2013, 2. 86 Ibid., 13. 87 Ibid.
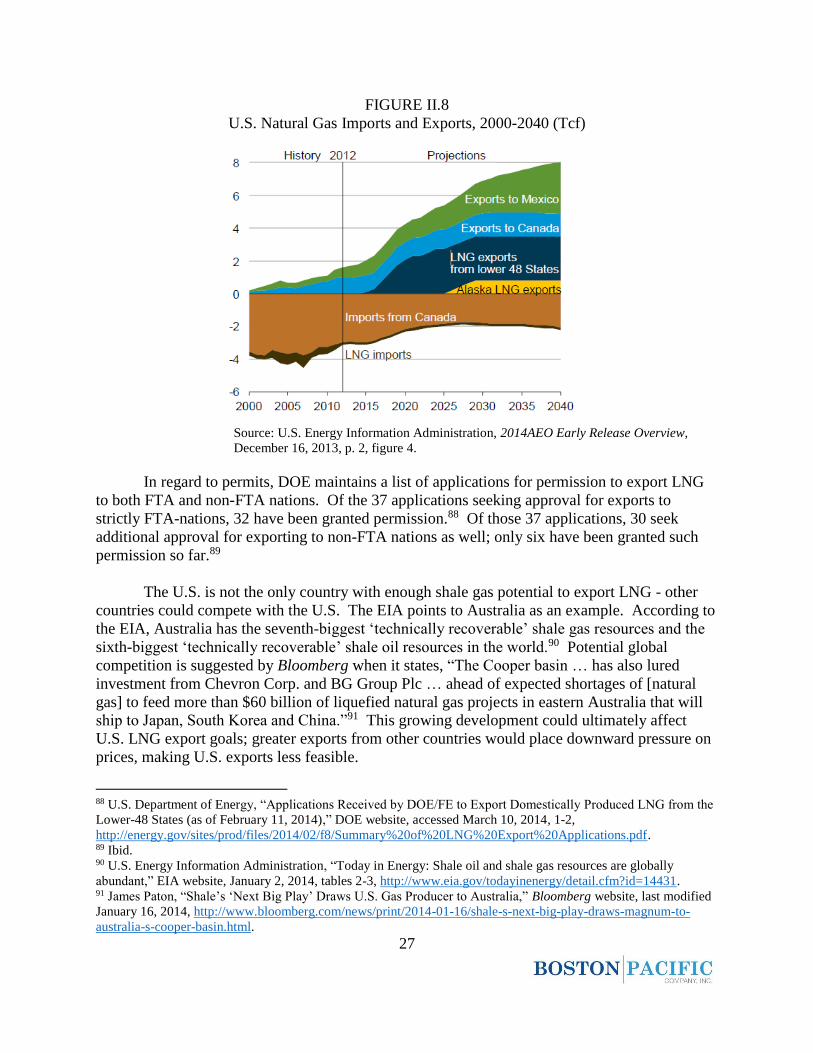
27
FIGURE II.8
U.S. Natural Gas Imports and Exports, 2000-2040 (Tcf)
Source: U.S. Energy Information Administration, 2014AEO Early Release Overview,
December 16, 2013, p. 2, figure 4.
In regard to permits, DOE maintains a list of applications for permission to export LNG
to both FTA and non-FTA nations. Of the 37 applications seeking approval for exports to
strictly FTA-nations, 32 have been granted permission.88 Of those 37 applications, 30 seek
additional approval for exporting to non-FTA nations as well; only six have been granted such
permission so far.89
The U.S. is not the only country with enough shale gas potential to export LNG - other
countries could compete with the U.S. The EIA points to Australia as an example. According to
the EIA, Australia has the seventh-biggest ‘technically recoverable’ shale gas resources and the
sixth-biggest ‘technically recoverable’ shale oil resources in the world.90 Potential global
competition is suggested by Bloomberg when it states, “The Cooper basin … has also lured
investment from Chevron Corp. and BG Group Plc … ahead of expected shortages of [natural
gas] to feed more than $60 billion of liquefied natural gas projects in eastern Australia that will
ship to Japan, South Korea and China.”91 This growing development could ultimately affect
U.S. LNG export goals; greater exports from other countries would place downward pressure on
prices, making U.S. exports less feasible.
88 U.S. Department of Energy, “Applications Received by DOE/FE to Export Domestically Produced LNG from the
Lower-48 States (as of February 11, 2014),” DOE website, accessed March 10, 2014, 1-2,
http://energy.gov/sites/prod/files/2014/02/f8/Summary%20of%20LNG%20Export%20Applications.pdf. 89 Ibid. 90 U.S. Energy Information Administration, “Today in Energy: Shale oil and shale gas resources are globally
abundant,” EIA website, January 2, 2014, tables 2-3, http://www.eia.gov/todayinenergy/detail.cfm?id=14431. 91 James Paton, “Shale’s ‘Next Big Play’ Draws U.S. Gas Producer to Australia,” Bloomberg website, last modified
January 16, 2014, http://www.bloomberg.com/news/print/2014-01-16/shale-s-next-big-play-draws-magnum-to-
australia-s-cooper-basin.html.
28
III. EPA’s Continued Environmental
Campaign
his chapter provides an update on the status of EPA regulations affecting the
electricity sector. These regulations target greenhouse gas emissions from new
and existing units, emissions of ozone and fine particulates, emissions of mercury
and other heavy metals, cooling water intake structures, and coal combustion residuals.
Practically, the process of EPA regulation involves creating a framework for regulation,
proposing regulations, finalizing regulations, and then facing legal challenges. Only after facing
legal challenges are regulations de facto final. These process steps can help us understand the
status of EPA’s regulations. For example, with GHG emissions, attempts were made in
Congress and by the Obama administration in 2009 and 2010 to expand the framework for
regulations through new legislation that would have enacted a national GHG emission cap-and-
trade program. This legislation was unsuccessful. The Obama administration responded by
having the EPA target GHG emissions using authority under the Clean Air Act. When these
regulations are completed, they will face legal challenges. For several other pollutants, the EPA
has used the CAA and other existing statutes to propose and finalize key regulations and is now
facing legal challenges. In general then, the EPA is now attempting to finalize the regulations
that make up the so-called “campaign on coal” before the end of President Obama’s second term.
T
29
The goal is, as much as possible, to make regulations de facto final before the end of the
president’s second term in order to secure the progress that has already been made.
As a result, whereas last year’s report discussed the likely impact of new and updated
EPA regulations on the electricity sector, this year we focus on the status of these regulations,
including the many legal challenges they face. The chapter begins by discussing the status of
what might be the most influential regulations under development; that is, those targeting GHG
emissions. It then discusses the status of several other recent and upcoming EPA regulations,
and especially how they have been impacted by court challenges. These regulations cover
traditional air pollutants such as sulfur dioxide (SO2), nitrogen oxides (NOX), mercury, and
particulate matter, as well as water use and coal combustion residuals. The main conclusion we
draw from legal experts is that aspects of some EPA regulations are at risk of being overturned
by legal challenges, but the fundamental statutory and legal drivers of EPA’s regulations remain
in place.
The chapter ends with a discussion of current data on U.S. GHG emissions and the
ongoing debate about whether EPA is properly measuring emissions of methane, a potent
GHG.92
A. Status of EPA Regulations on GHG Emissions
EPA continues to develop regulations on GHG emissions from stationary sources such as
power plants. On June 25, 2013, President Obama proposed the Climate Action Plan, which
detailed a comprehensive suite of measures to address climate change,93 and issued a presidential
memorandum on carbon pollution standards for the power sector.94 The memorandum included
a timeline for EPA to complete GHG regulations before the end of his second term.95 It directs
the EPA to (1) re-propose standards on GHG emissions from new power plants by September 20,
2013; (2) propose standards on GHG emissions from existing power plants by June 1, 2014; (3)
finalize standards on GHG emissions from existing power plants by June 1, 2015; and (4) require
states to submit to EPA the implementation plans for those regulations by June 30, 2016.96 This
92 For a detailed discussion of the rules and their potential impact on the electricity sector, see Roach, Ph.D. et al.,
Southwest Power Pool Annual Looking Forward Report, Boston Pacific Company, Inc., April 23, 2013, 22-32. 93 Office of the Press Secretary, FACT SHEET: President Obama’s Climate Action Plan, the White House website,
last modified June 25, 2013, http://www.whitehouse.gov/the-press-office/2013/06/25/fact-sheet-president-obama-s-
climate-action-plan. See, also, Executive Office of the President, The President’s Climate Action Plan, June 2013. 94 Office of the Press Secretary, Presidential Memorandum – Power Sector Carbon Pollution Standards, the White
House website, last modified June 25, 2013, http://www.whitehouse.gov/the-press-office/2013/06/25/presidential-
memorandum-power-sector-carbon-pollution-standards. 95 Ibid. 96 Office of the Press Secretary, Presidential Memorandum – Power Sector Carbon Pollution Standards, the White
House website, last modified June 25, 2013, http://www.whitehouse.gov/the-press-office/2013/06/25/presidential-
memorandum-power-sector-carbon-pollution-standards. The president reaffirmed his commitment to addressing
climate change and regulating carbon emissions from power plants in his 2014 State of the Union Address. See:
Office of the Press Secretary, President Barack Obama’s State of the Union Address, the White House website, last
modified January 28, 2014, www.whitehouse.gov/the-press-office/2014/01/28/president-barack-obamas-state-union-
address.
30
section of our report discusses the current status of GHG regulations on new and existing plants
as well as potential legal challenges, and a recent Supreme Court challenge to EPA’s existing
regulations that require certain facilities to have prevention of significant deterioration (PSD)
permits for GHG emissions.
1. Regulations on GHG Emissions from New Plants
In the spring of 2012, the EPA proposed New Source Performance Standards for GHGs
from coal- and gas-fired power plants under CAA Section 111.97 These standards set the best
system of emission reduction that has been “adequately demonstrated.”98 EPA’s proposal would
have blocked new construction of conventional coal plants by requiring such plants to limit GHG
emissions to the level achieved by a natural gas-fired combined cycle unit by using partial
carbon capture and sequestration. The proposal received over 2.5 million public comments and,
after review, the EPA decided to re-issue the rule.99
EPA announced a new proposal on September 20, 2013, as per the timeline set out by
President Obama.100 This new proposal has essentially the same outcome as the rule proposed in
2012 in that it would prevent construction of any traditional coal plants without at least partial
CCS.101 As compared to the previous proposal, this rule would create separate emissions
categories for coal and natural gas plants, and it slightly increases the emissions limit for coal
from 1,000 lbs/MWh to 1,100 lbs/MWh, as measured on average over 12 months.102
Additionally, the new proposal would require all new coal plants to implement CCS from the
first day of operation; the 2012 proposal had provided an alternative 30-year compliance option
that gave a 10-year grace period for installing CCS equipment if plants met tighter emission
standards after that point.103
97 Roach, Ph.D. et al., Southwest Power Pool Annual Looking Forward Report, Boston Pacific Company, Inc., April
23, 2013, 24, 28. See, also, U.S. Environmental Protection Agency, “Standards of Performance for Greenhouse Gas
Emissions from New Stationary Sources: Electric Utility Generating Units,” regulations.gov, last modified April 13,
2012, http://www.regulations.gov/#!documentDetail;D=EPA-HQ-OAR-2011-0660-0001. 98 Ibid. Additionally, once enacted such standards are to be reviewed every eight years and, if appropriate, updated. 99 U.S. Environmental Protection Agency, “2013 Proposed Carbon Pollution Standard for New Power Plants,” EPA
website, last modified February 26, 2014, www2.epa.gov/carbon-pollution-standards/2013-proposed-carbon-
pollution-standard-new-power-plants. 100 U.S. Environmental Protection Agency, EPA FACT SHEET: Reducing Carbon Pollution From Power Plants,
EPA website, accessed April 18, 2014, 1, http://www2.epa.gov/sites/production/files/2013-
09/documents/20130920factsheet.pdf. 101 This proposal was published as a proposed rule on January 8, 2014. See U.S. Environmental Protection Agency,
“Standards of Performance for Greenhouse Gas Emissions from New Stationary Sources: Electric Utility Generating
Units,” regulations.gov, last modified January 8, 2014, http://www.regulations.gov/#!documentDetail;D=EPA-HQ-
OAR-2013-0495-0001. 102 Ibid. The newly proposed rule also offers an alternative compliance option of 1,000-1,050 lbs/MWh as measured
on average over 84 months. 103 U.S. Environmental Protection Agency, “Standards of Performance for Greenhouse Gas Emissions from New
Stationary Sources: Electric Utility Generating Units,” regulations.gov, last modified January 8, 2014,
http://www.regulations.gov/#!documentDetail;D=EPA-HQ-OAR-2013-0495-0001. See, also, U.S. Environmental
Protection Agency, “Standards of Performance for Greenhouse Gas Emissions from New Stationary Sources:
31
When this rule is finalized, it will certainly face legal challenges. At this time it is
difficult to judge the merits of any legal challenges, but at least two possible objections have
been presented. First, there is a question whether CCS is “adequately demonstrated” as the best
system of emission reduction. Some of the facilities that EPA relied on to say that CCS was
adequately demonstrated received support under the DOE’s Clean Coal Power Initiative.
Meanwhile, Republican congressmen104 and the state of Nebraska105 have both objected that the
Energy Policy Act of 2005 prohibits using such facilities to make such a determination. In turn,
EPA has issued a technical support document defending its interpretation of partial CCS
technology as the best system of emissions reduction that has been adequately demonstrated.106
Second, there may be concerns about EPA’s scientific review of CCS. EPA has stated that its
rule “focuses on carbon capture,” not carbon sequestration, because the risks associated with
carbon sequestration are not in the scope of the Clean Air Act.107 EPA’s Science Advisory
Board, a group that advises EPA on the scientific basis for its regulations, declared in January
2014 that it “defers to EPA’s legal view” and will not be reviewing the science behind carbon
sequestration, but cautioned EPA that carbon sequestration is intertwined with the rule, and that
the technology has not undergone sufficient scientific review.108
One interesting note in support of EPA’s authority to issue New Source Performance
Standards for GHG emissions did come up in a recent U.S. Supreme Court case on EPA’s PSD
regulations on GHGs. In the case, there was discussion about EPA’s option to regulate GHGs
from stationary sources through the New Source Performance Standard provisions of the CAA.
While EPA’s authority to use these provisions to regulate GHGs was not before the Supreme
Court, the lawyer for industry in that case conceded that EPA has such authority and no party
argued to the contrary.109
Electric Utility Generating Units,” regulations.gov, last modified April 13, 2012,
http://www.regulations.gov/#!documentDetail;D=EPA-HQ-OAR-2011-0660-0001. 104 Rep. Fred Upton et al. to Administrator Gina McCarthy, letter, November 15, 2013,
http://energycommerce.house.gov/sites/republicans.energycommerce.house.gov/files/letters/20131115EPA.pdf.
See, also, Rep. Lamar Smith to Administrator Gina McCarty, letter, December 3, 2013,
http://science.house.gov/sites/republicans.science.house.gov/files/documents/12-03-
2013%20Chairman%20Smith%20to%20Administrator%20McCarthy.pdf. 105 State of Nebraska v. United States Environmental Protection Agency; and Gina McCarthy, Administrator, U.S.
EPA, Complaint for Declaratory and Injunctive Relief, No. 4:14-cv-3006 (D. Neb. January 15, 2014). 106 U.S. Environmental Protection Agency, “Technical Support Document to Docket EPA-HQ-OAR-2013-0495,”
January 8, 2014, http://www2.epa.gov/sites/production/files/2014-
01/documents/2013_proposed_cps_for_new_power_plants_tsd.pdf.
107 Dr. David T. Allen, Chair, Science Advisory Board to Administrator Gina McCarthy, letter, January 29, 2014, 2,
http://yosemite.epa.gov/sab/sabproduct.nsf/0/6646907111A3A35385257C70006F5F22/$File/EPA-SAB-14-003-
unsigned.pdf. 108 Ibid. 109 BLR, “Justices challenge both sides in GHG case,” enviro.BLR.com, last modified February 25, 2014,
https://enviro.blr.com/environmental-news/air/climate-change-greenhouse-gas-emissions/Justices-challenge-both-
sides-in-GHG-case/.
32
2. Regulations on GHG Emissions from Existing Plants
Under the CAA Section 111(d), if EPA has issued performance standards for new
sources, it is typically required to issue guidelines regulating existing sources in the same
category for the same pollutant.110 Accordingly, in anticipation of its standards on GHG
emissions from new power plants, EPA is working on a rule to limit GHG emissions from
existing plants. State regulators will then use EPA’s emission guidelines in setting performance
standards.111 These performance standards must reflect “the best system of emission reduction”
that is “adequately demonstrated,” accounting for costs and “nonair quality health and
environmental impact and energy requirements …”112
The exact form of the guidelines for GHG emissions from existing power plants is
unclear, but they will not be as stringent as EPA’s proposed regulation on new plants. EPA
Administrator Gina McCarthy has already said that EPA will not require CCS at existing
plants.113 McCarthy also noted that EPA would consider the energy mix of each state.114 One
possible guideline implied by these statements would set the “best system of emission reduction”
as a particular regulatory system. 115 For example, EPA could allow states to create
implementation plans that make broad changes to reduce demand and increase renewable energy
across the state, or even implement a statewide cap-and-trade program. Alternative guidelines
EPA could propose include source-by-source guidelines that could set specific emissions limits
or operating standards, or even a national cap-and-trade system.116
Although the rule on GHG emissions from existing sources has not yet been created, it is
clear that it, too, will face stiff legal challenges. First, if the New Source Performance Standards
were invalidated, the existing source regulations would be as well.117 Second, industry attorneys
have already raised another possible legal challenge that delves into the language of CAA
110 James E. McCarthy, EPA Standards for Greenhouse Gas Emissions from Power Plants: Many Questions, Some
Answers, Congressional Research Service, November 15, 2013, summary. See, also, Standard of Performance for
Stationary Sources, 42 U.S.C. § 7411. See, also, Standards of Performance for New Stationary Sources, 40 C.F.R.
60(b) § 60.22, Electronic Code of Federal Regulations, accessed April 16, 2014, http://www.ecfr.gov/cgi-bin/text-
idx?SID=50c4e28fd55b4427dcd4a8e546e70e56&node=40:7.0.1.1.1.2.151.3&rgn=div8. The exception to this rule
is if the pollutant is already regulated as a criteria pollutant or a hazardous air pollutant. 111 U.S. Environmental Protection Agency, “Considerations in the Design of a Program to Reduce Carbon Pollution
from Existing Power Plants,” EPA website, last modified September 23, 2013,
http://www2.epa.gov/sites/production/files/2013-09/documents/20130923statequestions.pdf. 112 Ibid. See, also, the definition of “standard of performance” in Standard of Performance for Stationary Sources,
42 U.S.C. § 7411 (a)(1). 113 Andrew Childers, “EPA Won’t Require Carbon Capture for Existing Power Plants, McCarthy Says,” Bloomberg
BNA website, last modified September 24, 2013, http://www.bna.com/epa-wont-require-n17179877247/. 114 Ibid. 115 Ayres Law Group, “EPA Regulation Under Clean Air Act Section 111(d): An Overview,” Ayres Law Group
website, last modified December 2013, http://www.ayreslawgroup.com/policy-alerts/111d-overview-2/. 116 Ibid. See, also, proposals from NARUC, NRDC, and industry stakeholders, as well as EPA comments and
questions for state partners in “Outreach Feedback on the CAA Section 111(d) Existing Source EGU Greenhouse
Gas Rulemaking,” regulations.gov, accessed April 18, 2014,
http://www.regulations.gov/#!docketBrowser;rpp=25;po=0;D=EPA-HQ-OAR-2014-0020. 117 Nathan Richardson, EPA Greenhouse Gas Performance Standards: What the Settlement Agreement Means,
Resources for the Future, February 2011, 5.
33
Section 111(d).118 They argue that this part of the CAA does not allow EPA to require states to
issue standards of performance for sources like power plants where the source is already
regulated for emissions of hazardous pollutants. More discussion on such challenges will occur
as EPA continues to develop its regulations on GHG emissions.
3. Challenges to Prevention of Significant Deterioration Regulation on GHG
Emissions
In 2011, an EPA regulation came into effect requiring facilities emitting levels of CO2e
above certain thresholds to have PSD permits for GHGs.119 The EPA claimed authority to issue
this rule from a long-standing EPA policy: once a pollutant is regulated under any part of the
CAA, it becomes subject to regulation under the PSD provisions of the act. Therefore, once
EPA began regulating GHG emissions from vehicles under the CAA in 2011, the PSD
provisions of the act were triggered for GHGs.120
In 2012, the PSD regulation, along with EPA’s finding that greenhouse gas emissions
endanger public health and welfare (Endangerment Finding) and EPA’s rule regulating GHGs
from motor vehicles (Tailpipe Rule), were challenged and upheld at the D.C. Circuit Court of
Appeals.121 Industry parties then petitioned the Supreme Court to review the Court of Appeals’
decision. The Supreme Court decided to hear only the challenges to the PSD rule, specifically
whether EPA “permissibly determined” that its rule limiting GHG emissions from vehicles
triggered PSD permitting requirements for GHG emissions from stationary sources.122 The fact
that the Supreme Court did not hear the other challenges indicates that the other rules were
118 Jean Chemnick, “Climate: Legislative glitch could doom rules for existing power plants,” E&E Publishing, LLC
website, last modified October 24, 2013, http://www.eenews.net/stories/1059989360. 119 These thresholds are at least 75,000 tons per year CO2e from sources that would already be subject to PSD or
Title V permitting for other pollutants, 100,000 tons per year CO2e, for any new sources, and a threshold of 75,000
tons per year CO2e increase from any existing source that already emits 100,000 tons per year. PSD permits require
new power plants to meet the “best available control technology” standard, as set by the state. When EPA sets New
Source Performance Standards, those standards will set the floor for determining best available control technology.
For more information, see Roach, Ph.D. et al., Southwest Power Pool Annual Looking Forward Report, Boston
Pacific Company, Inc., April 23, 2013, 24, 28. See, also, U.S. Environmental Protection Agency, PSD and Title V
Permitting Guidance for Greenhouse Gases, March 2011, 1, 12. 120 Prevention of Significant Deterioration and Title V Greenhouse Gas Tailoring Rule, Final Rule, 75 Fed. Reg.
31520-31522 (June 3, 2010). 121 U.S. Environmental Protection Agency, “U.S. Court of Appeals – D.C. Circuit Court Upholds EPA’s Actions to
Reduce Greenhouse Gases under the Clean Air Act,” EPA website, last modified September 9, 2013,
http://www.epa.gov/climatechange/endangerment/ghgcourtdecision.html. 122 Chamber of Commerce v. EPA, 684 F.3d 102 (October 15, 2013), http://www.supremecourt.gov/qp/12-
01272qp.pdf; “Utility Air Regulatory Group v. Environmental Protection Agency: Proceedings and Orders,”
SCOTUSblog, October 15, 2013 entry, accessed March 17, 2014, http://www.scotusblog.com/case-
files/cases/utility-air-regulatory-group-v-environmental-protection-agency/.
34
implicitly upheld.123 Oral argument in this case was held on February 24, 2014. Legal analysts
were unclear exactly how the court will rule; a decision is likely to be issued in June.124
B. EPA Regulations on Other Air Emissions
A number of other recent EPA regulations are also facing court challenges or are under
development. We discuss both categories here.
1. Cross-State Air Pollution Rule
Some states, especially in the eastern half of the U.S., have difficulty meeting ozone
and/or fine particulate National Ambient Air Quality Standards due to emissions blowing in from
other states. EPA’s Cross-State Air Pollution Rule (CSAPR) was intended to address this issue
by requiring certain upwind states to limit SO2 and NOX emissions so that downwind states
could achieve EPA’s standards.125
CSAPR was originally issued as a replacement for the Clean Air Interstate Rule after that
rule was vacated in 2008.126 However, in August 2012, CSAPR itself was vacated by the U.S.
Court of Appeals for the D.C. Circuit.127 The court reinstated the Clean Air Interstate Rule
pending the issuance of a rule to replace CSAPR. The court vacated CSAPR largely because the
emission reductions required of upwind states were not proportional to the impact of those
emissions on downwind states, as required by the so-called “good neighbor” provision of the
CAA.128 The EPA petitioned the Supreme Court to review this decision,129 and the Supreme
Court accepted.130 Oral argument was held December 10, 2013. A decision is expected to be
issued by the end of the Supreme Court term in June 2014.
123 Jeremy P. Jacobs and Jean Chemnick, “Climate: Supreme Court to review EPA greenhouse gas emissions
permitting,” E&E Publishing, LLC website, last modified October 15, 2013,
http://www.eenews.net/stories/1059988851. 124 Lawrence Hurley, “Justices question Obama climate change regulations,” Reuters website, last modified
February 24, 2014, http://www.reuters.com/article/2014/02/24/us-usa-court-climate-idUSBREA1N06Q20140224. 125 U.S. Environmental Protection Agency, Fact Sheet: The Cross-State Air Pollution Rule: Reducing the Interstate
Transport of Fine Particulate Matter and Ozone, 1-2, http://www.epa.gov/crossstaterule/pdfs/CSAPRFactsheet.pdf.
For information on the upwind-downwind pollution linkages, see U.S. Environmental Protection Agency: Office of
Air and Radiation, “Cross-State Air Pollution Rule: Reducing Air Pollution Protecting Public Health,” (PowerPoint
presentation), 22, http://www.epa.gov/crossstaterule/pdfs/CSAPRPresentation.pdf. 126 EME Homer City Generation, L.P. v. Environmental Protection Agency, et al., No. 11-1302 (D.C. Cir. August
21, 2012), 14. 127 Ibid., 59. 128 Ibid., 26-29. 129 Petition for a Writ of Certiorari, United States Environment Protection Agency, et al. v. EME Homer City
Generation, L.P., March 2013,
http://www.epa.gov/airmarkets/airtransport/CSAPR/pdfs/EME_Homer_City_Pet.pdf. 130 U.S. Supreme Court, “Certiorari – Summary Dispositions,” June 24, 2013, 6,
http://www.supremecourt.gov/orders/courtorders/062413zor_n7ip.pdf.
35
2. Mercury and Air Toxics Standards
The Mercury and Air Toxics Standards (MATS) rule was issued in February 2012.131
This rule is the first national emission standard for air toxics from new and existing coal- and oil-
fired power plants. Air toxics include mercury, other heavy metals like arsenic, and acid gases
such as hydrochloric acid.132 This rule was the latest step in decades of activity towards
regulating such air toxics from power plants. Specifically, that activity includes: (1) the 1990
amendments to the Clean Air Act; (2) a decade of study in the 1990s; (3) a year 2000
determination by EPA that it was “appropriate and necessary” to regulate coal- and oil-fired
electric generating units for hazardous air pollutants; and (4) the Clean Air Mercury Rule, which
the D.C. Circuit Court of Appeals vacated in 2008.133 To meet the new MATS rule, existing
units must install “maximum achievable control technology” by April 16, 2015, although they
may ask their state regulator for a one-year extension.134 This standard is generally set to be at
least as stringent as the 12 percent of existing units with the lowest emissions.135
Soon after being finalized, the MATS rule was challenged at the D.C. Circuit Court of
Appeals, where oral argument was held on December 10, 2013.136 This was an extremely
technical case. Oral argument covered a long list of topics, including whether EPA had
appropriately decided to regulate coal- and oil-fired electric generation units in December 2000
(which triggered a requirement for EPA to regulate air toxics emissions), whether EPA was
appropriate in not considering the costs of setting emissions reduction targets, and whether the
court had jurisdiction over this case at all.137 On April 15, 2014 the court upheld EPA’s MATS
rule; notably, a majority opinion deferred to EPA on not considering costs of its regulation
because the law “neither requires EPA to consider costs nor prohibits EPA from doing so.”138
131 National Emission Standards for Hazardous Air Pollutants From Coal- and Oil-Fired Electric Utility Steam
Generating Units and Standards of Performance for Fossil-Fuel-Fired Electric Utility, Industrial-Commercial-
Institutional, and Small Industrial-Commercial-Institutional Steam Generating Units, Final Rule, 77 Fed. Reg. 9304
(February 16, 2012). 132 Ibid., 9306. 133 U.S. Environmental Protection Agency, “Mercury and Air Toxics Standards (MATS): History,” EPA website,
last modified April 10, 2012, http://epa.gov/airquality/powerplanttoxics/history.html. 134 National Emission Standards for Hazardous Air Pollutants From Coal- and Oil-Fired Electric Utility Steam
Generating Units and Standards of Performance for Fossil-Fuel-Fired Electric Utility, Industrial-Commercial-
Institutional, and Small Industrial-Commercial-Institutional Steam Generating Units, Final Rule, 77 Fed. Reg. 9465
(February 16, 2012). See, also, National Emission Standards for Hazardous Air Pollutants from Coal- and Oil-fired
Electric Utility Steam Generating Units and Standards of Performance for Fossil-Fuel-Fired Electric Utility,
Industrial-Commercial-Institutional, and Small Industrial-Commercial-Institutional Steam Generating Units, 40
C.F.R. 562 (December 16, 2011). 135 National Emission Standards for Hazardous Air Pollutants from Coal- and Oil-fired Electric Utility Steam
Generating Units and Standards of Performance for Fossil-Fuel-Fired Electric Utility, Industrial-Commercial-
Institutional, and Small Industrial-Commercial-Institutional Steam Generating Units, 40 C.F.R. 15 (December 16,
2011). 136 “Oral Arguments Recordings,” White Stallion Energy Center v. EPA et al. (D.C. Cir. December 10, 2013),
uscourts.gov, accessed April 19, 2014,
http://www.cadc.uscourts.gov/recordings/recordings.nsf/DocsByRDate?OpenView&count=100&SKey=201312. 137 This case is also complicated because EPA is considering petitions for reconsideration on some of the issues
under consideration in this case. 138 White Stallion Energy Center, LLC v. EPA et al., No. 12-1100 (D.C. Cir. April 15, 2014), 21.
36
3. Particulate Matter National Ambient Air Quality Standards
In January 2013, EPA issued final updated National Ambient Air Quality Standards
(NAAQS) for fine particulate matter (PM 2.5), particles less than 2.5 microns in diameter.139
This rule limits atmospheric levels of PM 2.5 to protect public health. NAAQS for PM 2.5 were
originally designated in 1997 and revised in 2006.140 NAAQS are supposed to be reviewed
every five years; EPA was sued, by states and other organizations, in 2012 when this review had
not been done.141 The current revision reduced allowable annual PM 2.5 levels from 15 to 12
micrograms per cubic meter, which is consistent with the recommendations of EPA’s Clean Air
Scientific Advisory Committee.142 Full implementation of this revised NAAQS will take at least
until 2020. Areas first have to be monitored and designated as either attainment or
nonattainment. States then have five years or more to develop and enforce implementation plans
for nonattainment areas.143 When this rule was being developed, EPA did not estimate specific
costs for electric generating units because they were not expected to need controls to address this
change beyond what they would need to address MATS.144
In March 2013, the National Association of Manufacturers (NAM) and other parties filed
a challenge to the rule at the D.C. Circuit Court of Appeals.145 In its opening brief, NAM argued
that EPA ignored evidence showing the NAAQS did not need to be revised.146 EPA defended its
process and conclusion.147 Oral argument was held on February 20, 2014, and focused on the
scientific basis for EPA’s actions. At oral argument, one of the judges said that the parties
challenging EPA’s rule would have an “uphill climb” since the Clean Air Scientific Advisory
Committee unanimously supported EPA’s standard.148
139 U.S. Environment Protection Agency, “Particulate Matter (PM): Regulatory Actions,” EPA website, last
modified November 19, 2013, http://www.epa.gov/air/particlepollution/actions.html. EPA also reviewed its PM 10
standards, but retained the existing standards at 150 micrograms per cubic meter. 140 Ibid. 141 U.S. Environmental Protection Agency, Revised Air Quality Standards for Particle Pollution and Updates to the
Air Quality Index (AQI), 2012, 5. 142 U.S. Environmental Protection Agency, Overview of EPA’s Revisions to the Air Quality Standards for Particle
Pollution (Particulate Matter), 2012, 2. 143 Robert Esworthy, Air Quality: EPA’s 2013 Changes to the Particulate Matter (PM) Standard, Congressional
Research Service, January 23, 2013, 17. 144 U.S. Environmental Protection Agency, Regulatory Impact Analysis for the Final Revisions to the National
Ambient Air Quality Standards for Particulate Matter, December 2012 (updated February 28, 2013) 4-6, 4-7. 145 Joint Reply Brief of Petitioners, National Association of Manufacturers, et. al., v. United States Environmental
Protection Agency, et. al., No. 13-1069 (consolidated with No. 13-1071) (D.C. Cir. December 19, 2013). 146 Joint Opening Brief of Petitioners, National Association of Manufacturers, et. al., v. United States Environmental
Protection Agency, et. al., No. 13-1069 (consolidated with No. 13-1071) (D.C. Cir. August 19, 2013), 1-2, 13-15. 147 Final Brief for Respondents, National Association of Manufacturers, et. al., v. United States Environmental
Protection Agency, et. al., No. 13-1069 (consolidated with No. 13-1071) (D.C. Cir. January 17, 2014), 22-23. 148 Jeremy P. Jacobs, “Air Pollution: Federal judges skeptical of industry challenge to EPA soot standard,” E&E
Publishing, LLC website, last modified 20, 2014, http://www.eenews.net/stories/1059994856.
37
4. Cooling Water Intake Structures Standards (316b)
Cooling Water Intake Structures Standards, also known as the Clean Water Act 316(b)
regulation, were proposed in spring 2011. They require existing electric generators that
withdraw more than 2 million gallons of cooling water per day to limit how many fish are killed
by being pinned against intake screens.149 New units added to existing facilities must produce
results equal to at least 90 percent of closed-cycle cooling technology (i.e., cooling towers).150
EPA is under a court order to finalize this rule but continues to ask for extensions. Most
recently, the court order was amended to require the EPA to publish the final rule in the Federal
Register by April 17, 2014.151 When this rule was in development, EPA estimated that it would
affect over 45 percent of all electric generating capacity, with annualized costs of $386 million
($2009), though industry sources argued the costs could be much higher.152
5. Coal Combustion Residuals Regulation
This rule is intended to regulate the disposal of coal combustion residuals (CCR) under
the Resource Conservation and Recovery Act. Two options were provided in the proposed rule,
issued in June 2010. First, if CCRs are classified as hazardous waste, EPA will require disposal
in hazardous waste facilities. If deemed not hazardous, EPA will establish minimum national
technical criteria, such as composite liner requirements, for states to include in their own
regulations.153 This regulation has been delayed, but may be finalized in 2014. EPA was under a
court order to set a deadline to finalize the rule; that deadline has been set for December 19,
2014.154 When this rule was initially proposed, EPA estimated it could increase electricity prices
by 0.2 to 0.8 percent, though industry sources argued that prices could rise higher.155
149 For example, see: National Pollutant Discharge Elimination System—Cooling Water Intake Structures at
Existing Facilities and Phase I Facilities, Proposed Rule, 76 Fed. Reg. 22194 (April 20, 2011). 150 Roach, Ph.D. et al., Southwest Power Pool Annual Looking Forward Report, Boston Pacific Company, Inc.,
April 23, 2013, 27. See, also, National Pollutant Discharge Elimination System—Cooling Water Intake Structures
at Existing Facilities and Phase I Facilities, Proposed Rule, 76 Fed. Reg. (April 20, 2011). 151 Fifth Amendment to Settlement Agreement among the Environmental Protection Agency, the Plaintiffs in
Cronin, et al. v. Reilly, 93 CIV 314 (LTS) (SDNY), and the Plaintiffs in Riverkeeper, et al. v. EPA, 06 CIV. 12987
(PKC) (SDNY) (February 10, 2014). 152 National Pollutant Discharge Elimination System—Cooling Water Intake Structures at Existing Facilities and
Phase I Facilities, Proposed Rule, 76 Fed. Reg. 22190, 22219 (April 20, 2011). 153 U.S. Environmental Protection Agency, “Hazardous and Solid Waste Management System: Identification and
Listing of Special Wastes; Disposal of Coal Combustion Residuals from Electric Utilities,” regulations.gov, last
modified June 21, 2010, http://www.regulations.gov/#!documentDetail;D=EPA-HQ-RCRA-2009-0640-0352. 154 Jackson Kelly PPLC, “EPA Ordered by Court to Finalize Regulation of Coal Ash Rule by December 19, 2014,”
Energy & Environment Monitor (blog), February 3, 2014, http://eem.jacksonkelly.com/2014/02/epa-ordered-by-
court-to-finalize-regulation-of-coal-ash-rule-by-december-19-2014.html. 155 Roach, Ph.D. et al., Southwest Power Pool Annual Looking Forward Report, Boston Pacific Company, Inc.,
April 23, 2013, 27. See, also, U.S. Environmental Protection Agency, “Hazardous and Solid Waste Management
System: Identification and Listing of Special Wastes; Disposal of Coal Combustion Residuals from Electric
Utilities,” regulations.gov, last modified June 21, 2010, http://www.regulations.gov/#!documentDetail;D=EPA-HQ-
RCRA-2009-0640-0352.
38
C. Update on U.S. GHG Emissions, Including Methane Emission Estimates
This section briefly reviews U.S. greenhouse gas emissions to help determine if current
emission reduction goals are likely to be met. If not, these goals may be the impetus for
additional government action. This section also discusses methane emissions from natural gas
production and transport, which has been a recent question mark in U.S. GHG emissions.
1. Data on U.S. GHG Emissions
In December 2009, President Obama pledged that the U.S. would reduce emissions 17
percent from 2005 levels by 2020.156 Analysts from Resources for the Future reviewed U.S.
emissions data through 2011 and concluded that the U.S. may be on track to meet this goal due
to factors such as EPA regulations, abundant natural gas supply, and state and regional cap-and-
trade policies and renewable portfolio standards (RPS).157 Updated GHG emissions data through
2012 indicates that we are still on that path.158
Based on data from the EPA, U.S. GHG emissions peaked in 2007 then have generally
declined through 2012.159 Whereas from 1990 to 2007, U.S. GHG emissions grew at a
compound annual growth rate of 0.9 percent, between 2008 and 2012, they declined by 2.1
percent per year. For the electricity sector, GHG emissions grew by 1.6 percent per year from
1990 to 2007 but have since declined by 3.7 percent per year from 2008 through 2012.160 For
more information, see Figure III.1.
156 Dallas Burtraw and Matt Woerman, US Status on Climate Change Mitigation, Resources for the Future, October
2012, 1. 157 Ibid., 7-10. 158 For example, see U.S. Environmental Protection Agency, Inventory of U.S. Greenhouse Gas Emissions and
Sinks: 1990 – 2012, April 15, 2014, pp. ES-5 – ES-7, table ES-2, p. ES-22, table ES-7. 159 The most recent available data is from 2012. 160 U.S. Environmental Protection Agency, Inventory of U.S. Greenhouse Gas Emissions and Sinks: 1990 – 2012,
April 15, 2014, pp. ES-5 – ES-7, table ES-2, p. ES-22, table ES-7.
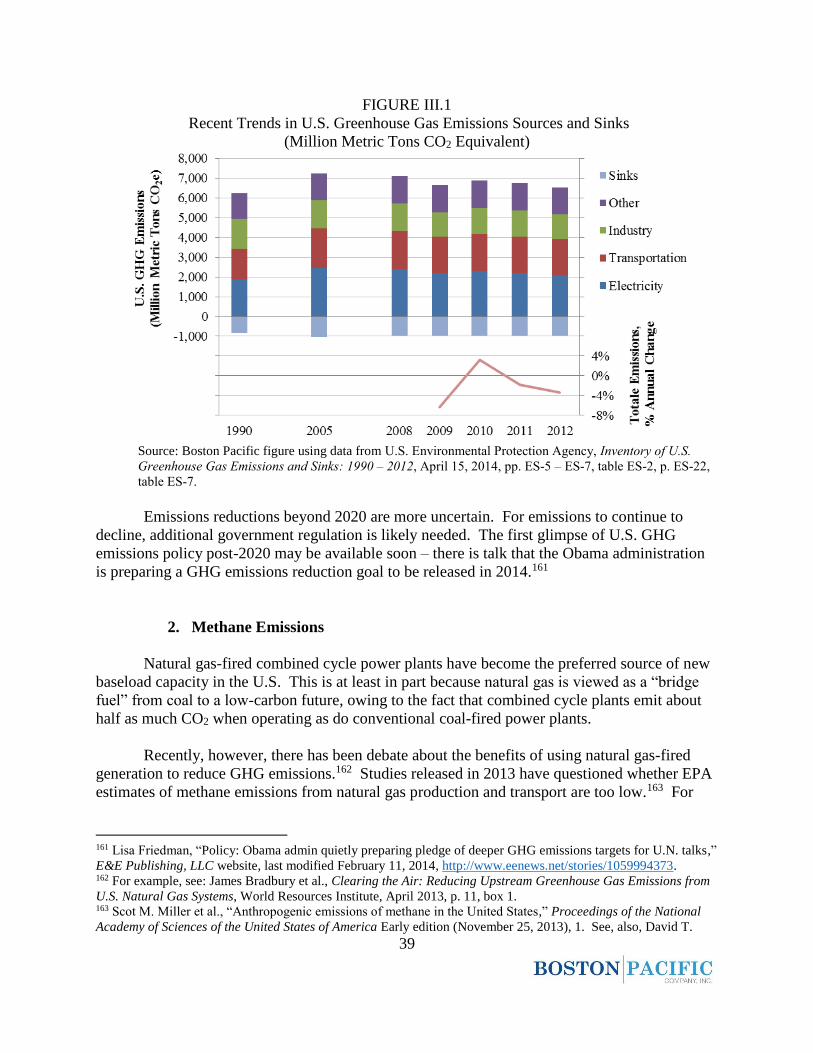
39
FIGURE III.1
Recent Trends in U.S. Greenhouse Gas Emissions Sources and Sinks
(Million Metric Tons CO2 Equivalent)
Source: Boston Pacific figure using data from U.S. Environmental Protection Agency, Inventory of U.S.
Greenhouse Gas Emissions and Sinks: 1990 – 2012, April 15, 2014, pp. ES-5 – ES-7, table ES-2, p. ES-22,
table ES-7.
Emissions reductions beyond 2020 are more uncertain. For emissions to continue to
decline, additional government regulation is likely needed. The first glimpse of U.S. GHG
emissions policy post-2020 may be available soon – there is talk that the Obama administration
is preparing a GHG emissions reduction goal to be released in 2014.161
2. Methane Emissions
Natural gas-fired combined cycle power plants have become the preferred source of new
baseload capacity in the U.S. This is at least in part because natural gas is viewed as a “bridge
fuel” from coal to a low-carbon future, owing to the fact that combined cycle plants emit about
half as much CO2 when operating as do conventional coal-fired power plants.
Recently, however, there has been debate about the benefits of using natural gas-fired
generation to reduce GHG emissions.162 Studies released in 2013 have questioned whether EPA
estimates of methane emissions from natural gas production and transport are too low.163 For
161 Lisa Friedman, “Policy: Obama admin quietly preparing pledge of deeper GHG emissions targets for U.N. talks,”
E&E Publishing, LLC website, last modified February 11, 2014, http://www.eenews.net/stories/1059994373. 162 For example, see: James Bradbury et al., Clearing the Air: Reducing Upstream Greenhouse Gas Emissions from
U.S. Natural Gas Systems, World Resources Institute, April 2013, p. 11, box 1. 163 Scot M. Miller et al., “Anthropogenic emissions of methane in the United States,” Proceedings of the National
Academy of Sciences of the United States of America Early edition (November 25, 2013), 1. See, also, David T.
40
example, one study used atmospheric concentrations of methane to estimate that methane
emissions from oil and gas production in Oklahoma, Texas, and Kansas were 4.9 times larger
than commonly cited.164 This is potentially concerning because methane is 21 times more potent
than CO2 as a GHG.165 A finding that increases the estimate of how much methane is emitted
when natural gas is produced and transported increases the estimated life-cycle GHG emissions
of natural gas-fired generation. These studies have led some in Congress to investigate methane
emissions more closely and to question the benefits of natural gas-fired electricity for reducing
GHG emissions.166
Despite the attention that methane emissions have received, the evidence to date does not
suggest that life-cycle emissions from natural gas-fired electricity have higher GHG emissions
than emissions from coal-fired electricity do. For example, a recent study published in the
journal Science synthesized findings from more than 200 technical publications.167 It found that
methane emissions were generally about 50 percent greater than EPA estimates,168 but that
natural gas-fired generation still reduces GHG emissions as compared to coal-fired generation.169
Allen et al., “Measurements of methane emissions at natural gas production sites in the United States,” Proceedings
of the National Academy of Sciences of the United States of America Early edition (September 16, 2013). 164 Miller et al., “Anthropogenic emissions of methane in the United States,” Proceedings of the National Academy
of Sciences of the United States of America Early edition (November 25, 2013), 1. 165 The relative strength of methane and carbon dioxide as greenhouse gases is cited here over a 100-year timeframe,
as used by the EPA. See, for example, Piers Forster et al., “Changes in Atmospheric Constituents and in Radiative
Forcing,” Climate Change 2007:The Physical Science Basis: Contribution of Working Group I to the Fourth
Assessment Report of the Intergovernmental Panel on Climate Change, The Intergovernmental Panel on Climate
Change, p. 212, table 2.14. 166 At least one hearing was held in the U.S. Senate by the Committee on Environment & Public Works
Subcommittee on Oversight, titled “Fugitive Methane Emissions from Oil and Gas Operations,” November 5, 2013.
Ranking members of the U.S. House of Representatives Energy and Commerce committee called for hearings, citing
two studies published in the Proceedings of the National Academy of Science. See: Committee on Energy and
Commerce, “Ranking Members Waxman and Rush Call for Hearings on Methane Emissions,” house.gov, last
modified December 17, 2013, http://democrats.energycommerce.house.gov/index.php?q=news/ranking-members-
waxman-and-rush-call-for-hearings-on-methane-emissions. 167 A.R. Brandt et al., “Methane Leaks from North American Natural Gas Systems,” Science 343, no. 6172
(February 14, 2014): supplementary materials, p. 2. 168 Stanford University, “Study: America’s Natural Gas System is Leaky and in Need of a Fix,” The Cynthia &
George Mitchell Foundation website, last modified February 13, 2014, http://www.cgmf.org/blog-entry/92/Study-
America%27s-natural-gas-system-is-leaky-and-in-need-of-a-fix.html. 169 Brandt et al., “Methane Leaks from North American Natural Gas Systems,” Science 343, no. 6172, (February 14,
2014): 733.
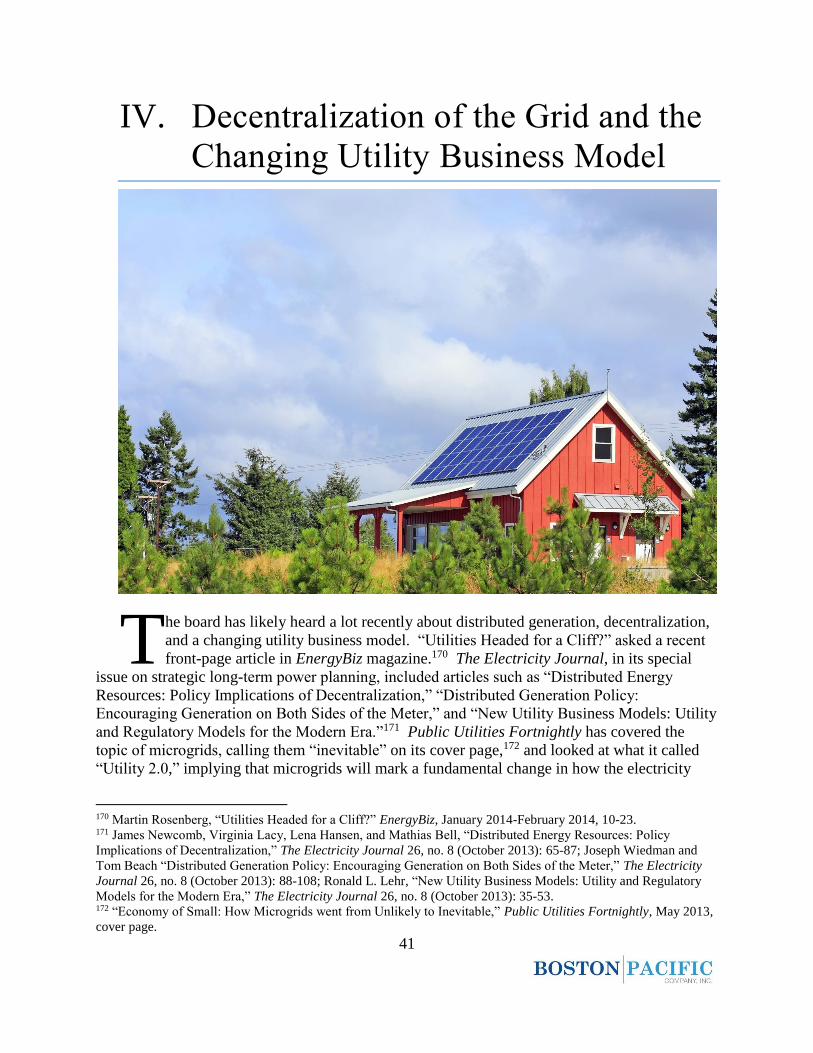
41
IV. Decentralization of the Grid and the
Changing Utility Business Model
he board has likely heard a lot recently about distributed generation, decentralization,
and a changing utility business model. “Utilities Headed for a Cliff?” asked a recent
front-page article in EnergyBiz magazine.170 The Electricity Journal, in its special
issue on strategic long-term power planning, included articles such as “Distributed Energy
Resources: Policy Implications of Decentralization,” “Distributed Generation Policy:
Encouraging Generation on Both Sides of the Meter,” and “New Utility Business Models: Utility
and Regulatory Models for the Modern Era.”171 Public Utilities Fortnightly has covered the
topic of microgrids, calling them “inevitable” on its cover page,172 and looked at what it called
“Utility 2.0,” implying that microgrids will mark a fundamental change in how the electricity
170 Martin Rosenberg, “Utilities Headed for a Cliff?” EnergyBiz, January 2014-February 2014, 10-23. 171 James Newcomb, Virginia Lacy, Lena Hansen, and Mathias Bell, “Distributed Energy Resources: Policy
Implications of Decentralization,” The Electricity Journal 26, no. 8 (October 2013): 65-87; Joseph Wiedman and
Tom Beach “Distributed Generation Policy: Encouraging Generation on Both Sides of the Meter,” The Electricity
Journal 26, no. 8 (October 2013): 88-108; Ronald L. Lehr, “New Utility Business Models: Utility and Regulatory
Models for the Modern Era,” The Electricity Journal 26, no. 8 (October 2013): 35-53. 172 “Economy of Small: How Microgrids went from Unlikely to Inevitable,” Public Utilities Fortnightly, May 2013,
cover page.
T
42
business works.173 The National Association of Regulatory Utility Commissioners’ (NARUC)
winter meetings dedicated numerous panels to the topics of distributed generation, microgrids,
and new utility models.174
For our purposes, decentralized technologies include the following: (1) small generators
of all technologies connected to a distribution system; (2) cogeneration; (3) energy storage; (4)
smart meter technology; and (5) microgrids. These technologies have already impacted the
operation of the electric power grid and are projected to play a greater role going forward.175 In
the extreme, decentralized technologies could represent a competitive threat to the existing,
centralized power grid, relegating the grid to becoming “an antiquated backup system”176 that
provides reliability services and access to a power spot market. Since it oversees the expansion
of the transmission grid, the board should be aware of any potential competitive threats to the
existing network model and that is why the issue is addressed herein.
A. Decentralized Technology: Existential Threat, Complement, or Both?
To some, it may appear that decentralized technologies represent a looming competitive
threat to the grid. Distributed generation already has a significant foothold in the U.S. For
example, as explained by the DOE, there are about “12 million [distributed generation] units
installed across the country, with a total capacity of about 200 GW.”177 Most “are backup power
units and are used primarily by customers to provide emergency power during times when grid-
connected power is unavailable.”178 Eighty-four of the 200 GW are consumer-owned combined
heat and power (CHP) systems, which “provide electricity and thermal energy for certain
manufacturing plants, commercial buildings, and independently-owned district energy systems
that provide electricity and/or thermal energy for university campuses and urban areas.”179 North
America also has a current total microgrid capacity of 992 MW.180 To put these numbers into
perspective, however, the U.S.’s current centralized generation capacity totals approximately
1,000 GW.181
173 Mani Vadari and Gerry Stokes, “Utility 2.0 and the Dynamic Microgrid,” Public Utilities Fortnightly, November
2013, 42-46, 64. 174 “Meetings Program” (NARUC Winter Committee Meetings, Renaissance Washington Hotel, Washington, DC,
February 9-12, 2014). 175 Electric Power Research Institute, The Integrated Grid: Realizing the Full Value of Central and Distributed
Energy Resources, 2014, 3. 176 Katherine Tweed, “NRG’s David Crane Warns of ‘Shockingly Stupid’ Planning in the Power Sector,” Greentech
Media website, last modified February 25, 2014, http://www.greentechmedia.com/articles/read/forget-about-
resiliency-david-crane-says-utilities-are-failing-at-primary-m. 177 U.S. Department of Energy, The Potential Benefits of Distributed Generation and Rate-Related Issues That May
Impede Their Expansion, February 2007, ii. 178 Ibid. 179 Ibid., ii-iii. 180 Asmus, Lauderbaugh and Lawrence, “Executive Summary,” Market Data: Microgrids, Navigant Research, Q1
2013, 3. 181 Electric Power Research Institute, The Integrated Grid: Realizing the Full Value of Central and Distributed
Energy Resources, 2014, 8.
43
To further consider the potential of distributed resources to be an existential threat to the
network, we considered a report from the Electric Power Research Institute titled The Integrated
Grid: Realizing the Full Value of Central and Distributed Energy Resources.182 In its report,
EPRI puts forth its vision of an “integrated grid,” which includes distributed resources. One of
EPRI’s major takeaways is that distributed generation and the grid “are not competitors but
complements, provided that grid technologies and practices develop with the expansion of
[distributed energy resources].”183 For customers that rely heavily on distributed generation,
EPRI claims that the grid enhances the value of distributed generation, noting, “… in nearly all
settings the full value of [distributed generation] requires grid connection to provide reliability,
virtual storage and access to upstream markets.”184 Meanwhile, “[e]ven with increasing
penetration, U.S. distributed resources account for a small percent of power production and
consumption and have not yet fundamentally affected [the] one-way flow of power.”185
Going forward, EPRI sees significant value to the grid from increases in distributed
energy resources and vice versa. EPRI identifies five primary benefits of the grid for all
customers, including distributed generation customers: (1) reliability, which is driven by
redundant capacity, and can make up for the intermittency of distributed generation; (2) startup
power, which helps prevent faults; (3) voltage quality, which results in tighter frequency
regulation; (4) efficiency, which allows generation resources to operate at their economic
optimum; and (5) energy transaction, which allows distributed generation to sell to the grid.186
Specifically, EPRI estimates that for the U.S. ratepayer who pays an average of $110/month, the
cost of providing grid support services is “about $51/month on average in the typical current
configuration of the grid in the United States” and $59/month for energy.187 This $51/month in
grid support services, explains EPRI, includes “the combination of transmission, distribution,
and the portion of generation that provides grid support,” or “capacity,” to customers.188 EPRI
claims that for a customer who decides to “self-generate and disconnect from the grid,”
providing an identical service 100 percent independent of the grid “would be four to eight times
more expensive” than buying those services from the grid.189 More specifically, EPRI estimates
that “the cost to re-create grid-level service without a grid connection ranges from $275-$430 per
month above that of the original array. Expected decreases in the cost of battery and PV module
technology could reduce this to $165-$262 within a decade.”190
While the grid benefits distributed resource customers, the reverse is also true. EPRI
notes that distributed resources can provide benefits to the grid, including: (1) providing
“distribution grid voltage and system disturbance performance by riding through system voltage
and frequency disturbances to ensure reliability of the overall system”; (2) helping to “optimize
distribution operations” by “coordinated control of distributed resources”; (3) “facilitat[ing]
182 Ibid., full report. 183 Ibid., 7. 184 Ibid. 185 Ibid., 8. 186 Ibid., p. 16, figure 4, pp.16-20. 187 Ibid., 21, 7, 22. 188 Ibid., 22. 189 Ibid., 23, 7. 190 Ibid., 23.
44
consumer participation in demand response programs such as dynamic pricing, interruptible
tariffs, and direct load control”; (4) “improv[ing] voltage quality and reduc[ing] system losses”;
(5) “reduc[ing] environmental impact” through use of renewable distributed generation; (6)
“defer[ing] capacity upgrades” as long as “proper planning and targeted deployment” are used;
and (7) “improv[ing] power system resiliency” in part by “supporting portions of the distribution
system during outages.”191
EPRI cautions that the current “rapidly expanding deployments of [distributed
generation] are connected to the grid but not integrated into grid operations, which is a pattern
that is unlikely to be sustainable.”192 EPRI explains that increased penetration of distributed
generation “requires interconnection rules, communications technologies and standards,
advanced distribution and reliability technologies, integration with grid planning, and enabling
policy and regulation.”193 EPRI identifies Germany as an example of the unintended
consequences that occur when deployment of distributed generation on a large scale is not
integrated with the grid: higher prices, lower reliability, and lower power quality.194
Another warning on the importance of integrating grid planning with distributed
technologies comes from Synapse Energy Economics, which issued a report asserting that ISO
New England does not incorporate increases in distributed generation in its transmission
planning process, and as a result, will overbuild the transmission system with unneeded
projects.195 Specifically, this overbuilding of the grid occurs when ISO New England fails to
lower its load forecasts for expected new distributed generation, and as a result, assumes it needs
more transmission expansion than it actually does.196
B. Drivers of Demand for Decentralization: Cybersecurity, Weather, Rates
We continue to see three main drivers of demand for and investment in decentralized
technology, including distributed generation and microgrids: “(a) cybersecurity, (b) severe
weather, and (c) rising retail rates for homes and businesses.”197
Perhaps the most significant of these three is related to the security of the grid, especially
cybersecurity, an issue we covered last year.198 Cybersecurity is a growing and significant issue:
spending on cybersecurity for the electric grid is expected to grow from $7.8 billion in 2011 to
191 Ibid., 30. 192 Ibid., 7. 193 Ibid. 194 Ibid., 4, 13-14. 195 Sarah Jackson et al., Forecasting Distributed Generation Resources in New England: Distributed Generation
Must be Properly Accounted for in Regional System Planning, Synapse Energy Economics, Inc., June 7, 2013, 1. 196 Ibid. 197 Roach, Ph.D. et al., Southwest Power Pool Annual Looking Forward Report, Boston Pacific Company, Inc.,
April 23, 2013, 62. 198 Ibid.

45
$79 billion in 2020.199 As cybersecurity for the centralized grid looms as a real and growing
threat, customers seeking protection from cyberattacks on the grid could choose to invest in
distributed generation and/or in microgrids.
On February 12, 2014, “the White House released the National Institute of Standards and
Technology Framework for Improving Critical Infrastructure Cybersecurity [citation omitted],
which is a key step in the implementation of Executive Order 13636 on cybersecurity issued by
President Obama in February 2013 ...”200 The standards were developed over the past year
through collaboration with critical infrastructure owners and operators, other federal agencies
like DHS, and local governments.201 The standards are voluntary, and would need to be adopted
through regulation by an entity such as the North American Electric Reliability Corporation
(NERC).202
We note, too, that in addition to cyberattacks, the grid can also be under threat from
physical attacks, as was reported to have occurred at a PG&E substation near San Jose, CA in
April. In a front-page story titled “U.S. Risks National Blackout from Small-Scale Attack,” the
Wall Street Journal explained, “… gunmen shot 17 large transformers over 19 minutes before
fleeing in advance of police.”203 The act has been described as “domestic terrorism” by former
FERC Chairman Jon Wellinghoff.204 The Wall Street Journal noted, “[t]he U.S. could suffer a
coast-to-coast blackout if saboteurs knocked out just nine of the country’s 55,000 electric-
transmission substations on a scorching summer day,” citing a “previously unreported” report by
FERC.205 In March 2014, FERC took action by issuing an order indicating that it would require
utilities to provide physical protection for certain locations on the grid, “which, if badly
damaged, could produce cascading blackouts or other widespread problems.”206 FERC has
directed NERC to work with utilities to determine which locations on the grid meet this
standard.207 NERC has begun developing reliability standards addressing FERC’s directive.208
199 PR Newswire, “Smart Grid Cyber Security Market & Electrical Energy Storage Technology in the Intelligent
Grid Analyzed in New Market Research Reports,” PR Newswire website, last modified September 17, 2012,
http://www.prnewswire.com/news-releases/smart-grid-cyber-security-market--electrical-energy-storage-technology-
in-the-intelligent-grid-analyzed-in-new-market-research-reports-170005586.html. 200 Jim Halpert, Ryan T. Sulkin, and Sydney M. White, “Executive Branch Acts on Cybersecurity – what you need
to know about this groundbreaking effort,” DLA Piper website, last modified February 12, 2014,
http://www.dlapiper.com/en/us/insights/publications/2014/02/executive-branch-acts-on-cybersecurity/. 201 Ibid. 202 Ibid. 203 Rebecca Smith, “U.S. Risks National Blackout from Small-Scale Attack,” Wall Street Journal, March 12, 2014. 204 Rebecca Smith, “Assault on California Power Station Raises Alarm on Potential for Terrorism,” Wall Street
Journal, February 18, 2014. 205 Smith, “U.S. Risks National Blackout From Small-Scale Attack,” Wall Street Journal, March 12, 2014. 206 Rebecca Smith, “Regulators to Impose New Security Rules on Electric Utilities,” Wall Street Journal, March 8,
2014. 207 Ibid. 208 NERC, “Project 2014-04 Physical Security,” North American Electric Reliability Corporation website, accessed
April 19, 2014, http://www.nerc.com/pa/Stand/Pages/Project-2014-04-Physical-Security.aspx.
46
Two other drivers of decentralized generation are severe weather and insulation from
retail rates.209 Severe weather events like Superstorm Sandy in 2012 illustrate the devastating
impact weather can have on electricity service. Distributed generation and microgrids can help
protect customers from interruption. Higher retail rates can also drive investment in
decentralized technology. Customers may seek to protect themselves from high or volatile retail
rates associated with centralized generation. According to Dr. Michael Webster at ICETEC
Energy Services, the Princeton University microgrid’s primary purpose was to mitigate
deregulated energy prices.210
C. Developments in Supply of Distributed Technologies: Solar PV, Cogeneration,
Microgrids
To dig deeper on what may drive the supply of distributed resources, we looked for
developments in three of the most promising distributed technologies. First, we look at
developments in solar photovoltaic (PV), projected to be one of the faster-growing distributed
technologies. Second, we look at cogeneration, a long-standing distributed technology that has
achieved impressive capacity and efficiency numbers. Third, we look at miniature grids, or
microgrids, including an example at Princeton University. (We note, too, that energy storage is a
distributed resource that we cover in depth in Chapter VII).
1. Solar PV
It appears that solar PV is considered to be the distributed generation technology where
the highest growth and penetration is expected to occur. EPRI states that growth in solar PV is
“projected to increase in scale and pace over the next decade.”211 Globally, distributed PV
power generation “has increased from approximately 4 GW of global installed capacity in 2003
to nearly 128 GW in 2013.”212 In the U.S., solar PV installations in 2013 grew 41 percent from
installations in 2012,213 and solar PV in 2013 made up 29 percent of all new U.S. electricity
generation capacity additions, second only to natural gas.214 At the end of 2013, U.S. PV
installations totaled nearly 10 GW.215 EPRI contrasts this data with that of Germany, where PV
209 Roach, Ph.D. et al., Southwest Power Pool Annual Looking Forward Report, Boston Pacific Company, Inc.,
April 23, 2013, 62. 210 As recalled from Michael Webster, “The Microgrid Asset Classification Real world example: Princeton
University,” ICETEC Energy Services (presentation, NARUC Winter Committee Meetings, Renaissance
Washington Hotel, Washington, DC, February 9-12, 2014). 211 Electric Power Research Institute, The Integrated Grid, 2014, 10. 212 International Energy Agency, Renewable Energy Medium-Term Market Report, 2013, quoted in Electric Power
Research Institute, The Integrated Grid, 2014, 10. 213 Shayle Kann et al., “Executive Summary,” U.S. Solar Market Insight Report: 2013 Year in Review, GTM
Research and Solar Energy Industries Association, 2014, 3. 214 Ibid., figure 1.1. 215 Electric Power Research Institute, The Integrated Grid, 2014, 10.
47
installations total approximately 36 GW, much of it distributed,216 suggesting that solar PV in the
U.S. has a lot of room to grow.
Further, there is some evidence – albeit anecdotal – that solar PV is improving as a
distributed technology in terms of diversity in its implementations. One recent development in
solar PV technology comes from Dow Solar’s “Powerhouse” rooftop shingles, which are now
manufactured in a way that makes them “weather tight,” meaning, they serve as “the sole
weatherization material on the portion of the roof where they are installed.”217 The Powerhouse
shingles are the first solar PV panels to be “building code certified as a roofing material.”218
They are also more “inconspicuous” because they lie flush on the roof, not jutting out like past
designs, and are now able to be installed by conventional roofers, and conventional electricians
can handle the wiring.219
Solar PV manufacturing costs also appear to be falling. For example, SunPower, the
second biggest PV manufacturer in the U.S., claims to have reduced its manufacturing costs by
20 percent over 2013, and said it expects to reduce the cost per watt by another 35 percent in its
next line of manufacturing plant.220 Further, SunPower stated that it plans to produce its first 23
percent capacity factor panel by 2015.221
2. Cogeneration (Combined Heat and Power)
In addition to the emergence and growth of solar PV, it may help to remember an older,
more established technology – cogeneration, or combined heat and power. It can be argued that
CHP marked the beginning of competitive generation following the enactment of PURPA. The
U.S. current has about 84 GW of CHP capacity,222 and it continues to be a viable option for large
industrial and commercial customers. By reusing exhaust heat, CHP allows for added
efficiencies because it produces two byproducts instead of one from a single fuel source. Figure
IV.1 illustrates how CHP works. The single fuel source fires the generator and produces
electricity, which can be used to power the facility and can also be sold to the grid. Exhaust heat
from the turbine is captured in a heat recovery unit where it heats a water source to produce
steam. The steam can be used for heating or cooling the facility.
216 Ibid. 217 Joe Provey, “Coming Soon to a Rooftop Near You—Solar Shingles,” Yahoo Homes website, last modified
November 4, 2013, http://homes.yahoo.com/news/coming-soon-rooftop-near-solar-shingles-213201355.html. 218 Ibid. 219 Ibid. 220 Giles Parkinson, “Cost of Solar PV Continues to Plummet,” Clean Technica website, last modified February 18,
2014, http://cleantechnica.com/2014/02/18/cost-of-solar-pv/. 221 Ibid. 222 U.S. Department of Energy, The Potential Benefits of Distributed Generation and Rate-Related Issues that May
Impede Their Expansion, February 2007, ii.
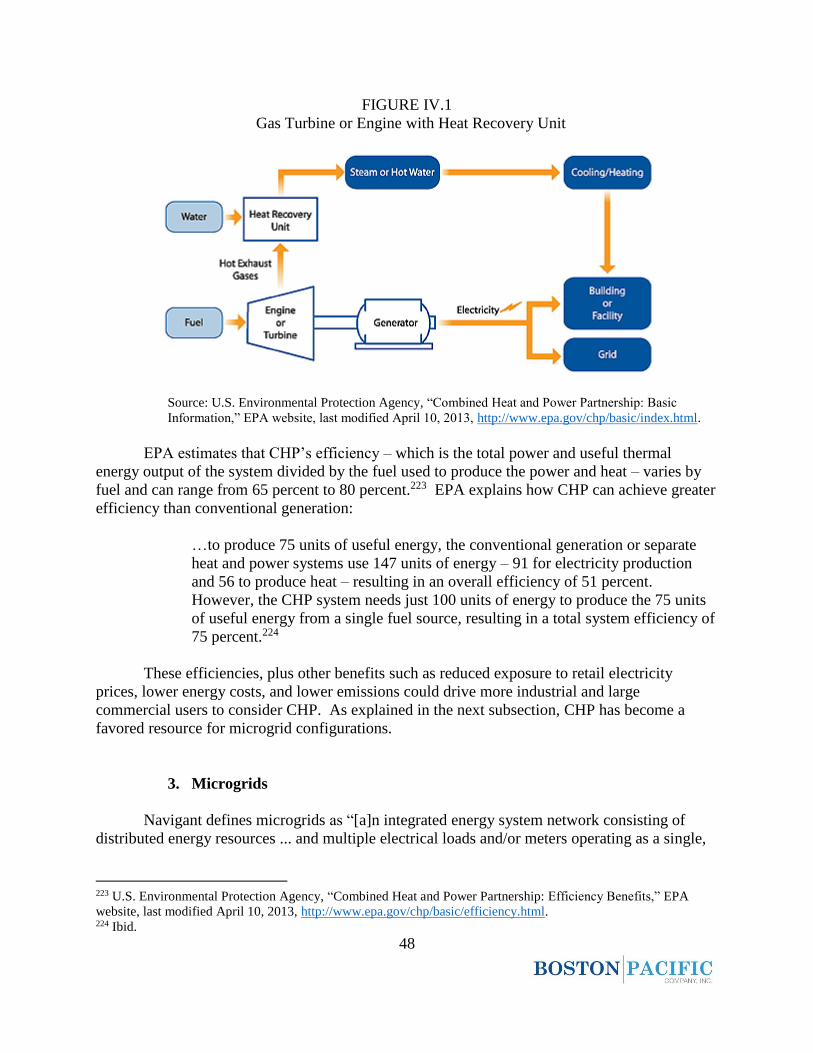
48
FIGURE IV.1
Gas Turbine or Engine with Heat Recovery Unit
Source: U.S. Environmental Protection Agency, “Combined Heat and Power Partnership: Basic
Information,” EPA website, last modified April 10, 2013, http://www.epa.gov/chp/basic/index.html.
EPA estimates that CHP’s efficiency – which is the total power and useful thermal
energy output of the system divided by the fuel used to produce the power and heat – varies by
fuel and can range from 65 percent to 80 percent.223 EPA explains how CHP can achieve greater
efficiency than conventional generation:
…to produce 75 units of useful energy, the conventional generation or separate
heat and power systems use 147 units of energy – 91 for electricity production
and 56 to produce heat – resulting in an overall efficiency of 51 percent.
However, the CHP system needs just 100 units of energy to produce the 75 units
of useful energy from a single fuel source, resulting in a total system efficiency of
75 percent.224
These efficiencies, plus other benefits such as reduced exposure to retail electricity
prices, lower energy costs, and lower emissions could drive more industrial and large
commercial users to consider CHP. As explained in the next subsection, CHP has become a
favored resource for microgrid configurations.
3. Microgrids
Navigant defines microgrids as “[a]n integrated energy system network consisting of
distributed energy resources ... and multiple electrical loads and/or meters operating as a single,
223 U.S. Environmental Protection Agency, “Combined Heat and Power Partnership: Efficiency Benefits,” EPA
website, last modified April 10, 2013, http://www.epa.gov/chp/basic/efficiency.html. 224 Ibid.
49
autonomous grid either in parallel to or ‘islanded’ from the existing utility power grid.”225
Navigant projects that the revenue from deployments of microgrids globally will be $8.3 billion
in 2013, increasing to more than $40 billion in annual investments by 2020.226 Currently, “North
America features 63% of total global microgird capacity (992 MW) …”227 Navigant projects
that “North America will remain the global leader in microgrid capacity by 2020, increasing its
market share to 65% of the global market (5,973 MW) …”228
To provide a clearer picture of what a microgrid is and how it can provide benefits to its
customer(s), we looked at Princeton University as an example, which several presenters
discussed at the 2014 NARUC winter meetings, including Dr. Michael Webster. Princeton’s
microgrid has a total capability of 43 MW and includes a number of distributed assets, including:
(1) a 15 MW gas-fired turbine; (2) a 9 MW steam-driven cooling unit; (3) 9 MW of chilled water
storage; (4) a 0.5 MW back pressure steam turbine; (5) 2.5 MW of CHP cogeneration; (6) 5 MW
of solar PV; (7) 1 MW of diesel generation; and (8) 1 MW of demand response.229 The
Princeton microgrid is optimized to choose the most economical resources to meet its load. It
can pull power from its diesel generation, biodiesel generation, gas-fired generation, solar PV,
storage, or off the grid from Public Service Electric and Gas Company (PSE&G), its utility.230
The total cost of the Princeton microgrid was significant at approximately $100 million.231 The
microgrid saves Princeton University an estimated $13 million a year,232 primarily through
economic dispatch (i.e., self-generating power when it is cheaper than grid-based power from
Princeton’s PJM Interconnection, LLC (PJM) utility, PSE&G) and sales of products like
regulation to the grid.233
Princeton’s microgrid made news during Superstorm Sandy, when it performed well
during the storm and the grid outages. During the storm, as PSE&G endured outages, “the
university islanded itself, shut down non-critical facilities and stayed open.”234 The power it
pulled from PSE&G dropped to zero and was replaced by the portfolio of assets it has as part of
its microgrid. Later, when PSE&G came back online, Princeton immediately started pulling
225 Asmus, Lauderbaugh and Lawrence, “Executive Summary,” Market Data: Microgrids, Navigant Research, Q1
2013, 1. 226 Ibid., 2. 227 Ibid., 3. 228 Ibid. 229 John Kelly, “NARUC Microgrid Panel: Leveraging Microgrids and Customer Investment,” Perfect Power
Institute (presentation, NARUC Summer Committee Meetings, Sheraton Denver Downtown Hotel, Denver, CO,
July 21-24, 2013), 5. 230 Ibid. 231 Ibid. 232 Ibid. 233 As recalled from Michael Webster, “The Microgrid Asset Classification Real world example: Princeton
University,” ICETEC Energy Services (presentation, NARUC Winter Committee Meetings, Renaissance
Washington Hotel, Washington, DC, February 9-12, 2014). See, also, Perfect Power Institute, “Peer Power OasesTM
and Utility Microgrids,” 2014, 4,
http://perfectpowerinstitute.org/sites/default/files/PPI%20PEER%20OasesArticle%20040314.pdf. 234 Advanced Energy Now, “Advanced Energy in Action: Microgrids Keep the Lights on During Superstorm
Sandy,” accessed April 17, 2014, http://advancedenergynow.aee.net/?objectid=E3647AE0-5A9B-11E2-
9609000C29CA3AF3.
50
power from PSE&G when the power was cheaper than on-site generation.235 Notably, the
primary impetus for the Princeton project was a desire by the customer to not be exposed to real-
time pricing; Princeton was concerned following deregulation, not necessarily about severe
weather.236
Princeton’s success story highlights the usefulness of microgrids and underscores the
importance of integrating distributed technology planning with the centralized grid. However,
challenges for microgrid investment remain, especially upfront cost, as the Princeton example
illustrates. While it is projected to generate savings that may allow it to pay for itself in several
years of operation, potential customers may balk at the high initial investment needed. There are
also emerging regulatory challenges and hurdles that must be addressed by state and federal
regulators that are adapting to this new asset class.237 Specifically, most states lack a “legal
framework” for microgrid owners and operators “who are not public utilities to create microgrids
without having to go through years of legal and regulatory hurdles.”238 For example, in New
York City, “[d]ifferent rules apply depending on how a microgrid operates, and state law isn’t
clear about the legal status of microgrids ...”239
D. Net Metering and Monthly Grid User Fees
The increasing penetration of distributed resources has resulted in a regulatory showdown
in some states on whether or not to charge utility customers with distributed generation for grid
services. Some utilities allege that their customers that do not have distributed generation are
subsidizing distributed generation customers.240 SPP should be aware of this emerging front in
states with “net metering” policies because charging distributed generation customers for grid
services increases the cost of distributed generation and limits its potential.
Net metering allows utility customers to “offset their electricity purchases from the grid
with energy generated behind the retail meter, such as from rooftop solar panels.”241 Net
metering credits apply “not only to foregone consumption but also – with limited exceptions – to
the energy generated from behind the meter in excess of the customer’s own use and delivered to
235 Michael Webster, “The Microgrid Asset Classification Real world example: Princeton University” ICETEC
Energy Services (presentation, NARUC Winter Committee Meetings, Renaissance Washington Hotel, Washington,
DC, February 9-12, 2014), “Campus Power During Hurricane Sandy” graph. 236 Ibid. 237 Jon Creyts, “Business Models to Unlock the Value of Microgrids,” Rocky Mountain Institute, July 23, 2013
(presentation, NARUC Summer Committee Meetings, Sheraton Denver Downtown Hotel, Denver, CO, July 21-24,
2013), 5. 238 Sara C. Bronin, quoted in Bobby Magill, “Microgrids: A New Kind of Power Struggle in New York and
Connecticut,” Greentech Media website, last modified September 16, 2013,
http://www.greentechmedia.com/articles/read/microgrids-a-new-kind-of-power-struggle. 239 Magill, “Mircrogrids: A New Kind of Power Struggle,” Greentech Media website, last modified September 16,
2013, http://www.greentechmedia.com/articles/read/microgrids-a-new-kind-of-power-struggle. 240 David B. Raskin, “The Regulatory Challenge of Distributed Generation,” Harvard Business Law Review Online,
last modified December 2, 2013, 42, http://www.hblr.org/wp-content/uploads/2013/12/Raskin_The-Regulatory-
Challenge-Of-Distributed-Generation.pdf. 241 Ibid., 40-41.
51
the utility.”242 Thus, net metering provides incentives for utility customers to invest in
distributed generation technologies and reduce their reliance on the grid. For example, if a
residential customer has a solar PV system on the home’s rooftop, it may generate more
electricity than the home uses during daylight hours. “If the home is net-metered, the electricity
meter will run backwards to provide a credit against what electricity is consumed at night or
other periods where the home’s electricity use exceeds the system’s output.”243
Net metering customers typically receive the full-bundled retail rate for the electricity
they put into the grid,244 which currently averages around 12.5 cents per kWh.245 Data on recent
sales of grid-connected renewable energy, which has been priced as low as “near or below 3
cents per kWh [citation omitted],” suggests that “net metering allows the owners of distributed
generation to effectively sell their energy at prices between two and six times the market price
for energy.”246
1. Case Study: Arizona Public Service Company
This basic net metering structure has raised concerns among some utilities.247 In a study
titled Net Metering Bill Impacts and Distributed Energy Subsidies, prepared for Arizona Public
Service Company, an Arizona utility, Navigant claims that net metering can result in “cross-
subsidies” if charges to distributed generation resources for electricity are below the cost of
serving those customers, and charges to non-distributed generation customers for electricity are
above the cost of serving those customers.248
Arizona’s net metering program works as follows: during the billing period, net metering
customers receive credits for generated electricity that exceeds their demand.249 So, if in a given
hour, a net metering customer generates 10 kWh and consumes just 5 kWh, it would receive a
242 Ibid., 41. 243 Solar Energy Industries Association, “Issues & Policies: Net Metering,” SEIA website, accessed April 19, 2014,
http://www.seia.org/policy/distributed-solar/net-metering. 244 Raskin, “The Regulatory Challenge of Distributed Generation,” Harvard Business Law Review Online, last
modified December 2, 2013, 41, http://www.hblr.org/wp-content/uploads/2013/12/Raskin_The-Regulatory-
Challenge-Of-Distributed-Generation.pdf. 245 U.S. Energy Information Administration, “Average Retail Price of Electricity to Ultimate Customers by End-Use
Sector, by State, November 2013 and 2012 (Centers per Kilowathour),” Electric Power Monthly, January 21, 2014,
table 5.6.A, cited in Raskin, “The Regulatory Challenge of Distributed Generation,” Harvard Business Law Review
Online, last modified December 2, 2013, 41, http://www.hblr.org/wp-content/uploads/2013/12/Raskin_The-
Regulatory-Challenge-Of-Distributed-Generation.pdf. 246 American Wind Energy Association, “The Cost of Wind Energy in the U.S.,” AWEA website, accessed
November 24, 2013, http://www.awea.org/Resources/Content.aspx?ItemNumber=5547, cited in Raskin, “The
Regulatory Challenge of Distributed Generation,” Harvard Business Law Review Online, last modified December 2,
2013, 41, http://www.hblr.org/wp-content/uploads/2013/12/Raskin_The-Regulatory-Challenge-Of-Distributed-
Generation.pdf. 247 For example, as explained by EPRI, “… Hawaii has experienced a rapid deployment of distributed PV
technology that is challenging the power system’s reliability.” Electric Power Research Institute, The Integrated
Grid, 2014, 4. 248 Navigant Consulting, Inc., Net Metering Bill Impacts and Distributed Energy Studies, December 11, 2012, 7. 249 Ibid., 4.
52
credit of 5 kWh. That 5 kWh credit is used to offset future consumption. For example, in the
next hour, if the distributed generation customer generated 5 kWh and consumed 10 kWh, then
the 5 kWh credit from the previous hour would carry over and reduce its net consumption to 0
kWh for those two hours.
At the end of each monthly billing period, any credits that remain are “banked” and can
be used to offset consumption in future months during the year.250 For example, if in January a
net metering customer generated 50 kWh in excess of what it consumed during the month, the
customer’s February monthly bill would begin with a credit of 50 kWh. The $/kWh rate that
these customers would receive for these credits are equal to the fully bundled retail rate.251 At
the end of the calendar year, net metering customers are paid a true-up payment by the utility for
any remaining credits at prices equal to the non-firm power purchase price approved by the
Arizona Corporation Commission that is a “proxy for the short-run variable … costs [citation
omitted] avoided by excess generation, rather than on the customer’s retail rate.”252
Navigant explains that Arizona Public Service Company’s net metering program is
resulting in a cross-subsidy, and as a result, distributed generation customers currently avoid
paying for the full cost of the additional generation capacity needed to maintain reliability in
Arizona.253 As a result, Arizona Public Service Company sought to impose a “monthly grid user
fee” on distributed generation customers. The charge sought to remove the alleged subsidy
being paid by non-distributed generation customers for the benefit of those who had distributed
generation and to get distributed generation customers to pay their fair share of the grid.254
The Arizona Corporation Commission recently passed a monthly charge of $0.70/kW-
month for customers with PV installations.255 According to the Arizona Corporation
Commission, the typical net metering customer with rooftop solar will pay $4.90 per month.256
Other states are also considering monthly grid user fee for their distributed generation
customers taking advantage of net metering programs. In Colorado, Xcel Energy, the state’s
largest utility, provides a 10.5 cent/kWh credit to solar PV distributed generation customers.257
However, the value of the solar PV was less than 5 cents/kWh, meaning that non-solar customers
are cross-subsidizing solar PV customers.258 The Colorado Public Utilities Commission is
currently considering a case reviewing net metering.259
250 Ibid. 251 Ibid., 5. 252 Ibid. 253 Ibid. 254 Arizona Public Service Company, “Arizona Corporation Commission Sets New Direction for Net Metering
Policy,” APS website, last modified November 14, 2013,
http://www.aps.com/en/ourcompany/news/latestnews/Pages/arizona-corporation-commission-sets-new-direction-
for-net-metering-policy.aspx. 255 Ibid. 256 Ibid. 257 Mark Jaffe, “In Solar Energy Debate, Colorado Homeowners, Business get their say at PUC,” Denver Post,
February 3, 2014. 258 Ibid. 259 Ibid.

53
2. Solar PV and Net Metering in SPP
According to the Solar Energy Industries Association, 43 states plus the District of
Columbia have net metering policies, including SPP states: Texas, New Mexico, Oklahoma,
Nebraska, Kansas, Arkansas, Louisiana, and Missouri.260 Table IV.1 summarizes net metering in
SPP by showing the number of customers and the amount of installed PV.261
TABLE IV.1
Number of Net Metering Customers and Installed Solar PV Net Metered Capacity
State Number of Solar PV Net
Metering Customers
Installed Solar PV Net Metered
Capacity (MW)
AR 184 0.99
KS 76 0.70
LA 1,287 9.70
MO 512 4.95
NE 32 0.22
NM 3,037 30.63
OK 115 0.59
TX 3,775 34.38
Source: Solar Energy Industries Association, “Solar Net Metering by State,” November 16, 2012,
http://www.seia.org/sites/default/files/resources/Net-Metering-by-State_0.pdf.
260 Solar Energy Industries Association, “Solar Net Metering by State,” November 16, 2012,
http://www.seia.org/sites/default/files/resources/Net-Metering-by-State_0.pdf. 261 Ibid.
54
V. Fundamental Changes in
Transmission Planning (Update
Based on New Information)
ransmission planning is one of SPP’s most important functions. SPP’s
transmission planning process has delivered billions of dollars of transmission
project investment and commensurate benefits to the SPP region. In 2013, for
example, SPP approved $751 million in new transmission investment.262 SPP is not alone. The
Brattle Group states that U.S. transmission investments by FERC-jurisdictional transmission
providers increased from $2 billion per year in the 1990s to $10 to $13 billion per year in the last
several years.263 The Brattle Group also projects $120 to $160 billion of further transmission
investment over the next 10 years.264
262 Pete Hoelscher, “SPP Board Approves $751 Million of Transmission Expansion Projects,” Southwest Power
Pool, January 31, 2013,
http://www.spp.org/publications/SPP%20NR%202013%20Transmission%20Plan%20013113.pdf. 263 Johannes Pfeifenberger et al., “Competition in Transmission Planning and Development: Current Status and
International Experience,” The Brattle Group, January 31, 2014 (presentation, EUCI – Transmission Policy: A
National Summit, Washington, DC, January 30-31, 2014), 2. 264 Ibid.
T
55
In this year’s report, we update our previous work to focus on three emerging events that
could impact the role of U.S. transmission planners. Two of the events involve opening
transmission expansion to competition with the purpose of producing a cheaper, better
transmission grid, while the third is being billed as a disruptive competitor to the grid. First, as
we explain in the next section, FERC’s requirement for transmission planners to remove “the
right of first refusal” for some regional transmission projects is a positive step toward opening
the transmission sector to competition. The second competitive event we discuss also involves
improving the grid by encouraging competition. Merchant transmission, a long-standing
business model for private investment in the grid, has seen a good number of proposals but few
success stories. The third event is the increasing decentralization of the grid and whether that
constitutes a competitive threat to the network model by allowing electricity customers to
sidestep the grid altogether.
A. Right of First Refusal Out, Competitive Solicitations In
One of the most important reforms implemented in FERC’s Order No. 1000265 is the
requirement for transmission planners to remove incumbent transmission owners’ “right of first
refusal” from open access tariffs266 for transmission projects that seek regional cost allocation.
Prior to that, incumbent transmission owners had the right under the rules of the tariff to build
new, regional transmission projects that interconnected with their existing lines. Under FERC’s
directive, that right is removed, and it will be the responsibility of the transmission provider to
select which regional projects will be built and which entity or entities – incumbent or otherwise
– will finance, own, and construct those projects.267 While transmission planners have been busy
altering their transmission planning processes to comply with the FERC directives since 2011,
the impact of this particular directive is just beginning to be felt.
To comply, transmission providers, including SPP, have made two general changes.
First, they are removing language from their tariffs that provides incumbent transmission owners
with a right of first refusal for transmission projects that seek regional cost allocation. (SPP tried
unsuccessfully to retain a right of first refusal for some projects, but was rejected by FERC and
ordered to remove the provision.268) Second, some transmission providers have developed new
or enhanced solicitation processes for selecting which transmission developers will build the
transmission projects to meet the needs of their region. These changes have made transmission
providers the arbiter of competing transmission proposals from both incumbent transmission
owners and non-incumbent developers.
As we noted in last year’s report, this can be viewed as a step toward opening
transmission to competition the way Congress opened generation to competition in 1978 with the
265 Transmission Planning and Cost Allocation by Transmission Owning and Operating Public Utilities, Final Rule
Order No. 1000, 136 FERC ¶ 61,051 (July 21, 2011). 266 Ibid., p. 248, paragraph 313. 267 Ibid. 268 Bill Reid, “SPP’s Order 1000 Filing,” Climate + Energy Project (blog), September 3, 2013,
http://www.climateandenergy.org/blog.1049800.spp-s-order-1000-filing?act=view.
56
Public Utility Regulatory Policies Act, which allowed entry by qualifying facilities.269 However,
the true impact of this reform may be somewhat limited because the solicitations for transmission
may tend to favor incumbent transmission owners.270 That may be the case because, more than
with generation, transmission upgrades and additions have a system-wide impact that can be
difficult to quantify with precision, especially when comparing the merits of one project to
another. Ideally, selection of the winning competitor would be done on a price-only basis; the
lowest cost project would be selected, as is often the case with generation competitive
procurements. However, competing transmission projects may have different reliability and
other non-price benefits that must be subjectively judged by transmission providers in
determining which competitor is superior. Also, the technical and financial wherewithal to build
transmission can also vary among bidders and, thus, must be taken into account. (Most
transmission providers have developed prequalification standards for interested developers; only
prequalified developers may submit proposals to build new transmission.) These realities could
tend to favor incumbent transmission owners, at least in the short run. Incumbent transmission
owners are a known quantity with established records of building transmission, which should
make prequalification a non-issue for them. Given this, there is some risk, too, that transmission
providers may face challenges from proposing developers that are not selected in the competitive
process.
1. An Example: California ISO Experience
As part of its compliance with FERC Order Nos. 890271 and 1000, California ISO
(CAISO) developed and refined a competitive solicitation process for certain regional
transmission projects that seek regional cost recovery.272 Like SPP, CAISO itself identifies
transmission needs and identifies the solutions needed through its planning process. Then, at
minimum, a two-month bid window is opened in which interested project sponsors can submit
applications to finance, construct, and own elements of the identified transmission projects.
Only proposals from prequalified project sponsors are accepted and evaluated. Proposals are
269 Roach, Ph.D. et al., Southwest Power Pool Annual Looking Forward Report, April 23, 2013, 34-35. 270 We noted, too, that it may be the states that dictate how significantly Order No. 1000 will impact regional
transmission development. Specifically, we noted that three states – North Dakota, South Dakota, and Minnesota –
had all passed laws introducing a state-level right of first refusal for incumbent transmission owners, and other
states, including SPP states Nebraska and New Mexico, were considering similar legislation. Over the past year,
more states have made progress in blocking the federal removal of a right of first refusal. In SPP, both Oklahoma
and Nebraska have passed legislation protecting incumbent transmission owners from competition from non-
incumbent developers. New Mexico’s proposed right of first refusal bill, which passed the New Mexico House of
Representatives, failed to pass the Senate. Roach, Ph.D. et al., Southwest Power Pool Annual Looking Forward
Report, Boston Pacific Company, Inc., April 23, 2013, 35; Reid, “SPP’s Order 1000 Filing,” Climate + Energy
Project (blog), September 3, 2013. 271 Preventing Undue Discrimination and Preference in Transmission Service, Order No. 890, FERC ¶ 31,241,
(February 16, 2007). 272 NERA Economic Consulting, US Transmission Planning Arrangements – Competitive Procurement and
Independent Planner Model: A Report for Grid Australia, November 21, 2012, 10.
57
evaluated on 10 factors, including the willingness to enter into a binding cost cap, quality of
materials, and dependability of technologies.273
In the event that there is just one proposal that meets the necessary criteria, the winning
developer may begin seeking siting approval. If, however, two or more proposals from different
developers meet the criteria to build the same project and propose to seek siting approval from
the same authority – such as the California Public Utilities Commission – CAISO will encourage
the winning sponsors to collaborate and submit a single joint proposal to construct and own the
project. If that fails, CAISO will post the key “factors and considerations” on which it will focus
in selecting a winner, and CAISO will engage an expert consultant to assist in selecting the
winner. Importantly, the evaluation will not focus only on costs, but will consider reliability,
financial ability to build and maintain the project, and the developer’s capabilities to license,
operate, construct, and maintain the facility in a timely and proper manner.274
In its 2012-2013 Transmission Plan, CAISO identified the Gates-Gregg project for
competitive solicitation.275 The Gates-Gregg project is a 59-mile, 230 kV project located
between two existing substations on the PG&E grid276 that will have both reliability and
economic benefits. CAISO received proposals from five applicants, including the incumbent,
PG&E, and four non-incumbents: (1) Elecnor, a Spanish developer; (2) Isolux Infrastructure, a
Dutch developer; and two U.S.-based developers: (3) Pattern; and (4) TBC. The “key” selection
factors identified by CAISO included experience acquiring rights-of-way, capabilities to finance,
license, construct, operate, and maintain the project, the schedule for constructing the project,
and cost containment measures.277
CAISO selected PG&E as the winner of the solicitation. CAISO based its decision on the
fact that PG&E has tangible advantages over the non-incumbent proposals, including the ability
to share existing rights-of-way and reduce easement requirements, costs, approvals, and
difficulties with eminent domain.278 CAISO’s report explaining its selection of PG&E as the
winner of the Gates-Gregg solicitation was submitted to FERC in a motion filed by LS Power on
December 10, 2013.279 This motion and other parties’ filled comments at FERC regarding
CAISO’s selection process may illustrate the risk transmission providers face in executing their
responsibilities in selecting winners in the transmission planning process. Specifically, both LS
Power and Pattern filed comments claiming that the CAISO was “too subjective” in applying its
273 California Independent System Operator, Gates-Gregg Project: Project Sponsor Selection Report, November 6,
2013, 5-6. 274 Order on Compliance Filing, FERC 143 ¶ 61,057, April 18, 2013. 275 California ISO Infrastructure Development, 2012 – 2013 Transmission Plan, California ISO, March 20, 2013, 8. 276 California Independent System Operator, Gates-Gregg Project: Project Sponsor Selection Report, November 6,
2013, 1,9. 277 Ibid., 55. 278 Ibid. 279 Motion to Lodge of LSP Transmission LLC, and LSP Transmission Holdings, FERC Docket No. ER03-103-002
(December 10, 2013).
58
evaluation criteria.280 Specifically, LS Power and Pattern alleged that while CAISO based its
decision on advantages enjoyed by PG&E as an incumbent transmission owner, CAISO did not
tie those advantages specifically to ratepayer benefits.281 LS Power and Pattern noted that
CAISO found that all five proposers were physically, financially, and technically capable of
constructing and completing the project in a timely and competent manner, and operating and
maintaining the facilities in accordance with “Good Utility Practice” over the life of the
facility.282 LS Power and Pattern asserted that if there are multiple qualified bidders that are
otherwise tied according to the CAISO’s criteria, the winner must be selected on the basis of
lowering costs to ratepayers, a benefit that LS Power and Pattern alleged was not shown.283
Pattern also claimed that CAISO’s process was not transparent, evidenced by CAISO’s use of an
independent evaluator that was not publicly identified or required to file a public report on its
findings.284
The criticisms faced by CAISO may not be unique to its particular transmission planning
process. Other RTOs, including SPP, may face criticism or even challenges in various
regulatory, dispute resolution, or legal forums from proposing transmission developers that are
not selected in the competitive process. One of the reasons is that the process is quite different
from that for stakeholder-driven issues that SPP faces on a day-to-day basis. Issues raised in the
stakeholder process are put to a vote and advanced only if certain pre-established thresholds are
met. Here, however, SPP is tasked with picking winners unilaterally. And while SPP has wisely
chosen to use a panel of independent experts to recommend which project developers to select,
the final decision is the responsibility of the SPP Board.
B. More Flexibility for Merchant Developers
Merchant transmission is intended to improve the grid by encouraging more competition
and it is a business fully open to competition by non-incumbent developers. A merchant
transmission developer is an entity that takes on all of the market risk of a transmission project.
Unlike a traditional utility, a merchant developer has no captive customers and does not receive
cost-plus rate recovery. Instead, merchant transmission projects are eligible for “negotiated”
rates.
280 Motion to Lodge of LSP Transmission LLC, and LSP Transmission Holdings, FERC Docket No. ER03-103-002
(December 10, 2013); Answer of Pattern Transmission LP to Motion to Lodge of LSP Transmission LLC, and LSP
Transmission Holdings LLC, FERC Docket No. ER13-103-003 (December 23, 2013). 281 Motion to Lodge of LSP Transmission LLC, and LSP Transmission Holdings, FERC Docket No. ER03-103-002
(December 10, 2013), 6; Answer of Pattern Transmission LP to Motion to Lodge of LSP Transmission LLC, And
LSP Transmission Holdings LLC, FERC Docket No. ER13-103-003 (December 23, 2013), 4. 282 Motion to Lodge of LSP Transmission LLC, and LSP Transmission Holdings, FERC Docket No. ER03-103-002
(December 10, 2013),10; Answer of Pattern Transmission LP To Motion To Lodge of LSP Transmission LLC, and
LSP Transmission Holdings LLC, FERC Docket No. ER13-103-003 (December 23, 2013), 6. 283 Motion to Lodge of LSP Transmission LLC, and LSP Transmission Holdings, FERC Docket No. ER03-103-002
(December 10, 2013), 19; Answer of Pattern Transmission LP To Motion To Lodge of LSP Transmission LLC, And
LSP Transmission Holdings LLC, FERC Docket No. ER13-103-003 (December 23, 2013), 6. 284 Answer of Pattern Transmission LP To Motion To Lodge of LSP Transmission LLC, and LSP Transmission
Holdings LLC, FERC Docket No. ER13-103-003 (December 23, 2013), 17-18.
59
Historically, merchant transmission has been very difficult to build and there are few
success stories. Most projects are high-voltage direct current (HVDC) lines in or between
regions with sustained price differentials or resource needs.285 HVDC projects are well suited
for merchant development, in part because they have a more limited system impact than
alternating current (AC) lines; for example, since HVDC projects are controllable, they do not
produce parallel flows (i.e., loop flows) on the system.286 Merchant projects offer developers the
chance to transmit excess, cheaper power over long distances to load pockets with high prices,
and/or move renewable energy from remote locations to load centers in states with renewable
portfolio standards. For example, the Zephyr project, an 850-mile, 3,000 MW HVDC project,
promises to sell wind power from eastern Wyoming to cities in the southwest U.S.287
Nevertheless, seeing a merchant transmission project through from its initial proposal stages
through energization is a long, arduous, and uncertain process. For example, the Zephyr
transmission project has been in development since 2008 but is not expected to be online until
2020.
Some might say that the best case for SPP using merchant transmission is in exporting
power. As with many merchant projects, a project in SPP may likely seek to sell renewable
power to a state with an RPS and/or sell cheap power to a market with higher prices. The
likelihood of merchant development in SPP would be improved by states outside of SPP
adopting RPS standards or competitive markets, especially states in the Southeast. To the extent
that SPP is interested in attracting merchant transmission development, SPP should be aware of
recent action by FERC intended to help merchant developers.
1. FERC’s Flexibility on Merchant Rates
FERC, which approves the rates that merchants can charge on their projects, attempted
to help merchant developers by allowing more flexibility in negotiating contracts with potential
customers. Until recently, to get approval to charge negotiated rates, the developer had to pass
FERC’s “four-factor analysis” to ensure that: (1) rates would be just and reasonable; (2) the
developer would not have potential for undue discrimination; (3) the developer would not unduly
favor one customer – like one of its affiliates – over another; and (4) the project would be
operated consistent with regional reliability and operational efficiency requirements.288 To pass
this test, merchant developers set aside a minimum percentage of the total capacity on the project
for sale in an open season. The developer would sell some of its capacity to an anchor customer
through a bilateral agreement negotiated confidentially, but would have to offer the same rates,
terms, and conditions given to the anchor customer in the open season. Any interested customer
285 Johannes Pfeifenberger et al., “Competition in Transmission Planning and Development: Current Status and
International Experience,” The Brattle Group, January 31, 2014 (presentation, EUCI – Transmission Policy: A
National Summit, Washington, DC, January 30-31, 2014), 3. 286 Michael Bahrman P.E., “HVDC Transmission: An economical complement to AC transmission,” ABB Group
(presentation, WECC Transmission Planning Seminar, February 2-3, 2009), 6. 287 Duke American Transmission Co., “Zephyr Power Transmission Project,” DATC website, accessed April 19,
2014, http://www.datcllc.com/datc-projects/zephyr/. 288 Order Authorizing Proposals and Grant Waivers, 126 FERC ¶ 61,134, (February 19, 2009), 12.
60
could receive the same deal as the anchor customer in the open season, which would serve as a
check on the reasonableness of the anchor customer’s agreement.
In January 2013, FERC issued a policy statement289 addressing industry concerns that its
existing merchant transmission capacity allocation policy was not sufficient to get merchant
projects financed, subscribed, and built. FERC’s new policy introduced an alternative in which
developers can sell up to 100 percent of project capacity to a single anchor customer or multiple
anchor customers – including affiliates. Merchant developers choosing this option are no longer
required to set aside a minimum percentage of the project’s capacity for sale in an open season;
instead, the developer must have what FERC calls an “open solicitation” to find potential anchor
customers. Once a developer has a shortlist of potential customers, it may sell capacity on their
projects at different rates, terms, and conditions to its anchor customers.
FERC’s policy statement should help merchant transmission developers by providing
additional flexibility. Almost every merchant transmission developer we have spoken to has
lauded the policy statement as providing additional flexibility. Especially critical is FERC’s new
stance on offering more favorable terms to potential customers based on criteria that are not
unduly discriminatory. For example, FERC will allow merchants to provide better terms to
customers that agree to sign up for capacity earlier in the process – so-called “first mover status.”
This can help solve merchant transmission developers’ most fundamental challenge in financing
their projects. Without customers, attracting financing is nearly impossible, but while the
merchant developers had incentive to sign up customers quickly, the potential customers
themselves did not since they could get the same rates, terms, and conditions as the “anchor”
customer later on in the open season. Those contrasting incentives often led to stalemates that
delayed financing and project timelines. FERC’s policy statement regarding first mover status
helps alleviate this problem.
Nevertheless, we think there are two factors that may limit the effectiveness of FERC’s
policy statement. First, the hurdles that prevent merchant transmission developers from project
development likely remain outside the realm of FERC’s regulatory tools. For merchant
development in SPP, often the most fundamental hurdle is that of finding interested,
creditworthy customers.290 Second, developers could face additional regulatory risk under this
option. Under the old method – the anchor customer/open season model – a merchant developer
got up-front approval from FERC, all but eliminating its regulatory risk. If FERC rejected its
application, the merchant developer could restructure its application and re-apply, all in advance
of negotiating contracts with potential customers.291 Under FERC’s new method, merchant
developers must file the results of their open solicitation process after negotiations are over,
customers are selected, and contracts have been signed. This after-the-fact FERC review means
289 Allocation of Capacity on New Merchant Transmission Projects and New Cost-Based, Participant-Funded
Transmission Project Priority Rights to New Participant-Funded Transmission, 142 FERC ¶ 61,038, January 17,
2013. 290 In addition to demand, other challenges like siting and permitting remain difficult obstacles for projects,
especially those that cover long distances and multiple jurisdictions. 291 Sun Zia is an example of a merchant developer that saw its application to sell merchant transmission capacity at
negotiated rates rejected by FERC. Sun Zia altered its application, re-applied, and later received FERC approval.
See: Order on Petition for Declaratory Order, 135 FERC ¶ 61,169, May 20, 2011.
61
that merchant developers will retain regulatory risk – that is, the risk that FERC will find their
sales of capacity on their projects to be unjust and unreasonable – throughout negotiations with
potential customers.
C. Decentralization and Distributed Generation: Disruptive Impact on
Transmission Planning?
Changing gears from two events that are attempts to strengthen the grid by introducing
more competition in transmission expansion, we turn now to an event that some view could be
an existential threat to expansion of the grid. As we describe in Chapter III, decentralization and
distributed resources have been raised as a direct, competitive challenge to the grid. Our purpose
in this chapter is to focus on distributed resources’ impact on transmission planning specifically.
To consider the potential impact of a less-centralized grid on transmission planning, we
looked to a white paper by ICF titled How and Where Distributed Energy Resources Will Reduce
the Need for Transmission.292 ICF concludes that targeted distributed resources can reduce the
need for transmission and distribution investments in certain areas. To do so, distributed
resources must be reliable and properly located,293 and, in addition, distributed resource
programs must be “carefully tailored” to match distributed generation with central station power
in a way that reduces the need for new transmission investments.294 When distributed energy
generation is unorganized – as ICF claims that most is today – it will not provide adequate
reliability benefits that offset the need for transmission investment.295 ICF finds that distributed
generation, when targeted properly, can defer transmission investments, resulting in fewer
transmission and distribution losses, the economic benefits of avoided costs of generation,
reduced water needs and air pollution, and deferral of distribution system investments.296
ICF also notes that despite the forecast increase in distributed resources and the benefits
they provide, need for transmission expansion will persist. “In light of a significantly changing
generation profile due to projected coal retirements, increased renewable penetration, and high
levels of flexible natural gas-fired generation, new transmission lines provide …” flexibility to
support reliable operation of the grid.297 Additionally, aging infrastructure in several regions
across the U.S. combined with potential system contingencies will also necessitate new
transmission lines being built.298
ICF provides three case studies to back up its conclusions about the need to precisely
match distributed generation to the grid. The first is the Greater Springfield Reliability Project
292 Kiran Kumaraswamy, How and Where Distributed Energy Resources Will Reduce the Need for Transmission,
ICF International, December 6, 2013. 293 Ibid., 4. 294 Ibid., 1. 295 Ibid. 296 Ibid. 297 Ibid. 298 Ibid.
62
near Springfield, MA.299 The area was experiencing reliability violations because the double-
circuit tower configurations were built several decades ago and therefore were outdated. The
proposed transmission solution would have replaced the towers and provided high-voltage
reinforcement. Nevertheless, the local utility (Northeast Utilities) was required to evaluate non-
transmission alternatives and to determine whether those alternatives were capable of offsetting
the need for the proposed transmission project. Northeast Utilities’ analysis showed that the
distributed energy resources in the region did not provide adequate reliability based on NERC’s
transmission planning standards. As a result, the Greater Springfield Reliability Project was
approved and is now under construction.
The second case study, also in New England,300 involves an analysis by ISO New
England into specific locations in the grid where the addition of distributed energy resources
could provide a level of reliability comparable to that of proposed transmission projects. ISO
New England concluded that, if targeted and planned development of distributed energy
resources occurred at specific locations, mostly in Vermont, the possibility existed for deferring
new transmission projects. Vermont has yet to act on ISO New England’s analysis.
The third case study involves Maine.301 In April 2012, the Maine Public Utilities
Commission approved a pilot non-transmission alternative program to defer investment in new
transmission lines in Central Maine Power’s region. Central Maine Power had identified a need
for an $18 million upgrade to a 34.5 kV transmission line from Newcastle to Boothbay Harbor
for load serving needs. The Maine Public Utilities Commission approved the pilot non-
transmission alternative, which included two megawatts of distributed generation, energy
conservation, and demand response that would offset the $18 million investment need.
More broadly, ICF further concludes that the impact of distributed resources on
transmission expansion will vary greatly by region because of the large number of variables
inherent in transmission planning, including varying demand conditions, combinations of
contingencies, and imports and exports.302 In order for transmission planners to effectively study
distributed energy resources as an alternative to transmission expansion, “utilities and other
stakeholders involved in the process must fully agree on the underlying set of assumptions and
modeling methods.”303
ICF is not alone in encouraging transmission planners to integrate distributed resources
into their transmission planning processes. Synapse Energy Economics issued a report in which
it claims that ISO New England fails to account for distributed generation capacity in its analysis
of grid needs and, as a result, New England ratepayers will pay for transmission expansion
299 Ibid., 2. 300 Ibid., 2. 301 Ibid., 2-3. 302 Ibid., 4. 303 Ibid.

63
projects that are not needed.304 EPRI, too, echoes the theme of planning the grid in conjunction
with distributed technologies.
304 Sarah Jackson et al., Forecasting Distributed Generation Resources in New England: Distributed Generation
Must be Properly Accounted for in Regional System Planning, Synapse Energy Economics, Inc., June 7, 2013, 2.
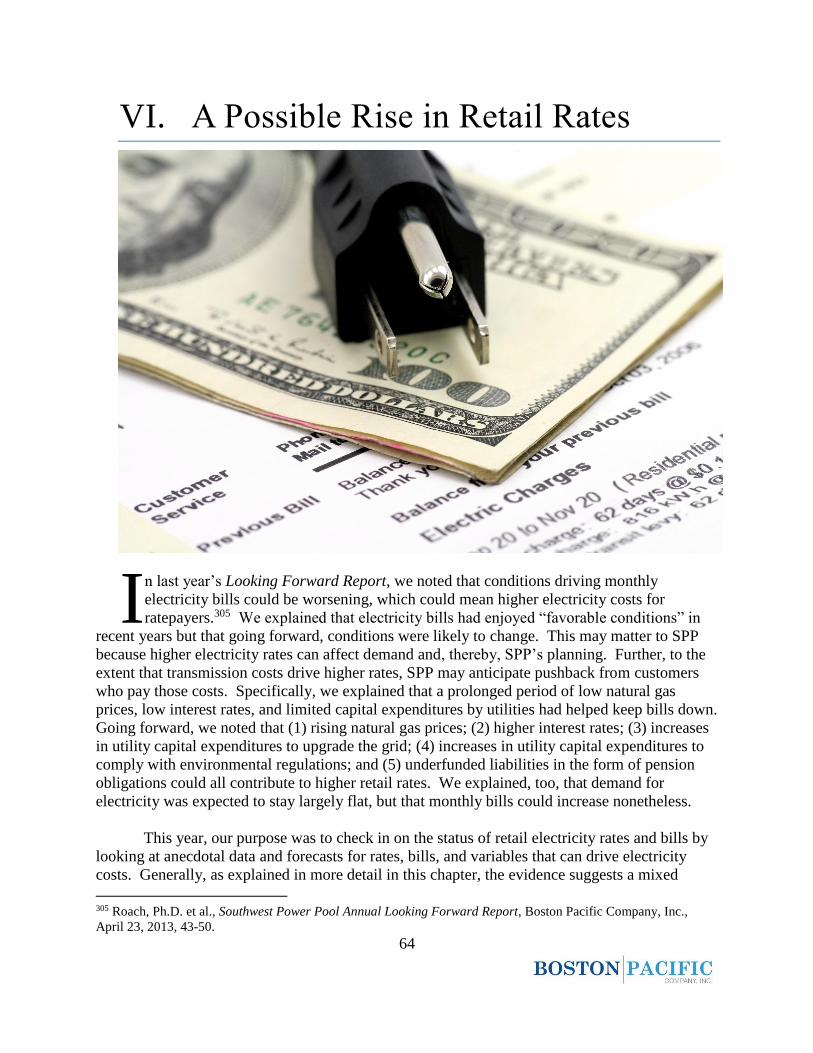
64
VI. A Possible Rise in Retail Rates
n last year’s Looking Forward Report, we noted that conditions driving monthly
electricity bills could be worsening, which could mean higher electricity costs for
ratepayers.305 We explained that electricity bills had enjoyed “favorable conditions” in
recent years but that going forward, conditions were likely to change. This may matter to SPP
because higher electricity rates can affect demand and, thereby, SPP’s planning. Further, to the
extent that transmission costs drive higher rates, SPP may anticipate pushback from customers
who pay those costs. Specifically, we explained that a prolonged period of low natural gas
prices, low interest rates, and limited capital expenditures by utilities had helped keep bills down.
Going forward, we noted that (1) rising natural gas prices; (2) higher interest rates; (3) increases
in utility capital expenditures to upgrade the grid; (4) increases in utility capital expenditures to
comply with environmental regulations; and (5) underfunded liabilities in the form of pension
obligations could all contribute to higher retail rates. We explained, too, that demand for
electricity was expected to stay largely flat, but that monthly bills could increase nonetheless.
This year, our purpose was to check in on the status of retail electricity rates and bills by
looking at anecdotal data and forecasts for rates, bills, and variables that can drive electricity
costs. Generally, as explained in more detail in this chapter, the evidence suggests a mixed
305 Roach, Ph.D. et al., Southwest Power Pool Annual Looking Forward Report, Boston Pacific Company, Inc.,
April 23, 2013, 43-50.
I
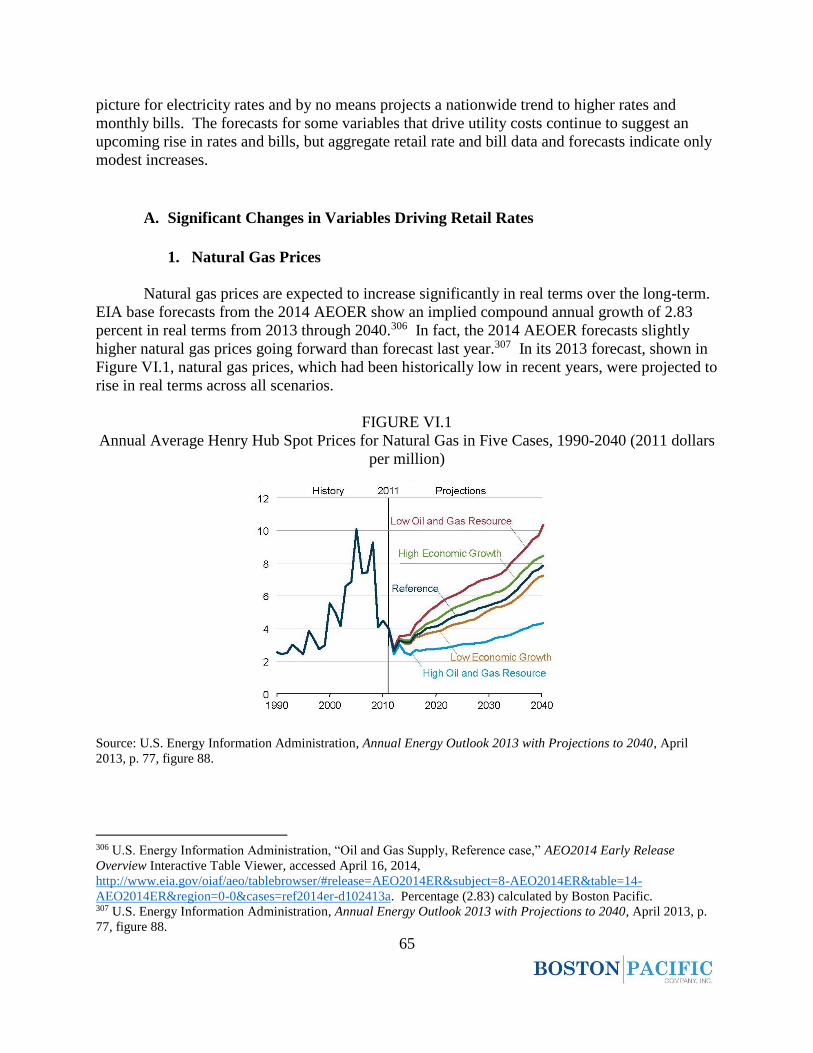
65
picture for electricity rates and by no means projects a nationwide trend to higher rates and
monthly bills. The forecasts for some variables that drive utility costs continue to suggest an
upcoming rise in rates and bills, but aggregate retail rate and bill data and forecasts indicate only
modest increases.
A. Significant Changes in Variables Driving Retail Rates
1. Natural Gas Prices
Natural gas prices are expected to increase significantly in real terms over the long-term.
EIA base forecasts from the 2014 AEOER show an implied compound annual growth of 2.83
percent in real terms from 2013 through 2040.306 In fact, the 2014 AEOER forecasts slightly
higher natural gas prices going forward than forecast last year.307 In its 2013 forecast, shown in
Figure VI.1, natural gas prices, which had been historically low in recent years, were projected to
rise in real terms across all scenarios.
FIGURE VI.1
Annual Average Henry Hub Spot Prices for Natural Gas in Five Cases, 1990-2040 (2011 dollars
per million)
Source: U.S. Energy Information Administration, Annual Energy Outlook 2013 with Projections to 2040, April
2013, p. 77, figure 88.
306 U.S. Energy Information Administration, “Oil and Gas Supply, Reference case,” AEO2014 Early Release
Overview Interactive Table Viewer, accessed April 16, 2014,
http://www.eia.gov/oiaf/aeo/tablebrowser/#release=AEO2014ER&subject=8-AEO2014ER&table=14-
AEO2014ER®ion=0-0&cases=ref2014er-d102413a. Percentage (2.83) calculated by Boston Pacific. 307 U.S. Energy Information Administration, Annual Energy Outlook 2013 with Projections to 2040, April 2013, p.
77, figure 88.
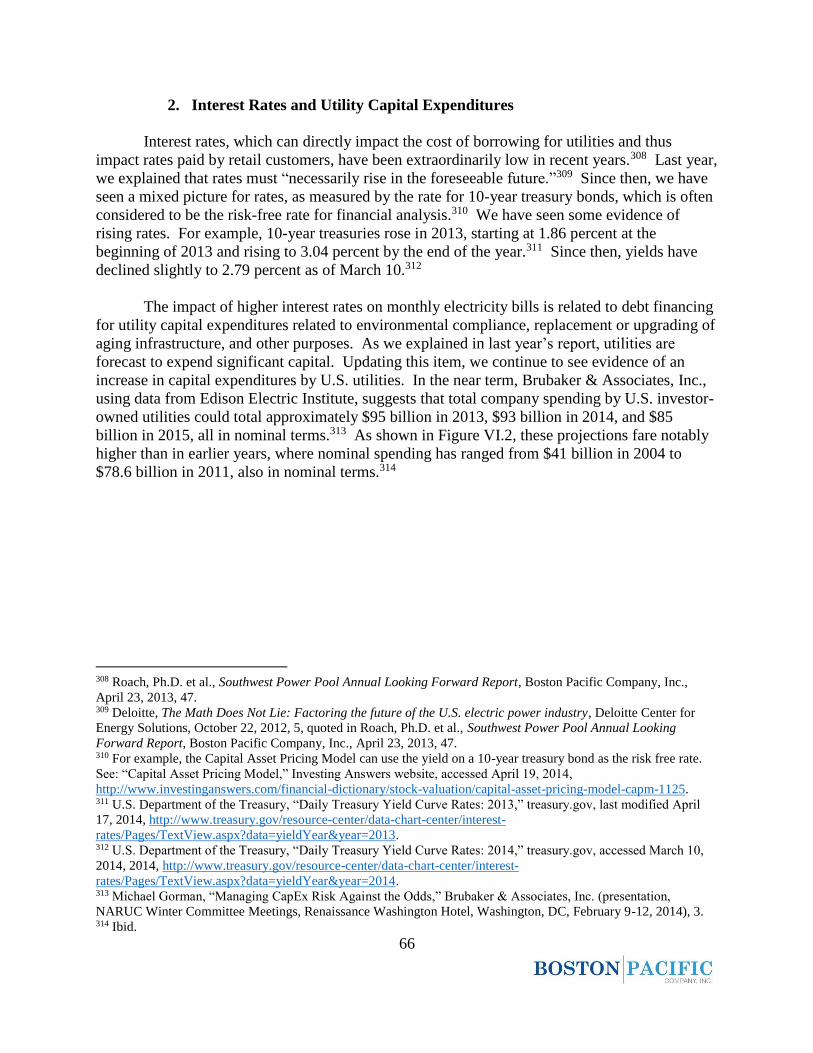
66
2. Interest Rates and Utility Capital Expenditures
Interest rates, which can directly impact the cost of borrowing for utilities and thus
impact rates paid by retail customers, have been extraordinarily low in recent years.308 Last year,
we explained that rates must “necessarily rise in the foreseeable future.”309 Since then, we have
seen a mixed picture for rates, as measured by the rate for 10-year treasury bonds, which is often
considered to be the risk-free rate for financial analysis.310 We have seen some evidence of
rising rates. For example, 10-year treasuries rose in 2013, starting at 1.86 percent at the
beginning of 2013 and rising to 3.04 percent by the end of the year.311 Since then, yields have
declined slightly to 2.79 percent as of March 10.312
The impact of higher interest rates on monthly electricity bills is related to debt financing
for utility capital expenditures related to environmental compliance, replacement or upgrading of
aging infrastructure, and other purposes. As we explained in last year’s report, utilities are
forecast to expend significant capital. Updating this item, we continue to see evidence of an
increase in capital expenditures by U.S. utilities. In the near term, Brubaker & Associates, Inc.,
using data from Edison Electric Institute, suggests that total company spending by U.S. investor-
owned utilities could total approximately $95 billion in 2013, $93 billion in 2014, and $85
billion in 2015, all in nominal terms.313 As shown in Figure VI.2, these projections fare notably
higher than in earlier years, where nominal spending has ranged from $41 billion in 2004 to
$78.6 billion in 2011, also in nominal terms.314
308 Roach, Ph.D. et al., Southwest Power Pool Annual Looking Forward Report, Boston Pacific Company, Inc.,
April 23, 2013, 47. 309 Deloitte, The Math Does Not Lie: Factoring the future of the U.S. electric power industry, Deloitte Center for
Energy Solutions, October 22, 2012, 5, quoted in Roach, Ph.D. et al., Southwest Power Pool Annual Looking
Forward Report, Boston Pacific Company, Inc., April 23, 2013, 47. 310 For example, the Capital Asset Pricing Model can use the yield on a 10-year treasury bond as the risk free rate.
See: “Capital Asset Pricing Model,” Investing Answers website, accessed April 19, 2014,
http://www.investinganswers.com/financial-dictionary/stock-valuation/capital-asset-pricing-model-capm-1125. 311 U.S. Department of the Treasury, “Daily Treasury Yield Curve Rates: 2013,” treasury.gov, last modified April
17, 2014, http://www.treasury.gov/resource-center/data-chart-center/interest-
rates/Pages/TextView.aspx?data=yieldYear&year=2013. 312 U.S. Department of the Treasury, “Daily Treasury Yield Curve Rates: 2014,” treasury.gov, accessed March 10,
2014, 2014, http://www.treasury.gov/resource-center/data-chart-center/interest-
rates/Pages/TextView.aspx?data=yieldYear&year=2014. 313 Michael Gorman, “Managing CapEx Risk Against the Odds,” Brubaker & Associates, Inc. (presentation,
NARUC Winter Committee Meetings, Renaissance Washington Hotel, Washington, DC, February 9-12, 2014), 3. 314 Ibid.
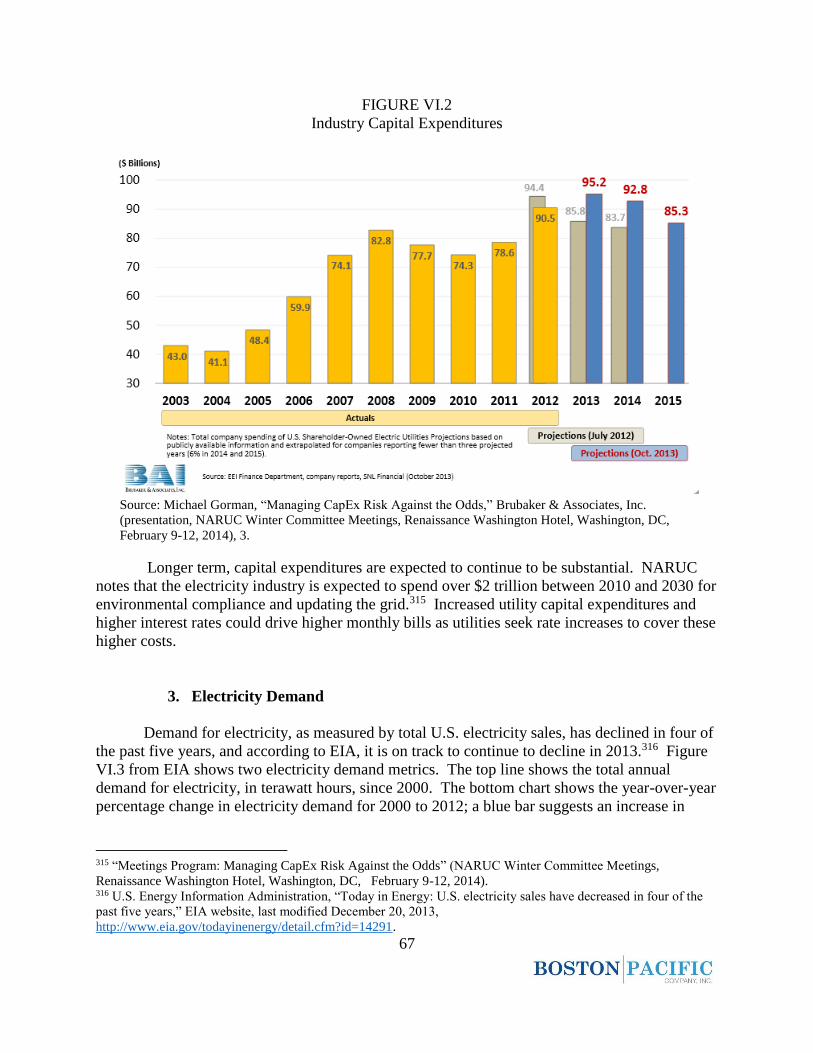
67
FIGURE VI.2
Industry Capital Expenditures
Source: Michael Gorman, “Managing CapEx Risk Against the Odds,” Brubaker & Associates, Inc.
(presentation, NARUC Winter Committee Meetings, Renaissance Washington Hotel, Washington, DC,
February 9-12, 2014), 3.
Longer term, capital expenditures are expected to continue to be substantial. NARUC
notes that the electricity industry is expected to spend over $2 trillion between 2010 and 2030 for
environmental compliance and updating the grid.315 Increased utility capital expenditures and
higher interest rates could drive higher monthly bills as utilities seek rate increases to cover these
higher costs.
3. Electricity Demand
Demand for electricity, as measured by total U.S. electricity sales, has declined in four of
the past five years, and according to EIA, it is on track to continue to decline in 2013.316 Figure
VI.3 from EIA shows two electricity demand metrics. The top line shows the total annual
demand for electricity, in terawatt hours, since 2000. The bottom chart shows the year-over-year
percentage change in electricity demand for 2000 to 2012; a blue bar suggests an increase in
315 “Meetings Program: Managing CapEx Risk Against the Odds” (NARUC Winter Committee Meetings,
Renaissance Washington Hotel, Washington, DC, February 9-12, 2014). 316 U.S. Energy Information Administration, “Today in Energy: U.S. electricity sales have decreased in four of the
past five years,” EIA website, last modified December 20, 2013,
http://www.eia.gov/todayinenergy/detail.cfm?id=14291.
68
demand from the year prior, while a brown bar suggests a decrease in demand over the previous
year.317
FIGURE VI.3
U.S. Electricity End Use, Total and Year-Over-Year Change (2000-2012)
Source: U.S. Energy Information Administration, “Today in Energy: U.S. electricity sales have decreased in
four of the past five years,” EIA website, last modified December 20, 2013,
http://www.eia.gov/todayinenergy/detail.cfm?id=14291.
B. Aggregated Rate and Bill Data
During 2013, EIA estimates the average U.S. residential customer used 10,870 kWh of
electricity, which is 2.2 percent lower than the average level of consumption between 2008 and
2012.318 Going forward, EIA estimates that residential consumption will remain relatively flat.
Improvements in energy efficiency are likely to continue affecting growth in electricity
consumption, and EIA expects the average sales of electricity per residential customer to fall by
1.1 percent in 2014 and by 0.4 percent in 2015.319 Energy efficiency also impacts sales of
electricity to the commercial sector, which EIA expects to decline by 0.5 percent this year and to
grow by only 0.3 percent in 2015.320 In contrast, improved economic conditions, especially in
the chemicals and primary metals industries, drive a 2.2 percent increase in industrial electricity
sales during 2014 and a 2.5 percent increase in 2015, according to EIA.321
317 Ibid. 318 U.S. Energy Information Administration, Short Term Energy Outlook (STEO), January 2014, 9. 319 Ibid. 320 Ibid. 321 Ibid.
69
Both electricity rates and monthly electricity bills have risen over the past year.
According to EIA, U.S. residential rates have risen 2.9 percent; commercial rates are up by 2.3
percent; and industrial rates are up by 1.4 percent.322 U.S. monthly retail electricity bills have
also risen over the past year. Specifically, the average residential bill in January 2013 increased
1.45 percent from the year prior.323 Going forward, EIA forecasts of rate and monthly bill data
and forecasts indicate only modest increases. EIA forecasts average residential rates in 2014 to
rise 0.9 percent from 2013 levels, another 1.7 percent in 2015, and by a total of 14.7 percent in
2040 from 2013 levels, all in real terms.324
C. Utilities Seeking Significant Rate Increases
Aside from aggregate forecasts, we checked in on some utilities for any evidence of
significant changes in rates. Again, while by no means proving a wider trend, these anecdotes
could be early warning signs of cost pressures coming to U.S. utilities.
1. PSE&G325
One example of a utility that is increasing its rates to pay for increasing transmission
expansion costs is PSE&G. PSE&G filed its new transmission rates on October 15, 2013. The
new rates are higher and reflect increases in transmission expansion costs attributable to PSE&G.
Specifically, PSE&G’s Basic Generation Service Firm Transmission Service Supplier Rate
increased by more than 31 percent from 2013 to 2014 and by 98.5 percent from 2012 to 2014.326
These rate increases are being driven by increases in transmission expansion costs
attributable to PSE&G customers. Specifically, the total transmission expansion costs borne by
PSE&G customers went up over 31 percent, from $442.7 million in 2013 to $580.3 million in
2014.327 These increases reflect transmission upgrades in PJM whose costs are allocated to
PSE&G. Transmission rates have climbed high enough to be comparable to capacity costs in the
PJM’s capacity market, the Reliability Pricing Model, where PSE&G’s localized price for
capacity for the 2016 to 2017 deliverability year is $177.61/MW-day.328
322 U.S. Energy Information Administration, “Average Retail Price of Electricity to Ultimate Customers by End-Use
Sector, by State, November 2013 and 2012 (Cents per Kilowatthour),” Electric Power Annual, December 12, 2013. 323 Percent increase (1.45 percent) calculated by Boston Pacific using data from Edison Electric Institute, Typical
Bills and Average Rates Report for Winter 2013 cited in Florida Power & Light, “Residential Bills lower than
national average,” 2012; Edison Electric Institute, Typical Bills and Average Rates Report for Winter 2012 cited in
Florida Power & Light, “Residential customer bills 25 percent below the national average,” 2013. 324 Percent increase calculated by Boston Pacific using data from U.S. Energy Information Administration,
“Electricity Supply, Disposition, Prices, and Emissions, Reference Case,” AEO2014 Early Release Overview
Interactive Table Viewer, accessed April 18, 2014,
http://www.eia.gov/oiaf/aeo/tablebrowser/#release=AEO2014ER&subject=6-AEO2014ER&table=8-
AEO2014ER®ion=0-0&cases=ref2014er-d102413a. 325 PSE&G, 2014 Formula Rate Annual Update, October 15, 2013. 326 Ibid. 327 Ibid. 328 PJM Interconnection, LLC, 2016/2017 Base Residual Auction Results, May 24, 2013.
70
2. FirstEnergy
Another example of a utility increasing its expenditures on both upgrading aging
transmission infrastructure and responding to environmental mandates is FirstEnergy. Its
"Energizing the Future" initiative was previously announced in May 2012 as part of
FirstEnergy's ongoing commitment to enhance its high-voltage transmission system.329
FirstEnergy states that many of the projects – including new or rebuilt high-voltage power lines,
new substations, and the installation of specialized voltage regulating equipment – were needed
to help support system reliability as coal-fired power plants in the region are deactivated based
on MATS and other environmental rules.330 Overall, these initial "Energizing the Future"
projects represented about a $1.8 billion investment in Ohio, Pennsylvania, West Virginia, New
Jersey and Maryland over the next five years.331
In November 2013, First Energy announced an additional $2.8 billion expansion of the
“Energizing the Future” initiative. This expansion will primarily focus on upgrading some areas
of FirstEnergy’s aging grid, which averages more than 40 years old. Specifically, FirstEnergy
will evaluate and rebuild 7,200 circuit miles of 69 kV and higher transmission lines, inspect and
upgrade more than 170 substations, and evaluate and rebuild 70,000 transmission structures.332
While FirstEnergy’s rates have yet to increase, its CEO, Anthony Alexander, hinted that
rate increases are on the horizon. He stated, “[a]ny time you are investing in the rate base (the
wires) to improve customer service, improve reliability, it will have consequences on rates.”333
3. National Grid
In December, National Grid received approval from the Rhode Island Public Utilities
Commission to increase residential electricity rates by 12.1 percent.334 Beginning in January of
this year, “the typical Rhode Island household’s monthly bill is projected to rise from $78.91 to
$88.47, an increase of $9.56.”335 Commercial electricity rates rose by 23.2 percent.336
329 FirstEnergy, “FirstEnergy Announces ‘Energizing the Future’ Initiative to Enhance Transmission System
Reliability,” FirstEnergy website, accessed April 19, 2014,
https://www.firstenergycorp.com/content/fecorp/newsroom/news_releases/firstenergy_announcesenergizingthefutur
einitiativetoenhancetrans.html. 330 Ibid. 331 Ibid. 332 FirstEnergy, “FirstEnergy Announces $2.8 Billion Expansion of "Energizing the Future" Transmission
Initiative,” FirstEnergy website, last modified November 12, 2013,
https://www.firstenergycorp.com/content/fecorp/newsroom/news_releases/firstenergy-announces--2-8-billion-
expansion-of--energizing-the-.html. 333 Anthony Alexander, quoted in John Funk, “FirstEnergy confirms rate increases with transmission
improvements,” The Plain Dealer, November 12, 2013. 334 G. Wayne Miller, “Utility panel approves 12.1 percent rate hike for National Grid electricity,” Providence
Journal, December 20, 2013. 335 Ibid. 336 Alex Kuffner, “R.I. Utilities Panel Oks 23.2 Percent Increase in Commercial Electricity Rates,” Providence
Journal, December 20, 2013.
71
National Grid claims that the “overwhelming majority” of the increase is derived from an
increase in natural gas prices in New England.337 It should be noted that prices for natural gas in
New England are uniquely high because of the combination of New England’s “limited”338
pipeline capacity, high reliance on natural gas for generation – natural gas-fired generation
supplied 52 percent of electricity in 2012339 – and its reliance on natural gas for heating in the
winter.340 Nevertheless, National Grid customers’ experience illustrates how volatile end user
rates can be when closely associated with natural gas prices.
4. Indiana Utilities
Lastly, in December 2013, a Purdue University-based group, The State Utility
Forecasting Group, issued its bi-annual report on Indiana electricity rates for the Indiana Utility
Regulatory Commission.341 The Indiana report predicts a 30 percent rise in Indiana’s electricity
rates in real terms by 2023, stating, “[r]eal prices are projected to increase by 30 percent from
2012 to 2023 and then slowly decrease until 2026 before maintaining that level for the remainder
of the forecast period.”342 The Indiana report also suggests “electricity usage [will] grow at a
rate of 0.74 percent per year over the 20 years of the forecast.”343
The report attributes the projected rate increases to “costs associated with meeting
environmental rules, costs associated with recent plant construction, and costs associated with
extending the life of existing generating facilities.”344 The report attributes the lower growth in
electricity usage primarily to “increasing efficiency,” which “are projected to occur from three
sources: utility-sponsored conservation efforts, higher projected electricity prices making
investments in higher efficiency equipment more cost-effective, and stricter federal energy
efficiency standards.”345
337 Miller, “Utility panel approves 12.1 percent rate hike for National Grid electricity,” Providence Journal,
December 20, 2013. 338 Kuffner, “R.I. Utilities Panel Oks 23.2 Percent Increase in Commercial Electricity Rates,” Providence Journal,
December 20, 2013. 339 Ibid. 340 Ibid. 341 Timothy A. Phillips et al., Indiana Electricity Projections: The 2013 Forecast, State Utility Forecasting Group,
Purdue University, December 2013. 342 Ibid., 1-7. 343 Ibid., 1-1. 344 Ibid. 345 Ibid.
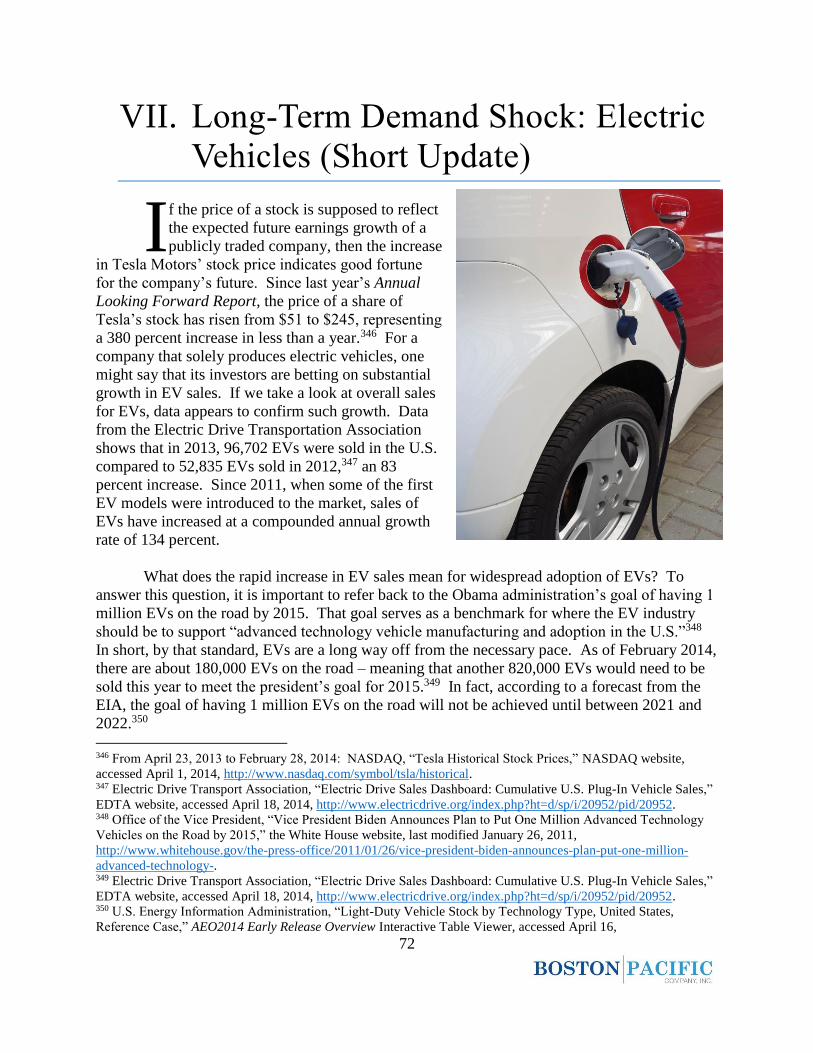
72
VII. Long-Term Demand Shock: Electric
Vehicles (Short Update)
f the price of a stock is supposed to reflect
the expected future earnings growth of a
publicly traded company, then the increase
in Tesla Motors’ stock price indicates good fortune
for the company’s future. Since last year’s Annual
Looking Forward Report, the price of a share of
Tesla’s stock has risen from $51 to $245, representing
a 380 percent increase in less than a year.346 For a
company that solely produces electric vehicles, one
might say that its investors are betting on substantial
growth in EV sales. If we take a look at overall sales
for EVs, data appears to confirm such growth. Data
from the Electric Drive Transportation Association
shows that in 2013, 96,702 EVs were sold in the U.S.
compared to 52,835 EVs sold in 2012,347 an 83
percent increase. Since 2011, when some of the first
EV models were introduced to the market, sales of
EVs have increased at a compounded annual growth
rate of 134 percent.
What does the rapid increase in EV sales mean for widespread adoption of EVs? To
answer this question, it is important to refer back to the Obama administration’s goal of having 1
million EVs on the road by 2015. That goal serves as a benchmark for where the EV industry
should be to support “advanced technology vehicle manufacturing and adoption in the U.S.”348
In short, by that standard, EVs are a long way off from the necessary pace. As of February 2014,
there are about 180,000 EVs on the road – meaning that another 820,000 EVs would need to be
sold this year to meet the president’s goal for 2015.349 In fact, according to a forecast from the
EIA, the goal of having 1 million EVs on the road will not be achieved until between 2021 and
2022.350
346 From April 23, 2013 to February 28, 2014: NASDAQ, “Tesla Historical Stock Prices,” NASDAQ website,
accessed April 1, 2014, http://www.nasdaq.com/symbol/tsla/historical. 347 Electric Drive Transport Association, “Electric Drive Sales Dashboard: Cumulative U.S. Plug-In Vehicle Sales,”
EDTA website, accessed April 18, 2014, http://www.electricdrive.org/index.php?ht=d/sp/i/20952/pid/20952. 348 Office of the Vice President, “Vice President Biden Announces Plan to Put One Million Advanced Technology
Vehicles on the Road by 2015,” the White House website, last modified January 26, 2011,
http://www.whitehouse.gov/the-press-office/2011/01/26/vice-president-biden-announces-plan-put-one-million-
advanced-technology-. 349 Electric Drive Transport Association, “Electric Drive Sales Dashboard: Cumulative U.S. Plug-In Vehicle Sales,”
EDTA website, accessed April 18, 2014, http://www.electricdrive.org/index.php?ht=d/sp/i/20952/pid/20952. 350 U.S. Energy Information Administration, “Light-Duty Vehicle Stock by Technology Type, United States,
Reference Case,” AEO2014 Early Release Overview Interactive Table Viewer, accessed April 16,
I
73
Another metric to consider is market penetration. While the growth rates of EV sales
have been impressive, the market share of EVs is just 0.62 percent of total vehicle sales – still a
small fraction of the overall vehicle market – with over 15.5 million total vehicles sold in
2013.351 In contrast, 495,530 hybrid electric vehicles (HEV), which do not have plug-in
capability, were sold in 2013, accounting for 3.19 percent of total 2013 vehicle sales.352 It is
worth noting that there are nearly 3.5 times more model types of HEVs than EVs.353
Furthermore, since 2007, the annual average market share of HEVs has ranged from 2.09 percent
to 3.19 percent.354 EVs have yet to break a sales mark of 1 percent of total vehicle sales in a
year. In terms of where EVs are being purchased, nationwide EV sales have been concentrated
in the eastern and western coastal states of the U.S., accounting for approximately 60 percent of
total sales.355 In comparison, the same data shows that the west central regions of the U.S.,
which include the majority of SPP’s footprint, only accounted for 14 percent of total nationwide
sales.356
Forecasts also show that EVs will remain on the periphery well into the future. The EIA
predicts that EVs will represent less than 2 percent of total vehicles in 2040.357 On the other
hand, there will be twice as many HEVs than EVs on the road, which will account for about 5
percent of total vehicles in 2040.358 Still, overall, both HEVs and EVs continue to make up a
2014, http://www.eia.gov/oiaf/aeo/tablebrowser/#release=AEO2014ER&subject=15-AEO2014ER&table=48-
AEO2014ER®ion=1-0&cases=ref2014er-d102413a. 351 Electric Drive Transport Association, “Electric Drive Sales Dashboard: Cumulative U.S. Plug-In Vehicle Sales,”
EDTA website, accessed April 18, 2014, http://www.electricdrive.org/index.php?ht=d/sp/i/20952/pid/20952. 352 Ibid. 353 U.S. Department of Energy, “Hybrids, Diesels, and Alternative Fuel Vehicles,” fueleconomy.gov, accessed April
19, 2014, http://www.fueleconomy.gov/feg/alternatives.shtml. 354 Electric Drive Transport Association, “Electric Drive Sales Dashboard: Cumulative U.S. Plug-In Vehicle Sales,”
EDTA website, accessed April 18, 2014, http://www.electricdrive.org/index.php?ht=d/sp/i/20952/pid/20952. 355 U.S. Energy Information Administration, “Light-Duty Vehicle Sales by Technology Type, United States,
Reference Case,” AEO2014 Early Release Overview Interactive Table Viewer, accessed April 16,
2014, http://www.eia.gov/oiaf/aeo/tablebrowser/#release=AEO2014ER&subject=15-AEO2014ER&table=48-
AEO2014ER®ion=1-0&cases=ref2014er-d102413a; U.S. Energy Information Administration, “Light-Duty
Vehicle Sales by Technology Type, New England, Reference Case,” AEO2014 Early Release Overview Interactive
Table Viewer, accessed April 16, 2014,
http://www.eia.gov/oiaf/aeo/tablebrowser/#release=AEO2014ER&subject=15-AEO2014ER&table=48-
AEO2014ER®ion=1-1&cases=ref2014er-d102413a; Regional Tables for Middle Atlantic, South Atlantic, and
Pacific reference cases were also used. 356 U.S. Energy Information Administration, “Light-Duty Vehicle Sales by Technology Type, West North Central,
Reference Case,” AEO2014 Early Release Overview Interactive Table Viewer, accessed April 16,
2014, http://www.eia.gov/oiaf/aeo/tablebrowser/#release=AEO2014ER&subject=15-AEO2014ER&table=48-
AEO2014ER®ion=1-4&cases=ref2014er-d102413a; U.S. Energy Information Administration, “Light-Duty
Vehicle Sales by Technology Type, West South Central, Reference Case,” AEO2014 Early Release Overview
Interactive Table Viewer, accessed April 16, 2014,
http://www.eia.gov/oiaf/aeo/tablebrowser/#release=AEO2014ER&subject=15-AEO2014ER&table=48-
AEO2014ER®ion=1-7&cases=ref2014er-d102413a. 357 U.S. Energy Information Administration, “Light-Duty Vehicle Sales by Technology Type, United
States, Reference Case,” AEO2014 Early Release Overview Interactive Table Viewer, accessed April 16,
2014, http://www.eia.gov/oiaf/aeo/tablebrowser/#release=AEO2014ER&subject=15-AEO2014ER&table=48-
AEO2014ER®ion=1-0&cases=ref2014er-d102413a. 358 Ibid.

74
small segment of total vehicles on the road. Interestingly, the composition of vehicles on the
road in 2040 will be predominately gasoline powered internal combustion engine vehicles – with
EIA’s forecast indicating that 78 percent of total vehicles will run on gasoline.359 While it may
seem disappointing to some that gasoline ICE vehicles will maintain such a high share of the
total vehicle market 26 years from now, given the advances in hybrid and electric vehicle
technology, part of the reason for the longevity of gasoline ICE vehicles is attributable to
increased fuel efficiency overtime.
Currently, as shown in Table VII.1, alternative fuel cars – which include all-electric EVs,
plug-in hybrid EVs (PHEV), and HEVs – have greater fuel efficiencies than their conventional
fuel counterparts. Notably, all-electric EVs (100 and 200 mile electric vehicles) have higher fuel
efficiencies – equivalent to 125 to 132 miles per gallon – than their counterparts. In 2040, all-
electric EV fuel efficiencies are expected to increase moderately by 4 percent to 13 percent to
137 to 141 miles per gallon. Another type of plug-in, the PHEV, which currently exhibits fuel
efficiency of 60 to 73 miles per gallon (depending on all-electric range of 10 or 40 miles), is
expected to experience a significant increase in fuel efficiency of 21 percent to 37 percent to 82
to 88 miles per gallon. Conventional HEVs will also experience similar gains, with fuel
efficiencies increasing by 39 percent from 51 miles per gallon to 71 miles per gallon. Notably,
however, gasoline ICE vehicles are expected to experience the largest percentage increase with
fuel efficiencies increasing by 47 percent from 36 miles per gallon to 53 miles per gallon in
2040.360
359 Ibid. 360 U.S. Energy Information Administration, “Light-Duty Vehicle Miles per Gallon by Technology Type, Reference
Case,”AEO2014 Early Release Overview Interactive Table Viewer, accessed April 16,
2014, http://www.eia.gov/oiaf/aeo/tablebrowser/#release=AEO2014ER&subject=15-AEO2014ER&table=50-
AEO2014ER®ion=0-0&cases=full2013-d102312a,ref2014er-d102413a.
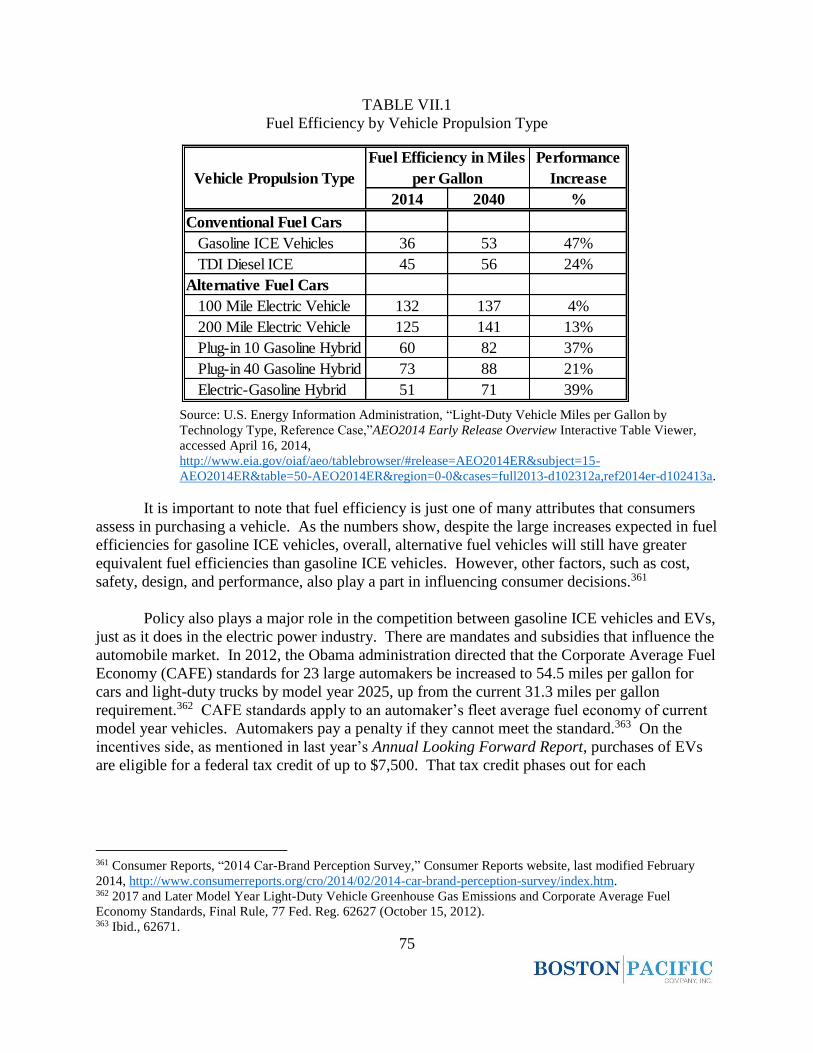
75
TABLE VII.1
Fuel Efficiency by Vehicle Propulsion Type
Source: U.S. Energy Information Administration, “Light-Duty Vehicle Miles per Gallon by
Technology Type, Reference Case,”AEO2014 Early Release Overview Interactive Table Viewer,
accessed April 16, 2014,
http://www.eia.gov/oiaf/aeo/tablebrowser/#release=AEO2014ER&subject=15-
AEO2014ER&table=50-AEO2014ER®ion=0-0&cases=full2013-d102312a,ref2014er-d102413a.
It is important to note that fuel efficiency is just one of many attributes that consumers
assess in purchasing a vehicle. As the numbers show, despite the large increases expected in fuel
efficiencies for gasoline ICE vehicles, overall, alternative fuel vehicles will still have greater
equivalent fuel efficiencies than gasoline ICE vehicles. However, other factors, such as cost,
safety, design, and performance, also play a part in influencing consumer decisions.361
Policy also plays a major role in the competition between gasoline ICE vehicles and EVs,
just as it does in the electric power industry. There are mandates and subsidies that influence the
automobile market. In 2012, the Obama administration directed that the Corporate Average Fuel
Economy (CAFE) standards for 23 large automakers be increased to 54.5 miles per gallon for
cars and light-duty trucks by model year 2025, up from the current 31.3 miles per gallon
requirement.362 CAFE standards apply to an automaker’s fleet average fuel economy of current
model year vehicles. Automakers pay a penalty if they cannot meet the standard.363 On the
incentives side, as mentioned in last year’s Annual Looking Forward Report, purchases of EVs
are eligible for a federal tax credit of up to $7,500. That tax credit phases out for each
361 Consumer Reports, “2014 Car-Brand Perception Survey,” Consumer Reports website, last modified February
2014, http://www.consumerreports.org/cro/2014/02/2014-car-brand-perception-survey/index.htm. 362 2017 and Later Model Year Light-Duty Vehicle Greenhouse Gas Emissions and Corporate Average Fuel
Economy Standards, Final Rule, 77 Fed. Reg. 62627 (October 15, 2012). 363 Ibid., 62671.
Performance
Increase
2014 2040 %
Conventional Fuel Cars
Gasoline ICE Vehicles 36 53 47%
TDI Diesel ICE 45 56 24%
Alternative Fuel Cars
100 Mile Electric Vehicle 132 137 4%
200 Mile Electric Vehicle 125 141 13%
Plug-in 10 Gasoline Hybrid 60 82 37%
Plug-in 40 Gasoline Hybrid 73 88 21%
Electric-Gasoline Hybrid 51 71 39%
Fuel Efficiency in Miles
per GallonVehicle Propulsion Type
76
manufacturer once it sells 200,000 EVs.364 In addition, several states provide similar incentives
for the purchase of EVs.365
Given the favorable policy towards EVs, what is preventing these vehicles from gaining
widespread adoption? The last two Annual Looking Forward Reports pointed to range anxiety
as a key issue for consumers in deciding to buy an EV.366 Range anxiety refers to the concern
that an EV has inadequate range to reach its destination, thus potentially leaving the driver
stranded. Range anxiety is attributable to two factors: battery performance and infrastructure.367
To be clear, range anxiety does not affect all EVs, only all-electric EVs. PHEVs rely on gasoline
for recharging the vehicle’s batteries and propulsion. For all-electric EVs, cases of battery
underperformance and a lack of charging infrastructures have contributed to some the public’s
apprehension to make the switch to EVs.368
Many EVs rely on Li-ion batteries as compared to other battery technologies due to their
superior energy density and faster charging. However, a limitation of lithium-ion is its
susceptibility to “thermal runaway,” which refers to the situation in which a self-contained cell in
a battery experiences overheating and causes the battery to catch fire or even explode.369 Such
occurrences have been documented with EVs – with a Dodge Ram 1500 Plug-in Hybrid and a
Mitsubishi i-MiEV and Outlander P-HEV,370 whose batteries are manufactured by GS Yuasa, the
same company that manufactures batteries for the Boeing 787 Dreamliner, which experienced
similar problems.371
Other battery technologies are being explored for EV use that do not carry the same fire
risks of a Li-ion battery. These alternatives include batteries with different chemistries such as
lithium-sulfur and lithium-air batteries, which could potentially provide, in addition to increased
safety, significantly higher energy densities, meaning more energy per weight. The Lawrence
Berkeley National Laboratory of the DOE has demonstrated a lithium-sulfur battery that has
more than two-times the energy density of a typical Li-ion battery and would cost less to
produce.372 Lithium-air batteries would offer five to 10 times the storage capacity of Li-ion
364 U.S. Department of Energy, “Federal Tax Credits for Electric Vehicles Purchased in or after 2010,”
fueleconomy.gov, accessed April 19, 2014, http://www.fueleconomy.gov/feg/taxevb.shtml. 365 For example, see: U.S. Department of Energy, “Alternative Fuels Data Center: Electricity Laws and Incentives,”
DOE website, accessed April 19, 2014, http://www.afdc.energy.gov/fuels/laws/3270/AZ. 366 For example, see Roach, Ph.D. et al., Southwest Power Pool Annual Looking Forward Report, Boston Pacific
Company, Inc., April 23, 2013, 53. 367 Maria Nilsson, Electric Vehicles: An Interview Study Investigating the Phenomenon of Range Anxiety, ELVIRE
consortium, November 16, 2011, 1. 368 For example, see: John M. Broder, “Stalled on Tesla’s Electric Highway,” New York Times, February 8, 2013. 369 Peter Els, “Is There an Overreaction to EV Safety Concerns?” Automotive iQ: International Quality and
Productivity Center website, last modified October 16, 2013, http://www.automotive-
iq.com/PDFS/Electric_vehicle_safety.pdf. 370 Ibid. 371 Hiroko Tabuchi, “New Problem for Boeing 787 Battery Maker,” New York Times, March 27, 2013. 372 Allan Chen, “Holistic Cell Design by Berkeley Lab Scientists Leads to High-Performance, Long Cycle-Life
Lithium-Sulfur Battery: Battery could find use in mobile applications, and eventually, electric vehicles with 300-
mile range,” Berkeley Lab, Environmental Energy Technologies Division (EETD) website, last modified November
2013, http://eetd.lbl.gov/news/article/57182/holistic-cell-design-by-berkele.

77
batteries.373 DOE’s Advanced Research Projects Agency-Energy program awarded $34 million
in 2010 to fund breakthrough research in automobile batteries – two of the grants went to
companies developing lithium-air battery technology.374 Such advantages, if achievable, could
solve some of the limitations of Li-ion batteries and thereby improve the competitiveness of
EVs. However, these technologies are currently in laboratory research stages and must
overcome several challenges that are preventing commercialization, such as battery life and
reliability.
EVs have many hurdles to overcome in addressing range anxiety, and unless a
breakthrough emerges, gasoline ICE vehicles are expected to remain the vehicle of choice for
most Americans for some time. In addition, HEVs are expected to be a more popular choice
than EVs in coming years. Based on the status of the EV industry, we reaffirm our conclusion
from the 2011 Annual Looking Forward Report that the emergence of EVs is not expected to
have a major impact on SPP in the foreseeable future.375 Our conclusion, we note, at that time,
was based on the assumption of 1 million EVs on the road in the U.S. causing less than a 1
percent increase in electric demand in SPP. Again, according to forecasts from the EIA,
America will not reach that 1 million EV goal until 2021 to 2022.
373 Dexter Johnson, “A Nanoscale Peek at Lithium-air Batteries Promises Better Electric Vehicles,” IEEE Spectrum
website, last modified May 14, 2013http://spectrum.ieee.org/nanoclast/green-tech/advanced-cars/nanoscale-peak-at-
lithiumair-batteries-promise-better-electric-vehicles. 374 Saqib Rahim and Climatewire, “Lithium-Air Batteries Could Rescue Electric Car Drivers from ‘Range Anxiety’”
Scientific American, May 7, 2010. 375 Roach, Ph.D. et al., Southwest Power Pool Annual Looking Forward Report, Boston Pacific Company, Inc.,
April 15, 2011, 35.

78
VIII. An Introduction to Energy Storage
ecently, there has been substantial
discussion on energy storage in the
media, as well as in the investment, utility
and regulatory communities. That discussion indicates
some momentum for energy storage projects. California
is seen to be fertile ground for growth in energy storage,
with the state expected to see $3 billion in contracts for
large-scale energy storage systems according to utility
industry estimates.376 The investment community sees
energy storage technologies progressing from research
and development stages to real projects. An executive
from a Silicon Valley venture capital firm is quoted
saying, “[w]e’re not talking about lab experiments
anymore … [w]e're talking about a real solution to a
growing issue as renewables become a bigger percentage
of everyone's grid.”377
Among the competition in storage technology,
current research and utility activity indicates that
batteries will be the chosen device for grid-scale energy
storage implementation. An industry executive is quoted as saying that, "[b]attery technology is
probably going to be the immediate, short-run leader.”378 The momentum around batteries was
highlighted in late February 2014 as Tesla’s stock jumped 14 percent in response to plans for its
own battery factory – batteries that are planned to be used in its cars and on the grid.379
Additionally, the president of AES, a major power company and the biggest operator of
electricity-storage systems, stated that the company is seeking to sell scalable battery storage
systems that can be sized as large as 500 MW and can compete with conventional power
plants.380
With this new, emerging momentum, we thought it might be helpful to present an
overview of energy storage, covering formative policy, leading technologies, and the range of
applications that energy storage may fill. This primer may be beneficial if the board begins to
see proposals for storage especially in the context of SPP’s new ancillary services markets.
376 Sweet and Smith, “For Storing Electricity, Utilities Push New Technologies,” Wall Street Journal, February 27,
2014. 377 Ibid. 378 Ibid. 379 Mike Ramsey, “Tesla’s Battery Ambitions Gets Stock Jumping,” Wall Street Journal, February 25, 2014. 380 Jim Polson, “AES Seeks to Replace Gas Power Plants With Big Batteries,” Bloomberg website, last modified
March 6, 2014, http://www.bloomberg.com/news/2014-03-06/aes-seeks-to-replace-gas-power-plants-with-big-
batteries.html.
R
79
A. Formative Policy
Several policy actions by FERC and by the state of California over the past few years are
propelling energy storage forward. First, FERC issued three orders that created new
opportunities for grid energy storage: Order No. 755 in 2011 and Order Nos. 784 and 792 in
2013.381 These three FERC orders should help energy storage better compete with conventional
generation as a grid resource. Order No. 755 requires transmission providers to increase
payments to resources that provide fast and accurate frequency response service, one of energy
storage’s primary advantages over conventional resources.382 Order No. 784 requires
transmission providers to add to its Open Access Transmission Tariff that it will take into
account the speed and accuracy of regulation resources in its determination of reserve
requirements for Regulation and Frequency Response service.383 Order No. 792 allows energy
storage to be considered generation and thus be subject to the small generator interconnection
protocols of FERC’s pro forma tariff.384 Each of these FERC actions lowers barriers to energy
storage participation in wholesale electricity markets.
The second important policy action is California’s energy storage mandate, adopted on
October 17, 2013, that requires its three major regulated utilities to have a combined 1,325 MW
of grid energy storage procured by 2020 – the first such mandate in the nation.385 California’s
mandate for energy storage establishes an immediate market for grid energy storage applications
that will help support investment of new projects. The mandate is guided by three overarching
objectives: “1) [t]he optimization of the grid, including peak reduction, contribution to reliability
needs, or deferment of transmission and distribution upgrade investments; 2) the integration of
renewable energy; and 3) [t]he reduction of greenhouse gas emissions to 80 percent below 1990
levels by 2050, per California goals [citation omitted].”386 The three largest California investor-
owned utilities, Pacific Gas & Electric Company, Southern California Edison, and San Diego
Gas & Electric, are required to procure a cumulative total of 200 MW of energy storage in 2014.
The procurement targets increase biennially thereafter to achieve the 1,325 MW target by
2020.387 For each biennial procurement, the three utilities must also meet targets for different
grid interconnection points – transmission, distribution, or at the customer site.388
381 See: Frequency Regulation Compensation in the Organized Wholesale Power Markets, Order No. 755, 137
FERC ¶ 61,604 (October 20, 2011); Third-Party Provision of Ancillary Services; Accounting and Financial
Reporting for New Electric Storage Technologies, Order No. 784, 144 FERC ¶ 61,056 (July 18, 2013); Small
Generator Interconnection Agreements and Procedures, Order No. 792, 145 FERC ¶ 61,159 (November 22, 2013). 382 Frequency Regulation Compensation in the Organized Wholesale Power Markets, Order No. 755, 137 FERC ¶
61,604 (October 20, 2011), 1-2. 383 Third-Party Provision of Ancillary Services; Accounting and Financial Reporting for New Electric Storage
Technologies, Order No. 784, 144 FERC ¶ 61,056 (July 18, 2013), 1-2. 384 Small Generator Interconnection Agreements and Procedures, Order No. 792, 145 FERC ¶ 61,159 (November
22, 2013), 1-2. 385 Decision Adopting Energy Storage Procurement Framework and Design Program, Order Instituting Rulemaking
Pursuant to Assembly Bill 2514 to Consider the Adoption of Procurement Targets for Viable and Cost-Effective
Energy Storage Systems, Decision 13-10-040 (October 17, 2013), 2. 386 Ibid., 9-10. 387 Ibid., p. 15, table 2. 388 Ibid., pp. 11-14, table 1.
80
B. Energy Storage Technologies
The following section presents a brief overview of the leading types of energy storage
technologies.
1. Pumped Hydro
Pumped hydro is evidence that grid energy storage is not a new concept. The earliest
pumped hydro storage plant was built in the 1920s.389 Pumped hydro works by using off-peak
electricity to pump water from a lower reservoir up to a higher reservoir. Such reservoirs may be
naturally occurring lakes or rivers or manmade basins. During a peak demand period, the water
is released when deemed necessary and allowed to flow back through a hydroelectric turbine into
the lower reservoir, generating electricity. That is, pumped hydro is generally used to provide
electric energy time-shifting services or “arbitrage.”
Pumped hydro systems are the most mature of all energy storage system technologies.390
Globally, pumped hydro is by far the most widely used energy storage technology today, as
shown in Figure VIII.1. Because of the nature of these systems, pumped hydro can be
practically sized up to 4,000 MW391 and is one of the few technologies available today that can
reliably provide bulk energy services.392 These services include arbitrage and the supply of
electric capacity, which require higher power output and the ability to sustain longer discharges
of energy.393 The largest currently operating pumped hydro storage plant in the world is the Bath
County Pumped Storage Station in Virginia with a nameplate capacity of 3,030 MW.394
389 Abbas A. Akhil et al., DOE/EPRI 2013 Electricity Storage Handbook in Collaboration with NRECA, Sandia
National Laboratories, July 2013, 33. 390 Ibid., xxx. 391 Ibid., 33. 392 Ibid., 38. 393 For example, see: Akhil et al., DOE/EPRI 2013 Electricity Storage Handbook in Collaboration with NRECA,
Sandia National Laboratories, July 2013, p. 29, figure 19. 394 U.S. Department of Energy, “Projects,” DOE Energy Storage Database, accessed April 19, 2014,
http://www.energystorageexchange.org/projects.
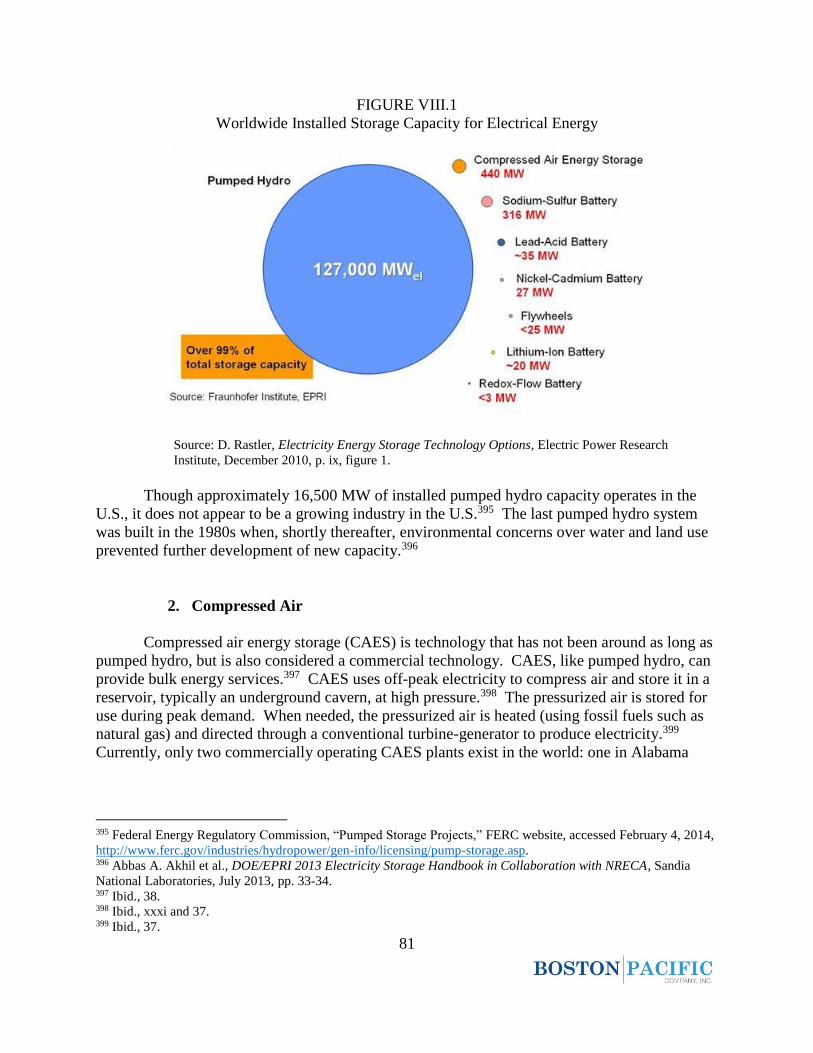
81
FIGURE VIII.1
Worldwide Installed Storage Capacity for Electrical Energy
Source: D. Rastler, Electricity Energy Storage Technology Options, Electric Power Research
Institute, December 2010, p. ix, figure 1.
Though approximately 16,500 MW of installed pumped hydro capacity operates in the
U.S., it does not appear to be a growing industry in the U.S.395 The last pumped hydro system
was built in the 1980s when, shortly thereafter, environmental concerns over water and land use
prevented further development of new capacity.396
2. Compressed Air
Compressed air energy storage (CAES) is technology that has not been around as long as
pumped hydro, but is also considered a commercial technology. CAES, like pumped hydro, can
provide bulk energy services.397 CAES uses off-peak electricity to compress air and store it in a
reservoir, typically an underground cavern, at high pressure.398 The pressurized air is stored for
use during peak demand. When needed, the pressurized air is heated (using fossil fuels such as
natural gas) and directed through a conventional turbine-generator to produce electricity.399
Currently, only two commercially operating CAES plants exist in the world: one in Alabama
395 Federal Energy Regulatory Commission, “Pumped Storage Projects,” FERC website, accessed February 4, 2014,
http://www.ferc.gov/industries/hydropower/gen-info/licensing/pump-storage.asp. 396 Abbas A. Akhil et al., DOE/EPRI 2013 Electricity Storage Handbook in Collaboration with NRECA, Sandia
National Laboratories, July 2013, pp. 33-34. 397 Ibid., 38. 398 Ibid., xxxi and 37. 399 Ibid., 37.
82
with a 110 MW capacity and the other in Germany with a 321 MW capacity.400 The plant in
Alabama has the higher efficiency – it can deliver 1 kWh of on-peak electricity using 0.69 kWh
of off-peak electricity and 1.17-kWh-equivalent of natural gas.401 Similar to pumped hydro,
development of CAES currently relies on natural infrastructure – the presence of underground
reservoirs, such as salt caverns. A number of advanced CAES systems, including systems that
use more advanced machinery and processes to increase performance efficiency and do not
require natural reservoirs, 402 are currently under development.403
3. Batteries
Unlike pumped hydro and CAES, battery energy storage systems are more flexible
because they are not dependent on the limited number of sites with the required natural
infrastructure. This means that they can be built where they are most needed, regardless of
whether there are specific geographical features present. Most battery energy storage systems
are modular and scalable such that they can be built to meet the requirements of specific
applications.404 Battery energy storage systems also have advantageous performance
characteristics such as fast response times and ramp rates that can be used to provide certain
ancillary services that conventional generation units cannot.405
A range of battery energy storage technologies is available for grid energy storage.
These technologies are distinguished by the material composition of the battery. For example, a
Li-ion battery denotes that an electrode of the battery’s cells are constructed from a lithium
compound.406 Some of the leading battery technologies that are currently available for grid
energy storage include sodium sulfur (NaS), Li-ion, and lead-acid batteries.407 NaS batteries are
considered a commercial energy storage technology and, due to their long discharge period of
four to seven hours, can be used in several grid applications such as bulk energy and
transmission and distribution infrastructure services.408 Also, because of their fast response
400 U.S. Department of Energy, “Projects,” DOE Energy Storage Database, accessed April 19, 2014,
http://www.energystorageexchange.org/projects. See, also, Akhil et al., DOE/EPRI 2013 Electricity Storage
Handbook in Collaboration with NRECA, Sandia National Laboratories, July 2013, 38. 401 BINE Informationsdienst, Compressed air energy storage power plants, 2,
http://www.bine.info/fileadmin/content/Publikationen/Englische_Infos/projekt_0507_engl_internetx.pdf. 402 For example, see, LightSail Energy, “We Store Energy in Compressed Air,” LightSail website, accessed April
20, 2014, http://www.lightsail.com/. 403 For example, see: RWE, “ADELE – Adiabatic compressed-air energy storage (CAES) for electricity supply,”
RWE website, accessed April 19, 2014, https://www.rwe.com/web/cms/en/365478/rwe/innovation/projects-
technologies/energy-storage/project-adele-adele-ing/; see, also, U.S. Department of Energy, “Projects,” DOE Energy
Storage Database, accessed April 19, 2014, http://www.energystorageexchange.org/projects. 404 Akhil et al., DOE/EPRI 2013 Electricity Storage Handbook in Collaboration with NRECA, July 2013, 126. 405 Ibid., 6. 406 Ibid., 96 and p. 97, figure 94. 407 U.S. Department of Energy, Grid Energy Storage, December 2013, 17. 408 Electric Power Research Institute, Electricity Energy Storage Technology Options, December 2010, xxiii-xxiv,
table 4. See, also, International Renewable Energy Agency and International Energy Agency, Electricity Storage:
Technology Brief, April 2012, p. 15, table 1.
83
times, NaS batteries can respond to grid signals for regulation services.409 However, because of
their chemistry, one drawback of NaS batteries is that they operate at high temperatures (300 degrees Celsius to 350 degrees Celsius) and are also combustible if exposed to water.410
Therefore, they must be confined in airtight, double-walled, stainless-steel enclosures.411 NaS
batteries have been deployed mainly in Japan and the U.S. The largest operating project is the
Rokkasho Village Wind Farm in Japan, which has a rated capacity of 34 MW and is integrated
with the wind farm to provide output firming and time shifting services.412 The operating
projects in the U.S. are smaller and range from 1 to 4 MW.413 Currently, all operating NaS
batteries in the world are manufactured by NGK Insulators, a Japanese company.414
Li-ion technology is already a mature technology for batteries of consumer electronics
and is established as a leading battery technology for electric vehicles.415 However, Li-ion is
also emerging as the fastest growing technology for battery grid energy storage.416 The chemical
nature of Li-ion batteries means it is best suited for short discharge operations, such as frequency
regulation or power quality services.417 Many currently deployed Li-ion battery projects are in
“early field trials to gain experience in siting, grid integration, and operation.”418 In the U.S.,
there are 28 currently operating projects, the largest of which is a 64 MW facility that is owned
and operated by AES.419 The battery system is integrated into AES’s Laurel Mountain wind
farm in West Virginia for the primary purpose of providing frequency regulation services.420
The lead-acid battery was invented in the mid-1800s, and is the oldest type of
rechargeable battery.421 This mature technology is relatively cheap to manufacture and has good
409 Akhil et al., DOE/EPRI 2013 Electricity Storage Handbook in Collaboration witRECA, Sandia National
Laboratories, July 2013, 42. 410 Ibid., 42-43. 411 Ibid., 43. 412 U.S. Department of Energy, “Projects,” DOE Energy Storage Database, accessed April 19, 2014,
http://www.energystorageexchange.org/projects. See, also, CleanEnergy Action Project, “Rokkasho-Futamata Wind
Farm: Case Study,” CleanEnergy Action Project website, accessed April 19, 2014,
http://www.cleanenergyactionproject.com/CleanEnergyActionProject/CS.Rokkasho-
Futamata_Wind_Farm___Energy_Storage_Case_Study.html. 413 U.S. Department of Energy, “Projects,” DOE Energy Storage Database, accessed April 19, 2014,
http://www.energystorageexchange.org/projects. 414 Ibid. 415 Akhil et al., DOE/EPRI 2013 Electricity Storage Handbook in Collaboration with NRECA, Sandia National
Laboratories, July 2013, 96. 416 Ibid. 417 Electric Power Research Institute, Electricity Energy Storage Technology Options, December 2010, pp. xxiii-
xxiv, table 4, p. 4-17, table 4-11. See, also, International Renewable Energy Agency and International Energy
Agency, Electricity Storage Technology Brief, April 2012, p. 16, figure 3. 418 Akhil et al., DOE/EPRI 2013 Electricity Storage Handbook in Collaboration with NRECA, Sandia National
Laboratories, July 2013, 98. 419 Polson, “AES Seeks to Replace Gas Power Plants With Big Batteries,” Bloomberg website, last modified March
6, 2014, http://www.bloomberg.com/news/2014-03-06/aes-seeks-to-replace-gas-power-plants-with-big-
batteries.html. See also, U.S. Department of Energy, “Projects,” DOE Energy Storage Database, accessed April 19,
2014, http://www.energystorageexchange.org/projects. 420 Ibid. 421 Akhil et al., DOE/EPRI 2013 Electricity Storage Handbook in Collaboration with NRECA, Sandia National
Laboratories, July 2013, 75.
84
battery life. However, it suffers from having a low energy density, which means that, on a per
weight basis, it does not deliver as much energy as other battery technologies.422 While the lead-
acid battery is a mature technology, improvements have been made to the technology to make it
more robust for grid energy storage applications. Performance-enhanced variants of the standard
lead-acid technology include lead-acid carbon and advanced lead-acid batteries.423 These
specialized lead-acid batteries, among other improvements, allow for faster recharge rates, faster
response times, and minimal required maintenance.424 While there are a number of lead-acid
type energy storage systems currently operating, most of them have capacities below 1 MW.
The few systems with capacities greater than 1 MW use advanced lead-acid technology.425
Among those systems, the largest project is a 36 MW demonstration energy storage system at a
wind farm site in Texas that is owned and operated by Duke Energy.426
4. Flywheel
A non-battery energy storage system that is also known for its fast response and ramp
rates is flywheel energy storage.427 Flywheel energy storage is a mechanical energy storage
technology like pumped hydro and CAES, but it works much differently than those systems and
does not rely on natural infrastructure. Flywheel energy storage is a unique technology in that it
stores energy in the form of, in simplistic terms, a “spinning wheel,” called a rotor.428 To
understand how a flywheel works, it is helpful to know how electric generators and motors work.
In general, a generator converts rotational mechanical movement into electric energy and, vice-
versa, a motor converts electric energy into rotational mechanical movement through
electromagnetic principles. A flywheel is charged by taking electricity from the grid and
converting it to mechanical energy by an electric motor. The electric motor accelerates a
spinning wheel or rotor to store the energy. To make the storage of energy more efficient, the
rotor is typically suspended by magnetic bearings and housed in a vacuumed chamber to reduce
friction and air resistance, thereby maintaining a high level of inertia.429 When discharging, the
mechanical energy from the spinning rotor powers the generator to produce electricity.430 Thus,
in a flywheel energy system, the motor and generator are integrated as one device.
422 U.S. Department of Energy, Grid Energy Storage, December 2013, 18. 423 Akhil et al., DOE/EPRI 2013 Electricity Storage Handbook in Collaboration with NRECA, Sandia National
Laboratories, July 2013, 75-76. 424 Ibid., 76. 425 U.S. Department of Energy, “Projects,” DOE Energy Storage Database, accessed April 19, 2014,
http://www.energystorageexchange.org/projects. 426 Ibid. 427 Akhil et al., DOE/EPRI 2013 Electricity Storage Handbook in Collaboration with NRECA, Sandia National
Laboratories, July 2013, pp. 6, 14. 428 Ibid., 89. 429 International Renewable Energy Agency and International Energy Agency, Electricity Storage Technology Brief,
April 2012, 9. 430 Ibid.
85
Because of its design, flywheel energy storage systems are modular and scalable.431 The
capabilities of flywheel energy storage resembles more of that of a battery with the ability to
discharge and recharge in a matter of seconds, making it suitable for providing frequency
regulation.432 In the U.S., there are currently two commercial operating flywheel energy storage
systems greater than 1 MW – a 20 MW facility in New York and a 6 MW facility in
Pennsylvania.433 These systems provide frequency regulation services to New York ISO and
PJM, respectively.434
5. Quick Performance Comparison
Table VIII.1 compares some characteristics of the different energy storage technologies
discussed in the previous sections. It is important to note that, because many of these
technologies are new, estimates of cost and performance are wide ranging and are not necessarily
comparable across sources. Therefore, Table VIII.1 focuses on key data that indicate the
different roles and capabilities of each technology. For example, the second column shows that
the largest operating projects using pumped hydro and CAES technologies are over 100 MW,
indicating that these technologies can participate in bulk energy services. On the other hand, the
third column shows that the Li-ion and lead-acid batteries and flywheel systems have shorter
discharge times,435 indicating that these technologies are more suited for ancillary services.
Roundtrip efficiency, listed in column four, is a measure of the ratio of the electric output of an
energy storage system to the input required to restore it to the initial state of charge. The
roundtrip efficiency is an important metric for energy storage systems because it will impact a
project’s operating profitability – the fewer the kWh produced per kWh purchased, the lower the
profit margin. The technologies listed in the table all have roundtrip efficiencies greater than 70
percent. Note that these figures do not reflect the kWh lost in the generation of off-peak power
to charge these storage systems. Lastly, as shown in the table, pumped hydro and CAES, which
are more capital intensive than their battery and flywheel counterparts, have much longer plant
lives, at 60 and 40 years, respectively, versus 15 years for the other energy storage technologies.
431 Akhil et al., DOE/EPRI 2013 Electricity Storage Handbook in Collaboration with NRECA, Sandia National
Laboratories, July 2013, 92. 432 Ibid., 91-92. 433 U.S. Department of Energy, “Projects,” DOE Energy Storage Database, accessed April 19, 2014,
http://www.energystorageexchange.org/projects. 434 Ibid. 435 The discharge time of an energy storage system is how long it can discharge at a specific level of power output.

86
TABLE VIII.1
Key Performance Statistics of Energy Storage Technologies
Source: U.S. Department of Energy, “Projects,” DOE Energy Storage Database, accessed April 19, 2014,
http://www.energystorageexchange.org/projects; Polson, “AES Seeks to Replace Gas Power Plants With Big
Batteries,” Bloomberg website, last modified March 6, 2014, http://www.bloomberg.com/news/2014-03-06/aes-
seeks-to-replace-gas-power-plants-with-big-batteries.html; Electric Power Research Institute, Electricity Energy
Storage Technology Options, December 2010, pp. xxiii-xxiv, tables 4-5; International Renewable Energy Agency
and International Energy Agency, Electricity Storage Technology Brief, April 2012, 15, table 1; Akhil et al.,
DOE/EPRI 2013 Electricity Storage Handbook in Collaboration with NRECA, Sandia National Laboratories, July
2013, appendix b.
C. Energy Storage Applications
An energy storage technology’s performance characteristics determine the technology’s
compatibility for a particular grid application. The DOE and the EPRI released the 2013
Electricity Storage Handbook on grid energy storage in July 2013, which provides an overview
of the range of technologies available for energy storage and their applications.436 Figure VIII.2
lists five major grid application categories for energy storage with various services listed under
each category.
436 Akhil et al., DOE/EPRI 2013 Electricity Storage Handbook in Collaboration with NRECA, Sandia National
Laboratories, July 2013.
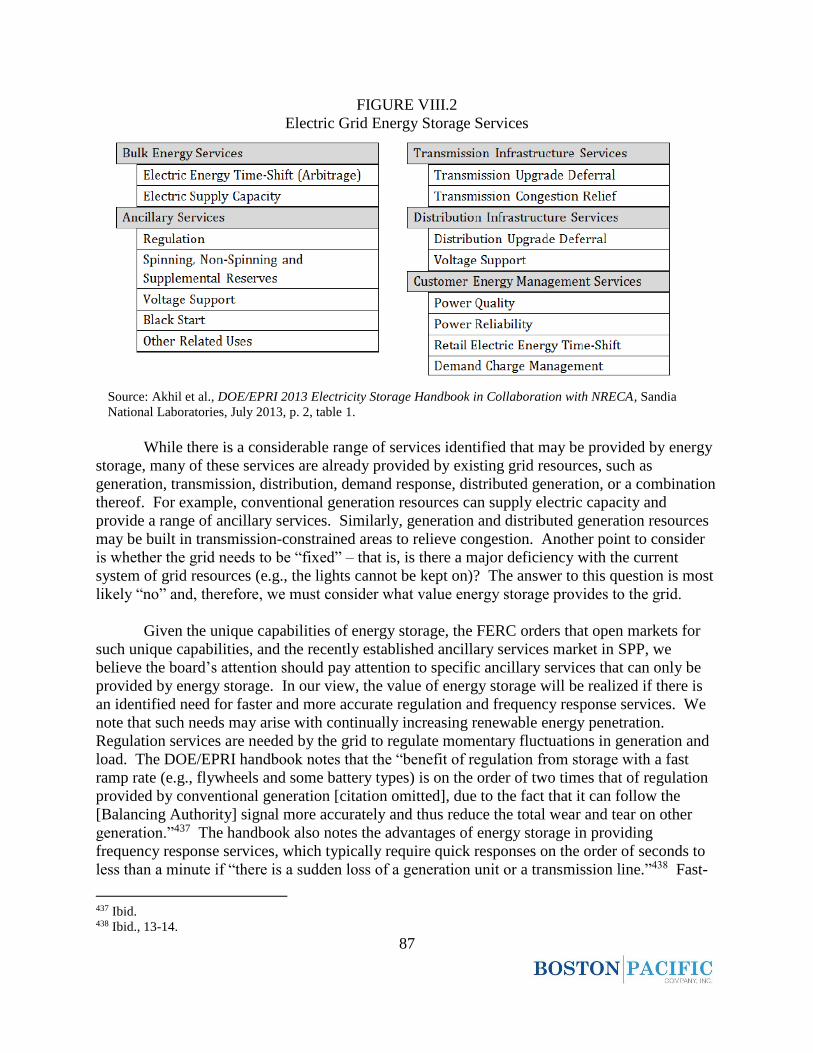
87
FIGURE VIII.2
Electric Grid Energy Storage Services
Source: Akhil et al., DOE/EPRI 2013 Electricity Storage Handbook in Collaboration with NRECA, Sandia
National Laboratories, July 2013, p. 2, table 1.
While there is a considerable range of services identified that may be provided by energy
storage, many of these services are already provided by existing grid resources, such as
generation, transmission, distribution, demand response, distributed generation, or a combination
thereof. For example, conventional generation resources can supply electric capacity and
provide a range of ancillary services. Similarly, generation and distributed generation resources
may be built in transmission-constrained areas to relieve congestion. Another point to consider
is whether the grid needs to be “fixed” – that is, is there a major deficiency with the current
system of grid resources (e.g., the lights cannot be kept on)? The answer to this question is most
likely “no” and, therefore, we must consider what value energy storage provides to the grid.
Given the unique capabilities of energy storage, the FERC orders that open markets for
such unique capabilities, and the recently established ancillary services market in SPP, we
believe the board’s attention should pay attention to specific ancillary services that can only be
provided by energy storage. In our view, the value of energy storage will be realized if there is
an identified need for faster and more accurate regulation and frequency response services. We
note that such needs may arise with continually increasing renewable energy penetration.
Regulation services are needed by the grid to regulate momentary fluctuations in generation and
load. The DOE/EPRI handbook notes that the “benefit of regulation from storage with a fast
ramp rate (e.g., flywheels and some battery types) is on the order of two times that of regulation
provided by conventional generation [citation omitted], due to the fact that it can follow the
[Balancing Authority] signal more accurately and thus reduce the total wear and tear on other
generation.”437 The handbook also notes the advantages of energy storage in providing
frequency response services, which typically require quick responses on the order of seconds to
less than a minute if “there is a sudden loss of a generation unit or a transmission line.”438 Fast-
437 Ibid. 438 Ibid., 13-14.

88
acting storage, such as flywheels and batteries, is twice more effective in stabilizing frequency
than conventional fossil-fueled generators.439
While advances continue to be made in energy storage technologies, it is still too early to
tell how competitive energy storage will be compared to existing grid resources. There is still
much uncertainty that remains regarding its need, costs, and benefits.
439 Ibid., 15.

89
IX. Anticipating New Science and
Technology
ost can agree that long-term strategic planning for the electricity business must
anticipate the potential for new science and new (often-disruptive) science and
technology to emerge. To wit, most of the topics addressed in this report
involve new technologies that have or may have major impacts on the electricity market, in
general, and on SPP Markets, in particular. However, most can also agree that the standard
quantitative models do not do a good job at anticipating new technology. The best (or worst)
example is the failure of those models to predict the shale gas revolution. A more qualitative, yet
disciplined approach is needed.
To start our discussion about such a qualitative approach, it is a good idea to step back
and give some historical perspective on the forces driving new technology in the electricity
business. Historians make at least two important, broad points. First, new technology does not
arrive unexpectedly, which gives some hope that new technology can be anticipated. Second,
new technology is not all (or even primarily) about science and engineering because government
policy, law, economics, business strategy, and culture all collude to shape an industry, which
shows how complex it is to anticipate new technology. Hughes makes these points in his
authoritative book titled Networks of Power: Electrification in Western Society 1880 -1930.440
As to technology not arriving unexpectedly, Hughes states, “[t]he evolving power systems were
440 Thomas P. Hughes, Networks of Power: Electrification in Western Society, 1880-1930 (Baltimore: The John
Hopkins University Press, 1983).
M
90
not, metaphorically speaking, driverless vehicles carrying society to destinations unknown and
perhaps undesired.”441 As to multiple influences, he states, “[t]echnological affairs contain a rich
texture of technical matters, scientific laws, economic principles, political forces, and social
concerns. The historian must take the broad perspective to get to the root of things and to see the
patterns.”442
Hirsch makes a similar point on multiple forces in his noted work on more recent times in
Technology and Transformation in the American Electric Utility Industry.443 Hirsch concludes
that the industry needs “managers who can rerationalize the industry by comprehending
technological barriers, social concerns, political realities, economic forces, and –perhaps most
importantly – their own history.”444 Constructively, Hirsch warns about making presumptions
about the future. For example, he warns that, “progress does not continue forever.”445 His
specific point is that utility managers in the 1980s presumed economies of scale would continue
to drive electricity prices down when, by his reckoning, those economies had been exhausted by
the 1960s in terms of both fuel efficiency gains and increased size of power plants.446 To the
original point here, he emphasizes “the difficulty of projecting accurately the direction and
magnitude of future technological change.”447
To understand this more qualitative approach to anticipating the future, it is crucial to
weave the story to include all of the many factors that drive change: science, engineering, law,
politics, government policy, economics and culture. At the heart of this qualitative approach is
what can be termed “strategic storytelling,” a concept that encompasses these drivers. Rather
than define this approach in the abstract, this section jumps right to apply to it three varied
technologies or policies. In the first application, parallels are sought between (a) a historical
story about the early development of nuclear power, and (b) a strategic story about the future of
wind power. In the second application, a strategic story leading to a new policy calling for a
“carbon tax swap” is told. In the third application, the possibility of a new, more successful
technology for nuclear power is presented.
A. Parallels Between Nuclear and Wind Policy
1. Nuclear: A Historical Strategic Story
The purpose of this historical story about nuclear power is to train the eye to see what
drives the fortunes of a major new technology for the electricity business. More broadly, it trains
us to find the point at which thinking about the future might actually begin and it forewarns that
the story changes over time.
441 Ibid., 462. 442 Ibid., 1. 443 Richard F. Hirsch, Technology and Transformation in the American Electric Utility Industry (Cambridge:
Cambridge University Press, 1989). 444 Ibid., xi. 445 Ibid., x. 446 Ibid., p. 4, figure 1 and p. 5, figure 2. 447 Ibid., xi.
91
The broad outline of the strategic story for nuclear power goes back more than 100 years
to 1905 with Einstein’s famous equation E=MC2, which states that energy equals mass times the
speed of light squared. This, ultimately, is the science behind converting a small amount of mass
in the form of uranium fuel into massive amounts of energy used to create steam in a nuclear
power plant. Obviously, a strategic planner in that day would have been hard-pressed to
anticipate this science, let alone the emergence of nuclear power 50 years later. This part of the
story alone reveals that the electricity business is built on amazing science and that the potential
for new science should never be forgotten.
Fast forward to more amazing science and technology with the development of nuclear
weapons through the Manhattan Project, again, based on E=MC2. What drove the breakthrough
with atomic weapons was the urgent need to develop nuclear weapons. At this point, again, a
strategic planner would have been unlikely to anticipate nuclear power – at minimum because
the details of nuclear weapons remained secret.
Finally, President Eisenhower’s “Atoms for Peace” speech in which he promoted the
peaceful uses of this amazing science was driven by the need to win the Cold War. Successful
nuclear power, it was thought, would prove the technological prowess of capitalism as compared
to communism. Related to that was the plan that America also would sell its nuclear science and
technology to the world resulting in great commercial success.448 It is at this point a strategic
planner might begin anticipating the impact of the new science and technology on the future of
the electricity business.
To continue with the historical story in greatly condensed form, in the 1960s and 1970s
the development of nuclear power plants surged, but then cost overruns and poor performance
undermined the industry. A significant number of orders for new nuclear power plants were
cancelled.449 Hirsch suggests the mistake by business managers was to think that nuclear power
was “simply another, more cost effective way to boil water.”450 Specifically, it was thought that
larger-scale nuclear power would benefit from the same economies of scale that pushed prices
down with fossil fuels. Historians understand that the widely publicized accidents at Three Mile
Island in 1979 and Chernobyl in 1986 undermined confidence in the safety of nuclear power, but
many believe nuclear power declined primarily because of its high cost even before these
accidents.451 Again, in the context of strategic planning, these failings of business strategy had
some chance of being detected early on. For example, if Hirsch is correct, the presumption that
nuclear power would be like fossil plants could have been challenged, and, likewise, the
presumption of never-ending economies of scale could have been assessed. Finally, it is clear
that nuclear power enjoyed significant government subsidies. The subsidies came from the U.S.
448 Gordon Dean, “Atoms for Peace: An American View,” International Journal 9, no. 4 (Fall 1954): 258-259. 449 Steve Cohn, “The Political Economy of Nuclear Power (1945-1990): The Rise and Fall of an Official
Technology,” Journal of Economic Issues 24, no. 3 (Sept. 1990): 800. 450 Hirsch, Technology and Transformation in the American Electric Utility, (Cambridge: Cambridge University
Press, 1989), 179. 451 Charles Komanoff, Power Plant Cost Escalation: Nuclear and Capital Costs, Regulation, and Economics (New
York: Van Nostrand Reinholdt Publishing, 1981), 16-17, 20.

92
Navy and the Atomic Energy Commission early on, and later from the big power equipment
manufacturers General Electric and Westinghouse.452
In summary, there are four points to make based on the story of the early development of
nuclear power. One, a strategic story, as expected, helps to capture the wide range of factors
driving nuclear power science and technology. The earliest parts of that story concerning
science, however, would have been difficult, if not impossible, to anticipate for a strategic plan
for nuclear development – especially with much of the worked market “secret” in the 1940s.
Two, by the 1950s, an overarching goal was a quite important driver for nuclear power; winning
the Cold War was that goal with the concomitant goal of selling America’s nuclear know-how to
the world. Three, government policy for nuclear power was supportive with substantial
subsidies paid. Four, consistent with its original overarching goal – to prove the technological
prowess of capitalism and to sell American technology to the world – nuclear power ultimately
had to face a commercial test; that is, be an economically viable energy source independent of
subsidies. Nuclear power, according to conventional wisdom, failed that test in the 1970s and
1980s. However, despite this talk of failure, it is important to remember that nuclear power
today still provides upwards of 20 percent of all the electricity generated in America. Moreover,
as will be discussed later, some see a new story emerging for nuclear power.
2. Possible Parallels with Wind
It is useful to take these four elements of the historical, strategic story for nuclear power
and look for parallels going forward with renewable technologies. Wind, for example, shares
parallels with the nuclear strategic story. First, as with nuclear power, a strategic story helps to
capture the full range of drivers for wind power. It is unlikely that wind power is as deeply
rooted in science as nuclear power, especially not the science marked secret for national security
reasons. Still, impressive technological gains have been and will be key to wind power’s future.
A broad range of drivers dictate the direction of wind power technology and a strategic story
helps to capture those drivers.
Second, as with nuclear power, there is an overarching goal – wind power and other
renewables mean to address concerns about global climate change. Related to that is the goal of
creating “green energy jobs” in America by being the first to develop new technologies and to
sell them to the world. Third, again, as with nuclear power, supportive government policy is a
major driver. State government mandates in the form of RPS and federal money in the form of
tax incentives are substantial drivers.
Fourth, like nuclear power, wind power must face a commercial test; that is, be an
economically viable energy source independent of subsidies. This is the part of the strategic
story that is yet to be fully scripted. Wind must prove to be a cost effective solution to global
climate change if it is to constitute an important share of the investment by the U.S. to this
end. The difficulty of passing this test, however, depends on the nature of the U.S. policy toward
452 Navigant Consulting, Inc., Assessment of the Nuclear Power Industry-Final Report, June 2013, 19, 24.
93
global climate change. There is an important fork in the road on U.S. policy. If the policy is to
reduce greenhouse gas emissions sufficiently to prevent climate change, the competing solutions
could be quite costly. In contrast, if U.S. policy is to adapt to climate change, the competing
costs could be lower. Thus, the strategic storyteller must ask first whether there will be a
commercial test and then discern the nature or methodology of that test. In this case, the
permanent elimination of the federal production tax credit would suggest that test for wind has
begun.
As to the success of passing the commercial test, there are at least two major differences
for wind power as compared to nuclear power. One is that wind cannot achieve the reliability
and capacity factor of nuclear generation, which limits wind power’s potential impact. An
important second difference is that competitive markets, like those in SPP, and state competitive
procurements for wind (and other renewables) already serve as a preliminary commercial test on
these technologies, which was not there for nuclear power in the early years. That commercial
test has promoted decreases in the price for and increases in the performance of wind power
technologies over time. Thus, wind and other renewable technologies have already faced part of
their commercial test, and that can help these technologies eventually to survive without
government subsidies.
B. A Carbon Tax Swap: Policy Choice Driving Technology
1. Teeing up a Tax Swap
The purpose of this section is to tee up an example of a strategic question for the board
concerning public policy. The question is this: Will the federal government make a fundamental
change in the policies it uses to address concerns about global climate change by switching from
technology-specific subsidies to an economy-wide carbon tax? Again, a strategic story is a good
tool to address the question because the drivers would be so diverse. As explained herein, a tax
swap would be plausible only with political compromise that includes a tax on carbon to address
global climate change and the use of the revenue from that tax to reduce income tax rates –
obviously two interests on opposite sides of the aisle in Congress.
Right now, the federal government’s policy tools of choice to address global climate
change include EPA’s campaign on coal, tax incentives for specific power technologies, notably
wind and solar, project loan guarantees for new nuclear plants,453 and subsidies for clean coal
plants.454 The change assessed here would be to switch to the use of an economy-wide carbon
tax to provide a general incentive to reduce CO2 and other greenhouse gas emissions. Since
passing a carbon tax would require a significant political compromise, it makes sense to discuss
453 See, for example, U.S. Department of Energy Office of Nuclear Energy “Obama Administration Announces
Loan Guarantees to Construct New Nuclear Power Reactors in Georgia,” DOE website, last modified February 16,
2010, http://www.energy.gov/ne/articles/obama-administration-announces-loan-guarantees-construct-new-nuclear. 454 See, for example, Carbon Capture & Sequestration Technologies at MIT, “Taylorville Energy Center Fact Sheet:
Carbon Dioxide Capture and Storage,” MIT website, last modified December 4, 2013,
http://sequestration.mit.edu/tools/projects/taylorville.html.
94
the carbon tax in the context of a “tax swap.” That is, revenue from the carbon tax would fund
tax reform, thereby lowering the marginal tax rates for corporate and personal income taxes. In
this sense, a carbon tax replaces – or is “swapped for” – taxes on income. The compromise is
clear. Those with major concerns about climate change get the tax on carbon to address those
concerns. Those who may have less (or little) concern with climate change, get the tax reform
that addresses their concerns about economic growth.
Another part of the necessary political compromise might be a “policy sweep.” That is,
the carbon tax would not be just an addition, but would be the replacement for – that is, it would
“sweep away” – the other federal policies such as the tax subsidies and the command-and-control
environmental regulation noted above. A federal carbon tax might also allow states to back
away from their technology-specific policies, too.
The notion of a tax swap and a policy sweep has been studied widely. A 2012 Brookings
Institution paper, for example, described the possible policy change as follows:
One option for pricing carbon in the United States would embed a carbon
pollution tax within a broader tax reform or budget deficit reduction package.
Such an approach could use the revenue from the carbon tax to improve the
economic efficiency of the tax system and/or reduce the federal budget deficit,
while also reducing the need for costlier regulatory measures to reduce climate-
disrupting greenhouse gases [citation omitted]. A carbon tax might also allow
reductions in subsidies for clean energy technologies since a price on carbon
alone can make low-carbon technologies more competitive with their
conventional alternatives.455
The board’s interest in the tax swap and policy sweep lies in what might happen to SPP
markets if the compromise(s) were successful. Would a broad-based tax on fossil fuels be likely
to increase SPP market prices more than the current federal policies? The carbon tax is
characterized as a tax on fossil fuels because, for administrative ease, a carbon tax might be
imposed on natural gas at the well head, coal at the mine, and oil products at the refinery. Prices
for all of these fuels would increase to some extent with the carbon tax. Another question the
board might consider is whether the policy sweep – which would reduce or eliminate subsidies
for wind power and other technologies – would make a big difference in the transmission
investment needed in SPP going into the future.
2. Industry’s View on Federal Policy Going Forward
As to the likelihood of a tax swap, note that, in December 2013, the New York Times
published an article titled “Large Companies Prepared to Pay Price on Carbon.”456 The article
stated, “[a] new report by the environmental data company CDP has found that at least 29
455 Warwick J. McKibbin et al., The Potential Role of a Carbon Tax in U.S. Fiscal Reform, The Brookings
Institution, July 24, 2012, 3. 456 Coral Davenport, “Large Companies Prepared to Pay Tax on Carbon,” New York Times, December 5, 2013.
95
companies, some with close ties to Republicans, including Exxon Mobil, Walmart and American
Electric Power, are incorporating a price on carbon into their long-term financial plans.”457 The
article went on to state, “[o]ther companies that are incorporating a carbon price into their
strategic planning include Microsoft, General Electric, Walt Disney, ConAgra Foods, Wells
Fargo, DuPont, Duke Energy, Google and Delta Air Lines.”458
The article makes it clear that this practice is not universal and that there is substantial
opposition to putting a price on carbon from other businesses.459 However, if the article is
accurate, these are significant businesses acknowledging the high probability of additional,
stricter rules on carbon emissions. For example, ExxonMobil is quoted as saying, “[u]ltimately,
we think the government will take action through a myriad of policies that will raise the prices
and reduce demand [of carbon-polluting fossil fuels].”460 The article adds, “[m]ainstream
economists have long agreed that putting a price on carbon pollution is the most effective way to
fight global warming.”461
None of this is ‘big news’ to those into the details of global climate change policy; for
example, America already has a “myriad of policies.”462 The fact that substantial businesses are
incorporating a carbon tax in their financial planning is not ‘big news’ either for those involved
in the details of resource planning for the electricity business. It is routine to at least test the
sensitivity of a resource choice with a variety of carbon taxes. What would be ‘big news’ is any
indication that the necessary political compromise might be reached in Congress. The actions of
these major corporations may be one such indication that they feel some broad, political
compromise on global climate change is possible.
3. Credible Studies of the Tax Swap
As noted, the tax swap has been analyzed extensively. That analysis could be a key
component to achieving a political compromise. Three credible and recent efforts include those
from the Congressional Budget Office (CBO), NERA Economic Consultants for the National
Association of Manufacturers, and the Brookings Institution.
In May 2013, CBO, in response to a request from the Ranking Member of the House
Committee on Energy and Commerce,463 prepared a report titled Effects of a Carbon Tax on the
Economy and the Environment.464 It was not new analysis; rather it referenced previous CBO
efforts and the research by others, including the reports just cited by NERA and Brookings.
CBO returned to a previous analysis of a policy that led to a carbon price of $20 per ton of
457 Ibid. 458 Ibid. 459 Ibid. 460 Ibid. 461 Ibid. 462 Ibid. 463 Terry Dinan et al., Effects of a Carbon Tax on the Economy and the Environment, Congressional Budget Office,
May 2013, 20. 464 Ibid., full report.
96
emitted CO2 in 2012, increasing the price by 5.6 percent per year thereafter, would result in $1.2
trillion in revenue and 8 percent lower CO2 emissions over that 10-year period.465 Thus, CBO
clearly found a carbon tax would collect significant revenue. As to its economic impact, CBO
reported that “[w]ithout accounting for how the revenues from a carbon tax would be used, such
a tax would have a negative effect on the economy.”466 That negative effect would come from
higher prices for products like electricity and gasoline, which, in turn, would lower real wages;
that is, it would lower the purchasing power of what workers earn on the job. CBO concludes,
“[l]ower real wages would have the net effect of reducing the amount that people worked, thus
decreasing the overall supply of labor.”467 Investment would also decline since the return on that
investment would be decreased, “further reducing the economy’s total output.”468
Simply giving the revenue back to those who paid it would not fully mitigate these
negative economic effects according to CBO.469 However, using the revenue to reduce the
federal budget deficit and/or to lower marginal tax rates on working and investing would
mitigate to some extent the harm to the economy from a carbon tax.470 CBO concluded that
cutting the budget deficit would mitigate the harm of a budget deficit in the sense that deficits
“crowd out … private-sector investment.”471 Using the carbon tax revenue to lower marginal tax
rates – again, this is called a “tax swap” – would mitigate the economic effects by increasing the
incentive to work and invest by increasing the after-tax returns to working and investing.472
With more work and more investment, the output of the U.S. economy would increase.473 As to
the correct level of the tax, CBO points to a U.S. “interagency working group [formed] to
develop estimates of the social costs of carbon ...”474 CBO readily acknowledges the uncertainty
in this estimate. For example, CBO shows a summary table in which the damage from a ton of
carbon emissions varies for 2020 from $7 to $42 per ton of CO2 emissions.475 CBO notes that
the “central estimate” was $21 per ton.476
In another study, the National Association of Manufacturers asked the well-respected
consulting firm NERA to assess the economic effects of a carbon tax. The NAM report is titled
465 Ibid., 1. 466 Ibid. 467 Ibid. 468 Ibid. 469 Ibid., 2. 470 Ibid. 471 Ibid., 10. 472 Ibid., 10-11. 473 To show some of the complexity in making such estimates, CBO points out that there is a counter effect. For
example, while higher taxes on income from working decrease the return to work, it also may necessitate working
more to keep after tax income at the level achieved prior to the tax increase. However, CBO says “research studies”
indicate that the negative effect generally outweighs the counter effect. See, Dinan et al., Effects of a Carbon Tax on
the Economy and the Environment, Congressional Budget Office, May 2013, 6. 474 Terry Dinan et al., Effects of a Carbon Tax on the Economy and the Environment, Congressional Budget Office,
May 2013, 14. 475 Ibid., p. 15, table 1. 476 Ibid., 15.
97
Economic Outcomes of a U.S. Carbon Tax.477 The report assesses two policies but the one of
interest here is a tax starting at $20 per metric ton of CO2 in 2013 and increasing by 4 percent per
year thereafter to 2053.478 NAM is decidedly negative on a carbon tax. In broad terms, the
NAM report makes it clear that the revenue from a carbon tax would be offset substantially by
the loss of revenue due to lower economic activity. The report states,
Any revenue raised by a carbon tax … would be far outweighed by the negative
impacts to the overall economy … A carbon tax would have a net negative effect
on consumption, investment and jobs, resulting in lower federal tax revenues from
taxes on capital and labor … Factoring in lost revenue from reduced economic
activity, the net [emphasis omitted] revenue from a carbon tax available for
deficit/debt reduction and lower tax revenues is relatively small.479
The report found that, on net, the carbon tax it modeled would reduce gross domestic product
(GDP) in the range of 0.4 percent to 0.6 percent in each year of the period it assesses – from
2013 to 2053.480 It would also reduce household spending by a financial average of $310 per
household.481
In addition, the NAM report lays out a long list of impacts of its presumed carbon tax.
CO2 emissions, as compared to those in the year 2005, would decrease by 23 percent in 2033 and
by 31 percent in 2053.482 Electricity prices would be 17 percent higher in 2033 and 20 percent
higher in 2053 than they would without a carbon tax.483 Gasoline prices would rise by 10
percent in 2033 and by 17 percent in 2053.484 Coal-fired power plant retirements would surge to
112 GW as compared to the base line of 37 GW in 2033.485 Electricity demand would be 11
percent lower in 2033 and 12 percent lower in 2053.486 Output from the coal industry would be
cut drastically, dropping by 45 percent in 2033.487 Natural gas output would increase by 1.8
percent in that same year.488 For NAM, the conclusion is clear: “[o]verall, the net impact of a
carbon tax would be negative, as the adverse effects of the imposition of such a tax would
outweigh any benefits, including the reduction of the deficit/debt and lower personal income tax
rates.”489
Brookings also assessed the effect of a carbon tax in a report cited earlier. Their paper
reports substantial revenues from a tax starting at $15 per metric ton of CO2 in 2012 and
477 National Association of Manufacturers, “Executive Summary,” Economic Outcomes of a U.S. Carbon Tax,
February 2013. 478 Ibid., 2. 479 Ibid., 1. 480 Ibid., p. 4, figure 2. 481 Ibid. 482 Ibid., p. 6, figure 4. 483 Ibid., p. 6, figure 5. 484 Ibid. 485 Ibid., p. 7, figure 6. 486 Ibid. 487 Ibid., p. 8, figure 7. 488 Ibid. 489 Ibid., 9.
98
escalating thereafter.490 The carbon tax revenue was estimated to be $80 billion in 2012, $170
billion in 2030, and $310 billion in 2050.491 With the carbon tax, CO2 emissions in 2050 would
be 34 percent lower than they would be otherwise.492
As to mitigating the economic impact of a carbon tax, Brookings reports the most notable
findings on the impact of different ways to use the revenue from a carbon tax. Brookings
concludes that in most cases the carbon tax would lower GDP.493 However, if the carbon tax
revenue is used to lower tax rates on capital, GDP is higher in most years.494 Brookings states,
“[u]sing the revenue for a capital tax cut, however, is significantly different than the other
policies. In that case, investment booms, employment rises, consumption declines slightly,
imports increase, and overall GDP rises significantly relative to baseline through about 2040.”495
Summing up their detailed findings, Brookings concludes that, “… the capital tax swap appears
to produce a double dividend, i.e. both emissions reductions and an increase in economic
activity.”496
At the moment, there is no indication the needed political compromise is near. Tax
reform proposals have been put on the table, including a reduction in tax rates.497 However, at
the moment, the Obama administration is pursuing command-and-control regulations to address
climate change as detailed earlier in this report. Perhaps a setback in the litigation concerning
this regulatory approach might incite interest in a market-based policy such as a carbon tax.
C. A New Story for Nuclear: SMRs?
It is clear that nuclear power’s future in the U.S. is unclear. As discussed herein, several
existing nuclear facilities have shut down early for economic reasons, in large part because of the
shale gas revolution and the resulting low prices for natural gas. For new nuclear plants, the
renaissance predicted by some, because nuclear has zero CO2 emissions, has not happened.
Further, the natural disaster at the Fukushima plant in Japan has renewed concerns over safety.
Despite this, a technology discussed in last year’s Looking Forward Report – small
modular reactors498 – is receiving public funding. The DOE has continued its support of the
nuclear power industry by funding SMRs through its Small Modular Reactor Licensing
Technical Support program, which began in 2012. The mission of this program is to “promote
490 McKibbin et al., The Potential Role of a Carbon Tax in U.S. Fiscal Reform, The Brookings Institution, July 24,
2012, 2. 491 Ibid. 492 Ibid. 493 Ibid. 494 Ibid. 495 Ibid. 496 Ibid., 30. 497 For example, see, Dave Camp, “Dave Camp: How to fix our appalling tax code,” Wall Street Journal, February
25, 2014. 498 Roach, Ph.D. et al., Southwest Power Pool Annual Looking Forward Report, Boston Pacific Company, Inc.,
April 23, 2013, 59-61. See, also, U.S. Department of Energy Office of Nuclear Energy, “Small Modular Nuclear
Reactors,” DOE website, accessed April 19, 2014, http://www.energy.gov/ne/nuclear-reactor-technologies/small-
modular-nuclear-reactors.
99
the accelerated deployment of SMRs by supporting certification and licensing requirements for
U.S.-based SMR projects through cooperative agreements with industry partners, and by
supporting the resolution of generic SMR issues.”499 The DOE anticipates spending $452
million over the life of the six-year program, $70 million of which would be spent in 2014.500
According to the proponents, SMRs offer the promise of several advantages over their
large-scale counterparts. First, SMRs are considered to have safety advantages over larger
reactors. For example, SMR designs use “passive” safety systems, meaning they are not
dependent on external electrical power and thus do not require backup station power.501 SMRs
also use secure underground containment to minimize risks of natural disasters or aircraft
impacts.502 SMR designs also incorporate lessons learned from the existing nuclear fleet and use
enriched standard fuel.503 Second, SMRs require a much smaller capital investment. SMRs run
approximately $900 million to $1.2 billion for a 200 MW plant, while large nuclear plants can
require approximately 7.75 billion per unit.504 (Note that this cuts only the scale of the
investment, not the cost per kWh.) Third, SMRs are scalable, able to be manufactured, and
shipped by rail,505 have a longer operating cycle between refueling, and can be built on smaller
sites closer to load.506 Additionally, like large nuclear reactors, SMRs have zero CO2 emissions.
To date, no SMR concept has been licensed or constructed. However, the DOE has
awarded funding to two teams of developers under its SMR program. Those teams have shown
some of the promise that commercially viable SMRs may provide. The first recipient, noted in
last year’s report,507 is the team of Babcock & Wilcox, Tennessee Valley Authority, and
Bechtel.508 Its efforts have focused on completing “design certifications, site characterization,
licensing, first-of-a-kind engineering activities, and the associated Nuclear Regulatory
Commission (NRC) review processes.”509 mPower also “has developed a plan … to achieve a
commercial operation date (COD) [for its SMRs] of October 2021.”510 mPower’s design uses
499 U.S. Department of Energy Office of Nuclear Energy, “Small Modular Nuclear Reactors,” DOE website,
accessed April 19, 2014, http://www.energy.gov/ne/nuclear-reactor-technologies/small-modular-nuclear-reactors.
Generic SMR issues include assisting the industry in addressing licensing hurdles such as the treatment of unique
SMR source term evaluations or operations, and maintenance and security staffing requirements. 500 Ibid. 501 Generation mPower, “Technology,” The Babock & Wilcox Company Generation mPower website, accessed
April 19, 2014, http://www.generationmpower.com/technology/. 502 Ibid. 503 Ibid. 504 Ken Silverstein, “Nuclear Energy Rising at the Expense of Renewable Power,” Forbes website, last modified
March 9, 2014, http://www.forbes.com/sites/kensilverstein/2014/03/09/nuclear-energy-rising-at-the-expense-of-
renewable-power/. 505 Matthew L. Wald, “The Next Nuclear Reactor May Arrive Hauled by a Truck,” New York Times, April 24, 2013. 506 U.S. Department of Energy Office of Nuclear Energy, “Small Modular Nuclear Reactors,” DOE website,
accessed April 19, 2014, http://www.energy.gov/ne/nuclear-reactor-technologies/small-modular-nuclear-reactors. 507 Roach, Ph.D. et al., Southwest Power Pool Annual Looking Forward Report, Boston Pacific Company, Inc.,
April 23, 2013, 59. See, also, Matthew L. Wald, “Deal Advances Development of a Small Nuclear Reactor,” New
York Times, February 20, 2013. 508 Babcock & Wilcox and Bechtel have since formed Generation mPower LLC (mPower) from this team. 509 U.S. Department of Energy Office of Nuclear Energy, “Small Modular Nuclear Reactors,” DOE website,
accessed April 19, 2014, http://www.energy.gov/ne/nuclear-reactor-technologies/small-modular-nuclear-reactors. 510 Ibid.

100
passive safety systems and is housed in an underground containment structure and insulated core
to prevent accidents511; there also is no need for a safety-grade backup generator.512 Again, the
mPower design reflects some of the purported benefits of SMRs: (1) it uses a four-year operating
cycle between refuelings513 – compared to 18-24 months for larger reactors514; (2) it is scalable –
a site can have between one and 10 units with each unit at 180 MWe; and (3) it is manufactured
in the U.S. and shippable by rail.515
As a second recipient, in December 2013, DOE chose NuScale, which has a 160 MWt
(about 45 MWe) SMR design.516 NuScale’s design also reflects some of the promised benefits
of SMR. It is scalable, allowing up to 12 units per plant,517 with a multi-year refueling cycle.
The design has “innovative and comprehensive safety features.”518 For example, the NuScale
design will shut down and self-cool indefinitely “with no operator action, no AC or DC power,
and no additional water.”519 Finally, NuScale’s design can be built in three years,520 compared to
five to six years for large-scale reactors.521
In addition to the DOE funding, other factors to consider in assessing the future of SMRs
include: (1) current and expected retirements of existing nuclear plants and (2) the need to reduce
CO2 emissions to address concerns about global climate change.522 In the last year, five U.S.
nuclear plants have sought early closure: (1) Southern California Edison’s San Onofre Nuclear
Generating Station in Pendleton, California523; (2) Dominion’s Kewaunee plant near Green Bay,
Wisconsin524; (3) Duke Energy’s Crystal River plant in Citrus County, Florida525; (4) Exelon’s
511 Generation mPower, “Technology,” The Babock & Wilcox Company Generation mPower website, accessed
April 19, 2014, http://www.generationmpower.com/technology/. 512 Generation mPower, Delivering Clean Energy to the World with Small Modular Reactor Technology, 2012, 4. 513 Ibid. 514 “What Happens During a Refueling Outage?” NEI Nuclear Notes (blog), May 8, 2012,
http://neinuclearnotes.blogspot.com/2012/05/what-happens-during-refueling-outage.html. 515 Generation mPower, delivering clean energy to the world with small modular reactor technology, 2012, 3. 516 NuScale Power, “How NuScale Technology Works,” NuScale website, accessed April 19, 2014,
http://www.nuscalepower.com/overviewofnuscalestechnology.aspx. 517 NuScale Power, “Benefits of NuScale’s Technology,” NuScale website, accessed April 19, 2014,
http://www.nuscalepower.com/nuscalesmrbenefits.aspx. 518 NuScale Power, “Safety Features of the NuScale Design,” NuScale website, accessed April 19, 2014,
http://www.nuscalepower.com/safe.aspx. 519 Ibid. 520 NuScale Power, “A Cost Competitive Nuclear Option for Multiple Applications,” NuScale website, accessed
April 19, 2014, http://www.nuscalepower.com/economical.aspx. 521 See, for example, Georgia Power, Plant Vogtle units 3&4 fact sheet, Southern Company website, accessed April
19, 2014, http://www.southerncompany.com/what-doing/energy-innovation/nuclear-energy/pdfs/Vogtle-Fact-
Sheet.pdf. 522 Ibid. 523 Joseph Serna and Abby Sewell, “Edison will shut down the San Onofre nuclear plant for good,” Los Angeles
Times, June 7, 2013. 524 Matthew L. Wald, “As Price of Nuclear Energy Drops, a Wisconsin Plant is Shut,” New York Times, May 7,
2013. 525 Ivan Penn, “Duke Energy announces closing of Crystal River nuclear power plant,” Tampa Bay Times, February
5, 2014.

101
Oyster Creek plant in Lacey Township, New Jersey526; and (5) Entergy’s Vermont Yankee plant
in Vernon, Vermont.527 Plants are shutting down at least in part because of economic reasons,
specifically “the low price of [natural] gas,”528 which drives down power prices and can lower an
existing nuclear plant’s revenue.
It is far too soon to know whether SMRs will mean that nuclear power will have a new,
successful strategic story to tell. The new, overarching goal of nuclear is to contribute to the
reduction if CO2 emissions. In addition, SMRs abandon the presumed strategic advantage with
large plants – economies of scale; at 200 MW or so, they would be just one-fifth the size of the
typical 1,000 MW nuclear unit.529 While new passive safety approaches are intended to address
the safety concerns of Fukushima and other accidents,530 skeptics claim that passive systems are
not “infallible” and should include additional safety measures.531 Still, SMRs will have to pass
the commercial test of being a low-cost, viable option to address climate change concerns.
526 Alexi Friedman, “Forced shutdown of Oyster Creek nuclear plant occurs on day it returns to service,” Star-
Ledger, October 7, 2013. 527 Matthew L. Wald, “Vermont Yankee Plant to Close Next Year as the Nuclear Industry Retrenches,” New York
Times, August 27, 2013. 528 Ibid. 529 U.S. Department of Energy Office of Nuclear Energy, “Small Modular Nuclear Reactors,” DOE website,
accessed April 19, 2014, http://www.energy.gov/ne/nuclear-reactor-technologies/small-modular-nuclear-reactors. 530 Nuclear Energy Institute, “DOE Selects NuScale Power for SMR Development Funds,” NEI website, last
modified December 12, 2013, http://www.nei.org/News-Media/News/News-Archives/DOE-Selects-NuScale-Power-
for-SMR-Development-Fund. 531 Union of Concerned Scientists, “Small Modular Reactors: Safety, Security and Cost Concerns,” UCSUSA
website, last modified September 10, 2013, http://www.ucsusa.org/nuclear_power/nuclear_power_technology/small-
modular-reactors.html.
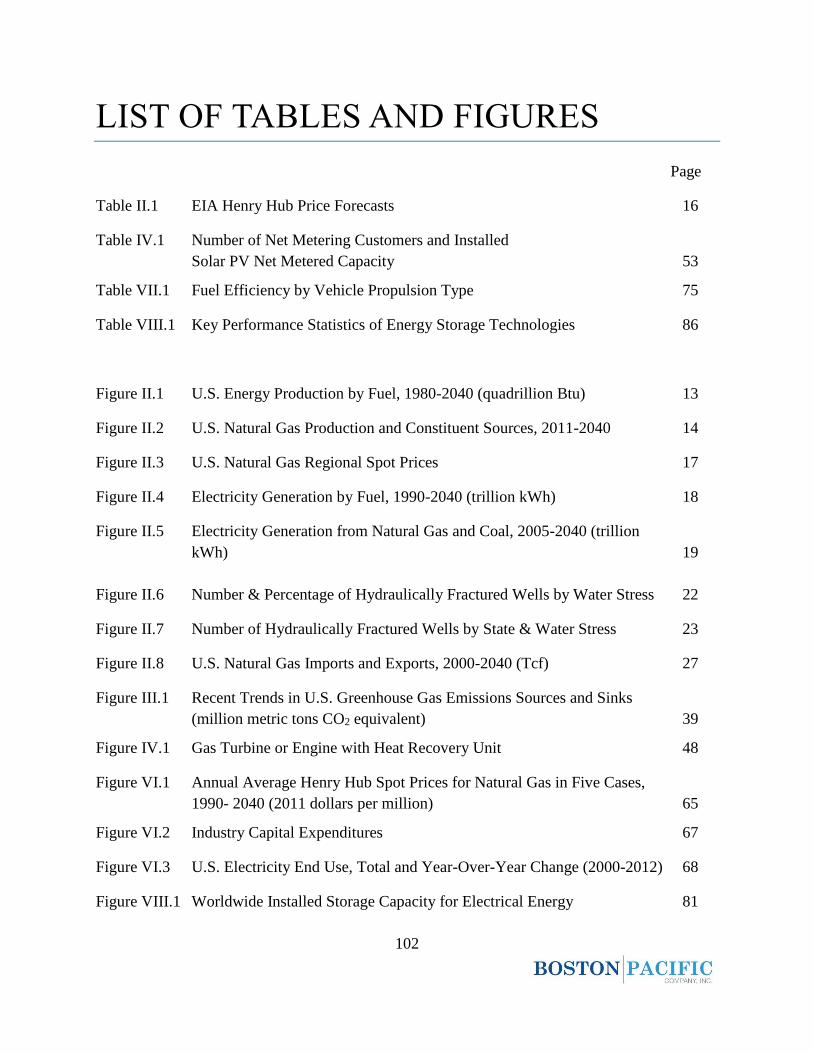
102
LIST OF TABLES AND FIGURES
Page
Table II.1 EIA Henry Hub Price Forecasts 16
Table IV.1 Number of Net Metering Customers and Installed
Solar PV Net Metered Capacity 53
Table VII.1 Fuel Efficiency by Vehicle Propulsion Type 75
Table VIII.1 Key Performance Statistics of Energy Storage Technologies 86
Figure II.1 U.S. Energy Production by Fuel, 1980-2040 (quadrillion Btu) 13
Figure II.2 U.S. Natural Gas Production and Constituent Sources, 2011-2040 14
Figure II.3 U.S. Natural Gas Regional Spot Prices 17
Figure II.4 Electricity Generation by Fuel, 1990-2040 (trillion kWh) 18
Figure II.5 Electricity Generation from Natural Gas and Coal, 2005-2040 (trillion
kWh) 19
Figure II.6 Number & Percentage of Hydraulically Fractured Wells by Water Stress 22
Figure II.7 Number of Hydraulically Fractured Wells by State & Water Stress 23
Figure II.8 U.S. Natural Gas Imports and Exports, 2000-2040 (Tcf) 27
Figure III.1 Recent Trends in U.S. Greenhouse Gas Emissions Sources and Sinks
(million metric tons CO2 equivalent) 39
Figure IV.1 Gas Turbine or Engine with Heat Recovery Unit 48
Figure VI.1 Annual Average Henry Hub Spot Prices for Natural Gas in Five Cases,
1990- 2040 (2011 dollars per million) 65
Figure VI.2 Industry Capital Expenditures 67
Figure VI.3 U.S. Electricity End Use, Total and Year-Over-Year Change (2000-2012) 68
Figure VIII.1 Worldwide Installed Storage Capacity for Electrical Energy 81

103
Figure VIII.2 Electric Grid Energy Storage Services 87
104
GLOSSARY
AC Alternating Current
AEO Annual Energy Outlook
AEOER Annual Energy Outlook Early Release Overview
CAA Clean Air Act
CAES Compressed Air Energy Storage
CAFE Corporate Average Fuel Economy
CAISO California ISO
CBO Congressional Budget Office
CCR Coal Combustion Residuals
CCS Carbon Capture and Sequestration
CHP Combined Heat and Power
CO2 Carbon Dioxide
CO2e Carbon Dioxide Equivalent
CSAPR Cross-State Air Pollution Rule
DOE U.S. Department of Energy
EIA U.S. Energy Information Agency
EPA U.S. Environmental Protection Agency
EPRI Electric Power Research Institute
EV Electric Vehicle
FERC Federal Energy Regulatory Commission
FTA Free Trade Agreement

105
GDP Gross Domestic Product
GHG Greenhouse Gas
GW Gigawatt
HEV Hybrid Electric Vehicle
HVDC High-Voltage Direct Current
ICE Internal Combustion Engine
ICF ICF International
IHS IHS Global
ISO Independent System Operator
kWh Kilowatt-hour
Li-ion Lithium-ion
LNG Liquefied Natural Gas
MATS Mercury and Air Toxic Standards
MMBTu Million British Thermal Units
MW Megawatt
MWh Megawatt-hour
NAAQS National Air Ambient Quality Standards
NAM National Association of Manufacturers
NARUC National Association of Regulatory Utility Commissioners
NaS Sodium Sulfur
NERA NERA Economic Consulting
NERC North American Electric Reliability Corporation
NOx Nitrogen Oxide
106
PG&E Pacific Gas & Electric Company
PHEV Plug-in Hybrid Electric Vehicle
PJM PJM Interconnection, LLC
PM 2.5 Fine Particulate Matter
PSD Prevention of Significant Deterioration
PSE&G Public Service Electric and Gas Company
PURPA Public Utilities Regulatory Policies Act
PV Photovoltaic
RPS Renewable Portfolio Standard
RTO Regional Transmission Organization
SMR Small Modular Reactors
SO2 Sulfur Dioxide
SPP Southwest Power Pool
Tcf Trillion Cubic Feet
USGS United States Geological Survey


![Shell – Upstream in the Eagleford Shale South Texas near ... · Microsoft PowerPoint - FLEXIM_Case Study_Shell Upstream [Compatibility Mode] Author: Izzy Rivera Created Date: 3/13/2013](https://static.fdocuments.in/doc/165x107/5f90e2ccbad813567560abfa/shell-a-upstream-in-the-eagleford-shale-south-texas-near-microsoft-powerpoint.jpg)