Southwest Corridor High Capacity Transit Mode Comparison · Project background 4 The Southwest...
39
CONNECT www.swcorridorplan.org @SWCorridor [email protected] 503-797-1756 The goal of this document is to present detailed technical information on a wide range of considerations for bus rapid transit (BRT) and light rail transit (LRT) travel modes. This document does not provide a recommendation or weigh the factors against each other. The information included in this memo will be synthesized and referenced within a staff recommendation report, to be released by the end of January 2016. In late February 2016, the Southwest Corridor Steering Committee is scheduled to decide whether bus rapid transit or light rail is the preferred high capacity transit mode for further study. The preferred transit mode will be incorporated into a draft ‘Preferred Package’ of investments for the Southwest Corridor for further public review. The Preferred Package will be finalized at the May 2016 steering committee meeting. Southwest Corridor High Capacity Transit Mode Comparison Released December 31, 2015 Updated January 13, 2016 to fix minor errors – see Errata, p. 39
Transcript of Southwest Corridor High Capacity Transit Mode Comparison · Project background 4 The Southwest...
CONNECT
www.swcorridorplan.org
@SWCorridor
503-797-1756
The goal of this document is to present detailed technical information on a wide range of considerations for bus rapid transit (BRT) and light rail transit (LRT) travel modes. This document does not provide a recommendation or weigh the factors against each other. The information included in this memo will be synthesized and referenced within a staff recommendation report, to be released by the end of January 2016.
In late February 2016, the Southwest Corridor Steering Committee is scheduled to decide whether bus rapid transit or light rail is the preferred high capacity transit mode for further study. The preferred transit mode will be incorporated into a draft ‘Preferred Package’ of investments for the Southwest Corridor for further public review. The Preferred Package will be finalized at the May 2016 steering committee meeting.
Southwest Corridor High Capacity Transit Mode ComparisonReleased December 31, 2015Updated January 13, 2016 to fix minor errors – see Errata, p. 39
HOW TO NAVIGATE THIS DOCUMENT ELECTRONICALLY
Many of the considerations at play in the decision between bus rapid transit and light rail are inextricably linked. To help you understand these relationships, this document includes several interactive features to make it easier to navigate.
Keep an eye out for these elements to help you explore the information in a "choose your own adventure" style:
Buttons in the graphic table of contents:
Links to related information in the sidebar and body text:
service frequency, p. 31
Links in the summary tables:
equity, p. 24
Shortcuts to return to the table of contents:

3
MOBILITY COST-EFFECTIVENESS
OPERATIONS FINANCE
COMMUNITYLAND USE
Table of contents
Project background . . . . . . . . . . . . . 4
HCT project narrowing . . . . . . . . . . 5
What are BRT and LRT? . . . . . . . . . 6
Alignment assumptions . . . . . . . . . 7
Summary table: project goals . . . . 8
Summary table: logistics . . . . . . . . 9
Considerations: project goals . . . 10
Land use . . . . . . . . . . . . . . . . . . . . 10
Mobility . . . . . . . . . . . . . . . . . . . . 15
Community . . . . . . . . . . . . . . . . . . 22
Cost-effectiveness . . . . . . . . . . . . . 25
Considerations: logistics . . . . . . . . 29
Operations . . . . . . . . . . . . . . . . . . 29
Finance . . . . . . . . . . . . . . . . . . . . . 35
Next steps . . . . . . . . . . . . . . . . . . . 38
CONSIDERATIONS: PROJECT GOALS
CONSIDERATIONS: LOGISTICS

4Project background
The Southwest Corridor Plan is a collaborative effort between project partners Portland, Sherwood, Tigard, Tualatin, Beaverton, Durham, King City, Washington County, ODOT, TriMet and Metro. It is a comprehensive approach to achieving community visions through integrated land use and transportation planning. The Plan is rooted in the adopted local land use plans of the corridor communities, including the Barbur Concept Plan, the Tigard High Capacity Transit Land Use Plan, Linking Tualatin and the Sherwood Town Center Plan. In support of these community visions, the Southwest Corridor Plan Steering Committee has recommended a Shared Investment Strategy that includes key investments in transit, roadways, active transportation, parks, trails and natural areas.
Roadway, bike and pedestrian projectsProject partners have identified a list of priority projects to improve safety and connectivity throughout the corridor. Staff are working to identify potential funding strategies for these projects.
Local bus service improvementsThrough the Southwest Service Enhancement Plan, TriMet has evaluated the existing bus routes throughout the Southwest Corridor and recommended an array of improvements, including service upgrades, route changes and new routes. These improvements will be phased in as funding allows, starting with the new Line 97 between Sherwood and Tualatin opening in summer 2016.
High capacity transit (HCT)Bus rapid transit (BRT) and light rail transit (LRT) alternatives are being considered for several alignments that connect downtown Portland, Southwest Portland, Tigard and Tualatin. The purpose of this document is to explore the advantages and disadvantages of these two HCT modes.
PROJECT GOALS
The Southwest Corridor Plan Purpose and Need statement, adopted January 2014, includes thirteen project goals:
1. Serve the existing and projected transit demand in the corridor
2. Improve transit service reliability in the corridor
3. Improve transit frequency and travel times
4. Provide options that reduce overall transportation costs
5. Improve multimodal access to a range of housing types and businesses in growing communities
6. Improve potential for housing and commercial development in the corridor and encourage development in centers and transit-oriented development at stations along the corridor
7. Ensure benefits and impacts promote community equity
8. Increase multimodal transportation options and improve mobility in the corridor
9. Complete multimodal transportation networks in the corridor
10. Advance transportation projects that increase active transportation and encourage physical activity
11. Provide transit service that is cost effective to build and operate with limited local resources
12. Advance transportation projects that are sensitive to the environment, improve water and air quality and help reduce carbon emissions
13. Catalyze improvements to natural resources, habitat and parks in the corridor
Roadway, Bike and Pedestrian Projects
Natural areas
Natural areas
Natural areas
Local Bus Service Improvements
Natural areas
High Capacity TransitHigh
capacitytransit

5
LRT to Tigard
2009-11 2012 2013
LRT to Tualatin
BRT to Tigard
BRT to Tualatin
Streetcar
HCT on I-5
WES commuter rail improvements
BRT to Sherwood(mixed traffic)
HCT on 99Wsouth of Portland
HCT in exclusive ROWto Sherwood
BRT hub and spoke
ADDED REMOVED
IDENTIFIEDFOR SEPARATE
FUTURE STUDY
HCT project narrowing
EARLY NARROWING OF MODE AND ALIGNMENT
In the early stages of the Southwest Corridor project, many HCT modes and alignments were evaluated. The diagram below shows when rapid streetcar and WES commuter rail improvements were removed from consideration for this project, as well as HCT on 99W in Tigard. Since 2013, the project has focused on LRT or BRT to Tigard or Tualatin.
March 2014The steering committee removed several options with ‘fatal flaws’ prior to more detailed analysis leading up to the June 2014 decision, including BRT along the south side of the PCC Sylvania campus and LRT on Hunziker Street in Tigard.
June 2014The steering committee removed several HCT alignment options and requested additional refinement work from staff on the remaining options. The options removed included a tunnel to Marquam Hill from South Waterfront, a “long tunnel” that served Multnomah Village, BRT in mixed traffic through Hillsdale, and an Upper Boones Ferry option west of Bridgeport Village.
July 2015The steering committee removed tunnels to Marquam Hill and Hillsdale and accepted technical modifications to the remaining options.
January 2016The steering committee is scheduled to consider which HCT alignment and terminus options to study further in Tigard and Tualatin.
February 2016The steering committee is scheduled to consider whether LRT or BRT is the preferred HCT mode to study further, as well as whether to continue studying an LRT tunnel to PCC Sylvania. This mode will be incorporated into a draft Preferred Package of transportation investments to support community land use goals for further public review.
May 2016The steering committee is anticipated to recommend a Preferred Package, which will include the recommended HCT project and a funding strategy for priority roadway and active transportation projects.
Future analysisOnce the HCT project and associated road, bike and pedestrian projects are undergoing federal review through the National Environmental Policy Act, staff will assess a wide array of positive and negative impacts and compare to not investing in transportation improvements for the Corridor.
After the steering committee’s 2013 Shared Investment Strategy recommendation, a refinement study was initiated to narrow high capacity transit (HCT) options and identify a list of roadway and active transportation projects to support the HCT project. Through this refinement phase, the steering committee has made several narrowing decisions, and further decisions will be made in early 2016.
HCT alignment narrowingOrange: removed in 2014-2015Purple: currently under consideration

6
MAX light rail in PortlandEmX bus rapid transit in Eugene
LIGHT RAILBUS RAPID TRANSIT
What are BRT and LRT?
For the purpose of this memo, a light rail (LRT) line in the Southwest Corridor is assumed to include:
• 11 to 12 mile alignment serving 14 to 15 stations between downtown Portland and Bridgeport Village (including existing Lincoln Street station)
• Operations in exclusive transitway for 100 percent of the alignment
• Two-car trains (electric) that carry up to 266 passengers
• Branding consistent with existing MAX system
• Advance fare collection with upcoming e-fare system, boarding through all doors and level boarding
• Most stations spaced around ½ to ¾ mile apart
• Improved bike and pedestrian access to stations and along the line
• Service frequency of 15 minutes or better all day
• New and expanded park-and-ride lots
For the purpose of this memo, a bus rapid transit (BRT) line in the Southwest Corridor is assumed to include:
• 11 to 12 mile alignment serving 14 to 15 stations between downtown Portland and Bridgeport Village
• Operations in exclusive transitway for 78 to 85 percent of the alignment
• 60-foot articulated buses that carry up to 86 passengers (fuel/propulsion type to be determined)
• Special BRT system branding
• Advance fare collection with upcoming e-fare system, boarding through all doors and level boarding
• Most stations spaced around ½ to ¾ mile apart
• Improved bike and pedestrian access to stations and along the line
• Service frequency of 15 minutes or better all day
• New and expanded park-and-ride lots
HIGH CAPACITY TRANSIT IN THE PORTLAND METRO REGION
Whether BRT or LRT, a Southwest Corridor line would tie into a region-wide high capacity transit network with a history stretching back to the 1980s. In 2016, C-TRAN will open The Vine, the region’s first BRT line in Vancouver. The Powell-Division project is anticipated to add another BRT line to the region, and the first for TriMet. A BRT line in the Southwest Corridor would be a bigger investment than The Vine or Powell-Division, with an exclusive busway for most of the line.
1986 Eastside MAX Blue Line
1998 Westside MAX Blue Line
2001 Airport MAX Red Line
2004 Interstate MAX Yellow Line
2009 WES Commuter Rail I-205 MAX Green Line
2015 MAX Orange Line
2016 The Vine BRT in Vancouver (C-TRAN)
~2020 Powell-Division BRT
~2025 Southwest Corridor BRT or LRT
TriMet MAX light rail system today

7For the purpose of this document, certain assumptions have been made about which alignments to use for ridership projections, travel times and costs. Both modes share the same ‘base’ alignment, to provide as much of an ‘apples-to-apples’ comparison as possible. In addition to the base, this document includes the alignment options that serve the PCC Sylvania campus directly because they are considerably different between BRT and LRT and the steering committee is scheduled to consider a decision on the LRT tunnel to PCC at the same time as the mode decision. A memo evaluating several alternative connections to PCC Sylvania is being released concurrently with this document.
Note: these alignments are for analysis purposes only and do not indicate a preferred alignment.
For more information on the performance of the other alignment options not included in the base or PCC alignments, see previously released Key Issues Memos and Evaluation Reports on the project website at www.swcorridorplan.org.
Base alignment for BRT and LRT:
• Naito Parkway in South Portland
• Barbur Boulevard from Naito to 60th Avenue, including a station at 53rd Avenue with a park-and-ride lot and an enhanced walk/bike connection to PCC campus
• 68th/70th Avenue couplet in the Tigard Triangle
• Ash Avenue option in downtown Tigard
• Adjacent to freight rail in Southeast Tigard
• Terminus at Bridgeport Village
PCC alignment for BRT: same as base alignment except between Barbur Transit Center and Tigard Triangle
• Capitol Highway / 49th Avenue with a station near Capitol Hill Library and Holly Farm Park
• Station at “front door” of Sylvania campus
• Connection to Tigard Triangle via new bridge over I-5 from Lesser Road
PCC alignment for LRT: same as base alignment except between 53rd Avenue and Tigard Triangle
• Long bored tunnel from 53rd Avenue to Tigard Triangle (similar costs and travel times for short bored tunnel)
• Station with park-and-ride lot at 53rd Avenue
• Underground station on north side of campus
HCT TERMINUS & OTHER DECISIONS CURRENTLY UNDER REVIEW
In November 2015, staff recommended removing the downtown Tualatin terminus for consideration at the January 2016 steering committee meeting. In order to provide up-to-date information for a February mode decision, the base and PCC alignments analyzed in this memo assume steering committee agreement with the recommendation and terminate at Bridgeport Village for both BRT and LRT.
The other alignments recommended for removal in the November report, which include the two loop options in downtown Tigard and a portion of the adjacent to I-5 option, are not included in the base alignment and thus are not discussed in this document.
ASSUMED IMPACTS
HCT would be able to provide fast, reliable travel times by operating mostly in exclusive transit lanes. The transitway itself would require an extra 26 to 28 feet of width, plus more at stations and where upgraded bike lanes and sidewalks are needed. In some areas, vacant land or under-utilized parking would make it easy to find this extra width with few impacts, but in others it may be necessary to convert one or two auto lanes to transit use or widen the roadway and purchase the adjacent properties.
Converting auto lanes to transit use is only under consideration in areas where preliminary traffic analysis indicates that doing so would not negatively impact traffic. Accordingly, two auto lanes would be maintained in each direction along Barbur Boulevard from the Barbur Transit Center to Naito Parkway. South of Tigard, LRT and BRT would be mostly out of roadways altogether.
Alignment assumptions
8Summary table: project goals
bus rapid transit (BRT) light rail (LRT)
base* PCC* base* PCC*
lan
d u
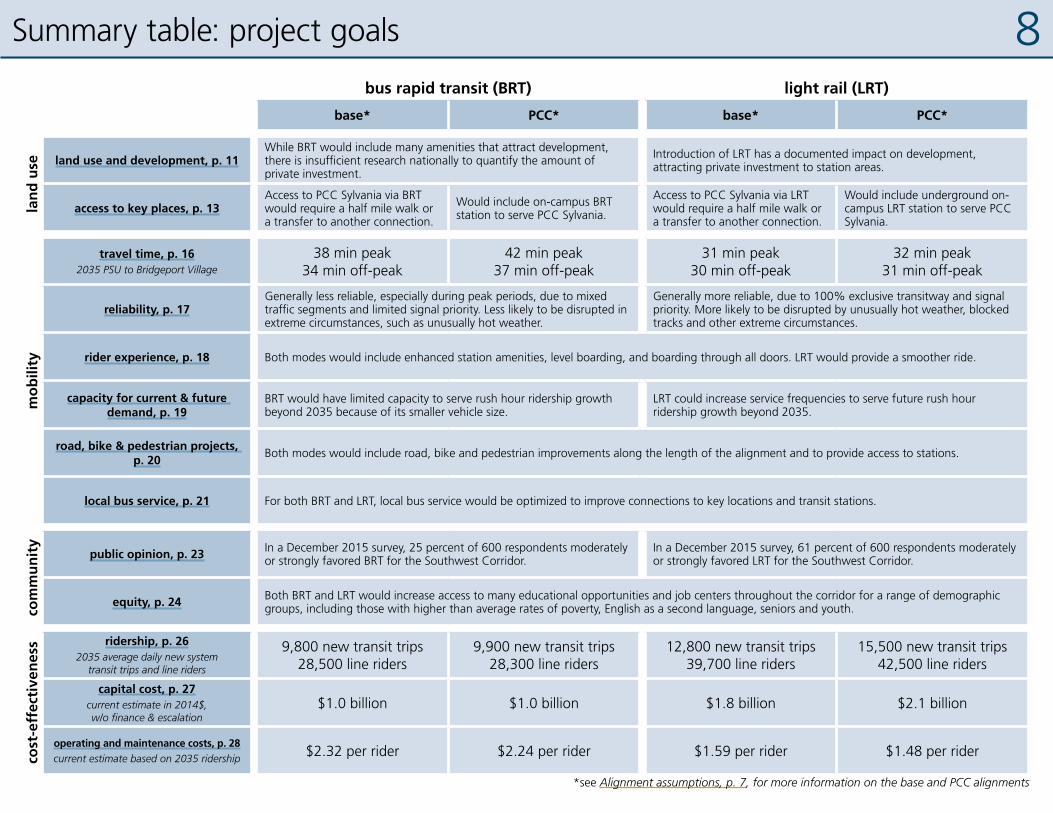
se land use and development, p. 11While BRT would include many amenities that attract development, there is insufficient research nationally to quantify the amount of private investment.
Introduction of LRT has a documented impact on development, attracting private investment to station areas.
access to key places, p. 13Access to PCC Sylvania via BRT would require a half mile walk or a transfer to another connection.
Would include on-campus BRT station to serve PCC Sylvania.
Access to PCC Sylvania via LRT would require a half mile walk or a transfer to another connection.
Would include underground on-campus LRT station to serve PCC Sylvania.
mo
bili
ty
travel time, p. 162035 PSU to Bridgeport Village
38 min peak 34 min off-peak
42 min peak 37 min off-peak
31 min peak30 min off-peak
32 min peak31 min off-peak
reliability, p. 17Generally less reliable, especially during peak periods, due to mixed traffic segments and limited signal priority. Less likely to be disrupted in extreme circumstances, such as unusually hot weather.
Generally more reliable, due to 100% exclusive transitway and signal priority. More likely to be disrupted by unusually hot weather, blocked tracks and other extreme circumstances.
rider experience, p. 18 Both modes would include enhanced station amenities, level boarding, and boarding through all doors. LRT would provide a smoother ride.
capacity for current & future demand, p. 19
BRT would have limited capacity to serve rush hour ridership growth beyond 2035 because of its smaller vehicle size.
LRT could increase service frequencies to serve future rush hour ridership growth beyond 2035.
road, bike & pedestrian projects, p. 20
Both modes would include road, bike and pedestrian improvements along the length of the alignment and to provide access to stations.
local bus service, p. 21 For both BRT and LRT, local bus service would be optimized to improve connections to key locations and transit stations.
com
mu
nit
y
public opinion, p. 23 In a December 2015 survey, 25 percent of 600 respondents moderately or strongly favored BRT for the Southwest Corridor.
In a December 2015 survey, 61 percent of 600 respondents moderately or strongly favored LRT for the Southwest Corridor.
equity, p. 24 Both BRT and LRT would increase access to many educational opportunities and job centers throughout the corridor for a range of demographic groups, including those with higher than average rates of poverty, English as a second language, seniors and youth.
cost
-eff
ecti
ven
ess ridership, p. 26
2035 average daily new system transit trips and line riders
9,800 new transit trips28,500 line riders
9,900 new transit trips28,300 line riders
12,800 new transit trips39,700 line riders
15,500 new transit trips42,500 line riders
capital cost, p. 27current estimate in 2014$, w/o finance & escalation
$1.0 billion $1.0 billion $1.8 billion $2.1 billion
operating and maintenance costs, p. 28current estimate based on 2035 ridership
$2.32 per rider $2.24 per rider $1.59 per rider $1.48 per rider
*see Alignment assumptions, p. 7, for more information on the base and PCC alignments

9Summary table: logistics
bus rapid transit (BRT) light rail (LRT)
base* PCC* base* PCC*
op
erat
ion
s
vehicle capacity, p. 30 86 passengers per vehicle 266 passengers per vehicle
service frequency, p. 31 2035 PSU to Tigard
(see p. 29 for frequencies south of Tigard)
3.0 min peak (demand for 2.9 min)
12 min off-peak
3.3 min peak12 min off-peak
6.7 min peak15 min off-peak
transit mall capacity, p. 32To meet demand, 18 to 20 BRT vehicles would be added to the Transit Mall in each direction during the peak hour in 2035, which could result in bus bunching at stations and at the northern terminus.
Because a Southwest Corridor LRT line would interline with an existing MAX line, there would be little to no increase in hourly LRT vehicles on the Transit Mall, which would preserve capacity for future system growth.
transit signal treatment, p. 34 Higher service frequencies would limit how often buses would receive signal priority, especially during rush hour.
Less frequent service would allow LRT vehicles to receive signal priority or preemption through most intersections.
interlining, p. 33 Would not interline with another transit line because there would be no BRT line to connect to from the north end of the Transit Mall. Would interline with the MAX yellow or green line.
fin
ance
federal funding, p. 36The absence of comparable high-level BRT projects in the United States makes it more difficult to gauge the competitiveness of a Southwest Corridor BRT project for federal funding.
The Portland region’s history of receiving federal New Starts funding for MAX projects, paired with the anticipated strength of a Southwest Corridor LRT line, suggests that LRT could be competitive for federal funding.
local funding, p. 37While a BRT project would cost less to construct than an LRT project, LRT would outperform BRT in terms of ridership, travel time and capacity for future ridership growth. Due to this difference in both costs and benefits between the two modes, it is difficult to assess the relative feasibility of receiving the necessary local funding.
*see Alignment assumptions, p. 7, for more information on the base and PCC alignments

10LAND USE
Why does land use matter?
The Southwest Corridor Plan is rooted in the adopted local land use plans of the corridor communities, including the Barbur Concept Plan, the Tigard High Capacity Transit Land Use Plan, Linking Tualatin and the Sherwood Town Center Plan. The project could support these land use visions by encouraging private investment in residential and commercial development along the HCT alignment. In addition to land use and development goals, each city identified and prioritized key places throughout the corridor to connect to the high capacity transit alignment, including Marquam Hill, Crossroads (Barbur Transit Center), downtown Tigard and Bridgeport Village.
Key questions:
• How well would BRT and LRT support the land use visions of the corridor communities? How much private investment would BRT or LRT encourage along the HCT alignment?
• What differences are there between the key places that BRT or LRT would serve? How would access to PCC Sylvania differ between BRT and LRT?
Key findings:
• Both BRT and LRT would serve many of the areas prioritized for future development in the corridor land use vision.
• Introduction of LRT has a documented impact on development, attracting private investment to station areas. While BRT includes many of the same amenities as LRT and streetcar that attract development, there is insufficient research nationally to quantify the amount of private investment.
• Both modes would directly or indirectly improve transit access to several ‘essential’ key places throughout the corridor, including Marquam Hill, the Tigard Triangle and Bridgeport Village.
• BRT and LRT would have stations in similar locations, with the exception of the PCC Sylvania area. BRT could serve the Sylvania campus directly at little additional capital cost, while LRT would require a tunnel in order to provide direct service to the campus. Several concepts are under consideration for improving access to the campus with HCT on Barbur (base alignment), including a bus hub on campus, an aerial tram to a station at Barbur/53rd and a special branded bus that could share the HCT transitway in certain areas to bypass traffic.RELATED PROJECT GOALS
· Improve potential for housing and commercial development in the corridor and encourage development in centers and transit-oriented development at stations along the corridor
· Improve multimodal access to a range of housing types and businesses in growing communities

11LAND USE | land use and development: land use vision
How well would BRT and LRT support the land use visions of the corridor communities?
To create the Southwest Corridor Plan, representatives of cities and counties throughout the corridor looked to local land use plans and policies to identify areas where the communities wanted to focus new development. The resulting ‘land use vision’ compiled and coordinated these plans. The map on the right illustrates these land use goals for the corridor, highlighting areas where communities envision retail, commercial, employment, industrial, mixed use and higher intensity residential development.
As a result of this land use focused process, the HCT alignments have been designed to improve access to the places in the corridor that have been prioritized for future development. Locations identified for future development in the land use vision that could be served by the HCT line include Marquam Hill (with a bike/pedestrian connection), the historic segment of Barbur Boulevard, the PCC Sylvania area, downtown Tigard, the Tigard Triangle and Bridgeport Village.
In addition to the HCT line under consideration, project partners have identified many priority roadway, bike and pedestrian projects that would improve access to the key destinations in the corridor and further support the land use vision. These projects would improve access not only along the HCT line and to its stations, but also in other areas not directly served by HCT, such as Sherwood and King City. See road, bike & pedestrian projects, p. 20, for more information on these projects.
RELATED CONSIDERATIONS
· access to key places, p. 13
· equity, p. 24

12LAND USE | land use and development: impact on private investment
RELATED CONSIDERATIONS
· access to key places, p. 13
· equity, p. 24
How much private investment would BRT or LRT encourage along the HCT alignment?
In an attempt to quantify the effects of HCT on potential future development outcomes, Metro commissioned Johnson Economics to run a predictive development model for the corridor. The results of that work are summarized here.
Existing literature is extensive on the effects of LRT on development, with years of statistically relevant data that point to a clear value premium associated with this particular transit investment. Consequently, the LRT outputs from the model show impacts on development in the corridor that align with national trends and are grounded by local experience. The following table summarizes the assumed average value premiums for properties within the impact radius, for both a low range and a high range estimate:
LRT value premium (base)
use type impact radius low range high range
ownership residential 1/4 mile 4.0% 6.0%
rental residential 1/4 mile 5.6% 8.4%
office 1/8 mile 9.6% 14.4%
retail 1/8 mile 8.0% 12.0%
The table below summarizes the predictive increase in development activity that could happen over 20 years as a result of an LRT investment in the Southwest Corridor. The model estimates that the value premiums associated with LRT would effectively increase development outcomes along the corridor by approximately 13 to 15 percent overall.
increased development with LRT over 20 years (base)construction investment residential units
commercial space
change in real market value
low range $574 million 5,100 23,100 $836 million
high range $642 million 5,600 75,400 $930 million
The land development impacts of BRT have not been extensively studied. Since there are few BRT lines in the United States with a design similar to that of the proposed Southwest Corridor BRT, there is a lack of viable data to establish value premiums for the model. However, the BRT envisioned for the Southwest Corridor would include many of the design elements of light rail and streetcar projects that are known to encourage private investment, including stations with shelters, benches, and real-time arrival information, a permanent alignment largely in exclusive right-of-way, branding, and high projected ridership. Based on the quality of the BRT line under consideration, it can be assumed that it would induce some level of development, but there is insufficient data to quantify an amount.
13LAND USE | access to key places
What differences are there between the key places that BRT or LRT would serve?
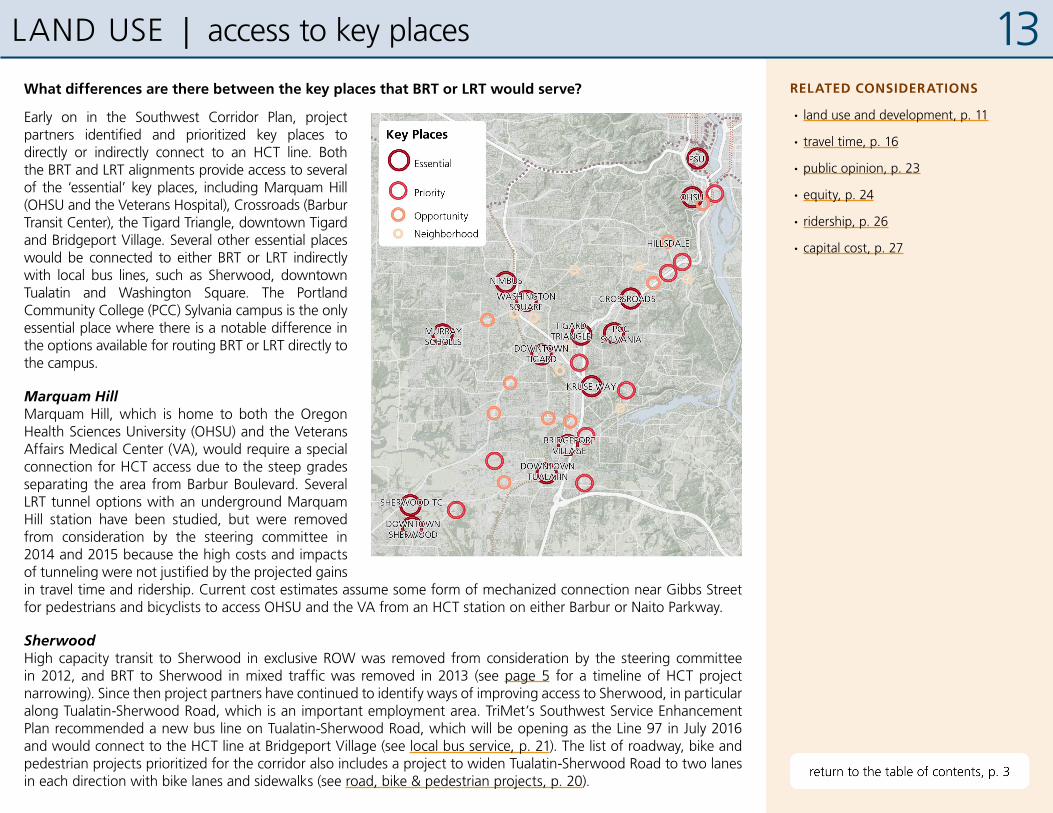
Early on in the Southwest Corridor Plan, project partners identified and prioritized key places to directly or indirectly connect to an HCT line. Both the BRT and LRT alignments provide access to several of the ‘essential’ key places, including Marquam Hill (OHSU and the Veterans Hospital), Crossroads (Barbur Transit Center), the Tigard Triangle, downtown Tigard and Bridgeport Village. Several other essential places would be connected to either BRT or LRT indirectly with local bus lines, such as Sherwood, downtown Tualatin and Washington Square. The Portland Community College (PCC) Sylvania campus is the only essential place where there is a notable difference in the options available for routing BRT or LRT directly to the campus.
Marquam HillMarquam Hill, which is home to both the Oregon Health Sciences University (OHSU) and the Veterans Affairs Medical Center (VA), would require a special connection for HCT access due to the steep grades separating the area from Barbur Boulevard. Several LRT tunnel options with an underground Marquam Hill station have been studied, but were removed from consideration by the steering committee in 2014 and 2015 because the high costs and impacts of tunneling were not justified by the projected gains in travel time and ridership. Current cost estimates assume some form of mechanized connection near Gibbs Street for pedestrians and bicyclists to access OHSU and the VA from an HCT station on either Barbur or Naito Parkway.
SherwoodHigh capacity transit to Sherwood in exclusive ROW was removed from consideration by the steering committee in 2012, and BRT to Sherwood in mixed traffic was removed in 2013 (see page 5 for a timeline of HCT project narrowing). Since then project partners have continued to identify ways of improving access to Sherwood, in particular along Tualatin-Sherwood Road, which is an important employment area. TriMet’s Southwest Service Enhancement Plan recommended a new bus line on Tualatin-Sherwood Road, which will be opening as the Line 97 in July 2016 and would connect to the HCT line at Bridgeport Village (see local bus service, p. 21). The list of roadway, bike and pedestrian projects prioritized for the corridor also includes a project to widen Tualatin-Sherwood Road to two lanes in each direction with bike lanes and sidewalks (see road, bike & pedestrian projects, p. 20).
RELATED CONSIDERATIONS
· land use and development, p. 11
· travel time, p. 16
· public opinion, p. 23
· equity, p. 24
· ridership, p. 26
· capital cost, p. 27
14
WILSONVILLE
TUALATIN
SHERWOOD
TIGARD
BEAVERTON
HILLSDALE
LAKEOSWEGO
MILWAUKIE
SELLWOOD
HOLLYWOOD
EXPOCENTER
PORTLAND
WEST LINN
PCC
BRT
WILSONVILLE
TUALATIN
SHERWOOD
TIGARD
BEAVERTON
HILLSDALE
LAKEOSWEGO
MILWAUKIE
SELLWOOD
HOLLYWOOD
EXPOCENTER
PORTLAND
WEST LINN
PCC
LRT
LAND USE | access to key places: PCC Sylvania
RELATED CONSIDERATIONS
· land use and development, p. 11
· travel time, p. 16
· public opinion, p. 23
· equity, p. 24
· ridership, p. 26
· capital cost, p. 27
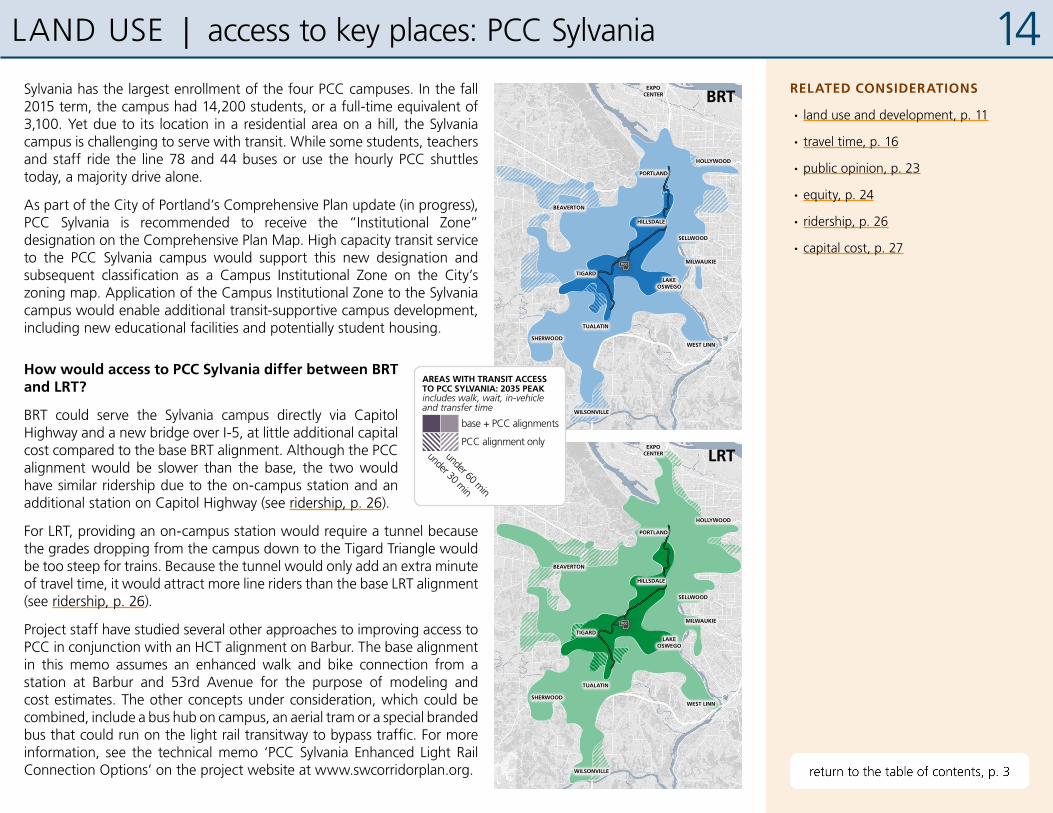
Sylvania has the largest enrollment of the four PCC campuses. In the fall 2015 term, the campus had 14,200 students, or a full-time equivalent of 3,100. Yet due to its location in a residential area on a hill, the Sylvania campus is challenging to serve with transit. While some students, teachers and staff ride the line 78 and 44 buses or use the hourly PCC shuttles today, a majority drive alone.
As part of the City of Portland’s Comprehensive Plan update (in progress), PCC Sylvania is recommended to receive the “Institutional Zone” designation on the Comprehensive Plan Map. High capacity transit service to the PCC Sylvania campus would support this new designation and subsequent classification as a Campus Institutional Zone on the City’s zoning map. Application of the Campus Institutional Zone to the Sylvania campus would enable additional transit-supportive campus development, including new educational facilities and potentially student housing.
How would access to PCC Sylvania differ between BRT and LRT?
BRT could serve the Sylvania campus directly via Capitol Highway and a new bridge over I-5, at little additional capital cost compared to the base BRT alignment. Although the PCC alignment would be slower than the base, the two would have similar ridership due to the on-campus station and an additional station on Capitol Highway (see ridership, p. 26).
For LRT, providing an on-campus station would require a tunnel because the grades dropping from the campus down to the Tigard Triangle would be too steep for trains. Because the tunnel would only add an extra minute of travel time, it would attract more line riders than the base LRT alignment (see ridership, p. 26).
Project staff have studied several other approaches to improving access to PCC in conjunction with an HCT alignment on Barbur. The base alignment in this memo assumes an enhanced walk and bike connection from a station at Barbur and 53rd Avenue for the purpose of modeling and cost estimates. The other concepts under consideration, which could be combined, include a bus hub on campus, an aerial tram or a special branded bus that could run on the light rail transitway to bypass traffic. For more information, see the technical memo ‘PCC Sylvania Enhanced Light Rail Connection Options’ on the project website at www.swcorridorplan.org.
base + PCC alignments
PCC alignment onlyunder 30 min
under 60 min
AREAS WITH TRANSIT ACCESS TO PCC SYLVANIA: 2035 PEAKincludes walk, wait, in-vehicle and transfer time

15MOBILITY
Why does mobility matter?
Many of the project goals focus on improving mobility throughout the corridor by providing a range of safe, fast, reliable and accessible options for getting around. Mobility encompasses not only the improvements that HCT would provide, but also roadway, bike and pedestrian projects and local bus service changes that could be implemented along with HCT. Because the corridor and region are growing, it is also important to assess whether each mode will provide the capacity to serve future transit demand.
Key questions:
• How would travel time compare between BRT and LRT? Why would BRT be slower than LRT?
• How would reliability compare between BRT and LRT?
• How would the rider experience differ from standard buses and between BRT and LRT?
• Would each mode serve the projected ridership demand both today and into the future?
• What road, bike and pedestrian projects are included in the Southwest Corridor Plan? Would either mode allow for more roadway, bike and pedestrian projects in the corridor?
• What local bus service changes are proposed for the corridor? What differences would there be between BRT and LRT in terms of local bus service?
Key findings:
• For the base alignment, LRT would usually be around 4 minutes faster than BRT, but 7 minutes faster during rush hour. Direct HCT service to PCC Sylvania campus would add 1 minute for LRT and 3 to 4 minutes for BRT.
• LRT would be more reliable day-to-day, but BRT would be less likely to be disrupted in extreme circumstances such as unusually hot weather or obstacles blocking the transitway.
• Both modes would include enhanced station amenities compared to local bus stops, level boarding and boarding through all doors, but LRT would provide a smoother ride.
• BRT would have limited capacity to serve rush hour ridership growth beyond 2035 because of its smaller vehicle size. LRT could increase service frequencies to double its peak capacity beyond 2035.
• Both BRT and LRT would include bike and pedestrian improvements along the alignment and to provide access to stations.
• For either mode, local bus service would be adjusted with HCT to optimize service and allocate operating hours efficiently and equitably throughout the corridor. The lower per-rider operating cost of LRT may help allow for more of the local bus improvements identified in the Service Enhancement Plan.
RELATED PROJECT GOALS
· Serve the existing and projected transit demand in the corridor
· Improve transit service reliability in the corridor
· Improve transit frequency and travel times
· Provide options that reduce overall transportation costs
· Improve multimodal access to a range of housing types and businesses in growing communities
· Increase multimodal transportation options and improve mobility in the corridor
· Complete multimodal transportation networks in the corridor
· Advance transportation projects that increase active transportation and encourage physical activity

162035 TRAVEL TIME | PSU to Bridgeport Village
PCC
PSUBarbur TC
Tigard TC
Bridgeport
off-peak segment time total time
segment time total time
base
5040302010
31 min 32 min
31 min 30 min
37 min 42 min
34 min 38 min
14 11 6
15 11 6
15 10 6
14 10 6LRT
BRT18
15
18
15
7
7
18
15
13
12
7
7
rush hour
base
PCC
NOTE: Due to rounding, segment times may not add up to total times.
How would travel time compare between BRT and LRT?
The chart on the right shows the estimated peak (rush hour) and off-peak travel times for the base and PCC alignments for each mode in 2035. For the base alignment, LRT would usually be around 4 minutes faster than BRT, but 7 minutes faster during rush hour. Direct HCT service to PCC Sylvania would add 1 minute for LRT and 3 to 4 minutes for BRT.
Travel times would differ between the peak and off-peak periods because of the extra delay time HCT would experience at some signalized intersections during rush hour. Signal delay times have been estimated for both BRT and LRT and are at least partially included in the travel times presented here and the assumptions for the travel demand model. BRT is estimated to experience an average of 6 minutes of delay in the peak and 2 minutes in the off-peak in 2035. For LRT, the range of signal delay is estimated to be 40 seconds to 2 minutes in the peak only. This 40 seconds of peak delay has been incorporated into the travel times and the ridership assumptions. With the full 2 minutes of peak delay at signals, LRT ridership would be slightly lower.
Why would BRT be slower than LRT?BRT would be 4 to 7 minutes slower than LRT for three primary reasons:
• LRT would run exclusively in its own transitway and interact with auto traffic only at intersections, which would allow for reliable travel times. For BRT, these travel times assume 16 percent of the alignment would operate in mixed traffic in order to reduce costs and minimize impacts. (See reliability, p. 17, for a map of where BRT could potentially operate in mixed traffic.) Congestion in the mixed traffic segments could slow down the BRT vehicles and affect reliability.
• There is more operator variability for BRT than for LRT due to the additional need to guide the BRT vehicles from side to side in a dedicated transitway, as well as interactions with other vehicles while in mixed traffic.
• Particularly during the peak periods, the higher service frequency of BRT would result in extra delay time at signals because not all vehicles could receive signal priority (see transit signal treatment, p. 34).
MOBILITY | travel time
RELATED CONSIDERATIONS
· access to key places, p. 13
· reliability, p. 17
· rider experience, p. 18
· public opinion, p. 23
· service frequency, p. 31
· transit signal treatment, p. 34

17MOBILITY | reliability
How would reliability compare between BRT and LRT?
Based on modal characteristics and preliminary design, general assumptions can be made about reliability for BRT and LRT in the Southwest Corridor, both in terms of day-to-day performance and extreme circumstances.
In terms of day-to-day reliability, meaning both on-time performance and variation in travel times, LRT would likely outperform BRT on average because it would receive signal priority more often than BRT due to the ability of trains to hold more people than buses, resulting in more time between trains (see transit signal treatment, p. 34). Additionally, LRT would operate only in exclusive transitways while BRT would include portions in mixed traffic to reduce costs and property impacts. The current assumption is that about 2 miles (16 percent) of the BRT alignment would run in mixed traffic, or up to about 3 miles (24 to 27 percent) if mixed traffic options along Barbur Boulevard or Capitol Highway near PCC Sylvania are included. Within these mixed traffic areas BRT may be unable to bypass congestion. See the map below for the mixed traffic segments currently assumed for the purpose of modeling ridership and travel times and estimating capital costs.
Additionally, BRT vehicles would be more likely to bunch together due to the higher service frequency required to meet ridership demand, especially during the peak hours, when vehicles may need to run 3 minutes apart by 2035. Once buses bunch together, arriving at stations at the same time rather than evenly distributed, the wait time between bus arrivals would increase and buses would be more likely to run off schedule. (Note that bus bunching, or platooning, could theoretically be implemented intentionally as a means of improving on-time performance while sacrificing scheduled frequency, but would likely be infeasible for a Southwest Corridor BRT line). See vehicle capacity, p. 30, for more information.)
In extreme circumstances, the flexibility of BRT can become an asset. While a light rail train could be delayed as a result of blocked tracks, BRT vehicles could depart from the transitway to avoid an obstacle. Additionally, BRT vehicles would not be hindered by unusually hot weather, which can delay LRT by restricting maximum travel speeds. Both modes could be delayed as a result of power outages to traffic signals, though LRT would require substitute shuttle buses if the power supply to the train was lost.
RELATED CONSIDERATIONS
· travel time, p. 16
· rider experience, p. 18
· public opinion, p. 23
· service frequency, p. 31
· transit signal treatment, p. 34
18MOBILITY | rider experience
How would the rider experience differ from standard buses and between BRT and LRT?
BRT in the Southwest Corridor would be relatively similar to LRT in terms of station amenities and the boarding process. At stations, both modes would have shelters, benches and real-time arrival information. Both modes would provide level boarding using raised stations and low-floor vehicles, which improves accessibility and speeds up boarding times. BRT and LRT would both use advance payment with TriMet’s upcoming electronic fare system, which also speeds up boarding times and allows people to board at any door.
BRT could include bike storage either within the vehicles, as seen on existing MAX trains, or on the front of the vehicles, like a standard TriMet bus. Bike storage on the front of the BRT vehicles would increase delay time at stations compared to what is currently assumed in the travel times and modeling results.
For both BRT and LRT, the exclusive transitway can improve the rider experience by providing a more prominent view of where the HCT line runs. Mixed-traffic sections of the BRT alignment may not provide as strong of a visual cue of where the route is going.
While modern BRT vehicles provide a comparable level of amenities to light rail, they are often challenged to provide an equal ride quality. Since trains run on tracks rather than pavement and turning movements are more gradual and less frequent, LRT vehicles typically deliver a smoother ride than buses, thus making it easier to read or work on board. Additionally, articulated BRT buses, which allow for more passengers than the standard TriMet buses, include a trailer that tends to sway, causing more vertical and horizontal movement for riders in the back.
RELATED CONSIDERATIONS
· travel time, p. 16
· reliability, p. 17
· public opinion, p. 23
· ridership, p. 26
· service frequency, p. 31
· interlining, p. 33

19
RID
ERS
PER
HO
UR
5,000
4,000
3,000
2,000
1,000
BRT LRT
89%
42% 43%
PCCbase PCCbase
2035 hourly ridership demand during rush hour at the busiest point on the line (Barbur Blvd & Gibbs St)
101%
demand exceeds capacity
capacity for about 200
more riders per hour
capacity for about 3,000 more riders per
hour beyond 2035 with increased service
MOBILITY | capacity for current & future demand
Would each mode serve the projected ridership demand both today and into the future?
Long-term ridership capacity for BRT and LRT would be constrained by the maximum service frequency that the Transit Mall in downtown Portland would allow. An analysis of Transit Mall operations found that either BRT or LRT could operate at a frequency of up to 3 minutes without significant issues on the Transit Mall. (See service frequency, p. 31, and transit mall capacity, p. 32, for more information.) For BRT, this 3 minute frequency restriction would result in overcrowding during weekday rush hours sooner because of the smaller vehicle size.
At 86 passengers per bus, the maximum hourly passenger capacity of BRT would be around 1,720. Ridership projections estimate a rush hour demand of approximately 1,540 to 1,740 passengers per hour at the busiest point on the line by 2035. The PCC alignment for BRT would have lower demand at the busiest point along the line, Barbur and Gibbs Street, because fewer people would take trips from south of PCC to north of Barbur/Gibbs as a result of the slower travel times compared to the base alignment. Ridership to the Sylvania campus would be higher with direct access, but many of these people would come from south and west of the campus and thus wouldn’t contribute to the crowding at Barbur and Gibbs. Beyond 2035, there would be no additional rush hour capacity for the base alignment, but the PCC alignment would have room for around 180 additional riders per hour. In other words, 89 to 100 percent of the maximum rush hour capacity would be utilized by 2035 with BRT.
Light rail, with a vehicle capacity of 266 passengers, could accommodate a maximum of 5,320 riders per hour. Ridership projections estimate a rush hour demand of around 2,300 passengers per hour at the busiest point in 2035. Beyond 2035, the line could eventually serve over 3,000 more riders per hour by increasing the service frequency to up to 3 minutes. In other words, in 2035, the LRT line would be utilizing less than half of its long-term maximum rush hour capacity, allowing for significant growth in ridership for the future as the region grows.
(Note that service frequencies of 3 minutes could result in more signal delay than the 40 seconds to 2 minutes currently assumed for LRT with 6.7 minute headways during rush hour in 2035. See travel time, p. 16, for more information.)
RELATED CONSIDERATIONS
· ridership, p. 26
· vehicle capacity, p. 30
· service frequency, p. 31
· transit mall capacity, p. 32

20MOBILITY | road, bike & pedestrian projects
What road, bike and pedestrian projects are included in the Southwest Corridor Plan?
The current capital cost estimates already include approximately $75 million in road, bike and pedestrian projects that overlap with the HCT alignments, such as bringing bike lanes and sidewalks along Barbur Boulevard up to current standards and adding a new crossing over OR-217 for transit, bikes, pedestrians and potentially autos. Many other projects have been identified to improve access to HCT stations, and would also be eligible for federal transit funding, but haven’t yet been incorporated into the HCT capital costs.
Project partners have also prioritized a list of projects that would improve access to key places and support the land use vision throughout the Southwest Corridor communities. This broader list includes projects such as widening Tualatin-Sherwood Road to improve connectivity along an important industrial employment corridor.
The map on the right shows all of the roadway, bike and pedestrian projects that have been prioritized for the Corridor, including the projects along the HCT alignment, the station-supportive projects and the broader land use supportive projects.
Would either mode allow for more roadway, bike and pedestrian projects in the corridor?
There is currently no assumption that either mode would allow for more roadway, bike and pedestrian projects than the other. Because the funding strategy for either mode has not yet been developed, it is too early to tell what implications the difference in project capital cost between BRT and LRT would have on the capacity to fund other projects around the corridor or the region.
RELATED CONSIDERATIONS
· equity, p. 24
· capital cost, p. 27
· local funding, p. 37
21MOBILITY | local bus service
What local bus service changes are proposed for the corridor?
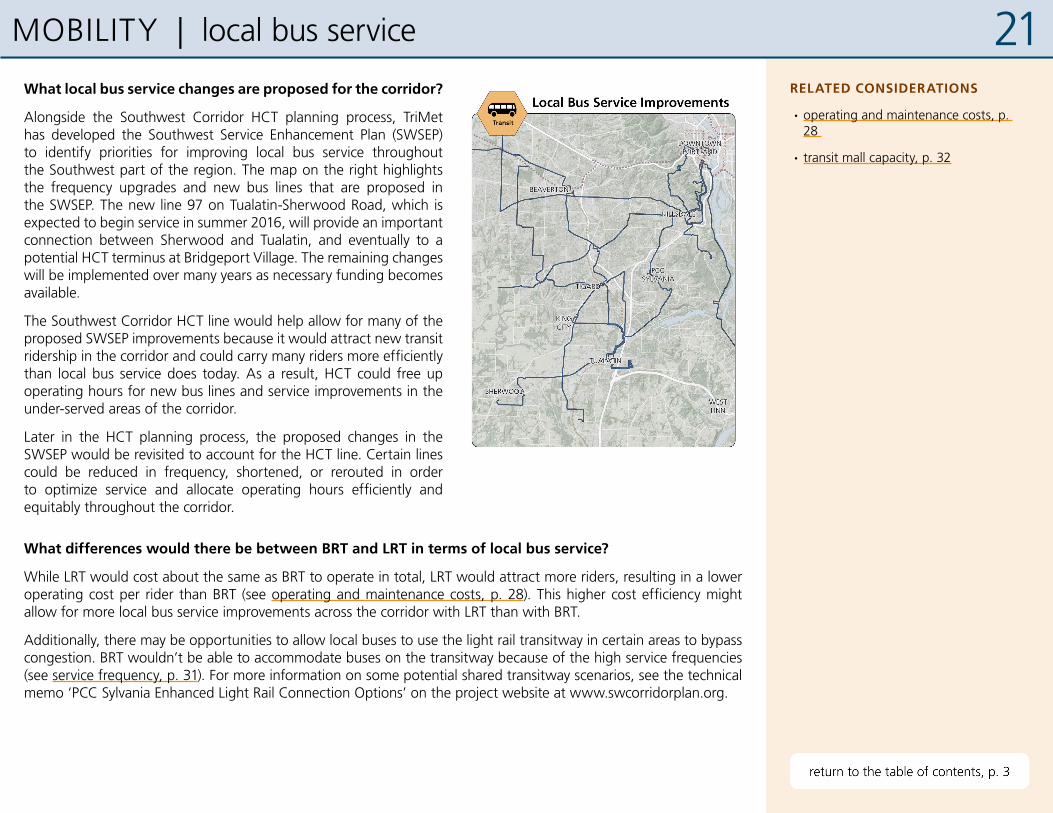
Alongside the Southwest Corridor HCT planning process, TriMet has developed the Southwest Service Enhancement Plan (SWSEP) to identify priorities for improving local bus service throughout the Southwest part of the region. The map on the right highlights the frequency upgrades and new bus lines that are proposed in the SWSEP. The new line 97 on Tualatin-Sherwood Road, which is expected to begin service in summer 2016, will provide an important connection between Sherwood and Tualatin, and eventually to a potential HCT terminus at Bridgeport Village. The remaining changes will be implemented over many years as necessary funding becomes available.
The Southwest Corridor HCT line would help allow for many of the proposed SWSEP improvements because it would attract new transit ridership in the corridor and could carry many riders more efficiently than local bus service does today. As a result, HCT could free up operating hours for new bus lines and service improvements in the under-served areas of the corridor.
Later in the HCT planning process, the proposed changes in the SWSEP would be revisited to account for the HCT line. Certain lines could be reduced in frequency, shortened, or rerouted in order to optimize service and allocate operating hours efficiently and equitably throughout the corridor.
What differences would there be between BRT and LRT in terms of local bus service?
While LRT would cost about the same as BRT to operate in total, LRT would attract more riders, resulting in a lower operating cost per rider than BRT (see operating and maintenance costs, p. 28). This higher cost efficiency might allow for more local bus service improvements across the corridor with LRT than with BRT.
Additionally, there may be opportunities to allow local buses to use the light rail transitway in certain areas to bypass congestion. BRT wouldn’t be able to accommodate buses on the transitway because of the high service frequencies (see service frequency, p. 31). For more information on some potential shared transitway scenarios, see the technical memo ‘PCC Sylvania Enhanced Light Rail Connection Options’ on the project website at www.swcorridorplan.org.
RELATED CONSIDERATIONS
· operating and maintenance costs, p. 28
· transit mall capacity, p. 32

22COMMUNITY
Why does community matter?
Decision makers consider technical and operational issues along with the public interest and support when determining the best mode for a corridor. Transportation models indicate that more riders would choose to ride light rail than bus rapid transit, but this should be considered along with input from the public. Ultimately the success of an HCT project relies on transit riders using the line since it meets their daily needs and supports desires for their communities.
Key questions:
• What is known about public preferences for BRT or LRT?
• What differences are there between BRT and LRT in terms of equity?
Key findings:
• To date, a majority of survey respondents moderately or strongly prefer LRT over BRT.
• The public has requested additional information regarding the trade-offs and details of both LRT and BRT, including more information on how either mode would impact traffic, cost-benefit analysis, how either mode may impact redevelopment opportunities and housing affordability, and how existing bus service would be impacted.
• Both BRT and LRT would increase access to many educational opportunities and job centers throughout the corridor for a range of demographic groups, including those with higher than average rates of poverty, English as a second language, seniors and youth.
• Based on current designs, both modes would improve bike and pedestrian facilities along the length of the HCT line.
RELATED PROJECT GOALS
· Provide options that reduce overall transportation costs
· Improve multimodal access to a range of housing types and businesses in growing communities
· Ensure benefits and impacts promote community equity

23
Results from December 2015 online survey (600 responses)
strong BRTsupport
moderate BRTsupport
strong LRTsupport
moderate LRTsupport
neutral/don’t know
16% 9% 14% 15% 46%
COMMUNITY | public opinion
What is known about public preferences for BRT or LRT?
To date, project partners have collected public input on a preferred mode for the Southwest Corridor through open-ended questionnaires, online surveys, and in-person dialogue. Closed-ended survey responses in May, June, October and November 2015 point to important factors and outcomes that the public wants decision makers to consider for the project, including:
• reliable, fast travel times
• high ridership numbers that will result in fewer cars on the road
• access to employment and education centers
Open-ended survey questions and in-person discussions have provided a sense of how the public views the trade-offs between the mode options, and what further information people need in order to form an opinion about their preference. A sampling of comments include:
• Some respondents perceive BRT to be less noisy, more flexible and less expensive
• Some respondents feel that LRT is worth the upfront additional expense in order to have a system that will serve ridership long into the future
• Some respondents feel that LRT will be a more attractive option for the most riders
• Some respondents want more detail about how BRT would function in the corridor, including the location of transit stops and where BRT may run in mixed traffic
• Some respondents want more information on the costs and benefits of each option
• Some respondents want more information about how either mode option would impact existing local bus service
• Some respondents want more information about how each mode option would impact redevelopment potential for new retail, housing and employment in the area
In a December 2015 online survey, people were asked to indicate their preference between BRT and LRT for a Southwest Corridor HCT line. Respondents favored LRT over BRT at over a two to one ratio (61 percent LRT and 25 percent BRT), and 14 percent were unsure or neutral.
There will be several additional opportunities for the public to ask questions and provide feedback on their preferred mode choice in January and February.
RELATED CONSIDERATIONS
· access to key places, p. 13
· travel time, p. 16
· reliability, p. 17
· rider experience, p. 18

24COMMUNITY | equity
What differences are there between BRT and LRT in terms of equity?
Populations with increased access to high capacity transitBoth BRT and LRT would increase access to many educational opportunities and job centers throughout the corridor for a range of demographic groups, including those with higher than average rates of poverty, English as a second language, seniors and youth. Because LRT would provide faster and more reliable travel times and people generally prefer riding in trains over buses, more people would view LRT as a viable mode of transportation and shift over from driving, biking or walking (see ridership, p. 26).
In the future, BRT would reach its maximum capacity at rush hour sooner than LRT (see capacity for current & future demand, p. 19). Over-crowded buses during the peak hour would lead people to wait longer for an emptier vehicle, adjust their travel schedules to avoid the busiest times, or choose a different way to travel.
Walk/bike improvements and access for seniors, youth and people who don’t driveBased on current designs, both modes would improve bike and pedestrian facilities along the length of the HCT line. Either mode would also include improvements to increase safety and access for people traveling to HCT stations, which would be eligible for 50 percent federal funding as part of the transit package. These projects would include bike lanes, sidewalks and new crosswalks. See road, bike & pedestrian projects, p. 20, for more information.
Access to educationIncreasing access to educational opportunities in the corridor is one of the top priorities identified by the public when they are asked what benefits they want to see from the Southwest Corridor project. Either mode would connect people to a variety of high schools, colleges and universities throughout the corridor. These connections would increase access for a diverse group of residents to educational and career opportunities, which could impact family stability, earning potential, and regional economic development.
In particular, increasing region-wide access to PCC Sylvania has been identified as an important project outcome. Direct HCT access to the campus could be provided at little additional capital cost with BRT, but would require a costly tunnel for LRT. Other approaches to improving access to PCC along with an LRT alignment on Barbur Boulevard are also being studied, such as a bus hub concept, an aerial tram and a special branded bus that could share the LRT transitway. See access to key places, p. 13, for more information.
Access to job centersIncreasing access to job centers and employment opportunities in the corridor is also one of the top project priorities identified by the public. Selecting LRT or BRT as the preferred mode would not directly impact how the HCT line would connect to existing and future job centers in the corridor.
RELATED CONSIDERATIONS
· land use and development, p. 11
· access to key places, p. 13
· road, bike & pedestrian projects, p. 20
· ridership, p. 26

25COST-EFFECTIVENESS
Why does cost-effectiveness matter?
Because there are considerable differences between BRT and LRT in terms of both costs and benefits, it is important to understand these trade-offs. This section includes the current estimates of ridership, capital cost and operating cost for each mode, but the goal of this report is not to provide a quantitative cost-benefit analysis of these factors. There is no simple approach to weighing the one-time cost of construction against the ongoing operating and maintenance costs, and such a comparison is further complicated due to the difference in funding sources between capital and operating costs.
It is also critical to understand that the estimates of ridership and operating cost represent one snapshot in time, namely 2035, and would change over time along with changes in population and travel patterns. The current project timeline estimates an opening year around 2025, so the estimates represent approximately 10 years after opening. Ridership demand would likely be lower in the opening year, and would continue to rise beyond 2035.
Key questions:
• How would ridership compare between modes? How would ridership differ with direct HCT service to PCC Sylvania?
• How would capital cost differ between BRT and LRT?
• How would the operating and maintenance cost differ between BRT and LRT?
Key findings:
• Assuming the base alignment for both modes, LRT would attract approximately 31 percent more new system transit trips and 39 percent more line riders than BRT in 2035. The BRT alignment to PCC would have similar ridership to the base alignment because the trips gained by providing direct access to the campus would be offset by the trips lost as a result of the slower travel time. Compared to the base alignment, the LRT tunnel to PCC Sylvania would increase line ridership by 7 percent and new system trips by 21 percent.
• For the base alignment, LRT would cost about 80 percent more than BRT due to the costs of tracks, electrification, utility relocation, etc. The PCC tunnel would add around $330 million, or 18 percent, to the base cost for LRT, while the PCC option for BRT would only add about $10 million (2014$, not including finance costs and escalation). Assuming the PCC alignment for both modes, LRT would cost just over twice as much as BRT.
• Based on 2035 ridership, BRT would cost approximately $2.24 to $2.32 per rider to operate and maintain, and LRT would cost around $1.48 to $1.59.RELATED PROJECT GOALS
· Provide transit service that is cost effective to build and operate with limited local resources

26
50,00040,00030,00020,00010,000
BRT
LRT
2035 AVERAGE WEEKDAY RIDERSHIP
new transit tripsline riders
PCC
base
PCC
base
28,5009,800
28,3009,900
39,70012,800
42,50015,500
COST-EFFECTIVENESS | ridership
RELATED CONSIDERATIONS
· access to key places, p. 13
· rider experience, p. 18
· capacity for current & future demand, p. 19
· equity, p. 24
· service frequency, p. 31
· federal funding, p. 36
Two key numbers are used to measure ridership performance: new system transit trips and line ridership. New system transit trips measures the overall growth in transit ridership across the system, calculated as the difference in the total number of daily transit trips between a scenario with the project and a no-build scenario without the project. These new transit trips could have otherwise been taken by car, bike or walking. Line ridership, in contrast, is the number of trips on the new HCT line each day, irrespective of how those trips would have been taken if the project didn’t exist. This measure includes both the new transit trips and the existing transit riders who would benefit from the improved reliability and travel times that the HCT project would provide.
How would ridership compare between modes?
Assuming the base alignment for both modes, LRT would attract approximately 31 percent more new system transit trips and 39 percent more line riders than BRT on weekdays in 2035.
Why would LRT attract more riders?Light rail is projected to attract more riders than BRT for three reasons. First, LRT service would be faster and more reliable than BRT service, especially during rush hour. Second, it is documented and accepted by the Federal Transit Administration that rail modes attract more riders than buses or BRT. This rider preference for LRT over BRT is programmed into Metro’s travel demand model, as it is in other models utilized throughout the country. Third, LRT would interline with either the existing Green or Yellow MAX line, providing a one-seat ride between the Southwest Corridor and areas east of the Willamette River, which would require transfers with a BRT line that would terminate near Union Station.
How would ridership differ with direct HCT service to PCC Sylvania?
Compared to the base alignment, the LRT tunnel to PCC Sylvania would increase line ridership by 7 percent and new system trips by 21 percent. The BRT alignment to PCC would have similar ridership to the base alignment because the trips gained by providing direct access to the campus would be offset by the trips lost as a result of the slower travel time. In addition, a new park-and-ride lot along Barbur Boulevard near 53rd Avenue is assumed for both the BRT and LRT base alignments and the LRT to PCC alignment, which would all pass by the park-and-ride lot location. BRT to PCC, however, could not access the site because of its route along Capitol Highway, so the park-and-ride lot is not assumed to be included and the resulting ridership is not captured.
Ridership projections do not assume redevelopment at the PCC Sylvania campus location, which could be induced by new HCT service, or alternative connection options such as a PCC Sylvania bus hub or an aerial tram. Actual ridership could be higher depending on future campus development and other connection scenarios.
27COST-EFFECTIVENESS | capital cost
How would capital cost differ between BRT and LRT?
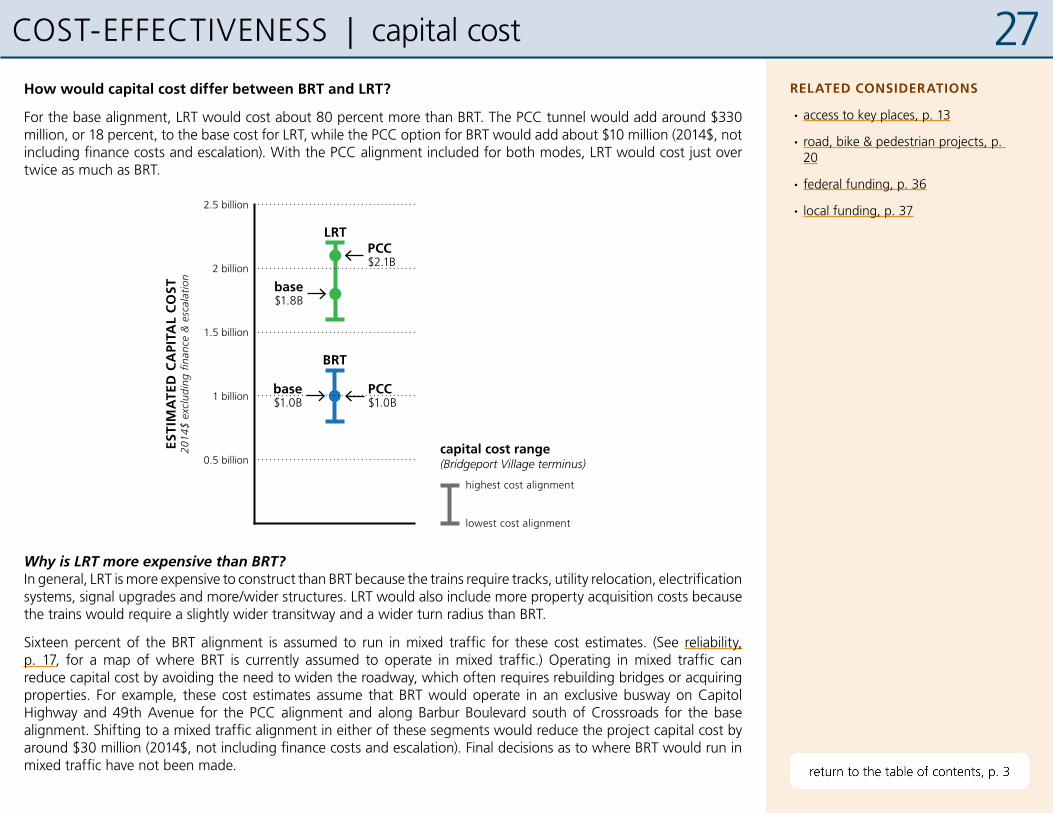
For the base alignment, LRT would cost about 80 percent more than BRT. The PCC tunnel would add around $330 million, or 18 percent, to the base cost for LRT, while the PCC option for BRT would add about $10 million (2014$, not including finance costs and escalation). With the PCC alignment included for both modes, LRT would cost just over twice as much as BRT.
2.5 billion
2 billion
1.5 billion
1 billion
0.5 billion
ESTI
MA
TED
CA
PITA
L C
OST
2014
$ ex
clud
ing
finan
ce &
esc
alat
ion
LRT
base$1.8B
PCC$2.1B
BRT
base$1.0B
PCC$1.0B
highest cost alignment
lowest cost alignment
capital cost range (Bridgeport Village terminus)
Why is LRT more expensive than BRT?In general, LRT is more expensive to construct than BRT because the trains require tracks, utility relocation, electrification systems, signal upgrades and more/wider structures. LRT would also include more property acquisition costs because the trains would require a slightly wider transitway and a wider turn radius than BRT.
Sixteen percent of the BRT alignment is assumed to run in mixed traffic for these cost estimates. (See reliability, p. 17, for a map of where BRT is currently assumed to operate in mixed traffic.) Operating in mixed traffic can reduce capital cost by avoiding the need to widen the roadway, which often requires rebuilding bridges or acquiring properties. For example, these cost estimates assume that BRT would operate in an exclusive busway on Capitol Highway and 49th Avenue for the PCC alignment and along Barbur Boulevard south of Crossroads for the base alignment. Shifting to a mixed traffic alignment in either of these segments would reduce the project capital cost by around $30 million (2014$, not including finance costs and escalation). Final decisions as to where BRT would run in mixed traffic have not been made.
RELATED CONSIDERATIONS
· access to key places, p. 13
· road, bike & pedestrian projects, p. 20
· federal funding, p. 36
· local funding, p. 37

28COST-EFFECTIVENESS | operating and maintenance costs
How would the operating and maintenance cost differ between BRT and LRT?
The chart below illustrates the differences in operating and maintenance (O&M) cost between BRT and LRT, in terms of both the total annual cost and the average cost per rider, based on ridership projections for 2035.
$5
$10
$15
$20
2035
AN
NU
AL
OPE
RA
TIN
G C
OST
in m
illio
ns
10 1552035 ANNUAL LINE RIDERSHIP
in millions
2035COST
PER RIDER
$2.0
0
$3.0
0
$1.00
BRT base$2.32
BRT PCC$2.24
LRT base$1.59
LRT PCC$1.48
While each two-car LRT train would cost 153 percent more to operate per hour than each articulated BRT bus ($296 and $117 per hour, respectively), each train would hold 210 percent more passengers than each bus (see vehicle capacity, p. 30). As a result of its lower vehicle capacity, BRT would need to operate at a higher service frequency in order to meet the ridership demand, and accordingly would have a higher total number of operating hours than LRT (see service frequency, p. 31). This higher service frequency of BRT paired with a lower cost per vehicle hour balances out to a similar total annual operating cost for both modes of around $20 million. However, because LRT would attract more line riders than BRT (see ridership, p. 26), the per-rider O&M cost would be lower for LRT. While LRT would cost around $1.59 per ride for the base alignment, the BRT base would cost around $2.32 per ride, or 46 percent more than LRT.
For both BRT and LRT, the PCC alignment would have a lower O&M cost per rider than the base alignment. For LRT, this difference is a result of the higher ridership that the PCC station would attract, paired with no difference in the total O&M cost. For BRT, the line ridership would be similar between the two alignments while the total O&M cost would be lower with the PCC alignment because less frequent service would be required during rush hour than with the base alignment (see service frequency, p. 31).
RELATED CONSIDERATIONS
· local bus service, p. 21
· service frequency, p. 31
· interlining, p. 33
· federal funding, p. 36
· local funding, p. 37

29OPERATIONS
Why do operational considerations matter?
The technical details of how each mode would operate are important in evaluating whether BRT or LRT is the best fit for the Southwest Corridor.
Because TriMet has experience operating the MAX light rail network but not a BRT system, the operational logistics of a Southwest Corridor BRT alignment are less well understood. As a result, the information in this section addresses BRT in more detail than LRT.
Key questions:
• How would vehicle capacity compare between BRT and LRT? Would platooning, or running two buses together, be feasible?
• How frequently would HCT vehicles need to run in order to meet ridership demand? What is the most frequent service that BRT or LRT could provide?
• What effect would transit mall capacity have on BRT and LRT operations?
• How would interlining differ between BRT and LRT?
• How are signal treatments used for transit in the Metro region today? How would signal treatments differ between LRT and BRT?
Key findings:
• Each BRT bus would have a maximum capacity of approximately one third the number of passengers as an LRT train. Platooning buses appears operationally infeasible.
• By 2035, BRT vehicles would need to run 3 to 3.3 minutes apart in order to meet ridership demand during the peak hour and LRT trains would run 6.7 minutes apart. It is assumed that 3 minutes is the maximum service frequency that either mode could accommodate.
• Transit Mall capacity is a concern for BRT in the peak periods at Union Station (the northern terminus) and at the intersection of SW Lincoln Street and 4th Avenue.
• LRT would interline with either the yellow or green MAX line, while BRT would not interline with another transit line because there would be no BRT lines from the north to connect to.
• Both LRT and BRT would have opportunities for enhanced transit signal treatments, but the high service frequency of BRT would limit how often the buses could receive signal priority during rush hour.

30
7 min
PLATOONED BUSES
3.5 min
EVENLY DISTRIBUTED BUSES
OPERATIONS | vehicle capacity
How would vehicle capacity compare between BRT and LRT?
Light rail would have a capacity of 266 passengers per two-car train. For BRT, the largest capacity vehicle available in the region would be an 86-passenger single-articulated bus. While larger-capacity buses are used in other countries, only 86-passenger vehicles are built in the United States, which is a requirement for federal New Starts funding.
Would platooning, or running two buses together, be feasible?
In order to increase the capacity of a BRT system, one idea is to operate buses in pairs, known as platooning. These pairs of buses would, ideally, arrive at each station together, and travel through intersections together.
With platooning, less frequent service could be provided while serving the same number of riders, as illustrated in the diagram above. This reduced frequency could potentially speed up travel times and improve reliability by reducing delay time at signals, because each pair of buses would be more likely to receive signal priority. However, platooning may not work as intended in practice, as it would be difficult to balance passenger loads and boarding times between the two paired buses, resulting in varying station dwell times (i.e. the time it takes for passengers to get on and off). Differing dwell times could lead to the platoon splitting up, thereby eliminating its intended benefits.
Los Angeles Metro considered platooning to address overcrowding on its Orange Line BRT, and concluded that the concept should not be implemented because the scheduled platoons can become delayed in an attempt to keep the pair of buses together, and platooning would increase dwell times at stations.
An additional challenge of platooning in the Portland region is the required length of the stations. A pair of buses would occupy a station platform of about two-thirds the length of a downtown Portland city block. In the Transit Mall, this would constrain locations suitable for Southwest Corridor BRT stations, and limit their use by other bus lines. Other bus lines, including new BRT lines such as Powell-Division, would mostly have to be consolidated in the remaining blocks not used by MAX or Southwest Corridor BRT.
RELATED CONSIDERATIONS
· capacity for current & future demand, p. 19
· service frequency, p. 31
31OPERATIONS | service frequency
How frequently would HCT vehicles need to run in order to meet ridership demand?
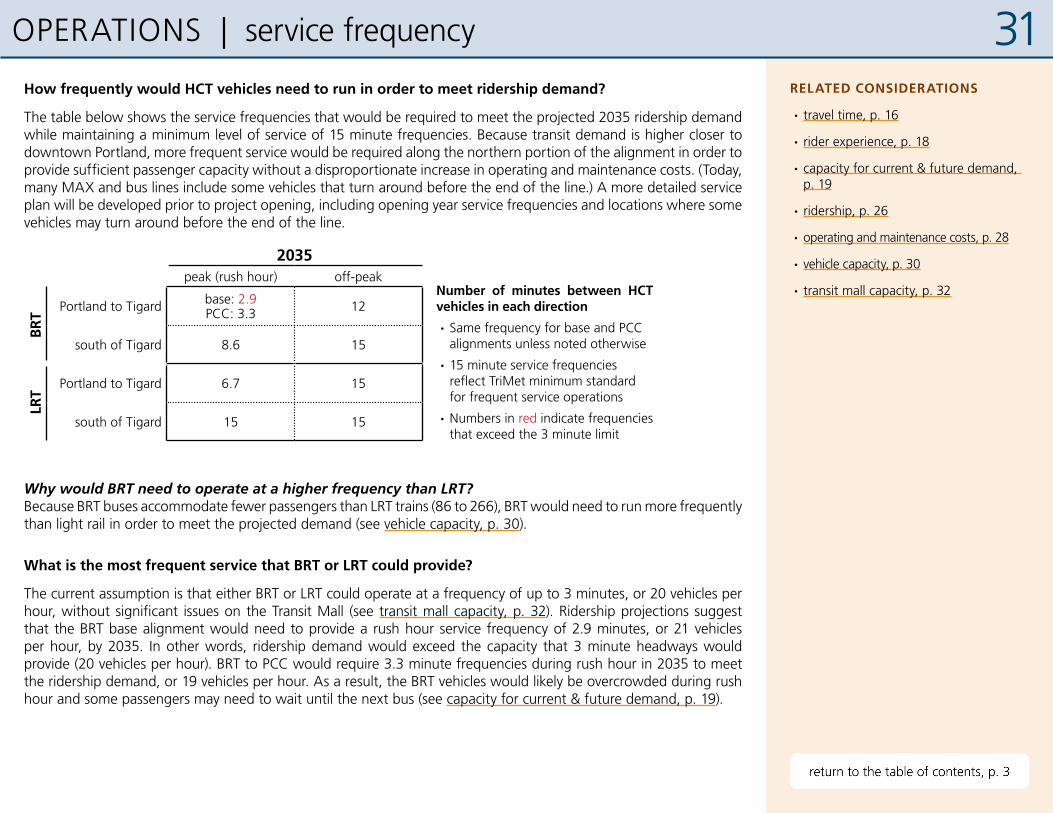
The table below shows the service frequencies that would be required to meet the projected 2035 ridership demand while maintaining a minimum level of service of 15 minute frequencies. Because transit demand is higher closer to downtown Portland, more frequent service would be required along the northern portion of the alignment in order to provide sufficient passenger capacity without a disproportionate increase in operating and maintenance costs. (Today, many MAX and bus lines include some vehicles that turn around before the end of the line.) A more detailed service plan will be developed prior to project opening, including opening year service frequencies and locations where some vehicles may turn around before the end of the line.
2035peak (rush hour) off-peak
BR
T
Portland to Tigard base: 2.9PCC: 3.3 12
south of Tigard 8.6 15
LRT
Portland to Tigard 6.7 15
south of Tigard 15 15
Why would BRT need to operate at a higher frequency than LRT?Because BRT buses accommodate fewer passengers than LRT trains (86 to 266), BRT would need to run more frequently than light rail in order to meet the projected demand (see vehicle capacity, p. 30).
What is the most frequent service that BRT or LRT could provide?
The current assumption is that either BRT or LRT could operate at a frequency of up to 3 minutes, or 20 vehicles per hour, without significant issues on the Transit Mall (see transit mall capacity, p. 32). Ridership projections suggest that the BRT base alignment would need to provide a rush hour service frequency of 2.9 minutes, or 21 vehicles per hour, by 2035. In other words, ridership demand would exceed the capacity that 3 minute headways would provide (20 vehicles per hour). BRT to PCC would require 3.3 minute frequencies during rush hour in 2035 to meet the ridership demand, or 19 vehicles per hour. As a result, the BRT vehicles would likely be overcrowded during rush hour and some passengers may need to wait until the next bus (see capacity for current & future demand, p. 19).
RELATED CONSIDERATIONS
· travel time, p. 16
· rider experience, p. 18
· capacity for current & future demand, p. 19
· ridership, p. 26
· operating and maintenance costs, p. 28
· vehicle capacity, p. 30
· transit mall capacity, p. 32Number of minutes between HCT vehicles in each direction
· Same frequency for base and PCC alignments unless noted otherwise
· 15 minute service frequencies reflect TriMet minimum standard for frequent service operations
· Numbers in red indicate frequencies that exceed the 3 minute limit

32OPERATIONS | transit mall capacity
What effect would transit mall capacity have on BRT and LRT operations?
Today, the Transit Mall on 5th and 6th Avenues in downtown Portland carries 16 TriMet bus lines along with the Green and Orange/Yellow MAX lines all day, as well as five C-TRAN bus lines in the morning and afternoon. Estimates show that the mall can carry up to 120 buses per hour. Stations for LRT are separate from bus stops, and LRT vehicles and buses weave along the route, leapfrogging each other to reach their respective stop locations.
A Southwest Corridor LRT line would interline with either the existing Yellow or Green Line MAX. Southwest Corridor LRT would utilize the same MAX tracks and stations, and with similar service frequencies, which would result in few or no additional LRT vehicles on the Transit Mall. Local bus service planning with a light rail project will not occur until later in the planning process, but it is likely that duplicative local bus service would be reduced, resulting in fewer standard buses on the Transit Mall.
A Southwest Corridor BRT line would introduce new vehicles to the Transit Mall because it would not interline with any existing service and could not interline with the Powell-Division BRT route since both would connect to the southern end of the Transit Mall. Current plans assume the northern terminus of a Southwest Corridor BRT would be near Union Station. As with LRT, BRT service would likely result in fewer standard buses on the mall from reductions in duplicative local service.
Projected BRT service frequencies (see service frequency, p. 31) generate concerns about bus bunching at Transit Mall stations and at the northern terminus, where the vehicles would not only stop for passengers but also lay over to provide breaks for drivers. If BRT is chosen as the preferred mode, routing to the Transit Mall will be evaluated in detail during the Draft Environment Impact Statement.
The current assumption is that either BRT or LRT could operate at a frequency of up to 3 minutes, or 20 vehicles per hour, without significant issues on the Transit Mall. This 3-minute headway restriction is an estimate of the frequency threshold at which transit service would deteriorate because transit vehicles could not be granted sufficient signal priority at intersections outside of downtown Portland and the vehicle bunching entering and progressing along the Transit Mall would cause intersection blockages and delays at stations. A 3-minute headway provides a baseline to compare peak capacities of each mode.
RELATED CONSIDERATIONS
· capacity for current & future demand, p. 19
· local bus service, p. 21
· service frequency, p. 31
· interlining, p. 33
TriMet map of the Transit Mall

33OPERATIONS | interlining
How would interlining differ between BRT and LRT?
A Southwest Corridor LRT alignment would be interlined with either the MAX Yellow Line, which currently interlines with the Orange Line, or the Green Line, which currently terminates at the south end of the downtown Portland Transit Mall. The decision on which of these lines would interline with each other would be made at a later date based on service frequencies, travel patterns and public input.
Because there are no existing BRT alignments on the Transit Mall, a Southwest Corridor BRT alignment would terminate at the north end of the Transit Mall, near Union Station. A Southwest Corridor BRT alignment would not be able to interline with the Powell-Division BRT project currently under development because both lines would connect to the Transit Mall from the south. Either the Southwest Corridor or the Powell-Division BRT line could potentially be extended beyond the Transit Mall to the north as part of a future project, but there are no such plans at this time.
The opportunity to interline with an existing MAX line would provide three benefits for LRT: it would preserve Transit Mall capacity, reduce operating costs, and provide one-seat rides for transit riders crossing the Willamette River. Because the Yellow and Green lines already serve the Transit Mall to Portland State University, interlining with either of these would in effect be an extension of the existing service, so few or no additional LRT vehicles would be introduced onto the Transit Mall at any one time and the operating hours along the Transit Mall would already be accounted for by the Yellow or Green Line service. For a Southwest Corridor BRT line, the BRT buses on the mall and the operating costs would both be new to the system. Finally, LRT would provide a one-seat ride across the Willamette River, while BRT would require a transfer because it would terminate at Union Station.
RELATED CONSIDERATIONS
· rider experience, p. 18
· operating and maintenance costs, p. 28
· transit mall capacity, p. 32

34OPERATIONS | transit signal treatment
How are signal treatments used for transit in the Metro region today?
There is a range of transit signal treatments in use around the world, from cautious and minimally effective to aggressive and highly effective. The Metro region uses a fairly aggressive signal treatment on the MAX light rail system – preemption – but MAX has never run on a state-owned five-lane arterial, which could occur in some segments of this project. TriMet uses several types of signal priority on the local bus system, including queue jumps and green extensions, which are more cautious.
How would signal treatments differ between LRT and BRT?
LRT and BRT would have opportunities for enhanced transit signal treatments, but the type of treatments would likely differ between the two transit modes and the transit treatments cannot supersede emergency vehicle preemption or terminate an active pedestrian clearance phase.
If the selected mode is LRT, it may have the ability to preempt traffic signals, extend green time, and/or utilize other signal treatments. The ability to skip side street or turn phases may be limited in some segments of the corridor to avoid potential safety issues, such as queuing on I-5 exit ramps.
If the selected mode is BRT, the signal treatments would likely be less aggressive due to operational differences between the modes. Serving the forecasted future transit demand in the corridor would require a high frequency of BRT vehicles during the peak hour. Each instance of a bus receiving priority at a traffic signal would require a recovery period in order to adequately serve cross traffic that has been held. Due to the high frequency needed for BRT (up to every 3 minutes in each direction during rush hour) and projected signal cycle lengths of 1.5 to 2 minutes along Barbur Boulevard, consistent signal preemption or priority would not be feasible. Some BRT vehicles would not receive priority, likely resulting in slower and less reliable operations for BRT during peak periods compared to light rail. (This is not expected to be an issue during off-peak periods due to less frequent BRT service.) LRT also would experience this issue during peak periods, but to a lesser degree than BRT.
See travel time, p. 16, for an overview of the estimated 2035 travel times for each mode, including signal delay time.
As the project progresses, it is expected that continued review, coordination, and analysis will determine the appropriate transit signal treatments at specific locations throughout the corridor.
RELATED CONSIDERATIONS
· travel time, p. 16
· reliability, p. 17
· service frequency, p. 31

35FINANCE
Why does finance matter?
Both local and federal sources of funding for high capacity transit projects are becoming increasingly scarce and competitive. Although a detailed funding strategy for the Southwest Corridor project has not yet been developed and will continue to be discussed throughout the federal environmental review process, it is important to begin to understand how the operating and capital costs of LRT and BRT relate to the potential sources of funding.
Key questions:
• How would access to federal funding differ between BRT and LRT?
• Where has local funding come from for past high capacity transit projects in the region? How would access to local funding sources differ between BRT and LRT?
Key findings:
• The Portland region’s history of receiving federal New Starts funding for MAX projects, paired with the anticipated strength of a Southwest Corridor LRT line, suggests that LRT could be competitive for federal funding. The absence of comparable high-level BRT projects in the United States makes it more difficult to gauge the competitiveness of a Southwest Corridor BRT project for federal funding.
• While a BRT project would cost less to construct than an LRT project, LRT would outperform BRT in terms of ridership, travel time and capacity for future ridership growth. Due to this difference in both costs and benefits between the two modes, it is difficult to assess the relative feasibility of receiving the necessary local funding.

36FINANCE | federal funding
How would access to federal funding differ between BRT and LRT?
Federal funding for high capacity transit projects typically comes from the Federal Transit Administration (FTA) through their competitive New Starts and Small Starts grant programs. New Starts requires a total project capital cost of over $250 million, and at least 50 percent of the alignment must be in exclusive transitway, while Small Starts is geared toward smaller projects with a maximum grant award of $75 million. Current New Starts practice allows projects to receive up to 50 percent federal funding for the capital cost. The Portland region has been successful at securing New Starts funding for all but one of its MAX light rail projects. (Airport MAX Red Line did not apply for federal funds because a large portion of the project was privately funded.) Currently there are over 20 projects across the country that may be seeking New Starts funding in the near future (see map on the right).
The communities in the Southwest Corridor already contain a high concentration of people and jobs, significant traffic congestion and areas for future business and residential growth. These elements lead to strong transit ridership projections and support a project’s competitiveness nationally. The anticipated strength of an LRT project as currently assumed, paired with the Portland region’s history of successful New Starts grant applications, suggests that a Southwest Corridor LRT project could be competitive for federal funding. However, based on 50 percent local funding match, a Southwest Corridor LRT alignment as envisioned currently could require a New Starts grant around $1 billion. Although a number of light rail projects have been awarded around $1 billion from the New Starts program, many of those have provided a local share greater than 50 percent.
BRT is a new concept for the Portland metro region, and a Southwest Corridor BRT line would be a larger investment than other BRT projects considered for the United States so far. A BRT line is being concurrently planned for the Powell-Division corridor, and C-TRAN is constructing The Vine BRT in Vancouver, but both of these are expected to operate mostly in mixed traffic. As envisioned, a Southwest Corridor BRT line would achieve a higher standard due largely to extensive exclusive busway operations – 84 percent in current assumptions. In fact, the Southwest Corridor BRT as planned would likely score the highest in the United States on a scale developed by the Institute for Transportation & Development Policy. Only five lines in the United States score highly enough on the scale to be ranked according to the BRT Standard, with one line, the Cleveland Health Line, achieving the “silver” level and the other four achieving “bronze.” The absence of comparable high-level true BRT projects in the United States makes it more difficult to gauge likelihood of FTA funding. Over the last decade only three BRT projects have received funding in the New Starts category of the FTA grant program, and those received $275 million from FTA. Based on 50 percent local match, a Southwest Corridor BRT alignment as envisioned currently would require a $500 million New Starts grant.
WHAT IS NEW STARTS?
· Fixed guideway projects such as light rail, busway, subway and commuter rail
· Funded by FTA discretionary funding
· Very competitive program – five times as many projects as funds available
RELATED CONSIDERATIONS
· ridership, p. 26
· capital cost, p. 27
· operating and maintenance costs, p. 28
· local funding, p. 37
Location of high capacity transit projects likely competing for New Starts funding
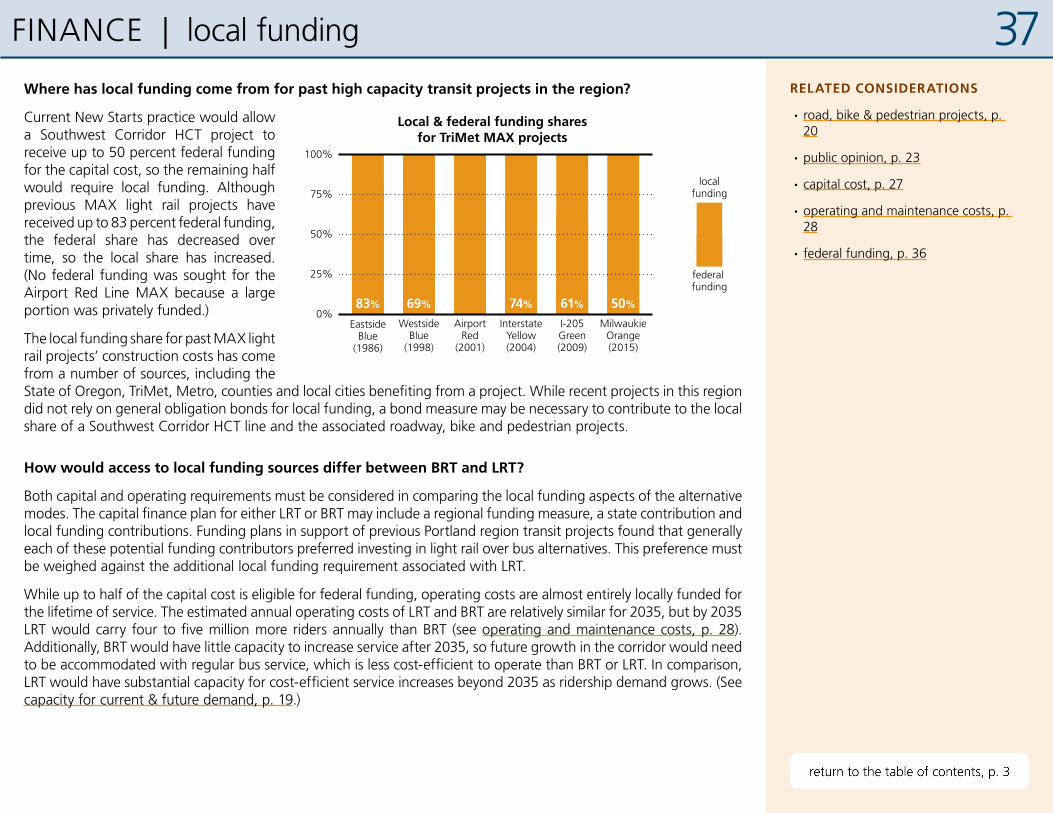
37
EastsideBlue
(1986)
WestsideBlue
(1998)
AirportRed
(2001)
InterstateYellow(2004)
I-205Green(2009)
MilwaukieOrange(2015)
25%
0%
50%
75%
100%
federal funding
localfunding
Local & federal funding sharesfor TriMet MAX projects
83%
17% 31% 100% 26% 39% 50%
69% 74% 61% 50%
FINANCE | local funding
Where has local funding come from for past high capacity transit projects in the region?
Current New Starts practice would allow a Southwest Corridor HCT project to receive up to 50 percent federal funding for the capital cost, so the remaining half would require local funding. Although previous MAX light rail projects have received up to 83 percent federal funding, the federal share has decreased over time, so the local share has increased. (No federal funding was sought for the Airport Red Line MAX because a large portion was privately funded.)
The local funding share for past MAX light rail projects’ construction costs has come from a number of sources, including the State of Oregon, TriMet, Metro, counties and local cities benefiting from a project. While recent projects in this region did not rely on general obligation bonds for local funding, a bond measure may be necessary to contribute to the local share of a Southwest Corridor HCT line and the associated roadway, bike and pedestrian projects.
How would access to local funding sources differ between BRT and LRT?
Both capital and operating requirements must be considered in comparing the local funding aspects of the alternative modes. The capital finance plan for either LRT or BRT may include a regional funding measure, a state contribution and local funding contributions. Funding plans in support of previous Portland region transit projects found that generally each of these potential funding contributors preferred investing in light rail over bus alternatives. This preference must be weighed against the additional local funding requirement associated with LRT.
While up to half of the capital cost is eligible for federal funding, operating costs are almost entirely locally funded for the lifetime of service. The estimated annual operating costs of LRT and BRT are relatively similar for 2035, but by 2035 LRT would carry four to five million more riders annually than BRT (see operating and maintenance costs, p. 28). Additionally, BRT would have little capacity to increase service after 2035, so future growth in the corridor would need to be accommodated with regular bus service, which is less cost-efficient to operate than BRT or LRT. In comparison, LRT would have substantial capacity for cost-efficient service increases beyond 2035 as ridership demand grows. (See capacity for current & future demand, p. 19.)
RELATED CONSIDERATIONS
· road, bike & pedestrian projects, p. 20
· public opinion, p. 23
· capital cost, p. 27
· operating and maintenance costs, p. 28
· federal funding, p. 36

38Next steps
OTHER DOCUMENTS
A separate memo addressing the LRT tunnel to PCC and other PCC connection options is being released concurrently with this document, and can be accessed on the project website at www.swcorridorplan.org.
By the end of January 2016 a staff recommendation memo will be released for the February 2016 steering committee decisions. The committee is scheduled to consider which HCT mode to study further and whether to continue studying the LRT tunnel to PCC.
After the February decision, the preferred transit mode will be incorporated into a draft ‘Preferred Package’ of investments for the Southwest Corridor for further public review, which will be finalized at the May 2016 steering committee meeting.
UPCOMING PUBLIC ENGAGEMENT OPPORTUNITIES
An online comment period will be open from early January through early February for the public to provide input for the Steering Committee’s February 29th decisions regarding mode and whether to continue study of an underground transit station to serve the PCC Sylvania campus.
Project staff will also be attending multiple neighborhood, business and civic meetings in January and February to present information about the project and engage with interested stakeholders. Please let us know if you are interested in scheduling a presentation by project staff by emailing [email protected].
10% high capacity transit design, analysis of potential impacts, ongoing public outreach and selection of Locally Preferred Alternative
2017-2018
ENVIRONMENTAL REVIEW PHASE
Local funding commitments, 30% high capacity transit design and application for federal funding
2019-2020
PROJECT DEVELOPMENT PHASE
2021-2025 Final design and construction of high capacity transit line
ENGINEERING AND CONSTRUCTION PHASE
Decision between light rail or bus rapid transit as the mode choice for the corridor
Decision on whether to continue studying light rail tunnel to PCC Sylvania
Recommendation on strategy to fund road, bikeway, sidewalk and trail projects to serve the entire corridor and on land use and development strategy
February 2016
Public feedback to inform adoption of Preferred Package of AlternativesMarch to
April 2016
May 2016
High Capacity Transit Preferred Package of Alternatives: Identify high capacity transit alignments and terminus options to receive further study, associated road, bikeway, sidewalk and trail projects, and choice between light rail or bus rapid transit
Corridor Connections: Potential funding source and timeframe for each of the roadway, bike, sidewalk and trail projects in the Shared Investment Strategy
REFINEMENT PHASE
Decision on HCT alignment and terminus options in Tigard and Tualatin
Public feedback to inform decision on HCT mode and light rail tunnel to PCC SylvaniaJanuary
2016

39Errata
The following corrections have been made since this document was first published on December 31, 2015:
travel time, p. 16
“BRT would be 4 to 7 minutes slower faster than LRT for three primary reasons...”
Cost-effectiveness, p. 25, and ridership, p. 26
“Compared to the base alignment, the LRT tunnel to PCC Sylvania would increase line ridership by 7 percent and new system trips by 21 13 percent.”