Southern Sierra CZO update Roger Bales, UC Merced –Science directions –Infrastructure update...
30
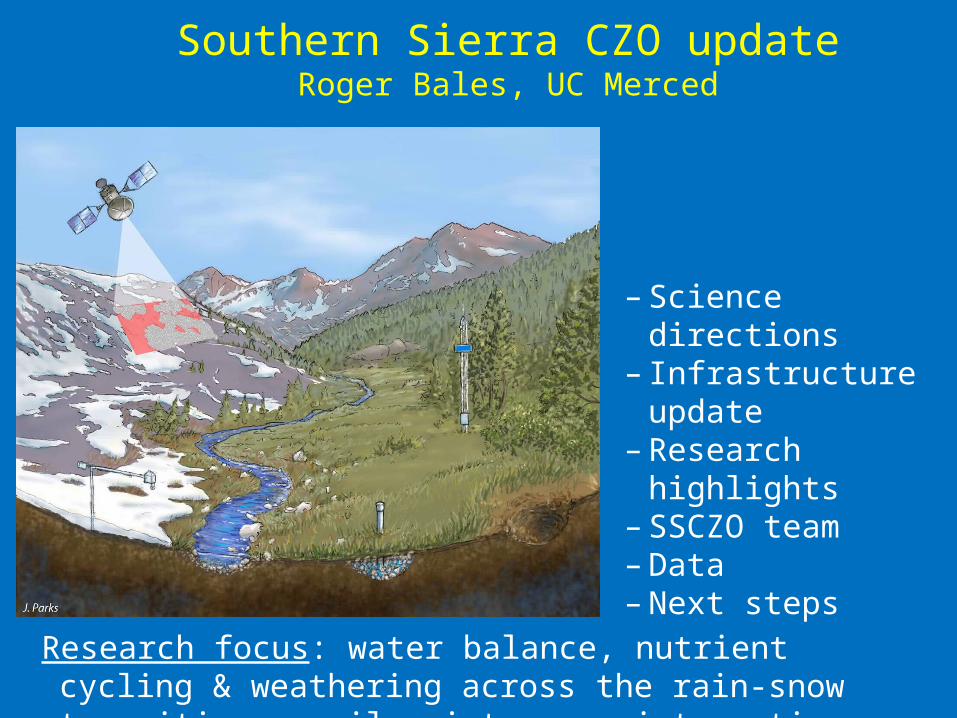
Southern Sierra CZO update Roger Bales, UC Merced – Science directions – Infrastructure update – Research highlights – SSCZO team – Data – Next steps Research focus : water balance, nutrient cycling & weathering across the rain-snow transition – soil moisture as integrating
-
date post
20-Dec-2015 -
Category
Documents
-
view
217 -
download
1
Transcript of Southern Sierra CZO update Roger Bales, UC Merced –Science directions –Infrastructure update...
Southern Sierra CZO updateRoger Bales, UC Merced
– Science directions– Infrastructure update– Research highlights– SSCZO team– Data– Next steps
Research focus: water balance, nutrient cycling & weathering across the rain-snow transition – soil moisture as integrating variable

Southern Sierra CZO updateRoger Bales, UC Merced
– Science directions– Infrastructure update– Research highlights– SSCZO team– Data– Next steps
Conceptual model: bi-directional links between landscape/climate variability & water/material fluxes across the rain-snow transition
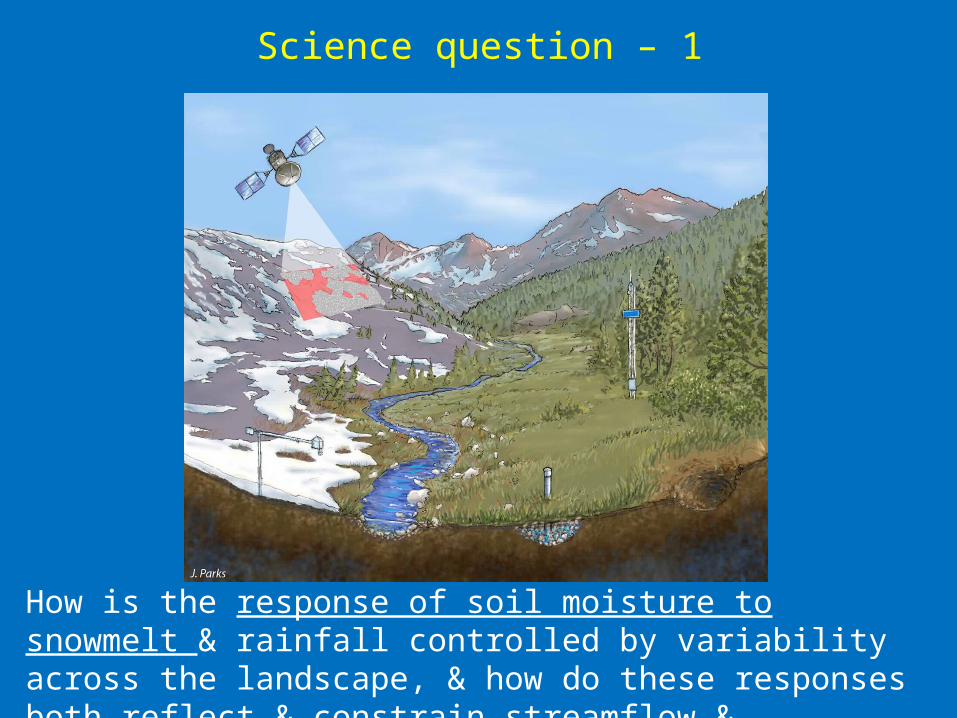
How is the response of soil moisture to snowmelt & rainfall controlled by variability across the landscape, & how do these responses both reflect & constrain streamflow & evapotranspiration?
Science question – 1
What is the process linkage between soil moisture & topographic variability, soil formation & weathering?
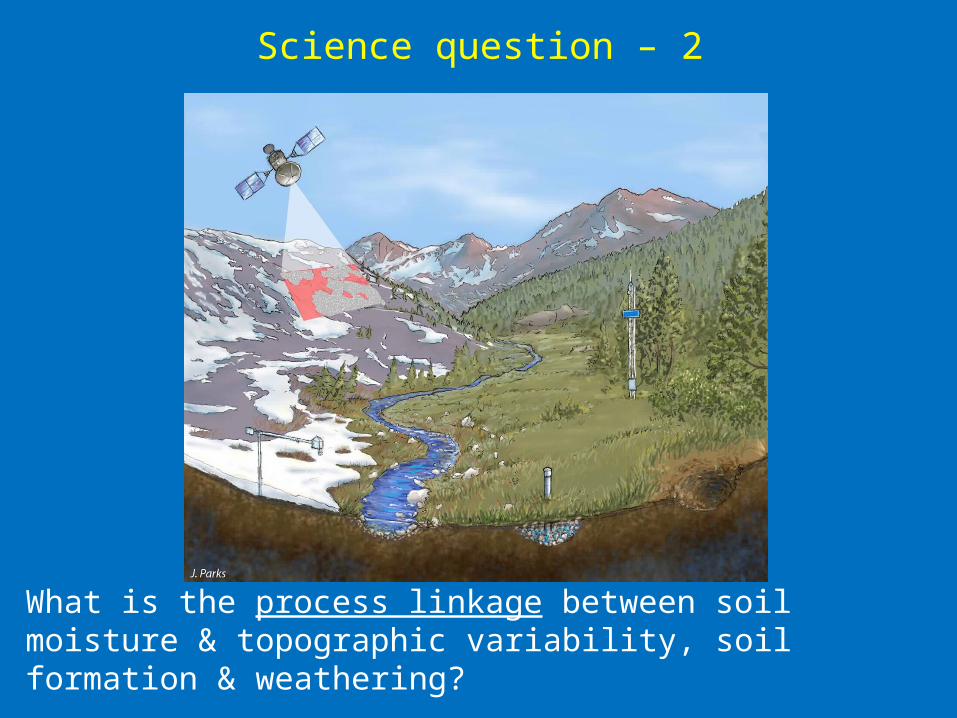
Science question – 2
How does vegetation/ecosystem distribution & function (species, plant functional type, production) vary with climate (elevation); & what physiological mechanisms are controlling?
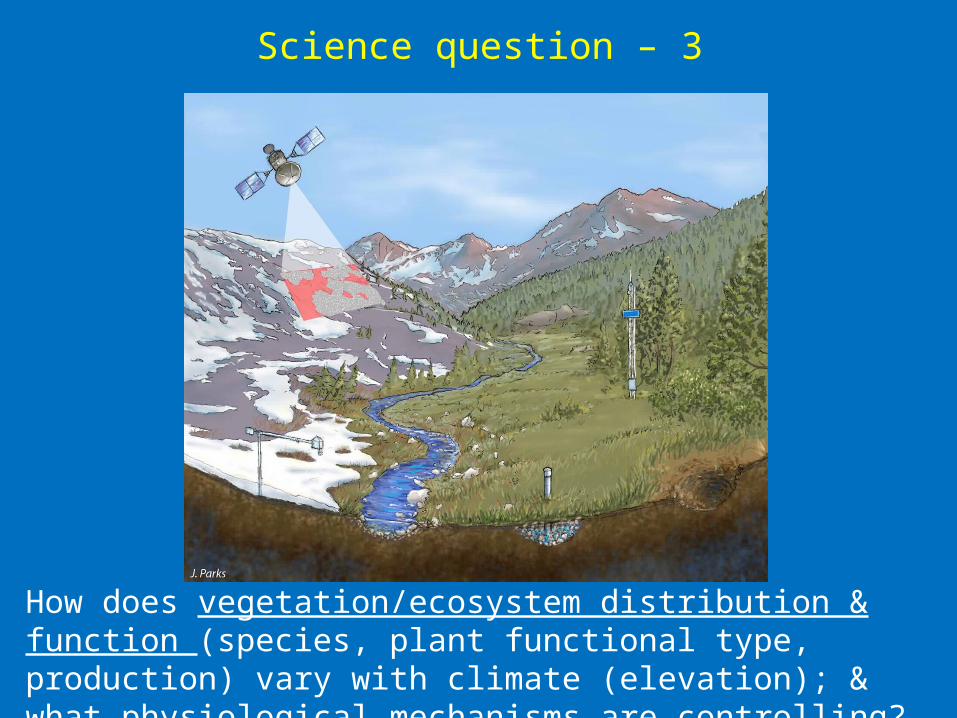
Science question – 3
How do vegetation attributes influence land-atmosphere exchange & catchment cycling of water, energy, CO2?
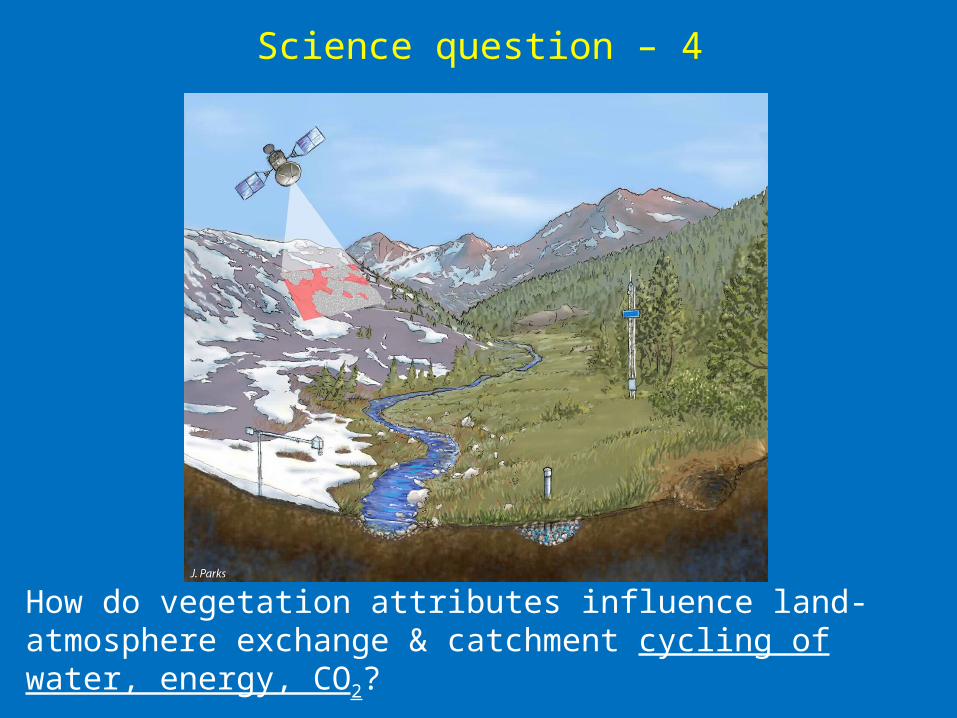
Science question – 4

What is the link between soil heterogeneity, water fluxes & nutrient availability?
Science question – 5
CZO
UCM
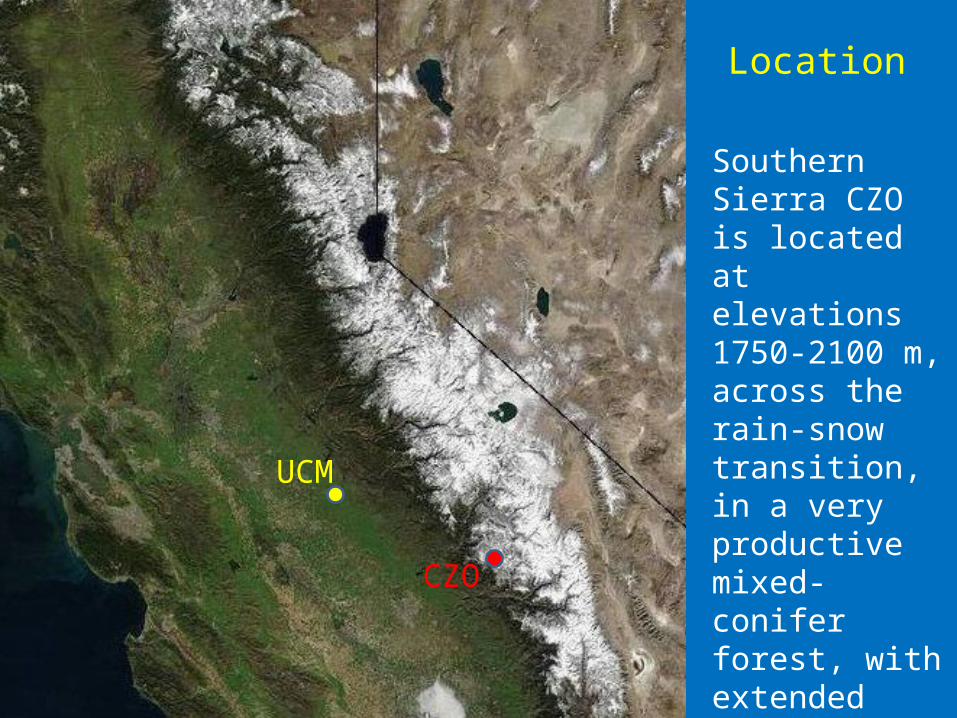
Location
Southern Sierra CZO is located at elevations 1750-2100 m, across the rain-snow transition, in a very productive mixed-conifer forest, with extended measurement nodes at elevations 400-2700 m
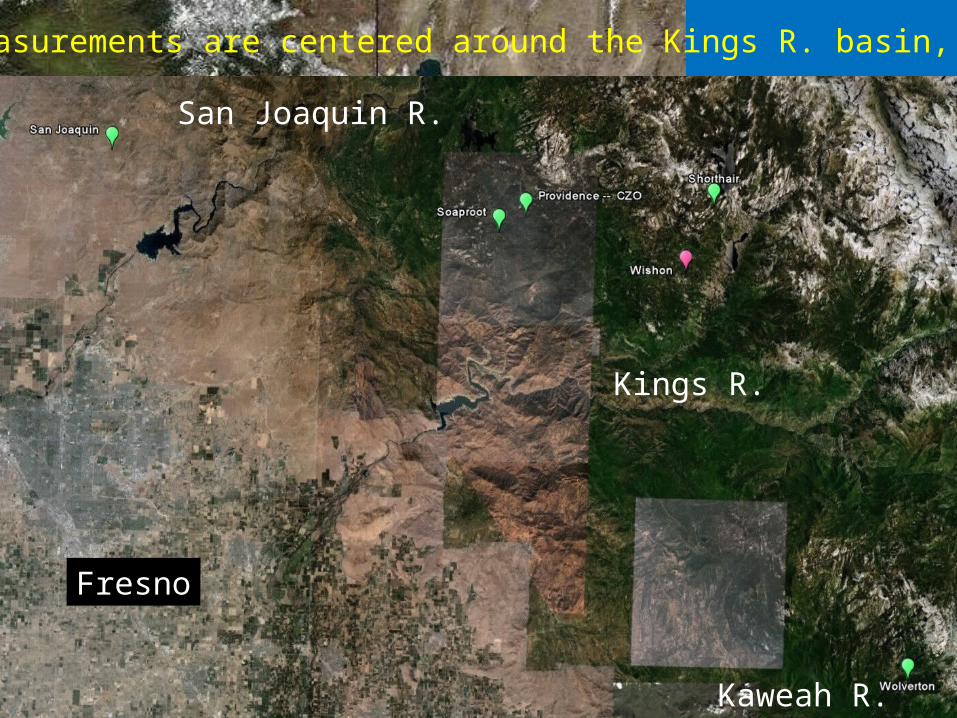
CZO measurements are centered around the Kings R. basin, N fork
Kings R.
San Joaquin R.
Kaweah R.
Fresno

Kings R.
San Joaquin R.
Kaweah R.
Fresno
Kings River
Wolverton catchments, 2100-2700 m, lies in the snow zone, above the 1750-2100 m elevation Providence catchments
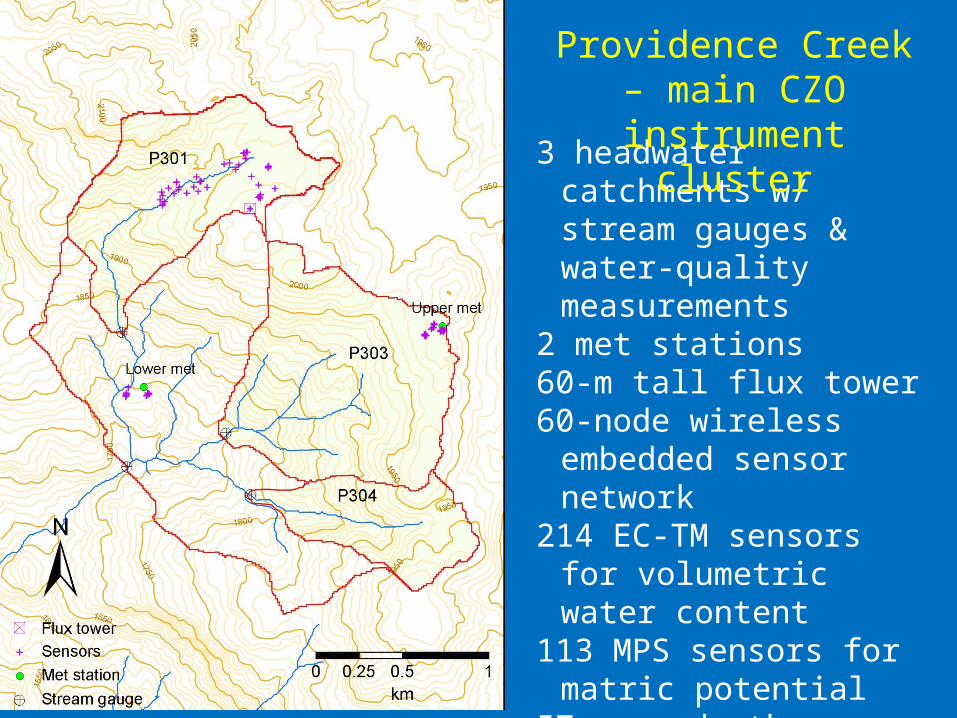
3 headwater catchments w/ stream gauges & water-quality measurements
2 met stations60-m tall flux tower60-node wireless embedded
sensor network214 EC-TM sensors for
volumetric water content113 MPS sensors for matric
potential57 snow-depth sensorsMeadow piezometers & wellsSap-flow sensors
Providence Creek – main CZO instrument cluster

Kings R.
San Joaquin R.
Kaweah R.
Fresno
Flux towers along an elevation gradient, 400-2700 m, extend the core CZO instrument cluster from water-limited to temperature-limited ecosystems
4 towers in place now, 3 more planned under NEON (2 co-located)
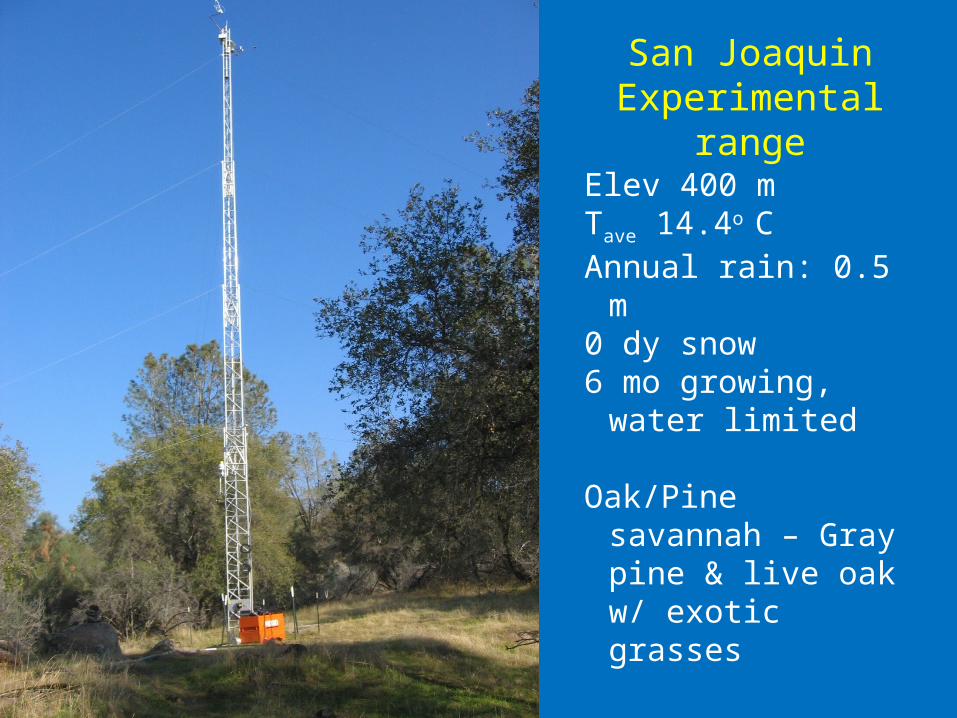
Elev 400 mTave 14.4o CAnnual rain: 0.5 m0 dy snow6 mo growing, water
limited Oak/Pine savannah –
Gray pine & live oak w/ exotic grasses
San Joaquin Experimental range

Elev 1200 m Tave 10.9oCAnnual precip: 0.9 m 11 dy snowPossible long growing season &
high productivity
Dense mix of smallish Ponderosa pine & oak, w/ many shrubs
Site may be recovering from logging/fire/beetles
Soaproot saddle

Elev 2100 mTave 8.9oCAnnual precip: 1.0 m130 dy snow12 mo growing season –
neither cold nor drought limited
White fir w/ sugar & other pines, incense cedar & patchy, dense shrubs
Providence P301
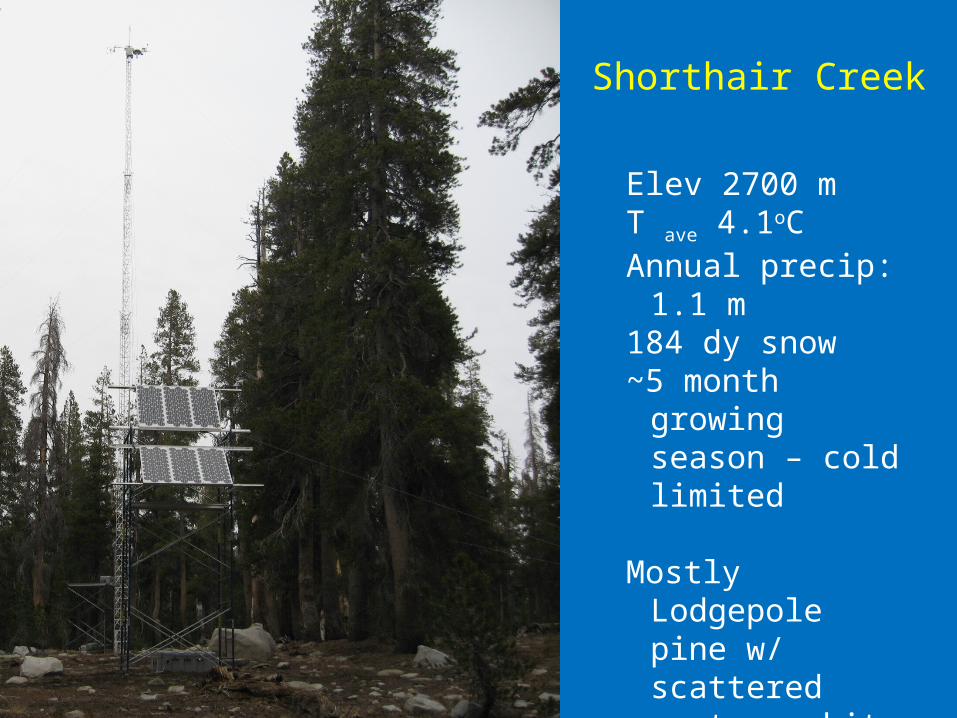
Elev 2700 m T ave 4.1oCAnnual precip: 1.1 m184 dy snow~5 month growing
season – cold limited
Mostly Lodgepole pine w/ scattered western white pine & red fir
Shorthair Creek

Sep- 08 Jun 10Jan 09 Jan 10Jun 09
Cumulative Et (mm)
Rnet (W/m2)
Air T (oC)
Little rain, 5/09-10/09
430 mm Et, 5/10-10/10
730 mm Et, 10/08-10/09
Very high annual & summer ET at P301
High summer values depend on deep root extraction of water
Happy elev for trees – T & precip just right
Soils hold snowmelt over summer.How much water can soils hold vs. elev?

Total profile soil water storage – upper vs. lower met(soil texture effect)
Lower – finer soils
Upper – coarser textured soils

D J F M A M
Physiographic controls over snow distribution
Snow depletion links w/ soil drying at multiple scales
Snowpack & snowmelt control the timing of soil drying

Climatic, physiographic & vegetation controls on water yield
Decreasing temperatureIncreasing snow fractionDecreasing LAICoarser soils
Mean elevations for 8 catchments
Modeling in progress
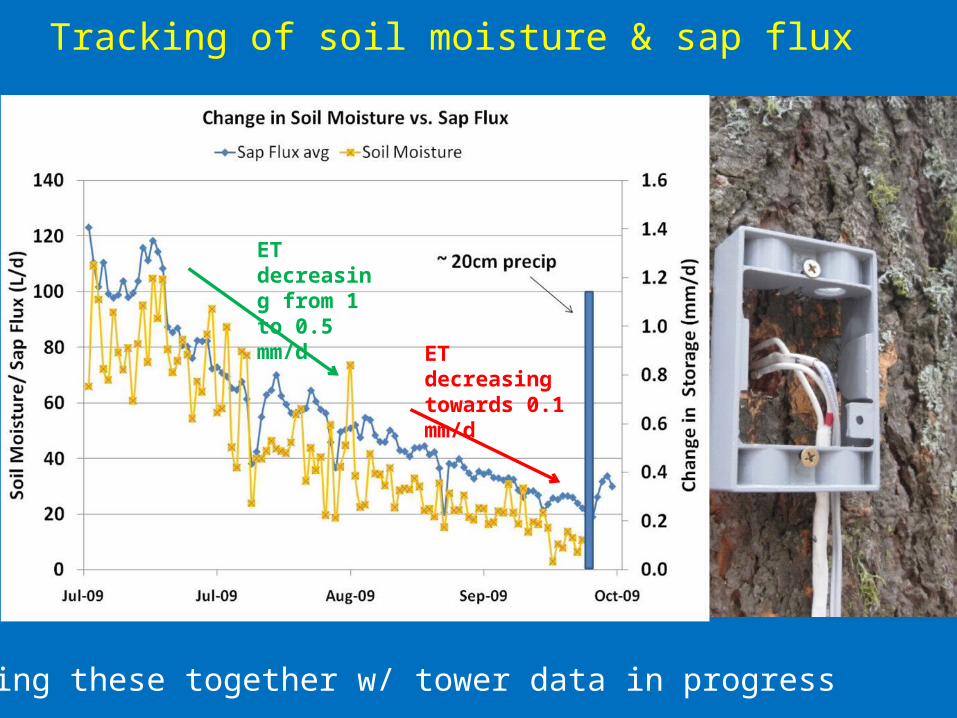
Tracking of soil moisture & sap flux
ET decreasing from 1 to 0.5 mm/d
ET decreasing towards 0.1 mm/d
Putting these together w/ tower data in progress
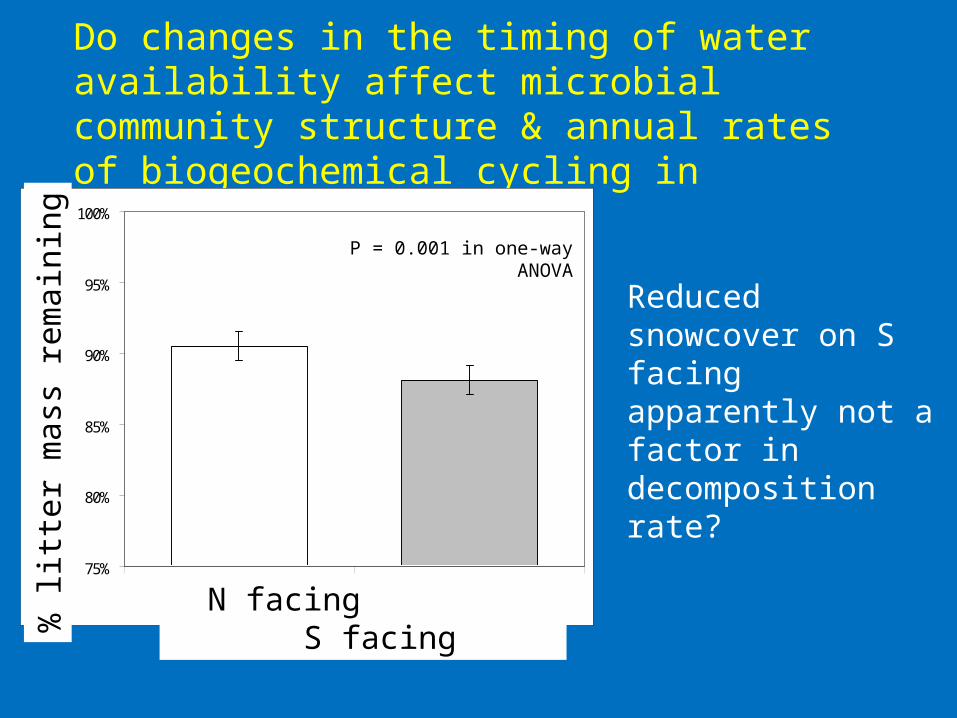
Do changes in the timing of water availability affect microbial community structure & annual rates of biogeochemical cycling in mountain soils?
Reduced snowcover on S facing apparently not a factor in decomposition rate?
75%
80%
85%
90%
95%
100%
North-Facing Trees South-Facing Trees
% L
itte
r M
ass
Rem
aini
ng
P = 0.001 in one-way ANOVA
N facing S facing
% li
tter
mas
s re
mai
ning

Hot spots, i.e. statistical outliers, common for inorganic species in both O horizon & mineral soil
Infiltration of nutrient-rich runoff in preferential flowpaths creates the hot spots
Runoff through O horizon occurs due to lack of roots
Hotspots in mineral soil not co-located with hotspots in overlying O horizon
Hotspots increase litter decomposition rates?
Nutrient hot spots

Providence erosion rates
Sediment basin
Headcut

Soil moisture & sap flux measurement design using RHESSys & cluster analysis – catchment P300
Initial plots mainly in 1-3
Added plots in 4-6
Model vs. initial measurements – qualitative agreement

Prototype embedded sensor network, 2008-present
RSSI<-80dBmRSSI>-80dBm
Randomized channel-hopping protocol
Self-assembling redundant mesh
Near 100% transmission w/ RSSI > -73 dBm, i.e. spacing of < 100 m
Received signal strength (RSSI), log scale
Pack
et d
eliv
ery
ratio
n
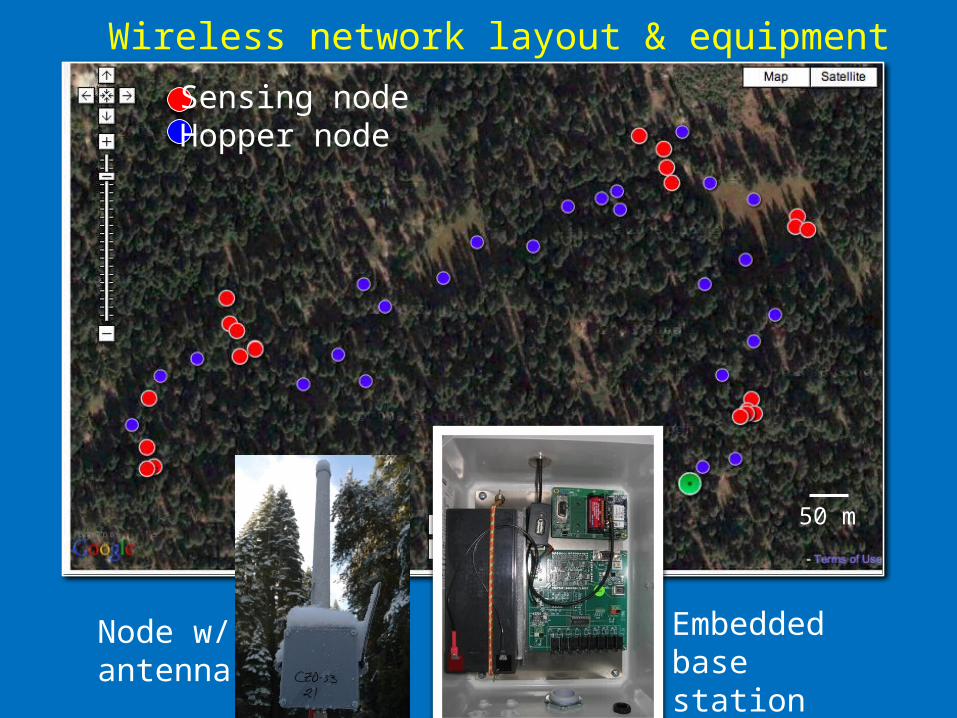
Wireless network layout & equipment
50 m
Sensing nodeHopper node
Embedded base station
Node w/ antenna

SSCZO Co-PIs & students from 8 campuses; many more collaborators
R. Bales, P. KirchnerM. Conklin, R. LucasS. Hart, J. BlankenshipA. Behre, E. Stacy
M. Goulden, A. Kelly
C. Tague, K. Son
J. Hopmans, P. HartsoughB. Houlton, S. EndersT. O’Geen
D. Johnson, C. Woodward
C. Riebe, B. Jessup
S. Glaser, B. Kerkz
C. Hunsaker
N. Molotch, K. Musselman
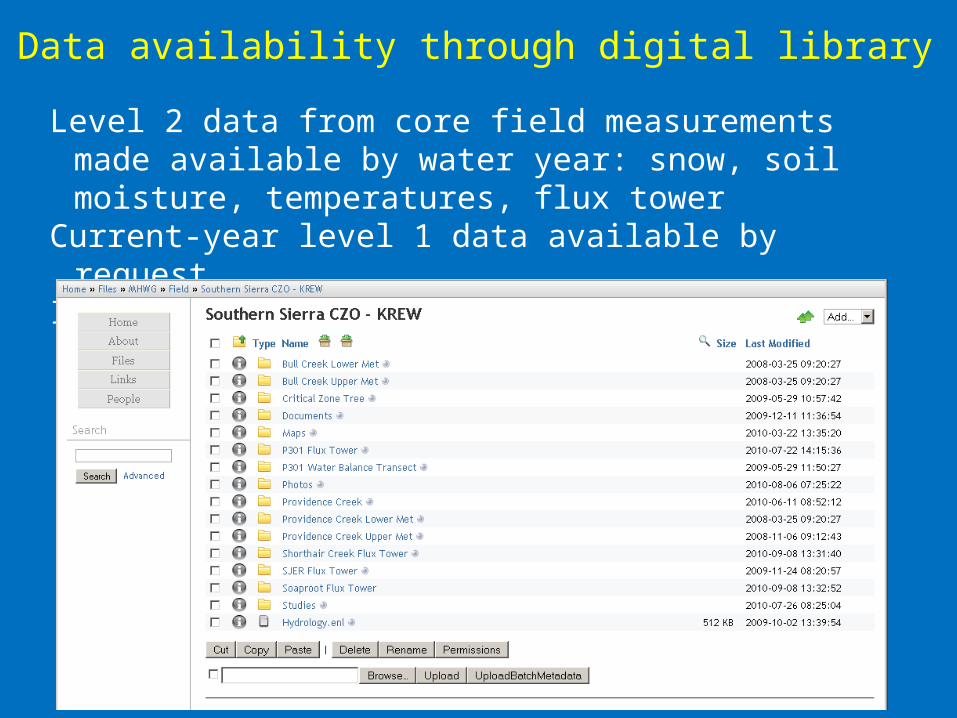
Data availability through digital library
Level 2 data from core field measurements made available by water year: snow, soil moisture, temperatures, flux tower
Current-year level 1 data available by requestInvestigator-specific data available as per CZO & NSF data policy

– End of yr 3 – some mature research & some data streams just initiated
– Most students started in yr 2– Several papers submitted or
close– Fall AGU: 16 abstracts– LIDAR products – spring 2011– Single-tree experiment replicated
this summer– Instrument cluster – basis for
developing broader water information system in Sierra Nevada
Next steps
http://snri.ucmerced.edu/CZO