SOUTHERN POWER DISTRIBUTION COMPANY OF …tserc.gov.in/file_upload/uploads/Filings/ARR...
304
SOUTHERN POWER DISTRIBUTION COMPANY OF TELANGANA LIMITED (Distribution and Retail Supply of Electricity Licensee) Filing of ARR for Retail Supply Business for FY 2017-18 30 th November, 2016
Transcript of SOUTHERN POWER DISTRIBUTION COMPANY OF …tserc.gov.in/file_upload/uploads/Filings/ARR...

SOUTHERN POWER DISTRIBUTION COMPANY OF TELANGANA LIMITED
(Distribution and Retail Supply of Electricity Licensee)
Filing of ARR
for Retail Supply Business for FY 2017-18
30th November, 2016
BEFORE THE HONOURABLE TELANGANA STATE ELECTRICITY REGULATORY
COMMISSION
AT ITS OFFICE AT 5th
Floor, Singareni Bhavan, Red Hills, Hyderabad - 500 004
FILING NO.________/2016
CASE NO. ________/2016
In the matter of:
Filing of the ARR application for the year 2017-18 in accordance with the “Telangana
Electricity Regulatory Commission (Terms And Conditions For Determination Of Tariff
For Wheeling And Retail Sale Of Electricity) Regulation, 2005” by the Southern Power
Distribution Company of Telangana Limited („TSSPDCL‟ or „the Company‟ or „the
Licensee‟) as the Distribution and Retail Supply Licensee.
In the matter of:
SOUTHERN POWER DISTRIBUTION COMPANY OF TELANGANA LIMITED
… Applicant
The Applicant respectfully submits as under: -
1. With the enactment of Andhra Pradesh Reorganization Act, 2014, the Telangana state has
been carved out from the undivided Andhra Pradesh state as the 29th
state of the Republic
India on 02.06.2014. On the eve of State bifurcation, the 2 districts, Ananthapur and Kurnool
have been delinked from APCPDCL and merged with APSPDCL in accordance with the
provisions of AP Reorganisation Act, 2014 vide G.O. Ms. No. 24, dated 29.05.2014, Further,
the name of Central Power Distribution Company of Andhra Pradesh Limited has been
changed to Southern power Distribution of Company Telangana Limited (TSSPDCL).
2. The erstwhile Regulatory Commission of the undivided state of Andhra Pradesh has issued
Regulation No. 3 of 2014 (Reorganization) Regulation, 2014 on 26.05.2014 consequent to
the framing of Andhra Pradesh Reorganisation Act,2014 notified by Government of India on
01.03.2014, Wherein Clause 3 of the regulation says that ,
ii
3. “All the notified regulations as well as their supplementary regulations/amendments, rules,
orders ,proceedings ,guidelines ,memos ,notifications, other instruments issued immediately
before 2nd June 2014 by the APERC for conduct of business and other matters shall fully &
completely apply to the whole of the states of Telangana and Andhra Pradesh and shall
similarly apply in relation to all matters falling within the jurisdiction of the Commission
until they are altered, repealed or amended by the respective State Electricity Regulatory
Commissions.”
4. In accordance with the above regulation, all the regulations framed by erstwhile APERC will
continue to apply for the state of Telangana. Subsequently TSERC vide Telangana Official
Gazzette has issued its first regulation, Regulation No. 1 of 2014 on 10.12.2014 (Adoption of
Previously Subsisting Regulations, Decisions, Directions or Orders, Licenses and Practice of
Directions) wherein clause 2 says that
5. “All regulations, decisions, directions or orders along with all the licences and practice
directions issued by the erstwhile Andhra Pradesh Electricity Regulatory Commission
(Regulatory Commission for States of Andhra Pradesh and Telangana) in existence as on the
date of the constitution of the Telangana State Electricity Regulatory Commission and in
force, shall mutatis-mutandis apply in relation to the stakeholders in electricity in the State of
Telangana including the Commission and shall continue to have effect they are until duly
altered, repealed or amended by any of the Regulation by the Commission with effect from
the date of notification as per Notification issued by the Government of Telangana in
G.O.Ms.No.3 Energy( Budget) Department, dt.26-07-2014 constituting the Commission.”
6. This filing is made by the SOUTHERN POWER DISTRIBUTION COMPANY OF
TELANGANA LIMITED (TSSPDCL) under Section 64 of the Electricity Act 2003 for
determination of the Aggregate Revenue Requirement (ARR) for the Retail Supply Business
for the year FY 2017-18.
7. The licensee has adopted the following methodology to arrive at the ARR for retail supply
business.
Distribution Cost: : The licensee has considered the figures as per the Distribution Tariff
Order dated 27th March, 2015 issued by TSERC for the period from FY 2014-15 to FY
2018-19.
iii
Transmission Cost: The licensee has considered the approved transmission cost as per
the Transmission Tariff Order dated 9th May 2014.
SLDC Cost: The licensee has considered the approved figures as per the SLDC Annual
Fee and Operating Charges order dated 9th May 2014.
PGCIL and ULDC Costs: PGCIL and ULDC costs have been projected for FY 2016-17
H2 and FY 2017-18 based on the H1 actuals of FY 2016-17.
Distribution losses: The Licensee has considered the Distribution Losses as approved by
by TSERC for the period from FY 2014-15 to FY 2018-19 in its tariff Order dated 27th
Mar, 2015.
Transmission losses: The licensee has considered the actual transmission losses of
3.38% incurred in current year as they are less than the approved loss figures as per the
Transmission Tariff Order dated 09th May 2014.
PGCIL Losses: The external losses (PGCIL) are estimated at a level of 3.44%.
8. As per the Government of Telangana vide G.O Ms. No, dt: 11.10.2016 and G.O Ms No.234
dt: 11.10.2016 has given final notification for formation/ reorganization of new districts,
revenue divisions and mandals in Siddipet and Jangaon Districts respectively. In the said
GOs, 7 revenue Mandals from the jurisdiction of Karimnagar and Warangal were now re-
organized to Siddipet District and one Mandal, Gundala of Nalgonda District were re-
organized to Jangaon District. However the impact of sales re-allocation between the two
licensees, - Northern Power Distribution Company of Telangana Limited (TS NPDCL) and
Southern Power Distribution Company of Telangana Limited (TSSPDCL) is expected to be
minimal. Any inter-discom adjustment in sales if any would be done at the end of the
financial year if required.
9. As per Regulation No. 4 of 2005, the licensee is required to file the Aggregate Revenue
Requirement (ARR) for Retail Supply Business and Tariff proposal for the entire control
period i.e., for the period FY 2014-15 to FY 2018-19. However, the licensee had requested
the Hon‟ble Commission to allow it to submit the ARR for Retail Supply Business for the FY
2017-18 on yearly basis, instead for the entire control period due to the reasons as mentioned
below:
iv
a. Significant uncertainty involved in projection of quantum of power to be purchased
from various sources as well as in costs
Projections of Generation Availability
Projection of power to be purchased from TS Genco stations, CGS Stations & other
stations would be difficult beyond one or two years. As seen in the past there have
been deviations from the scheduled commissioning for both thermal and Hydro
plants. Given the high quantum of power likely to be purchased from the plants likely
to be commissioned till FY 2018-19, any deviations in the power procurement
schedule from these plants will have a material impact on the power purchase costs if
projections are to be done for the entire 3rd
control period.
Projections of Power Purchase Costs
The licensee would like to submit that it is facing challenges in projecting the power
procurement cost for the entire 3rd
control period as there has been a sharp increase in
the power procurement cost in the recent past due to the following reasons:
Sharp fall observed in Energy dispatched from cheaper Hydel sources over the
years. The hydro energy availability for FY 2016-17 is expected to be 1,021 MU
as compared to the Tariff Order approved quantity of 3,841 MU. It has been
observed over the past few years that the actual availability from Hydel stations
has been consistently lower than the value approved in the Tariff Orders issued by
TSERC. This can be attributed to the multipurpose usage of hydro projects
wherein irrigation takes a preference over power generation.
The shortfall in energy from Hydel sources FY 2016-17 was met from relatively
expensive sources like Bilateral purchases.
As can be seen from the points mentioned above, there is a scope of significant variation
in the power purchase costs of the licensee, if the projections of power procurement are
done for the entire control period.
b. Regulatory objectives of a Multi-year tariff regime not met
Mechanism of Incentivization
One of the objectives of the multi-year tariff regime is to incentivize the
performance of the licensee based on its achievement vis-à-vis the targets fixed by
the regulator. In the current scenario, this concept is more relevant in distribution
v
business as many of the ARR items in distribution business are deemed to be
controllable and the licensee can take steps to achieve the targets fixed by the
regulator thereby improving its operational performance. However in the retail
supply business, the cost of power purchase is uncontrollable factor and hence not
amenable to fixation of targets. Hence the regulatory objective of improving the
performance of the licensee, intended to be achieved in a multi-year tariff regime
is not met in case of retail supply business
Tariff Certainty
The other key objective intended to be achieved through a multi-year tariff
framework is to reduce the regulatory uncertainty for consumers stemming from
methodology followed by the regulator in tariff setting. This objective is achieved
in the distribution business through the wheeling tariffs set for the MYT control
period which are based on the factors which are controllable by the licensee.
However in retail supply business, following are the key constraints in fixing a
tariff for entire control period-
o As explained in point 1, there is high degree of uncertainty in power purchase
costs and it has a significant impact on the „Cost to serve‟ which forms the basis
of fixation of retail tariffs.
o In addition to „cost of service‟, the retail tariffs also depend on the level of subsidy
support from Government of Telangana and cross subsidy levels across consumer
categories. These factors are beyond the control of the licensee.
Hence the objective of providing tariff certainty to consumers, which is well established
in distribution business in the form wheeling tariffs, is unlikely to be met in retail supply
business due to the uncontrollable factors mentioned above.
Demand Side uncertainties -
The licensee has made best efforts in estimating to a good degree of accuracy, the
quantum of load shedding done in the previous year for consumers category-wise
and factoring the impact of the same in coming up with projections for the
ensuing year. However any short-fall in the load relief estimates will have an
vi
adverse impact on the licensee if sales projections are done for the entire 3rd
control period
The policy of the Government of Telangana towards the agricultural supply hours
and the likely date of commissioning of the Lift Irrigation Schemes (LI Schemes)
are other parameters which would significantly alter the demand projections for
the 3rd
control period.
It is also very difficult to predict with accuracy the levels of demand that will be
there for power from different category of consumers especially Industrial and
Commercial consumers. These are dependent on macroeconomic situations and
are not easy to forecast over a 5 year period. Variations in this demand will alter
sales mix and therefore make ARR substantially inaccurate if done over 5year
period.
The Hon‟ble Commission has been kind enough in granting permission to submit the ARR &
Proposed Tariff filings in respect of the Retail Supply Business for FY 2017-18 instead of
total control period of FY 2014-15 to FY 2018-19 vide proceedings No. Lr. No.
TSERC/Tariff/DD(T-Engg)/T-03/2015/D.No. 708/16 Dt. 19.11.2016.
10. In the following paragraphs, the licensee has provided a brief summary of its performance
during FY 2015-16 as well as the expected performance for the current year i.e. FY 2016-17
against the current tariff order and projections for FY 2017-18.
11. The Petitioner (Distribution Licensee) submits that as per the APERC Regulation 1 of 2014,
TS DISCOMS have to file for provisional true-up for the FY 2016-17 and final true-up for
the FY 2015-16. However, the licensee would like to submit the following to the Hon‟ble
Commission for consideration.
a. Joining the UDAY scheme is under consideration by Government of Telangana
(GoTS). The accumulated losses of the licensee as on 31st March 2015 is Rs 8,061
crs. The licensee has taken loans to fund cash losses, and since 75% of the loans
outstanding as on 30th
September would be taken over GoTS, this would impact the
loss position of the licensee and hence the true-up requirements. Hence filing of true-
up subsequent to take-over of the debt of licensee would result in minimizing the
financial burden on the consumers in the state.
b. The licensee would like to file for true-up for the previous years based on the take-
over of debt by the since the actual loss position of the discom would be known based
vii
on the take over of discom debt. Hence the licensee prays that the Hon‟ble
Commission may allow the licensee to file the true-up for previous years separately.
c. In order to simplify the tariff structure/ reduce tariff categories of consumers,
Government of India constituted a committee with Joint Secretary (Ministry of
Power) as the Chairperson vide 23/32/2016- R & R dated 24 / 08/2016. The licensee
is currently evaluating the options for rationalizing tariff and categories. As a careful
study needs to be made to assess the impact of such an exercise on different consumer
categories in the state of Telangana, the licensee prays that the Hon‟ble Commission
may allow the licensee to file for tariff proposals, cross subsidy surcharge and
additional surcharge proposals separately.
d. In view of the above, the licensee prays that the Hon‟ble Commission may allow the
licensee to file for True-ups for previous years and tariff proposals separately. This
will enable the licensee in minimizing the financial impact on the consumers and also
would enable the licensees in proposing a rationalized tariff structure after due
examination which reduces any un-due financial burden on any category of
consumers.
12. Other Key Measures: Telangana Power Generation Corporation has initiated
measures for reducing the cost of power generation. Some of the measures adopted
are – re-negotiation of interest rate on loans for newly commissioned generating
stations, minimizing grade slippage of coal which reduces the variable cost of
generation.
Summary of the Filing
Performance Analysis of the Licensee for the Previous Year FY 2015-16 and Current Year
FY 2016-17
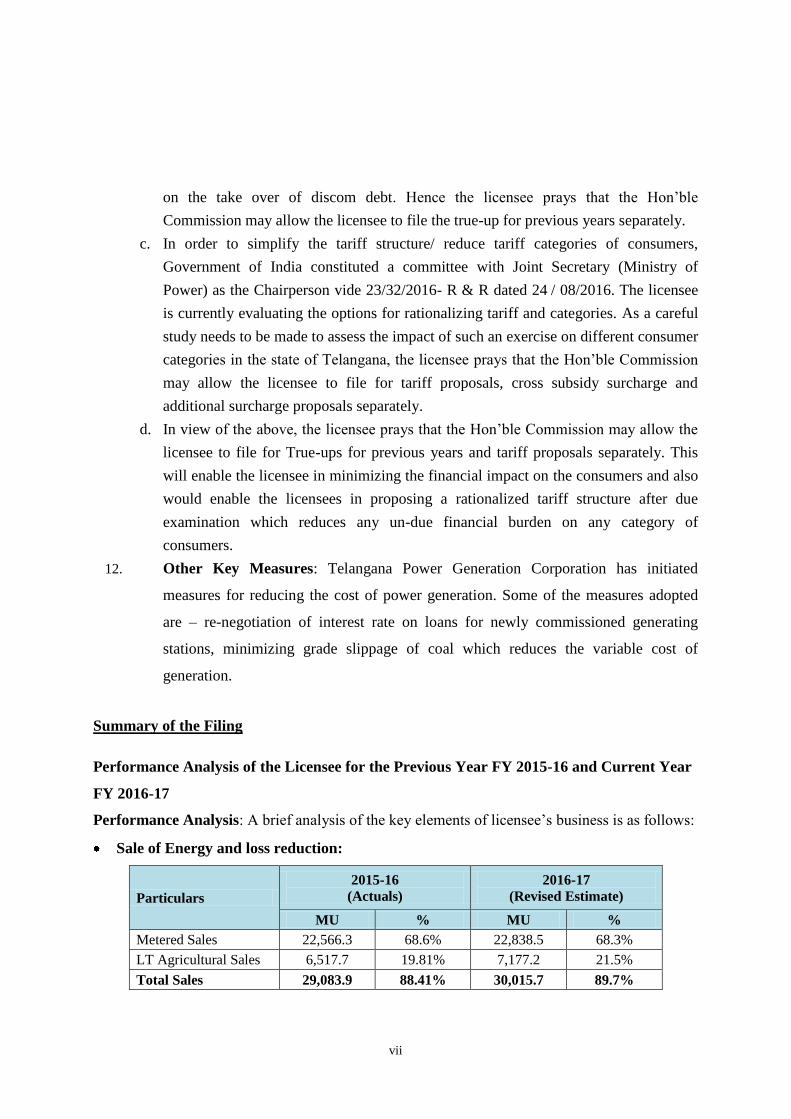
Performance Analysis: A brief analysis of the key elements of licensee‟s business is as follows:
Sale of Energy and loss reduction:
Particulars
2015-16
(Actuals)
2016-17
(Revised Estimate)
MU % MU %
Metered Sales 22,566.3 68.6% 22,838.5 68.3%
LT Agricultural Sales 6,517.7 19.81% 7,177.2 21.5%
Total Sales 29,083.9 88.41% 30,015.7 89.7%
viii
Particulars
2015-16
(Actuals)
2016-17
(Revised Estimate)
MU % MU %
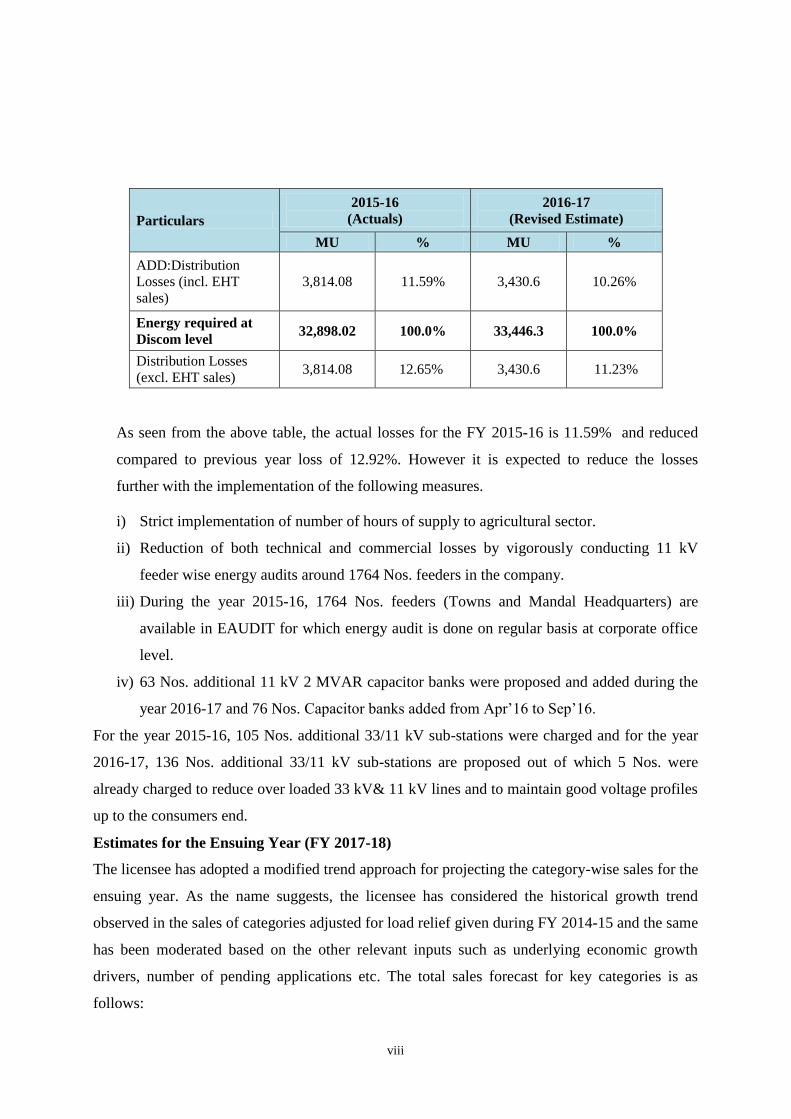
ADD:Distribution
Losses (incl. EHT
sales)
3,814.08 11.59% 3,430.6 10.26%
Energy required at
Discom level 32,898.02 100.0% 33,446.3 100.0%
Distribution Losses
(excl. EHT sales) 3,814.08 12.65% 3,430.6 11.23%
As seen from the above table, the actual losses for the FY 2015-16 is 11.59% and reduced
compared to previous year loss of 12.92%. However it is expected to reduce the losses
further with the implementation of the following measures.
i) Strict implementation of number of hours of supply to agricultural sector.
ii) Reduction of both technical and commercial losses by vigorously conducting 11 kV
feeder wise energy audits around 1764 Nos. feeders in the company.
iii) During the year 2015-16, 1764 Nos. feeders (Towns and Mandal Headquarters) are
available in EAUDIT for which energy audit is done on regular basis at corporate office
level.
iv) 63 Nos. additional 11 kV 2 MVAR capacitor banks were proposed and added during the
year 2016-17 and 76 Nos. Capacitor banks added from Apr‟16 to Sep‟16.
For the year 2015-16, 105 Nos. additional 33/11 kV sub-stations were charged and for the year
2016-17, 136 Nos. additional 33/11 kV sub-stations are proposed out of which 5 Nos. were
already charged to reduce over loaded 33 kV& 11 kV lines and to maintain good voltage profiles
up to the consumers end.
Estimates for the Ensuing Year (FY 2017-18)
The licensee has adopted a modified trend approach for projecting the category-wise sales for the
ensuing year. As the name suggests, the licensee has considered the historical growth trend
observed in the sales of categories adjusted for load relief given during FY 2014-15 and the same
has been moderated based on the other relevant inputs such as underlying economic growth
drivers, number of pending applications etc. The total sales forecast for key categories is as
follows:
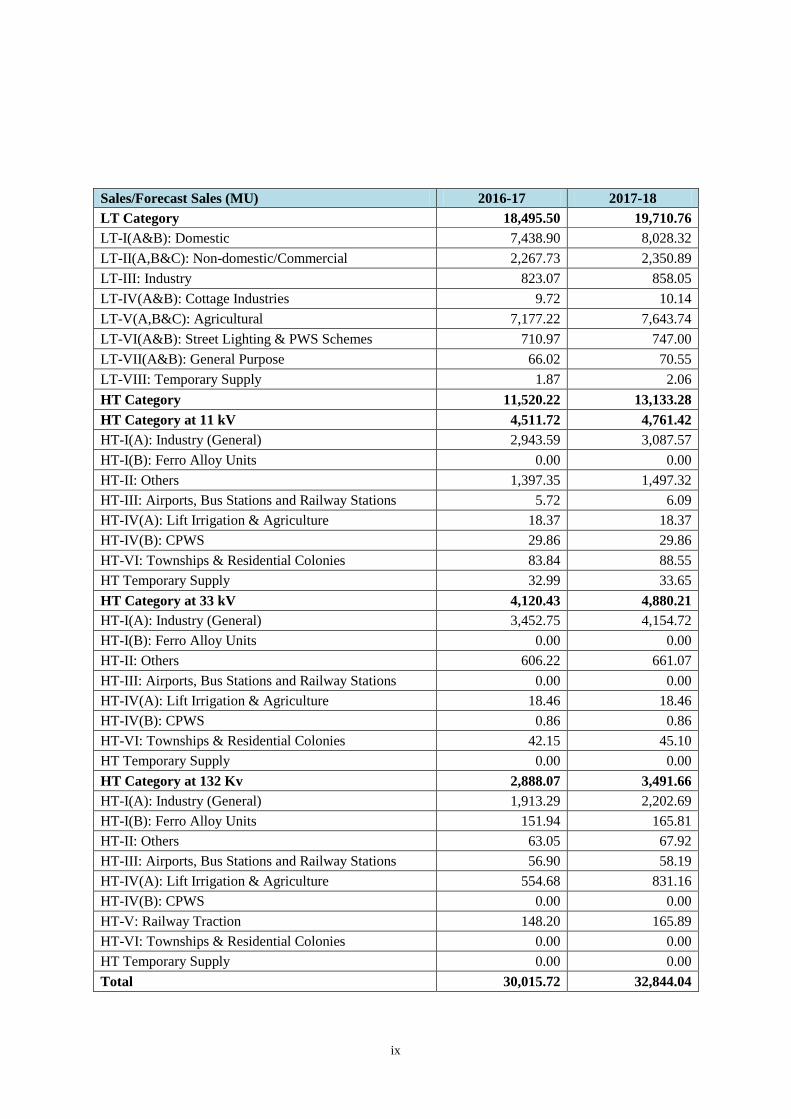
ix
Sales/Forecast Sales (MU) 2016-17 2017-18
LT Category 18,495.50 19,710.76
LT-I(A&B): Domestic 7,438.90 8,028.32
LT-II(A,B&C): Non-domestic/Commercial 2,267.73 2,350.89
LT-III: Industry 823.07 858.05
LT-IV(A&B): Cottage Industries 9.72 10.14
LT-V(A,B&C): Agricultural 7,177.22 7,643.74
LT-VI(A&B): Street Lighting & PWS Schemes 710.97 747.00
LT-VII(A&B): General Purpose 66.02 70.55
LT-VIII: Temporary Supply 1.87 2.06
HT Category 11,520.22 13,133.28
HT Category at 11 kV 4,511.72 4,761.42
HT-I(A): Industry (General) 2,943.59 3,087.57
HT-I(B): Ferro Alloy Units 0.00 0.00
HT-II: Others 1,397.35 1,497.32
HT-III: Airports, Bus Stations and Railway Stations 5.72 6.09
HT-IV(A): Lift Irrigation & Agriculture 18.37 18.37
HT-IV(B): CPWS 29.86 29.86
HT-VI: Townships & Residential Colonies 83.84 88.55
HT Temporary Supply 32.99 33.65
HT Category at 33 kV 4,120.43 4,880.21
HT-I(A): Industry (General) 3,452.75 4,154.72
HT-I(B): Ferro Alloy Units 0.00 0.00
HT-II: Others 606.22 661.07
HT-III: Airports, Bus Stations and Railway Stations 0.00 0.00
HT-IV(A): Lift Irrigation & Agriculture 18.46 18.46
HT-IV(B): CPWS 0.86 0.86
HT-VI: Townships & Residential Colonies 42.15 45.10
HT Temporary Supply 0.00 0.00
HT Category at 132 Kv 2,888.07 3,491.66
HT-I(A): Industry (General) 1,913.29 2,202.69
HT-I(B): Ferro Alloy Units 151.94 165.81
HT-II: Others 63.05 67.92
HT-III: Airports, Bus Stations and Railway Stations 56.90 58.19
HT-IV(A): Lift Irrigation & Agriculture 554.68 831.16
HT-IV(B): CPWS 0.00 0.00
HT-V: Railway Traction 148.20 165.89
HT-VI: Townships & Residential Colonies 0.00 0.00
HT Temporary Supply 0.00 0.00
Total 30,015.72 32,844.04

x
Key Demand Drivers for FY 2017-18: Some of the key drivers for the increase in the demand
of the licensee has been highlighted below-
A growth rate of 10.83% is observed in the agriculture sales H1 of FY 2016-17 over H1
of FY 2015-16. This higher growth of sales is on account of 54,717 Nos of Agricultural
service connections released in FY2015-16 against the target of 50,000 Nos in addition to
the extension of 9Hrs power supply to agriculture consumers from 01.04.2016 as per the
policy of Govt. of Telangana State. Further, the target for release of agricultural
connections for FY 2016-17 are 64,730 Nos. Considering the same per HP consumption
for ensuing year and keeping in view the increase in number of agricultural connections,
a growth rate of 6.50% is adopted for projecting the sales in FY 2017-18.
HT – Industrial Sales: It is expected that a substantial portion of open access consumers
will come back to the grid.
Hyderabad Metro Rail: The licensee expects a load of 23.54 MU in its area. These
loads have been considered under categories as shown below:
o HT II ( Others): 11.10 MU
o HT V ( Railway Traction- HMR): 12.44 MU
The licensee has started supply of 9 hours of supply to agricultural consumers from April
this year. The licensee intends to continue with supply of 9 hours supply to agricultural
consumers in the ensuing year as well.
Lift Irrigation (LI) Schemes: Based on the data provided by Irrigation Department, the
licensee expects the following LI schemes in its area in FY 2017-18. An addition of 276.5
MU has been considered for FY 2017-18.
SN LI Schemes MVA Total MUs
1 Mahatma Gandhi LIS Stage
I, II, III 180 259
2 AMRP-LLC 12 17
Total 192 276
Power Purchase Requirement for FY 2017-18:
The following are the key points considered by the licensee with regard to power purchase
requirement by the licensee –
xi
Average PLF of 80% from TSGENCO & APGENCO (thermal) considered
New sources of energy considered
o Kudigi- Unit 2 - 75 Aug 2017, Unit 3 –84 MW from Jan 2018
o The licensee has entered into PPA with Chhattisgarh State Power Distribution
Company Limited (CSPDCL) for purchase of power on long-term basis for a
period of 12 years. The licensee has submitted the PPA to the Hon‟ble for
approval. The licensee has considered an availability of 6,482 MU.
o The balance capacity of Solar Plants of 2012, 2013 & 2014 bidding and the
2000 MW bidding in 2015 are expected to be commissioned during the year
2017-18.
o In addition to the existing capacity of 100 MW wind power in TSSPDCL, the
licensee has projected additional wind based capacity to the extent of 100
MW in the ensuing year.
Allocation Principles
o NCE – As per Geographical location
o All other sources – 53.89% as per GO Ms. No. 20 of 2014
The licensee has not projected any availability from new gas based IPPs in the
absence of any proposal of supply of power to stranded gas based plants.
The overall energy scenario in FY 2017-18 is given below
Particulars FY 2017-18
Energy Requirement (MU) 54,756
Energy Availability from Long term & Medium Term sources
(MU) 66,076
Deficit (MU) 0
Energy availability from Short term sources (MU) -
Power Purchase Cost Estimate for the state of Telangana for FY 2017-18
Variable costs for TSGENCO & APGENCO – Thermal and CGS – These costs are
considered as given by the generator or capped at 2% escalation on 2016-17 H1
actuals.
Fixed costs for existing stations have been considered as projected for the respective
generating station
xii
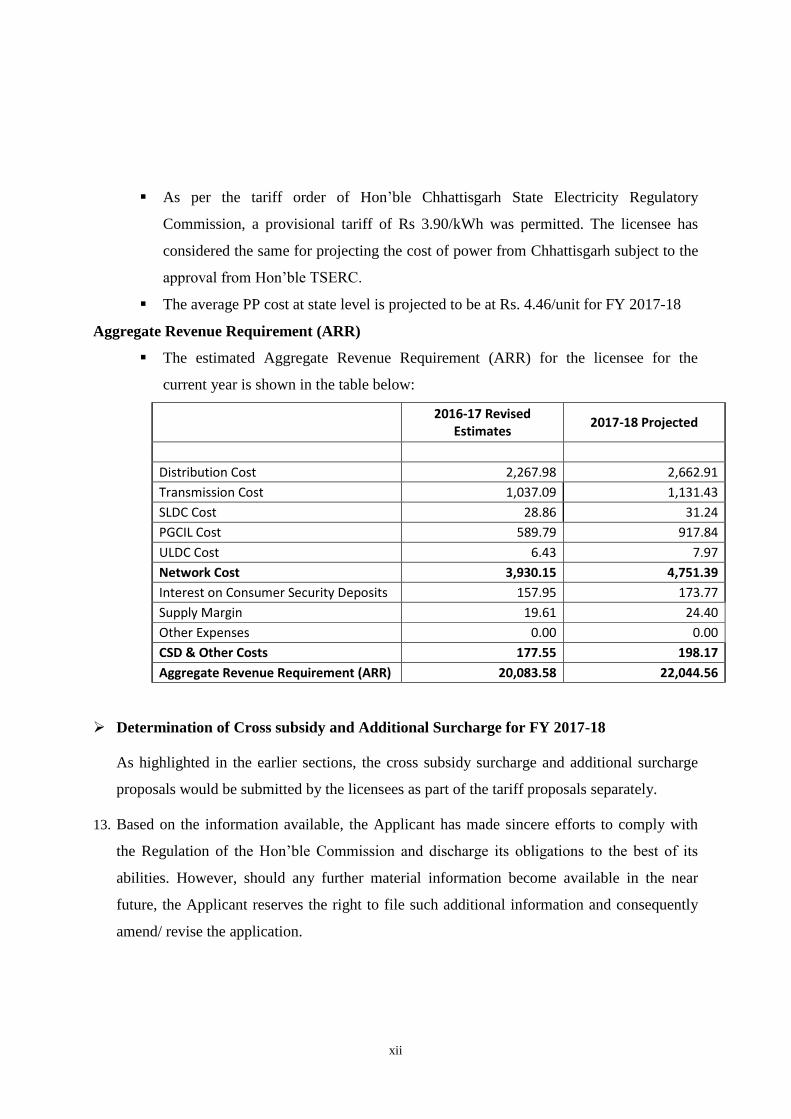
As per the tariff order of Hon‟ble Chhattisgarh State Electricity Regulatory
Commission, a provisional tariff of Rs 3.90/kWh was permitted. The licensee has
considered the same for projecting the cost of power from Chhattisgarh subject to the
approval from Hon‟ble TSERC.
The average PP cost at state level is projected to be at Rs. 4.46/unit for FY 2017-18
Aggregate Revenue Requirement (ARR)
The estimated Aggregate Revenue Requirement (ARR) for the licensee for the
current year is shown in the table below:
2016-17 Revised
Estimates 2017-18 Projected
Power Purchase Cost 15,975.88 17,095.00
Distribution Cost 2,267.98 2,662.91
Transmission Cost 1,037.09 1,131.43
SLDC Cost 28.86 31.24
PGCIL Cost 589.79 917.84
ULDC Cost 6.43 7.97
Network Cost 3,930.15 4,751.39
Interest on Consumer Security Deposits 157.95 173.77
Supply Margin 19.61 24.40
Other Expenses 0.00 0.00
CSD & Other Costs 177.55 198.17
Aggregate Revenue Requirement (ARR) 20,083.58 22,044.56
Determination of Cross subsidy and Additional Surcharge for FY 2017-18
As highlighted in the earlier sections, the cross subsidy surcharge and additional surcharge
proposals would be submitted by the licensees as part of the tariff proposals separately.
13. Based on the information available, the Applicant has made sincere efforts to comply with
the Regulation of the Hon‟ble Commission and discharge its obligations to the best of its
abilities. However, should any further material information become available in the near
future, the Applicant reserves the right to file such additional information and consequently
amend/ revise the application.

xiv
BEFORE THE HONOURABLE TELANGANA STATE ELECTRICITY REGULATORY COMMISSION
AT ITS OFFICE AT 5th
Floor, Singareni Bhavan, Red Hills, Hyderabad - 500 004
FILING NO.________/2016
CASE NO. ________/2016
In the matter of:
Filing of the ARR application for the year 2017-18 in accordance with the “Telangana
Electricity Regulatory Commission (Terms And Conditions For Determination Of Tariff
For Wheeling And Retail Sale Of Electricity) Regulation, 2005” by the SOUTHERN
POWER DISTRIBUTION COMPANY OF TELANGANA LIMITED („TSSPDCL‟ or „the
Company‟ or „the Licensee‟) as the Distribution and Retail Supply Licensee.
In the matter of:
SOUTHERN POWER DISTRIBUTION COMPANY OF TELANGANA LIMITED
… Applicant
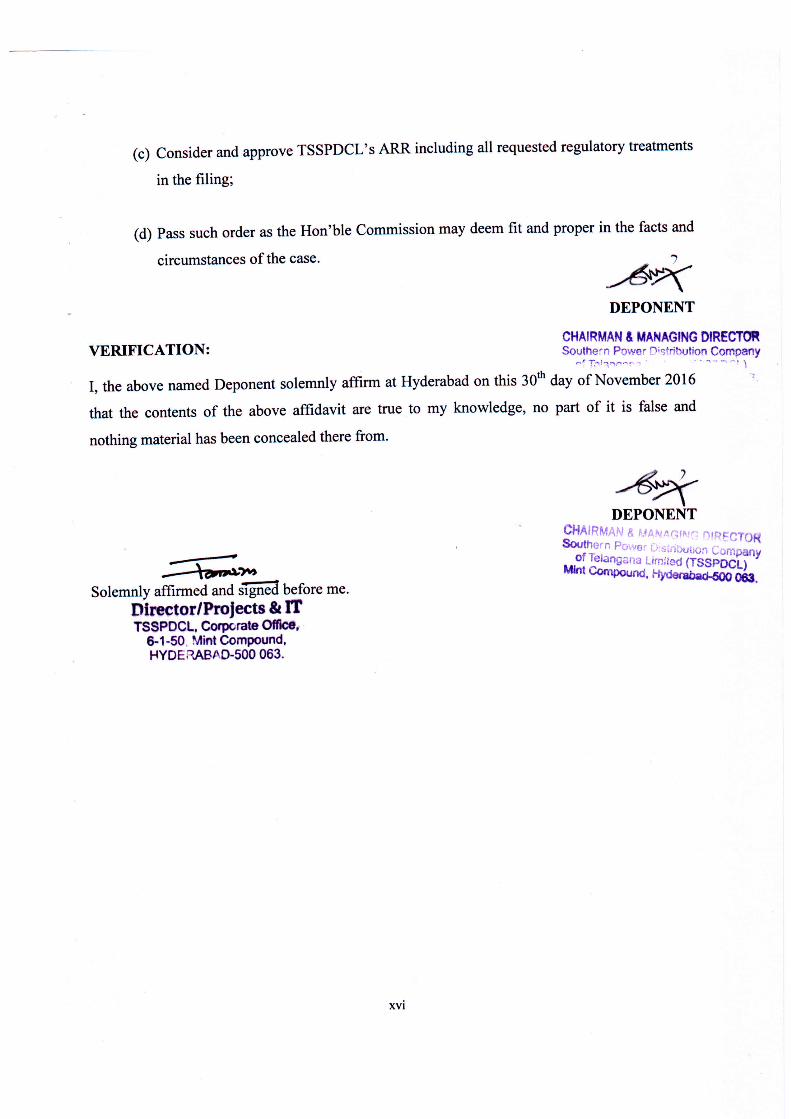
AFFIDAVIT OF APPLICANT VERIFYING THE APPLICATION ACCOMPANYING
FILING AS PER TERMS AND CONDITIONS OF TARIFF FOR WHEELING AND
RETAIL SALE OF ELECTRICITY
I, Sri G.Raghuma Reddy, son of Sri G. Janga Reddy (Late), working for gain at the Southern
Power Distribution Company of Telangana Limited do solemnly affirm and say as follows:
1 I am the Chairman and Managing Director of TSSPDCL, the Licensee that has, vide the
Hon‟ble Commission‟s approval in proceedings No. APERC/Secy/Engg/No.6 dt.31.3.2000,
been granted the distribution and retail supply functions that Transco was authorised to
conduct or carry out under the Act and the license, with respect to the business of distribution
and retail supply of electricity in the Southern distribution zone in Telangana. On December
27, 2000, the Hon'ble Commission has awarded a Distribution and Retail Supply License to
APCPDCL ( now TSSPDCL) effected from April 1, 2001.
2 Consequent to the bifurcation of the Andhra Pradesh State as per the Andhra Pradesh
Reorganization Act, the two districts of Anathapur and Kurnool were moved from the

xv
jurisdiction of APCPDCL to APSPDCL and the name of the licensee was changed from
APCPDCL to TSSPDCL.
3 As per the section 92 read with the twelfth schedule of the AP Reorganization Act, the then
APERC functioned as Joint regulatory body and issued Regulation No. 3 of 2014 (
Reorganisation) Regulation,2014 and as per clause 5 of the regulation which reads as “ the
area of supply of existing distribution & Retail supply licensees shall deemed to be
reassigned as per the provisions of the Andhra Pradesh Reorganisation Act 2014 until
amended or separate licenses are issued by the respective state electricity Regulatory
Commissions.”
4 I am competent and duly authorised by TSSPDCL to affirm, swear, execute and file this
affidavit in the present proceedings.
5 As such, I submit that I have been duly authorised by the Board of Directors of TSSPDCL to
submit the application, as per Terms and Conditions of Tariff for Wheeling and Retail Sale of
Electricity (Regulation 4 of 2005) of TSSPDCL for the FY 2017-18 to Hon‟ble Commission.
6 I submit that I have read and understood the contents of the appended application of
TSSPDCL. The facts stated in the application are true to the best of my knowledge, which are
derived from the official records made available and certain facts stated are based on
information and advice which, I believe to be true and correct.
7 I submit that for the reasons, and facts stated in the appended application this Applicant pray
that the Hon‟ble Commission may be pleased to
(a) Take the accompanying ARR application of TSSPDCL on record and treat it as complete the
tariff proposals, true-ups will be submitted at a later date
(b) Grant suitable opportunity to TSSPDCL within a reasonable time frame to file
additional material information that may be subsequently available;

TSSPDCL ARR for FY2017-18 Retail Supply Business
1
Contents
1 INTRODUCTION ..................................................................................................................... 3 1.1 Factual Background ................................................................................................................. 3 1.2 Multi-Year Tariff (MYT) Principles .......................................................................................... 3 1.3 Past Filings ................................................................................................................................ 4 1.4 Present Filings .......................................................................................................................... 5 1.5 Filing Contents .......................................................................................................................... 5
2 EFFICIENCY & PERFORMANCE ................................................................................................... 7 2.1 Operational Performance ........................................................................................................ 7
2.1.1 Energy Balance ............................................................................................................ 7
2.1.2 Metered Sales ............................................................................................................... 7
2.1.3 Agricultural sales .......................................................................................................... 8
2.1.4 Distribution Loss ........................................................................................................... 8
2.1.5 Other Significant Achievements: ................................................................................ 9
2.2 Financial Performance ............................................................................................................. 9 2.2.1 Financial Performance Summary .............................................................................. 9
2.2.2 Revenue from sale of Electricity .............................................................................. 10
2.2.3 Power purchase cost ................................................................................................. 10
2.2.4 Distribution cost .......................................................................................................... 11
2.3 Performance Reports ............................................................................................................. 11 2.4 Status on Implementation of Directives .............................................................................. 12
3 SALES FORECAST AND POWER PROCUREMENT PLAN ........................................ 24 3.1 Sales Forecast ........................................................................................................................ 24 3.2 Load Forecast ......................................................................................................................... 32
3.2.1 Discom Losses ........................................................................................................... 32
3.2.2 Transco Losses .......................................................................................................... 33
3.2.3 Losses external to Transco system ......................................................................... 33
3.2.4 Energy Requirement .................................................................................................. 33
3.3 Power Procurement Plan ...................................................................................................... 34 3.3.1 Basis of Estimation of Quantity and Cost ............................................................... 34
3.3.2 Power Purchase allocation ....................................................................................... 34
3.3.3 Installed Capacity of Generating Stations .............................................................. 34
3.3.4 Energy Availability ...................................................................................................... 39
4 EXPENDITURE PROJECTIONS & ARR .......................................................................... 46 4.1 Power Purchase Quantum & Procurement Cost ............................................................... 46
4.1.1 TSGenco & APGenco ................................................................................................ 46
4.1.2 Central Generating Stations (CGS): ........................................................................ 47
4.1.3 APGPCL ...................................................................................................................... 51
4.1.4 New IPPs ..................................................................................................................... 52
4.1.5 Non-ConventionalEnergy(NCE) Sources: .............................................................. 52

TSSPDCL ARR for FY2017-18 Retail Supply Business
2
4.1.6 Bilateral Purchases .................................................................................................... 53
4.1.7 Long Term ................................................................................................................... 53
4.1.8 Singareni Thermal Power Project ............................................................................ 53
4.1.9 Summary of Energy Requirement ........................................................................... 53
4.1.10 Summary of power purchase for current year and ensuing year ........................ 53
4.2 Transmission Charges ........................................................................................................... 54 4.3 PGCIL Charges ...................................................................................................................... 55 4.4 SLDC Charges ........................................................................................................................ 55 4.5 Distribution Cost ..................................................................................................................... 55 4.6 Interest on Consumer Security Deposit .............................................................................. 56 4.7 Supply Margin ......................................................................................................................... 56 4.8 Other Cost ............................................................................................................................... 56 4.9 Aggregate Revenue Requirement ....................................................................................... 56
5 REVENUE PROJECTIONS ................................................................................................. 58 5.1 Revenue at Current Tariffs.................................................................................................... 58 5.2 Non-Tariff Income from Current Tariffs ............................................................................... 58
6 COST OF SERVICE ............................................................................................................. 61 6.1 Introduction .............................................................................................................................. 61 6.2 Cost of Service Model ........................................................................................................... 61 6.3 CoS Results ................................................................................................................................ 66
7 RESOURCE PLAN TILL FY2018-19 (for 3rdcontrol period) ........................................... 68 7.1 Sales Projections .................................................................................................................... 68
7.1.3 The Summary of Sales Projections ......................................................................... 68
7.2 Energy Requirement .............................................................................................................. 69 7.3 Supply Projections ................................................................................................................. 69 7.4 Distribution Plan ..................................................................................................................... 71
8 ANNEXURE-I ............................................................................................................................. 73
9 ANNEXURE- II ........................................................................................................................... 84 10 COS Formats ………………………………………………………………………………………………………………….. 104 11 Retail Supply Formats……………………………………………………………………………………………………… 114

TSSPDCL ARR for FY2017-18 Retail Supply Business
3
1 INTRODUCTION
1.1 Factual Background
1.1.1 Southern Power Distribution Company of Telangana Limited (TSSPDCL) [formerly
Central Power Distribution Company of Andhra Pradesh Limited, APCPDCL] was
incorporated under the Companies Act, 1956 as a public limited company and has
Distribution and Retail Supply of Electricity license (License No.13 of 2000), granted
by Hon‟ble Commission (former APERC) in O.P.No.643/2000, dated 29.12.2000 u/s
15 of Andhra Pradesh Electricity Reform Act, 1998 effected from 1st April, 2001, all
conditions as contained in License shall be deemed to have been specified u/s 16 of
the Electricity Act, 2003 as per Hon‟ble Commission (former APERC) notified
Regulation 8 of 2004.
1.1.2 In terms with Schedule XII to the Andhra Pradesh Reorganisation Act, 2014 [APR
Act], which came into effect on 2nd June, 2014, the Anantapur and Kurnool districts,
which fall within the jurisdiction of the APCPDCL have been reassigned to the
Southern Power Distribution Company of Andhra Pradesh Limited (APSPDCL).
Accordingly two (2) operating circles of the Licensee viz., Anantapur and Kurnool
were demerged and assigned to APSPDCL effective on the appointed date i.e.,
02.06.2014. Assets and Liabilities of the Licensee were bifurcated in terms of
Transfer Guidelines issued by united State of Andhra Pradesh in G.O.Ms.No.24,
dated 29.05.2014. Financial Statements relating to bifurcation was adopted by the
Licensee and certified by Independent Chartered Accountants, Comptroller and
Auditor General of India and submitted to Expert Committee constituted under the
APR Act. However in the case of employees related Assets and Liabilities, the basis
of bifurcation as specified in above-mentioned G.O. could not followed and another
basis was used for bifurcation of Assets and Liabilities.
1.1.3 In pursuant to the provisions of Section 13 and other applicable provisions of
Companies Act, 2013 the name of the company has been changed from APCPDCL
to Southern Power Distribution Company of Telangana Limited (TSSPDCL)
w.e.f. 27.05.2014.
1.2 Multi-Year Tariff (MYT) Principles
1.2.1 The Hon‟ble Commission (former APERC) has notified Regulation 4 of 2005 laying
down the principles for determination of Aggregate Revenue Requirement (ARR) for
Retail Supply Business which will be the basis for the fixation of the Tariff/Charges

TSSPDCL ARR for FY2017-18 Retail Supply Business
4
for retail sale of electricity including surcharges. This Regulation introduced Multi-
Year-Tariff (MYT) framework.
1.2.2 The Hon‟ble Commission (TSERC) has notified Regulation 1 of 2014 on 10.12.2014
(Adoption of Previously Subsisting Regulations, Decisions, Directions or Orders,
Licenses and Practice of Directions)wherein clause 2 stipulates that -
“All regulations, decisions, directions or orders, all the licences and practice directions issued by the erstwhile Andhra Pradesh Electricity Regulatory Commission (Regulatory Commission for States of Andhra Pradesh and Telangana) in existence as on the date of the constitution of the Telangana State Electricity Regulatory Commission and in force, shall mutatis-mutandis apply in relation to the stakeholders in electricity in the State of Telangana including the Commission and shall continue to have effect until duly altered, repealed or amended, any of Regulation by the Commission with effect from the date of notification as per Notification issued by the Government of Telangana in G.O.Ms.No.3 Energy(Budget) Department, dt.26-07-2014 constituting the Commission.”
1.2.3 As such, all Regulations notified by erstwhile APERC will continue to apply for the
state of Telangana.
1.3 Past Filings
1.3.1 As per the Regulation 4 of 2005, the licensee is required to file the ARR along with
Filing for Proposed Tariff (FPT) for Retail Supply Business for a period of 5 years
called control period for approval by the Hon‟ble Commission not less than 120 days
before the commencement of 1st year of the control period. The 3rd control period
covers the years from 2014-15 to 2018-19.
1.3.2 However, the licensee expressed its inability to make filings for Retail Supply
Business for entire 3rd control period in view of uncertainty involved in projections of
generation availability, power purchase cost viz., a) projections of quantum of power
to be purchased from various sources as well as in cost; and b) demand side
uncertainties. Moreover, due to the regulatory objectives (i.e., incentivize the
performance of the licensee based on its achievement vis-à-vis targets; and
providing tariff certainty to the consumers) of MYT regime are not being met, instead
sought approval of the Hon‟ble Commission to allow it to file the ARR for Retail
Supply Business on annual basis, year after year, i.e., for FY2014-15, for FY2015-16
and for FY2016-17. The Hon‟ble Commission has been kind enough in granting
permission for filing ARR on annual basis vide proceedings No.Secy./DD(EAS)/S-
98/260/ 13, dated 01.11.2013 for FY2014-15, vide letter No.TSERC/DD(T-Engg)/T-
03 of 2014/D.No./14, dated 15.12.2014 for FY2015-16 and vide letter
No.TSERC/Tariff/DD(T-Engg)/T-01of 2015/D.No.751/15, dated 28.09.2015 for

TSSPDCL ARR for FY2017-18 Retail Supply Business
5
FY2016-17. Accordingly, the Licensee has filed the ARR filings with the Hon‟ble
Commission.
1.4 Present Filings
1.4.1 With regard to current filings of Retail Supply Business, the Licensee represented
vide letter dated 07.11.2016 that the requirements of Multi-Year-Tariff (MYT) filing
should be waived and sought permission of the Hon‟ble Commission for filing ARR
and Tariff proposals on annual basis from here on, specifically from the 4thyear of 3rd
control period onwards. The Licensee explained that the uncontrollable factors and
significant uncertainties involved are likely to continue in the coming years as well.
1.4.2 The Hon‟ble Commission vide letterno.TSERC/Tariff/DD(T-Engg)/T-
03/2015/D.No.708/16, dated 19.11.2016 has granted permission to TSDiscoms to
submit the ARR & Filing for Proposed Tariff for Retail Supply Business on annual
basis for the year 2017-18 only.
1.4.3 In order to simplify the tariff structure/ reduce tariff categories of consumers,
Government of India constituted a committee with Joint Secretary (Ministry of Power)
as the Chairperson vide 23/32/2016- R & R dated 24/ 08/2016. The licensee is
currently evaluating the options for rationalizing tariff and categories and would
require additional time for performing a holistic assessment to meet the above
mandate. Hence the licensee requested the Hon‟ble Commission to permit to file to
the extent of ARR only for FY 2017-18 by 30th Nov 16 and allow filing of Tariff
Proposals by 31st December 2016.
1.4.4 Further, as per the Directive No.10 issued by the Hon‟ble Commission in Tariff Order
dated 23.06.2016 for Retail Supply Tariffs for FY2016-17, the Discoms have to file
True-up proposals of Distribution Business for both 1st and 2nd control periods and
true-up of Retail Supply Business under Regulation 1 of 2014 for FY 2014-15 and FY
2015-16. In this regard it is to submit that Government of Telangana (GoTS) is
considering signing UDAY scheme this year. Licensee will file true-up for FY15-16
and FY16-17 along with tariff proposal after considering final MoU signed by GoTS
and GoI.
1.5 Filing Contents
1.5.1 The application is structured in seven (7) Sections as given in table below:
Section 1:
(this section)
Provides factual background about TSSPDCL (Licensee). About these filings
under regulatory MYT framework. The summary and the salient features of
these filings.
Section 2: Provides performance analysis of the Licensee during the previous year by
TSSPDCL ARR for FY2017-18 Retail Supply Business
6
considering certain key operational and financial parameters.
Section 3: Provides the sales forecast and power procurement plan of Licensee viz.,
Sales Forecast, Load Forecast and Power Procurement Plan.
The sales forecast is used to determine the energy input required for ensuing
year for meeting the demand. For sales forecast of second half of FY2016-17
and for the year 2017-18, historical sales of Licensee has been considered to
arrive at growth trend.
Energy requirement is arrived by grossing up the projected sales with
Hon‟ble TSERC approved Transmission & Distribution (T&D) losses.
Discusses the methodology and assumptions considered for estimating the
quantum and corresponding cost of power purchase. The power
procurement plan is based on the availability of the generation sources
during the ensuing year to meet the demand expected during various
months.
Section 4: Provides Expenditure Projections for FY2017-18consisting of:-
Power Purchase and Procurement Cost Transmission and PGCIL Charges SLDC Charges Distribution Cost Interest on Consumer Security Deposits Supply Margin Other Costs ARR for Retail Supply Business for FY2017-18.
Section 5: Provides the details of actual revenue and Non Tariff Income (NTI) .
Section 6: Presents the estimated Cost of Service (CoS) for various consumer
categories of the Licensee for the year 2017-18 by classifying the costs into
demand, energy and customer related components and then apportioning
the same to various consumer categories.
Section 7 Provides the details of Resource Plan and Distribution Plan for the balance
years of 3rd control period.
TSSPDCL ARR for FY2017-18 Retail Supply Business
7
2 EFFICIENCY & PERFORMANCE
2.1 Operational Performance
The performance of the licensee is analyzed duly considering certain key operational
and financial parameters during the previous year with the approved values in the
Tariff Order 2015-16 and compared to the current year.
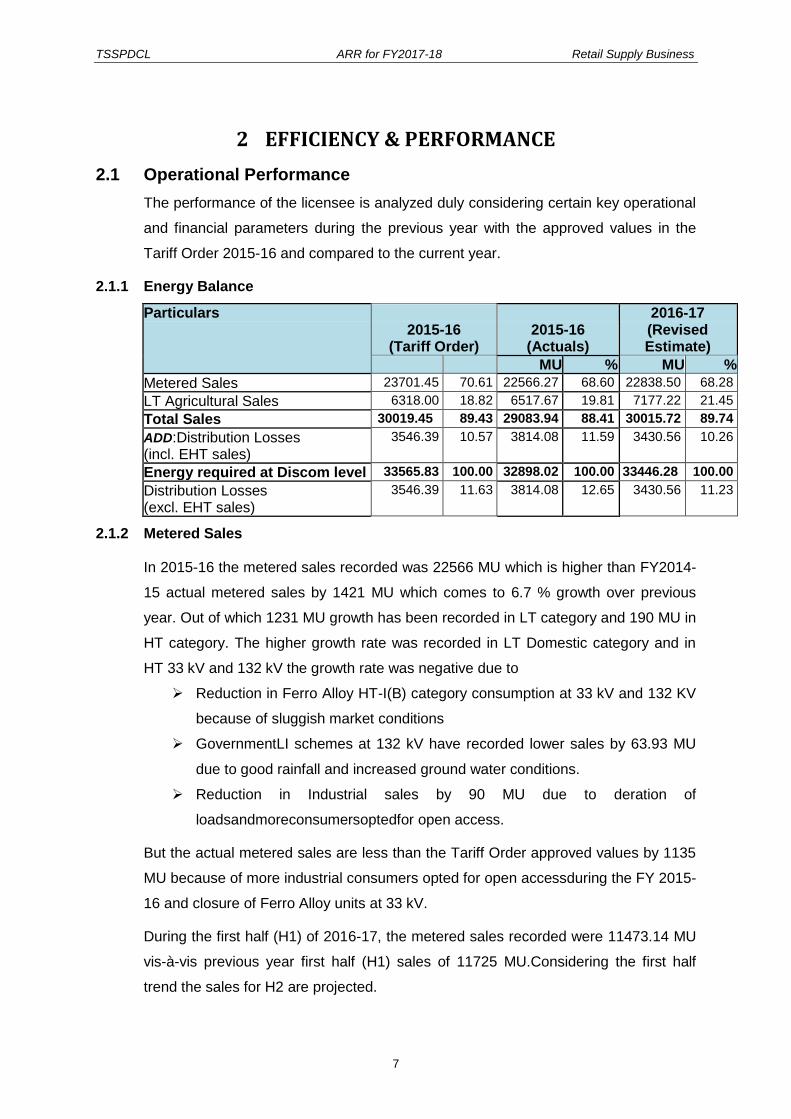
2.1.1 Energy Balance
Particulars 2015-16
(Tariff Order) 2015-16
(Actuals)
2016-17 (Revised Estimate)
MU % MU %
Metered Sales 23701.45 70.61 22566.27 68.60 22838.50 68.28
LT Agricultural Sales 6318.00 18.82 6517.67 19.81 7177.22 21.45
Total Sales 30019.45 89.43 29083.94 88.41 30015.72 89.74
ADD:Distribution Losses (incl. EHT sales)
3546.39 10.57 3814.08 11.59 3430.56 10.26
Energy required at Discom level 33565.83 100.00 32898.02 100.00 33446.28 100.00
Distribution Losses (excl. EHT sales)
3546.39 11.63 3814.08 12.65 3430.56 11.23
2.1.2 Metered Sales In 2015-16 the metered sales recorded was 22566 MU which is higher than FY2014-
15 actual metered sales by 1421 MU which comes to 6.7 % growth over previous
year. Out of which 1231 MU growth has been recorded in LT category and 190 MU in
HT category. The higher growth rate was recorded in LT Domestic category and in
HT 33 kV and 132 kV the growth rate was negative due to
Reduction in Ferro Alloy HT-I(B) category consumption at 33 kV and 132 KV
because of sluggish market conditions
GovernmentLI schemes at 132 kV have recorded lower sales by 63.93 MU
due to good rainfall and increased ground water conditions.
Reduction in Industrial sales by 90 MU due to deration of
loadsandmoreconsumersoptedfor open access.
But the actual metered sales are less than the Tariff Order approved values by 1135
MU because of more industrial consumers opted for open accessduring the FY 2015-
16 and closure of Ferro Alloy units at 33 kV.
During the first half (H1) of 2016-17, the metered sales recorded were 11473.14 MU
vis-à-vis previous year first half (H1) sales of 11725 MU.Considering the first half
trend the sales for H2 are projected.

TSSPDCL ARR for FY2017-18 Retail Supply Business
8
2.1.3 Agricultural sales
In the previous year FY2015-16, the agricultural consumption was 6517 MU. During
the year, 54717 agricultural connections were released. In the current year 2016-17
during the first half of the year the agriculture Consumption is 3265MU and in the
second half, the sales are projected based on the agricultural service connections to
be released as per the proposed targets for FY 2016-17. In FY 2016-17 the total
target for release of agricultural Services is 64730, out of which 27773 has already
been released during first half. Hence, the anticipated agricultural consumption will
for the entire financial year 2016-17be 7177 MU.
2.1.4 Distribution Loss Year Loss Target as
per APERC Actual No. of 11 kV
T&MHQ feeders for
which energy audit done
11 kV 2 MVAR capacitor banks
added to the system
Additional 33/11 kV sub-
stations charged
Excl. EHT
Incl. EHT
Excl. EHT
Incl. EHT
2009-10 13.04 11.51 18.41 16.67 1527 154 109
2010-11 14.71 13.1 17.34 15.67 1644 108 90
2011-12 13.86 12.34 18.13 16.36 1768 32 67
2012-13 13.67 12.18 16.28 14.78 1871 77 70
2013-14 12.84 11.44 14.63 13.20 1988 91 60
2014-15 - - 14.19 12.92 1738 50 81
2015-16 11.63 10.57 12.65 11.59 1764 63 105 nos.
2016-17 (upto
Sep‟16) 10.94 9.79 11.62 10.61 1824 76
136 nos. proposed, 5
nos. completed, balance works
are under progress
As seen from the above table, the actual losses for the FY2015-16 are 12.65 % and
reduced compared to previous year loss of 14.19%. However it is expected to reduce
the losses further with the implementation of the following measures.
i) Strict implementation of number of hours of supply to agricultural sector.
ii) Reduction of both technical and commercial losses by vigorously conducting
11 kV feeder wise energy audits around 1764 Nos. feeders in the company.
iii) During the year 2015-16, 1764 Nos. feeders (Towns and Mandal
Headquarters) are available in EAUDIT for which energy audit is done on
regular basis at corporate office level.
iv) 63 Nos. additional 11 kV 2 MVAR capacitor banks were proposed and added
during the year 2016-17 and 76 Nos. Capacitor banks added from Apr;16 to
Sep‟16.
For the year 2015-16, 105 Nos. additional 33/11 kV sub-stations were charged and
for the year 2016-17, 136 Nos. additional 33/11 kV sub-stations are proposed out of
TSSPDCL ARR for FY2017-18 Retail Supply Business
9
which 5 Nos. were already charged to reduce over loaded 33 kV& 11 kV lines and to
maintain good voltage profiles up to the consumers end.
2.1.5 Other Significant Achievements: The other significant achievements of Licensee during FY2015-16 are enumerated
below:
Energy Conservation Measures: Licensee has taken the following initiatives
for Energy Conservation during FY2015-16, whereby the energy losses to
energy input percentage decreased significantly.
Energy Audit of 26 Towns feeders and 178 Mandal Head Quarter feeders.
Impact of above measures is apparent. The energy losses in FY 2015-16
are significantly lower than the previous year.
Arrested the theft of power by regular DPE wings by conducting
inspections and special intensive inspections with the DPE & Operation
Wings of all circles. During the FY 2015-16, in both HT & LT
connectionstotal 113925 no. of cases were booked in pilferage,
Unauthorized usage, Back billing/Short billing and Development Charges.
2.2 Financial Performance
The following table provides an overview of TSSPDCL‟s financial performance for the
current year and previous year:
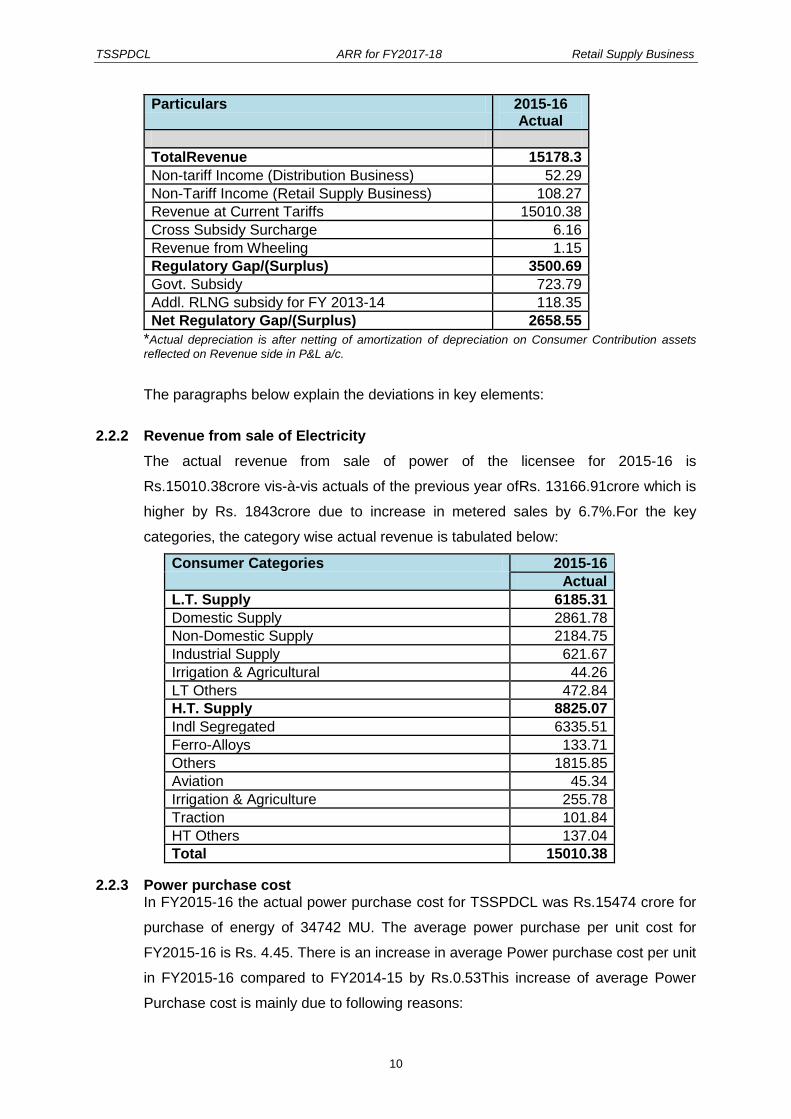
2.2.1 Financial Performance Summary The financial results of the Company for the year ended on 31st March, 2015 the
Company could earn an aggregate income of Rs.15178crore. The financial
performance of the Company is as follows:
Particulars 2015-16 Actual
Supply Margin 15.93
ROCE/Interest 445.16
Total Financing Cost 461.09
Power purchase 15478.91
Transmission charges 820.55
PGCIL/ULDC Charges 331.72
SLDC Charges 26.41
O&M (Gross) 1202.57
Depreciation 305.92*
Interest on consumer deposits 167.86
Special appropriations forsafety measures 0.00
Less: Expenses capitalized 121.75
Other Costs 5.66
Total Exp. Incl. Finance cost 18217.9
TSSPDCL ARR for FY2017-18 Retail Supply Business
10
Particulars 2015-16 Actual
TotalRevenue 15178.3
Non-tariff Income (Distribution Business) 52.29
Non-Tariff Income (Retail Supply Business) 108.27
Revenue at Current Tariffs 15010.38
Cross Subsidy Surcharge 6.16
Revenue from Wheeling 1.15
Regulatory Gap/(Surplus) 3500.69
Govt. Subsidy 723.79
Addl. RLNG subsidy for FY 2013-14 118.35
Net Regulatory Gap/(Surplus) 2658.55
*Actual depreciation is after netting of amortization of depreciation on Consumer Contribution assets
reflected on Revenue side in P&L a/c.
The paragraphs below explain the deviations in key elements:
2.2.2 Revenue from sale of Electricity
The actual revenue from sale of power of the licensee for 2015-16 is
Rs.15010.38crore vis-à-vis actuals of the previous year ofRs. 13166.91crore which is
higher by Rs. 1843crore due to increase in metered sales by 6.7%.For the key
categories, the category wise actual revenue is tabulated below:
Consumer Categories 2015-16
Actual
L.T. Supply 6185.31
Domestic Supply 2861.78
Non-Domestic Supply 2184.75
Industrial Supply 621.67
Irrigation & Agricultural 44.26
LT Others 472.84
H.T. Supply 8825.07
Indl Segregated 6335.51
Ferro-Alloys 133.71
Others 1815.85
Aviation 45.34
Irrigation & Agriculture 255.78
Traction 101.84
HT Others 137.04
Total 15010.38
2.2.3 Power purchase cost In FY2015-16 the actual power purchase cost for TSSPDCL was Rs.15474 crore for
purchase of energy of 34742 MU. The average power purchase per unit cost for
FY2015-16 is Rs. 4.45. There is an increase in average Power purchase cost per unit
in FY2015-16 compared to FY2014-15 by Rs.0.53This increase of average Power
Purchase cost is mainly due to following reasons:

TSSPDCL ARR for FY2017-18 Retail Supply Business
11
- Very lowHydel generation during FY2015-16 which is only 10% of generation in
FY 2014-15 due to scanty rainfall.
- Increase in market purchases and corresponding purchase costs.
- Increase in variable cost for thermal stations such as VTPS ,RTS B, KTPP-I.
2.2.4 Distribution cost The major deviations in the key elements of distribution cost against tariff order
approved values for FY2015-16 are explained below:
Particulars Tariff Order Actual Deviation
Operation and Maintenance Charges 1270.43 1202.57 (67.86)
Employee Cost 878 823 (55)
Administration & General 231 101 (130)
Repairs & Maintenance 161 278 117
Depreciation 561.63 544.52 (17.11)
Return on Capital Employed 376.00 445.16 69.15
O&M cost:
The operation and maintenance expenses incurred during FY2015-16 is lower than
the Tariff order approved values by Rs. 67 crore which is due to employee
separations owing to state bifurcation..
Depreciation:
The depreciation amount has been marginally varied with tariff order approved
values to the tune of Rs.17 croredue to variation in capitalization of various assets
and asset class mix.
Return on Capital Employed (RoCE):
The Return on capital employed has been increased over tariff order approved value
by Rs.69crore mainly due to change in regulated rate base and average cost of debt
which is 13.96 % p.a. vis-à-vis 12 % as approved by the Commission which is
detailed below.
Particulars Tariff order Actual Variance
Regulated Rate Base 3921.33 3186.94 734.39
WACC 12.50% 13.97% 1.47%
Cost of Debt 12.00% 13.96% 1.96%
Return on Equity 14.00% 14.00% 0.00%
2.3 Performance Reports In accordance with the directive No.1 referred under Fresh Directives [para 172,
page 172] in Tariff Order dated 20th March, 2008 issued for Retail Supply Tariffs for
the year 2008-09, the Performance Reports of the Licensee are provided as
Annexure-II to this application

TSSPDCL ARR for FY2017-18 Retail Supply Business
12
2.4 Status on Implementation of Directives
2.4.1 The status of implementation of directives issued in Tariff Order dated 23rd June,
2016 with regard to Retail Supply Tariffs for FY2016-17 are detailed in Table given
below:
Directive No.
Directive Compliance Report
A. Earlier Directives
1 Imported coal The Discoms are directed to verify whether APGENCO/TSGENCO is procuring imported coal through the competitive bidding process, or under any guidelines issued in this regard by GoI, before admitting the Station wise power purchase bills claimed/submitted by APGENCO/ TSGENCO. Regarding NTPC Stations, DISCOMs have to take-up the pricing issue of imported coal, if any, with CERC.
APGENCO vide letter dated:02.09.2016 has informed that they are following Competitive Bidding process for procuring Imported coal. APGENCO further stated that, no imported coal was procured during the FY 2015-16 and met the shortfall of coal from M/s. SCCL. TSGENCO is not procuring any imported coaland informed that they will follow the competitive bidding process if imported coal is procured.
2 Quality of domestic coal The Discoms are directed to “appoint independent agency to ensure that the coal of agreed quality and price as per the fuel supply agreement (FSA) is used for generation of power at all coal based Thermal Power Stations. Before making final payment such audit reports should be verified by the concerned officers of the DISCOMs”. TSGENCO is also directed to adopt proper sampling technique both at sending and receiving end for coal supply from each source separately, keeping in view, the importance of coal audit as directed to DISCOMs.
Earlier, the united APERC was requested by
united APDISCOMs to appoint Fuel Auditors (Coal/ Fuel) to check the Quality of Domestic Coal as well as the procurement of Imported Coal being carried out by united APGENCO, in a similar manner as appointed by the Punjab State Electricity Regulatory Commission (PSERC). However the then Commission called for Tenders but could not finalize the same.
TSGENCO informed that joint sampling techniques are being followed by TSGENCO and M/s. SCCL at various loading points of M/s. SCCL for the coal supplied to TSGENCO Thermal Stations as per the Fuel Supply Agreement (FSA) entered between TSGENCO and M/s. SCCL. TSGENCO further stated that Bunker Coal analysis is being carried out for the coal fed to bunkers at power station end for all Thermal Power Stations of TSGENCO. APGENCO stated that it is following Bureau of Indian Standards in sampling techniques.
3 Metering of agricultural DTRs The Discoms are directed to chalk out a timeline program and submit to the Commission for approval for installation of meters to all the agricultural DTRs in order to compute the metered agricultural consumption and losses in the system. In the meantime, for assessing the agricultural consumption based on ISI methodology, provide additional meters to new sample DTRs instead of shifting of the existing sample DTR meters to the new sample DTRs, as prescribed in the ISI methodology. Further, the DISCOMs are directed to follow the report of the Indian Statistical
A proposal was submitted to the Secretary/TSERC for fixing of energy meters to all Agricultural DTRs in the Nagarkurnool Division of Mahabubnagar Circle. Approximate cost of the proposal is Rs.13.44 crores. For assessing the agricultural consumption based on ISI methodology, in addition to the existing 2245 No. of Agl sample DTRs, 62 Nos. additional sample DTRs are provided with energy meters in the ISI methodology.
TSSPDCL ARR for FY2017-18 Retail Supply Business
13
Directive No.
Directive Compliance Report
Institution which was submitted to the erstwhile APERC(which was approved) in estimation of agricultural consumption for FY 2017-18.
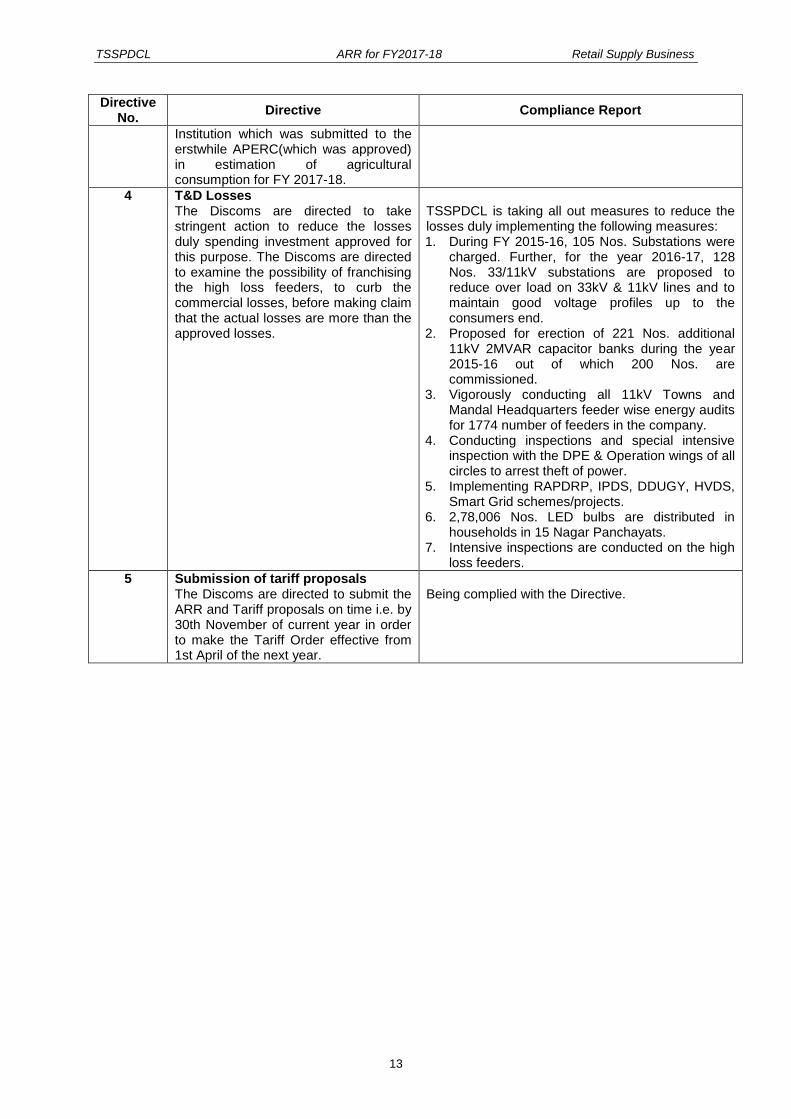
4 T&D Losses The Discoms are directed to take stringent action to reduce the losses duly spending investment approved for this purpose. The Discoms are directed to examine the possibility of franchising the high loss feeders, to curb the commercial losses, before making claim that the actual losses are more than the approved losses.
TSSPDCL is taking all out measures to reduce the losses duly implementing the following measures: 1. During FY 2015-16, 105 Nos. Substations were
charged. Further, for the year 2016-17, 128 Nos. 33/11kV substations are proposed to reduce over load on 33kV & 11kV lines and to maintain good voltage profiles up to the consumers end.
2. Proposed for erection of 221 Nos. additional 11kV 2MVAR capacitor banks during the year 2015-16 out of which 200 Nos. are commissioned.
3. Vigorously conducting all 11kV Towns and Mandal Headquarters feeder wise energy audits for 1774 number of feeders in the company.
4. Conducting inspections and special intensive inspection with the DPE & Operation wings of all circles to arrest theft of power.
5. Implementing RAPDRP, IPDS, DDUGY, HVDS, Smart Grid schemes/projects.
6. 2,78,006 Nos. LED bulbs are distributed in households in 15 Nagar Panchayats.
7. Intensive inspections are conducted on the high loss feeders.
5 Submission of tariff proposals The Discoms are directed to submit the ARR and Tariff proposals on time i.e. by 30th November of current year in order to make the Tariff Order effective from 1st April of the next year.
Being complied with the Directive.

TSSPDCL ARR for FY2017-18 Retail Supply Business
14
Directive No.
Directive Compliance Report
6 Replacement of fuses in agriculture DTRs The Discoms are directed to ensure that the field staff, to whom cell phone service (SIM card) are given, should attend to the fuse off calls within time, on the receipt of calls from a farmer over phone. For ensuring the same, register the time of call, and confirm the action taken from the consumer is required. For achieving this, the Licensee may examine on usage of advanced IT solutions. The Licensee shall examine other alternate approaches to achieve the above objective such as creating a central monitoring team to ensure that the field staff is responding properly to the farmers fuse off calls. The action taken in this regard shall be intimated within two months.
All ADE and AEs operations and field staff upto LM cadre are provided SIM cards/CUG facility and are regularly attending the fuse of calls in time on receipt of call from consumers/farmers. Further CSC‟s are also regularly monitoring the AGL. DTRs related issues of farmers. The farmers are being cautioned not to meddle with the DTR‟s and electrical lines and they were requested to call concerned field staff for attending the fuse of calls of Agl. DTRs. The mobile app is developed to address to the consumer grievance and implemented in GHMC area on pilot basis which will be rolled out to entire TSSPDCL area. The integrated electricity complaint handling system is developed & being tested as pilot project in GHMC.
Centrally operated toll free no.18004253600 is available for usage of farmers for registering electricity complaints in TSSPDCL and the toll free number 18004253600 will also be integrated to the above system.
7 Directive on resolving the problems faced by Rural area Consumers a)The Discoms are directed to examine the possibility of establishing operational crew consisting of two or three staff members with a vehicle and spare parts, to attend rectification of defects in AB switches of substations, DTR structures, carrying the minor repairs to the transformers at site, etc. in rural areas, for improving the quality of supply and to minimise problems faced by rural consumers. b) During the public hearing it was noticed that the staff members are not staying at headquarters (especially during night time) and causing problems to the consumers. The Discoms are directed to ensure that the staff members and all cadre of officers shall reside at the place of posting so as to make them easily accessible to the consumers and quarterly report ensuring the same shall be furnished to the Commission.
All the Officers Cadre and field staff are residing at their place of posting for easy accessibility for attending to Fuse of calls , break downs, rectification of AB Switches & DTR structures and also replacement of failed DTRs as per Citizen Charter. Sufficient O&M material is also available in stores for repairing of AB Switches, DTR structures. The circle wise Details of work carried out during F.Y 2015-16 on rectification of damaged AB Switches of substation and DTRs structures and carrying the minor repairs to the transformers up to Sep-2016 is here with enclosed in Annexure-I. Instructions are in place that all the Officers/Staff shall stay in their respective Headquarters. Necessary action will be initiated against the erring Officers/Staff who are not staying in the Headquarters, if Specific instances are brought to the notice of the TSSPDCL management.
TSSPDCL ARR for FY2017-18 Retail Supply Business
15
Directive No.
Directive Compliance Report
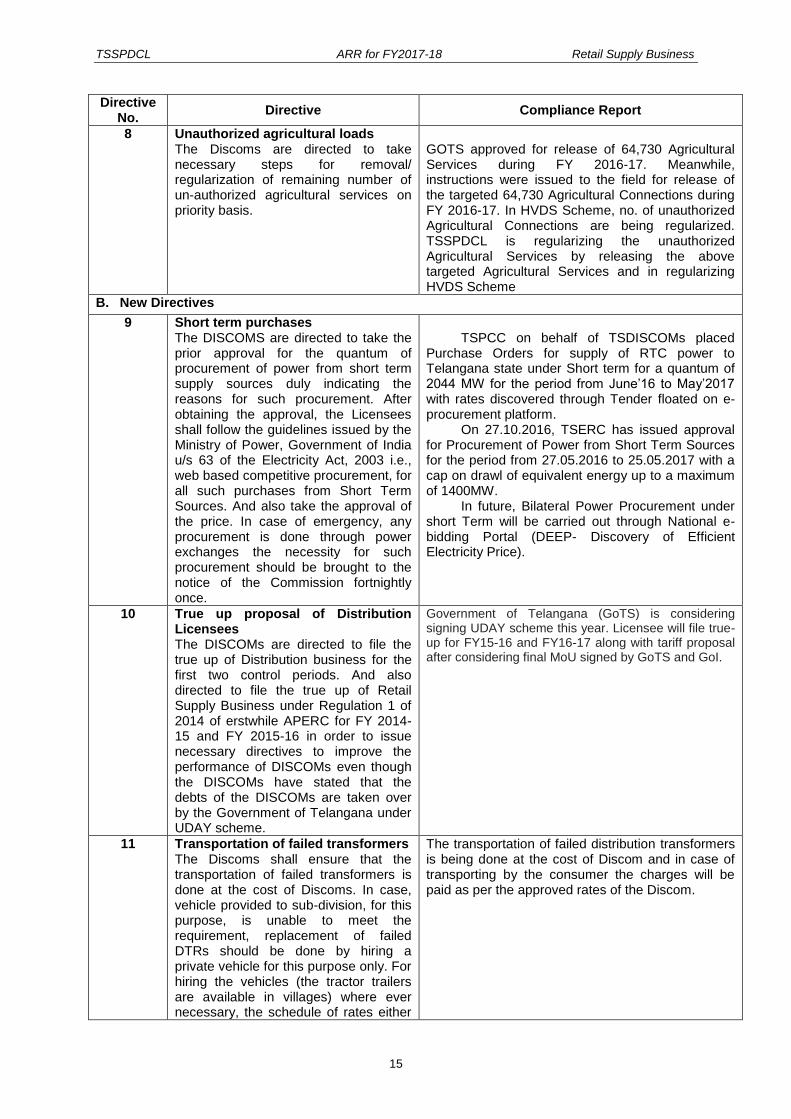
8 Unauthorized agricultural loads The Discoms are directed to take necessary steps for removal/ regularization of remaining number of un-authorized agricultural services on priority basis.
GOTS approved for release of 64,730 Agricultural Services during FY 2016-17. Meanwhile, instructions were issued to the field for release of the targeted 64,730 Agricultural Connections during FY 2016-17. In HVDS Scheme, no. of unauthorized Agricultural Connections are being regularized. TSSPDCL is regularizing the unauthorized Agricultural Services by releasing the above targeted Agricultural Services and in regularizing HVDS Scheme
B. New Directives
9 Short term purchases The DISCOMS are directed to take the prior approval for the quantum of procurement of power from short term supply sources duly indicating the reasons for such procurement. After obtaining the approval, the Licensees shall follow the guidelines issued by the Ministry of Power, Government of India u/s 63 of the Electricity Act, 2003 i.e., web based competitive procurement, for all such purchases from Short Term Sources. And also take the approval of the price. In case of emergency, any procurement is done through power exchanges the necessity for such procurement should be brought to the notice of the Commission fortnightly once.
TSPCC on behalf of TSDISCOMs placed
Purchase Orders for supply of RTC power to Telangana state under Short term for a quantum of 2044 MW for the period from June‟16 to May‟2017 with rates discovered through Tender floated on e-procurement platform.
On 27.10.2016, TSERC has issued approval for Procurement of Power from Short Term Sources for the period from 27.05.2016 to 25.05.2017 with a cap on drawl of equivalent energy up to a maximum of 1400MW.
In future, Bilateral Power Procurement under short Term will be carried out through National e-bidding Portal (DEEP- Discovery of Efficient Electricity Price).
10 True up proposal of Distribution Licensees The DISCOMs are directed to file the true up of Distribution business for the first two control periods. And also directed to file the true up of Retail Supply Business under Regulation 1 of 2014 of erstwhile APERC for FY 2014-15 and FY 2015-16 in order to issue necessary directives to improve the performance of DISCOMs even though the DISCOMs have stated that the debts of the DISCOMs are taken over by the Government of Telangana under UDAY scheme.
Government of Telangana (GoTS) is considering signing UDAY scheme this year. Licensee will file true-up for FY15-16 and FY16-17 along with tariff proposal after considering final MoU signed by GoTS and GoI.
11 Transportation of failed transformers The Discoms shall ensure that the transportation of failed transformers is done at the cost of Discoms. In case, vehicle provided to sub-division, for this purpose, is unable to meet the requirement, replacement of failed DTRs should be done by hiring a private vehicle for this purpose only. For hiring the vehicles (the tractor trailers are available in villages) where ever necessary, the schedule of rates either
The transportation of failed distribution transformers is being done at the cost of Discom and in case of transporting by the consumer the charges will be paid as per the approved rates of the Discom.
TSSPDCL ARR for FY2017-18 Retail Supply Business
16
Directive No.
Directive Compliance Report
on kilometer basis or on per day basis may be fixed.
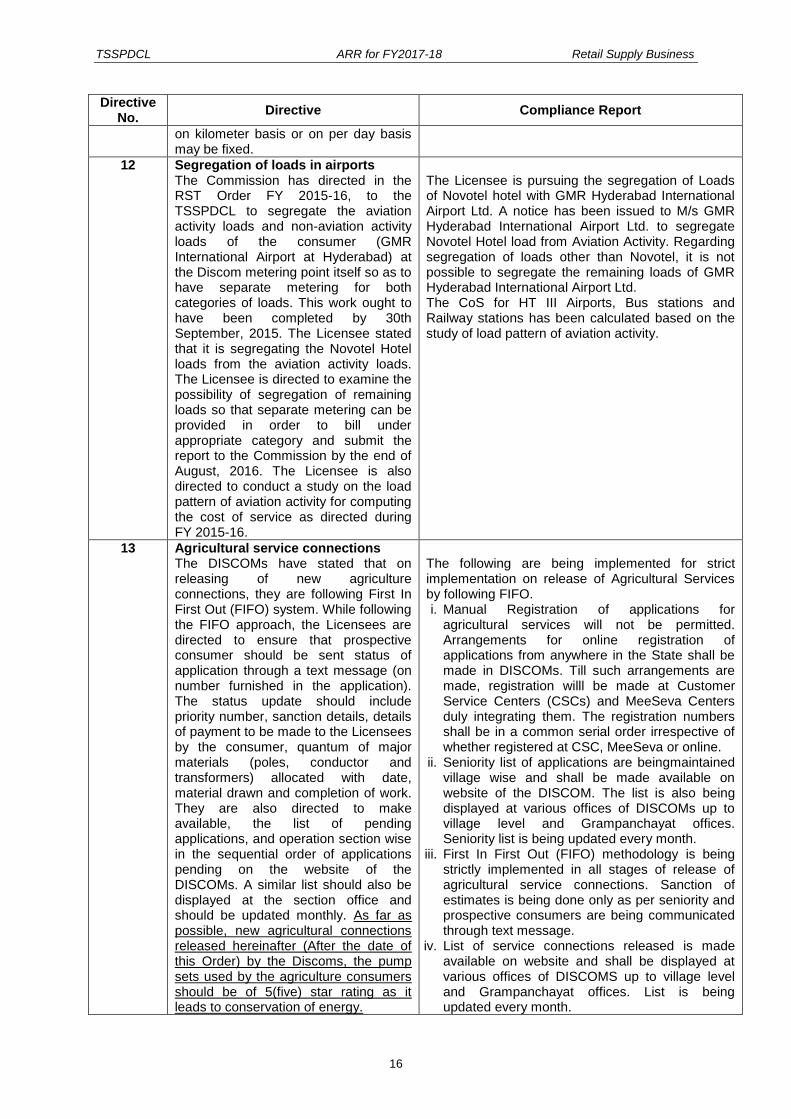
12 Segregation of loads in airports The Commission has directed in the RST Order FY 2015-16, to the TSSPDCL to segregate the aviation activity loads and non-aviation activity loads of the consumer (GMR International Airport at Hyderabad) at the Discom metering point itself so as to have separate metering for both categories of loads. This work ought to have been completed by 30th September, 2015. The Licensee stated that it is segregating the Novotel Hotel loads from the aviation activity loads. The Licensee is directed to examine the possibility of segregation of remaining loads so that separate metering can be provided in order to bill under appropriate category and submit the report to the Commission by the end of August, 2016. The Licensee is also directed to conduct a study on the load pattern of aviation activity for computing the cost of service as directed during FY 2015-16.
The Licensee is pursuing the segregation of Loads of Novotel hotel with GMR Hyderabad International Airport Ltd. A notice has been issued to M/s GMR Hyderabad International Airport Ltd. to segregate Novotel Hotel load from Aviation Activity. Regarding segregation of loads other than Novotel, it is not possible to segregate the remaining loads of GMR Hyderabad International Airport Ltd. The CoS for HT III Airports, Bus stations and Railway stations has been calculated based on the study of load pattern of aviation activity.
13 Agricultural service connections The DISCOMs have stated that on releasing of new agriculture connections, they are following First In First Out (FIFO) system. While following the FIFO approach, the Licensees are directed to ensure that prospective consumer should be sent status of application through a text message (on number furnished in the application). The status update should include priority number, sanction details, details of payment to be made to the Licensees by the consumer, quantum of major materials (poles, conductor and transformers) allocated with date, material drawn and completion of work. They are also directed to make available, the list of pending applications, and operation section wise in the sequential order of applications pending on the website of the DISCOMs. A similar list should also be displayed at the section office and should be updated monthly. As far as possible, new agricultural connections released hereinafter (After the date of this Order) by the Discoms, the pump sets used by the agriculture consumers should be of 5(five) star rating as it leads to conservation of energy.
The following are being implemented for strict implementation on release of Agricultural Services by following FIFO. i. Manual Registration of applications for
agricultural services will not be permitted. Arrangements for online registration of applications from anywhere in the State shall be made in DISCOMs. Till such arrangements are made, registration willl be made at Customer Service Centers (CSCs) and MeeSeva Centers duly integrating them. The registration numbers shall be in a common serial order irrespective of whether registered at CSC, MeeSeva or online.
ii. Seniority list of applications are beingmaintained village wise and shall be made available on website of the DISCOM. The list is also being displayed at various offices of DISCOMs up to village level and Grampanchayat offices. Seniority list is being updated every month.
iii. First In First Out (FIFO) methodology is being strictly implemented in all stages of release of agricultural service connections. Sanction of estimates is being done only as per seniority and prospective consumers are being communicated through text message.
iv. List of service connections released is made available on website and shall be displayed at various offices of DISCOMS up to village level and Grampanchayat offices. List is being updated every month.

TSSPDCL ARR for FY2017-18 Retail Supply Business
17
Directive No.
Directive Compliance Report
v. The Discom is ensuring5(five) star rated pump sets used by the consumer.
vi. Necessary steps will be taken to update the status to the consumers such as sanction details, payment details to be made to the licensee by the consumer, quantum of major materials (poles, conductor and transformer) allocated with date, material drawn and completion of the work.
The Agricultural Connection Seniority list is currently being displayed at all Customer Service Centers/ Integrated Customer Service Centers.
14 Non departmental accidents The DISCOMs are directed to establish a non-departmental accident registration system and give wide publicity. Necessary instructions to the staff shall be issued for acknowledging the accident claim applications at section office/ sub-division office. They are directed to make payment of ex-gratia for the fatal accident cases as per the Commission order on enhancement of ex-gratia amount, within the time specified. This was promised by the Licensees while replying at the public hearings. The report of compliance objector wise shall be furnished to the Commission by end of July, 2016
A portal to register the non-departmental accidents has been developed in house. The Hon‟ble Commission orders on ex- gratia payment are being complied. The compliance report objector wise is enclosed in Annexure-I
15 Monthly Billing The Licensees are directed to develop a software system in the spot billing machines such that the consumption is limited to the billing month (for example, if previous month reading was taken on 5
th day of the month, the next reading
taken on 7th day instead of taking on 5
th
day of current month, the consumption shall be apportioned to 30/31 days depending on the number of days in that particular calendar month so that it avoids the shifting of consumption to higher slabs).
The billing software system in the Spot Billing Machines and Energy Billing System in TSSPDCL is developed to apportion the actual consumption to 30/31 days depending on the No. of days in that Calendar Month in order to avoid the shifting of consumption to higher slabs and same has been implemented effectively w.e.f. 01.07.2016.
16 Staff shortage in rural areas In public hearing it was brought to the notice of the Commission that an acute shortage of operational staff exists in rural areas. We direct the Discoms to examine this issue and initiate appropriate action.
TSSPDCL is taking all the steps including arranging sufficient staff for ensuring effective service. From time to time, the existing vacancies in the initial recruitment cadre such as Jr. Linemen, Jr. Asst., Sub-Engineer, JAO, AEs, etc. are being filled by Direct recruitment. In the month of February-16, 128 number of AEs were appointed. The recruitment of the 153 Sub-Engineers is underway and the same will be concluded in the month of December-16. Further it is decide to issue Notifications shortly for filling-up of 852 posts of Jr. Linemen, 249 posts of Jr. Assts. In view of the workload norms, 3494 additional posts in various cadres are proposed for sanction and awaiting approval of the Government. However as a stop gap arrangement, sanctions are

TSSPDCL ARR for FY2017-18 Retail Supply Business
18
Directive No.
Directive Compliance Report
being given for engaging personnel on outsourcing basis wherever necessary.
17 Open Access In public hearing it was brought to the notice of the Commission that the applications of consumers who intend to go for open access are being delayed without any valid reasons. We direct the Discoms to dispose of all the applications seeking open access within ten (10) days from the date of receipt of the application.
Enclosed in Annexure-I
18 Filing of Multi Year Tariffs and True ups by TSTRANSCO The TS Transco has mentioned that the assets and liabilities of erstwhile AP Transco have not yet been bifurcated between AP and TS Transco. The TS Transco has, hence, stated that it will file the ARR and tariff for the balance of the third control period during the year 2016-17 along with True up for the second control period vide its letter No. CE/Plg.,Cooml.&Coordn./DE/RAC/F.ARR(FY16-17)/D.No.68/15 dates 24
th
November, 2015. The TS Transco is directed to file the ARR and tariff proposals for the balance period of third control period along with filing of true ups for first and second control period before the end of November 2016 without fail.
Not Pertains to DISCOM
19 Filing of Tariff of TSGENCO stations for third control period and PPAs for consent The TSDISCOMs/TSGENCO is directed to file the tariff proposals, station wise for the third control period (FY 2014-15 to FY 2018-19) along with capital cost of new stations which have not been determined by the erstwhile APERC, by end of October 2016. The TSGENCO is also directed to file the station wise PPAs of its stations for Commission‟s approval.
The directive has been communicated to TSGENCO for compliance videLr. No. CGM(Comml)/SE(IPC-II)/DE(RAC)/F.No.C/ 24 / D.No.1297/16, Dated 22-07-2016.
20 Cost of Supply of HT V(B)-HMR Railway Traction Category The Commission directs TSSPDCL to study the consumption pattern for the portion of energy likely to be consumed for the commercial operation (after commencement) of HMR Metro Railways out of the total energy to be consumed during the year FY 2016-17
The Category CoS for HMR Metro Railways will be proposed after the commencement of commercial operation of HMR.

TSSPDCL ARR for FY2017-18 Retail Supply Business
19
Directive No.
Directive Compliance Report
and propose the Category CoS for the subsequent year so as to examine the same.
21 Non availability of toll free number, developing the IVRS system for registering the consumer complaints such as fuse off Calls, billing issues, etc. During public hearing it was stated by the stakeholders that at many times the toll free number is not reachable or some of them stated that they are not aware of the number. In this regard, the Licensees are directed to widely publicize the toll free number and ensure its operation 24x7. The Licensees should also ensure sufficient lines for the toll free service are available to avoid congestion in communication. The DISCOMs shall ensure that the registered complaint, as per the existing practice, on Fuse off Calls, repair/ replacement of agricultural DTRs and they shall be resolved within the stipulated time as per SoP norms. In the meanwhile the Licensee shall develop a software to register complaint through IVRS system equipped to issue a docket number (i.e. complaint number) along with date and time of registration and send through SMS on registered mobile number. The Complaints once resolved should again be communicated to the consumer through SMS on the registered mobile number by the concerned authority. The SMS after complaint resolution should capture details on time taken to resolve the complaint, hence enabling the consumer to claim compensation as per Standard of Performance (SoP) regulations, in case of delay in compliance.
The Linemen/Line Inspectors are provided with cell phones. The phone numbers of field staff are displayed at Grampanchayath notice boards. The farmers are being cautioned not to meddle with the DTR‟s and electrical lines and they were requested to call concerned field staff for attending the fuse of calls of Agl. DTRs. The mobile app is developed to address to the consumer grievance and implemented in GHMC area on pilot basis which will be rolled out to entire TSSPDCL area. The Integrated Electricity Complaint Handling Cell is developed & being tested as pilot project in GHMC. Toll free no. 18004253600 is available for the purpose of farmers.
22 Reduction of interruptions in GHMC area It has been noticed by the Commission that 11/33 kV lines as well as overhead lines are damaged due to heavy winds and rain causing interruptions in power supply for a large section of GHMC area. Some such outages have continued for more than 24 hours in some parts of the city. The Discoms are directed to prepare a plan for replacing the overhead lines with the underground cable system of
TSSPDCL has identified Banjara hills
subdivision as a pilot area for evaluating the techno-commercial feasibility for converting existing Over Head (OH) network to Under Ground (UG) networks. Field Survey has been initiated and estimates are being prepared for converting the entire network from 33kV level to 11kV level and LT network to UG cabling. Sufficient redundancy at each level and leading technological tools for fault identification and power restoration like FPI‟s, DMS, etc. will be considered as part of estimates to

TSSPDCL ARR for FY2017-18 Retail Supply Business
20
Directive No.
Directive Compliance Report
appropriate voltage level in a phased manner and submit the proposal for the consolidation of the Commission for investment approval.
ensure highest levels of reliability for the consumer. In this regard the Commission is
requested to allow the DISCOM to recover the costs for this project through the ARR.
C. Other Directives
23 Consumers entitled for a refund of Rs. 2,081.81 crore towards the excess power purchase cost claimed by the Discoms over the 2nd Control Period (FY2009-14) The TSGENCO and TSDICOMs are directed to ascertain the exact amount to be paid or recovered by themselves for their respective shares and incorporate the same in subsequent year filing, if any. (Pg:18,para:2.6 of Tariff Order)
DISCOMS are required to pay the cost of power purchase to APGENCO as per Tariff Order issued by APERC. APGENCO has filed Tariff Petition for the control period 2009-14 in OP. No. 15 of 2009. The APERC has issued its Final Orders on the above petition on 31.05.2014 after competition of the control period. Pending APERC orders on tariff petition the cost of power purchase was made provisionally to APGENCO on year to year basis as per the provisions made in Distribution Tariff Order towards Fixed Cost and Variable Cost, for the existing projects and also supplementary claims the cost of power purchase was paid. The total amount paid by APPCC/DISCOMs was recognized in books by APGENCO towards fixed cost, variable cost and supplementary claims.
The commission has given provisional tariff in its tariff order to all stations of APGENCO. However, APPCC while paying the energy charges has considered the actual position of each station and released the payment to the extent APGENCO is eligible to receive. In fact the provisional payments were made considering the actual COD instead of anticipated COD as per orders of the commission. Therefore, the DISCOMs are eligible to receive only Rs. 735.32 Crs instead of Rs.2081.81 Crs and the same was adjusted against the dues payable to APGENCO in FY 2013-14. Hence, there is no excess payment made to APGENCO considering fixed cost, variable cost & supplementary claims as a whole by AP/TSDISCOMs.
24 Renewal of PPA/buyout of GVK Plant The Licensee is directed to furnish the decision that it has taken with the approval from GoTS, i.e. whether to buy or not ,by end of July 2016 so that appropriate action can be taken by the Commission. (Pg:28,para:2.21 of Tariff Order)
As per the directions of TSPCC, TSDISCOMs did not exercise the option for Renewal of PPA/ Buy-Out of M/s. GVK power plant in view of high cost of generation and the Govt. of Telangana has approved the decision of TSPCC vide letter dated 03.08.2015
25 Expiry of PPA The Licensee shall pursue with GoTS for obtaining necessary orders on SPGL and LancoKondapally and furnish the same to the Commission so that appropriate action can be taken. (Pg:29,para:2.22 of Tariff Order)
Initially the Government of Telangana (Energy
Department) was addressed requesting necessary approval for Renewal of PPA with M/s. LANCO. However, after examining High cost of Generation from these gas projects and also the availability of power at cheaper rates in the market, TSPCC in its meeting held on 14.09.2016 has decided not to renew the PPA with IPPs M/s. Spectrum Power Generation Limited (SPGL), as the PPAs had already expired and also that the cost of generation is not viable to TSDISCOMS, for considering the
TSSPDCL ARR for FY2017-18 Retail Supply Business
21
Directive No.
Directive Compliance Report
Renewal of PPA for 15 years. The same was informed to the Principal
Secretary to Govt., Energy Department, Telangana State on 03.10.2016.
26 Non-payment of subsidy by the government The Licensees are directed to furnish the details of subsidy amount received (with date and month). (Pg:35,para:2.30 of Tariff Order)
The information on Tariff Subsidy amount received up to September 2016 for FY 2016-17 from the Government of Telangana are furnished hereunder.
Sl.No
Pertaining
Month
GO RT No
GO Date Date of Receipt
Amount Rs.
In Crores
1 04/2016 35 28/04/2016 30/04/2016 86.11
2 05/2016 37 03/05/2016 31/05/2016 86.11
3 06/2016 45 06/06/2016 29/06/2016 86.11
4 07/2016 53 05/07/2016 02/08/2016 86.11
5 08/2016 65 24/08/2016 08/09/2016 86.11
6 09/2016 72 19/09/2016 13/10/2016 86.11
Grand Total 516.66
27 Reconnection of sick industries /Installation of Prepaid Meters Regarding installation of prepaid meters for HT category service, the Licensees are directed to verify the availability of meters and metering structure duly consulting Central Electricity Authority (CEA). (Pg:63,para:2.75 of Tariff Order)
At present there is no proven technology available for prepaid meters to HT Consumers in the Country. Hence, installation of prepaid meters to HT Consumers may not be possible. However, DISCOMs will consult CEA for latest status of prepaid meters and will be installed on availability.
28 PFA scheme The resource plan sum (21,998 MW) is not in coherence with the total capacity (22,408 MW) projected under the PFA scheme. The Licensee is advised to verify the figures and furnish a correct reply within a month. (Pg:73,para:2.94 of Tariff Order)
Report Submitted to TSERC vide Lr.No.CGM(Comml)/SE(IPC-II)/DE(RAC)/ D.No.1706 Dated:09/09/2016
29 Implementation of DSM The Licensees are directed to inspect the agricultural services which have been released in the earlier years (on the orders of APSEB) under the scheme to regularize unauthorized connections but without erecting poles and hence availing supply through long distance service wires. For all such services, necessary infrastructure shall be created in order to avoid accidents. A report on such infrastructures made has to be submitted to the Commission by end of August, 2016. (Pg:86,para:2.110 of Tariff Order)
The agricultural services having lengthy service wires are identified and 5113 nos. of services are provided with poles during first half of 2016-17.The action taken report is enclosed in Annexure-I.
30 Separate street lighting wires for dedicated control The Licensees are directed to provide separate wire for street lighting while preparing the estimates for street light services. Accordingly the cost has to be
The directive is being complied with. However for the existing lines, a letter was addressed to Principal Secretary, Government of Telangana intimating the amount of Rs. 38.18 Crs against
TSSPDCL ARR for FY2017-18 Retail Supply Business
22
Directive No.
Directive Compliance Report
recovered from the applicant authority as per the provisions of Electricity Act 2003 and regulations made therein by the Commission. (Pg:90,para:2.120 of Tariff Order)
providing of 3rd/5th street light wire to provide separate street lighting wires. Copy of the above was also submitted to Additional Commissioner, Panchayath Raj & Development. The consent is awaited.
31 Basis for extension of time to Solar Power Developers In case of a Commission approved PPA, the Licensees are directed to approach the Commission to amend any clause including extension of time. (Pg:103,para:2.139 of Tariff Order)
TSSPDCL is approaching the Commission for its approval/consent to amend any clause including extension of time, in case of Commission approved Solar Power Developers PPAs.
32 Solar for remote villages The Licensees are directed to take immediate steps to energize the remote habitants like chenchu community/ Thandas, etc. especially in the reserve forest area through decentralized (isolated mode) solar generation by taking necessary approvals. (Pg:105,para:2.144 of Tariff Order)
During the year 2012, a scheme had
formulated for electrification of 10 Nos. habitations under Decentralized Distributed Generation (DDG) for an estimated cost of Rs.273.92 Lakhs. REC has sanctioned Rs.240.64 Lakhs for electrification of 9 habitations in Mahabubnagar and Kurnool Districts under “”DDG under RGGVY” scheme on 21.08.2013. Tenders floated and letter of Acceptance was issued to the successful bidder M/s. Premier Solar Systems Private Limited, Secunderabad for contract price of Rs.3,15,76,932 vide letter dated 01.03.2014.
Out of 9 Nos. habitations, 3 Nos. habitations pertaining to Kurnool District were transferred to APSPDCL due to bifurcation of state.
During the field survey conducted by M/s. Premier Solar Systems Private Limited along with concerned field engineers, 4 Nos. habitations in Mahabubnagar District were not found as the residents have relocated to other places.
The Superintending Engineer/Op/ Mahabubnagar vide letter dated 15.03.2014 has addressed letter to the Principal Chief Conservator of Forest for arranging permission to enter the forest and erection of Solar Photo Voltaic Power Plant along with power distribution network. The Forest Department has not given permission. They have orally informed that the habitations are under the Tiger Reserve Area and any type of works are not allowed. REC vide letter dated 18.08.2015 has cancelled the sanction of 9 Nos. DDG projects in Mahabubnagar and Kurnool Districts.
33 Accidents and Ex-gratia The Licensees are directed to conduct pre-monsoon and periodic inspections of the lines and equipment so that the defects can be noticed and preventive measures can be taken in advance, thus avoiding occurrence of any accidents. The plan of action proposed shall be furnished to the Commission by the end of August, 2016. Licensees are directed to ensure the quality of works as per existing standards so that accidents occurring
The pre-monsoon & periodic inspections of lines and equipment are regularly being conducted by the field officers. Instructions are also issued that defects are to be rectified as and when noticed. The action plan is enclosed in Annexure-I.

TSSPDCL ARR for FY2017-18 Retail Supply Business
23
Directive No.
Directive Compliance Report
on account of lengthy spans of lines, absence of guy insulator to the stay wire, bending of poles, low height plinth for DTRs, etc. can be avoided. (Pg:117,para:2.184 of Tariff Order)
34 Operational Issues The Hon‟ble Commission has directed to take immediate appropriate action as replied during the public hearing and furnish objector wise action taken report by end of July, 2016 on operational issues mentioned from Para 2.145 to 2.166 of the Tariff Order (Pg:106 to 110) .
Action taken report on Operational Issues mentioned from Para 2.145 to Para 2.166 of Tariff Order (Pg 106 to 110) is enclosed in Annexure-I.
35 Agricultural Service Connection Issues The Hon‟ble Commission has directed to take action as replied during the public hearing and furnish objector wise compliance report on agricultural service connection issues mentioned from Para 2.167 to 2.172 of the Tariff Order (Pg:111 to 112).
Action taken report on Agricultural Service Connection Issues mentioned from Para 2.167 to Para 2.172 of Tariff Order (Pg 111 to 112) is enclosed in Annexure-I.
36 Corruption and other Issues
During the public hearing conducted in the areas of both the Licensees, many of the objectors have pointed out the growing corruption and no work (such replacement of transformers, release of new connections etc.) as is being taken up if such bribe is not given. The Commission noted the issue to be reviewed seriously.
The CMDs of both Licensees have replied on this issue stating that the corruption in the system will be curbed. In order to curb corruption and improve the image of the Licensees, the Commission opined that the team size of present vigilance department is not sufficient and hence shall be strengthened and also severe punishments should be imposed on corruptive employees, as per Licensee‟s rules of conduct in force. (Pg:112 to 113, Para:2.173 to 2.175 of Tariff Order)
All the complaints with the allegations of corruption against the employees of TSSPDCL that are received by various authorities viz. Government, CMD/TS Transco, JMD(Vigilance)/TS Transco, CMD/TSSPDCL and CVO/TSSPDCL are thoroughly enquired and action is being initiated against the employees concerned. There is need to increase the strength of Vigilance Teams. If the Vigilance & APTS Police Stations are opened in the newly formed districts, the issue of corruption can be taken care off more effectively.

TSSPDCL ARR for FY2017-18 Retail Supply Business
24
3 SALES FORECAST AND POWER PROCUREMENT PLAN
3.1 Sales Forecast
3.1.1 The projections of Sales for Second Half of FY2016-17 i.e. H2 of FY2016-17 and for
FY2017-18 is made based on the Trend Method. This method is a non-causal model
of demand forecasting which assumes that the underlying factors, which drive the
demand for electricity, are expected to follow the same trend as in the past and
hence the forecast for electricity is also based on the assumption that the past trend
in Consumption of electricity will continue in the future.
The strength of this method, when used with balanced judgment, lies in its ability to
reflect recent changes and therefore is probably best suited for a short-term
projection as used for the ARR/ Tariff filing.
However, the trend-based approach has to be adjusted for judgment on the
characteristics of the specific consumer groups/ categories. For example, while this
method may provide a better estimate of consumption by the domestic and
commercial categories of consumers, it may not be very suitable for the industrial
category because of the high dependence of demand on the end-use and also on the
macroeconomic variables.
Hence, the Licensee has projected category wise sales based on the modified trend
approach. Sales Forecast for the ensuing years has been developed primarily based
on analysis of historical data for the period FY2010-11 to H1 of FY2016-17.
The following inputs have been taken to arrive at sales projections for H2 of FY2016-
17 and FY2017-18.
Actual Sales till September 2016 have been taken.
Category wise CAGR (Compound Annual Growth Rate) trend during the
last 5 years, 4 years, 3 years, 2 years,1 year and growth rate of first half
of FY2016-17 over first half of FY2015-16 have been considered for
projecting sales for second half of the current year FY2016-17 and
ensuing year FY2017-18.
Estimation of Energy requirement for H2 of FY2016-17 and FY2017-18
was made by considering the Upcoming Irrigation projects information
received from Irrigation Department, Metro Rail Loads addition as per the
information received from the Hyderabad Metro Rail Corporation,
Hyderabad and requirement of new traction loads as requested by South
Central Railways.

TSSPDCL ARR for FY2017-18 Retail Supply Business
25
3.1.2 Historical Sales:The actual category wise, voltage wise sales trend from FY2010-11
to H1 of FY2016-17 pertaining to TSSPDCL which have been considered for sales
projections is shown in the below table
Category/Sales (MU) 2010-11 2011-12 2012-13 2013-14 2014-15 2015-16 2016-17H1
LT Category 13496.66 14698.53 14616.26 15399.19 16494.37 17310.54 8997.87
LT-I: Domestic 4,697.42 5,080.73 5,288.99 5517.93 6159.07 7021.44 3807.93
LT-II: Non-Domestic/ Commercial 1,569.83 1,696.89 1,735.72 1783.71 1893.01 2187.51 1152.54
LT-III- Industry 720.30 724.80 690.43 730.38 757.33 802.25 395.93
LT-IV: Cottage Industries 10.01 9.38 9.13 8.67 8.92 9.12 4.81
LT-V: Agricultural 5,886.37 6,553.77 6,229.27 6694.29 6932.86 6517.67 3265.36
LT-VI: Street Lighting & PWS Schemes
565.89 581.78 610.08 612.99 688.48 709.69 337.87
LT-VII: General Purpose 45.05 49.43 50.64 50.48 54.70 61.49 32.49
LT-VIII: Temporary Supply 1.79 1.74 1.99 0.75 - 1.36 0.94
HT Category 10446.01 11069.26 9769.46 10252.25 11583.36 11773.40 5740.64
HT Category at 11 kV 3671.92 3775.85 3479.01 3702.17 4065.83 4434.30 2295.13
HT-I(A): Industry (General) 2,606.01 2,629.82 2,294.15 2489.84 2662.92 2934.05 1487.42
HT-I(B): Ferro Alloy Units - - - - - - -
HT-II: Others 938.04 1,004.62 1,037.65 1042.05 1199.89 1325.20 727.49
HT-III: Airports, Bus Stations and Railway Stations
- - - 4.00 5.31 5.65 2.89
HT-IV(A): Lift Irrigation & Agriculture
43.12 45.40 21.10 27.32 39.08 19.63 5.27
HT-IV(B): CPWS 24.77 26.36 29.80 29.87 43.98 35.76 12.74
HT-VI: Townships & Residential Colonies
54.39 55.99 62.62 69.78 76.00 79.38 43.67
HT-Temporary Supply 5.59 13.65 33.70 39.31 38.66 34.62 15.64
HT Category at 33 kV 4306.46 4595.66 3943.51 4064.28 4634.04 4599.64 2005.50
HT-I(A): Industry (General) 3,730.15 3,893.58 3,259.17 3431.54 3978.24 3955.27 1656.40
HT-I(B): Ferro Alloy Units 186.81 196.02 139.51 75.09 71.53 25.86 -
HT-II: Others 360.52 468.85 497.07 510.52 517.72 555.09 320.28
HT-III Airports, Bus Stations and Railway Stations
- - - - - - -
HT-IV(A): Lift Irrigation & Agriculture
12.01 13.12 15.85 13.23 19.10 18.45 6.39
HT-IV(B): CPWS 1.36 1.69 1.83 1.76 3.86 2.35 0.05
HT-VI: Townships &Residential Colonies
15.61 22.38 30.02 32.14 35.72 39.39 22.38
HT-Temporary Supply - 0.03 0.07 - 7.88 3.23 -
HT Category at 132 kV 2467.62 2697.74 2346.93 2485.80 2883.48 2739.46 1440.01
HT-I(A): Industry (General) 1,826.30 2,013.05 1,767.27 1804.47 2069.01 2001.80 946.26
HT-I(B): Ferro Alloy Units 150.40 141.68 107.16 104.35 135.38 129.67 85.90
HT-II: Others 95.00 96.59 41.85 39.92 47.37 58.52 34.07
HT-III Airports, Bus Stations and Railway Stations
- - 54.55 55.25 57.98 58.34 30.29
HT-IV(A): Lift Irrigation & Agriculture
277.80 304.81 227.03 329.89 406.82 342.89 274.61
HT-IV(B): CPWS - - - - - - -
HT-V(A): Railway Traction 118.12 141.61 149.08 151.93 166.92 148.24 68.87
HT-V(B):HMR - - - - - - --
HT-VI: Townships & Residential Colonies
- - - - - - -
HT-Temporary Supply - - - - - - -
Total 23942.67 25767.79 24385.71 25651.44 28077.72 29083.94 14738.51
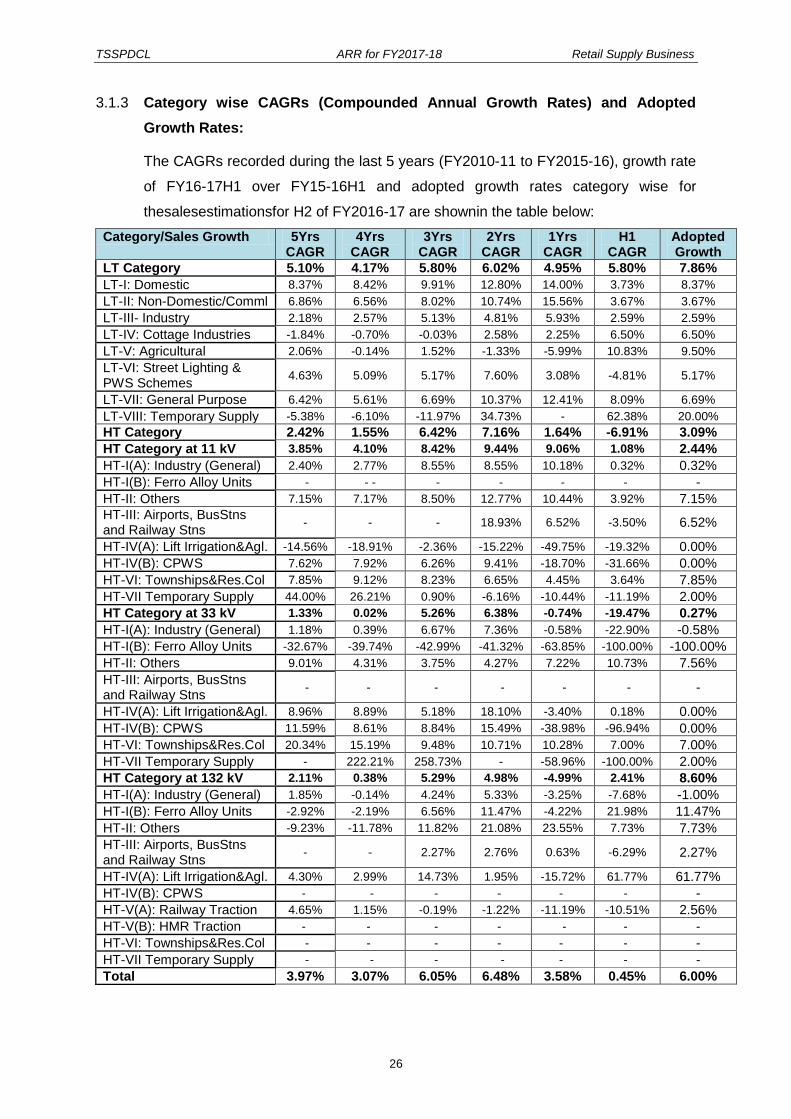
TSSPDCL ARR for FY2017-18 Retail Supply Business
26
3.1.3 Category wise CAGRs (Compounded Annual Growth Rates) and Adopted
Growth Rates:
The CAGRs recorded during the last 5 years (FY2010-11 to FY2015-16), growth rate
of FY16-17H1 over FY15-16H1 and adopted growth rates category wise for
thesalesestimationsfor H2 of FY2016-17 are shownin the table below:
Category/Sales Growth 5Yrs CAGR
4Yrs CAGR
3Yrs CAGR
2Yrs CAGR
1Yrs CAGR
H1 CAGR
Adopted Growth
LT Category 5.10% 4.17% 5.80% 6.02% 4.95% 5.80% 7.86%
LT-I: Domestic 8.37% 8.42% 9.91% 12.80% 14.00% 3.73% 8.37%
LT-II: Non-Domestic/Comml 6.86% 6.56% 8.02% 10.74% 15.56% 3.67% 3.67%
LT-III- Industry 2.18% 2.57% 5.13% 4.81% 5.93% 2.59% 2.59%
LT-IV: Cottage Industries -1.84% -0.70% -0.03% 2.58% 2.25% 6.50% 6.50%
LT-V: Agricultural 2.06% -0.14% 1.52% -1.33% -5.99% 10.83% 9.50%
LT-VI: Street Lighting & PWS Schemes
4.63% 5.09% 5.17% 7.60% 3.08% -4.81% 5.17%
LT-VII: General Purpose 6.42% 5.61% 6.69% 10.37% 12.41% 8.09% 6.69%
LT-VIII: Temporary Supply -5.38% -6.10% -11.97% 34.73% - 62.38% 20.00%
HT Category 2.42% 1.55% 6.42% 7.16% 1.64% -6.91% 3.09%
HT Category at 11 kV 3.85% 4.10% 8.42% 9.44% 9.06% 1.08% 2.44%
HT-I(A): Industry (General) 2.40% 2.77% 8.55% 8.55% 10.18% 0.32% 0.32%
HT-I(B): Ferro Alloy Units - - - - - - - -
HT-II: Others 7.15% 7.17% 8.50% 12.77% 10.44% 3.92% 7.15%
HT-III: Airports, BusStns and Railway Stns
- - - 18.93% 6.52% -3.50% 6.52%
HT-IV(A): Lift Irrigation&Agl. -14.56% -18.91% -2.36% -15.22% -49.75% -19.32% 0.00%
HT-IV(B): CPWS 7.62% 7.92% 6.26% 9.41% -18.70% -31.66% 0.00%
HT-VI: Townships&Res.Col 7.85% 9.12% 8.23% 6.65% 4.45% 3.64% 7.85%
HT-VII Temporary Supply 44.00% 26.21% 0.90% -6.16% -10.44% -11.19% 2.00%
HT Category at 33 kV 1.33% 0.02% 5.26% 6.38% -0.74% -19.47% 0.27%
HT-I(A): Industry (General) 1.18% 0.39% 6.67% 7.36% -0.58% -22.90% -0.58%
HT-I(B): Ferro Alloy Units -32.67% -39.74% -42.99% -41.32% -63.85% -100.00% -100.00%
HT-II: Others 9.01% 4.31% 3.75% 4.27% 7.22% 10.73% 7.56%
HT-III: Airports, BusStns and Railway Stns
- - - - - - -
HT-IV(A): Lift Irrigation&Agl. 8.96% 8.89% 5.18% 18.10% -3.40% 0.18% 0.00%
HT-IV(B): CPWS 11.59% 8.61% 8.84% 15.49% -38.98% -96.94% 0.00%
HT-VI: Townships&Res.Col 20.34% 15.19% 9.48% 10.71% 10.28% 7.00% 7.00%
HT-VII Temporary Supply - 222.21% 258.73% - -58.96% -100.00% 2.00%
HT Category at 132 kV 2.11% 0.38% 5.29% 4.98% -4.99% 2.41% 8.60%
HT-I(A): Industry (General) 1.85% -0.14% 4.24% 5.33% -3.25% -7.68% -1.00%
HT-I(B): Ferro Alloy Units -2.92% -2.19% 6.56% 11.47% -4.22% 21.98% 11.47%
HT-II: Others -9.23% -11.78% 11.82% 21.08% 23.55% 7.73% 7.73%
HT-III: Airports, BusStns and Railway Stns
- - 2.27% 2.76% 0.63% -6.29% 2.27%
HT-IV(A): Lift Irrigation&Agl. 4.30% 2.99% 14.73% 1.95% -15.72% 61.77% 61.77%
HT-IV(B): CPWS - - - - - - -
HT-V(A): Railway Traction 4.65% 1.15% -0.19% -1.22% -11.19% -10.51% 2.56%
HT-V(B): HMR Traction - - - - - - -
HT-VI: Townships&Res.Col - - - - - - -
HT-VII Temporary Supply - - - - - - -
Total 3.97% 3.07% 6.05% 6.48% 3.58% 0.45% 6.00%

TSSPDCL ARR for FY2017-18 Retail Supply Business
27
The CAGRs recorded during the last 5 years (FY2011-12 to FY2016-17) and
adopted growth rates category wise for the sales projections for ensuing year
FY2017-18 are shown in the table below:
Category/Sales Growth 5Yrs CAGR
4Yrs CAGR
3Yrs CAGR
2Yrs CAGR
1Yrs CAGR
Adopted Growth
LT Category 4.70% 6.06% 6.30% 5.89% 6.85% 6.57%
LT-I: Domestic 7.92% 8.90% 10.47% 9.90% 5.95% 7.92%
LT-II: Non-Domestic/Comml 5.97% 6.91% 8.33% 9.45% 3.67% 3.67%
LT-III- Industry 2.58% 4.49% 4.06% 4.25% 2.59% 4.25%
LT-IV: Cottage Industries 0.70% 1.57% 3.87% 4.35% 6.50% 4.35%
LT-V: Agricultural 1.83% 3.60% 2.35% 1.75% 10.12% 6.50%
LT-VI: Street Lighting & PWS Schemes
4.09% 3.90% 5.07% 1.62% 0.18% 5.07%
LT-VII: General Purpose 5.96% 6.86% 9.36% 9.86% 7.37% 6.86%
LT-VIII: Temporary Supply 1.42% -1.50% 35.81% - 38.01% 10.00%
HT Category 0.80% 4.21% 3.96% -0.27% -2.15% 14.00%
HT Category at 11 kV 3.63% 6.71% 6.81% 5.34% 1.75% 5.53%
HT-I(A): Industry (General) 2.28% 6.43% 5.74% 5.14% 0.32% 4.89%
HT-I(B): Ferro Alloy Units - - - - - -
HT-II: Others 6.82% 7.72% 10.27% 7.91% 5.44% 7.15%
HT-III: Airports, BusStns and Railway Stns
- - 12.70% 3.83% 1.21% 6.52%
HT-IV(A): Lift Irrigation&Agl. -16.55% -3.40% -12.39% -31.43% -6.43% 0.00%
HT-IV(B): CPWS 2.52% 0.05% -0.01% -17.61% -16.50% 0.00%
HT-VI: Townships&Res.Col 8.41% 7.57% 6.31% 5.03% 5.62% 5.62%
HT-VII Temporary Supply 19.31% -0.53% -5.68% -7.62% -4.71% 2.00%
HT Category at 33 kV -2.16% 1.10% 0.46% -5.70% -10.42% 18.44%
HT-I(A): Industry (General) -2.37% 1.45% 0.21% -6.84% -12.71% 20.33%
HT-I(B): Ferro Alloy Units -100.00% -100.00% -100.00% -100.00% -100.00% 0.00%
HT-II: Others 5.27% 5.09% 5.89% 8.21% 9.21% 9.05%
HT-III: Airports, BusStns and Railway Stns
- - - - - -
HT-IV(A): Lift Irrigation&Agl. 7.06% 3.88% 11.75% -1.69% 0.06% 0.00%
HT-IV(B): CPWS -12.68% -17.18% -21.34% -52.81% -63.51% 0.00%
HT-VI: Townships&Res.Col 13.50% 8.86% 9.46% 8.63% 7.00% 7.00%
HT-VII Temporary Supply -100.00% -100.00% - -100.00% -100.00% 2.00%
HT Category at 132 kV 1.37% 5.32% 5.13% 0.08% 5.42% 20.90%
HT-I(A): Industry (General) -1.01% 2.00% 1.97% -3.84% -4.42% 15.13%
HT-I(B): Ferro Alloy Units 1.41% 9.12% 13.34% 5.94% 17.18% 9.12%
HT-II: Others -8.18% 10.78% 16.46% 15.37% 7.73% 7.73%
HT-III: Airports, BusStns and Railway Stns
- 1.06% 0.98% -0.93% -2.47% 2.27%
HT-IV(A): Lift Irrigation&Agl. 12.72% 25.02% 18.91% 16.77% 61.77% 49.84%
HT-IV(B): CPWS - - - - - -
HT-V(A): Railway Traction 0.05% -1.21% -2.23% -7.77% -4.22% 3.69%
HT-V(B): HMR Traction - - - - - 200.00%
HT-VI: Townships&Res.Col - - - - - -
HT-VII Temporary Supply - - - - - -
Total 3.10% 5.33% 5.38% 3.39% 3.20% 9.42%
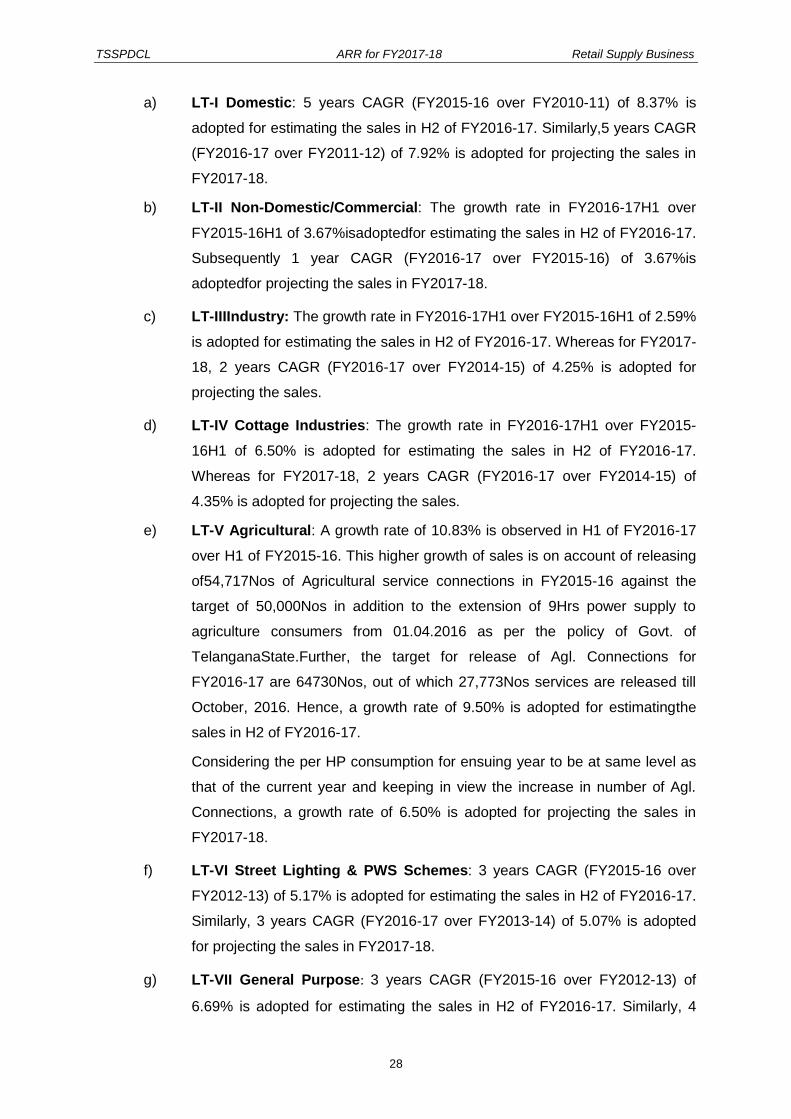
TSSPDCL ARR for FY2017-18 Retail Supply Business
28
a) LT-I Domestic: 5 years CAGR (FY2015-16 over FY2010-11) of 8.37% is
adopted for estimating the sales in H2 of FY2016-17. Similarly,5 years CAGR
(FY2016-17 over FY2011-12) of 7.92% is adopted for projecting the sales in
FY2017-18.
b) LT-II Non-Domestic/Commercial: The growth rate in FY2016-17H1 over
FY2015-16H1 of 3.67%isadoptedfor estimating the sales in H2 of FY2016-17.
Subsequently 1 year CAGR (FY2016-17 over FY2015-16) of 3.67%is
adoptedfor projecting the sales in FY2017-18.
c) LT-IIIIndustry: The growth rate in FY2016-17H1 over FY2015-16H1 of 2.59%
is adopted for estimating the sales in H2 of FY2016-17. Whereas for FY2017-
18, 2 years CAGR (FY2016-17 over FY2014-15) of 4.25% is adopted for
projecting the sales.
d) LT-IV Cottage Industries: The growth rate in FY2016-17H1 over FY2015-
16H1 of 6.50% is adopted for estimating the sales in H2 of FY2016-17.
Whereas for FY2017-18, 2 years CAGR (FY2016-17 over FY2014-15) of
4.35% is adopted for projecting the sales.
e) LT-V Agricultural: A growth rate of 10.83% is observed in H1 of FY2016-17
over H1 of FY2015-16. This higher growth of sales is on account of releasing
of54,717Nos of Agricultural service connections in FY2015-16 against the
target of 50,000Nos in addition to the extension of 9Hrs power supply to
agriculture consumers from 01.04.2016 as per the policy of Govt. of
TelanganaState.Further, the target for release of Agl. Connections for
FY2016-17 are 64730Nos, out of which 27,773Nos services are released till
October, 2016. Hence, a growth rate of 9.50% is adopted for estimatingthe
sales in H2 of FY2016-17.
Considering the per HP consumption for ensuing year to be at same level as
that of the current year and keeping in view the increase in number of Agl.
Connections, a growth rate of 6.50% is adopted for projecting the sales in
FY2017-18.
f) LT-VI Street Lighting & PWS Schemes: 3 years CAGR (FY2015-16 over
FY2012-13) of 5.17% is adopted for estimating the sales in H2 of FY2016-17.
Similarly, 3 years CAGR (FY2016-17 over FY2013-14) of 5.07% is adopted
for projecting the sales in FY2017-18.
g) LT-VII General Purpose: 3 years CAGR (FY2015-16 over FY2012-13) of
6.69% is adopted for estimating the sales in H2 of FY2016-17. Similarly, 4
TSSPDCL ARR for FY2017-18 Retail Supply Business
29
years CAGR (FY2016-17 over FY2012-13) of 6.86% is adopted for projecting
the sales in FY2017-18.
h) LT-VIII Temporary Supply: Keeping in view the growth rate of 62.38% in H1
of FY2016-17 over H1 of FY2015-16, a nominal growth rate of 20.00% is
adopted for estimating the sales in H2 of FY2016-17. Similarly, a growth rate
of 10.00% is adopted for projecting the sales in FY2017-18.
i) HT-I(A) Industry (General):During the year 2015-16 and H1 of 2016-17,
negative & meager growth rates have been recorded at in the Industrial
segment at all the voltage levels, due to moving out ofmore number of
consumers to avail power supply throughOpen access. Hence growth rates of
0.32% (CAGR of 16-17H1 over 15-16H1), -0.58% (1 year CAGR) and -1.00%
respectively for 11kV, 33kV and 132kVvoltage level are adopted for
estimating the sales in H2 of FY2016-17.
The percentage of open access sales over the total Discombilled units for H1
of FY2016-17 is observed as 2.49% at 11kV, 40.66% at 33kV and 30.25% at
132kV voltage level.The Licensee expects a substantial portion of open
access consumers will come back to the Discom. Hence, growth rates of
4.89% (including 5 years CAGR of 2.4%), 20.33% and 15.13% respectively
for 11kV, 33kV and 132kV voltage level are adopted for projecting the sales in
FY2017-18.
j) HT-I(B) Ferro Alloy Units: No sales are recorded in H1 of FY2016-17 at
33kV level and hence no projections are made at this voltage level. Based on
past trend, 2 years CAGR (FY2015-16 over FY2013-14) of 11.47% for 132 kV
is adopted for estimating the sales in H2 of FY2016-17.
Similarly, 4 years CAGR (FY2016-17 over FY2012-13) of 9.12% is adopted
for projecting the sales in FY2017-18.
k) HT-II Others: At 11kV voltage level, 5 years CAGR (FY2015-16 over
FY2010-11) of 7.15% is adopted for estimating the sales in H2 of FY2016-17
and also for projecting the sales in FY2017-18.
At 33kV voltage level, 1 year CAGR (FY2015-16 over FY2014-15) of 7.22% is
adopted for estimating the sales in H2 of FY2016-17 and also for projecting
the sales in FY2017-18. Further, additional sales of 0.9 MU in FY16-17H2
and 11.10MU in FY17-18 has been considered anticipating L&T-Hyderabad
Metro Rail commercial services operations of 2MVA in FY16-17H2 and 4MVA

TSSPDCL ARR for FY2017-18 Retail Supply Business
30
in FY17-18. Hence, growth rate arrived after considering the additional loads
is 7.56% for FY16-17H2 and 9.05% for FY17-18.
At 132kV voltage level, the growth rate in FY2016-17H1 over FY2015-16H1
of 7.73% is adopted for estimating the sales in H2 of FY2016-17.
Subsequently 1 year CAGR (FY2016-17 over FY2015-16) of 7.73% is
adopted for projecting the sales in FY2017-18.
l) HT-III Airports, Bus Stations& Railway Stations:At 11kV voltage level, 1
year CAGR (FY2015-16 over FY2014-15) of 6.52% is adopted for estimating
the sales in H2 of FY2016-17 and also for projecting the sales in FY2017-18.
Similarly at 132kV voltage level, 3 years CAGR (FY2015-16 over FY2012-13)
of 2.27% adopted for estimating the sales in H2 of FY2016-17 and also for
projecting the sales in FY2017-18.
m) HT-IV(A) Lift Irrigation &Agriculture:No growth is considered at 11kV and
33kV voltage levels for H2 of FY2016-17 and FY2017-18. The estimated
sales in FY2016-17 include the actual sales recorded in FY16-17H1 and
FY15-16H2. The same is considered for FY2017-18.
At 132kV voltage level, significant growth rate of 61.77% is recorded in H1 of
FY2016-17 over H1 of FY2015-16 and hence the same growth rate is
adopted for estimating the sales in H2 of FY2016-17. Whereas no growth is
considered for FY2017-18.
Further, additional sales volume of 276.48 MU is considered in FY2017-18 on
account of upcoming LI Scheme, AMRP LLC LIS in Nalgonda District and
180MW load enhancement of Mahatma Gandhi Kalwakurthy LI Scheme in
Mahaboobnagar District. Hence, growth rate arrived after considering the
additional loads is 49.84% for FY2017-18.
The Licensee collected the information regarding upcoming Lift Irrigation
projects and energy requirement details for FY2017-18 from Irrigation
Department. The anticipated additional sales volumes under LI schemes
(considering 90 pumping days per year with 16 hours of operation per day)
are tabulated below:
Projected sales (MU) for upcoming LI schemes in FY2017-18
S.No
Name of the scheme District CMD (MVA)
Voltage Jul’15 Aug’15 Sep’15 Total
1 AMRP LLC LIS Nalgonda 12 220 kV 5.76 5.76 5.76 17.28
3 MahatmagandhiKalwakurthy LI Scheme Stage-I, Stage-II and Stage-III
Mahabubnagar
180 220 kV 86.4 86.4 86.4 259.20
Total 276.48

TSSPDCL ARR for FY2017-18 Retail Supply Business
31
n) HT-IV(B) Composite Water Supply Schemes:No growth is considered at all
voltage levels for H2 of FY2016-17 and FY2017-18. The estimated sales in
FY2016-17 include the actual sales recorded in FY16-17H1 and FY15-16H2.
The same is considered for FY2017-18.
o) HT-V(A)Railway Traction:Based on the earlier trend, a moderated growth
rate of 2.00% is adopted for estimating the sales in H2 of FY2016-17 and also
for projecting the sales in FY2017-18.
In addition to the above, additional sales volume of 0.4MU is considered in H2
of FY2016-17 towards upcoming Krishna Traction Sub-Station of
10MVAcapacityinMahaboobnagar District, expecting its commencement from
December, 2016. Further, additional sales volume of 2.4MU is considered in
FY2017-18 towards upcoming Mattampalli Traction Sub-Station of 10MVA in
Nalgonda District, expecting its commencement from October, 2017. Hence,
growth rate arrived after considering the additional loads is 2.56% for FY16-
17H2 and 3.69% for FY17-18.
p) HT-V(B) HMR: The Licensee collected the information from L&T-Hyderabad
Metro Rail regarding the upcoming Metro Rail Traction loads and Energy
requirement details for H2 of FY2016-17 and FY2017-18. Accordingly, sales
volume of 6.22MU is considered in FY16-17 on account of upcoming 2No.s
HMR Stationsof 6MVA at Uppal&Miyapur. Further, sales volume of 12.44MU
is considered in FY17-18 on account of upcoming 2No.s HMR Stations of
6MVA at Yousufguda& MGBS.
q) HT-VI Townships & Residential Colonies:The recorded past 5 years CAGR
(FY2015-16 over FY2010-11) of 7.85% at 11 kV level and growth rate in
FY16-17H1 over FY15-16H1 of 7.00% at 33 kV level is adopted for estimating
the sales in H2 of FY2016-17.
Similarly, the recorded 1 year CAGR (FY2016-17 over FY2015-16) of 5.62%
at 11 kV level and 1 year CAGR (FY2016-17 over FY2015-16) of 7.00% at
33kVlevel is adopted for projecting the sales inFY2017-18.
r) HT-VII Temporary Supply:A nominal growth rate of 2.00% at 11kV voltage
level and 2.00% at 33 kVvoltagelevel is adopted for estimating the sales in H2
of FY2016-17 and also for projecting the sales in FY2017-18.
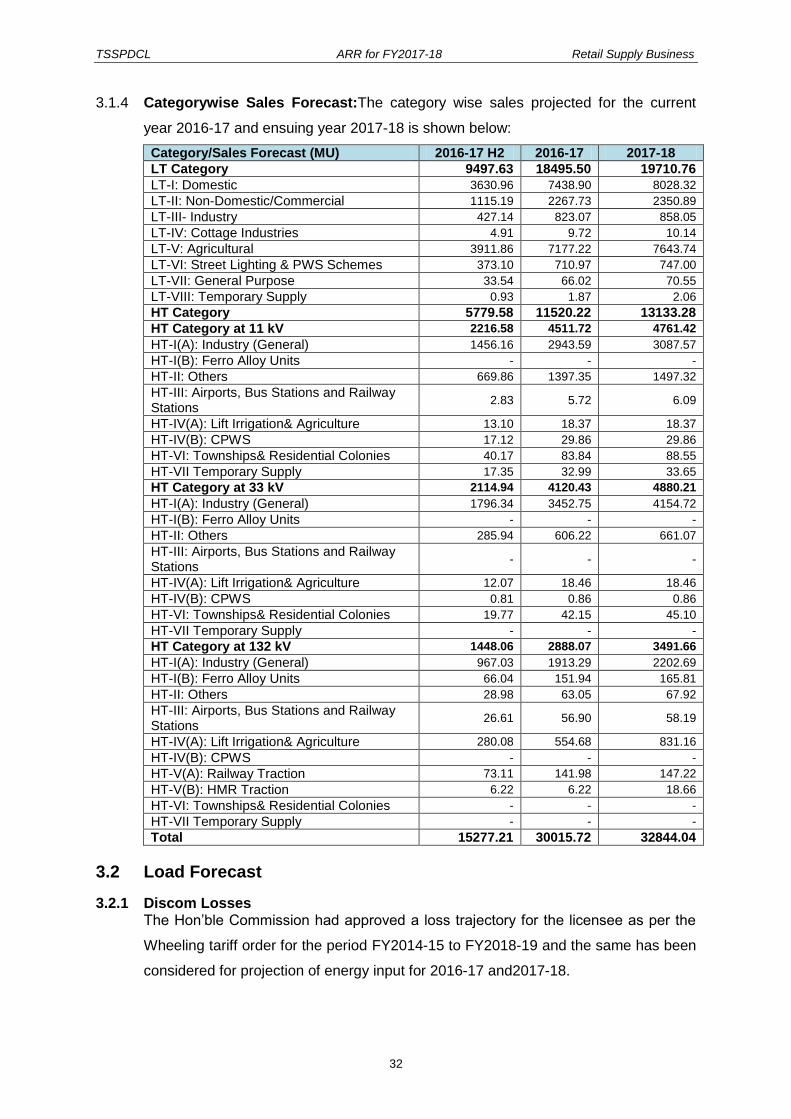
TSSPDCL ARR for FY2017-18 Retail Supply Business
32
3.1.4 Categorywise Sales Forecast:The category wise sales projected for the current
year 2016-17 and ensuing year 2017-18 is shown below:
Category/Sales Forecast (MU) 2016-17 H2 2016-17 2017-18
LT Category 9497.63 18495.50 19710.76
LT-I: Domestic 3630.96 7438.90 8028.32
LT-II: Non-Domestic/Commercial 1115.19 2267.73 2350.89
LT-III- Industry 427.14 823.07 858.05
LT-IV: Cottage Industries 4.91 9.72 10.14
LT-V: Agricultural 3911.86 7177.22 7643.74
LT-VI: Street Lighting & PWS Schemes 373.10 710.97 747.00
LT-VII: General Purpose 33.54 66.02 70.55
LT-VIII: Temporary Supply 0.93 1.87 2.06
HT Category 5779.58 11520.22 13133.28
HT Category at 11 kV 2216.58 4511.72 4761.42
HT-I(A): Industry (General) 1456.16 2943.59 3087.57
HT-I(B): Ferro Alloy Units - - -
HT-II: Others 669.86 1397.35 1497.32
HT-III: Airports, Bus Stations and Railway Stations
2.83 5.72 6.09
HT-IV(A): Lift Irrigation& Agriculture 13.10 18.37 18.37
HT-IV(B): CPWS 17.12 29.86 29.86
HT-VI: Townships& Residential Colonies 40.17 83.84 88.55
HT-VII Temporary Supply 17.35 32.99 33.65
HT Category at 33 kV 2114.94 4120.43 4880.21
HT-I(A): Industry (General) 1796.34 3452.75 4154.72
HT-I(B): Ferro Alloy Units - - -
HT-II: Others 285.94 606.22 661.07
HT-III: Airports, Bus Stations and Railway Stations
- - -
HT-IV(A): Lift Irrigation& Agriculture 12.07 18.46 18.46
HT-IV(B): CPWS 0.81 0.86 0.86
HT-VI: Townships& Residential Colonies 19.77 42.15 45.10
HT-VII Temporary Supply - - -
HT Category at 132 kV 1448.06 2888.07 3491.66
HT-I(A): Industry (General) 967.03 1913.29 2202.69
HT-I(B): Ferro Alloy Units 66.04 151.94 165.81
HT-II: Others 28.98 63.05 67.92
HT-III: Airports, Bus Stations and Railway Stations
26.61 56.90 58.19
HT-IV(A): Lift Irrigation& Agriculture 280.08 554.68 831.16
HT-IV(B): CPWS - - -
HT-V(A): Railway Traction 73.11 141.98 147.22
HT-V(B): HMR Traction 6.22 6.22 18.66
HT-VI: Townships& Residential Colonies - - -
HT-VII Temporary Supply - - -
Total 15277.21 30015.72 32844.04
3.2 Load Forecast
3.2.1 Discom Losses The Hon‟ble Commission had approved a loss trajectory for the licensee as per the
Wheeling tariff order for the period FY2014-15 to FY2018-19 and the same has been
considered for projection of energy input for 2016-17 and2017-18.
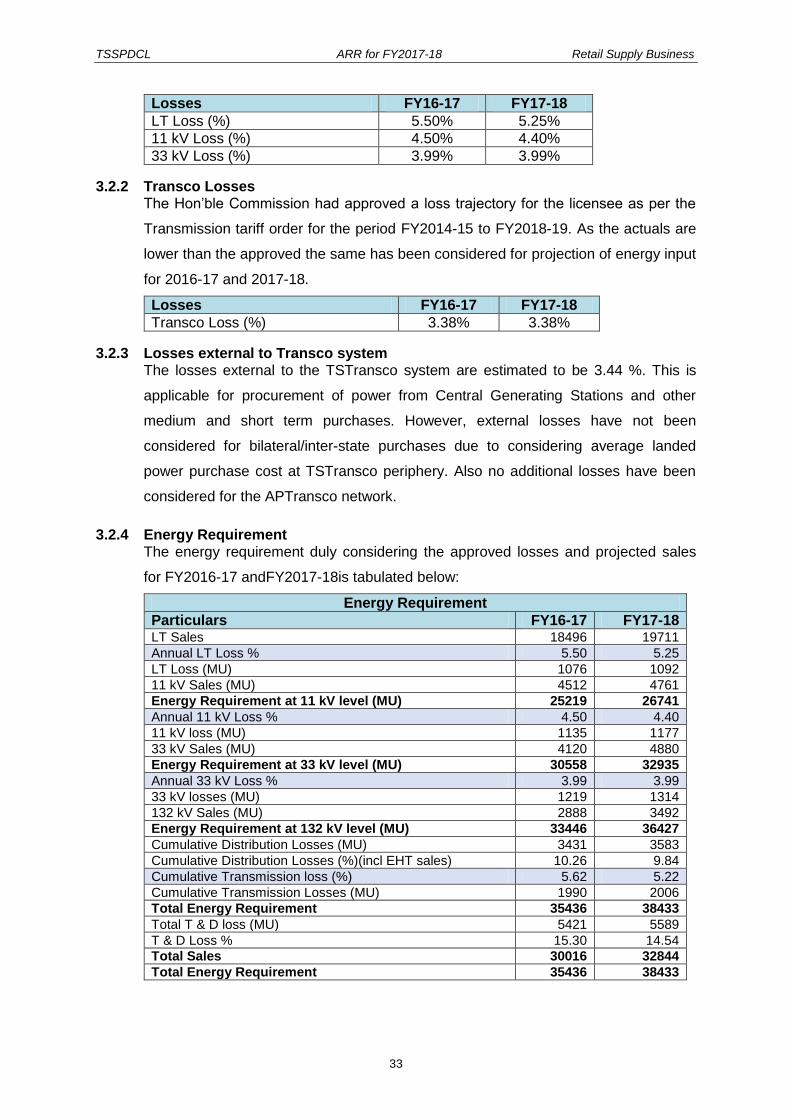
TSSPDCL ARR for FY2017-18 Retail Supply Business
33
Losses FY16-17 FY17-18
LT Loss (%) 5.50% 5.25%
11 kV Loss (%) 4.50% 4.40%
33 kV Loss (%) 3.99% 3.99%
3.2.2 Transco Losses The Hon‟ble Commission had approved a loss trajectory for the licensee as per the
Transmission tariff order for the period FY2014-15 to FY2018-19. As the actuals are
lower than the approved the same has been considered for projection of energy input
for 2016-17 and 2017-18.
Losses FY16-17 FY17-18
Transco Loss (%) 3.38% 3.38%
3.2.3 Losses external to Transco system The losses external to the TSTransco system are estimated to be 3.44 %. This is
applicable for procurement of power from Central Generating Stations and other
medium and short term purchases. However, external losses have not been
considered for bilateral/inter-state purchases due to considering average landed
power purchase cost at TSTransco periphery. Also no additional losses have been
considered for the APTransco network.
3.2.4 Energy Requirement The energy requirement duly considering the approved losses and projected sales
for FY2016-17 andFY2017-18is tabulated below:
Energy Requirement
Particulars FY16-17 FY17-18 LT Sales 18496 19711
Annual LT Loss % 5.50 5.25
LT Loss (MU) 1076 1092
11 kV Sales (MU) 4512 4761
Energy Requirement at 11 kV level (MU) 25219 26741
Annual 11 kV Loss % 4.50 4.40
11 kV loss (MU) 1135 1177
33 kV Sales (MU) 4120 4880
Energy Requirement at 33 kV level (MU) 30558 32935
Annual 33 kV Loss % 3.99 3.99
33 kV losses (MU) 1219 1314
132 kV Sales (MU) 2888 3492
Energy Requirement at 132 kV level (MU) 33446 36427
Cumulative Distribution Losses (MU) 3431 3583
Cumulative Distribution Losses (%)(incl EHT sales) 10.26 9.84
Cumulative Transmission loss (%) 5.62 5.22
Cumulative Transmission Losses (MU) 1990 2006
Total Energy Requirement 35436 38433
Total T & D loss (MU) 5421 5589
T & D Loss % 15.30 14.54
Total Sales 30016 32844
Total Energy Requirement 35436 38433
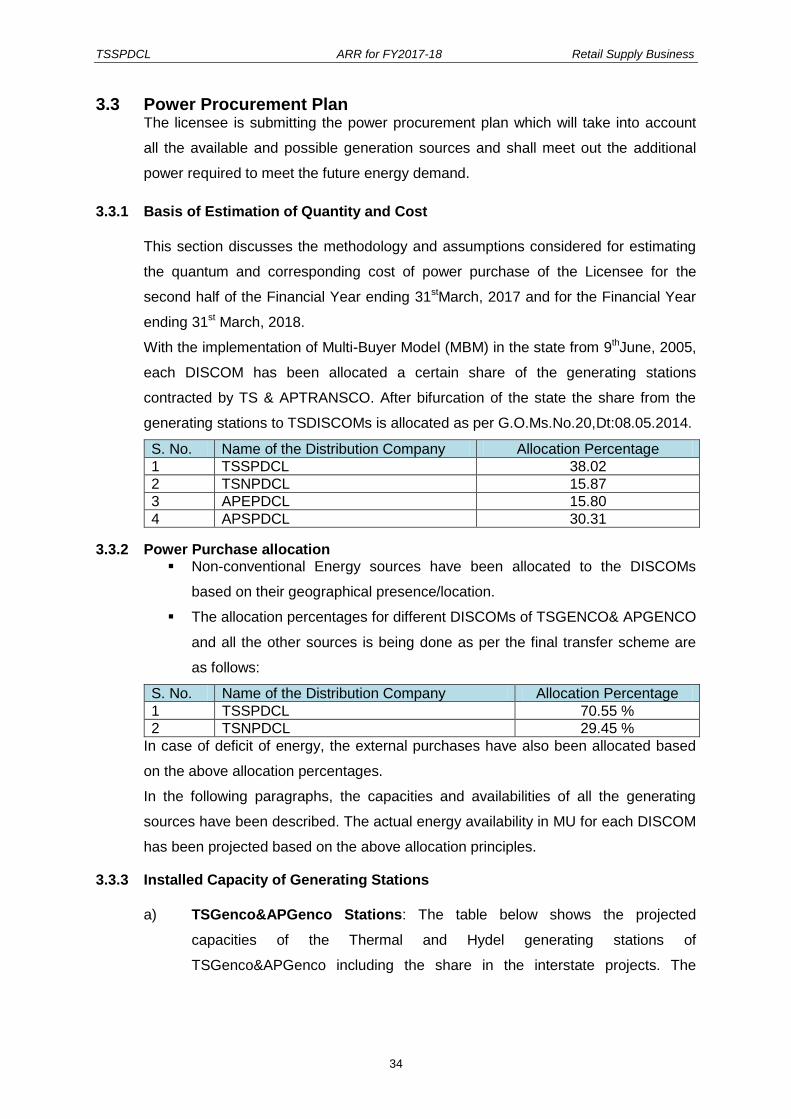
TSSPDCL ARR for FY2017-18 Retail Supply Business
34
3.3 Power Procurement Plan The licensee is submitting the power procurement plan which will take into account
all the available and possible generation sources and shall meet out the additional
power required to meet the future energy demand.
3.3.1 Basis of Estimation of Quantity and Cost
This section discusses the methodology and assumptions considered for estimating
the quantum and corresponding cost of power purchase of the Licensee for the
second half of the Financial Year ending 31stMarch, 2017 and for the Financial Year
ending 31st March, 2018.
With the implementation of Multi-Buyer Model (MBM) in the state from 9thJune, 2005,
each DISCOM has been allocated a certain share of the generating stations
contracted by TS & APTRANSCO. After bifurcation of the state the share from the
generating stations to TSDISCOMs is allocated as per G.O.Ms.No.20,Dt:08.05.2014.
S. No. Name of the Distribution Company Allocation Percentage
1 TSSPDCL 38.02
2 TSNPDCL 15.87
3 APEPDCL 15.80
4 APSPDCL 30.31
3.3.2 Power Purchase allocation Non-conventional Energy sources have been allocated to the DISCOMs
based on their geographical presence/location.
The allocation percentages for different DISCOMs of TSGENCO& APGENCO
and all the other sources is being done as per the final transfer scheme are
as follows:
S. No. Name of the Distribution Company Allocation Percentage
1 TSSPDCL 70.55 %
2 TSNPDCL 29.45 %
In case of deficit of energy, the external purchases have also been allocated based
on the above allocation percentages.
In the following paragraphs, the capacities and availabilities of all the generating
sources have been described. The actual energy availability in MU for each DISCOM
has been projected based on the above allocation principles.
3.3.3 Installed Capacity of Generating Stations
a) TSGenco&APGenco Stations: The table below shows the projected
capacities of the Thermal and Hydel generating stations of
TSGenco&APGenco including the share in the interstate projects. The
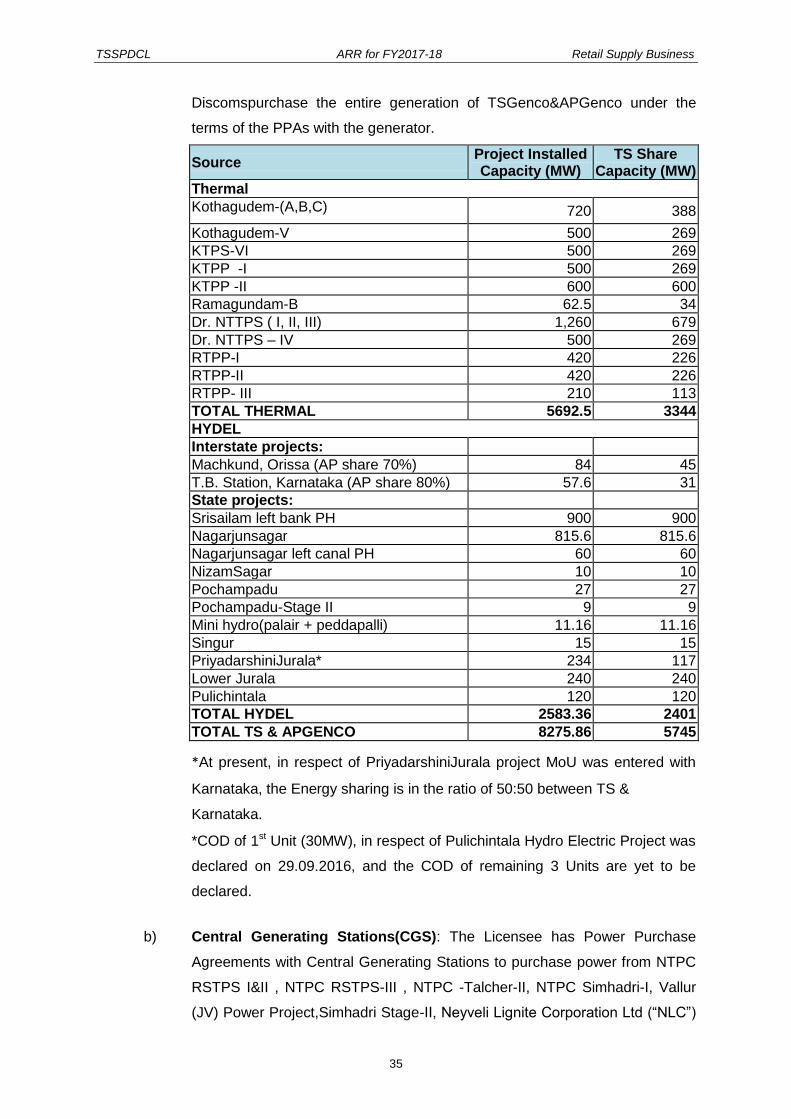
TSSPDCL ARR for FY2017-18 Retail Supply Business
35
Discomspurchase the entire generation of TSGenco&APGenco under the
terms of the PPAs with the generator.
Source Project Installed Capacity (MW)
TS Share Capacity (MW)
Thermal
Kothagudem-(A,B,C) 720 388
Kothagudem-V 500 269
KTPS-VI 500 269
KTPP -I 500 269
KTPP -II 600 600
Ramagundam-B 62.5 34
Dr. NTTPS ( I, II, III) 1,260 679
Dr. NTTPS – IV 500 269
RTPP-I 420 226
RTPP-II 420 226
RTPP- III 210 113
TOTAL THERMAL 5692.5 3344
HYDEL
Interstate projects:
Machkund, Orissa (AP share 70%) 84 45
T.B. Station, Karnataka (AP share 80%) 57.6 31
State projects:
Srisailam left bank PH 900 900
Nagarjunsagar 815.6 815.6
Nagarjunsagar left canal PH 60 60
NizamSagar 10 10
Pochampadu 27 27
Pochampadu-Stage II 9 9
Mini hydro(palair + peddapalli) 11.16 11.16
Singur 15 15
PriyadarshiniJurala* 234 117
Lower Jurala 240 240
Pulichintala 120 120
TOTAL HYDEL 2583.36 2401
TOTAL TS & APGENCO 8275.86 5745
*At present, in respect of PriyadarshiniJurala project MoU was entered with
Karnataka, the Energy sharing is in the ratio of 50:50 between TS &
Karnataka.
*COD of 1st Unit (30MW), in respect of Pulichintala Hydro Electric Project was
declared on 29.09.2016, and the COD of remaining 3 Units are yet to be
declared.
b) Central Generating Stations(CGS): The Licensee has Power Purchase
Agreements with Central Generating Stations to purchase power from NTPC
RSTPS I&II , NTPC RSTPS-III , NTPC -Talcher-II, NTPC Simhadri-I, Vallur
(JV) Power Project,Simhadri Stage-II, Neyveli Lignite Corporation Ltd (“NLC”)

TSSPDCL ARR for FY2017-18 Retail Supply Business
36
NLC TPS-II Stage-I and Stage-II, NTPL NLC Tamilnadu power
limited(Tuticorn), Madras Atomic Power Station (“MAPS”) and Kaiga Atomic
Power Station (“KAPS”). The share of the DISCOMs in the total capacity of
the stations is provided below for FY 2017-18. The percentage allocations
are the tentative weighted average allocations as per SRPC letter dt
14.09.2016.
Name of the Station Capacity TS Share
MW MW %
NTPC-(SR) Ramagundam I & II 2100 357.84 17.04
NTPC-(SR) STAGE – Ramagundam- III 500 89.70 17.94
NTPC-TALCHER-II 2000 226 11.3
NLC TS II STAGE-I 630 58.84 9.34
NLC TS II STAGE-II 840 105.67 12.58
MAPS 440 22.44 5.10
KAIGA 1 & 2 440 69.17 15.72
KAIGA 3 & 4 440 73.48 16.70
NTPC Simhadri Stage-II 1000 247.60 24.76
Vallur (JV) NTPC with TANGEDCO * 1500 108.60 7.24
NTPL (JV) NLC with TANGEDCO 1000 150.10 15.01
Bundled Power under JVNSM from NTPC
85 MW from CGS coal portion (NTPC)
45.81 53.89
TOTAL 10975 1555.25 14.17
NTPC- Simhadri stage-I 1000 538.9 53.89
GRAND-TOTAL (CGS) 11975 2094.15 17.49
2400MW(3x800MW) Thermal Power Project is being setting up by M/s NTPC
Ltd at Kudigi, Karnataka. The then TSDISCOMs have signed a PPA with
NTPC on 23.09.2010.9.75% of power (234 MW) from the said Power Project
was allocated by MoP,GoI to TSDISCOMs. As informed by NTPC, the
scheduled COD of 1st unit(800MW) in Jan, 2017, scheduled COD of 2nd
unit(800MW) in Aug,2017 and the scheduled COD of 3rd unit(800MW) in
Jan,2018.
c) Independent Power Producers (IPPs):As per the GoI scheme for utilization
of stranded gas based power generation capacity, it was envisaged to supply
imported spot RLNG “e-bid RLNG” to the stranded gas based plants receiving
domestic gas upto target PLF of 30% selected through a reverse e-bidding
process. The Commission approved energy availability for FY 2016-17 was
128 MU from old gas based IPPs – Spectrum and Reliance BSES and 1947
MU from new IPPs. However till date the gas based generation has been
minimal and TS Discoms have received 39 MU from GVK Extension in H1 of
2016-17. As there is no proposal from GoI for extension of the above scheme
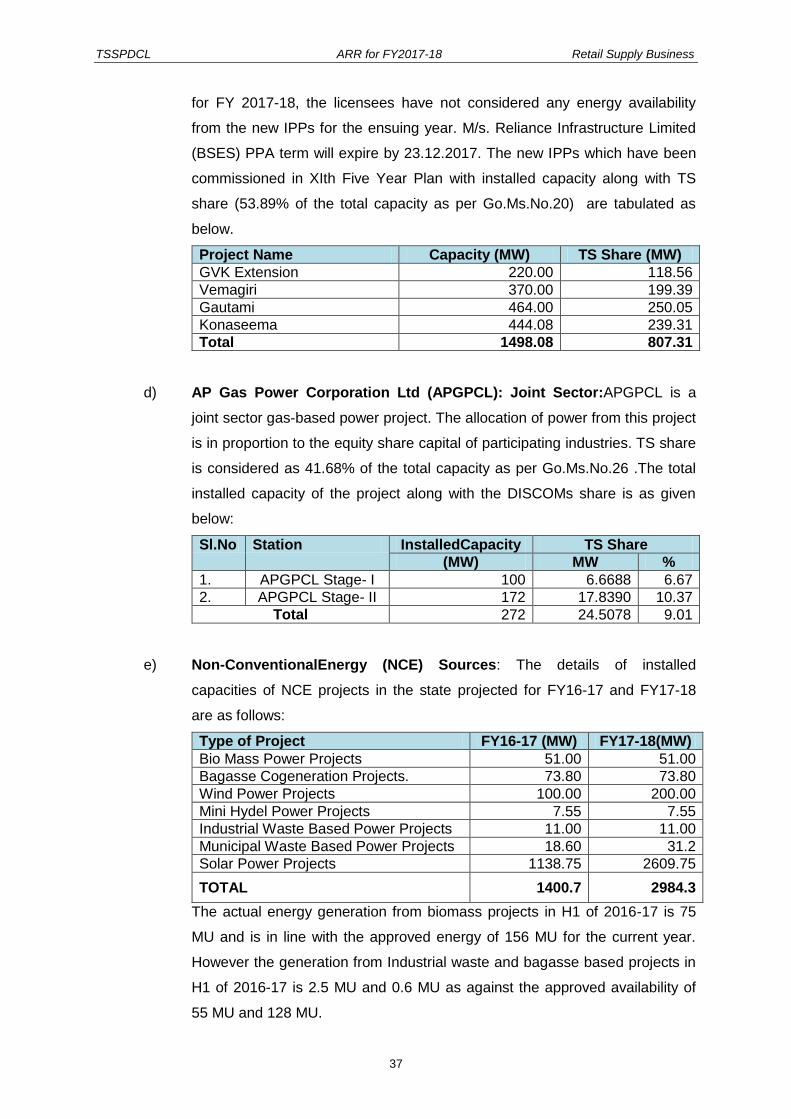
TSSPDCL ARR for FY2017-18 Retail Supply Business
37
for FY 2017-18, the licensees have not considered any energy availability
from the new IPPs for the ensuing year. M/s. Reliance Infrastructure Limited
(BSES) PPA term will expire by 23.12.2017. The new IPPs which have been
commissioned in XIth Five Year Plan with installed capacity along with TS
share (53.89% of the total capacity as per Go.Ms.No.20) are tabulated as
below.
Project Name Capacity (MW) TS Share (MW)
GVK Extension 220.00 118.56
Vemagiri 370.00 199.39
Gautami 464.00 250.05
Konaseema 444.08 239.31
Total 1498.08 807.31
d) AP Gas Power Corporation Ltd (APGPCL): Joint Sector:APGPCL is a
joint sector gas-based power project. The allocation of power from this project
is in proportion to the equity share capital of participating industries. TS share
is considered as 41.68% of the total capacity as per Go.Ms.No.26 .The total
installed capacity of the project along with the DISCOMs share is as given
below:
Sl.No Station InstalledCapacity TS Share
(MW) MW %
1. APGPCL Stage- I 100 6.6688 6.67
2. APGPCL Stage- II 172 17.8390 10.37
Total 272 24.5078 9.01
e) Non-ConventionalEnergy (NCE) Sources: The details of installed
capacities of NCE projects in the state projected for FY16-17 and FY17-18
are as follows:
Type of Project FY16-17 (MW) FY17-18(MW)
Bio Mass Power Projects 51.00 51.00
Bagasse Cogeneration Projects. 73.80 73.80
Wind Power Projects 100.00 200.00
Mini Hydel Power Projects 7.55 7.55
Industrial Waste Based Power Projects 11.00 11.00
Municipal Waste Based Power Projects 18.60 31.2
Solar Power Projects 1138.75 2609.75
TOTAL 1400.7 2984.3
The actual energy generation from biomass projects in H1 of 2016-17 is 75
MU and is in line with the approved energy of 156 MU for the current year.
However the generation from Industrial waste and bagasse based projects in
H1 of 2016-17 is 2.5 MU and 0.6 MU as against the approved availability of
55 MU and 128 MU.

TSSPDCL ARR for FY2017-18 Retail Supply Business
38
In view of the above, the licensee has considered a minimal generation of
7.77 MU from bagasse and industrial waste projects. However as the Hon‟ble
Commission has fixed the tariff for generation of power from MSW and RDF
projects, it expected that this will give impetus to waste to energy generation.
The licensee has projected an availability of 126 MU in the ensuing year from
MSW projects.
f) Singareni Thermal Power Project: During the united AP state regime the
then 4 APDISCOMs had entered into a PPA with M/s SingareniColleries
Company Limited (SCCL) in respect of their 2x600MW Thermal Power
Project-Stage-I at PagadapalliVillage,JaipurMandal, Adialabad Dist. on
29.09.2010. The aforesaid PPA was submitted to the then APERC for its
consent. The then APERC however, returned the said PPA without giving its
consent for the reason that the said PPA did not specify precisely the tariff
payable in terms of its Regulation No.1 of 2008 and directed that the
APDISCOMs &TSDISCOMs may file suitable petitions under section 86(1)(b)
of the Electricity Act 2003.
Consequent to the State bifurcation and formation of Telangana State, the
Govt.ofTelangana sought to work out the revised PPA to be entered by the 2
DISCOMs of Telangana only.
Accordingly, TelanganaDISCOMs have signed fresh PPA with M/s.
SingareniColleries Company Ltd on 18.01.2016 in respect of 2x600MW
Thermal Power Project, Stage-I after legal opinion was obtained from Ld.
Advocate General of Telangana State.
The COD of 1stunit(600MW) was declared on 25.09.2016. The licensee has
considered the COD of the 2nd unit (600 MW) in December 2016.
As per its filing of Capital Cost/Tariff of 1200 MW (2 X 600 MW) project,
SCCL has considered an IDC cost of Rs 407Crs which is substantial. It is the
submission of the licensee that the consumers in the state should not be
saddled with the IDC component which is due to the project execution delays.
Further there is scope of interest cost reduction through negotiations with the
funding agencies. Keeping this in view, the licensee has considered a fixed
cost per unit of Rs 2.15/KWh for FY 2017-18.
As SCCL is a pit head station, there is a good scope of decreasing the transit
losses in coal. The licensee has considered a variable cost per unit of
Rs.1.80/KWh for FY 2017-18.

TSSPDCL ARR for FY2017-18 Retail Supply Business
39
g) Long Term Purchases: The licensees have signed a Power Purchase
Agreement with M/s. Thermal Power Tech Corporation India Limited (TPCIL)
for a contracted capacity of 500 MW under long term basis through Case-I
bidding route for a period of 25 years. Consequent to bifurcation of the state
TSDISCOMs will have 53.89% of share i.e 269.45MW. TPCIL is supplying the
above power from 20.04.2015 and the energy availability projected from this
plant is 1000.41 MU for FY 2016-17 (H2 Projection) and 2006.32 MU for FY
2017-18. The licensee has considered a total cost per unit of Rs 3.79/unit for
power from TPCIL (Unit -1)
Also the licensees have followed the competitive bidding mechanism and have
signed a Power Purchase Agreement with M/s. Thermal Powertech
Corporation India Limited (TPCIL) for a contracted capacity of 570 MW under
long term DBFOO basis for a period of 8 years. TPCIL is supplying the above
power from 30.03.2016 and the energy availability from this plant is projected
at 3968 MU for FY 2017-18.
The licensees have considered the costs as per the prices quoted by the
bidders in the Long term bidding process.
h) Bilateral/Inter-State purchases: The licensee has not proposed any
additional purchase of power through bilateral/ inter-state purchases for the
FY 2017-18. However licensee may opt for procurement of power during
specific days/ month depending on demand to ensure the stability of the grid
and also to ensure uninterrupted power supply to all categories of consumers
in the State.
3.3.4 Energy Availability
a) TSGenco&APGenco– Thermal Energy: The Energy availability for H2 of
FY16 has been projected based on the actual performance of Plants up to
Sep 2016 and projected performance estimated by TS &APGENCO from
October 2016 to March 2017. For FY17, the energy availability has been
projected based on the projected performance estimated by TS & APGENCO
and maintenance schedules of the plants.
The average variable cost per unit for 1st half of FY 2016-17 is considered for
H2 of FY 2016-17. For FY 2017-18 the variable cost considered is lower of
the cost provided by the generator or actual cost in H1 escalated by 2%,
which is lower.
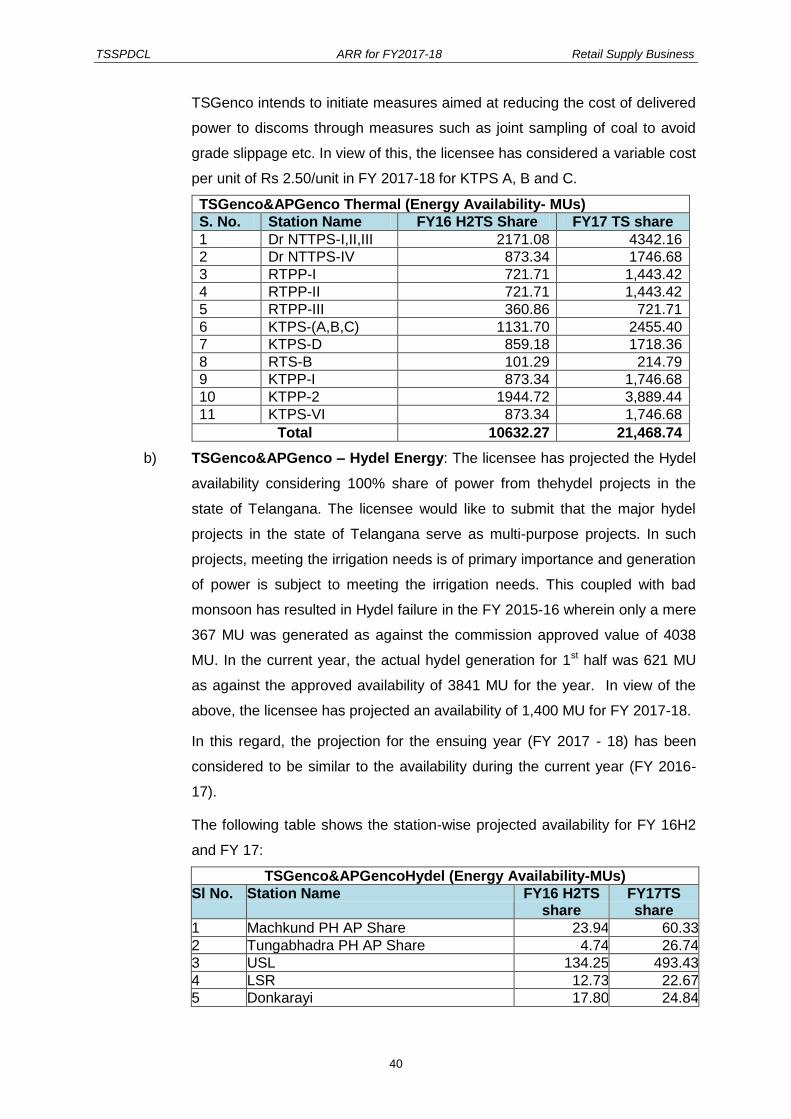
TSSPDCL ARR for FY2017-18 Retail Supply Business
40
TSGenco intends to initiate measures aimed at reducing the cost of delivered
power to discoms through measures such as joint sampling of coal to avoid
grade slippage etc. In view of this, the licensee has considered a variable cost
per unit of Rs 2.50/unit in FY 2017-18 for KTPS A, B and C.
TSGenco&APGenco Thermal (Energy Availability- MUs)
S. No. Station Name FY16 H2TS Share FY17 TS share
1 Dr NTTPS-I,II,III 2171.08 4342.16
2 Dr NTTPS-IV 873.34 1746.68
3 RTPP-I 721.71 1,443.42
4 RTPP-II 721.71 1,443.42
5 RTPP-III 360.86 721.71
6 KTPS-(A,B,C) 1131.70 2455.40
7 KTPS-D 859.18 1718.36
8 RTS-B 101.29 214.79
9 KTPP-I 873.34 1,746.68
10 KTPP-2 1944.72 3,889.44
11 KTPS-VI 873.34 1,746.68
Total 10632.27 21,468.74
b) TSGenco&APGenco – Hydel Energy: The licensee has projected the Hydel
availability considering 100% share of power from thehydel projects in the
state of Telangana. The licensee would like to submit that the major hydel
projects in the state of Telangana serve as multi-purpose projects. In such
projects, meeting the irrigation needs is of primary importance and generation
of power is subject to meeting the irrigation needs. This coupled with bad
monsoon has resulted in Hydel failure in the FY 2015-16 wherein only a mere
367 MU was generated as against the commission approved value of 4038
MU. In the current year, the actual hydel generation for 1st half was 621 MU
as against the approved availability of 3841 MU for the year. In view of the
above, the licensee has projected an availability of 1,400 MU for FY 2017-18.
In this regard, the projection for the ensuing year (FY 2017 - 18) has been
considered to be similar to the availability during the current year (FY 2016-
17).
The following table shows the station-wise projected availability for FY 16H2
and FY 17:
TSGenco&APGencoHydel (Energy Availability-MUs)
Sl No. Station Name FY16 H2TS share
FY17TS share
1 Machkund PH AP Share 23.94 60.33
2 Tungabhadra PH AP Share 4.74 26.74
3 USL 134.25 493.43
4 LSR 12.73 22.67
5 Donkarayi 17.80 24.84

TSSPDCL ARR for FY2017-18 Retail Supply Business
41
TSGenco&APGencoHydel (Energy Availability-MUs)
Sl No. Station Name FY16 H2TS share
FY17TS share
6 SSLM (Right Bank) 5.62 8.59
7 NSRCPH 1.44 19.91
8 Mini hydel (Chettipeta) 4.25 8.87
9 PABM 11.90 64.18
10 Nagarjunasagar tail pond dam PH 120.67 472.40
11 NSPH 34.32 46.31
12 NSLCPH 28.32 151.73
Total 400 1400
*At present, in respect of Jurala project, MoU was entered with Karnataka,
the Energy sharing is in the ratio of 50:50 between TS & Karnataka.
**In the Tariff Order FY 2016-17,theHon‟bleCommission has considered total
generation of TSGENCO Hydel stations to the TSDISCOMS only. Based on
this the Energy Availability of TSGENCO Hydel stations are 100% projected
to TSDISCOMS only for FY 2017-18.
c) Central Generating Stations:The energy availability for H2 of FY16-17 has
been projected based on the actual performance up to September 2016 and
projected performance estimated for H2 of FY 16-17. For FY 17-18, the
energy availability has been projected based on the projected performance
estimated by CGS and maintenance schedules of the plants.
The Kudigi Thermal Power Plant has total installed capacity of 2400MW.
9.75% Power i.e., 234 MW from the said Power Project was allocated by
MoP, GoI to TSDISCOMs. As informed by NTPC, the scheduled COD of 1st
unit (800MW) in Jan, 2017, scheduled COD of 2nd unit (800MW) in Aug,2017
and the scheduled COD of 3rd unit (800MW) in Jan,2018.
The total power availability estimate from CGS for FY16- 17 H2 and FY 17-18
is tabulated below:
Central Generating Stations ( Energy Availability - MUs )
Sl. No. Station Name 2016-17 H2 2017-18
1 NTPC- RSTPS I & II 1339.34 2493.15
2 NTPC- RSTPS– III 286.22 629.50
3 NTPC –TALCHER-II 835.07 1586.03
4 NTPC- SIMHADRI Stage-I 1929.80 3801.99
5 NTPC- Simhadri Stage –II (Unit 3 &4)
824.51 1746.84
5 NLC TPS II STAGE- I 135.43 314.01
6 NLC TS II STAGE- II 314.25 579.94
7 NPC-MAPS 63.85 137.65
8 NPC-KAIGA 1 & 2 219.66 460.96
9 NPC- KAIGA 3 & 4 274.55 460.96
10 Vallur (JV) NTPC & TANGEDCO 379.73 754.54
11 NTPL (JV) NLC with TANGEDCO 525.20 1058.97
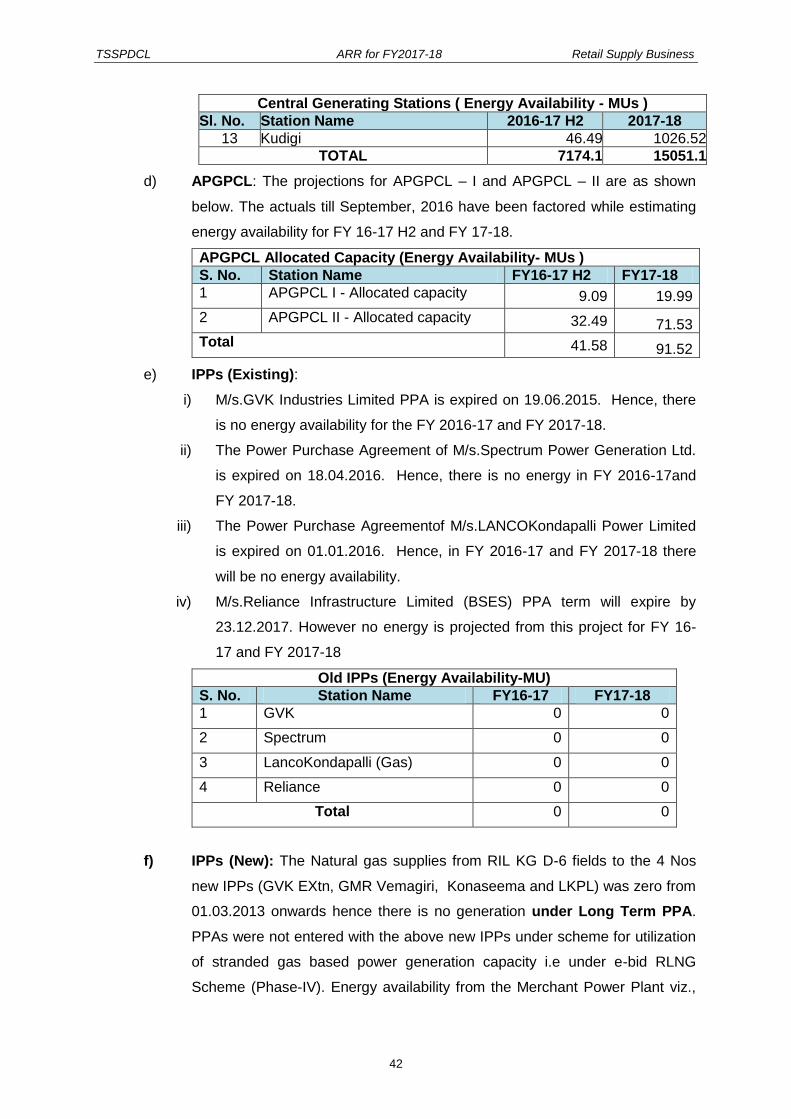
TSSPDCL ARR for FY2017-18 Retail Supply Business
42
Central Generating Stations ( Energy Availability - MUs )
Sl. No. Station Name 2016-17 H2 2017-18
13 Kudigi 46.49 1026.52
TOTAL 7174.1 15051.1
d) APGPCL: The projections for APGPCL – I and APGPCL – II are as shown
below. The actuals till September, 2016 have been factored while estimating
energy availability for FY 16-17 H2 and FY 17-18.
APGPCL Allocated Capacity (Energy Availability- MUs )
S. No. Station Name FY16-17 H2 FY17-18
1 APGPCL I - Allocated capacity 9.09 19.99
2 APGPCL II - Allocated capacity 32.49 71.53
Total 41.58 91.52
e) IPPs (Existing):
i) M/s.GVK Industries Limited PPA is expired on 19.06.2015. Hence, there
is no energy availability for the FY 2016-17 and FY 2017-18.
ii) The Power Purchase Agreement of M/s.Spectrum Power Generation Ltd.
is expired on 18.04.2016. Hence, there is no energy in FY 2016-17and
FY 2017-18.
iii) The Power Purchase Agreementof M/s.LANCOKondapalli Power Limited
is expired on 01.01.2016. Hence, in FY 2016-17 and FY 2017-18 there
will be no energy availability.
iv) M/s.Reliance Infrastructure Limited (BSES) PPA term will expire by
23.12.2017. However no energy is projected from this project for FY 16-
17 and FY 2017-18
Old IPPs (Energy Availability-MU)
S. No. Station Name FY16-17 FY17-18
1 GVK 0 0
2 Spectrum 0 0
3 LancoKondapalli (Gas) 0 0
4 Reliance 0 0
Total 0 0
f) IPPs (New): The Natural gas supplies from RIL KG D-6 fields to the 4 Nos
new IPPs (GVK EXtn, GMR Vemagiri, Konaseema and LKPL) was zero from
01.03.2013 onwards hence there is no generation under Long Term PPA.
PPAs were not entered with the above new IPPs under scheme for utilization
of stranded gas based power generation capacity i.e under e-bid RLNG
Scheme (Phase-IV). Energy availability from the Merchant Power Plant viz.,
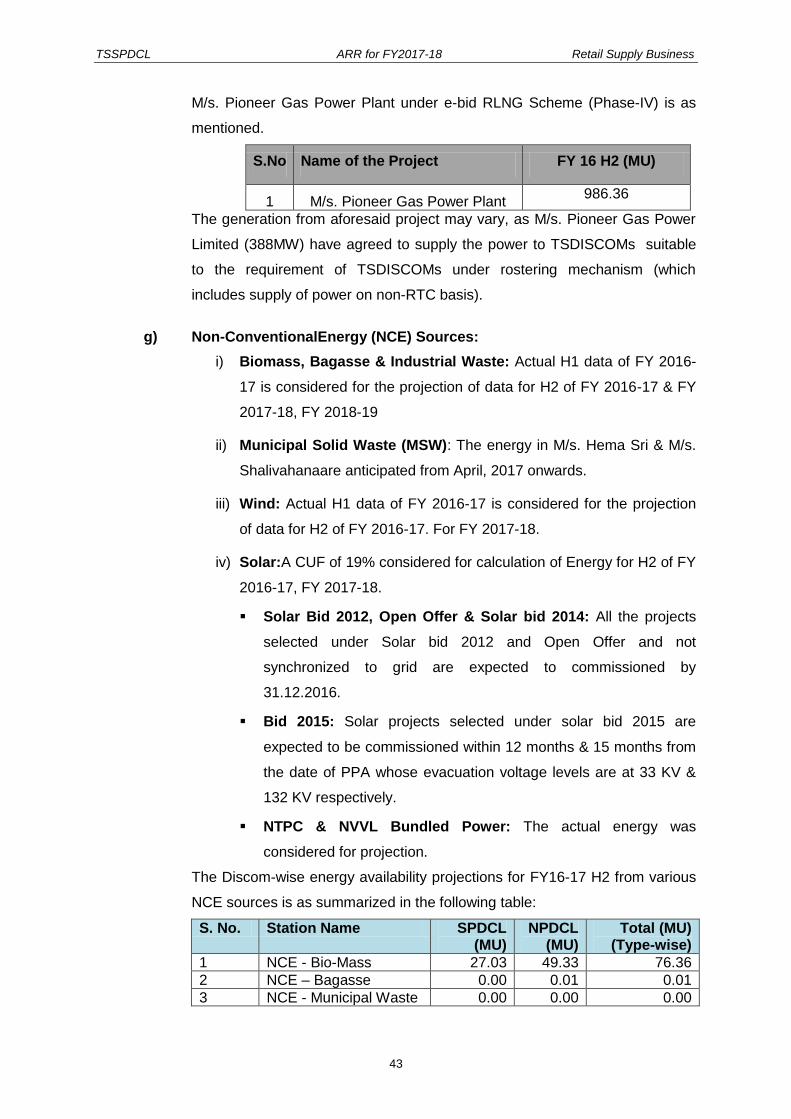
TSSPDCL ARR for FY2017-18 Retail Supply Business
43
M/s. Pioneer Gas Power Plant under e-bid RLNG Scheme (Phase-IV) is as
mentioned.
S.No Name of the Project FY 16 H2 (MU)
1 M/s. Pioneer Gas Power Plant 986.36
The generation from aforesaid project may vary, as M/s. Pioneer Gas Power
Limited (388MW) have agreed to supply the power to TSDISCOMs suitable
to the requirement of TSDISCOMs under rostering mechanism (which
includes supply of power on non-RTC basis).
g) Non-ConventionalEnergy (NCE) Sources:
i) Biomass, Bagasse & Industrial Waste: Actual H1 data of FY 2016-
17 is considered for the projection of data for H2 of FY 2016-17 & FY
2017-18, FY 2018-19
ii) Municipal Solid Waste (MSW): The energy in M/s. Hema Sri & M/s.
Shalivahanaare anticipated from April, 2017 onwards.
iii) Wind: Actual H1 data of FY 2016-17 is considered for the projection
of data for H2 of FY 2016-17. For FY 2017-18.
iv) Solar:A CUF of 19% considered for calculation of Energy for H2 of FY
2016-17, FY 2017-18.
Solar Bid 2012, Open Offer & Solar bid 2014: All the projects
selected under Solar bid 2012 and Open Offer and not
synchronized to grid are expected to commissioned by
31.12.2016.
Bid 2015: Solar projects selected under solar bid 2015 are
expected to be commissioned within 12 months & 15 months from
the date of PPA whose evacuation voltage levels are at 33 KV &
132 KV respectively.
NTPC & NVVL Bundled Power: The actual energy was
considered for projection.
The Discom-wise energy availability projections for FY16-17 H2 from various
NCE sources is as summarized in the following table:
S. No. Station Name SPDCL (MU)
NPDCL (MU)
Total (MU) (Type-wise)
1 NCE - Bio-Mass 27.03 49.33 76.36
2 NCE – Bagasse 0.00 0.01 0.01
3 NCE - Municipal Waste 0.00 0.00 0.00

TSSPDCL ARR for FY2017-18 Retail Supply Business
44
to Energy
4 NCE - Industrial Waste based power project
3.68 0.00 3.68
5 NCE - Wind Power 118.65 0.00 118.65
6 NCE - Mini Hydel 0.00 0.00 0.00
7 NCE - NCL Energy Ltd 0.00 0.00 0.00
8 NCE – Solar Power 524.52 62.51 587.03
Total Availability (Discom-wise) 673.88 111.85 785.73
The Discom-wise energy availability projections for FY2017-18 from various
NCE sources is as mentioned below:
S. No. Station Name TSSPDCL TSNPDCL Total (Type-wise)
1 NCE - Bio-Mass 56.52 95.22 151.74
2 NCE – Bagasse 0.40 1.57 1.97
3 Municipal Waste Energy 64.57 61.50 126.07
4 NCE - Industrial Waste based power project
5.52 0.00 5.52
5 NCE - Wind Power 397.75 0.00 397.75
6 NCE - Mini Hydel 0.00 0.00 0.00
7 NCE - NCL Energy Ltd 0.00 0.00 0.00
8 NCE – Solar Power 2745.87 1397.89 4143.76
Total Availability(Discom-wise) 3270.63 1556.18 4826.81
h) Long Term/Medium Term Purchases: The licensees have signed a Power
Purchase Agreement with M/s. Thermal Power Tech Corporation India
Limited (TPCIL) for a contracted capacity of 500 MW under long term basis
through Case-I bidding route for a period of 25 years. Consequent to
bifurcation of the state TSDISCOMs will have 53.89% of share i.e 269.45MW.
TPCIL is supplying the above power from 20.04.2015 and the energy
availability projected from this plant is 1000.41 MU for FY 2016-17 (H2
Projection) and 1875.913 MU for FY 2017-18.
Also the licensees have signed a Power Purchase Agreement with
M/s. Thermal Powertech Corporation India Limited (TPCIL) for a contracted
capacity of 570 MW under long term DBFOO basis for a period of 8 years.
TPCIL is supplying the above power from 30.03.2016 and the energy
availability from this plant is 2240.78 MU for FY 2016-17 (H2 Projection) and
3968.345 MU for FY 2017-18.
i) Singareni Thermal Power Project: Energy availability of 3179.68 MU and
7778.8MU has been considered from Singareni Thermal Power Plant for H2
of FY 2016-17 and FY 2017-18 respectively. The entire energy available from
Singareni Thermal Power Plant may be considered for TS DISCOMs only

TSSPDCL ARR for FY2017-18 Retail Supply Business
45
j) Summary: A summary of the source wise current estimate of dispatch for
FY2016-17 H2 and FY2017-18 is presented below
Generating Station Net Energy Availability (MU)
FY2016-17 H2 FY2017-18
TS & AP Genco - Thermal 10632.27 21468.8
TS & AP Genco - Hydel 400 1400
CGS 7174.21 15050
NCE 953.91 5163
IPPs 0 0
APGPCL 41.58 92
Singareni 3179.68 7778.9
Thermal Power Tech 2941.43 5844.3
CSPGCL 0 6482.4
Total 25323.08 63279
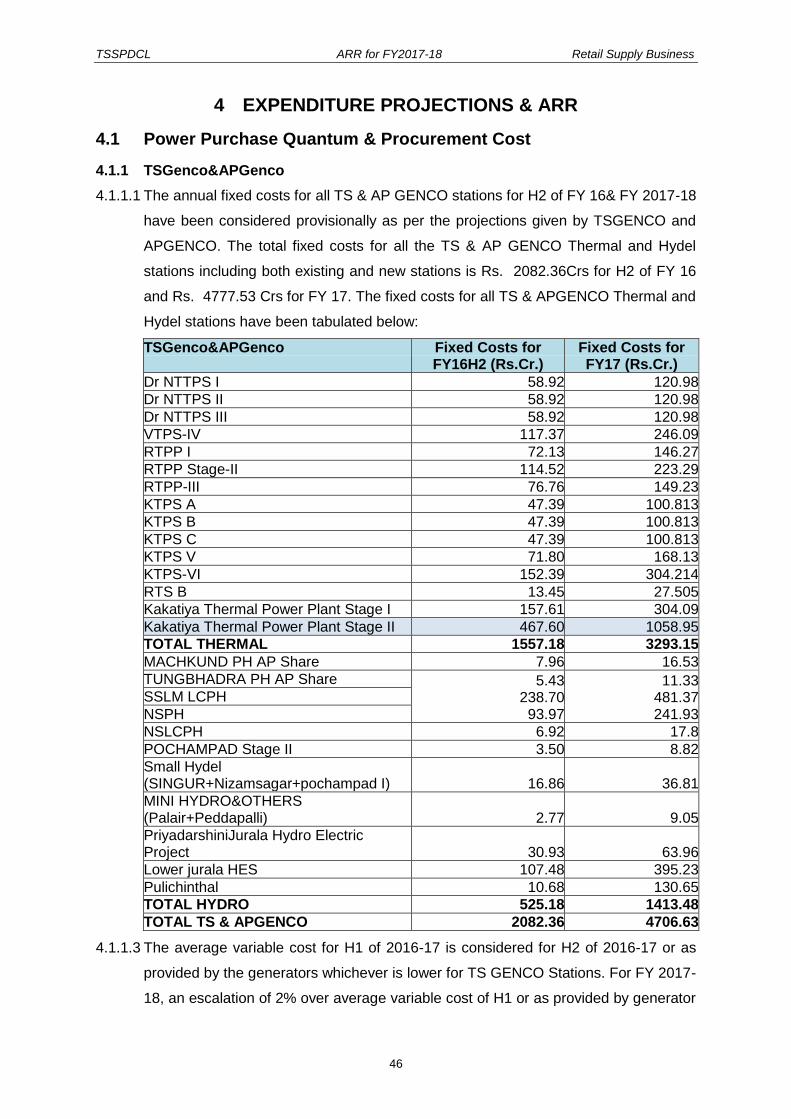
TSSPDCL ARR for FY2017-18 Retail Supply Business
46
4 EXPENDITURE PROJECTIONS & ARR
4.1 Power Purchase Quantum & Procurement Cost
4.1.1 TSGenco&APGenco
4.1.1.1 The annual fixed costs for all TS & AP GENCO stations for H2 of FY 16& FY 2017-18
have been considered provisionally as per the projections given by TSGENCO and
APGENCO. The total fixed costs for all the TS & AP GENCO Thermal and Hydel
stations including both existing and new stations is Rs. 2082.36Crs for H2 of FY 16
and Rs. 4777.53 Crs for FY 17. The fixed costs for all TS & APGENCO Thermal and
Hydel stations have been tabulated below:
TSGenco&APGenco Fixed Costs for FY16H2 (Rs.Cr.)
Fixed Costs for FY17 (Rs.Cr.)
Dr NTTPS I 58.92 120.98
Dr NTTPS II 58.92 120.98
Dr NTTPS III 58.92 120.98
VTPS-IV 117.37 246.09
RTPP I 72.13 146.27
RTPP Stage-II 114.52 223.29
RTPP-III 76.76 149.23
KTPS A 47.39 100.813
KTPS B 47.39 100.813
KTPS C 47.39 100.813
KTPS V 71.80 168.13
KTPS-VI 152.39 304.214
RTS B 13.45 27.505
Kakatiya Thermal Power Plant Stage I 157.61 304.09
Kakatiya Thermal Power Plant Stage II 467.60 1058.95
TOTAL THERMAL 1557.18 3293.15
MACHKUND PH AP Share 7.96 16.53
TUNGBHADRA PH AP Share 5.43 238.70 93.97
11.33 481.37 241.93
SSLM LCPH
NSPH
NSLCPH 6.92 17.8
POCHAMPAD Stage II 3.50 8.82
Small Hydel (SINGUR+Nizamsagar+pochampad I) 16.86 36.81
MINI HYDRO&OTHERS (Palair+Peddapalli) 2.77 9.05
PriyadarshiniJurala Hydro Electric Project 30.93 63.96
Lower jurala HES 107.48 395.23
Pulichinthal 10.68 130.65
TOTAL HYDRO 525.18 1413.48
TOTAL TS & APGENCO 2082.36 4706.63
4.1.1.3 The average variable cost for H1 of 2016-17 is considered for H2 of 2016-17 or as
provided by the generators whichever is lower for TS GENCO Stations. For FY 2017-
18, an escalation of 2% over average variable cost of H1 or as provided by generator
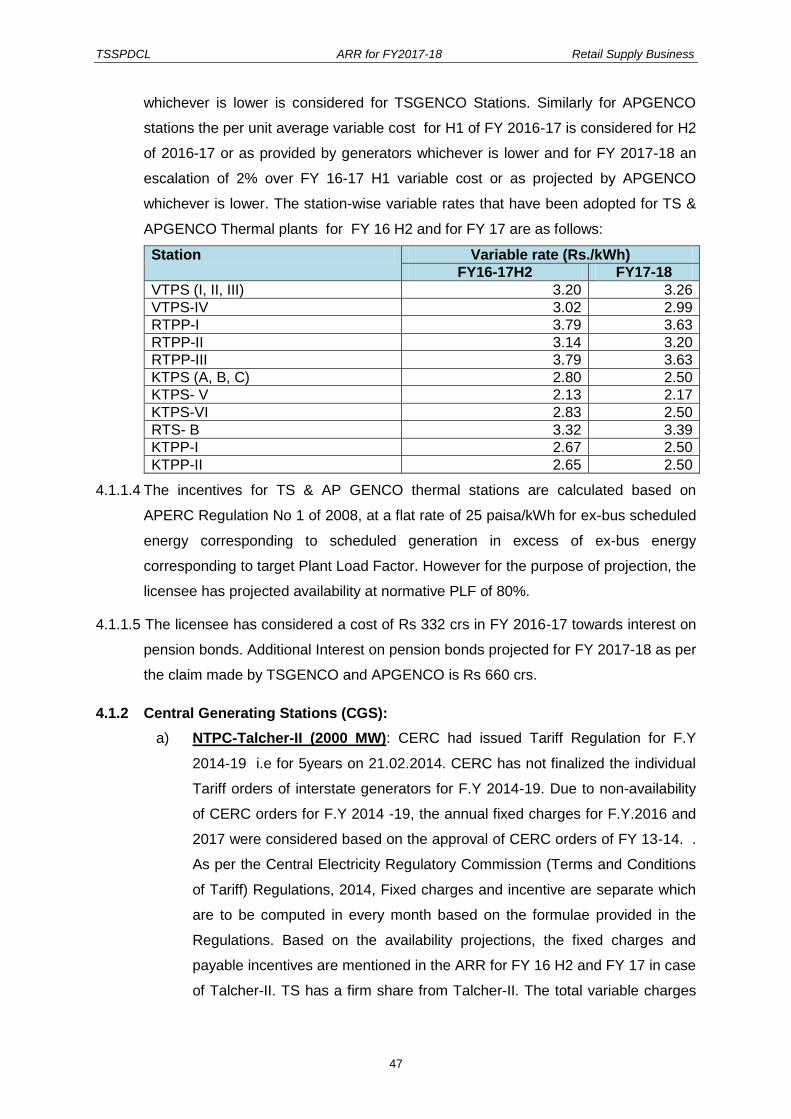
TSSPDCL ARR for FY2017-18 Retail Supply Business
47
whichever is lower is considered for TSGENCO Stations. Similarly for APGENCO
stations the per unit average variable cost for H1 of FY 2016-17 is considered for H2
of 2016-17 or as provided by generators whichever is lower and for FY 2017-18 an
escalation of 2% over FY 16-17 H1 variable cost or as projected by APGENCO
whichever is lower. The station-wise variable rates that have been adopted for TS &
APGENCO Thermal plants for FY 16 H2 and for FY 17 are as follows:
Station Variable rate (Rs./kWh)
FY16-17H2 FY17-18
VTPS (I, II, III) 3.20 3.26
VTPS-IV 3.02 2.99
RTPP-I 3.79 3.63
RTPP-II 3.14 3.20
RTPP-III 3.79 3.63
KTPS (A, B, C) 2.80 2.50
KTPS- V 2.13 2.17
KTPS-VI 2.83 2.50
RTS- B 3.32 3.39
KTPP-I 2.67 2.50
KTPP-II 2.65 2.50
4.1.1.4 The incentives for TS & AP GENCO thermal stations are calculated based on
APERC Regulation No 1 of 2008, at a flat rate of 25 paisa/kWh for ex-bus scheduled
energy corresponding to scheduled generation in excess of ex-bus energy
corresponding to target Plant Load Factor. However for the purpose of projection, the
licensee has projected availability at normative PLF of 80%.
4.1.1.5 The licensee has considered a cost of Rs 332 crs in FY 2016-17 towards interest on
pension bonds. Additional Interest on pension bonds projected for FY 2017-18 as per
the claim made by TSGENCO and APGENCO is Rs 660 crs.
4.1.2 Central Generating Stations (CGS):
a) NTPC-Talcher-II (2000 MW): CERC had issued Tariff Regulation for F.Y
2014-19 i.e for 5years on 21.02.2014. CERC has not finalized the individual
Tariff orders of interstate generators for F.Y 2014-19. Due to non-availability
of CERC orders for F.Y 2014 -19, the annual fixed charges for F.Y.2016 and
2017 were considered based on the approval of CERC orders of FY 13-14. .
As per the Central Electricity Regulatory Commission (Terms and Conditions
of Tariff) Regulations, 2014, Fixed charges and incentive are separate which
are to be computed in every month based on the formulae provided in the
Regulations. Based on the availability projections, the fixed charges and
payable incentives are mentioned in the ARR for FY 16 H2 and FY 17 in case
of Talcher-II. TS has a firm share from Talcher-II. The total variable charges
TSSPDCL ARR for FY2017-18 Retail Supply Business
48
for each month of FY 16 H2 and FY 17 are projected based on the variable
charges per unit already paid during the monthly Energy Bill of August‟16.
b) NTPC (SR) RSTPS Stage–I&II (2100 MW): CERC had issued Tariff
Regulation for F.Y 2014-19 i.e. for 5years on 21.02.2014. CERC has not
finalized the individual Tariff orders of interstate generators for F.Y 2014-19.
Due to non-availability of CERC orders for F.Y 2014 -19, the annual fixed
charges for F.Y.2016 and 2017 were considered based on the approval of
CERC orders of FY 13-14. As per the Central Electricity Regulatory
Commission (Terms and Conditions of Tariff) Regulations, 2014, Fixed
charges and incentive are separate which are to be computed in every month
based on the formulae provided in the Regulations. Based on the availability
projections, the fixed charges and payable incentives are mentioned in the
ARR for FY 16 H2 and FY 17 in case of RSTPS I&II. TS has a firm share
from RSTPS I&-II. The total variable charges for each month of FY 16 H2
and FY 17 are projected based on the variable charges per unit already paid
during the monthly Energy Bill of August‟16.
c) NTPC (SR) RSTPS Stage-III (500 MW): CERC had issued Tariff Regulation
for F.Y 2014-19 i.e. for 5years on 21.02.2014. CERC has notfinalized the
individual Tariff orders of interstate generators for F.Y 2014-19. Due to non-
availability of CERC orders for F.Y 2014 -19, the annual fixed charges for
F.Y.2016 and 2017 were considered based on the approval of CERC orders
of FY 13-14. . As per the Central Electricity Regulatory Commission (Terms
and Conditions of Tariff) Regulations, 2014, Fixed charges and incentive are
separate which are to be computed in every month based on the formulae
provided in the Regulations. Based on the availability projections, the fixed
charges and payable incentives are mentioned in the ARR for FY 16 H2 and
FY 17 in case of RSTPS III. TS has a firm share from RSTPS I-II. The total
variable charges for each month of FY 15 H2 and FY 16 are projected based
on the variable charges per unit already paid during the monthly Energy Bill of
August‟16.
d) NTPC Simhadri Stage-I (1000 MW): As per the Central Electricity Regulatory
Commission (Terms and Conditions of Tariff) Regulations, 2014 and CERC
orders fixed charges and incentive are separate which are to be computed in
every month based on the formulae provided in the Regulations. Based on
the availability projections, the fixed charges and payable incentives are
mentioned in the ARR for FY 16 H2 and FY 17 in case of NTPC Simhadri-I.

TSSPDCL ARR for FY2017-18 Retail Supply Business
49
TS has a firm share from NTPC Simhadri-I. The total variable charges for
each month of FY 16 H2 and FY 17 are projected based on the variable
charges per unit already paid during the monthly Energy Bill of August‟16.
e) NLC TPS II (1470 MW): CERC had issued Tariff Regulation for F.Y 2014-19
i.e for 5years on 21.02.2014. CERC has not finalized the individual orders of
inter state generators for F.Y 2014-19. Due to non-availability of CERC orders
for F.Y 2014 -19 , the annual fixed charges for F.Y.2016 and 2017 were
considered based on the approval of CERC orders of FY 13-14. . As per the
Central Electricity Regulatory Commission (Terms and Conditions of Tariff)
Regulations, 2014, Fixed charges and incentive are separate which are to be
computed in every month based on the formulae provided in the Regulations.
Based on the availability projections, the fixed charges and payable
incentives are mentioned in the ARR for FY 16 H2 and FY 17 in case of NLC
TPS-II. TS has a firm share from NLC TPS-II. The total variable charges for
each month of FY 16 H2 and FY 17 are projected based on the per unit cost
projections given by Generator.
f) NLC Stage –I (630 MW): For the TS DISCOMs share of 9.340 % of 630 MW,
the payable fixed charges and also lignite cost for the Control Period 2009-14
was determined by CERC in its final orders of NLC TPS-II. (Stage-I).
g) NLC Stage –II (840 MW): For the TS DISCOMs share of 12.58 % of 840 MW,
the payable fixed charges and also lignite cost for the Control Period 2009-14
was determined by CERC in its final orders of NLC TPS-II. (Stage-II).
h) Madras Atomic Power Stations (MAPS) (440 MW): The Department of
Atomic Energy (Power Section) under the Government of India, notified the
tariff for supply of power from MAPS vide „Tariff Notification „dated
22.09.2006. The share of TS in MAPS is 5.10%. The payable chargers to
MAPS to the extent of TS allocation are computed based on the tariff
determination of Department of Atomic Energy Commission.
i) Kaiga Atomic Power Station 1&2 (440 MW) and 3&4 (440MW): The TS
share from Kaiga 1 & 2 is 15.72% and it is 16.70% in case of Kaiga 3 &4. The
payable charges to Kaiga 1&2 and Kaiga 3&4 were computed based on the
single part tariff which was approved by DAE.
j) NTPC-Simhadri II (1000 MW): As per the Central Electricity Regulatory
Commission (Terms and Conditions of Tariff) Regulations, 2014 and CERC
provisional orders Fixed charges and incentive are separate which are to be

TSSPDCL ARR for FY2017-18 Retail Supply Business
50
computed in every month based on the formulae provided in the Regulations.
Based on the availability projections, the fixed charges and payable
incentives are mentioned in the ARR for FY 16 H2 and FY 17 in case of
NTPC Simhadri-II. TS has a firm share from NTPC Simhadri-II. The total
variable charges for each month of FY 16 H2 and FY 17 are projected based
on the variable charges per unit already paid during the monthly Energy Bill of
Aug‟16.
k) Vallur Thermal JV Power Project (NTPC & TANGEDCO): CERC had
issued Tariff Regulation for F.Y 2014-19 i.e for 5years on 21.02.2014. CERC
is not finalized the individual orders of inter state generators for F.Y 2014-19.
Due to non-availability of CERC orders for F.Y 2014 -19 , the annual fixed
charges for F.Y.2016 and 2017 were considered based on the approval of
CERC orders of FY 13-14. As per the Central Electricity Regulatory
Commission (Terms and Conditions of Tariff) Regulations, 2014, Fixed
charges and incentive are separate which are to be computed in every month
based on the formulae provided in the Regulations. Based on the availability
projections, the fixed charges and payable incentives are mentioned in the
ARR for FY 16 H2 and FY 17 in case of NTECL Valluru-II. TS has a firm
share from NTECL Valluru . The total variable charges for each month of FY
16 H2 and FY 17 are projected based on the variable charges per unit
already paid during the monthly Energy Bill of August‟16.
l) NTPL (Tuticorin) JV Power Project (NLC & TANGEDCO): As per the
Central Electricity Regulatory Commission (Terms and Conditions of Tariff)
Regulations, 2014 and CERC provisional orders Fixed charges and incentive
are separate which are to be computed in every month based on the formulae
provided in the Regulations. Based on the availability projections, the fixed
charges and payable incentives are mentioned in the ARR for FY 16 H2 and
FY 17 in case of NTPL. TS has a firm share from NTPL. . The total variable
charges for each month of FY 16 H2 and FY 17 are projected based on the
per unit cost projections given by Generator.
m) Bundled Power from NTPC(ER) Stations under JNNSM: Presently,
NVVNL has been issuing the availability declarations to TS DISCOMs from
NTPC(SR) stations to TS against commissioning of solar power in TS under
JNNSM Policy. The available energy was considered based on the solar
power at an availability of 20% PLF to the total installed capacity of 85 MWs
and 85MWs for unallocated power from NVVNL at availability PLF of 85%.

TSSPDCL ARR for FY2017-18 Retail Supply Business
51
n) Bundled Power from NTPC(ER) Stations under JNNSM: Presently,
NVVNL has been issuing the availability declarations to TS DISCOMs from
NTPC(SR) stations to TS against commissioning of solar power in TS under
JNNSM Policy. The available energy was considered based on the solar
power at an availability of 20% PLF to the total installed capacity of 85 MWs
and 85MWs for unallocated power from NVVNL at availability PLF of 85%.
o) PGCIL/CTU Charges, POSOCO Charges & ULDC Charges: TSDISCOMs
have been making the payments in every month towards utilization of Inter-
State Transmission Charges based on the determination of POC rates
applicable to TS in every quarter. Further, POSOCO (SRLDC) charges as
well ULDC charges are separately being paid to SRLDC & PGCIL
respectively based on the fixed chargers determined by CERC for a period of
5 years. In case of PGCIL, as per the regulations, PGCIL has been
recovering the full fixed charges through POC rates duly considering the
orders of CERC and also subject to reconcile the entire amounts on pro-rata
basis of payments in every quarter and if recovery of fixed charges are made
lesser or higher side by PGCIL in every month. Presently, the projection of
fixed charges of PGCIL, POSOCO & ULDC was projected for FY H2 16 and
FY 17 based on the Oct‟16 monthly bill.
p) NTPC-Kudgi: As informed by NTPC, the estimated total cost per unit is Rs
4.20 (Fixed Cost of Rs 2.31 and Variable Cost of Rs is 1.89). A petition was
filed before Hon‟ble CERC for determination of tariff based on the capital
cost. For the period between the achievements of COD and determination of
tariff by CERC, the Company will raise bills based on the provisional tariff and
reconciliation will be done after finalization of tariff by CERC.
4.1.3 APGPCL
4.1.3.1 The power purchase cost incurred by TSDISCOMs for procurement from APGPCL
for FY 16-17(H2) and FY 17-18 is as per the projections given by APGPCL:
Cost components for FY16-17 H2 and FY17-18
Stage-I FY 16-17 H2 FY 17-18
Fixed cost (Rs.in crore) 1.21 0.75
Variable cost (Rs./kWh) 2.84 2.33
Stage –II FY 16-17 H2 FY 17-18
Fixed cost (Rs. in crore) 2.07 3.04
Variable cost (Rs./kWh) 2.33 2.08
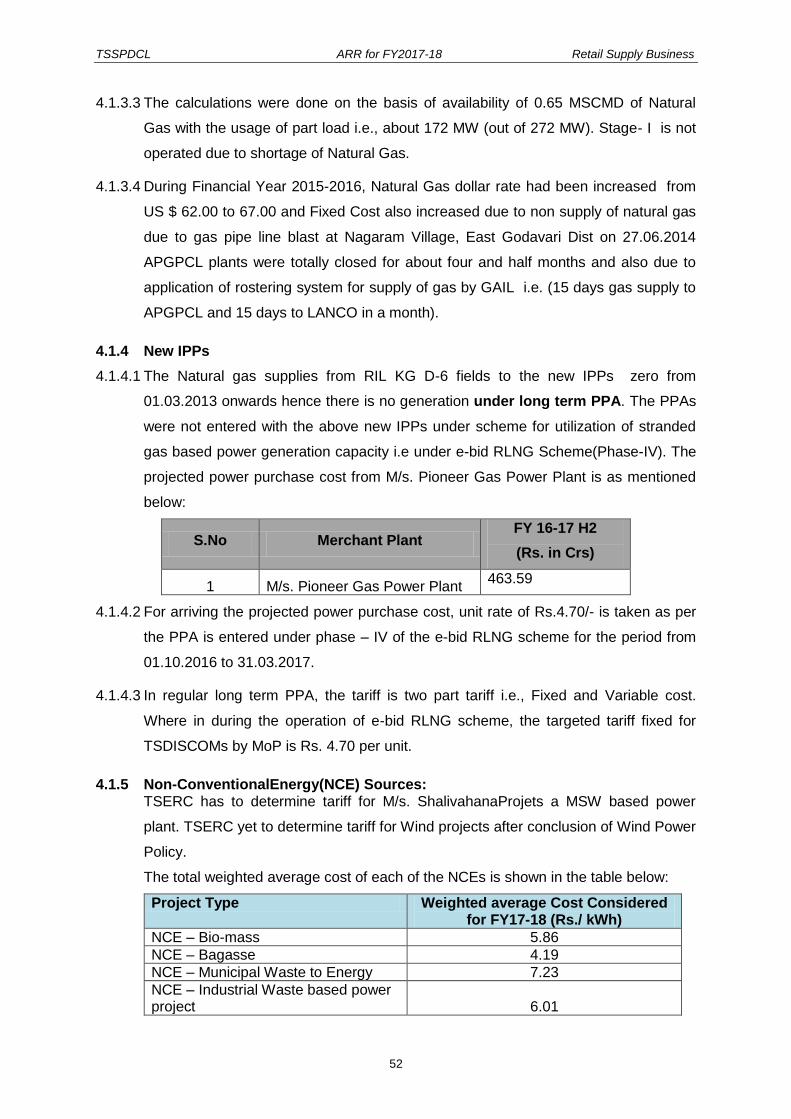
TSSPDCL ARR for FY2017-18 Retail Supply Business
52
4.1.3.3 The calculations were done on the basis of availability of 0.65 MSCMD of Natural
Gas with the usage of part load i.e., about 172 MW (out of 272 MW). Stage- I is not
operated due to shortage of Natural Gas.
4.1.3.4 During Financial Year 2015-2016, Natural Gas dollar rate had been increased from
US $ 62.00 to 67.00 and Fixed Cost also increased due to non supply of natural gas
due to gas pipe line blast at Nagaram Village, East Godavari Dist on 27.06.2014
APGPCL plants were totally closed for about four and half months and also due to
application of rostering system for supply of gas by GAIL i.e. (15 days gas supply to
APGPCL and 15 days to LANCO in a month).
4.1.4 New IPPs
4.1.4.1 The Natural gas supplies from RIL KG D-6 fields to the new IPPs zero from
01.03.2013 onwards hence there is no generation under long term PPA. The PPAs
were not entered with the above new IPPs under scheme for utilization of stranded
gas based power generation capacity i.e under e-bid RLNG Scheme(Phase-IV). The
projected power purchase cost from M/s. Pioneer Gas Power Plant is as mentioned
below:
S.No Merchant Plant FY 16-17 H2
(Rs. in Crs)
1 M/s. Pioneer Gas Power Plant 463.59
4.1.4.2 For arriving the projected power purchase cost, unit rate of Rs.4.70/- is taken as per
the PPA is entered under phase – IV of the e-bid RLNG scheme for the period from
01.10.2016 to 31.03.2017.
4.1.4.3 In regular long term PPA, the tariff is two part tariff i.e., Fixed and Variable cost.
Where in during the operation of e-bid RLNG scheme, the targeted tariff fixed for
TSDISCOMs by MoP is Rs. 4.70 per unit.
4.1.5 Non-ConventionalEnergy(NCE) Sources: TSERC has to determine tariff for M/s. ShalivahanaProjets a MSW based power
plant. TSERC yet to determine tariff for Wind projects after conclusion of Wind Power
Policy.
The total weighted average cost of each of the NCEs is shown in the table below:
Project Type Weighted average Cost Considered for FY17-18 (Rs./ kWh)
NCE – Bio-mass 5.86
NCE – Bagasse 4.19
NCE – Municipal Waste to Energy 7.23
NCE – Industrial Waste based power project 6.01

TSSPDCL ARR for FY2017-18 Retail Supply Business
53
Project Type Weighted average Cost Considered for FY17-18 (Rs./ kWh)
NCE – Wind Power 4.70
NCE – Mini Hydel 0.00
NCE – NCL Energy Ltd. 0.00
NCE – Solar Power 5.84
4.1.6 BilateralPurchases Month-wise shortfall has been estimated based on the availability and requirement. A
part of this deficit would be met from external sources such as power traders and
power exchange. The estimated purchases from such external sources are estimated
to be 628 MU for FY 16-17 H2.
4.1.7 Long Term The licensees have considered the costs as per the prices quoted by the bidders in
the Long term bidding process
4.1.8 Singareni Thermal Power Project
As per its filing of Capital Cost/ Tariff of 1200 MW (2 X 600 MW) project, SCCL has
considered an IDC cost of Rs 407 crs which is substantial. It is the submission of the
licensee that the consumers in the state should not be saddled with the IDC
component which is due to the project execution delays. Further there is scope of
interest cost reduction through negotiations with the funding agencies. Keeping this
in view, the licensee has considered a fixed cost per unit of Rs 2.15/KWh for FY
2017-18. As SCCL is a pit head station, there is a good scope of decreasing the
transit losses in coal. The licensee has considered a variable cost per unit of Rs
1.80/KWh for FY2017-18.
4.1.9 Summary of Energy Requirement Based on the availability shown above and the energy requirement from all the
DISCOMs, the actual energy to be purchased Discom-wise has been projected as
follows:
TSDiscom FY16-17 H2 FY17-18
MU MU
TSSPDCL 17823.4 38,432.93
TSNPDCL 7802.07 16,323.11
Total 25,625.46 54,756.05
The above energy requirement of the licensees has been arrived at by grossing up
the sales of the licensee sales with appropriate transmission and distribution losses.
The external loss on the power purchased from CGS only has also been factored in
the above energy requirement.
4.1.10 Summary of power purchase for current year and ensuing year
Based on the availability, requirement and costs for each source, the summary of
revised power purchase cost for the State for FY 2016 – 17 is projected as follows:

TSSPDCL ARR for FY2017-18 Retail Supply Business
54
Source FY2016-17 (H1 Actual & H2 Projected)
Power Purchase (MU)
Fixed Cost Rs.Crs.
Variable Cost Rs.Crs.
Other Cost RsCrs
Total Cost RsCrs
TS &APGenco – Thermal
19650 3114
5773
352
9240
TS &APGenco – Hydel
1021 1050 0.00 0.00 1050
CGS 13654 1223 3286 9.20 4518
NCE 1635 35 937 0.00 972
IPPs 394 0 185 88 273
APGPCL 68 5 16 0.00 21
Thermal Tech 5809 1307 1001 0.00 2308
Singareni 3606 765 778 52.92 1596
Market Purchase 4299 7 2592 0.00 2598
Total 50136 7506 14568 502 22577
Based on the availability, requirement and costs for each source, the summary of
power purchase cost for the State for FY 17 is projected as follows:
Source FY2017-18 (Projected)
Power Purchase
(MU)
Fixed Cost
Rs.Crs.
Variable Cost
Rs.Crs.
Other Cost
RsCrs
Total Cost
RsCrs
TS &APGenco - Thermal
14,410 3293 3741 356 7389
TS &APGenco - Hydel 1400 1413 0.00 0.00 1413
CGS 13586 1493 3153 0.18 4646
NCE 5163 68 2843 0.00 2911
IPPs 0.00 0.00 0.00 0.00 0.00
APGPCL 92 4 19.52 0.00 23.31
Thermal Tech 5844 1361 1076.8 0.00 2437.9
Singareni 7779 1672 1400 0.00 3073
CSPGCL 6482 1750 778 0.00 2528
Total 54,756 11055 13010 356 24421
4.2 Transmission Charges
4.2.1 The licensee has adopted the Transmission capacity contracted and rate of
Transmission charges for FY2016-17 and FY2017-18 as per the approved figures in
the MYT Transmission Tariff Order 2014-15 to 2018-19,
4.2.2 As the MYT Transmission Order considered transmission capacity contracted with
erstwhile APCPDCL (including Anantapur& Kurnool), the licensee has deducted the
Anantapur& Kurnool share of the transmission capacity according to G.O.Ms.No.20,
dated 08.05.2014 issued by undivided Government of AndhraPradesh.According to
G.O.Ms.No.20 the earlier share of 46.06% of the APCPDCLin the total undivided
state has been revised to 38.02% share of TSSPDCL.
4.2.3 The revised installed capacities considered for 2016-17 and 2017-18 are shown
below:
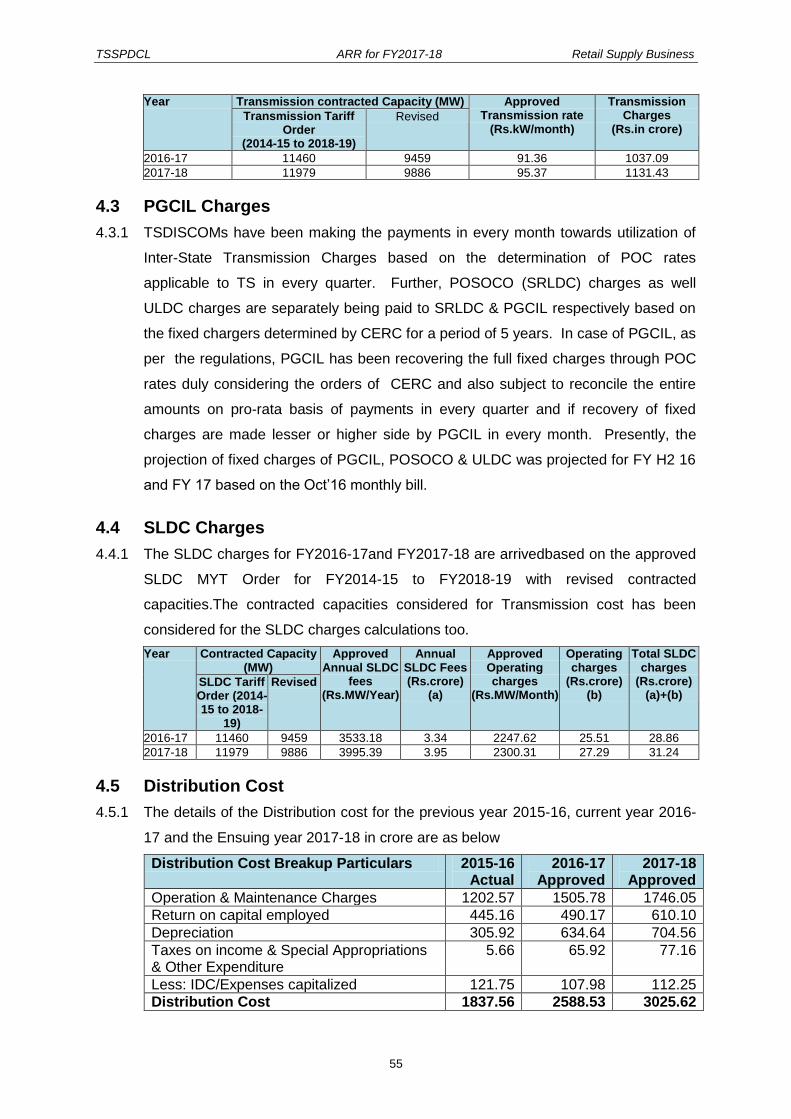
TSSPDCL ARR for FY2017-18 Retail Supply Business
55
Year Transmission contracted Capacity (MW) Approved Transmission rate
(Rs.kW/month)
Transmission Charges
(Rs.in crore) Transmission Tariff
Order (2014-15 to 2018-19)
Revised
2016-17 11460 9459 91.36 1037.09
2017-18 11979 9886 95.37 1131.43
4.3 PGCIL Charges
4.3.1 TSDISCOMs have been making the payments in every month towards utilization of
Inter-State Transmission Charges based on the determination of POC rates
applicable to TS in every quarter. Further, POSOCO (SRLDC) charges as well
ULDC charges are separately being paid to SRLDC & PGCIL respectively based on
the fixed chargers determined by CERC for a period of 5 years. In case of PGCIL, as
per the regulations, PGCIL has been recovering the full fixed charges through POC
rates duly considering the orders of CERC and also subject to reconcile the entire
amounts on pro-rata basis of payments in every quarter and if recovery of fixed
charges are made lesser or higher side by PGCIL in every month. Presently, the
projection of fixed charges of PGCIL, POSOCO & ULDC was projected for FY H2 16
and FY 17 based on the Oct‟16 monthly bill.
4.4 SLDC Charges
4.4.1 The SLDC charges for FY2016-17and FY2017-18 are arrivedbased on the approved
SLDC MYT Order for FY2014-15 to FY2018-19 with revised contracted
capacities.The contracted capacities considered for Transmission cost has been
considered for the SLDC charges calculations too.
Year Contracted Capacity (MW)
Approved Annual SLDC
fees (Rs.MW/Year)
Annual SLDC Fees (Rs.crore)
(a)
Approved Operating charges
(Rs.MW/Month)
Operating charges
(Rs.crore) (b)
Total SLDC charges
(Rs.crore) (a)+(b)
SLDC Tariff Order (2014-15 to 2018-
19)
Revised
2016-17 11460 9459 3533.18 3.34 2247.62 25.51 28.86
2017-18 11979 9886 3995.39 3.95 2300.31 27.29 31.24
4.5 Distribution Cost
4.5.1 The details of the Distribution cost for the previous year 2015-16, current year 2016-
17 and the Ensuing year 2017-18 in crore are as below
Distribution Cost Breakup Particulars 2015-16 Actual
2016-17 Approved
2017-18 Approved
Operation & Maintenance Charges 1202.57 1505.78 1746.05
Return on capital employed 445.16 490.17 610.10
Depreciation 305.92 634.64 704.56
Taxes on income & Special Appropriations & Other Expenditure
5.66 65.92 77.16
Less: IDC/Expenses capitalized 121.75 107.98 112.25
Distribution Cost 1837.56 2588.53 3025.62

TSSPDCL ARR for FY2017-18 Retail Supply Business
56
Distribution Cost Breakup Particulars 2015-16 Actual
2016-17 Approved
2017-18 Approved
Less: Wheeling Revenue 1.15 0.00 0.00
Less:NTI 52.29 320.55 362.72
Net Distribution Cost 1784.12 2267.98 2662.91
4.6 Interest on Consumer Security Deposit
4.6.1 The details showing the interest on Consumer Security Deposit (Rs. in crore) is as
below.
Particulars 2015-16 2016-17 2017-18
Opening Balance 2023.21 2256.76 2423.11
Additions during the Year 233.55 166.35 302.51
Closing Balance 2256.76 2423.11 2725.63
Average Balance ((Opening + Closing )/2) 2139.98 2339.94 2574.37
Interest @ % p.a. 7.84 6.75 6.75
Interest Cost (e * f) 167.86 157.95 173.77
4.6.2 The licensee has considered the rate of interest asnotified by the Reserve Bank of
India from time to time as stipulated in the Regulation for payment of interest on
security deposits. The Bank rates as notified by RBI for the previous and current
years is shown below
Period Rate of Interest (%) p.a.
01.04.15 to 01.06.15 8.5
02.06.15 to 28.09.15 8.25
29.09.15 to 05.04.16 7.75
05.04.16 to 03.10.16 7.00
04.10.16 to till date 6.75
4.6.3 Hence, the licensee has estimated interest on consumer security deposits for
FY2016-17 and FY2017-18 considering Bank rate @6.75% p.a.
4.7 Supply Margin
4.7.1 The Supply margin as approved by Hon‟ble Commission has been considered for
2016-17 and 2017-18.
Description 2015-16 2016-17 2017-18
Supply Margin (Rs. in crore) 15.93 19.61 24.40
4.8 Other Cost
4.8.1 The Licensee has not considered any other cost (i.e., Reactive Charges) for FY2016-
17and FY2017-18.
4.9 Aggregate Revenue Requirement
4.9.1 The Aggregate Revenue Requirement (ARR) forFY2015-16, FY 2016-17 and
FY2017-18 are as shown below:
Expenditure Item 2015-16 2016-17 2017-18

TSSPDCL ARR for FY2017-18 Retail Supply Business
57
Expenditure Item 2015-16 2016-17 2017-18
Power Purchase and procurement cost 15478.91 15975.88 17095
Transmission Cost 820.55 1037.09 1131.43
PGCIL & ULDC Cost 331.72 596.13 925.81
SLDC Charges 26.41 28.86 31.24
Distribution Cost 1784.12 2267.98 2662.91
Interest on Consumer Security Deposits 167.86 157.95 173.77
Supply Margin 15.93 19.61 24.40
Other Costs 0.00 0.00 0.00
Aggregate Revenue requirement 18625.5 20083.5 22044.56

TSSPDCL ARR for FY2017-18 Retail Supply Business
58
5 REVENUE PROJECTIONS
5.1 Revenue at Current Tariffs The gross revenue at current tariffs for FY 2015-16 is shown below:
Revenue from Current Tariffs (Rs.Crs.) 2015-16
LT Category 6185.31
LT-I: Domestic 2861.78
LT-II: Non–Domestic/Commercial 2184.75
LT-III: Industry 621.67
LT-IV: Cottage Industries 3.80
LT-V: Agricultural 44.26
LT-VI: Street Lightning & PWS Schemes 420.87
LT-VII: General Purpose 45.34
LT-VIII: Temporary Supply 2.84
HT Category 8825.07
HT-I(A): Industry (General) 6335.51
HT-I(B): Ferro-Alloy Units 133.71
HT-II: Others 1815.85
HT-III: Airports, Bus Stations and Railway Stations
45.34
HT-IV: Irrigation & CPWS 255.78
HT-V: Railway Traction 101.84
HT-VI: Townships & Residential Colonies 77.62
HT Temporary 59.42
Total 15010.38
5.2 Non-Tariff Income from Current Tariffs
5.2.1 Non-Tariff Income (NTI) for current year and ensuring year is as shown below:
The income reflected in financial statements other than revenue from sale of power is
tabulated below:
Other income (Rs. in crores)
2015-16
Remarks Other income as per audited
accounts Non-Tariff
income Others
Incidental Charges-Work 37.15 37.15
Sale of Scrap 3.51 3.51 0
Penalities from Suppliers 3.46 3.46
SDs & BGs forfeited 2.92 2.92 0
Price Variation 2.21 2.21
Wheeling charges 1.15 1.15 0
Rebate From Funding Agency 1.04 1.04
Miscellaneous income 0.8 0.8
Sale of Tender Schedule 0.34 0.34 0
Rent from Fixed Assets 0.31 0.31
Meter Testing Charges 0.25 0.25
Registration Fees 0.19 0.19
Interest on Staff loans & advances 0.07 0.07
Penalty from employees 0.02 0.02

TSSPDCL ARR for FY2017-18 Retail Supply Business
59
Other income (Rs. in crores)
2015-16
Remarks Other income as per audited
accounts Non-Tariff
income Others
Transformer Testing Charges 0.01 0.01 0
NTI Distribution 53.43
Prior Period 51.14 45.73 5.4 Rs. 5.40 Pertains to FSA
Capacitor Surcharge 20.55 20.55
Interest on Others (ED) 3.42 3.42
Reactive Income 2.83 2.83
Grid supporting /Application charge 2.08 2.08
Interest on Bank deposits 1.77 1.77
Application Registration Fee 1.36 1.36
Reconnection Fee –LT 1 1
Reconnection Fee –HT 0.05 0.05
Other income 147.83 29.48 118.35
Balance Rs. 118.35 crores pertains to RLNG subsidy by state government for the FY 2013-14 reflected in Form 9 as the subsidy received from the government
NTI Retail supply business 108.27
Theft of Power 16.9
16.9 Theft of power is not identified under income as the related Power purchase costs are not considered under Regulatory accounting
Theft-incidental charges 0.21 0.21 Theft of power is not identified under income as the related Power purchase costs are not considered under Regulatory accounting
Provision for Un-billed Revenue 21.76 21.76 provisions not included as per Regulatory accounting
UI charges 40.48 40.48 Adjusted in the PP cost
Amortization of CC 238.61 238.61 Adjusted in the depreciation in distribution cost
Compensation -5.66 -5.66 Shown in Other costs in DB
Cross subsidy Surcharge 6.16 6.16 Reflected under Revenue from Sale of power (Form7)
DPS Income 6.42 6.42 Not considered as it is used as a part of working capital requirement for Retail supply Business
ED last year -107.81 -107.81 Adjusted in the last year Revenue from sale of power(Form 7)
FSA 0.89 0.89
Interstate Sales 21.99 21.99 Adjusted in the PP cost
Electricity Duty -133.64 -133.64 Adjusted in current year Revenue from sale of power (Form 7)
Provision for Bad doubtful debts 219.11 219.11 Provision for bad and doubtful debts are not included in the income as per Regulatory accounting
R & C Penalties -5.47 -5.47 Not included as per regulatory accounting
Rebate on Power Purchase 35.47 35.47 Generated out of internal efficiencies and hence not considered as a pass through
Royalty from advertisements 0.19 0.19 Not a part of NTI as it is income from other business
Sub Total of Other Income 479.36
Grand total as per audited accounts 641 161.7 479.36
Revenue from sale of Power 16187 Reflected in Form 7
Grand Total of Revenue as per audited accounts
16828
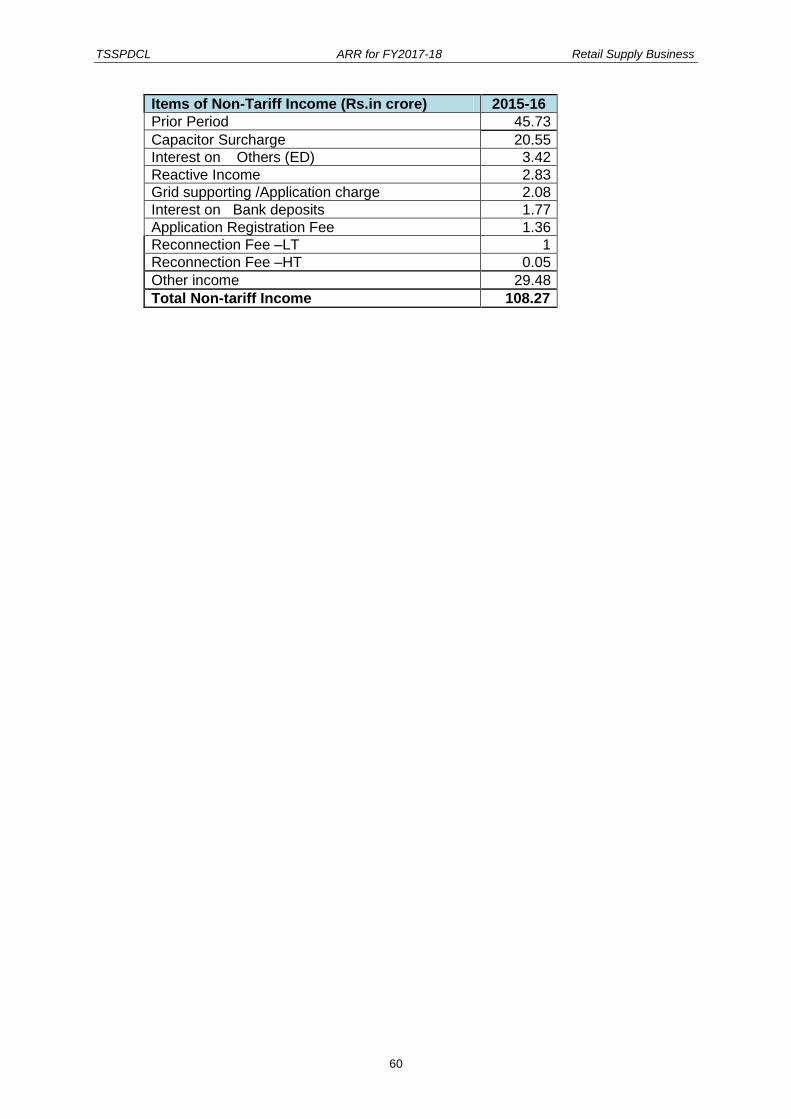
TSSPDCL ARR for FY2017-18 Retail Supply Business
60
Items of Non-Tariff Income (Rs.in crore) 2015-16
Prior Period 45.73
Capacitor Surcharge 20.55
Interest on Others (ED) 3.42
Reactive Income 2.83
Grid supporting /Application charge 2.08
Interest on Bank deposits 1.77
Application Registration Fee 1.36
Reconnection Fee –LT 1
Reconnection Fee –HT 0.05
Other income 29.48
Total Non-tariff Income 108.27
TSSPDCL ARR for FY2017-18 Retail Supply Business
61
6 COST OF SERVICE
6.1 Introduction
6.1.1 This section presents the estimated cost of service for various consumer categories
of the Southern Power Distribution Company Limited (TSSPDCL), for the year
starting on April 1, 2017 and ending on March 31, 2018.The objective of this section
is to classify the costs into demand; energy and customer related components and
then apportion the same to various customer categories.
The steps involved in the analysis are:
Forecasting the energy and peak demand requirements for the power system
in the year under consideration;
Forecasting the energy and peak demand requirements at the transmission-
distribution interface in that year;
Estimating the energy and peak demand requirements for each customer
category for that year;
Estimating the costs of providing the energy and peak demand required for
each customer category; and
Classifying and allocating the above costs to various consumer categories of
TSSPDCL at the retail level.
6.2 Cost of Service Model
6.2.1 The cost of service calculations are based on the cost of service model developed for
TSSPDCL. The model, as currently used, calculates the cost of serving all customers
categories of TSSPDCL.
6.2.2 All financial input into the model is as per the ARR for the year 2017-18, including
revenue, and expenditure data.
6.2.3 The following section gives a brief overview of the Cost of Service model developed
for TSSPDCL

TSSPDCL ARR for FY2017-18 Retail Supply Business
62
6.2.4 Financial Input Sheet: This forms the base for the income and expenses data for the
TSSPDCL. The values are as per the ARR for the year 2017-18.
6.2.5 Technical Input Sheet: This part includes the system data required for the cost of
service calculation.The energy and losses in the system are included along with the
data regarding the customers responsible for the corresponding sales and
losses.The percentage loss quoted is the loss in the distribution system and hence
accounts for the energy that is unavailable for sale to the retail customers.
6.2.6 TSSPDCL customers are segregated into LT and HT customers, which includes EHT
(220 kV and 132 kV), Sub-transmission (33 kV) and distribution (11 kV and LV).The
Financial Input Cost Elements as per the ARR
Technical Input
Energy Sales ( MU)
Coincident Demand (MW)
Non-CoincidentDemand (MW)
/ContractedDemand (MW)
Expenditure Classification
Classification of the cost elements –
Demand Related
Energy Related
Customer Related
Expenditure Allocation
Allocation of classified costs to Consumer Categories
Model Outputs
Category-wise PP Cost allocation
Category-wise Transmission Cost allocation
Category-wise Distribution Cost allocation
Category-wise Consolidated Cost Summary
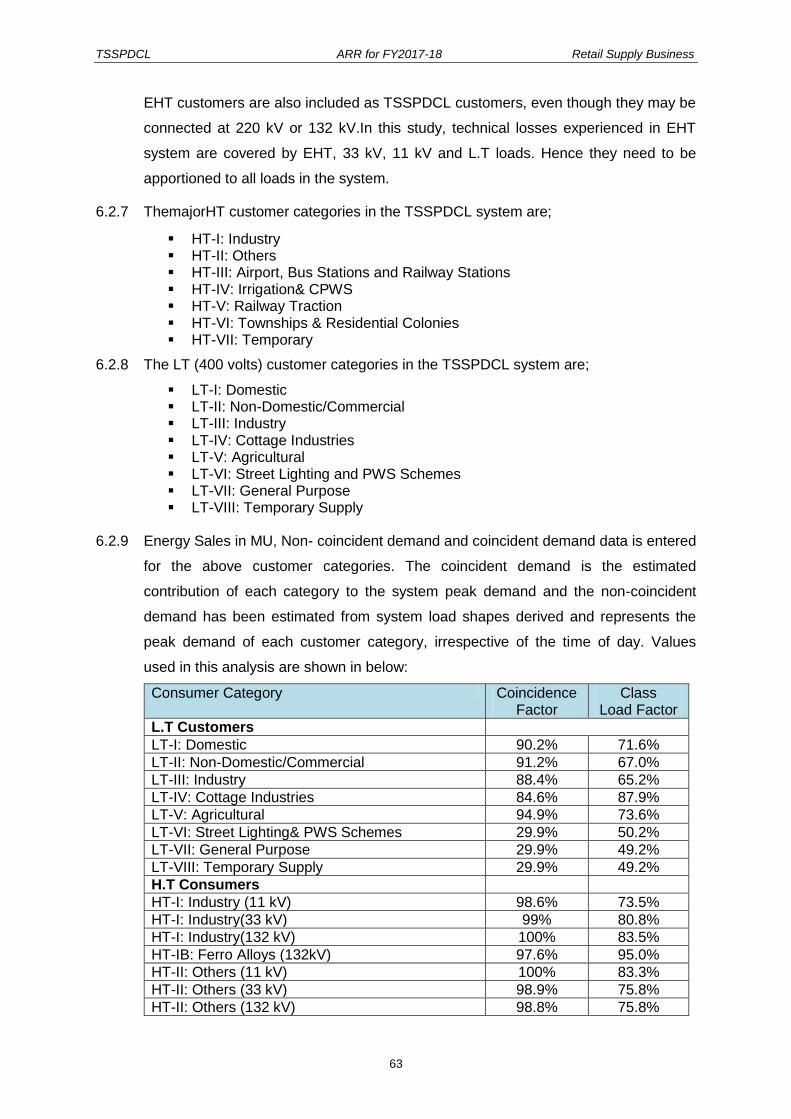
TSSPDCL ARR for FY2017-18 Retail Supply Business
63
EHT customers are also included as TSSPDCL customers, even though they may be
connected at 220 kV or 132 kV.In this study, technical losses experienced in EHT
system are covered by EHT, 33 kV, 11 kV and L.T loads. Hence they need to be
apportioned to all loads in the system.
6.2.7 ThemajorHT customer categories in the TSSPDCL system are;
6.2.8 The LT (400 volts) customer categories in the TSSPDCL system are;
LT-I: Domestic LT-II: Non-Domestic/Commercial LT-III: Industry LT-IV: Cottage Industries LT-V: Agricultural LT-VI: Street Lighting and PWS Schemes LT-VII: General Purpose LT-VIII: Temporary Supply
6.2.9 Energy Sales in MU, Non- coincident demand and coincident demand data is entered
for the above customer categories. The coincident demand is the estimated
contribution of each category to the system peak demand and the non-coincident
demand has been estimated from system load shapes derived and represents the
peak demand of each customer category, irrespective of the time of day. Values
used in this analysis are shown in below:
Consumer Category Coincidence Factor
Class Load Factor
L.T Customers
LT-I: Domestic 90.2% 71.6%
LT-II: Non-Domestic/Commercial 91.2% 67.0%
LT-III: Industry 88.4% 65.2%
LT-IV: Cottage Industries 84.6% 87.9%
LT-V: Agricultural 94.9% 73.6%
LT-VI: Street Lighting& PWS Schemes 29.9% 50.2%
LT-VII: General Purpose 29.9% 49.2%
LT-VIII: Temporary Supply 29.9% 49.2%
H.T Consumers
HT-I: Industry (11 kV) 98.6% 73.5%
HT-I: Industry(33 kV) 99% 80.8%
HT-I: Industry(132 kV) 100% 83.5%
HT-IB: Ferro Alloys (132kV) 97.6% 95.0%
HT-II: Others (11 kV) 100% 83.3%
HT-II: Others (33 kV) 98.9% 75.8%
HT-II: Others (132 kV) 98.8% 75.8%
HT-I: Industry HT-II: Others HT-III: Airport, Bus Stations and Railway Stations HT-IV: Irrigation& CPWS HT-V: Railway Traction HT-VI: Townships & Residential Colonies HT-VII: Temporary
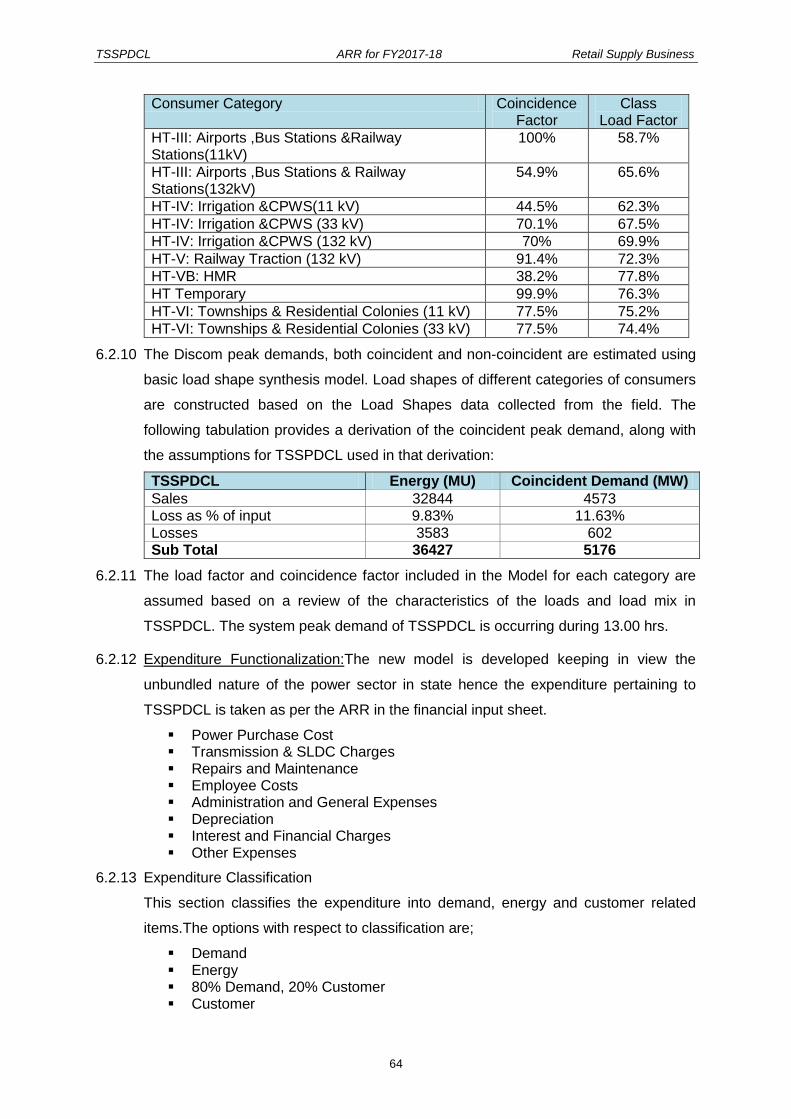
TSSPDCL ARR for FY2017-18 Retail Supply Business
64
Consumer Category Coincidence Factor
Class Load Factor
HT-III: Airports ,Bus Stations &Railway Stations(11kV)
100% 58.7%
HT-III: Airports ,Bus Stations & Railway Stations(132kV)
54.9% 65.6%
HT-IV: Irrigation &CPWS(11 kV) 44.5% 62.3%
HT-IV: Irrigation &CPWS (33 kV) 70.1% 67.5%
HT-IV: Irrigation &CPWS (132 kV) 70% 69.9%
HT-V: Railway Traction (132 kV) 91.4% 72.3%
HT-VB: HMR 38.2% 77.8%
HT Temporary 99.9% 76.3%
HT-VI: Townships & Residential Colonies (11 kV) 77.5% 75.2%
HT-VI: Townships & Residential Colonies (33 kV) 77.5% 74.4%
6.2.10 The Discom peak demands, both coincident and non-coincident are estimated using
basic load shape synthesis model. Load shapes of different categories of consumers
are constructed based on the Load Shapes data collected from the field. The
following tabulation provides a derivation of the coincident peak demand, along with
the assumptions for TSSPDCL used in that derivation:
TSSPDCL Energy (MU) Coincident Demand (MW)
Sales 32844 4573 Loss as % of input 9.83% 11.63%
Losses 3583 602 Sub Total 36427 5176
6.2.11 The load factor and coincidence factor included in the Model for each category are
assumed based on a review of the characteristics of the loads and load mix in
TSSPDCL. The system peak demand of TSSPDCL is occurring during 13.00 hrs.
6.2.12 Expenditure Functionalization:The new model is developed keeping in view the
unbundled nature of the power sector in state hence the expenditure pertaining to
TSSPDCL is taken as per the ARR in the financial input sheet.
Power Purchase Cost Transmission & SLDC Charges Repairs and Maintenance Employee Costs Administration and General Expenses Depreciation Interest and Financial Charges Other Expenses
6.2.13 Expenditure Classification
This section classifies the expenditure into demand, energy and customer related
items.The options with respect to classification are;
Demand Energy 80% Demand, 20% Customer Customer

TSSPDCL ARR for FY2017-18 Retail Supply Business
65
Manual Entry
6.2.14 The fixed costs in the power purchase are treated as demand related expense and
the variable cost of power purchase is treated as energy related expense.
6.2.15 Entire transmission cost is considered to be a demand related expense. The O & M
expenditure in distribution is classified into demand and customer related in the ratio
of 80:20. The same has been arrived at based on subjective judgment, as it is felt
that some portion of the assets and employee expenses are used for catering to the
needs of the customer such as customer service/call centers. The other cost
elements in distribution viz, ROCE, depreciation and other costs have been fully
considered under demand related costs.
6.2.16 Expenditure Allocation:The expenditures, which have been classified into, demand,
energy and consumer related are apportioned to the individual customer categories.
6.2.17 Power Purchase Cost Allocation:Demand related costs of Power Purchase are
primarily driven by the system peak. Hence they are allocated to customer categories
based on the Coincident Demand. Energy costs in Power Purchase are allocated
based on the loss-adjusted category energy Consumption.
6.2.18 Transmission Cost Allocation:The transmission costs (including PGCIL and ULDC)
are considered as demand related cost and the same is allocated to LT categories
based on Non-coincident demand and contracted demand (CMD) for HT categories
6.2.19 Distribution Cost Allocation:
a) Operation and Maintenance Expenditure: The demand related portion of O&M
expenses are allocated to LT consumer categories based on non -coincident
demand and contracted demand (CMD) for the HT consumer categories.The
customer related costs are allocated to customer categories based on the
number of customers in each category.
b) ROCE: Return on capital employed is driven by assets and it is fully
considered as demand related expense. ROCE is allocated to LT consumer
categories based on non -coincident demand and contracted capacity for the
HT consumer categories.
c) Depreciation: Depreciation expense is driven by the level of fixed assets in
the utility and is entirely considered under demand related expenses.
Depreciation is allocated to LT consumer categories based on non -coincident
demand and contracted capacity for the HT consumer categories.
d) Interest on Consumer Security Deposit: This is allocated to consumer
categories based on the energy Consumption grossed up for losses.

TSSPDCL ARR for FY2017-18 Retail Supply Business
66
6.2.20 Summaries of the results of the model are the outputs and these are discussed in the
next section and a comparison of revenues and costs by customers is made in this
part of the computation.
6.3 CoS Results
6.3.1 The following tabulation summarizes the results of the process:
TSSPDCL needs to handle 36427 MU excluding transmission losses, which
consist of sale of 32844 MU to its customers and losses of 3583 MU.
Coincident Peak demand required by TSSPDCL is 5176 MW, which consist
of 4573 MW to serve the customers, and 602 MW of losses in the system.
The average unit cost of supplying the customers of TSSPDCL is estimated
at Rs 6.71 /kWh.
The Licensee has estimated the CoS of HMR by assuming the load curve on
provisional basis. However, after the commencement of COD of HMR the
CoS will be submitted to the Hon‟ble Commission by taking the actual load
curves of HMR Traction.
6.3.2 Below Table shows the allocated expenditure for each category of service and Cost
of Service for each category.
Consumer Categories Sales in MU
Allocated Expenditure Rs. in crore
Cost of Service in
Rs. per kWh
Low Tension Supply
LT-I: Domestic 8,028.3 5,849.5 7.29
LT-II: Non-Domestic/Commercial 2,350.9 1,746.6 7.43
LT-III: Industry 858.1 647.9 7.55
LT-IV: Cottage Industries 10.1 6.5 6.41
LT-V: Agricultural 7,643.7 5,357.2 7.01
LT-VI: Street Lighting & PWS Schemes 747.0 485.7 6.50
LT-VII: General Purpose 70.6 47.1 6.68
LT-VIII: Temporary Supply 2.1 1.4 6.57
Total Low Tension Supply 19,711 14,142 7.17
High Tension Supply
HT-I: Industry (11 kV) 3,087.6 2,067.4 6.70
HT-I: Industry (33 kV) 4,154.7 2,335.6 5.62
HT-I: Industry (220/132 kV) 2,202.7 1,163.5 5.28
HT-IB: Ferro Alloys (132kV) 165.8 79.7 4.81
HT-II: Others (11 kV) 1,497.3 987.9 6.60
HT-II: Others (33 kV) 661.1 406.7 6.15
HT-II: Others (220/132 kV) 67.9 40.7 5.99
HT-III: Airports ,Bus Stations & Railway Stations (11kV)
6.1 4.1 6.65
HT-III: Airports ,Bus Stations & Railway Stations (132kV)
58.2 28.1 4.83
HT-IV: Irrigation & CPWS (11 kV) 48.2 30.2 6.26
HT-IV: Irrigation& CPWS (33 kV) 19.3 12.4 6.42
HT-IV: Irrigation & CPWS (132 kV) 831.2 529.1 6.37
HT-V: Railway Traction(132 kV) 147.2 94.7 6.43

TSSPDCL ARR for FY2017-18 Retail Supply Business
67
Consumer Categories Sales in MU
Allocated Expenditure Rs. in crore
Cost of Service in
Rs. per kWh
HT-V(B): HMR 18.7 15.1 8.11
HT-VI: Townships & Residential Colonies(11 kV) 88.6 54.8 6.18
HT-VI: Townships & Residential Colonies (33 kV) 45.1 29.1 6.46
HT Temporary 33.7 23.8 7.06
Total High Tension Supply 13,133 7,903 6.02
Total 32,844 22,045 6.71
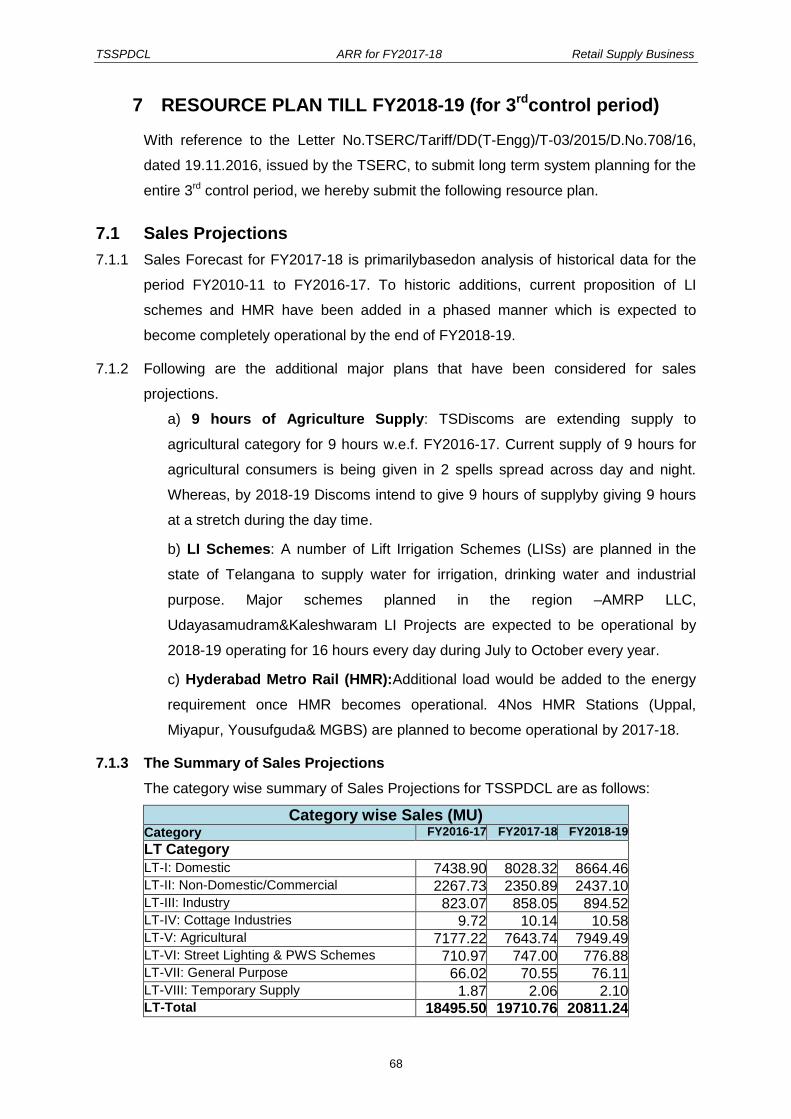
TSSPDCL ARR for FY2017-18 Retail Supply Business
68
7 RESOURCE PLAN TILL FY2018-19 (for 3rdcontrol period)
With reference to the Letter No.TSERC/Tariff/DD(T-Engg)/T-03/2015/D.No.708/16,
dated 19.11.2016, issued by the TSERC, to submit long term system planning for the
entire 3rd control period, we hereby submit the following resource plan.
7.1 Sales Projections
7.1.1 Sales Forecast for FY2017-18 is primarilybasedon analysis of historical data for the
period FY2010-11 to FY2016-17. To historic additions, current proposition of LI
schemes and HMR have been added in a phased manner which is expected to
become completely operational by the end of FY2018-19.
7.1.2 Following are the additional major plans that have been considered for sales
projections.
a) 9 hours of Agriculture Supply: TSDiscoms are extending supply to
agricultural category for 9 hours w.e.f. FY2016-17. Current supply of 9 hours for
agricultural consumers is being given in 2 spells spread across day and night.
Whereas, by 2018-19 Discoms intend to give 9 hours of supplyby giving 9 hours
at a stretch during the day time.
b) LI Schemes: A number of Lift Irrigation Schemes (LISs) are planned in the
state of Telangana to supply water for irrigation, drinking water and industrial
purpose. Major schemes planned in the region –AMRP LLC,
Udayasamudram&Kaleshwaram LI Projects are expected to be operational by
2018-19 operating for 16 hours every day during July to October every year.
c) Hyderabad Metro Rail (HMR):Additional load would be added to the energy
requirement once HMR becomes operational. 4Nos HMR Stations (Uppal,
Miyapur, Yousufguda& MGBS) are planned to become operational by 2017-18.
7.1.3 The Summary of Sales Projections
The category wise summary of Sales Projections for TSSPDCL are as follows:
Category wise Sales (MU) Category FY2016-17 FY2017-18 FY2018-19
LT Category
LT-I: Domestic 7438.90 8028.32 8664.46 LT-II: Non-Domestic/Commercial 2267.73 2350.89 2437.10 LT-III: Industry 823.07 858.05 894.52 LT-IV: Cottage Industries 9.72 10.14 10.58 LT-V: Agricultural 7177.22 7643.74 7949.49 LT-VI: Street Lighting & PWS Schemes 710.97 747.00 776.88 LT-VII: General Purpose 66.02 70.55 76.11 LT-VIII: Temporary Supply 1.87 2.06 2.10 LT-Total 18495.50 19710.76 20811.24

TSSPDCL ARR for FY2017-18 Retail Supply Business
69
Category wise Sales (MU) Category FY2016-17 FY2017-18 FY2018-19
HT Category HT-I(A): Industry-General 8309.62 9444.98 9822.77 HT-I(B): Ferro Alloy Units 151.94 165.81 180.93 HT-II: Others 2066.61 2226.31 2386.41 HT-III: Airports, Bus Stations and Railway Stations
62.62 64.29 66.01
HT-IV: Irrigation& CPWS 622.23 898.71 1998.80 HT-V(A):Railway Traction 141.98 147.22 150.17 HT-V(B): HMR 6.22 18.66 37.32 HT-VI: Townships & Residential Colonies 125.99 133.65 141.79 HT-VII Temporary Supply 32.99 33.65 34.33 HT-Total 11520.22 13133.28 14818.52 LT+HT-Total 30015.72 32844.04 35629.76
7.2 Energy Requirement Sales projections have been grossed up with the approved loss trajectory to compute
the Energy Requirement. Following table shows the energy requirement for the
control period.
Energy Requirement Particulars FY2016-17 FY2017-18 FY2018-19
LT Sales 18496 19711 20811
Annual LT Loss % 5.50 5.25 5.00
LT Loss (MU) 1076 1092 1095
11 kV Sales (MU) 4512 4761 4999
Energy Requirement at 11 kV level (MU) 25219 26741 26906
Annual 11 kV Loss % 4.50 4.40 4.25
11 kV loss (MU) 1135 1177 1194
33 kV Sales (MU) 4120 4880 5098
Energy Requirement at 33 kV level (MU) 30558 32935 33198
Annual 33 kV Loss % 3.99 3.99 3.99
33 kV losses (MU) 1219 1314 1380
132 kV Sales (MU) 2888 3492 4722
Energy Requirement at 132 kV level (MU) 33446 36427 39299
Cumulative Distribution Losses (MU) 3431 3583 3669
Cumulative Distribution Losses (%) 10.26 9.84 9.34
Cumulative Transmission loss (%) 5.62 5.22 5.09
Cumulative Transmission Losses (MU) 1990 2006 2107
Total Energy Requirement 35436 38433 41406
Total T & D loss (MU) 5421 5589 5776
T & D Loss % 15.30 14.54 13.95
Total Sales 30016 32844 35630
Total Energy Requirement 35436 38433 41406
7.3 Supply Projections To meet the energy requirement based on sales projections, state has planned
following capacity additions and other sources to meet the energy deficit.
State Plan:-
7.3.1 Genco Plants: For power supply projections, current plants of Capacity additions by
State Genco plants have been considered. Telangana State has planned Thermal
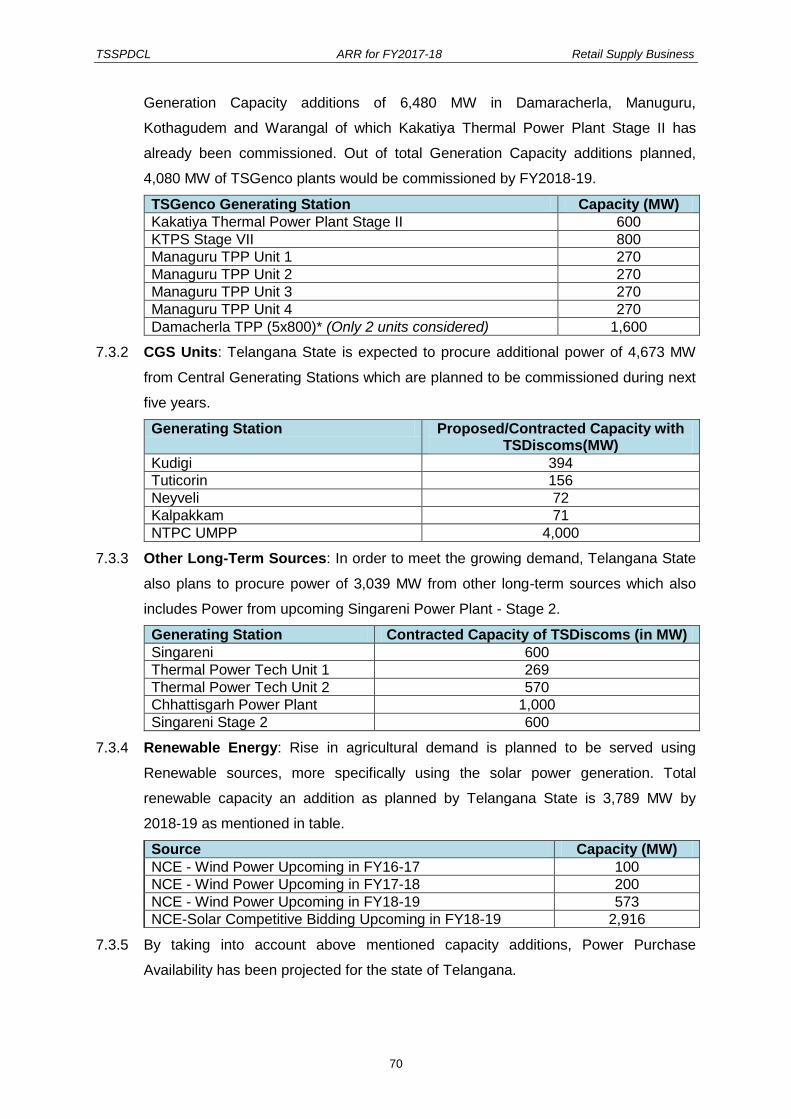
TSSPDCL ARR for FY2017-18 Retail Supply Business
70
Generation Capacity additions of 6,480 MW in Damaracherla, Manuguru,
Kothagudem and Warangal of which Kakatiya Thermal Power Plant Stage II has
already been commissioned. Out of total Generation Capacity additions planned,
4,080 MW of TSGenco plants would be commissioned by FY2018-19.
TSGenco Generating Station Capacity (MW)
Kakatiya Thermal Power Plant Stage II 600
KTPS Stage VII 800
Managuru TPP Unit 1 270
Managuru TPP Unit 2 270
Managuru TPP Unit 3 270
Managuru TPP Unit 4 270
Damacherla TPP (5x800)* (Only 2 units considered) 1,600
7.3.2 CGS Units: Telangana State is expected to procure additional power of 4,673 MW
from Central Generating Stations which are planned to be commissioned during next
five years.
Generating Station Proposed/Contracted Capacity with TSDiscoms(MW)
Kudigi 394
Tuticorin 156
Neyveli 72
Kalpakkam 71
NTPC UMPP 4,000
7.3.3 Other Long-Term Sources: In order to meet the growing demand, Telangana State
also plans to procure power of 3,039 MW from other long-term sources which also
includes Power from upcoming Singareni Power Plant - Stage 2.
Generating Station Contracted Capacity of TSDiscoms (in MW)
Singareni 600
Thermal Power Tech Unit 1 269
Thermal Power Tech Unit 2 570
Chhattisgarh Power Plant 1,000
Singareni Stage 2 600
7.3.4 Renewable Energy: Rise in agricultural demand is planned to be served using
Renewable sources, more specifically using the solar power generation. Total
renewable capacity an addition as planned by Telangana State is 3,789 MW by
2018-19 as mentioned in table.
Source Capacity (MW)
NCE - Wind Power Upcoming in FY16-17 100
NCE - Wind Power Upcoming in FY17-18 200
NCE - Wind Power Upcoming in FY18-19 573
NCE-Solar Competitive Bidding Upcoming in FY18-19 2,916
7.3.5 By taking into account above mentioned capacity additions, Power Purchase
Availability has been projected for the state of Telangana.

TSSPDCL ARR for FY2017-18 Retail Supply Business
71
Energy Availability projections from various sources (MU)
Period FY 15-16 FY 16-17 FY 17-18 FY 18-19
Thermal Power Stations 17,730 20,302 21,469 26,594
Hydel Power Stations 130 1,021 1,400 1,169
Total (Thermal and Hydel) 17,860 21,323 22,868 27,763
Central Generating Stations (CGS) 10,640 13,682 15,050 16,996
Gas Power Corporation Limited 132 68 92 56
IPPs 3,284 1,026 0 0
NCE 792 1,635 5,163 6,147
Others 17,739 9,415 20,106 19,821
Total (Without Market Purchase) 50,447 47,149 63,279 70,784
Availability from existing (Without Market Purchase)
32,975 45,860 52,907 32,575
Availability from upcoming 17,471 1289 10,372 38,209
Market Purchases 1,964 12,302 2,797 -
Grand Total 52,410 59,451 66,076 70,784
7.4 Distribution Plan
7.4.1 To achieve the objective of ensuring 24x7 power to all consumers and proposed
increase in number of hours of supply to agricultural consumers, the state has
planned significant investments under various schemes. Investments are planned
across various aspects of distribution infrastructure improvement including (a) load
growth and network strengthening (b) technology upgradation, renovation and
modernization schemes (c) measures for bringing down AT&C losses, and (d)
Demand Side Management (DSM) measures and (e) Other expenditure towards
general network improvement.
7.4.2 Investments can be broadly categorized as follows:
1. Regular distribution infrastructure works i.e,. Business-As-Usual investments;
2. Dedicated investments for ensuring 24x7 power supply to rural consumers
under the DeenDayalUpadhyay Gram JyotiYojna (DDUGJY) scheme;
3. Dedicated investments for ensuring 24x7 power supply to urban consumers
under the Integrated Power Development Scheme (IPDS);
7.4.3 Base Capex Network Additions: Summary of Infrastructure additions for the
balance years of 3rd control period is as given below:
Category Units FY2016-17 FY2017-18 FY2018-19
SS unit additions Nos 144 133 137
PTR additions Nos 450 443 444
Feeder Additions Km 30,381 30,899 29,457
DTR additions Nos 39,000 37,330 35,678
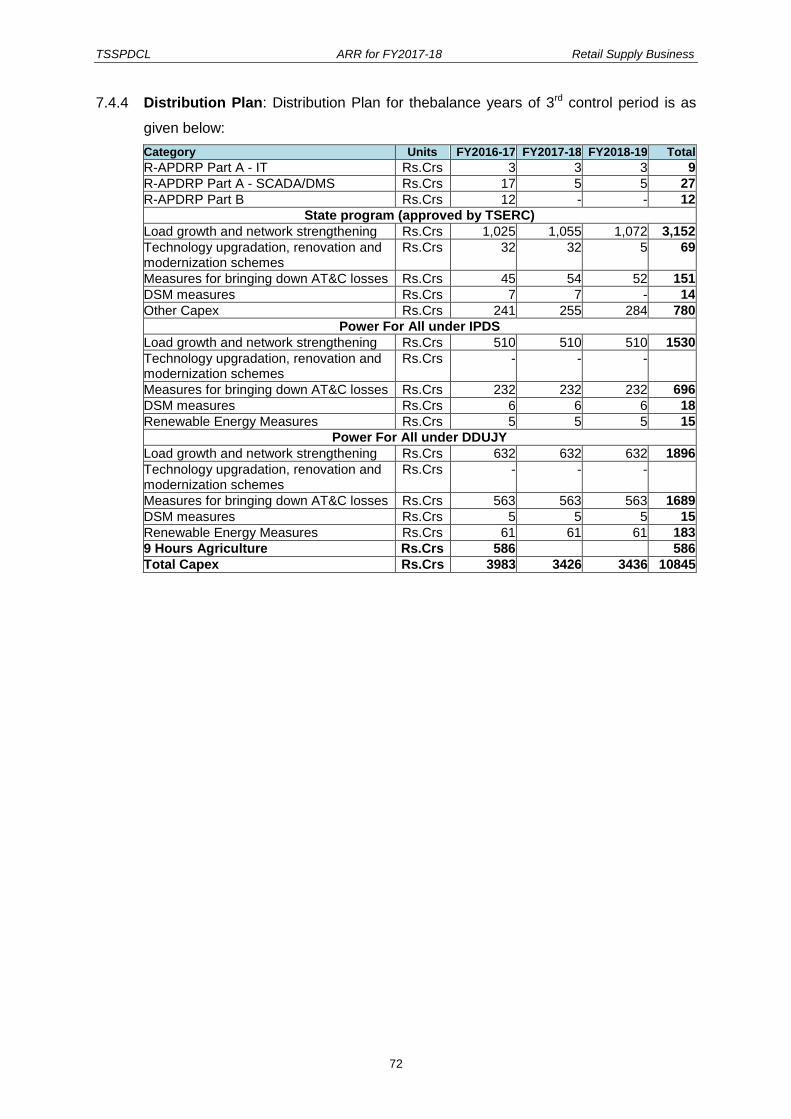
TSSPDCL ARR for FY2017-18 Retail Supply Business
72
7.4.4 Distribution Plan: Distribution Plan for thebalance years of 3rd control period is as
given below:
Category Units FY2016-17 FY2017-18 FY2018-19 Total
R-APDRP Part A - IT Rs.Crs 3 3 3 9
R-APDRP Part A - SCADA/DMS Rs.Crs 17 5 5 27
R-APDRP Part B Rs.Crs 12 - - 12
State program (approved by TSERC)
Load growth and network strengthening Rs.Crs 1,025 1,055 1,072 3,152
Technology upgradation, renovation and modernization schemes
Rs.Crs 32 32 5 69
Measures for bringing down AT&C losses Rs.Crs 45 54 52 151
DSM measures Rs.Crs 7 7 - 14
Other Capex Rs.Crs 241 255 284 780
Power For All under IPDS
Load growth and network strengthening Rs.Crs 510 510 510 1530
Technology upgradation, renovation and modernization schemes
Rs.Crs - - -
Measures for bringing down AT&C losses Rs.Crs 232 232 232 696
DSM measures Rs.Crs 6 6 6 18
Renewable Energy Measures Rs.Crs 5 5 5 15
Power For All under DDUJY
Load growth and network strengthening Rs.Crs 632 632 632 1896
Technology upgradation, renovation and modernization schemes
Rs.Crs - - -
Measures for bringing down AT&C losses Rs.Crs 563 563 563 1689
DSM measures Rs.Crs 5 5 5 15
Renewable Energy Measures Rs.Crs 61 61 61 183
9 Hours Agriculture Rs.Crs 586 586
Total Capex Rs.Crs 3983 3426 3436 10845
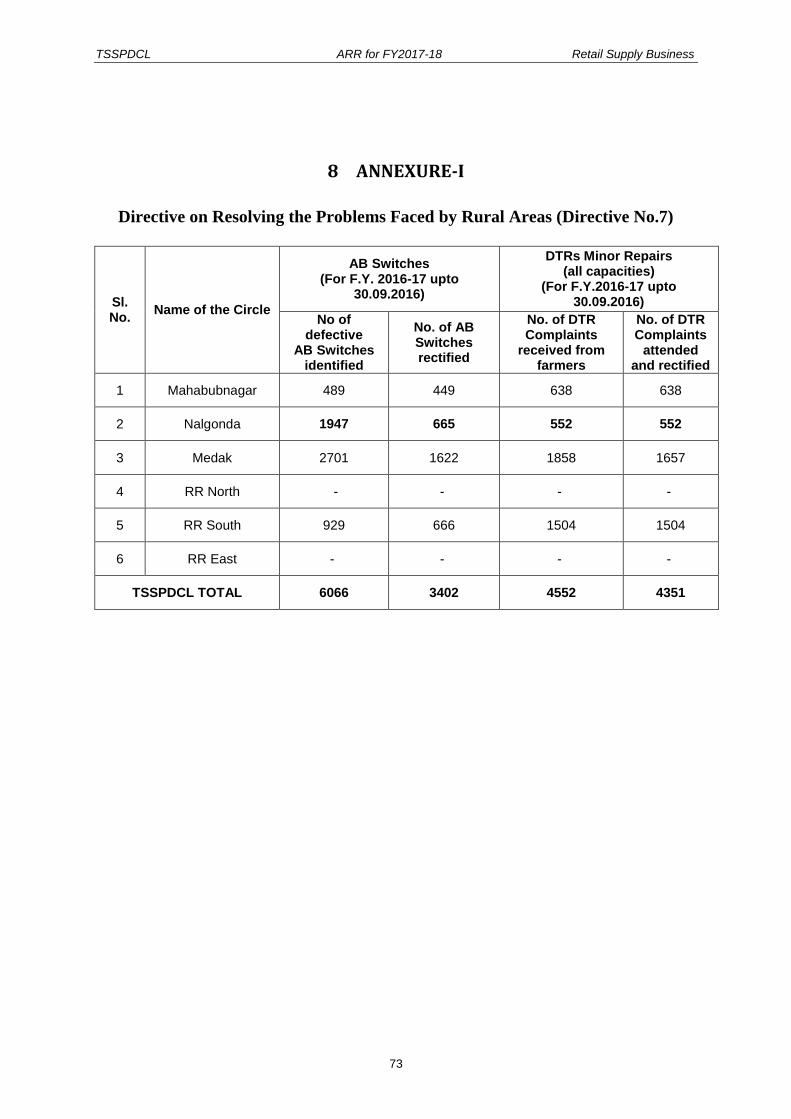
TSSPDCL ARR for FY2017-18 Retail Supply Business
73
8 ANNEXURE-I
Directive on Resolving the Problems Faced by Rural Areas (Directive No.7)
Sl. No.
Name of the Circle
AB Switches (For F.Y. 2016-17 upto
30.09.2016)
DTRs Minor Repairs (all capacities)
(For F.Y.2016-17 upto 30.09.2016)
No of defective
AB Switches identified
No. of AB Switches rectified
No. of DTR Complaints
received from farmers
No. of DTR Complaints
attended and rectified
1 Mahabubnagar 489 449 638 638
2 Nalgonda 1947 665 552 552
3 Medak 2701 1622 1858 1657
4 RR North - - - -
5 RR South 929 666 1504 1504
6 RR East - - - -
TSSPDCL TOTAL 6066 3402 4552 4351
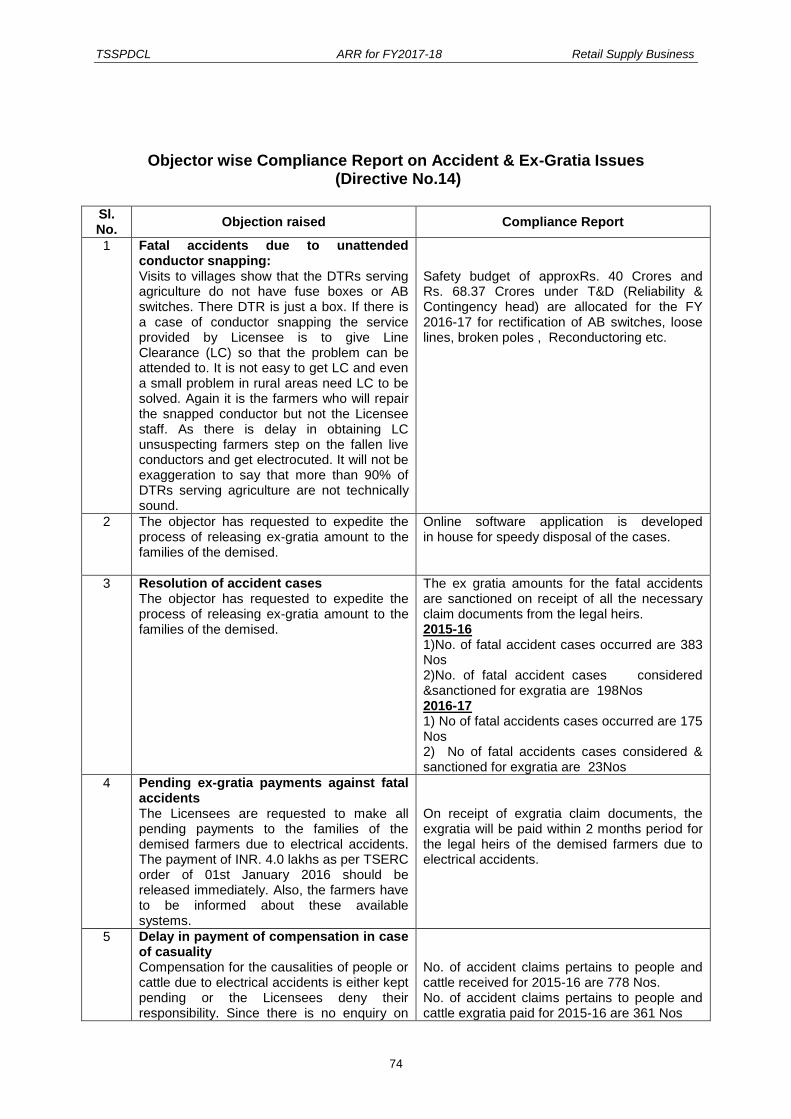
TSSPDCL ARR for FY2017-18 Retail Supply Business
74
Objector wise Compliance Report on Accident & Ex-Gratia Issues
(Directive No.14)
Sl. No.
Objection raised Compliance Report
1 Fatal accidents due to unattended conductor snapping: Visits to villages show that the DTRs serving agriculture do not have fuse boxes or AB switches. There DTR is just a box. If there is a case of conductor snapping the service provided by Licensee is to give Line Clearance (LC) so that the problem can be attended to. It is not easy to get LC and even a small problem in rural areas need LC to be solved. Again it is the farmers who will repair the snapped conductor but not the Licensee staff. As there is delay in obtaining LC unsuspecting farmers step on the fallen live conductors and get electrocuted. It will not be exaggeration to say that more than 90% of DTRs serving agriculture are not technically sound.
Safety budget of approxRs. 40 Crores and Rs. 68.37 Crores under T&D (Reliability & Contingency head) are allocated for the FY 2016-17 for rectification of AB switches, loose lines, broken poles , Reconductoring etc.
2 The objector has requested to expedite the process of releasing ex-gratia amount to the families of the demised.
Online software application is developed in house for speedy disposal of the cases.
3 Resolution of accident cases The objector has requested to expedite the process of releasing ex-gratia amount to the families of the demised.
The ex gratia amounts for the fatal accidents are sanctioned on receipt of all the necessary claim documents from the legal heirs. 2015-16 1)No. of fatal accident cases occurred are 383 Nos 2)No. of fatal accident cases considered &sanctioned for exgratia are 198Nos 2016-17 1) No of fatal accidents cases occurred are 175 Nos 2) No of fatal accidents cases considered & sanctioned for exgratia are 23Nos
4 Pending ex-gratia payments against fatal accidents The Licensees are requested to make all pending payments to the families of the demised farmers due to electrical accidents. The payment of INR. 4.0 lakhs as per TSERC order of 01st January 2016 should be released immediately. Also, the farmers have to be informed about these available systems.
On receipt of exgratia claim documents, the exgratia will be paid within 2 months period for the legal heirs of the demised farmers due to electrical accidents.
5 Delay in payment of compensation in case of casuality Compensation for the causalities of people or cattle due to electrical accidents is either kept pending or the Licensees deny their responsibility. Since there is no enquiry on
No. of accident claims pertains to people and cattle received for 2015-16 are 778 Nos. No. of accident claims pertains to people and cattle exgratia paid for 2015-16 are 361 Nos
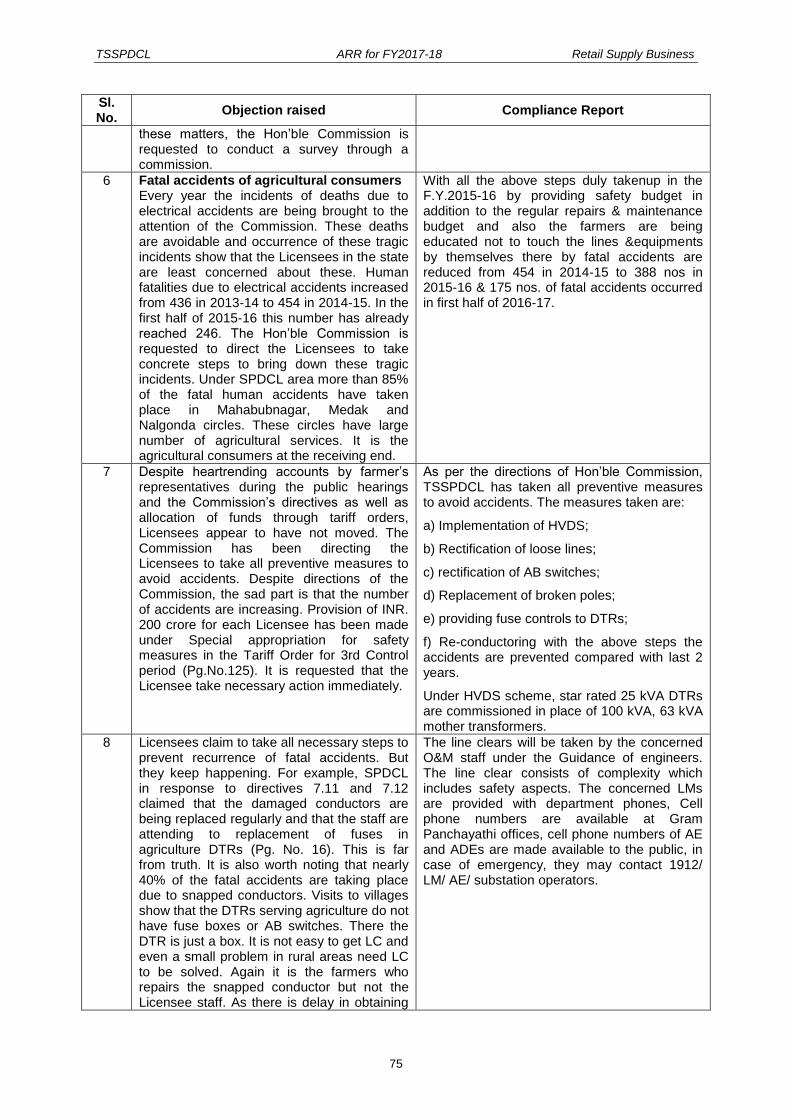
TSSPDCL ARR for FY2017-18 Retail Supply Business
75
Sl. No.
Objection raised Compliance Report
these matters, the Hon‟ble Commission is requested to conduct a survey through a commission.
6 Fatal accidents of agricultural consumers Every year the incidents of deaths due to electrical accidents are being brought to the attention of the Commission. These deaths are avoidable and occurrence of these tragic incidents show that the Licensees in the state are least concerned about these. Human fatalities due to electrical accidents increased from 436 in 2013-14 to 454 in 2014-15. In the first half of 2015-16 this number has already reached 246. The Hon‟ble Commission is requested to direct the Licensees to take concrete steps to bring down these tragic incidents. Under SPDCL area more than 85% of the fatal human accidents have taken place in Mahabubnagar, Medak and Nalgonda circles. These circles have large number of agricultural services. It is the agricultural consumers at the receiving end.
With all the above steps duly takenup in the F.Y.2015-16 by providing safety budget in addition to the regular repairs & maintenance budget and also the farmers are being educated not to touch the lines &equipments by themselves there by fatal accidents are reduced from 454 in 2014-15 to 388 nos in 2015-16 & 175 nos. of fatal accidents occurred in first half of 2016-17.
7 Despite heartrending accounts by farmer‟s representatives during the public hearings and the Commission‟s directives as well as allocation of funds through tariff orders, Licensees appear to have not moved. The Commission has been directing the Licensees to take all preventive measures to avoid accidents. Despite directions of the Commission, the sad part is that the number of accidents are increasing. Provision of INR. 200 crore for each Licensee has been made under Special appropriation for safety measures in the Tariff Order for 3rd Control period (Pg.No.125). It is requested that the Licensee take necessary action immediately.
As per the directions of Hon‟ble Commission, TSSPDCL has taken all preventive measures to avoid accidents. The measures taken are:
a) Implementation of HVDS;
b) Rectification of loose lines;
c) rectification of AB switches;
d) Replacement of broken poles;
e) providing fuse controls to DTRs;
f) Re-conductoring with the above steps the accidents are prevented compared with last 2 years.
Under HVDS scheme, star rated 25 kVA DTRs are commissioned in place of 100 kVA, 63 kVA mother transformers.
8 Licensees claim to take all necessary steps to prevent recurrence of fatal accidents. But they keep happening. For example, SPDCL in response to directives 7.11 and 7.12 claimed that the damaged conductors are being replaced regularly and that the staff are attending to replacement of fuses in agriculture DTRs (Pg. No. 16). This is far from truth. It is also worth noting that nearly 40% of the fatal accidents are taking place due to snapped conductors. Visits to villages show that the DTRs serving agriculture do not have fuse boxes or AB switches. There the DTR is just a box. It is not easy to get LC and even a small problem in rural areas need LC to be solved. Again it is the farmers who repairs the snapped conductor but not the Licensee staff. As there is delay in obtaining
The line clears will be taken by the concerned O&M staff under the Guidance of engineers. The line clear consists of complexity which includes safety aspects. The concerned LMs are provided with department phones, Cell phone numbers are available at Gram Panchayathi offices, cell phone numbers of AE and ADEs are made available to the public, in case of emergency, they may contact 1912/ LM/ AE/ substation operators.

TSSPDCL ARR for FY2017-18 Retail Supply Business
76
Sl. No.
Objection raised Compliance Report
LC unsuspecting farmers step on the fallen live conductors and get electrocuted. It will not be exaggeration to say that more than 90% of DTRs serving agriculture are not technically sound.
9 Request for report on accidents promised during prior hearing During the public hearing on tariff proposals for the year 2015-16 CMD of SPDCL assured to conduct a study on these electrical accidents. In case the study the objector requested the Commission to direct SPDCL to share the report with the public.
As per the directions of the Hon‟ble Commission, TSSPDCL has taken all preventive measures to avoid accidents. The measures taken are a) Implementation of HVDS, b) Rectification of loose lines c) rectification of AB switches, d) Replacement of broken poles, e) providing fuse controls to DTRs f) Re-conductoring with the above steps the accidents are prevented compared with last 2 years. The line clears will be taken by the concerned O&M staff under the Guidance of engineers. The line clear consists of complexity which includes safety aspects. The concerned LMs are provided with department phones, Cell phone numbers are available at Gram Panchayati offices, cell phone numbers of AE and ADEs are made available to the public, in case of emergency, they may contact 1912/ LM/AE/Substation operators. Under HVDS scheme, star rated 25 kVA DTRs are commissioned in place of 100 kVA, 63 kVA mother transformers. Safety budget of approx 40 Croresand Rs. 68.37 Crores under T&D (Reliability & Contingency head) are allocated for the FY 2016-17 for rectification of AB switches loose lines, broken poles, Reconductoring.

TSSPDCL ARR for FY2017-18 Retail Supply Business
77
Reply to Directive No.17:
TSSPDCL is granting Open Access to the applicants duly complying with the following Regulations and subsequent amendments thereof notified by the Commission. Inter-State Open Access
CEA (Installation and Operation of Meters) Regulations, 2006
CERC (Open Access in inter-State Transmission) Regulations, 2008
CERC (Grant of Connectivity, Long-term Access and Medium-term Open Access in inter-State Transmission and related matters ) Regulations, 2009
CERC (Indian Electricity Grid Code) Regulations, 2010
CERC (Deviation Settlement Mechanism and Related Matters) Regulations, 2014
Intra-State Open Access
APERC (Terms and Conditions of Open Access) Regulation No.2 of 2005
APERC (Interim Balancing and Settlement Code) Regulation No.2 of 2006
The following are the Nodal Agencies for Open Access transactions as stipulated in the relevant Regulations. Open Access Transactions Nodal Agency
Bilateral Transactions Inter State Long Term/Short Term Open Access
Regional Load Despatch Centre of the region where point of drawal of electricity is situated. (SRLDC)
Collective Transactions Inter State Long Term/Short Term Open Access
National Load Despatch Centre (NLDC)
Intra State Long Term Open Access
State Transmission Utility (STU) viz., TSTransco
Intra State Short Term Open Access
State Load Despatch Center (TSSLDC). The SLDC shall, however allow STOA transactions only after consulting the concerned transmission and/or distribution licensee(s) whose network(s) would be used for such transactions
TSSPDCL using its login facility to the SLDC/TSTransco software application [where
consumers are applying for NOC of SLDC for procuring power through power exchanges
(IEX)] is issuing online clearances (technical feasibilities) to the Inter-State Short Term Open
Access consumers for availing power through Power Exchanges duly verifying and ensuring
the technical details from field that a) the open access demand is well within the CMD; b)
ABT compatible metering facilities as per CEA (Installation and Operation of Meters)
Regulations, 2006 and tested by NABL accredited laboratory, etc.; and c) ensuring UI dues
are Nil.
TSSPDCL is allowing the capacity for transmission and/or wheeling to open access
consumer limiting to the Contracted Maximum Demand (CMD) entered with the Discom to
maintain grid discipline and grid security. TSSPDCL is providing quality and uninterrupted
power and also maintaining an efficient, co-ordinated and economical distribution system in
its area of supply in accordance with the provisions of the Electricity Act, 2003.
The month-wise Inter State STOA transactions cleared by TSSPDCL are as given below:
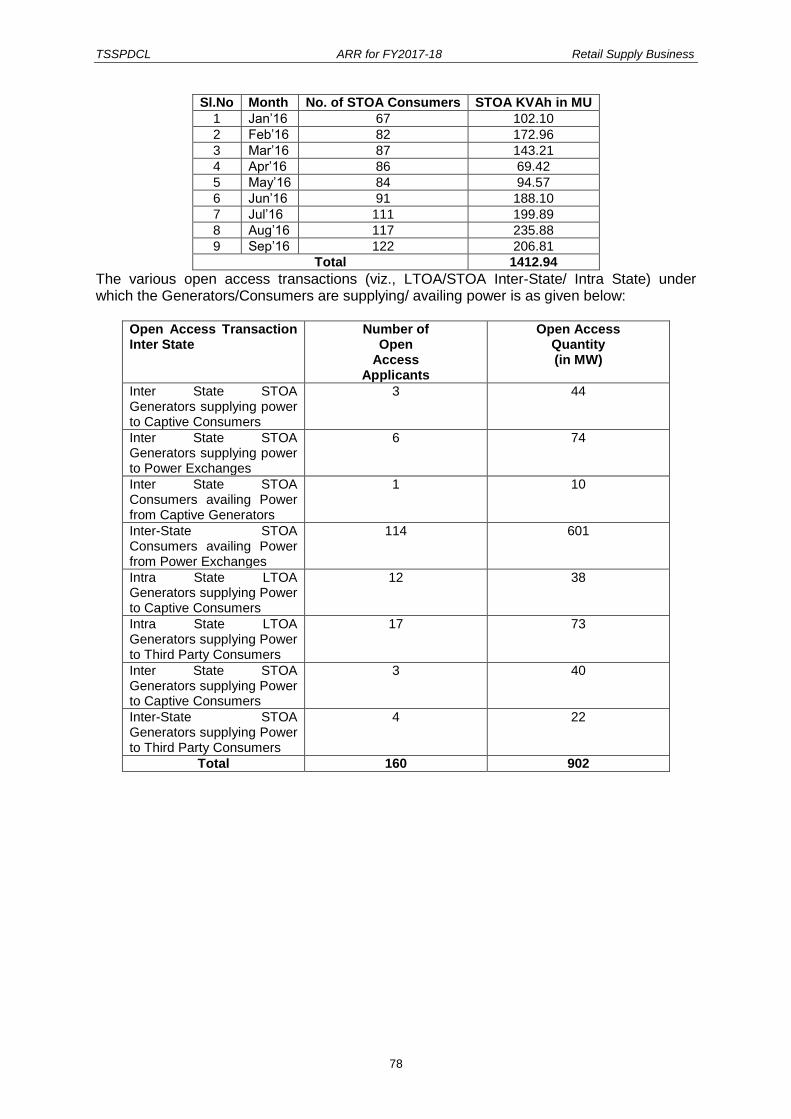
TSSPDCL ARR for FY2017-18 Retail Supply Business
78
Sl.No Month No. of STOA Consumers STOA KVAh in MU
1 Jan‟16 67 102.10
2 Feb‟16 82 172.96
3 Mar‟16 87 143.21
4 Apr‟16 86 69.42
5 May‟16 84 94.57
6 Jun‟16 91 188.10
7 Jul‟16 111 199.89
8 Aug‟16 117 235.88
9 Sep‟16 122 206.81
Total 1412.94
The various open access transactions (viz., LTOA/STOA Inter-State/ Intra State) under which the Generators/Consumers are supplying/ availing power is as given below:
Open Access Transaction Inter State
Number of Open
Access Applicants
Open Access Quantity (in MW)
Inter State STOA Generators supplying power to Captive Consumers
3 44
Inter State STOA Generators supplying power to Power Exchanges
6 74
Inter State STOA Consumers availing Power from Captive Generators
1 10
Inter-State STOA Consumers availing Power from Power Exchanges
114 601
Intra State LTOA Generators supplying Power to Captive Consumers
12 38
Intra State LTOA Generators supplying Power to Third Party Consumers
17 73
Inter State STOA Generators supplying Power to Captive Consumers
3 40
Inter-State STOA Generators supplying Power to Third Party Consumers
4 22
Total 160 902
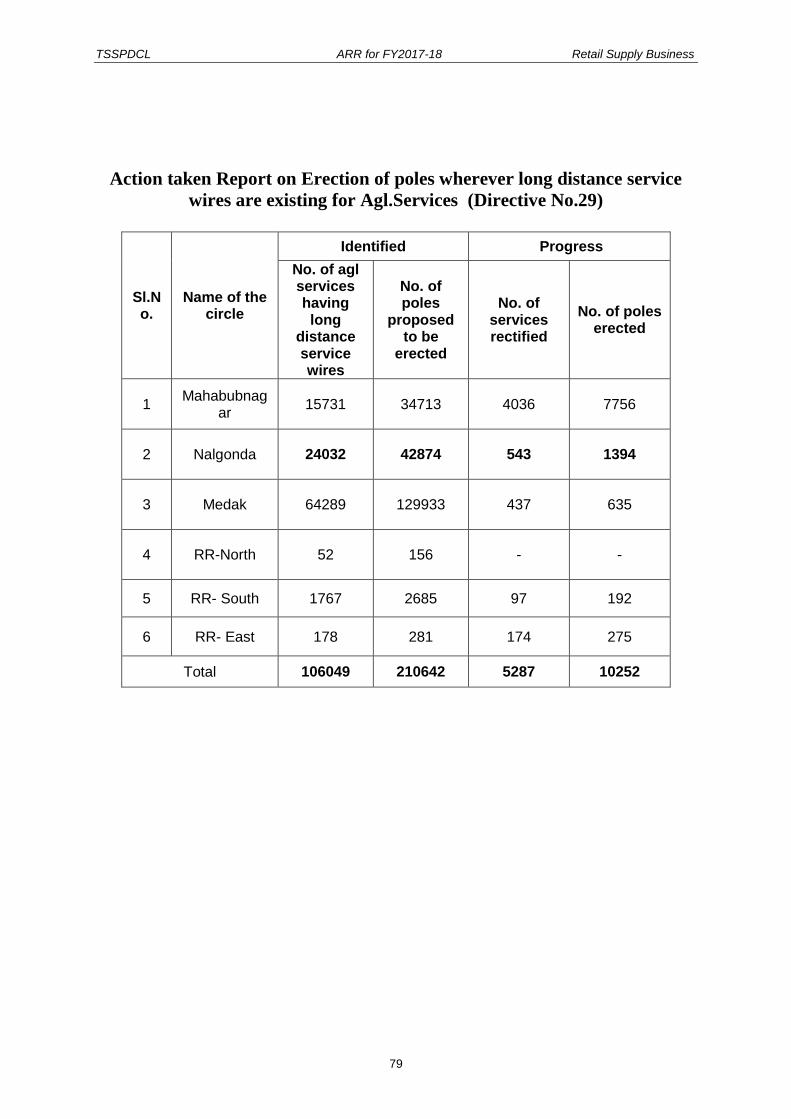
TSSPDCL ARR for FY2017-18 Retail Supply Business
79
Action taken Report on Erection of poles wherever long distance service
wires are existing for Agl.Services (Directive No.29)
Sl.No.
Name of the circle
Identified Progress
No. of agl services having long
distance service wires
No. of poles
proposed to be
erected
No. of services rectified
No. of poles erected
1 Mahabubnag
ar 15731 34713 4036 7756
2 Nalgonda 24032 42874 543 1394
3 Medak 64289 129933 437 635
4 RR-North 52 156 - -
5 RR- South 1767 2685 97 192
6 RR- East 178 281 174 275
Total 106049 210642 5287 10252

TSSPDCL ARR for FY2017-18 Retail Supply Business
80
Action Plan for Rectification of loose lines, unguarded lines, road crossings
(Directive No.33)
Sl. No.
Name of the Circle
No. of
identified
Action plan for rectification
Sep'16
Oct'16
Nov'16
Dec'16
Jan'17
Feb'17
Mar'17
1 Mahabubnaga
r
Loose lines
4193 600 599 601 598 603 597 595
Unguarded lines
412 65 60 66 55 52 50 64
Stay wires
138 20 19 17 18 18 17 29
Road Crossin
gs 708 100 98 95 101 111 95 108
2 Nalgonda
Loose lines
24358
3510 3200 3420 3402 3330 3430 4066
Unguarded lines 36 5 6 5 5 5 5 5
Stay wires 3324 475 450 500 455 490 480 474
Road Crossin
gs 1238 178 190 150 162 153 180 225
3 Medak
Loose lines 773 111 104 108 109 122 101 118
Unguarded lines 45 5 9 7 8 6 5 5
Stay wires
186 27 26 25 24 30 32 22
Road Crossin
gs 319 45 54 60 41 40 42 37
4 RR North
Loose lines
6 6 0 0 0 0 0 0
Unguarded lines
0 0 0 0 0 0 0 0
Staywires
0 0 0 0 0 0 0 0
Road Crossin
gs 5 5 0 0 0 0 0 0
5 RR South
Loose lines
4896 699 700 630 720 666 702 779
Unguarded lines
302 43 41 45 54 32 30 57
Staywires 541 77 63 72 75 70 79 105

TSSPDCL ARR for FY2017-18 Retail Supply Business
81
Sl. No.
Name of the Circle
No. of
identified
Action plan for rectification
Sep'16
Oct'16
Nov'16
Dec'16
Jan'17
Feb'17
Mar'17
Road Crossin
gs 840 120 120 120 120 120 120 120
6 RR East
Loose lines 1342 191 201 190 180 194 181 205
Unguarded lines 21 3 3 3 3 3 3 3
Staywires
43 6 7 6 6 6 6 6
Road Crossin
gs 21 3 3 3 3 3 3 3
7 Hyd-North
Loose lines
18 9 9 9 0 0 0 0
Unguarded lines
30 7 3 4 5 3 4 4
Staywires
1 1 0 0 0 0 0 0
Road Crossin
gs 30 5 4 3 4 3 4 7
8 Hyd South
Loose lines
36 5 5 5 5 5 5 6
Unguarded lines
70 10 10 10 10 10 10 10
Staywires 0 0 0 0 0 0 0 0
Road Crossin
gs 70 10 10 10 10 10 10 10
9 HydCental
Loose lines 123 18 19 20 17 16 15 18
Unguarded lines
0 0 0 0 0 0 0 0
Staywires
0 0 0 0 0 0 0 0
Road Crossin
gs 4 4 0 0 0 0 0 0
TSSPDCL TOTAL:
Loose lines
35745
5000 5040 5103 5022 5202 5220 5158
Unguarded lines
916 130 131 122 104 105 153 171
Staywires
4233 603 630 590 604 608 612 586
Road Crossin
gs 3235 462 450 490 441 465 462 465
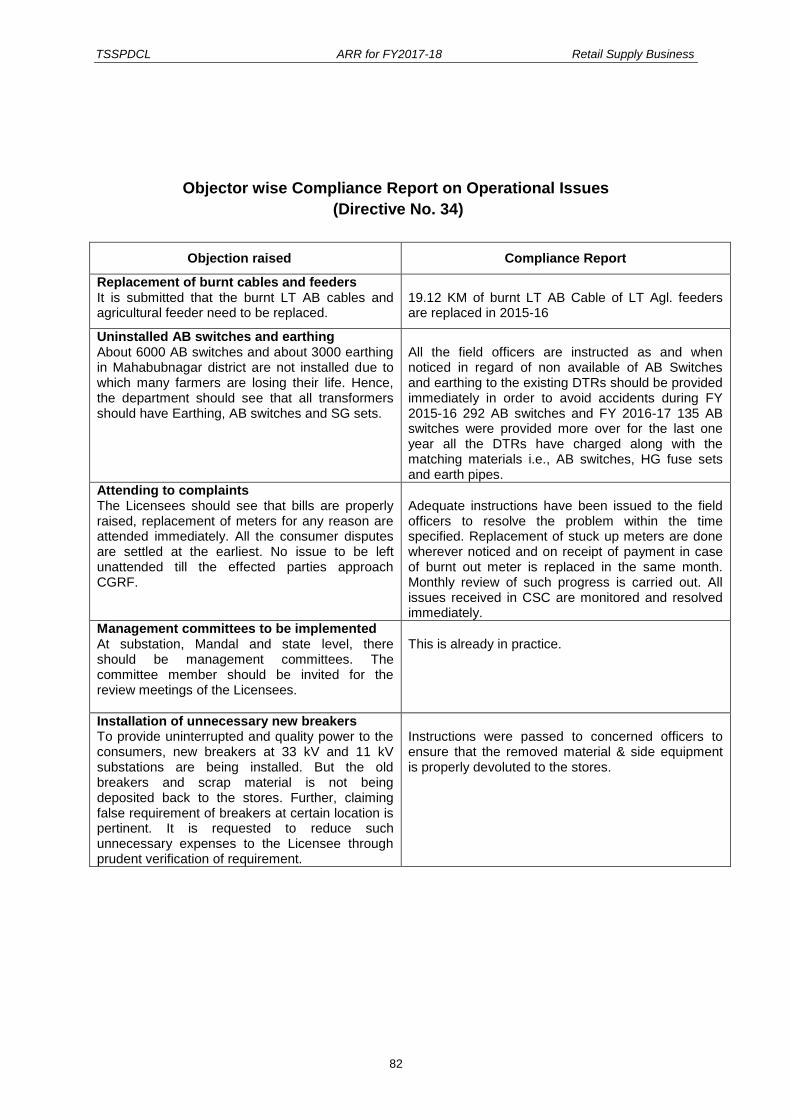
TSSPDCL ARR for FY2017-18 Retail Supply Business
82
Objector wise Compliance Report on Operational Issues
(Directive No. 34)
Objection raised Compliance Report
Replacement of burnt cables and feeders It is submitted that the burnt LT AB cables and agricultural feeder need to be replaced.
19.12 KM of burnt LT AB Cable of LT Agl. feeders are replaced in 2015-16
Uninstalled AB switches and earthing About 6000 AB switches and about 3000 earthing in Mahabubnagar district are not installed due to which many farmers are losing their life. Hence, the department should see that all transformers should have Earthing, AB switches and SG sets.
All the field officers are instructed as and when noticed in regard of non available of AB Switches and earthing to the existing DTRs should be provided immediately in order to avoid accidents during FY 2015-16 292 AB switches and FY 2016-17 135 AB switches were provided more over for the last one year all the DTRs have charged along with the matching materials i.e., AB switches, HG fuse sets and earth pipes.
Attending to complaints The Licensees should see that bills are properly raised, replacement of meters for any reason are attended immediately. All the consumer disputes are settled at the earliest. No issue to be left unattended till the effected parties approach CGRF.
Adequate instructions have been issued to the field officers to resolve the problem within the time specified. Replacement of stuck up meters are done wherever noticed and on receipt of payment in case of burnt out meter is replaced in the same month. Monthly review of such progress is carried out. All issues received in CSC are monitored and resolved immediately.
Management committees to be implemented At substation, Mandal and state level, there should be management committees. The committee member should be invited for the review meetings of the Licensees.
This is already in practice.
Installation of unnecessary new breakers To provide uninterrupted and quality power to the consumers, new breakers at 33 kV and 11 kV substations are being installed. But the old breakers and scrap material is not being deposited back to the stores. Further, claiming false requirement of breakers at certain location is pertinent. It is requested to reduce such unnecessary expenses to the Licensee through prudent verification of requirement.
Instructions were passed to concerned officers to ensure that the removed material & side equipment is properly devoluted to the stores.
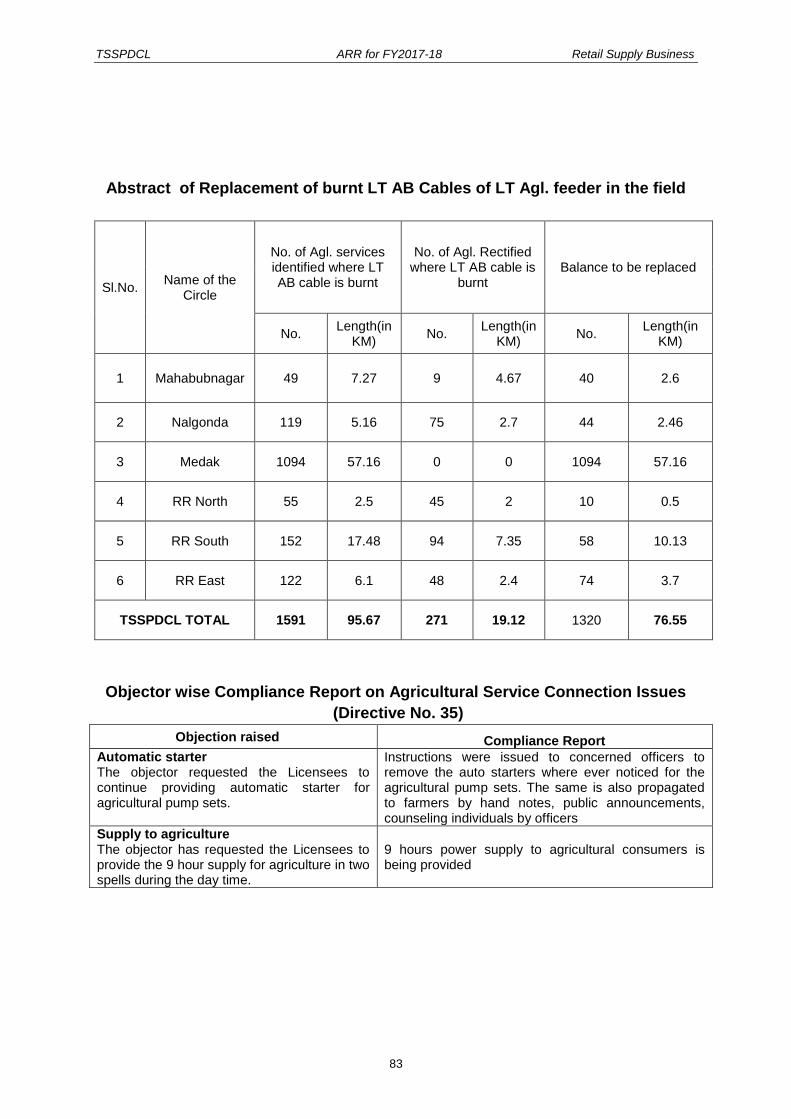
TSSPDCL ARR for FY2017-18 Retail Supply Business
83
Abstract of Replacement of burnt LT AB Cables of LT Agl. feeder in the field
Sl.No. Name of the
Circle
No. of Agl. services identified where LT AB cable is burnt
No. of Agl. Rectified where LT AB cable is
burnt Balance to be replaced
No. Length(in
KM) No.
Length(in KM)
No. Length(in
KM)
1 Mahabubnagar 49 7.27 9 4.67 40 2.6
2 Nalgonda 119 5.16 75 2.7 44 2.46
3 Medak 1094 57.16 0 0 1094 57.16
4 RR North 55 2.5 45 2 10 0.5
5 RR South 152 17.48 94 7.35 58 10.13
6 RR East 122 6.1 48 2.4 74 3.7
TSSPDCL TOTAL 1591 95.67 271 19.12 1320 76.55
Objector wise Compliance Report on Agricultural Service Connection Issues
(Directive No. 35)
Objection raised Compliance Report
Automatic starter The objector requested the Licensees to continue providing automatic starter for agricultural pump sets.
Instructions were issued to concerned officers to remove the auto starters where ever noticed for the agricultural pump sets. The same is also propagated to farmers by hand notes, public announcements, counseling individuals by officers
Supply to agriculture The objector has requested the Licensees to provide the 9 hour supply for agriculture in two spells during the day time.
9 hours power supply to agricultural consumers is being provided

TSSPDCL ARR for FY2017-18 Retail Supply Business
84
9 ANNEXURE- II
PERFORMANCE REPORTS

Index
TSSPDCL
30-11-2016
Multi Year Tariff Period FY 2014-2019
FY 2017-18
Performance Reports
1 Compensation paid by the Licensee to Consumers for deficiency of Service as per the Regulations of the Comm Form 1
2 Details of electrical accidents occurred during previous year and current year Form 2
3 Replacement of burnt Distribution Transformers (DTRs) and Installation of Additional DTRs Form 3
4 Statement showing Cirlce-wise, Category-wise Replacement of Burnt-out Meters Form 4(a)
5 Statement showing Cirlce-wise, Category-wise Replacement of Stuck-up Meters Form 4(b)
6 Performance with regard to attending to Fuse-off Calls (FOC) Form 5
7 Breakdowns in power supply to urban and rural consumers (circle-wise) and time taken for restoration Form 6(a)
8 Interruptions in power supply to urban and rural consumers (circle-wise) and time taken for restoration Form 6(b)
9 Frequency Profile of Southern Region (SR) Grid Form 7
10 Pending Service Connections applications of different categories of consumers Form 8(a)
11 Number of Service Connections released to different categories of consumers Form 8(b)
12 Arrears of consumers over Rs.50,000 pending for over six months Form 9(a)
13 Details of Bad Debts Written-off during FY2014-15 Form 9(b)
14 Court cases involing the Licensee and steps being taken to resolve them Form 10
15 Number of cases filed in respect of pilferage of power in various categories giving comparative picture with previ Form 11
S. No. Title Form No.
Company Name
Filing Date (dd/mm/yy)
Year of ARR filing
Data Type

Nos. Amount Nos. Amount Nos. Amount Nos. Amount Nos. Amount Nos. Amount Nos. Amount Nos. Amount Nos. Amount
1 Hyderabad (Central) 2 18800 1 200 3 19000
2 Hyderabad (North) 2 20000 1 100 1 50000 4 70100
3 Hyderabad (South) 2 65650 2 30700 1 36000 5 132350
4 Mahabubnagar 2 108600 1 95100 3 203700
5 Medak & Siddipet 1 20450 1 20450
6 Nalgonda 1 45300 1 45300
7 Rangareddy (East) 1 100 1 100 2 200
8 Rangareddy (North) 1 9850 1 20000 1 500 3 30350
9 Rangareddy (South) 5 76550 1 6200 3 46900 1 25000 10 154650
2 65650 14 176450 0 0 2 6300 7 211500 0 0 2 140400 5 75800 32 676100
1 Hyderabad (Central) 1 13400 1 13400
2 Hyderabad (North) 0 0
3 Hyderabad (South) 0 0
4 Mahabubnagar 0 0
5 Medak & Siddipet 0 0
6 Nalgonda 1 25,600 1 25600
7 Rangareddy (East) 1 25000 1 25000
8 Rangareddy (North) 0 0
9 Rangareddy (South) 0 0
0 0 2 38400 0 0 1 25600 0 0 0 0 0 0 0 0 3 64000
During FY2015-16
TSSPDCL Total
During H1 of FY2016-17
TSSPDCL Total
Wrong billingMeter
Complaints
Circle
Format - 1
Compensation paid by the Licensee to Consumers for deficiency of Service as per the Regulations of the Commission
Sl.
No.
TotalOthers O&MTitle ChangeNew
Connections
Release
Category
Change
Back Billing
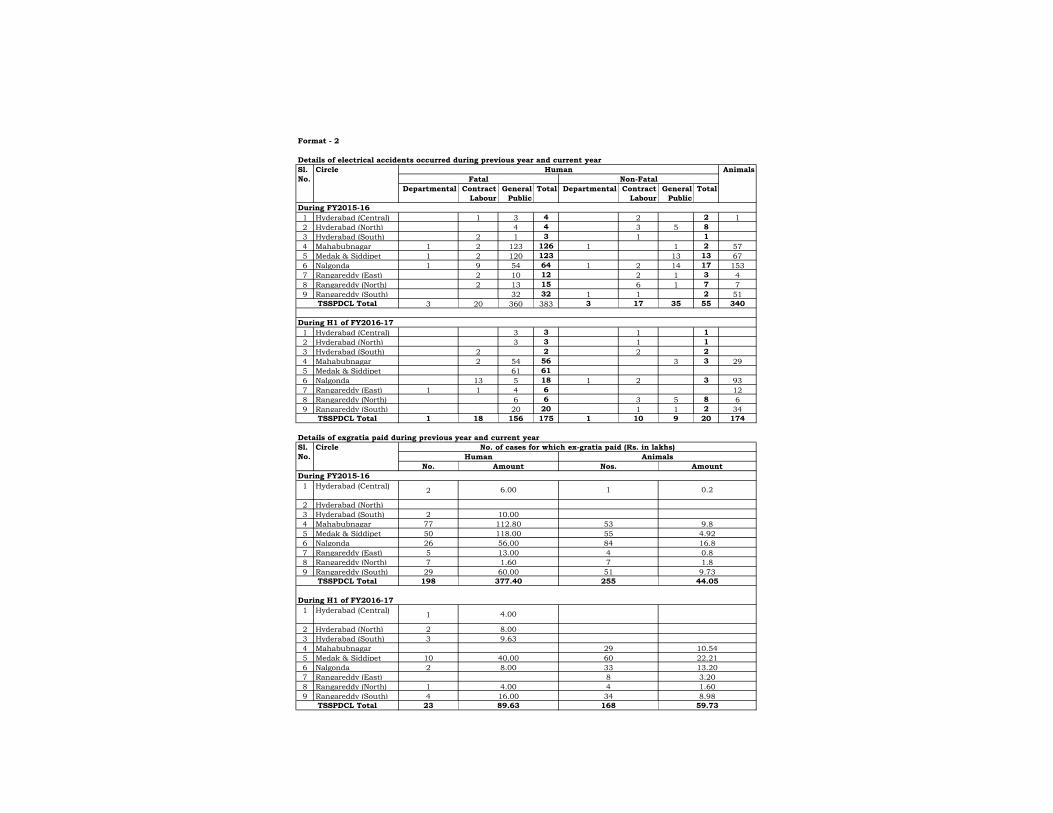
Departmental Contract
Labour
General
Public
Total Departmental Contract
Labour
General
Public
Total
1 Hyderabad (Central) 1 3 4 2 2 1
2 Hyderabad (North) 4 4 3 5 8
3 Hyderabad (South) 2 1 3 1 1
4 Mahabubnagar 1 2 123 126 1 1 2 57
5 Medak & Siddipet 1 2 120 123 13 13 67
6 Nalgonda 1 9 54 64 1 2 14 17 153
7 Rangareddy (East) 2 10 12 2 1 3 4
8 Rangareddy (North) 2 13 15 6 1 7 7
9 Rangareddy (South) 32 32 1 1 2 51
3 20 360 383 3 17 35 55 340
1 Hyderabad (Central) 3 3 1 1
2 Hyderabad (North) 3 3 1 1
3 Hyderabad (South) 2 2 2 2
4 Mahabubnagar 2 54 56 3 3 29
5 Medak & Siddipet 61 61
6 Nalgonda 13 5 18 1 2 3 93
7 Rangareddy (East) 1 1 4 6 12
8 Rangareddy (North) 6 6 3 5 8 6
9 Rangareddy (South) 20 20 1 1 2 34
1 18 156 175 1 10 9 20 174
No.
1 Hyderabad (Central)2
2 Hyderabad (North)
3 Hyderabad (South) 2
4 Mahabubnagar 77
5 Medak & Siddipet 50
6 Nalgonda 26
7 Rangareddy (East) 5
8 Rangareddy (North) 7
9 Rangareddy (South) 29
198
1 Hyderabad (Central)1
2 Hyderabad (North) 2
3 Hyderabad (South) 3
4 Mahabubnagar
5 Medak & Siddipet 10
6 Nalgonda 2
7 Rangareddy (East)
8 Rangareddy (North) 1
9 Rangareddy (South) 4
23
AnimalsHuman
Amount
6.00
During FY2015-16
Amount
0.2
Nos.
1
TSSPDCL Total
0.8
1.8
10.00
112.80
118.00
56.00
1.60
9.8
4.92
16.8
168
34
4
8
4.00
16.00
89.63TSSPDCL Total
13.20
3.20
1.60
8.98
59.73
10.54
22.21
51
255
9.73
44.05
60
29
During H1 of FY2016-17
60.00
7
33
8.00
9.63
40.00
8.00
377.40
4.00
13.00
Sl.
No.
Sl.
No.
Circle
Details of exgratia paid during previous year and current year
During FY2015-16
During H1 of FY2016-17
TSSPDCL Total
TSSPDCL Total
55
84
4
53
No. of cases for which ex-gratia paid (Rs. in lakhs)
Format - 2
Details of electrical accidents occurred during previous year and current year
Fatal Non-Fatal
HumanCircle Animals

Single
Phase
Three
Phase
Total Single
Phase
Three
Phase
Total Single
Phase
Three
Phase
Total Single
Phase
Three
Phase
Total
1 Hyderabad (Central) 95 6182 6277 2 271 273 7 252 259 102 6434 6536
2 Hyderabad (North) 265 12001 12266 3 602 605 0 682 682 265 12683 12948
3 Hyderabad (South) 28 5077 5105 7 434 441 0 209 209 28 5286 5314
4 Mahabubnagar 19590 44150 63740 3609 6440 10049 610 3062 3672 20200 47212 67412
5 Medak & Siddipet 12581 38162 50743 1579 3820 5399 863 5938 6801 13444 44100 57544
6 Nalgonda 26148 60964 87112 2197 7231 9428 301 8524 8825 26449 69488 95937
7 Rangareddy (East) 2592 14546 17138 177 1103 1280 -69 1448 1379 2523 15994 18517
8 Rangareddy (North) 1831 14871 16702 77 471 548 -7 933 926 1824 15804 17628
9 Rangareddy (South) 10369 23202 33571 1194 2050 3244 733 2625 3358 11102 25827 36929
73499 219155 292654 8845 22422 31267 2438 23673 26111 75937 242828 318765
1 Hyderabad (Central) 102 6434 6536 0 201 201 0 92 92 102 6526 6628
2 Hyderabad (North) 265 12683 12948 0 379 379 0 174 174 265 12857 13122
3 Hyderabad (South) 28 5286 5314 0 343 343 0 43 43 28 5329 5357
4 Mahabubnagar 20200 47212 67412 1936 4584 6520 182 787 969 20382 47999 68381
5 Medak & Siddipet 13444 44100 57544 1011 2791 3802 124 436 560 13568 44536 58104
6 Nalgonda 26449 69488 95937 1323 4919 6242 392 5224 5616 26841 74712 101553
7 Rangareddy (East) 2523 15994 18517 129 714 843 14 443 457 2537 16437 18974
8 Rangareddy (North) 1824 15804 17628 39 406 445 14 1031 1045 1838 16835 18673
9 Rangareddy (South) 11102 25827 36929 711 1542 2253 312 784 1096 11414 26611 38025
75937 242828 318765 5149 15879 21028 1038 9014 10052 76975 251842 328817
Replacement of burnt Distribution Transformers (DTRs) and Installation of Additional DTRs
Format - 3
Circle No.of DTRs as on
beginning of the year
No.of DTRs failed and
replaced
Note: Single phase DTRs in Urban circles are replaced with Three phase DTRs and are diverted to Rural circles
Sl.
No.
No.of DTRs as on end of
year/H1 of year
During H1 of FY2016-17
During FY2015-16
TSSPDCL Total
TSSPDCL Total
No.of DTRs added
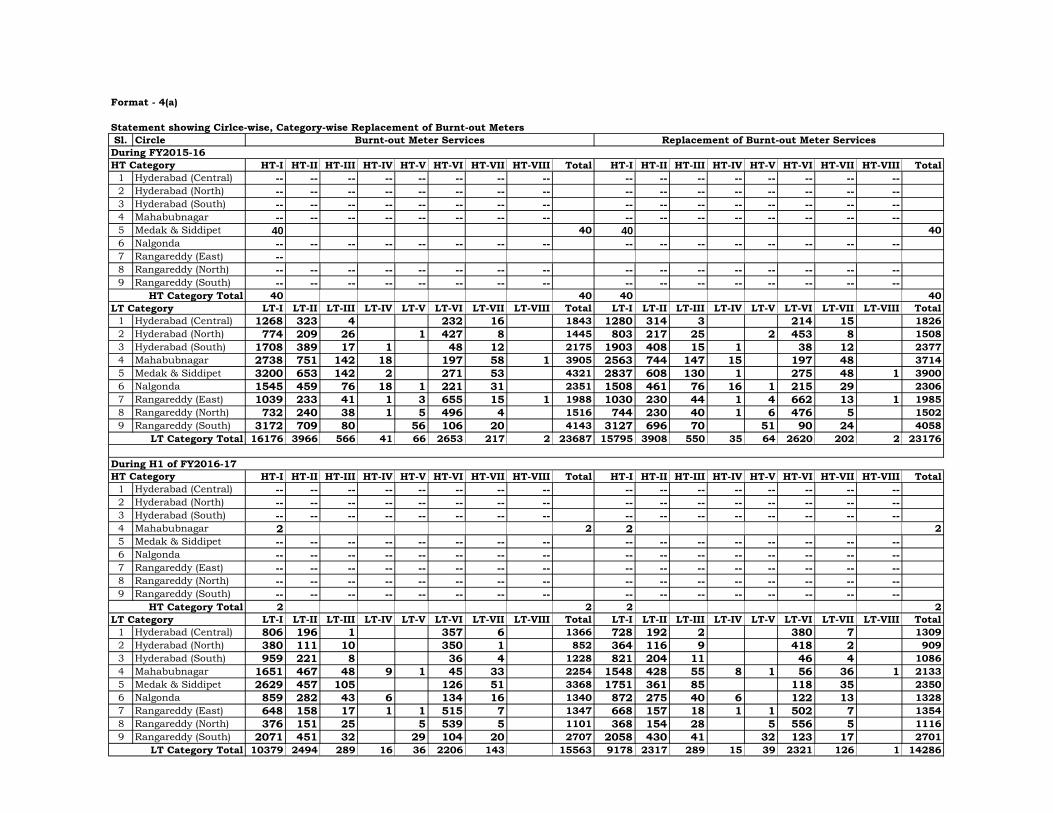
Sl.
No.
Circle
HT-I HT-II HT-III HT-IV HT-V HT-VI HT-VII HT-VIII Total HT-I HT-II HT-III HT-IV HT-V HT-VI HT-VII HT-VIII Total
1 Hyderabad (Central) -- -- -- -- -- -- -- -- -- -- -- -- -- -- -- --2 Hyderabad (North) -- -- -- -- -- -- -- -- -- -- -- -- -- -- -- --3 Hyderabad (South) -- -- -- -- -- -- -- -- -- -- -- -- -- -- -- --4 Mahabubnagar -- -- -- -- -- -- -- -- -- -- -- -- -- -- -- --5 Medak & Siddipet 40 40 40 40
6 Nalgonda -- -- -- -- -- -- -- -- -- -- -- -- -- -- -- --7 Rangareddy (East) --8 Rangareddy (North) -- -- -- -- -- -- -- -- -- -- -- -- -- -- -- --9 Rangareddy (South) -- -- -- -- -- -- -- -- -- -- -- -- -- -- -- --
40 40 40 40
LT-I LT-II LT-III LT-IV LT-V LT-VI LT-VII LT-VIII Total LT-I LT-II LT-III LT-IV LT-V LT-VI LT-VII LT-VIII Total
1 Hyderabad (Central) 1268 323 4 232 16 1843 1280 314 3 214 15 1826
2 Hyderabad (North) 774 209 26 1 427 8 1445 803 217 25 2 453 8 1508
3 Hyderabad (South) 1708 389 17 1 48 12 2175 1903 408 15 1 38 12 2377
4 Mahabubnagar 2738 751 142 18 197 58 1 3905 2563 744 147 15 197 48 3714
5 Medak & Siddipet 3200 653 142 2 271 53 4321 2837 608 130 1 275 48 1 3900
6 Nalgonda 1545 459 76 18 1 221 31 2351 1508 461 76 16 1 215 29 2306
7 Rangareddy (East) 1039 233 41 1 3 655 15 1 1988 1030 230 44 1 4 662 13 1 1985
8 Rangareddy (North) 732 240 38 1 5 496 4 1516 744 230 40 1 6 476 5 1502
9 Rangareddy (South) 3172 709 80 56 106 20 4143 3127 696 70 51 90 24 4058
16176 3966 566 41 66 2653 217 2 23687 15795 3908 550 35 64 2620 202 2 23176
HT-I HT-II HT-III HT-IV HT-V HT-VI HT-VII HT-VIII Total HT-I HT-II HT-III HT-IV HT-V HT-VI HT-VII HT-VIII Total
1 Hyderabad (Central) -- -- -- -- -- -- -- -- -- -- -- -- -- -- -- --2 Hyderabad (North) -- -- -- -- -- -- -- -- -- -- -- -- -- -- -- --3 Hyderabad (South) -- -- -- -- -- -- -- -- -- -- -- -- -- -- -- --4 Mahabubnagar 2 2 2 2
5 Medak & Siddipet -- -- -- -- -- -- -- -- -- -- -- -- -- -- -- --6 Nalgonda -- -- -- -- -- -- -- -- -- -- -- -- -- -- -- --7 Rangareddy (East) -- -- -- -- -- -- -- -- -- -- -- -- -- -- -- --8 Rangareddy (North) -- -- -- -- -- -- -- -- -- -- -- -- -- -- -- --9 Rangareddy (South) -- -- -- -- -- -- -- -- -- -- -- -- -- -- -- --
2 2 2 2
LT-I LT-II LT-III LT-IV LT-V LT-VI LT-VII LT-VIII Total LT-I LT-II LT-III LT-IV LT-V LT-VI LT-VII LT-VIII Total
1 Hyderabad (Central) 806 196 1 357 6 1366 728 192 2 380 7 1309
2 Hyderabad (North) 380 111 10 350 1 852 364 116 9 418 2 909
3 Hyderabad (South) 959 221 8 36 4 1228 821 204 11 46 4 1086
4 Mahabubnagar 1651 467 48 9 1 45 33 2254 1548 428 55 8 1 56 36 1 2133
5 Medak & Siddipet 2629 457 105 126 51 3368 1751 361 85 118 35 2350
6 Nalgonda 859 282 43 6 134 16 1340 872 275 40 6 122 13 1328
7 Rangareddy (East) 648 158 17 1 1 515 7 1347 668 157 18 1 1 502 7 1354
8 Rangareddy (North) 376 151 25 5 539 5 1101 368 154 28 5 556 5 1116
9 Rangareddy (South) 2071 451 32 29 104 20 2707 2058 430 41 32 123 17 2701
10379 2494 289 16 36 2206 143 15563 9178 2317 289 15 39 2321 126 1 14286LT Category Total
HT Category
HT Category Total
LT Category
During FY2015-16
HT Category Total
During H1 of FY2016-17
Format - 4(a)
Statement showing Cirlce-wise, Category-wise Replacement of Burnt-out Meters
Burnt-out Meter Services Replacement of Burnt-out Meter Services
LT Category Total
LT Category
HT Category

Sl.
No.
Circle
HT-I HT-II HT-III HT-IV HT-V HT-VI HT-VII HT-VIII Total HT-I HT-II HT-III HT-IV HT-V HT-VI HT-VII HT-VIII Total
1 Hyderabad (Central) 5 38 -- -- -- -- -- -- 43 5 38 -- -- -- -- -- -- 43
2 Hyderabad (North) -- -- -- -- -- -- -- -- -- -- -- -- -- -- -- --3 Hyderabad (South) -- -- -- -- -- -- -- -- -- -- -- -- -- -- -- --4 Mahabubnagar 29 29 29 29
5 Medak & Siddipet - - - - - - - - - - - - - - - -6 Nalgonda -- -- -- -- -- -- -- -- -- -- -- -- -- -- -- --7 Rangareddy (East) 35 21 1 2 1 60 35 21 1 2 1 60
8 Rangareddy (North) -- -- -- -- -- -- -- -- -- -- -- -- -- -- -- --9 Rangareddy (South) 8 3 11 8 3 11
77 62 1 2 1 143 77 62 1 2 1 143
LT-I LT-II LT-III LT-IV LT-V LT-VI LT-VII LT-VIII Total LT-I LT-II LT-III LT-IV LT-V LT-VI LT-VII LT-VIII Total
1 Hyderabad (Central) 6721 1419 27 127 31 8325 6697 1387 27 147 28 8286
2 Hyderabad (North) 10329 2324 122 1 134 43 12953 10358 2349 118 2 136 43 13006
3 Hyderabad (South) 5864 1763 42 11 27 7707 6422 1892 38 5 33 8390
4 Mahabubnagar 11620 2124 308 18 5 143 126 1 14345 11917 2156 301 19 9 153 131 2 14688
5 Medak & Siddipet 13590 1987 370 8 1 170 128 16254 13287 1951 364 9 1 171 140 15923
6 Nalgonda 18402 2736 451 159 11 759 145 22663 18042 2636 475 165 14 788 138 22258
7 Rangareddy (East) 12277 1635 145 1 4 568 46 14676 12175 1675 148 1 4 588 44 14635
8 Rangareddy (North) 11217 1710 139 13 21 286 23 1 13410 10852 1675 133 13 21 282 22 1 12999
9 Rangareddy (South) 12340 1546 225 7 136 164 61 14479 12347 1539 232 7 144 167 67 14503
102360 17244 1829 206 179 2362 630 2 124812 102097 17260 1836 214 195 2437 646 3 124688
HT-I HT-II HT-III HT-IV HT-V HT-VI HT-VII HT-VIII Total HT-I HT-II HT-III HT-IV HT-V HT-VI HT-VII HT-VIII Total
1 Hyderabad (Central) 2 20 -- -- -- -- -- -- 22 2 20 -- -- -- -- -- -- 22
2 Hyderabad (North) -- -- -- -- -- -- -- -- -- -- -- -- -- -- -- --3 Hyderabad (South) -- -- -- -- -- -- -- -- -- -- -- -- -- -- -- --4 Mahabubnagar 31 31 31 31
5 Medak & Siddipet - - - - - - - - - - - - - - - -6 Nalgonda -- -- -- -- -- -- -- -- -- -- -- -- -- -- -- --7 Rangareddy (East) 26 13 39 26 13 39
8 Rangareddy (North) -- -- -- -- -- -- -- -- -- -- -- -- -- -- -- --9 Rangareddy (South) 20 15 35 20 15 35
79 48 127 79 48 127
LT-I LT-II LT-III LT-IV LT-V LT-VI LT-VII LT-VIII Total LT-I LT-II LT-III LT-IV LT-V LT-VI LT-VII LT-VIII Total
1 Hyderabad (Central) 5540 1057 10 135 18 6760 4907 954 8 120 18 6007
2 Hyderabad (North) 7300 1563 85 2 160 23 1 9134 6634 1393 74 2 160 17 8280
3 Hyderabad (South) 3314 1144 22 2 1 32 16 4531 2929 1026 23 2 1 33 15 4029
4 Mahabubnagar 6142 1228 205 11 67 58 7711 5967 1147 189 11 1 56 49 7420
5 Medak & Siddipet 9683 1376 221 2 92 85 1 11460 7776 1146 186 75 70 1 9254
6 Nalgonda 12142 1844 299 145 1 600 86 15117 12045 1823 271 122 1 536 91 14889
7 Rangareddy (East) 9155 1235 124 1 6 411 35 10967 8523 1144 101 1 5 379 35 10188
8 Rangareddy (North) 9399 1285 85 3 8 262 14 1 11057 8411 1153 83 3 7 271 15 1 9944
9 Rangareddy (South) 7740 1092 195 1 66 72 30 9196 7564 1001 143 1 67 64 31 8871
70415 11824 1246 165 84 1831 365 3 85933 64756 10787 1078 140 84 1694 341 2 78882
HT Category
HT Category Total
LT Category
LT Category Total
HT Category Total
LT Category
LT Category Total
During H1 of FY2016-17
HT Category
Format - 4(b)
Statement showing Cirlce-wise, Category-wise Replacement of Stuck-up Meters
Stuck-up Meter Services Replacement of Stuck-up Meter Services
During FY2015-16

Max Min Avg.
Individual FOCs 100821 100821 1:00:00 0:20:00 0:40:00
Serivce Wire defect 4052 4052 1:00:00 0:30:00 0:45:00
LT Fuses blown 45114 635710 1:00:00 0:30:00 0:45:00
LT line fault 643 11316 1:00:00 0:30:00 0:45:00
HG fuse blown 4778 82150 1:00:00 0:30:00 0:45:00
DTR Failure 297 39501 1:00:00 1:00:00 1:00:00
Total 155705 873550 6:00:00 3:20:00 4:40:00
Individual FOCs 9900 9900 11:00:00 5:00:00 7:00:00
Serivce Wire defect 237 237 4:00:00 2:00:00 1:00:00
LT Fuses blown 50153 551683 16:00:00 7:00:00 6:00:00
LT line fault 27 324 3:00:00 2:00:00 2:20:00
HG fuse blown 7002 77022 9:00:00 5:00:00 6:30:00
DTR Failure 249 7968 9:00:00 4:00:00 5:00:00
Total 67568 647134 52:00:00 25:00:00 27:50:00
Individual FOCs 108342 108342 1:00:00 0:20:00 0:40:00
Serivce Wire defect 13532 13532 1:00:00 0:20:00 0:40:00
LT Fuses blown 24421 1598150 1:00:00 0:20:00 0:40:00
LT line fault 342 26753 1:30:00 0:30:00 1:00:00
HG fuse blown 1582 28916 1:00:00 0:30:00 0:30:00
DTR Failure 201 31615 4:00:00 1:30:00 2:40:00
Total 148420 1807308 9:30:00 3:30:00 6:10:00
Individual FOCs 20721 20721 1:00:00 0:30:00 0:45:00
Serivce Wire defect 1689 1689 1:30:00 0:30:00 1:00:00
LT Fuses blown 74 1854 2:00:00 1:00:00 1:30:00
LT line fault 30 310 3:00:00 2:00:00 2:30:00
HG fuse blown 36 1212 2:00:00 1:00:00 1:30:00
DTR Failure 7892 47352 48:00:00 12:00:00 30:00:00
Total 30442 73138 57:30:00 17:00:00 37:15:00
Individual FOCs 8106 45250 1:00:00 0:30:00 0:45:00
Serivce Wire defect 3562 3562 1:30:00 0:30:00 1:00:00
LT Fuses blown 5311 65606 2:00:00 1:00:00 1:30:00
LT line fault 2422 16710 3:00:00 2:00:00 2:30:00
HG fuse blown 1780 23868 2:00:00 1:00:00 1:30:00
DTR Failure 5536 138400 48:00:00 12:00:00 30:00:00
Total 26717 293396 57:30:00 17:00:00 37:15:00
Format - 5
Performance with regard to attending to Fuse-off Calls (FOC)
Time for rectification (hrs)Circle Type of Compalints No. of Complaints No. of Consumers
affected
Mahabubnagar
Medak & Siddipet
During FY2015-16
Hyderabad (North)
Hyderabad (South)
Hyderabad (Central)

Max Min Avg.
Time for rectification (hrs)Circle Type of Compalints No. of Complaints No. of Consumers
affected
Individual FOCs 24125 24125 4:00:00 1:00:00 2:30:00
Serivce Wire defect 841 841 4:00:00 1:00:00 2:30:00
LT Fuses blown 5024 20154 1:00:00 0:30:00 0:45:00
LT line fault 294 24215 4:00:00 1:00:00 2:30:00
HG fuse blown 2612 6154 0:00:00 0:00:00 0:00:00
DTR Failure 1258 14155 24:00:00 4:00:00 14:00:00
Total 34154 89644 37:00:00 7:30:00 22:15:00
Individual FOCs 3170 3170 16:00:00 7:00:00 11:30:00
Serivce Wire defect 4368 4368 17:00:00 6:30:00 11:45:00
LT Fuses blown 5665 39015 2:30:00 1:20:00 1:55:00
LT line fault 4055 57325 5:30:00 2:20:00 3:55:00
HG fuse blown 1323 7488 4:00:00 1:30:00 2:45:00
DTR Failure 628 10480 28:00:00 14:00:00 21:00:00
Total 19209 121846 73:00:00 32:40:00 52:50:00
Individual FOCs 25654 5213564 3:45:00 1:55:00 2:50:00
Serivce Wire defect 8213 8642 5:52:00 3:10:00 4:31:00
LT Fuses blown 13254 568456 3:25:00 1:45:00 2:35:00
LT line fault 4231 1512563 4:35:00 2:35:00 3:35:00
HG fuse blown 9263 963305 4:20:00 3:20:00 3:50:00
DTR Failure 358 82162 14:55:00 11:25:00 13:10:00
Total 60973 8348692 36:52:00 24:10:00 30:31:00
Individual FOCs 6021 6021 7:15:00 2:15:00 4:45:00
Serivce Wire defect 7202 7202 11:35:00 4:54:00 8:14:30
LT Fuses blown 35724 110739 38:57:00 2:31:00 20:44:00
LT line fault 4350 73519 14:50:00 3:48:00 9:19:00
HG fuse blown 18084 93023 10:40:00 2:35:00 6:37:30
DTR Failure 2676 179853 39:00:00 34:50:00 36:55:00
Total 74057 470357 122:17:00 50:53:00 86:35:00
Individual FOCs 306860 5531914 46:00:00 18:50:00 31:25:00
Serivce Wire defect 43696 44125 47:27:00 19:24:00 31:25:30
LT Fuses blown 184740 3591367 67:52:00 15:56:00 36:24:00
LT line fault 16394 1723035 40:25:00 16:43:00 28:24:00
HG fuse blown 46460 1283138 34:00:00 15:25:00 23:57:30
DTR Failure 19095 551486 215:55:00 94:45:00 153:45:00
Total 617245 12725065 451:39:00 181:03:00 305:21:00
TSSPDCL
Nalgonda
Rangareddy (North)
Rangareddy (South)
Rangareddy (East)

Max Min Avg.
Time for rectification (hrs)Circle Type of Compalints No. of Complaints No. of Consumers
affected
Individual FOCs 43871 43871 1:00:00 0:20:00 0:40:00
Serivce Wire defect 1187 1187 1:00:00 0:30:00 0:45:00
LT Fuses blown 23364 316704 1:00:00 0:30:00 0:45:00
LT line fault 381 6338 1:00:00 0:30:00 0:45:00
HG fuse blown 6664 48487 1:00:00 0:30:00 0:45:00
DTR Failure 207 27531 1:00:00 1:00:00 1:00:00
Total 75674 444118 6:00:00 3:20:00 4:40:00
Individual FOCs 4950 4950 7:00:00 4:00:00 5:00:00
Serivce Wire defect 132 132 2:00:00 00:50:00 1:00:00
LT Fuses blown 43070 473770 9:00:00 6:00:00 5:00:00
LT line fault 264 3960 6:00:00 3:00:00 4:00:00
HG fuse blown 7310 80410 9:00:00 5:00:00 6:30:00
DTR Failure 83 2905 5:00:00 2:00:00 3:00:00
Total 55809 566127 38:00:00 17:50:00 24:30:00
Individual FOCs 53685 54535 1:00:00 0:20:00 0:40:00
Serivce Wire defect 2051 2051 1:00:00 0:20:00 0:40:00
LT Fuses blown 34314 1011110 1:00:00 0:20:00 0:40:00
LT line fault 175 9139 1:30:00 0:30:00 1:00:00
HG fuse blown 1352 51183 1:00:00 0:30:00 0:30:00
DTR Failure 217 20293 4:00:00 1:30:00 2:40:00
Total 91794 1148311 9:30:00 3:30:00 6:10:00
Individual FOCs 9861 9861 1:00:00 0:30:00 0:45:00
Serivce Wire defect 924 924 1:30:00 0:30:00 1:00:00
LT Fuses blown 36 936 2:00:00 1:00:00 1:30:00
LT line fault 18 184 3:00:00 2:00:00 2:30:00
HG fuse blown 21 693 2:00:00 1:00:00 1:30:00
DTR Failure 6519 39114 48:00:00 12:00:00 18:00:00
Total 17379 51712 57:30:00 17:00:00 25:15:00
Individual FOCs 1855 4210 1:00:00 0:30:00 0:45:00
Serivce Wire defect 631 1823 1:30:00 0:30:00 1:00:00
LT Fuses blown 163 2267 2:00:00 1:00:00 1:30:00
LT line fault 213 1092 3:00:00 2:00:00 2:30:00
HG fuse blown 189 548 2:00:00 1:00:00 1:30:00
DTR Failure 3136 38220 48:00:00 12:00:00 18:00:00
Total 6187 48160 0:00:00 17:00:00 25:15:00
Hyderabad (North)
Hyderabad (Central)
During H1 of FY2016-17
Hyderabad (South)
Mahabubnagar
Medak & Siddipet
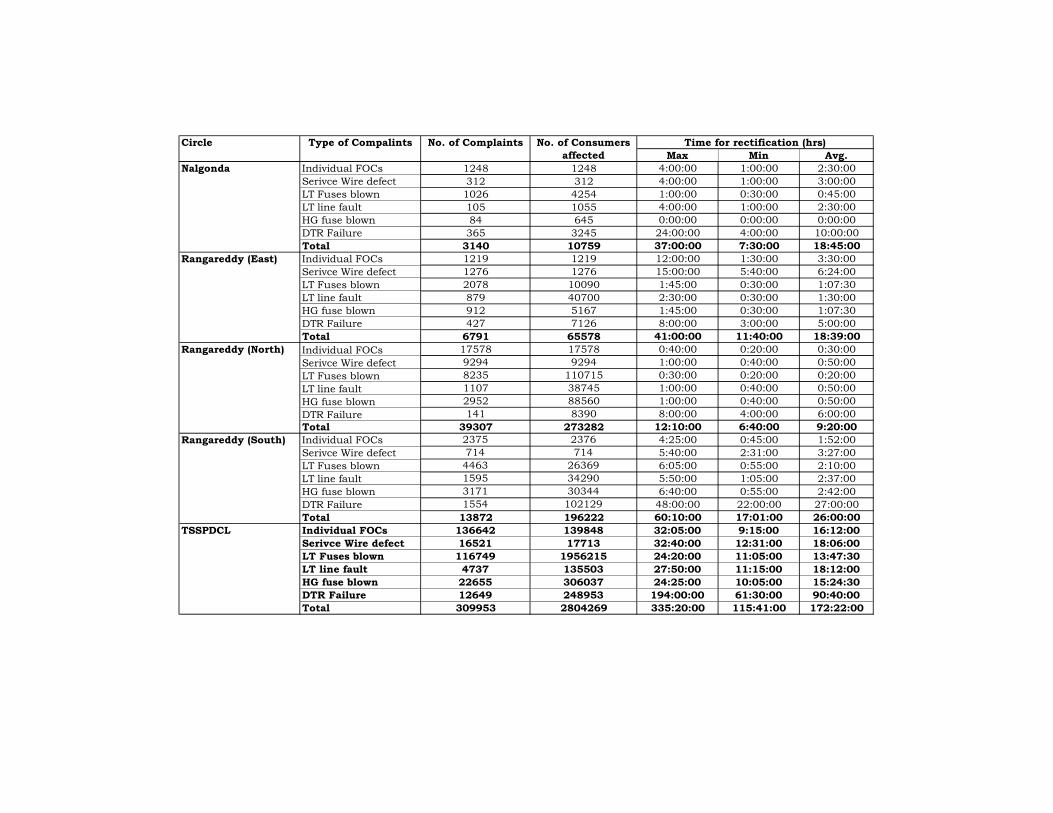
Max Min Avg.
Time for rectification (hrs)Circle Type of Compalints No. of Complaints No. of Consumers
affected
Individual FOCs 1248 1248 4:00:00 1:00:00 2:30:00
Serivce Wire defect 312 312 4:00:00 1:00:00 3:00:00
LT Fuses blown 1026 4254 1:00:00 0:30:00 0:45:00
LT line fault 105 1055 4:00:00 1:00:00 2:30:00
HG fuse blown 84 645 0:00:00 0:00:00 0:00:00
DTR Failure 365 3245 24:00:00 4:00:00 10:00:00
Total 3140 10759 37:00:00 7:30:00 18:45:00
Individual FOCs 1219 1219 12:00:00 1:30:00 3:30:00
Serivce Wire defect 1276 1276 15:00:00 5:40:00 6:24:00
LT Fuses blown 2078 10090 1:45:00 0:30:00 1:07:30
LT line fault 879 40700 2:30:00 0:30:00 1:30:00
HG fuse blown 912 5167 1:45:00 0:30:00 1:07:30
DTR Failure 427 7126 8:00:00 3:00:00 5:00:00
Total 6791 65578 41:00:00 11:40:00 18:39:00
Individual FOCs 17578 17578 0:40:00 0:20:00 0:30:00
Serivce Wire defect 9294 9294 1:00:00 0:40:00 0:50:00
LT Fuses blown 8235 110715 0:30:00 0:20:00 0:20:00
LT line fault 1107 38745 1:00:00 0:40:00 0:50:00
HG fuse blown 2952 88560 1:00:00 0:40:00 0:50:00
DTR Failure 141 8390 8:00:00 4:00:00 6:00:00
Total 39307 273282 12:10:00 6:40:00 9:20:00
Individual FOCs 2375 2376 4:25:00 0:45:00 1:52:00
Serivce Wire defect 714 714 5:40:00 2:31:00 3:27:00
LT Fuses blown 4463 26369 6:05:00 0:55:00 2:10:00
LT line fault 1595 34290 5:50:00 1:05:00 2:37:00
HG fuse blown 3171 30344 6:40:00 0:55:00 2:42:00
DTR Failure 1554 102129 48:00:00 22:00:00 27:00:00
Total 13872 196222 60:10:00 17:01:00 26:00:00
Individual FOCs 136642 139848 32:05:00 9:15:00 16:12:00
Serivce Wire defect 16521 17713 32:40:00 12:31:00 18:06:00
LT Fuses blown 116749 1956215 24:20:00 11:05:00 13:47:30
LT line fault 4737 135503 27:50:00 11:15:00 18:12:00
HG fuse blown 22655 306037 24:25:00 10:05:00 15:24:30
DTR Failure 12649 248953 194:00:00 61:30:00 90:40:00
Total 309953 2804269 335:20:00 115:41:00 172:22:00
TSSPDCL
Rangareddy (South)
Rangareddy (East)
Nalgonda
Rangareddy (North)

No. of
feeders
Length of
lines in km
No. of
breakdowns
Duration
in Hrs
Nos. Duration
in Hrs
No. of
feeders
Length of
lines in km
No. of
breakdowns
Duration
in Hrs
Nos. Duration
in Hrs
1 Hyderabad (Central) 31 198.64 28 43:25:00 14.10 21:51:25 280 879.60 460 1060:32:00 52.30 120:34:12
2 Hyderabad (North) 90 372.79 25 10:19:00 6.71 2:46:03 455 2847.00 1042 2576:27:00 36.60 90:29:49
3 Hyderabad (South) 39 358.88 24 9:42:00 6.69 2:42:10 253 1051.74 740 1598:52:00 70.36 152:01:16
4 Mahabubnagar 153 2271.60 194 298:57:00 8.54 13:09:37 1033 15664.51 1189 2486:54:10 7.59 15:52:34
5 Medak & Siddipet 122 3058.09 426 2163:45:00 13.93 707:45:00 1135 20183.24 1642 6842:25:00 8.14 33:54:05
6 Nalgonda 128 2859.00 389 2226:56:00 13.61 77:53:31 1041 23842.18 1281 5470:00:00 5.37 22:56:33
7 Rangareddy (East) 75 584.66 133 19:35:00 22.75 3:20:58 388 2245.18 443 815:24:00 19.73 36:19:04
8 Rangareddy (North) 48 529.00 49 17:50:00 9.26 3:22:16 374 2486.00 399 813:23:00 16.05 32:43:07
9 Rangareddy (South) 67 743.23 71 4:15:00 9.55 0:34:19 520 5534.92 572 1346:45:00 10.33 24:19:55
753 10975.89 1339 4794:44:00 12.20 43:41:03 5479 74734.37 7768 23010:42:10 10.39 30:47:24
1 Hyderabad (Central) 33 206.64 16 9:46:00 7.74 4:43:35 280 879.60 829 2790:24:00 94.25 317:14:06
2 Hyderabad (North) 90 380.59 28 57:59:00 7.36 15:14:06 455 2847.00 1324 3947:40:00 46.51 138:39:38
3 Hyderabad (South) 40 365.88 25 48:40:00 6.83 13:18:05 253 1051.74 848 2273:28:00 80.63 216:09:45
4 Mahabubnagar 164 2315.70 121 206:22:00 5.23 8:54:42 1045 15815.71 697 1341:36:00 4.41 8:28:58
5 Medak & Siddipet 132 3198.00 148 1942:45:00 4.63 60:44:56 1158 20819.57 762 4125:30:00 3.66 19:48:56
6 Nalgonda 133 3324.31 216 1196:40:00 6.50 35:59:51 1044 24327.05 678 2726:00:00 2.79 11:12:20
7 Rangareddy (East) 81 592.34 104 37:45:00 17.56 6:22:23 437 2319.14 528 161:02:00 22.77 6:56:37
8 Rangareddy (North) 56 539.00 23 47:15:00 4.27 8:45:58 410 2502.00 251 502:20:00 10.03 20:04:38
9 Rangareddy (South) 77 749.03 100 100:13:00 13.35 13:22:46 546 5621.61 601 1441:49:00 10.69 25:38:52
806 11671.49 781 3647:25:00 6.69 31:15:02 5628 76183.42 6518 19309:49:00 8.56 25:20:47
Format - 6(a)
TSSPDCL Total
CircleSl.
No.
33 kV System 11 kV System
TSSPDCL Total
Ratio per 100 km Ratio per 100 km
Occurred during H1 of FY2016-17
Occurred during FY2015-16
Breakdowns in power supply to urban and rural consumers (circle-wise) and time taken for restoration

No. of
feeders
Length of
lines in km
No. of
Interruptions
Duration
in HrsNos.
Duration
in Hrs
No. of
feeders
Length of
lines in km
No. of
Interruptions
Duration
in HrsNos.
Duration
in Hrs
1 Hyderabad (Central) 31 198.64 374 58:40:00 188.28 29:32:03 280 879.60 7846 2113:15:00 892.00 240:15:05
2 Hyderabad (North) 90 372.79 751 162:57:00 201.45 43:42:39 455 2847.00 13020 3687:58:00 457.32 129:32:19
3 Hyderabad (South) 39 358.88 677 101:41:00 188.64 28:20:01 253 1051.74 8081 2285:39:00 768.35 217:19:15
4 Mahabubnagar 153 2271.60 893 575:26:00 39.31 25:19:54 1033 15664.51 7873 4865:58:00 50.26 31:03:49
5 Medak & Siddipet 122` 3058.09 7166 1453:46:00 234.33 47:32:18 1135 20183.24 18452 3125:45:00 91.42 15:29:13
6 Nalgonda 128 2859.00 10108 2153:43:00 353.55 75:19:52 1041 23842.18 40233 6187:00:00 168.75 25:56:59
7 Rangareddy (East) 75 584.66 459 306:41:00 78.51 52:27:18 388 2245.18 1418 291:24:00 63.16 12:58:44
8 Rangareddy (North) 48 529.00 194 42:49:00 36.67 8:05:38 374 2486.00 11868 3942:05:00 477.39 158:34:17
9 Rangareddy (South) 67 743.23 886 290:32:00 119.21 39:05:26 520 5534.91 10444 3494:11:00 188.69 63:07:48
631 10975.89 21508 5146:15:00 195.96 46:53:13 5479 74734.36 119235 29993:15:00 159.55 40:07:59
1 Hyderabad (Central) 33 206.64 338 87:15:00 163.57 42:13:23 280 879.60 5883 1874:44:00 668.83 213:08:05
2 Hyderabad (North) 90 380.59 546 145:51:00 143.46 38:19:19 455 2847.00 9746 3037:00:00 342.33 106:40:25
3 Hyderabad (South) 40 365.88 617 125:03:00 168.63 34:10:40 253 1051.74 5872 1907:47:00 558.31 181:23:35
4 Mahabubnagar 164 2315.70 457 237:11:00 19.73 10:14:33 1045 15815.71 4316 2931:22:00 27.29 18:32:04
5 Medak & Siddipet 132 3198.00 2845 1254:30:00 88.96 39:13:40 1158 20819.57 9426 2561:50:00 45.27 12:18:18
6 Nalgonda 133 3324.31 5187 1078:30:00 156.03 32:26:34 1044 24327.05 20346 3106:00:00 83.64 12:46:04
7 Rangareddy (East) 81 592.34 475 486:32:00 80.19 82:08:15 437 2319.14 3384 1131:46:00 145.92 48:48:04
8 Rangareddy (North) 56 539.00 177 74:55:00 32.84 13:53:57 410 2502.00 3008 768:27:00 120.22 30:42:48
9 Rangareddy (South) 77 749.03 739 269:41:00 98.66 36:00:15 546 5621.61 5691 2150:20:00 101.23 38:15:04
806 11671.49 11381 3759:28:00 97.51 32:12:38 5628 76183.42 67672 19469:16:00 88.83 25:33:21
Ratio per 100 km
Format - 6(b)
Interruptions in power supply to urban and rural consumers (circle-wise) and time taken for restoration
Occurred during H1 of FY2016-17
Total
Total
Sl.
No.
Circle 33 kV System 11 kV System
Occurred during FY2015-16
Ratio per 100 km

Hz Date Hz Date <49.70 Hz 49.70-49.90 Hz 49.90-50.05 Hz 50.05-50.20 Hz >50.20 Hz
Apr-15 49.99 50.55 25.04.2015 49.5 7.04.15 0.68 15.97 60.11 22.21 1.03
May-15 49.98 50.55 19.05.2015 49.19 24.05.15 0.53 17.55 64.13 17.12 0.68
Jun-15 50.01 50.53 13.06.2015 49.56 26.06.15 0.13 10.21 64.44 24.01 1.21
Jul-15 49.99 50.53 26.07.2015 49.56 27.07.15 0.13 11.84 70.12 17.62 0.28
Aug-15 49.97 50.27 12.08.2015 49.55 3.08.05 0.20 17.22 69.45 13.06 0.06
Sep-15 49.94 50.33 20.09.2015 49.36 4.09.15 0.70 31.31 57.87 9.98 0.14
Oct-15 49.98 50.33 17.10.2015 49.52 1.10.15 0.04 15.27 68.33 16.16 0.19
Nov-15 49.99 50.28 13.11.2015 49.64 21.11.15 0.04 12.53 66.23 21.00 0.20
Dec-15 49.98 50.32 30.12.2015 49.58 6.12.15 0.08 17.33 64.57 17.42 0.29
Jan-16 50.00 50.39 16.01.2016 49.77 26.01.16 0.00 11.45 68.63 19.60 0.32
Feb-16 50.00 50.39 19.02.2016 49.8 14.02.16 0.00 6.91 71.29 21.55 0.24
Mar-16 49.99 50.35 18.03.2016 49.75 7.03.16 0.00 10.79 69.49 19.56 0.15
Average 49.99 50.55 19.05.2015 49.19 24.05.15 0.21 14.87 66.22 18.27 0.40
Apr-16 49.98 50.32 25.04.2016 49.73 01.04.2016 0.00 10.79 69.49 19.56 0.15
May-16 50 50.44 24.05.2016 49.78 18.05.2016 0.00 10.79 69.49 19.56 0.15
Jun-16 49.99 50.37 27.06.2016 49.76 19.06.2016 0.00 10.79 69.49 19.56 0.15
Jul-16 50.01 50.35 05.07.2016 49.80 02.07.2016 0.00 10.79 69.49 19.56 0.15
Aug-16 50.00 50.35 10.08.2016 49.75 21.08.2016 0.00 6.69 72.66 20.54 0.07
Sep-16
Average 49.996 50.44 24.05.2016 49.73 01.04.2016 0.00 9.97 70.12 19.76 0.13
During H1 of FY2016-17
* - Frequency levels changed by SRLDC from May'14 onwards.
Format - 7
Average
Hz
Month
During FY2015-16
Frequency Profile of Southern Region (SR) Grid
Maximum Minimum (Figures in percentage of time)

HYDC HYDN HYDS MBNR MDK &
SDP
NLG RRE RRN RRS Total
LT-I Domestic 2 7 11 1,113 170 28 19 44 3 1,397
LT-II Non-Domestic/Commercial 1 2 3 208 157 49 15 15 10 460
LT-III Industry 0 0 6 29 26 9 5 3 2 80
LT-IV Cottage Industries 0 0 0 5 0 1 0 0 0 6
LT-V Agricultural 0 0 0 14,204 3,195 6,381 645 137 1,937 26,499
LT-VI Street Lighting & PWS Schemes 0 0 1 374 161 163 15 8 23 745
LT-VII General Purpose 0 0 0 59 11 13 1 0 0 84
LT-VIII Temporary Supply 1 0 1 17 4 0 0 0 0 23
4 9 22 16,009 3,724 6,644 700 207 1,975 29,294
HT-I Industry 3 5 1 62 108 34 42 52 25 332
HT-II Others 37 80 7 28 40 20 51 104 45 412
HT-III Airports, Railway stations and Bus stations 0 0 0 0 0 0 0 1 0 1
HT-IV Irrigation & CPWS 0 0 0 35 23 28 1 0 3 90
HT-V Railway Traction 0 0 0 3 1 2 0 0 0 6
HT-VI Townships & Residential Colonies 1 5 2 0 2 0 0 5 4 19
HT-VII Green Power 0 0 0 3 0 0 0 0 0 3
HT-VIII Temporary Supply 2 5 1 5 3 0 2 24 7 49
43 95 11 136 177 84 96 186 84 912
47 104 33 16,145 3,901 6,728 796 393 2,059 30,206
LT-I Domestic 9 11 13 1,258 247 102 60 146 23 1,869
LT-II Non-Domestic/Commercial 1 6 7 345 296 101 33 65 30 884
LT-III Industry 0 0 7 60 48 34 18 16 19 202
LT-IV Cottage Industries 0 0 0 5 0 3 0 0 0 8
LT-V Agricultural 0 0 0 22,228 5,024 12,645 900 326 3,565 44,688
LT-VI Street Lighting & PWS Schemes 0 0 1 453 223 302 23 13 34 1,049
LT-VII General Purpose 0 0 1 78 27 29 1 1 0 137
LT-VIII Temporary Supply 1 1 2 24 9 0 0 0 0 37
11 18 31 24,451 5,874 13,216 1,035 567 3,671 48,874
HT-I Industry 0 2 26 50 14 19 16 11 138
HT-II Others 21 40 23 23 18 23 54 32 234
HT-III Airports, Railway stations and Bus stations 0 0 0 0 0 0 1 0 1
HT-IV Irrigation & CPWS 0 0 34 21 21 0 0 3 79
HT-V Railway Traction 0 0 3 1 1 0 0 0 5
HT-VI Townships & Residential Colonies 0 4 2 2 0 0 3 1 12
HT-VII Green Power 0 0 0 0 0 0 0 0 0
HT-VIII Temporary Supply 0 4 3 2 0 2 16 3 30
21 50 0 91 99 54 44 90 50 499
32 68 31 24,542 5,973 13,270 1,079 657 3,721 49,373
Pending Service Connections applications of different categories of consumers
HT Supply Total
LT+HT Supply Total
Format - 8(a)
LT Supply
HT Supply
LT Supply
HT Supply
LT Supply Total
HT Supply Total
LT+HT Supply Total
LT Supply Total
Category
As on 30.09.2016
As on 31.03.2016
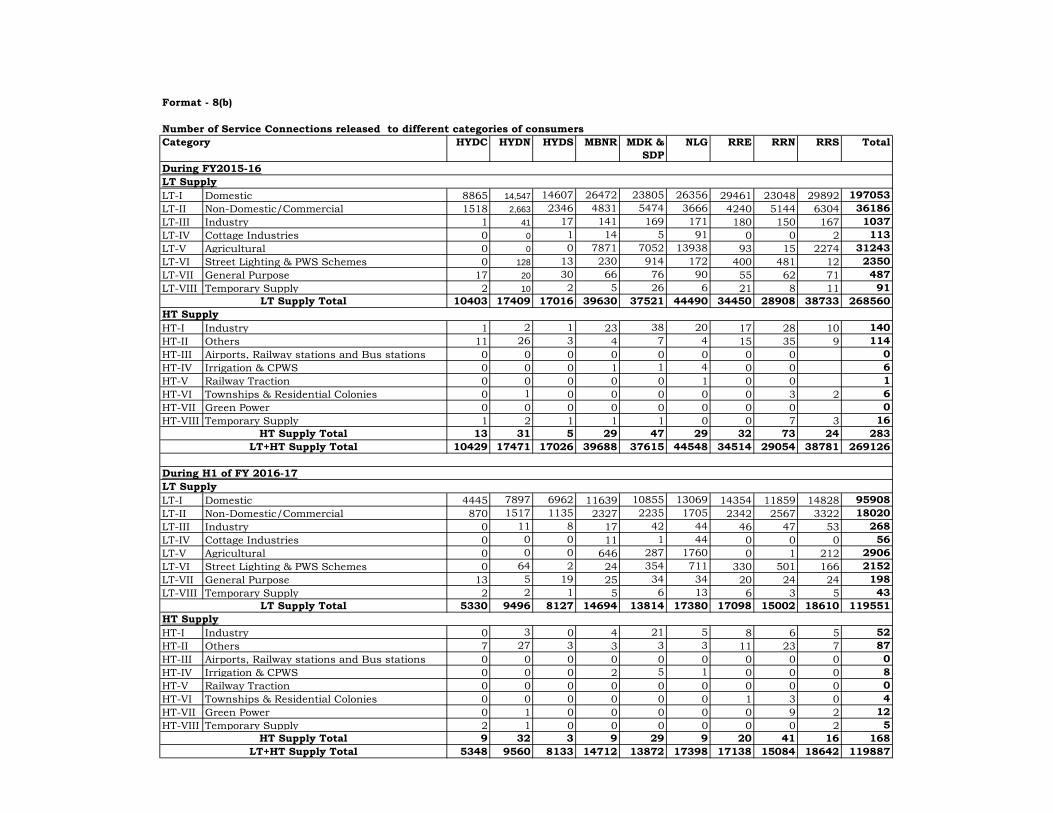
HYDC HYDN HYDS MBNR MDK &
SDP
NLG RRE RRN RRS Total
LT-I Domestic 8865 14,547 14607 26472 23805 26356 29461 23048 29892 197053
LT-II Non-Domestic/Commercial 1518 2,663 2346 4831 5474 3666 4240 5144 6304 36186
LT-III Industry 1 41 17 141 169 171 180 150 167 1037
LT-IV Cottage Industries 0 0 1 14 5 91 0 0 2 113
LT-V Agricultural 0 0 0 7871 7052 13938 93 15 2274 31243
LT-VI Street Lighting & PWS Schemes 0 128 13 230 914 172 400 481 12 2350
LT-VII General Purpose 17 20 30 66 76 90 55 62 71 487
LT-VIII Temporary Supply 2 10 2 5 26 6 21 8 11 91
10403 17409 17016 39630 37521 44490 34450 28908 38733 268560
HT-I Industry 1 2 1 23 38 20 17 28 10 140
HT-II Others 11 26 3 4 7 4 15 35 9 114
HT-III Airports, Railway stations and Bus stations 0 0 0 0 0 0 0 0 0
HT-IV Irrigation & CPWS 0 0 0 1 1 4 0 0 6
HT-V Railway Traction 0 0 0 0 0 1 0 0 1
HT-VI Townships & Residential Colonies 0 1 0 0 0 0 0 3 2 6
HT-VII Green Power 0 0 0 0 0 0 0 0 0
HT-VIII Temporary Supply 1 2 1 1 1 0 0 7 3 16
13 31 5 29 47 29 32 73 24 283
10429 17471 17026 39688 37615 44548 34514 29054 38781 269126
LT-I Domestic 4445 7897 6962 11639 10855 13069 14354 11859 14828 95908
LT-II Non-Domestic/Commercial 870 1517 1135 2327 2235 1705 2342 2567 3322 18020
LT-III Industry 0 11 8 17 42 44 46 47 53 268
LT-IV Cottage Industries 0 0 0 11 1 44 0 0 0 56
LT-V Agricultural 0 0 0 646 287 1760 0 1 212 2906
LT-VI Street Lighting & PWS Schemes 0 64 2 24 354 711 330 501 166 2152
LT-VII General Purpose 13 5 19 25 34 34 20 24 24 198
LT-VIII Temporary Supply 2 2 1 5 6 13 6 3 5 43
5330 9496 8127 14694 13814 17380 17098 15002 18610 119551
HT-I Industry 0 3 0 4 21 5 8 6 5 52
HT-II Others 7 27 3 3 3 3 11 23 7 87
HT-III Airports, Railway stations and Bus stations 0 0 0 0 0 0 0 0 0 0
HT-IV Irrigation & CPWS 0 0 0 2 5 1 0 0 0 8
HT-V Railway Traction 0 0 0 0 0 0 0 0 0 0
HT-VI Townships & Residential Colonies 0 0 0 0 0 0 1 3 0 4
HT-VII Green Power 0 1 0 0 0 0 0 9 2 12
HT-VIII Temporary Supply 2 1 0 0 0 0 0 0 2 5
9 32 3 9 29 9 20 41 16 168
5348 9560 8133 14712 13872 17398 17138 15084 18642 119887LT+HT Supply Total
During H1 of FY 2016-17
LT Supply
HT Supply
LT Supply
HT Supply
LT+HT Supply Total
LT Supply Total
HT Supply Total
Format - 8(b)
Number of Service Connections released to different categories of consumers
LT Supply Total
Category
HT Supply Total
During FY2015-16

SC Nos. Rs.Lakhs
LT-I Domestic 1649 1474.90
LT-II Non-Domestic/Commercial 1624 1846.91
LT-III Industry 1522 2197.98
LT-IV Cottage Industries 5 7.15
LT-V Agricultural 3175 3258.32
LT-VI Street Lighting & PWS Schemes 31591 99927.58
LT-VII General Purpose 397 472.11
LT-VIII Temporary Supply 22 25.79
39985 109210.73
HT-I Industry 1553 108736.93
HT-II Others 346 11708.24
HT-III Airports, Railway stations and Bus stations 4 515.79
HT-IV Irrigation & CPWS 161 15832.48
HT-V Railway Traction 2 72.99
HT-VI Townships & Residential Colonies 15 115.17
HT-VII Green Power 0 0.00
HT-VIII Temporary Supply 18 371.96
2099 137353.57
42084 246564.30
LT-I Domestic 1060 959.44
LT-II Non-Domestic/Commercial 1738 1945.79
LT-III Industry 1504 2203.05
LT-IV Cottage Industries 4 6.48
LT-V Agricultural 3122 3155.69
LT-VI Street Lighting & PWS Schemes 31877 114184.30
LT-VII General Purpose 442 514.81
LT-VIII Temporary Supply 18 22.13
39765 122991.70
HT-I Industry 1511 116308.56
HT-II Others 341 12289.49
HT-III Airports, Railway stations and Bus stations 4 401.32
HT-IV Irrigation & CPWS 177 19550.17
HT-V Railway Traction 1 14.19
HT-VI Townships & Residential Colonies 9 94.20
HT-VII Green Power 0 0.00
HT-VIII Temporary Supply 0 281.94
2043 148939.88
41808 271931.58
Format - 9(a)
Arrears of consumers over Rs.50,000 pending for over six months
LT Supply Total
HT Supply
Category
]
HT Supply Total
LT+HT Supply Total
As on 31.03.2016
HT Supply
HT Supply Total
LT Supply
LT+HT Supply Total
As on 30.09.2016
LT Supply Total
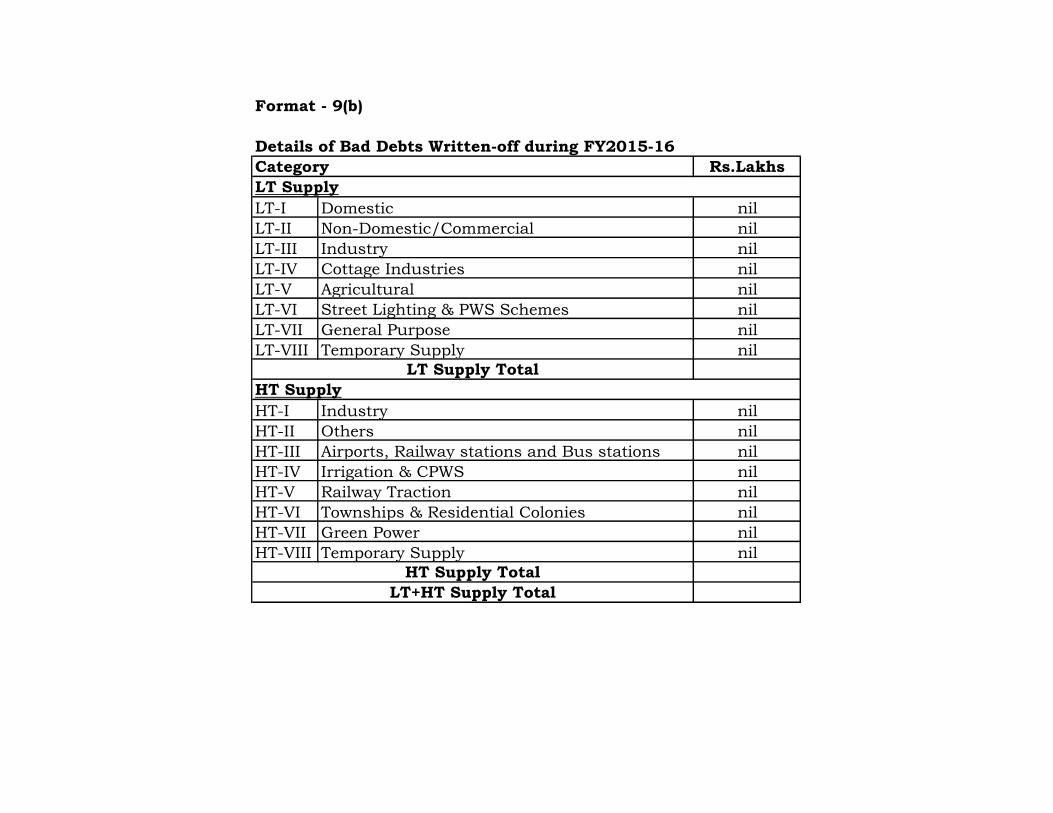
Rs.Lakhs
LT-I Domestic nil
LT-II Non-Domestic/Commercial nil
LT-III Industry nil
LT-IV Cottage Industries nil
LT-V Agricultural nil
LT-VI Street Lighting & PWS Schemes nil
LT-VII General Purpose nil
LT-VIII Temporary Supply nil
HT-I Industry nil
HT-II Others nil
HT-III Airports, Railway stations and Bus stations nil
HT-IV Irrigation & CPWS nil
HT-V Railway Traction nil
HT-VI Townships & Residential Colonies nil
HT-VII Green Power nil
HT-VIII Temporary Supply nil
LT+HT Supply Total
LT Supply
Format - 9(b)
Details of Bad Debts Written-off during FY2015-16
Category
LT Supply Total
HT Supply
HT Supply Total
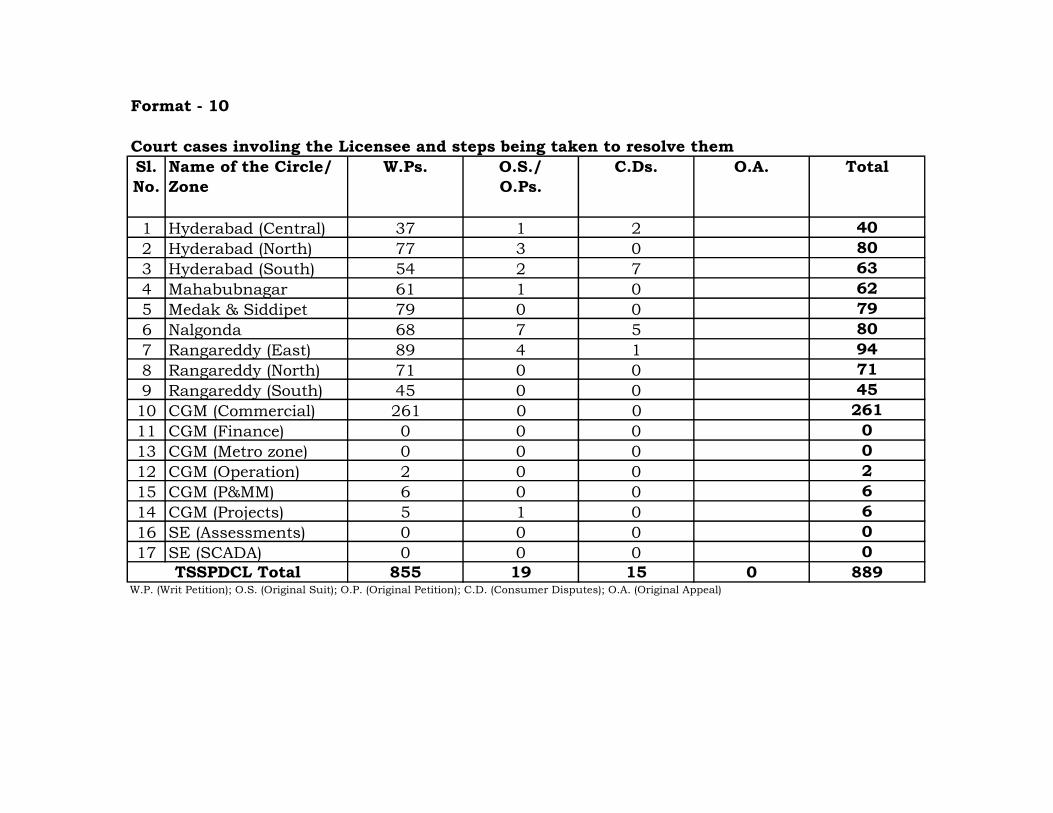
1 Hyderabad (Central) 37 1 2 40
2 Hyderabad (North) 77 3 0 80
3 Hyderabad (South) 54 2 7 63
4 Mahabubnagar 61 1 0 62
5 Medak & Siddipet 79 0 0 79
6 Nalgonda 68 7 5 80
7 Rangareddy (East) 89 4 1 94
8 Rangareddy (North) 71 0 0 71
9 Rangareddy (South) 45 0 0 45
10 CGM (Commercial) 261 0 0 261
11 CGM (Finance) 0 0 0 0
13 CGM (Metro zone) 0 0 0 0
12 CGM (Operation) 2 0 0 2
15 CGM (P&MM) 6 0 0 6
14 CGM (Projects) 5 1 0 6
16 SE (Assessments) 0 0 0 0
17 SE (SCADA) 0 0 0 0
855 19 15 0 889
Format - 10
Sl.
No.
TSSPDCL Total
Name of the Circle/
Zone
W.Ps.
Court cases involing the Licensee and steps being taken to resolve them
O.S./
O.Ps.
W.P. (Writ Petition); O.S. (Original Suit); O.P. (Original Petition); C.D. (Consumer Disputes); O.A. (Original Appeal)
C.Ds. O.A. Total

Sl.
No.
Circle Total No. of cases
booked
Provisional Amount
Accessed (Rs. in
lakhs)
Amount of Assesment
realized (Rs. in
Lakhs)
1 Hyderabad (Central) 845 150.40 115.28
2 Hyderabad (North) 1074 72.75 61.58
3 Hyderabad (South) 2227 202.21 74.56
4 Mahabubnagar 9691 160.23 45.99
5 Medak & Siddipet 6578 146.38 56.02
6 Nalgonda 8660 154.45 81.16
7 Rangareddy (East) 2038 66.77 52.31
8 Rangareddy (North) 1935 108.63 63.46
9 Rangareddy (South) 2653 107.94 51.72
10 HT (DPE only) 1 164.14 22.96
35702 1333.89746 625.04608
1 Hyderabad (Central) 1267 118.04 57.48
2 Hyderabad (North) 1642 78.00 42.99
3 Hyderabad (South) 2626 167.81 32.25
4 Mahabubnagar 6645 133.90 26.75
5 (a) Medak 3161 79.19 25.05
5 (b) Siddipet 7963 107.28 35.56
6 Nalgonda 2119 51.33 31.88
7 Rangareddy (East) 1711 128.85 93.54
8 Rangareddy (North) 2921 248.46 64.63
9 Rangareddy (South) 1937 50.61 5.11
10 HT (DPE only) - - -
31992 1163.44024 415.2361
During H1 of FY2016-17
Number of cases filed in respect of pilferage of power in various categories giving comparative
picture with previous year
Format - 11
During FY2015-16
TSSPDCL Total
TSSPDCL Total
CoS Formats

Company Name TSSPDCL
Filing Date (dd/mm/yy)
Multi Year Tariff Period FY 2014-2019
Year of ARR filing FY 2017-18
Data Type CoS Inputs
1 New Consumer Categories Form 1
2 ARR -Retail Supply Business Form 2
3 Percentage Cost Allocation Form 3
4 Cost Allocation Factors Form 4
5 Transmission Contracts Form 5
6 Percentage Losses Form 6
7 Classification of Asset Base Form 7
S. No. Title Form No.
Page 237
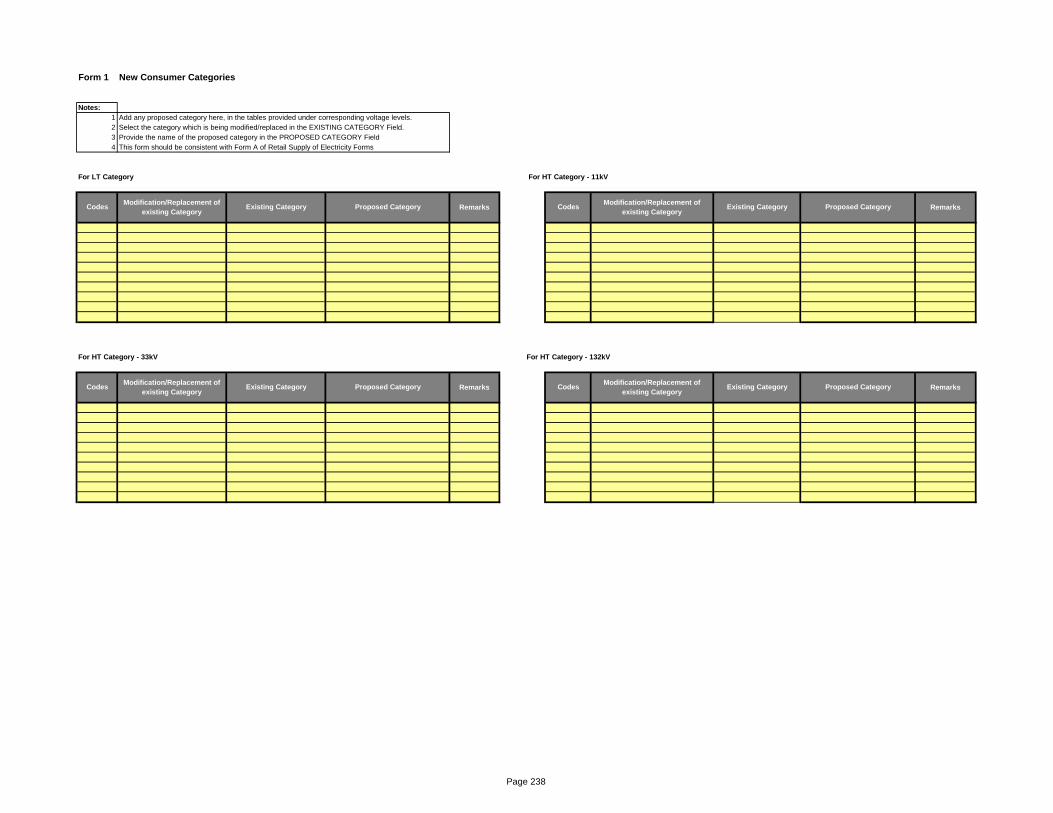
Form 1 New Consumer Categories
Notes:
1 Add any proposed category here, in the tables provided under corresponding voltage levels.
2 Select the category which is being modified/replaced in the EXISTING CATEGORY Field.
3 Provide the name of the proposed category in the PROPOSED CATEGORY Field
4 This form should be consistent with Form A of Retail Supply of Electricity Forms
For LT Category For HT Category - 11kV
For HT Category - 33kV For HT Category - 132kV
CodesModification/Replacement of
existing CategoryExisting Category Proposed Category
CodesModification/Replacement of
existing CategoryExisting Category Proposed Category
Modification/Replacement of
existing CategoryExisting Category
Modification/Replacement of
existing Category
Remarks Codes
Existing CategoryRemarks Codes
Remarks
Proposed Category Remarks
Proposed Category
Page 238
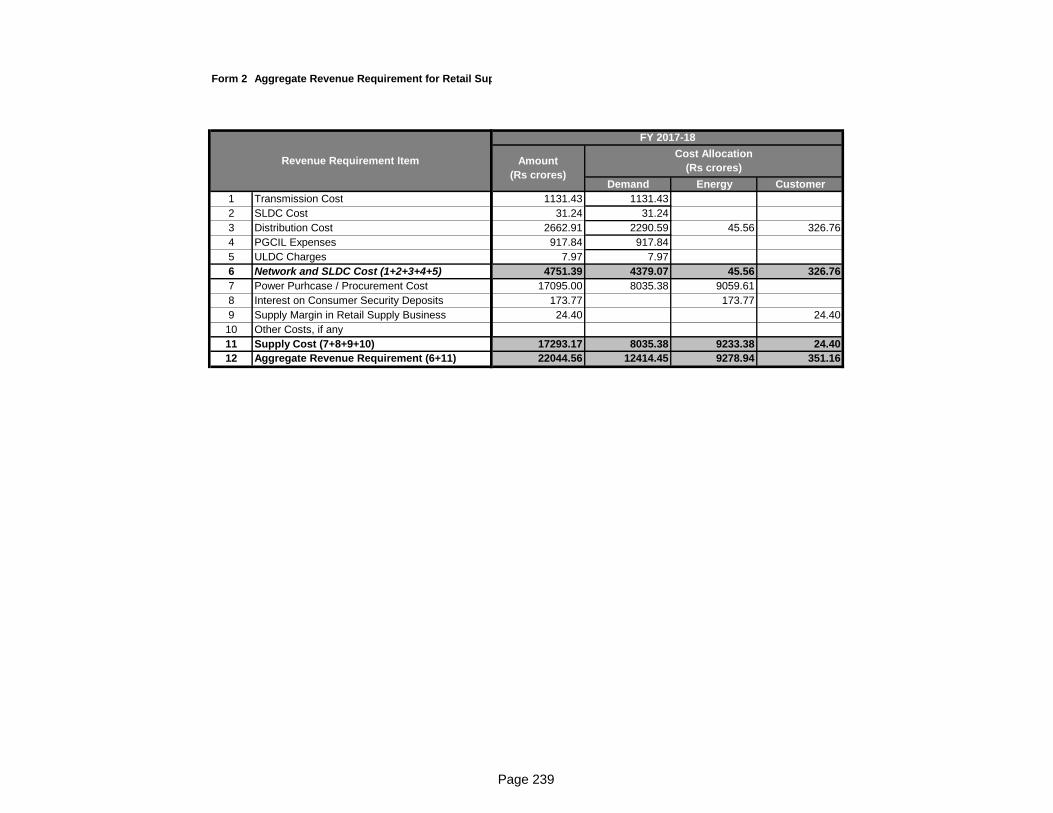
Form 2 Aggregate Revenue Requirement for Retail Supply Business
1 Transmission Cost
2 SLDC Cost
3 Distribution Cost
4 PGCIL Expenses
5 ULDC Charges
6 Network and SLDC Cost (1+2+3+4+5)
7 Power Purhcase / Procurement Cost
8 Interest on Consumer Security Deposits
9 Supply Margin in Retail Supply Business
10 Other Costs, if any
11 Supply Cost (7+8+9+10)
12 Aggregate Revenue Requirement (6+11)
Revenue Requirement Item
Demand Energy Customer
1131.43 1131.43
31.24 31.24
2662.91 2290.59 45.56 326.76
917.84 917.84
7.97 7.97
4751.39 4379.07 45.56 326.76
17095.00 8035.38 9059.61
173.77 173.77
24.40 24.40
17293.17 8035.38 9233.38 24.40
22044.56 12414.45 9278.94 351.16
Amount
(Rs crores)
Cost Allocation
(Rs crores)
FY 2017-18
Page 239

Form 3
Total Power Purchase Cost
Fixed Cost
Variable Cost
Incentive
Income Tax
Others
Interest on Consumer Security Deposits
Supply Margin in Retail Supply Business
Other Costs, if any
Total Supply Cost
Particulars
Demand Energy Customer
17095.00
7784.33 100.00 0.00 0.00
9059.610
100.00 0.00
0.00 0.00 100.00 0.00
0.00 100.00 0.00 0.00
251.06 100.00 0.00 0.00
173.77 0.00 100.00 0.00
24.40 0.00 0.00 100.00
17293.17
FY 2017-18
Amount
(Rs crores)
% allocation
Page 240

FY 2017-18
Energy
MU
Capacity
MW
Commercial
Loss
%
Non-
coincident
Demand
%
Coincident
Demand
Morning
%
Coincident
Demand
Evening
%
Class Load
Factor
Class
Coincidenc
e Factor -
Morning
Class
Coincidenc
e Factor -
Evening
LT Category 19710.76 14439.92 7671660.6 0.00 14141.8
Category I Domestic 8028.32 7133.84 5701127.97 35.30% 32.01% 34.63% 35.38% 71.59% 85% 90% 5849.5 7.29
Category II - Non-domestic/Commercial 2350.89 2315.53 788632.38 10.34% 10.01% 10.93% 11.19% 67.05% 86% 91% 1746.6 7.43
Category III (A & B) - Industrial 858.05 860.67 42625.90 3.77% 3.76% 4.62% 4.06% 65.19% 96% 88% 647.9 7.55
Category IV - Cottage Industries & Dhobighats 10.14 10.36 3722.52 0.04% 0.03% 0.04% 0.03% 87.86% 98% 85% 6.5 6.41
Category V (A), A(I) & A(II) - Irrigation and
Agriculture 7643.74 3849.45 1042447.36 33.61% 29.64% 33.53% 33.96% 73.60% 90% 95% 5357.2 7.01
Category V (B) - Agriculture (Tatkal)
Category VI - Local Bodies, St. Lighting & PWS 747.00 219.29 70069.25 3.28% 4.25% 2.16% 1.56% 50.21% 40% 30% 485.7 6.50
Category VII (A &B) - General & Religious
Purposes 70.55 49.29 22860.22 0.30% 0.40% 0.20% 0.15% 49.22% 40% 30% 47.1 6.68
Category VIII-Temporary Supply 2.06 1.50 175.00 0.01% 0.01% 0.01% 0.00% 49.22% 40% 30% 1.4 6.57
HT Category at 11 KV 4761.42 2228.12 8365.31332 0.00 3168.1
HT-I Industry Segregated 3087.57 1364.30 4786 8.65% 7.64% 9.39% 9.23% 73.48% 96.41% 98.62% 2067.4 6.70
Lights & Fans
Colony consumption
Seasonal Industries
HT-I Industrial Time-of-Day Tariff (6 PM to 10
PM)
HT-I (B) Ferro-Alloys
HT-II Industrial Non-Segregated 1497.32 764.12 3122 4.19% 3.27% 4.07% 4.02% 83.26% 97.55% 100.00% 987.9 6.60
HT-III Railway Stations, Bus Stations & Airports 6.09 2.12 11 0.02% 0.02% 0.02% 0.02% 58.70% 69.97% 100.00% 4.1 6.65
HT-IV A Govt. Lift Irrigation Schemes 48.23 35.00 227 0.14% 0.16% 0.08% 0.08% 62.27% 44.37% 44.53% 30.2 6.26
HT-IV B Agriculture
HT-IVC - Composite Public Water Supply
Schemes
HT-VI Townships and Residential Colonies 88.55 43.35 105 0.25% 0.21% 0.20% 0.20% 75.18% 74.69% 77.46% 54.8 6.18
HT-VII - Green Power
RESCOs
Temporary Supply 33.65 19.23 115 0.09% 8.02% 0.10% 0.10% 76.34% 99.58% 99.93% 23.8 7.06
HT Category at 33 KV 4880.21 1364.11 513 0.00 2783.8
HT-I Industry Segregated 4154.72 1058.57 353 0.00% 0.00% 0.00% 0.00% 80.78% 97.93% 99.01% 2335.6 5.62
Lights & Fans
Colony consumption
Seasonal Industries
HT-I Industrial Time-of-Day Tariff (6 PM to 10
PM)
HT-I (B) Ferro-Alloys
HT-II Industrial Non-Segregated 661.07 260.62 129 0.00% 0.00% 0.00% 0.00% 75.80% 98.37% 98.92% 406.7 6.15
HT-III Railway Stations, Bus Stations & Airports 0.00 0.00 0 0.00% 0.00% 0.00% 0.00% #DIV/0! #DIV/0! #DIV/0! 0.0 #DIV/0!
HT-IV A Govt. Lift Irrigation Schemes 19.32 17.00 21 0.00% 0.00% 0.00% 0.00% 67.50% 0.00% 70.10% 12.4 6.42
HT-IV B Agriculture
HT-IVC - Composite Public Water Supply
Schemes
HT-VI Townships and Residential Colonies 45.10 27.92 11 0.00% 0.00% 0.00% 0.00% 74.38% 70.23% 77.51% 29.1 6.46
HT-VII - Green Power
RESCOs
Cost
allocation
(Rs Cr)
Cost to
Serve (Rs/
kWh)
Consumer Category
Sales
Number of
Consumers
Load (MVA /
MW) - HP
Converted to
MVA
Approved
FACTORSCommercial Loss
Page 241

Energy
MU
Capacity
MW
Commercial
Loss
%
Non-
coincident
Demand
%
Coincident
Demand
Morning
%
Coincident
Demand
Evening
%
Class Load
Factor
Class
Coincidenc
e Factor -
Morning
Class
Coincidenc
e Factor -
Evening
Cost
allocation
(Rs Cr)
Cost to
Serve (Rs/
kWh)
Consumer Category
Sales
Number of
Consumers
Load (MVA /
MW) - HP
Converted to
MVA
Approved
FACTORSCommercial Loss
Temporary Supply
HT Category at 132 KV 3491.66 1430.75 70.3826352 0.00 1950.8
HT-I Industry Segregated 2202.69 525.36 36 0.00% 0.00% 0.00% 0.00% 83.46% 98.18% 100.00% 1163.5 5.28
Lights & Fans
Colony consumption
Seasonal Industries
HT-I Industrial Time-of-Day Tariff (6 PM to 10
PM)
HT-I (B) Ferro-Alloys 165.81 28.30 2 0.00% 0.00% 0.00% 0.00% 94.95% 96.44% 97.60% 79.7 4.81
HT-II Industrial Non-Segregated 67.92 29.10 7 0.00% 0.00% 0.00% 0.00% 75.80% 98.42% 98.81% 40.7 5.99
HT-III Railway Stations, Bus Stations & Airports 58.19 23.00 4 0.00% 0.00% 0.00% 0.00% 65.59% 36.78% 54.88% 28.1 4.83
HT-IV A Govt. Lift Irrigation Schemes 831.16 720.00 11 0.00% 0.00% 0.00% 0.00% 69.58% 20.00% 70.00% 529.1 6.37
HT-IV B Agriculture
HT-IVC - Composite Public Water Supply
Schemes
HT-V Railway Traction 147.22 93.00 7 0.00% 0.00% 0.00% 0.00% 72.27% 89.12% 91.35% 94.7 6.43
HT-VB HMR 18.66 12.00 4 0.00% 0.00% 0.00% 0.00% 38.19% 88.89% 77.78% 15.1 8.11
HT-VI Townships and Residential Colonies
HT-VII - Green Power
RESCOs
Temporary Supply
Total 32844.04 19462.90 7680609.52 0.00 22044.5 6.71188623
Page 242
Form 5 Transmission Contracts
FY 2013-14 FY 2014-15 FY 2015-16
Total Installed Generation Capacity - Discom's Share (MW)
Transmission Contracts of Discoms with APTransco (MW/MVA)
Transmission Contracts of Discoms with PGCIL (MW/MVA)
Discom's Share in CGS (MW)
Discom's NCP (MW)
Discom's CP (MW)
FY 2016-17 FY 2017-18 FY 2018-19
Total Installed Generation Capacity - Discom's Share (MW) 9349.91
Transmission Contracts of Discoms with APTransco (MW/MVA) 9886.00
Transmission Contracts of Discoms with PGCIL (MW/MVA) 2852.66
Discom's Share in CGS (MW) 1533.75
Discom's NCP (MW) 5811.31
Discom's CP (MW) 5175.75
RemarksParticulars FY 2013-14 FY 2014-15 FY 2015-16
Particulars FY 2017-18 FY 2018-19Remarks
FY 2016-17
Page 243
Form 6 Percentage Losses
Energy Losses %
Technical LT Losses 2.16%
Technical HT Losses (11 kV) 3.39%
Technical HT Losses (33 kV) 3.99%
Total Technical Losses 9.54%
Commercial LT Losses 1.16%
Commercial HT Losses (11 kV) 0.18%
Commercial HT Losses (33 kV) 0.00%
Total Commercial Losses 1.34%
Total Energy Losses 10.88%
Demand Losses %
Technical LT Losses 2.33%
Technical HT Losses (11 kV) 3.79%
Technical HT Losses (33 kV) 4.49%
Total Technical Losses 10.61%
Commercial LT Losses 1.03%
Commercial HT Losses (11 kV) 0.17%
Commercial HT Losses (33 kV) 0.00%
Total Commercial Losses 1.20%
Total Demand Losses 11.81%
Transmission loss %
APTransco Losses 3.38%
PGCIL Losses 3.44%
Total Transmission Losses % 5.22%
Particulars FY 2016-17 FY 2017-18 FY 2018-19
Page 244

Form 7
Assets Base for Discom
Land & Rights
Buildings
Hydraulic Works
Other Civil Works
Plant & Machinery
Lines, Cable, Network, etc.
Vehicles
Furniture and Fixtures
Office Equipments
Spare parts and other assets
Borrowings for Working Capital
Less: Contribution, Grants, Subsidies
Total Assets With Adjustments
Voltage wise-Distibution Assets
LT
11kV
33kV
Assets Base for Generation
Total Assets
Assets Base for Transmission
Total Assets
Asset
Demand Energy Customer
158.50 126.80 31.70
218.66 174.93 43.73
249.79 199.83 49.96
8572.70 6858.16 1714.54
6238.57 4990.86 1247.71
2.82
18.43 14.74 3.69
121.62 97.30 24.32
15,581.09
14,811.27
3525.85
8895.98
2389.44
FY 2017-18
Total Assets
Rs crores
% allocation
Page 245

Retail Supply Formats
Company Name TSSPDCL
Filing Date (dd/mm/yy) 30.11.2016
Multi Year Tariff Period FY 2015-19
Year FY2017-18
Commission' s Regulations Reg-4/2005
Business type Retail Supply of Electricity
1 Aggregate Revenue Requirement for Retail Supply Business Form 1
2 Transmission Cost Form 1.1
3 SLDC Charges Form 1.2
4 Distribution Cost Form 1.3
5 Power Purchase and Procurement Cost (For Regulated Business) Form 1.4
6 NCE Generation (Base Year) Form 1.4 (i)
7 NCE Generation (Year 1) Form 1.4(ii)
8 NCE Generation (Year 2) Form 1.4(iii)
9 NCE Generation (Year 3) Form 1.4(iv)
10 NCE Generation (Year 4) Form 1.4(v)
11 NCE Generation (Year 5) Form 1.4(vi)
12 Power Purchase and Procurement Cost (For Non-regulated Business) Form 1.4a
13 Sales to Licensees Form 1.4b
14 Discom-Discom Purchases Form 1.4c
15 Interest on Consumer Security Deposits Form 1.5
16 Supply Margin Form 1.6
17 Other Costs Form 1.7
18 New consumer categories Form A
19 Cost of Service: Embedded Cost Method Form 2
20 Sales Forecast Form 3
21 Power Purchase Requirement Form 4
22 Energy Losses (Distribution System) Form 4a
23 Transmission Losses Form 4b
24 Energy Availability Form 4.1
25 Energy Dispatch Form 4.2
26 Revenue from Current Tariffs Form 5
27 Incentives at current Tariffs Form 5a
28 Consumers switching to competition Form 5b
29 Consumers served under Open Access as per Section 42 and Section 49 of E Act Form 5c
30 Non-tariff Income at current charges Form 6
31 Total Revenue at Current tariff and Charges Form 7
32 Revenue Deficit/Surplus at current tariff and charges Form 8
33 Revenue Deficit/Surplus and Proposed Adjustments Form 9
34 Revenue from Proposed Tariffs Form 10
35 Incentives at Proposed Tariffs Form 10a
36 Non-tariff Income at proposed charges Form 11
37 Total Revenue at Proposed Tariff and Charges Form 12
38 Cost and Revenue Form 13
S. No. Title Form No.

Notes:
1) Base Year Base Year for the First control period FY15-19 is FY2013-14
2014-15 Year 1 is the First Year of the control Period, FY2014-15
2015-16 Year 2 is the Second Year of the control Period, FY2015-16
2016-17 Year 3 is the Third Year of the control Period, FY2016-17
2017-18 Year 4 is the Fourth Year of the control Period, FY2017-18
2018-19 Year 5 is the Five Year of the control Period, FY2018 -19
2) Filings 2013-14, Licensees shall provide
Full projections for FY2015-16
Estimates for FY2014-15 based on actuals for first half of the year
Actuals for FY2013-14
3)
4)
5) New Categories
The Licensees shall add the proposed categories in Form A, the new categories would be then updated automatically in other forms
The new categories are segregated voltage-wise in Form A
6)
7) Phasing of Open Access as per Regulation 2 of 2005 of APERC
Eligibility Criteria for Open Access
Phase Eligibility criteria Commencement date
1 Consumers availing of power from NCE developers
irrespective of the quantum of contracted capacity
September, 2005
2 Contracted capcity being greater than 5 MW September, 2005
3 Contracted capacity being greater than 2 MW September, 2006
4 Contracted capacity being greater than 1 MW April, 2008
8) Terminology for Open Access Status
1 Load not eligible for Open Access
2 Load Eligible for Open Access
3 Availed (within area of supply)
4 Availed ( Outside Area of supply)
Load within the area of supply of the licensees and satisfying the eligibility criteria to avail open
access as per Commission's Regulation during the period under consideration whether availing
power through Open Access or not.
Load within the area of supply of the Licensee and availing power through Open Access whether
from the same Licensee or any other supplier.
Load outside the area of supply of the Licensee but availing power through Open Access from the
Licensee under consideration.
Regulated Business: The retail supply of electricity to (i) consumers within the area of supply of the licensee and not eligible to
avail Open Access as per Commission’s Regulations (ii) consumers within the area of supply of the licensee and eligible to avail
Open Access but not exercising their option of availing open access.
Non-regulated Business: The retail supply of electricity to consumers availing supply under open access from the licensee
either forming the part of area of supply of the licensee or outside the area of supply of the licensee.
Direct Non-Tariff Income: Non-Tariff income which is directly identifiable with a consumer category.
Apportioned Non-Tariff Income: Non-Tariff income which is not directly identifiable with a consumer category. It shall be
appropriately apportioned across various consumer categories.
Modification/addition of Slabs/sub categories for LT consumers should be carried out in Form 7 for Current Tariff and Form 12
for Proposed Tariff.See notes in the relevant form for details
Load within the area of supply of the licensees not satisfying the eligibility criteria to avail open
access as per Commission's Regulation during the time period under consideration.
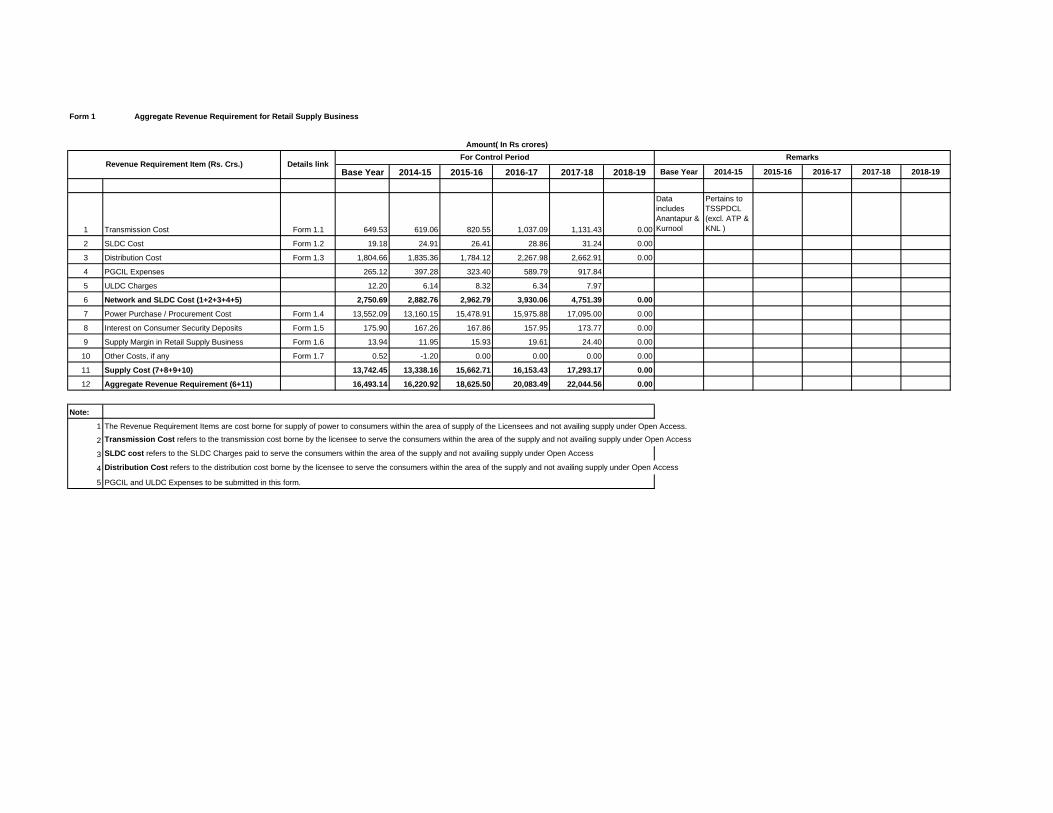
Form 1
Amount( In Rs crores)
Base Year 2014-15 2015-16 2016-17 2017-18 2018-19 Base Year 2014-15 2015-16 2016-17 2017-18 2018-19
1 Transmission Cost Form 1.1 649.53 619.06 820.55 1,037.09 1,131.43 0.00
Data
includes
Anantapur &
Kurnool
Pertains to
TSSPDCL
(excl. ATP &
KNL )
2 SLDC Cost Form 1.2 19.18 24.91 26.41 28.86 31.24 0.00
3 Distribution Cost Form 1.3 1,804.66 1,835.36 1,784.12 2,267.98 2,662.91 0.00
4 PGCIL Expenses 265.12 397.28 323.40 589.79 917.84
5 ULDC Charges 12.20 6.14 8.32 6.34 7.97
6 Network and SLDC Cost (1+2+3+4+5) 2,750.69 2,882.76 2,962.79 3,930.06 4,751.39 0.00
7 Power Purchase / Procurement Cost Form 1.4 13,552.09 13,160.15 15,478.91 15,975.88 17,095.00 0.00
8 Interest on Consumer Security Deposits Form 1.5 175.90 167.26 167.86 157.95 173.77 0.00
9 Supply Margin in Retail Supply Business Form 1.6 13.94 11.95 15.93 19.61 24.40 0.00
10 Other Costs, if any Form 1.7 0.52 -1.20 0.00 0.00 0.00 0.00
11 Supply Cost (7+8+9+10) 13,742.45 13,338.16 15,662.71 16,153.43 17,293.17 0.00
12 Aggregate Revenue Requirement (6+11) 16,493.14 16,220.92 18,625.50 20,083.49 22,044.56 0.00
Note:
1 The Revenue Requirement Items are cost borne for supply of power to consumers within the area of supply of the Licensees and not availing supply under Open Access.
2 Transmission Cost refers to the transmission cost borne by the licensee to serve the consumers within the area of the supply and not availing supply under Open Access
3 SLDC cost refers to the SLDC Charges paid to serve the consumers within the area of the supply and not availing supply under Open Access
4 Distribution Cost refers to the distribution cost borne by the licensee to serve the consumers within the area of the supply and not availing supply under Open Access
5 PGCIL and ULDC Expenses to be submitted in this form.
Aggregate Revenue Requirement for Retail Supply Business
Revenue Requirement Item (Rs. Crs.) Details linkFor Control Period Remarks
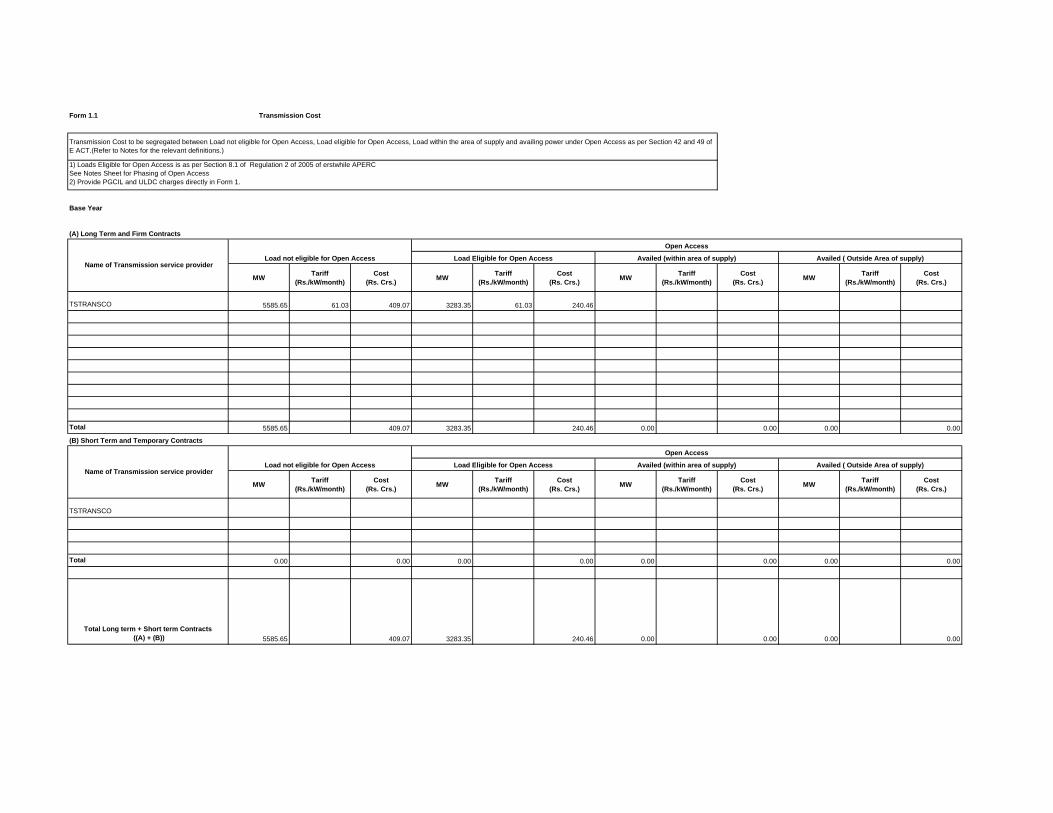
Form 1.1
1001 1001 1001 1002 1002 1002 1003 1003 1003 1004 1004 1004
Base Year
MWTariff
(Rs./kW/month)
Cost
(Rs. Crs.)MW
Tariff
(Rs./kW/month)
Cost
(Rs. Crs.)MW
Tariff
(Rs./kW/month)
Cost
(Rs. Crs.)MW
Tariff
(Rs./kW/month)
Cost
(Rs. Crs.)
TSTRANSCO 5585.65 61.03 409.07 3283.35 61.03 240.46
Total 5585.65 409.07 3283.35 240.46 0.00 0.00 0.00 0.00
MWTariff
(Rs./kW/month)
Cost
(Rs. Crs.)MW
Tariff
(Rs./kW/month)
Cost
(Rs. Crs.)MW
Tariff
(Rs./kW/month)
Cost
(Rs. Crs.)MW
Tariff
(Rs./kW/month)
Cost
(Rs. Crs.)
TSTRANSCO
Total 0.00 0.00 0.00 0.00 0.00 0.00 0.00 0.00
Total Long term + Short term Contracts
((A) + (B)) 5585.65 409.07 3283.35 240.46 0.00 0.00 0.00 0.00
Transmission Cost
Transmission Cost to be segregated between Load not eligible for Open Access, Load eligible for Open Access, Load within the area of supply and availing power under Open Access as per Section 42 and 49 of
E ACT.(Refer to Notes for the relevant definitions.)
1) Loads Eligible for Open Access is as per Section 8.1 of Regulation 2 of 2005 of erstwhile APERC
See Notes Sheet for Phasing of Open Access
2) Provide PGCIL and ULDC charges directly in Form 1.
(A) Long Term and Firm Contracts
Name of Transmission service providerLoad not eligible for Open Access
Open Access
Load Eligible for Open Access Availed (within area of supply) Availed ( Outside Area of supply)
(B) Short Term and Temporary Contracts
Name of Transmission service providerLoad not eligible for Open Access
Open Access
Load Eligible for Open Access Availed (within area of supply) Availed ( Outside Area of supply)
2014-15 Year 1
MWTariff
(Rs./kW/month)
Cost
(Rs. Crs.)MW
Tariff
(Rs./kW/month)
Cost
(Rs. Crs.)MW
Tariff
(Rs./kW/month)
Cost
(Rs. Crs.)MW
Tariff
(Rs./kW/month)
Cost
(Rs. Crs.)
TSTRANSCO 5628.64 65.30 441.06 2389.40 65.30 187.23
TSTRANSCO
diff cost adj. -9.24
Total 5628.64 431.82 2389.40 187.23 0.00 0.00 0.00 0.00
MWTariff
(Rs./kW/month)
Cost
(Rs. Crs.)MW
Tariff
(Rs./kW/month)
Cost
(Rs. Crs.)MW
Tariff
(Rs./kW/month)
Cost
(Rs. Crs.)MW
Tariff
(Rs./kW/month)
Cost
(Rs. Crs.)
TSTRANSCO
Total 0.00 0.00 0.00 0.00 0.00 0.00 0.00 0.00
Total Long term + Short term Contracts
((A) + (B)) 5628.64 431.82 2389.40 187.23 0.00 0.00 0.00 0.00
(A) Long Term and Firm Contracts
Name of Transmission service providerLoad not eligible for Open Access
Open Access
Load Eligible for Open Access Availed (within area of supply) Availed ( Outside Area of supply)
(B) Short Term and Temporary Contracts
Name of Transmission service providerLoad not eligible for Open Access
Open Access
Load Eligible for Open Access Availed (within area of supply) Availed ( Outside Area of supply)

2015-16 Year 2
MWTariff
(Rs./kW/month)
Cost
(Rs. Crs.)MW
Tariff
(Rs./kW/month)
Cost
(Rs. Crs.)MW
Tariff
(Rs./kW/month)
Cost
(Rs. Crs.)MW
Tariff
(Rs./kW/month)
Cost
(Rs. Crs.)
TSTRANSCO 6284.94 76.66 578.16 2634.86 76.66 242.39
Total 6284.94 578.16 2634.86 242.39 0.00 0.00 0.00 0.00
MWTariff
(Rs./kW/month)
Cost
(Rs. Crs.)MW
Tariff
(Rs./kW/month)
Cost
(Rs. Crs.)MW
Tariff
(Rs./kW/month)
Cost
(Rs. Crs.)MW
Tariff
(Rs./kW/month)
Cost
(Rs. Crs.)
TSTRANSCO
Total 0.00 0.00 0.00 0.00 0.00 0.00 0.00 0.00
Total Long term + Short term Contracts
((A) + (B)) 6284.94 578.16 2634.86 242.39 0.00 0.00 0.00 0.00
(A) Long Term and Firm Contracts
Name of Transmission service providerLoad not eligible for Open Access
Open Access
Load Eligible for Open Access Availed (within area of supply) Availed ( Outside Area of supply)
(B) Short Term and Temporary Contracts
Name of Transmission service providerLoad not eligible for Open Access
Open Access
Load Eligible for Open Access Availed (within area of supply) Availed ( Outside Area of supply)

2016-17 Year 3
MWTariff
(Rs./kW/month)
Cost
(Rs. Crs.)MW
Tariff
(Rs./kW/month)
Cost
(Rs. Crs.)MW
Tariff
(Rs./kW/month)
Cost
(Rs. Crs.)MW
Tariff
(Rs./kW/month)
Cost
(Rs. Crs.)
TSTRANSCO 6259.61 91.36 686.25 3200.14 91.36 350.84
Total 6259.61 686.25 3200.14 350.84 0.00 0.00 0.00 0.00
MWTariff
(Rs./kW/month)
Cost
(Rs. Crs.)MW
Tariff
(Rs./kW/month)
Cost
(Rs. Crs.)MW
Tariff
(Rs./kW/month)
Cost
(Rs. Crs.)MW
Tariff
(Rs./kW/month)
Cost
(Rs. Crs.)
TSTRANSCO
Total 0.00 0.00 0.00 0.00 0.00 0.00 0.00 0.00
Total Long term + Short term Contracts
((A) + (B)) 6259.61 686.25 3200.14 350.84 0.00 0.00 0.00 0.00
(A) Long Term and Firm Contracts
Name of Transmission service providerLoad not eligible for Open Access
Open Access
Load Eligible for Open Access Availed (within area of supply) Availed ( Outside Area of supply)
(B) Short Term and Temporary Contracts
Name of Transmission service providerLoad not eligible for Open Access
Open Access
Load Eligible for Open Access Availed (within area of supply) Availed ( Outside Area of supply)

2017-18 Year 4
MWTariff
(Rs./kW/month)
Cost
(Rs. Crs.)MW
Tariff
(Rs./kW/month)
Cost
(Rs. Crs.)MW
Tariff
(Rs./kW/month)
Cost
(Rs. Crs.)MW
Tariff
(Rs./kW/month)
Cost
(Rs. Crs.)
TSTRANSCO 6526.19 95.37 746.88 3360.15 95.37 384.55
Total 6526.19 746.88 3360.15 384.55 0.00 0.00 0.00 0.00
MWTariff
(Rs./kW/month)
Cost
(Rs. Crs.)MW
Tariff
(Rs./kW/month)
Cost
(Rs. Crs.)MW
Tariff
(Rs./kW/month)
Cost
(Rs. Crs.)MW
Tariff
(Rs./kW/month)
Cost
(Rs. Crs.)
TSTRANSCO
Total 0.00 0.00 0.00 0.00 0.00 0.00 0.00 0.00
Total Long term + Short term Contracts
((A) + (B)) 6526.19 746.88 3360.15 384.55 0.00 0.00 0.00 0.00
(A) Long Term and Firm Contracts
Name of Transmission service providerLoad not eligible for Open Access
Open Access
Load Eligible for Open Access Availed (within area of supply) Availed ( Outside Area of supply)
(B) Short Term and Temporary Contracts
Name of Transmission service providerLoad not eligible for Open Access
Open Access
Load Eligible for Open Access Availed (within area of supply) Availed ( Outside Area of supply)
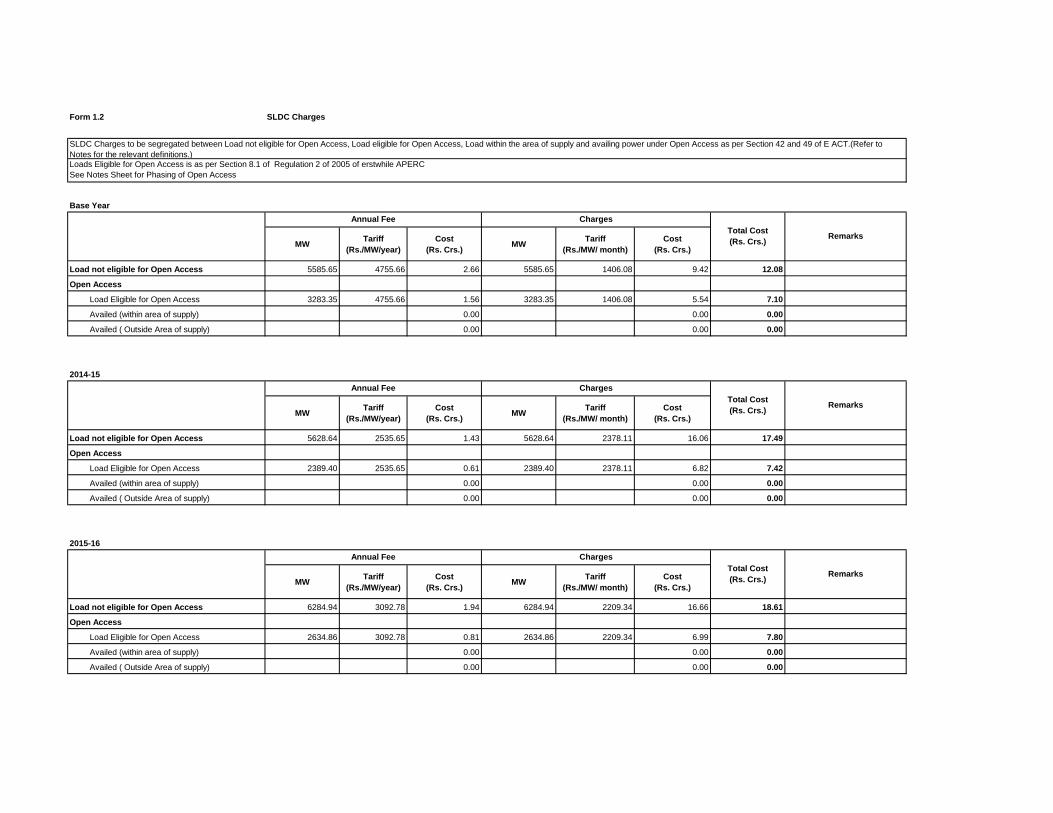
Form 1.2 SLDC Charges
Base Year
MWTariff
(Rs./MW/year)
Cost
(Rs. Crs.)MW
Tariff
(Rs./MW/ month)
Cost
(Rs. Crs.)
Load not eligible for Open Access 5585.65 4755.66 2.66 5585.65 1406.08 9.42 12.08
Open Access
Load Eligible for Open Access 3283.35 4755.66 1.56 3283.35 1406.08 5.54 7.10
Availed (within area of supply) 0.00 0.00 0.00
Availed ( Outside Area of supply) 0.00 0.00 0.00
2014-15
MWTariff
(Rs./MW/year)
Cost
(Rs. Crs.)MW
Tariff
(Rs./MW/ month)
Cost
(Rs. Crs.)
Load not eligible for Open Access 5628.64 2535.65 1.43 5628.64 2378.11 16.06 17.49
Open Access
Load Eligible for Open Access 2389.40 2535.65 0.61 2389.40 2378.11 6.82 7.42
Availed (within area of supply) 0.00 0.00 0.00
Availed ( Outside Area of supply) 0.00 0.00 0.00
2015-16
MWTariff
(Rs./MW/year)
Cost
(Rs. Crs.)MW
Tariff
(Rs./MW/ month)
Cost
(Rs. Crs.)
Load not eligible for Open Access 6284.94 3092.78 1.94 6284.94 2209.34 16.66 18.61
Open Access
Load Eligible for Open Access 2634.86 3092.78 0.81 2634.86 2209.34 6.99 7.80
Availed (within area of supply) 0.00 0.00 0.00
Availed ( Outside Area of supply) 0.00 0.00 0.00
SLDC Charges to be segregated between Load not eligible for Open Access, Load eligible for Open Access, Load within the area of supply and availing power under Open Access as per Section 42 and 49 of E ACT.(Refer to
Notes for the relevant definitions.)
Loads Eligible for Open Access is as per Section 8.1 of Regulation 2 of 2005 of erstwhile APERC
See Notes Sheet for Phasing of Open Access
Annual Fee Charges
Total Cost
(Rs. Crs.)Remarks
Annual Fee Charges
Total Cost
(Rs. Crs.)Remarks
Annual Fee Charges
Total Cost
(Rs. Crs.)Remarks

2016-17
MWTariff
(Rs./MW/year)
Cost
(Rs. Crs.)MW
Tariff
(Rs./MW/ month)
Cost
(Rs. Crs.)
Load not eligible for Open Access 6259.61 3533.18 2.21 6259.61 2247.62 16.88 19.09
Open Access
Load Eligible for Open Access 3200.14 3533.18 1.13 3200.14 2247.62 8.63 9.76
Availed (within area of supply) 0.00 0.00 0.00
Availed ( Outside Area of supply) 0.00 0.00 0.00
2017-18
MWTariff
(Rs./MW/year)
Cost
(Rs. Crs.)MW
Tariff
(Rs./MW/ month)
Cost
(Rs. Crs.)
Load not eligible for Open Access 6526.19 3995.39 2.61 6526.19 2300.31 18.01 20.62
Open Access
Load Eligible for Open Access 3360.15 3995.39 1.34 3360.15 2300.31 9.28 10.62
Availed (within area of supply) 0.00 0.00 0.00
Availed ( Outside Area of supply) 0.00 0.00 0.00
Annual Fee Charges
Total Cost
(Rs. Crs.)Remarks
Annual Fee Charges
Total Cost
(Rs. Crs.)Remarks

Form 1.3
1001 1001 1001 1002 1002 1002 1003 1003 1003 1004 1004 1004
Base Year
MW
Tariff
(Rs./kW/m
onth)
Cost
(Rs. Crs.)MW
Tariff
(Rs./kW/mont
h)
Cost
(Rs. Crs.)MW
Tariff
(Rs./kW/mo
nth)
Cost
(Rs. Crs.)MW
Tariff
(Rs./kW/m
onth)
Cost
(Rs. Crs.)
TS SPDCL ( 33 KV) 1436.20 33.43 60.65 0.00
TS SPDCL ( 11 KV) 260.74 204.79 67.45 0.00
TSSPDCL LT 649.23 0.00 0.00
Total ( Non Eligible OA
Cost) 1676.57
Total 0.00 1676.57 1696.94 128.10 0.00 0.00 0.00 0.00
MW
Tariff
(Rs./kW/m
onth)
Cost
(Rs. Crs.)MW
Tariff
(Rs./kW/mont
h)
Cost
(Rs. Crs.)MW
Tariff
(Rs./kW/mo
nth)
Cost
(Rs. Crs.)MW
Tariff
(Rs./kW/m
onth)
Cost
(Rs. Crs.)
Total 0.00 0.00 0.00 0.00 0.00 0.00 0.00 0.00
Total Long term + Short
term Contracts
((A) + (B)) 0.00 1676.57 1696.94 128.10 0.00 0.00 0.00 0.00
Remarks
Load Eligible for Open Access
Distribution Cost
Distribution Cost to be segregated between Load not eligible for Open Access, Load eligible for Open Access, Load within the area of supply and
availing power under Open Access as per Section 42 and 49 of E ACT.(Refer to Notes for the relevant definitions.)Loads Eligible for Open Access is as per Section 8.1 of Regulation 2 of 2005 of erstwhile APERC
See Notes Sheet for Phasing of Open Access.
(A) Long Term and Firm Contracts
Name of Distribution
service provider
Load not eligible for Open Access
Open Access
Remarks
Load Eligible for Open Access Availed (within area of supply) Availed ( Outside Area of supply)
(B) Short Term and Temporary Contracts
Availed (within area of supply) Availed ( Outside Area of supply) Name of Distribution
service provider
Load not eligible for Open Access
Open Access

2014-15
MW
Tariff
(Rs./kW/m
onth)
Cost
(Rs. Crs.)MW
Tariff
(Rs./kW/mont
h)
Cost
(Rs. Crs.)MW
Tariff
(Rs./kW/mo
nth)
Cost
(Rs. Crs.)MW
Tariff
(Rs./kW/m
onth)
Cost
(Rs. Crs.)
SPDCL ( 33 KV) 1168.51 12.67 18.70
SPDCL ( 11 KV) 254.91 155.91 50.20
SPDCL LT 344.17
Total ( Non Eligible OA
Cost) 1766.46
Total 0.00 1766.46 1423.42 68.90 0.00 0.00 0.00 0.00
MW
Tariff
(Rs./kW/m
onth)
Cost
(Rs. Crs.)MW
Tariff
(Rs./kW/mont
h)
Cost
(Rs. Crs.)MW
Tariff
(Rs./kW/mo
nth)
Cost
(Rs. Crs.)MW
Tariff
(Rs./kW/m
onth)
Cost
(Rs. Crs.)
Total 0.00 0.00 0.00 0.00 0.00 0.00 0.00 0.00
Total Long term + Short
term Contracts
((A) + (B)) 0.00 1766.46 1423.42 68.90 0.00 0.00 0.00 0.00
(A) Long Term and Firm Contracts
Name of Distribution
service provider
Load not eligible for Open Access
Open Access
Remarks
Load Eligible for Open Access Availed (within area of supply) Availed ( Outside Area of supply)
(B) Short Term and Temporary Contracts
Availed (within area of supply) Availed ( Outside Area of supply) Name of Distribution
service provider
Load not eligible for Open Access
Open Access
Remarks
Load Eligible for Open Access
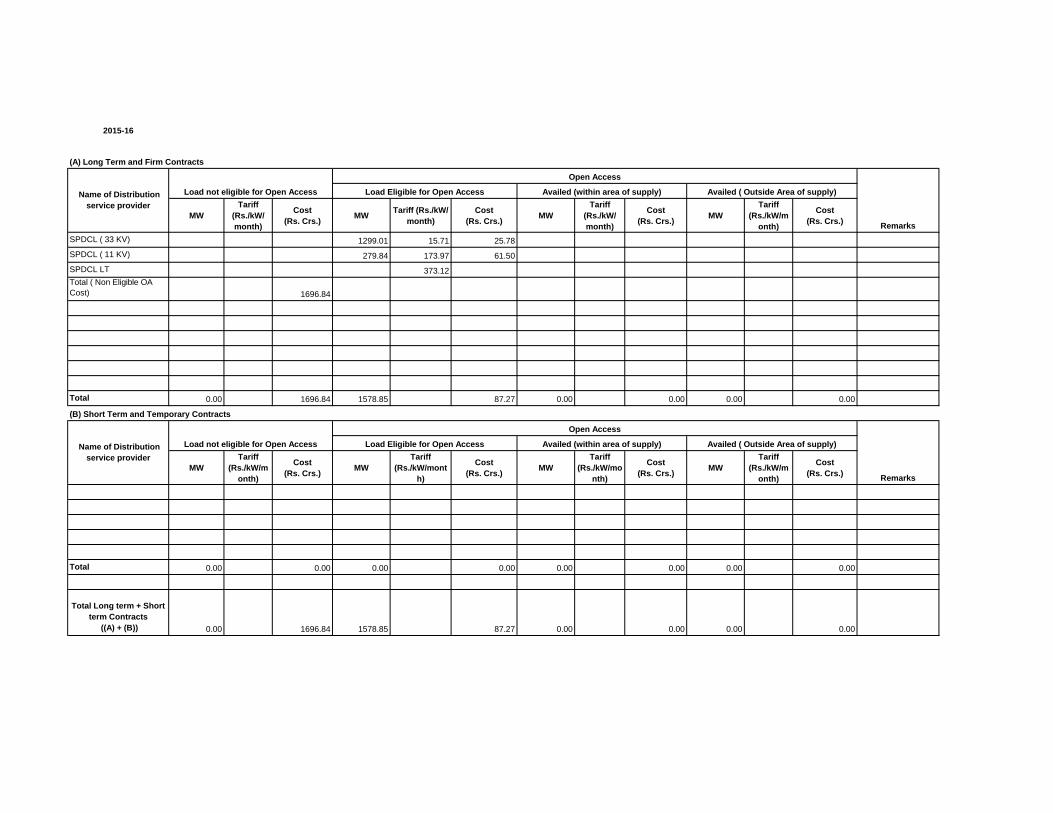
2015-16
MW
Tariff
(Rs./kW/
month)
Cost
(Rs. Crs.)MW
Tariff (Rs./kW/
month)
Cost
(Rs. Crs.)MW
Tariff
(Rs./kW/
month)
Cost
(Rs. Crs.)MW
Tariff
(Rs./kW/m
onth)
Cost
(Rs. Crs.)
SPDCL ( 33 KV) 1299.01 15.71 25.78
SPDCL ( 11 KV) 279.84 173.97 61.50
SPDCL LT 373.12
Total ( Non Eligible OA
Cost) 1696.84
Total 0.00 1696.84 1578.85 87.27 0.00 0.00 0.00 0.00
MW
Tariff
(Rs./kW/m
onth)
Cost
(Rs. Crs.)MW
Tariff
(Rs./kW/mont
h)
Cost
(Rs. Crs.)MW
Tariff
(Rs./kW/mo
nth)
Cost
(Rs. Crs.)MW
Tariff
(Rs./kW/m
onth)
Cost
(Rs. Crs.)
Total 0.00 0.00 0.00 0.00 0.00 0.00 0.00 0.00
Total Long term + Short
term Contracts
((A) + (B)) 0.00 1696.84 1578.85 87.27 0.00 0.00 0.00 0.00
Remarks
Load Eligible for Open Access
(A) Long Term and Firm Contracts
Name of Distribution
service provider
Load not eligible for Open Access
Open Access
Remarks
Load Eligible for Open Access
Name of Distribution
service provider
Load not eligible for Open Access
Open Access
Availed ( Outside Area of supply)
(B) Short Term and Temporary Contracts
Availed (within area of supply) Availed ( Outside Area of supply)
Availed (within area of supply)

2016-17
MW
Tariff
(Rs./kW/m
onth)
Cost
(Rs. Crs.)MW
Tariff
(Rs./kW/mont
h)
Cost
(Rs. Crs.)MW
Tariff
(Rs./kW/mo
nth)
Cost
(Rs. Crs.)MW
Tariff
(Rs./kW/m
onth)
Cost
(Rs. Crs.)
SPDCL ( 33 KV) 1433.56 16.63 30.11
SPDCL ( 11 KV) 304.25 191.53 73.61
SPDCL LT 406.84
Total ( Non Eligible OA
Cost) 2164.26
Total 0.00 2164.26 1737.81 103.72 0.00 0.00 0.00 0.00
MW
Tariff
(Rs./kW/m
onth)
Cost
(Rs. Crs.)MW
Tariff
(Rs./kW/mont
h)
Cost
(Rs. Crs.)MW
Tariff
(Rs./kW/mo
nth)
Cost
(Rs. Crs.)MW
Tariff
(Rs./kW/m
onth)
Cost
(Rs. Crs.)
Total 0.00 0.00 0.00 0.00 0.00 0.00 0.00 0.00
Total Long term + Short
term Contracts
((A) + (B)) 0.00 2164.26 1737.81 103.72 0.00 0.00 0.00 0.00
(A) Long Term and Firm Contracts
Remarks
Load Eligible for Open Access Availed (within area of supply) Availed ( Outside Area of supply)
(B) Short Term and Temporary Contracts
Name of Distribution
service provider
Load not eligible for Open Access
Open Access
Availed (within area of supply) Availed ( Outside Area of supply) Name of Distribution
service provider
Load not eligible for Open Access
Open Access
Remarks
Load Eligible for Open Access
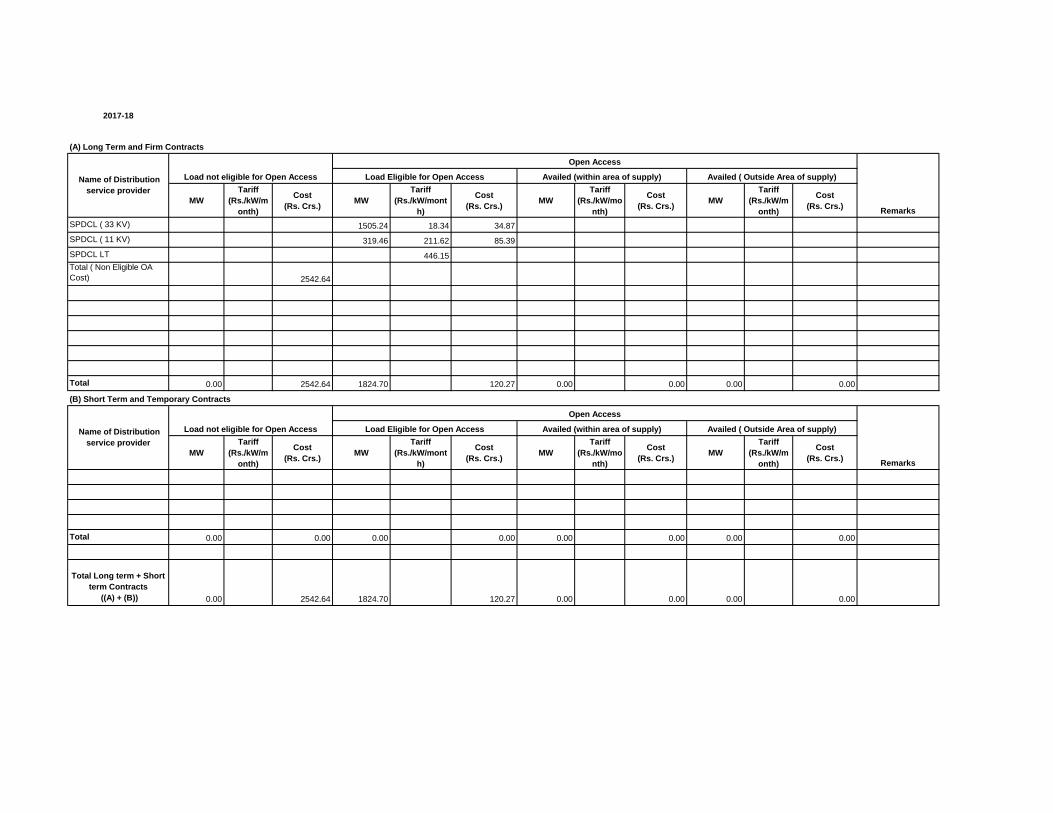
2017-18
MW
Tariff
(Rs./kW/m
onth)
Cost
(Rs. Crs.)MW
Tariff
(Rs./kW/mont
h)
Cost
(Rs. Crs.)MW
Tariff
(Rs./kW/mo
nth)
Cost
(Rs. Crs.)MW
Tariff
(Rs./kW/m
onth)
Cost
(Rs. Crs.)
SPDCL ( 33 KV) 1505.24 18.34 34.87
SPDCL ( 11 KV) 319.46 211.62 85.39
SPDCL LT 446.15
Total ( Non Eligible OA
Cost) 2542.64
Total 0.00 2542.64 1824.70 120.27 0.00 0.00 0.00 0.00
MW
Tariff
(Rs./kW/m
onth)
Cost
(Rs. Crs.)MW
Tariff
(Rs./kW/mont
h)
Cost
(Rs. Crs.)MW
Tariff
(Rs./kW/mo
nth)
Cost
(Rs. Crs.)MW
Tariff
(Rs./kW/m
onth)
Cost
(Rs. Crs.)
Total 0.00 0.00 0.00 0.00 0.00 0.00 0.00 0.00
Total Long term + Short
term Contracts
((A) + (B)) 0.00 2542.64 1824.70 120.27 0.00 0.00 0.00 0.00
Remarks
Load Eligible for Open Access
(A) Long Term and Firm Contracts
Name of Distribution
service provider
Load not eligible for Open Access
Open Access
Remarks
Load Eligible for Open Access
Name of Distribution
service provider
Load not eligible for Open Access
Open Access
Availed ( Outside Area of supply)
(B) Short Term and Temporary Contracts
Availed (within area of supply) Availed ( Outside Area of supply)
Availed (within area of supply)
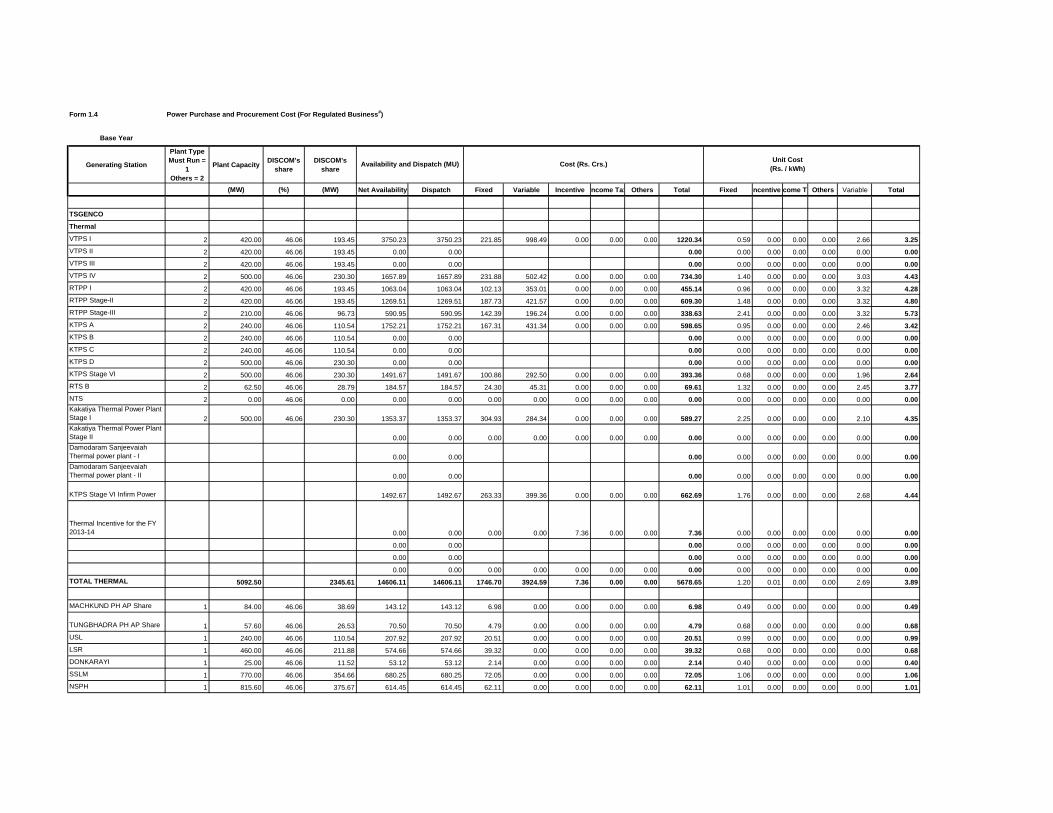
Form 1.4 Power Purchase and Procurement Cost (For Regulated Business#)
Base Year
Generating Station
Plant Type
Must Run =
1
Others = 2
Plant CapacityDISCOM's
share
DISCOM's
share
(MW) (%) (MW) Net Availability Dispatch Fixed Variable Incentive Income Tax Others Total Fixed IncentivesIncome TaxOthers Variable Total
TSGENCO
Thermal
VTPS I 2 420.00 46.06 193.45 3750.23 3750.23 221.85 998.49 0.00 0.00 0.00 1220.34 0.59 0.00 0.00 0.00 2.66 3.25
VTPS II 2 420.00 46.06 193.45 0.00 0.00 0.00 0.00 0.00 0.00 0.00 0.00 0.00
VTPS III 2 420.00 46.06 193.45 0.00 0.00 0.00 0.00 0.00 0.00 0.00 0.00 0.00
VTPS IV 2 500.00 46.06 230.30 1657.89 1657.89 231.88 502.42 0.00 0.00 0.00 734.30 1.40 0.00 0.00 0.00 3.03 4.43
RTPP I 2 420.00 46.06 193.45 1063.04 1063.04 102.13 353.01 0.00 0.00 0.00 455.14 0.96 0.00 0.00 0.00 3.32 4.28
RTPP Stage-II 2 420.00 46.06 193.45 1269.51 1269.51 187.73 421.57 0.00 0.00 0.00 609.30 1.48 0.00 0.00 0.00 3.32 4.80
RTPP Stage-III 2 210.00 46.06 96.73 590.95 590.95 142.39 196.24 0.00 0.00 0.00 338.63 2.41 0.00 0.00 0.00 3.32 5.73
KTPS A 2 240.00 46.06 110.54 1752.21 1752.21 167.31 431.34 0.00 0.00 0.00 598.65 0.95 0.00 0.00 0.00 2.46 3.42
KTPS B 2 240.00 46.06 110.54 0.00 0.00 0.00 0.00 0.00 0.00 0.00 0.00 0.00
KTPS C 2 240.00 46.06 110.54 0.00 0.00 0.00 0.00 0.00 0.00 0.00 0.00 0.00
KTPS D 2 500.00 46.06 230.30 0.00 0.00 0.00 0.00 0.00 0.00 0.00 0.00 0.00
KTPS Stage VI 2 500.00 46.06 230.30 1491.67 1491.67 100.86 292.50 0.00 0.00 0.00 393.36 0.68 0.00 0.00 0.00 1.96 2.64
RTS B 2 62.50 46.06 28.79 184.57 184.57 24.30 45.31 0.00 0.00 0.00 69.61 1.32 0.00 0.00 0.00 2.45 3.77
NTS 2 0.00 46.06 0.00 0.00 0.00 0.00 0.00 0.00 0.00 0.00 0.00 0.00 0.00 0.00 0.00 0.00 0.00
Kakatiya Thermal Power Plant
Stage I 2 500.00 46.06 230.30 1353.37 1353.37 304.93 284.34 0.00 0.00 0.00 589.27 2.25 0.00 0.00 0.00 2.10 4.35
Kakatiya Thermal Power Plant
Stage II 0.00 0.00 0.00 0.00 0.00 0.00 0.00 0.00 0.00 0.00 0.00 0.00 0.00 0.00
Damodaram Sanjeevaiah
Thermal power plant - I 0.00 0.00 0.00 0.00 0.00 0.00 0.00 0.00 0.00
Damodaram Sanjeevaiah
Thermal power plant - II 0.00 0.00 0.00 0.00 0.00 0.00 0.00 0.00 0.00
KTPS Stage VI Infirm Power 1492.67 1492.67 263.33 399.36 0.00 0.00 0.00 662.69 1.76 0.00 0.00 0.00 2.68 4.44
Thermal Incentive for the FY
2013-14 0.00 0.00 0.00 0.00 7.36 0.00 0.00 7.36 0.00 0.00 0.00 0.00 0.00 0.00
0.00 0.00 0.00 0.00 0.00 0.00 0.00 0.00 0.00
0.00 0.00 0.00 0.00 0.00 0.00 0.00 0.00 0.00
0.00 0.00 0.00 0.00 0.00 0.00 0.00 0.00 0.00 0.00 0.00 0.00 0.00 0.00
TOTAL THERMAL 5092.50 2345.61 14606.11 14606.11 1746.70 3924.59 7.36 0.00 0.00 5678.65 1.20 0.01 0.00 0.00 2.69 3.89
MACHKUND PH AP Share 1 84.00 46.06 38.69 143.12 143.12 6.98 0.00 0.00 0.00 0.00 6.98 0.49 0.00 0.00 0.00 0.00 0.49
TUNGBHADRA PH AP Share 1 57.60 46.06 26.53 70.50 70.50 4.79 0.00 0.00 0.00 0.00 4.79 0.68 0.00 0.00 0.00 0.00 0.68
USL 1 240.00 46.06 110.54 207.92 207.92 20.51 0.00 0.00 0.00 0.00 20.51 0.99 0.00 0.00 0.00 0.00 0.99
LSR 1 460.00 46.06 211.88 574.66 574.66 39.32 0.00 0.00 0.00 0.00 39.32 0.68 0.00 0.00 0.00 0.00 0.68
DONKARAYI 1 25.00 46.06 11.52 53.12 53.12 2.14 0.00 0.00 0.00 0.00 2.14 0.40 0.00 0.00 0.00 0.00 0.40
SSLM 1 770.00 46.06 354.66 680.25 680.25 72.05 0.00 0.00 0.00 0.00 72.05 1.06 0.00 0.00 0.00 0.00 1.06
NSPH 1 815.60 46.06 375.67 614.45 614.45 62.11 0.00 0.00 0.00 0.00 62.11 1.01 0.00 0.00 0.00 0.00 1.01
Availability and Dispatch (MU) Cost (Rs. Crs.)Unit Cost
(Rs. / kWh)
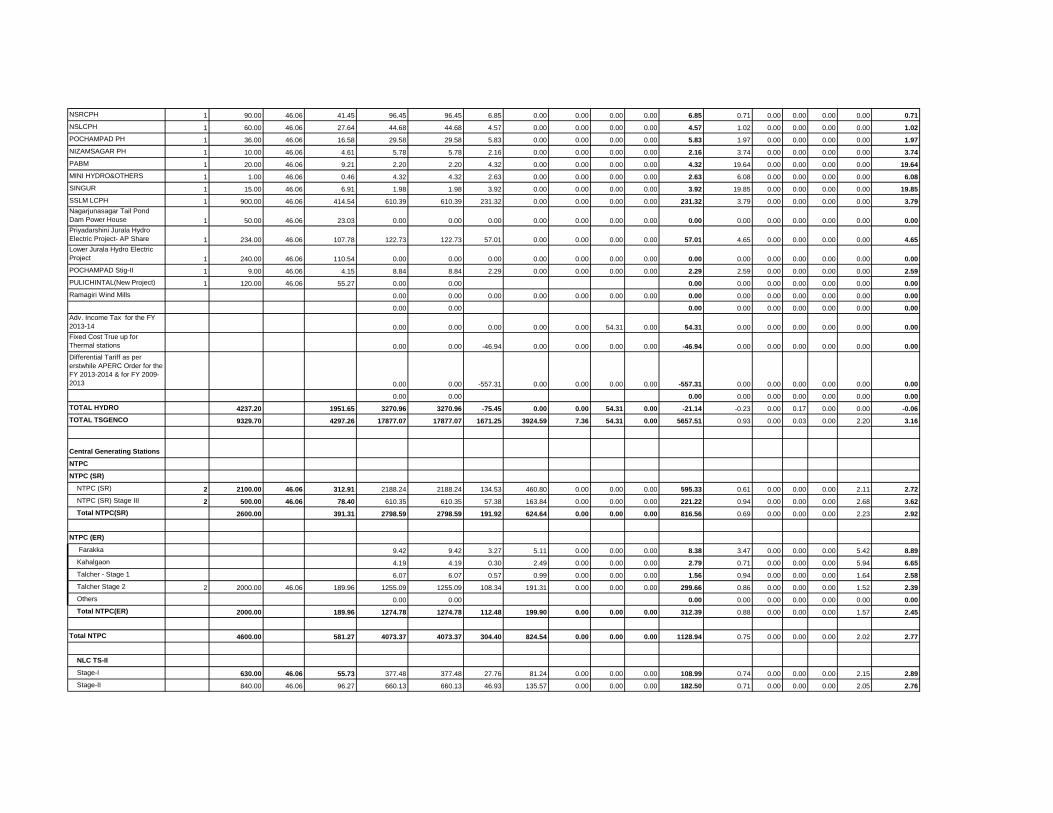
NSRCPH 1 90.00 46.06 41.45 96.45 96.45 6.85 0.00 0.00 0.00 0.00 6.85 0.71 0.00 0.00 0.00 0.00 0.71
NSLCPH 1 60.00 46.06 27.64 44.68 44.68 4.57 0.00 0.00 0.00 0.00 4.57 1.02 0.00 0.00 0.00 0.00 1.02
POCHAMPAD PH 1 36.00 46.06 16.58 29.58 29.58 5.83 0.00 0.00 0.00 0.00 5.83 1.97 0.00 0.00 0.00 0.00 1.97
NIZAMSAGAR PH 1 10.00 46.06 4.61 5.78 5.78 2.16 0.00 0.00 0.00 0.00 2.16 3.74 0.00 0.00 0.00 0.00 3.74
PABM 1 20.00 46.06 9.21 2.20 2.20 4.32 0.00 0.00 0.00 0.00 4.32 19.64 0.00 0.00 0.00 0.00 19.64
MINI HYDRO&OTHERS 1 1.00 46.06 0.46 4.32 4.32 2.63 0.00 0.00 0.00 0.00 2.63 6.08 0.00 0.00 0.00 0.00 6.08
SINGUR 1 15.00 46.06 6.91 1.98 1.98 3.92 0.00 0.00 0.00 0.00 3.92 19.85 0.00 0.00 0.00 0.00 19.85
SSLM LCPH 1 900.00 46.06 414.54 610.39 610.39 231.32 0.00 0.00 0.00 0.00 231.32 3.79 0.00 0.00 0.00 0.00 3.79
Nagarjunasagar Tail Pond
Dam Power House 1 50.00 46.06 23.03 0.00 0.00 0.00 0.00 0.00 0.00 0.00 0.00 0.00 0.00 0.00 0.00 0.00 0.00
Priyadarshini Jurala Hydro
Electric Project- AP Share 1 234.00 46.06 107.78 122.73 122.73 57.01 0.00 0.00 0.00 0.00 57.01 4.65 0.00 0.00 0.00 0.00 4.65
Lower Jurala Hydro Electric
Project 1 240.00 46.06 110.54 0.00 0.00 0.00 0.00 0.00 0.00 0.00 0.00 0.00 0.00 0.00 0.00 0.00 0.00
POCHAMPAD Stig-II 1 9.00 46.06 4.15 8.84 8.84 2.29 0.00 0.00 0.00 0.00 2.29 2.59 0.00 0.00 0.00 0.00 2.59
PULICHINTAL(New Project) 1 120.00 46.06 55.27 0.00 0.00 0.00 0.00 0.00 0.00 0.00 0.00 0.00
Ramagiri Wind Mills 0.00 0.00 0.00 0.00 0.00 0.00 0.00 0.00 0.00 0.00 0.00 0.00 0.00 0.00
0.00 0.00 0.00 0.00 0.00 0.00 0.00 0.00 0.00
Adv. Income Tax for the FY
2013-14 0.00 0.00 0.00 0.00 0.00 54.31 0.00 54.31 0.00 0.00 0.00 0.00 0.00 0.00
Fixed Cost True up for
Thermal stations 0.00 0.00 -46.94 0.00 0.00 0.00 0.00 -46.94 0.00 0.00 0.00 0.00 0.00 0.00
Differential Tariff as per
erstwhile APERC Order for the
FY 2013-2014 & for FY 2009-
2013 0.00 0.00 -557.31 0.00 0.00 0.00 0.00 -557.31 0.00 0.00 0.00 0.00 0.00 0.00
0.00 0.00 0.00 0.00 0.00 0.00 0.00 0.00 0.00
TOTAL HYDRO 4237.20 1951.65 3270.96 3270.96 -75.45 0.00 0.00 54.31 0.00 -21.14 -0.23 0.00 0.17 0.00 0.00 -0.06
TOTAL TSGENCO 9329.70 4297.26 17877.07 17877.07 1671.25 3924.59 7.36 54.31 0.00 5657.51 0.93 0.00 0.03 0.00 2.20 3.16
Central Generating Stations
NTPC
NTPC (SR)
NTPC (SR) 2 2100.00 46.06 312.91 2188.24 2188.24 134.53 460.80 0.00 0.00 0.00 595.33 0.61 0.00 0.00 0.00 2.11 2.72
NTPC (SR) Stage III 2 500.00 46.06 78.40 610.35 610.35 57.38 163.84 0.00 0.00 0.00 221.22 0.94 0.00 0.00 0.00 2.68 3.62
Total NTPC(SR) 2600.00 391.31 2798.59 2798.59 191.92 624.64 0.00 0.00 0.00 816.56 0.69 0.00 0.00 0.00 2.23 2.92
NTPC (ER)
Farakka 9.42 9.42 3.27 5.11 0.00 0.00 0.00 8.38 3.47 0.00 0.00 0.00 5.42 8.89
Kahalgaon 4.19 4.19 0.30 2.49 0.00 0.00 0.00 2.79 0.71 0.00 0.00 0.00 5.94 6.65
Talcher - Stage 1 6.07 6.07 0.57 0.99 0.00 0.00 0.00 1.56 0.94 0.00 0.00 0.00 1.64 2.58
Talcher Stage 2 2 2000.00 46.06 189.96 1255.09 1255.09 108.34 191.31 0.00 0.00 0.00 299.66 0.86 0.00 0.00 0.00 1.52 2.39
Others 0.00 0.00 0.00 0.00 0.00 0.00 0.00 0.00 0.00
Total NTPC(ER) 2000.00 189.96 1274.78 1274.78 112.48 199.90 0.00 0.00 0.00 312.39 0.88 0.00 0.00 0.00 1.57 2.45
Total NTPC 4600.00 581.27 4073.37 4073.37 304.40 824.54 0.00 0.00 0.00 1128.94 0.75 0.00 0.00 0.00 2.02 2.77
NLC TS-II
Stage-I 630.00 46.06 55.73 377.48 377.48 27.76 81.24 0.00 0.00 0.00 108.99 0.74 0.00 0.00 0.00 2.15 2.89
Stage-II 840.00 46.06 96.27 660.13 660.13 46.93 135.57 0.00 0.00 0.00 182.50 0.71 0.00 0.00 0.00 2.05 2.76
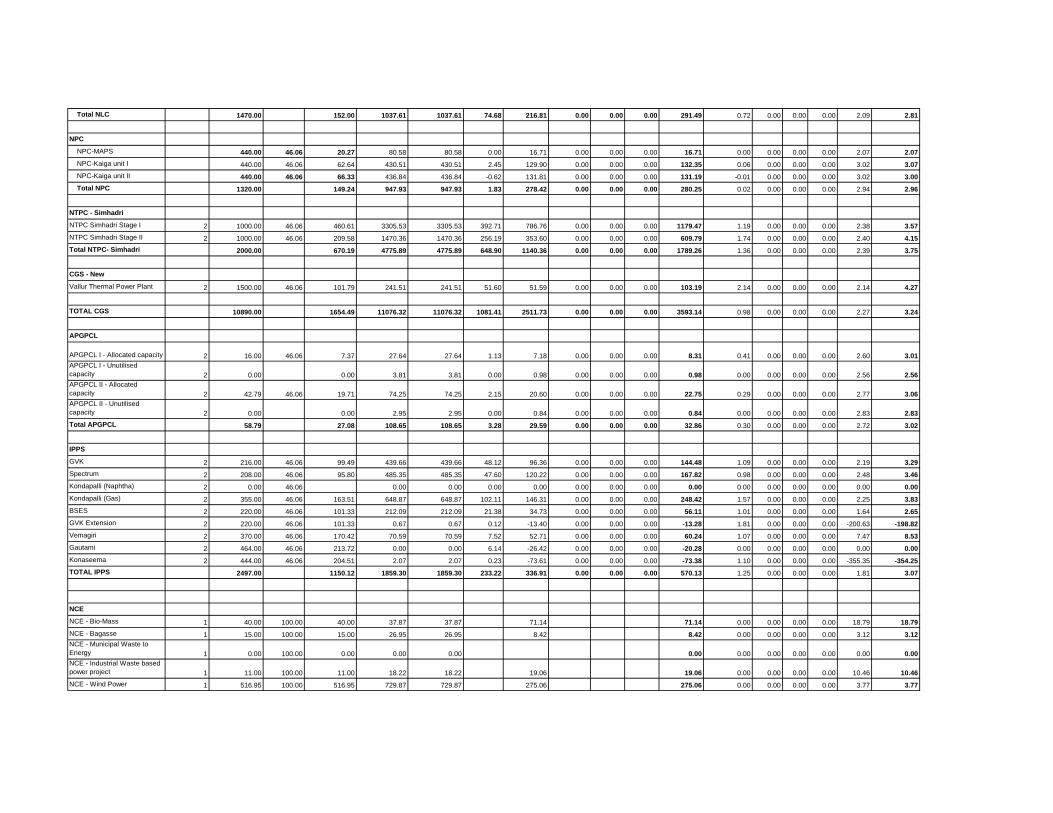
Total NLC 1470.00 152.00 1037.61 1037.61 74.68 216.81 0.00 0.00 0.00 291.49 0.72 0.00 0.00 0.00 2.09 2.81
NPC
NPC-MAPS 440.00 46.06 20.27 80.58 80.58 0.00 16.71 0.00 0.00 0.00 16.71 0.00 0.00 0.00 0.00 2.07 2.07
NPC-Kaiga unit I 440.00 46.06 62.64 430.51 430.51 2.45 129.90 0.00 0.00 0.00 132.35 0.06 0.00 0.00 0.00 3.02 3.07
NPC-Kaiga unit II 440.00 46.06 66.33 436.84 436.84 -0.62 131.81 0.00 0.00 0.00 131.19 -0.01 0.00 0.00 0.00 3.02 3.00
Total NPC 1320.00 149.24 947.93 947.93 1.83 278.42 0.00 0.00 0.00 280.25 0.02 0.00 0.00 0.00 2.94 2.96
NTPC - Simhadri
NTPC Simhadri Stage I 2 1000.00 46.06 460.61 3305.53 3305.53 392.71 786.76 0.00 0.00 0.00 1179.47 1.19 0.00 0.00 0.00 2.38 3.57
NTPC Simhadri Stage II 2 1000.00 46.06 209.58 1470.36 1470.36 256.19 353.60 0.00 0.00 0.00 609.79 1.74 0.00 0.00 0.00 2.40 4.15
Total NTPC- Simhadri 2000.00 670.19 4775.89 4775.89 648.90 1140.36 0.00 0.00 0.00 1789.26 1.36 0.00 0.00 0.00 2.39 3.75
CGS - New
Vallur Thermal Power Plant 2 1500.00 46.06 101.79 241.51 241.51 51.60 51.59 0.00 0.00 0.00 103.19 2.14 0.00 0.00 0.00 2.14 4.27
TOTAL CGS 10890.00 1654.49 11076.32 11076.32 1081.41 2511.73 0.00 0.00 0.00 3593.14 0.98 0.00 0.00 0.00 2.27 3.24
APGPCL
APGPCL I - Allocated capacity 2 16.00 46.06 7.37 27.64 27.64 1.13 7.18 0.00 0.00 0.00 8.31 0.41 0.00 0.00 0.00 2.60 3.01
APGPCL I - Unutilised
capacity 2 0.00 0.00 3.81 3.81 0.00 0.98 0.00 0.00 0.00 0.98 0.00 0.00 0.00 0.00 2.56 2.56
APGPCL II - Allocated
capacity 2 42.79 46.06 19.71 74.25 74.25 2.15 20.60 0.00 0.00 0.00 22.75 0.29 0.00 0.00 0.00 2.77 3.06
APGPCL II - Unutilised
capacity 2 0.00 0.00 2.95 2.95 0.00 0.84 0.00 0.00 0.00 0.84 0.00 0.00 0.00 0.00 2.83 2.83
Total APGPCL 58.79 27.08 108.65 108.65 3.28 29.59 0.00 0.00 0.00 32.86 0.30 0.00 0.00 0.00 2.72 3.02
IPPS
GVK 2 216.00 46.06 99.49 439.66 439.66 48.12 96.36 0.00 0.00 0.00 144.48 1.09 0.00 0.00 0.00 2.19 3.29
Spectrum 2 208.00 46.06 95.80 485.35 485.35 47.60 120.22 0.00 0.00 0.00 167.82 0.98 0.00 0.00 0.00 2.48 3.46
Kondapalli (Naphtha) 2 0.00 46.06 0.00 0.00 0.00 0.00 0.00 0.00 0.00 0.00 0.00 0.00 0.00 0.00 0.00 0.00
Kondapalli (Gas) 2 355.00 46.06 163.51 648.87 648.87 102.11 146.31 0.00 0.00 0.00 248.42 1.57 0.00 0.00 0.00 2.25 3.83
BSES 2 220.00 46.06 101.33 212.09 212.09 21.38 34.73 0.00 0.00 0.00 56.11 1.01 0.00 0.00 0.00 1.64 2.65
GVK Extension 2 220.00 46.06 101.33 0.67 0.67 0.12 -13.40 0.00 0.00 0.00 -13.28 1.81 0.00 0.00 0.00 -200.63 -198.82
Vemagiri 2 370.00 46.06 170.42 70.59 70.59 7.52 52.71 0.00 0.00 0.00 60.24 1.07 0.00 0.00 0.00 7.47 8.53
Gautami 2 464.00 46.06 213.72 0.00 0.00 6.14 -26.42 0.00 0.00 0.00 -20.28 0.00 0.00 0.00 0.00 0.00 0.00
Konaseema 2 444.00 46.06 204.51 2.07 2.07 0.23 -73.61 0.00 0.00 0.00 -73.38 1.10 0.00 0.00 0.00 -355.35 -354.25
TOTAL IPPS 2497.00 1150.12 1859.30 1859.30 233.22 336.91 0.00 0.00 0.00 570.13 1.25 0.00 0.00 0.00 1.81 3.07
NCE
NCE - Bio-Mass 1 40.00 100.00 40.00 37.87 37.87 71.14 71.14 0.00 0.00 0.00 0.00 18.79 18.79
NCE - Bagasse 1 15.00 100.00 15.00 26.95 26.95 8.42 8.42 0.00 0.00 0.00 0.00 3.12 3.12
NCE - Municipal Waste to
Energy 1 0.00 100.00 0.00 0.00 0.00 0.00 0.00 0.00 0.00 0.00 0.00 0.00
NCE - Industrial Waste based
power project 1 11.00 100.00 11.00 18.22 18.22 19.06 19.06 0.00 0.00 0.00 0.00 10.46 10.46
NCE - Wind Power 1 516.95 100.00 516.95 729.87 729.87 275.06 275.06 0.00 0.00 0.00 0.00 3.77 3.77
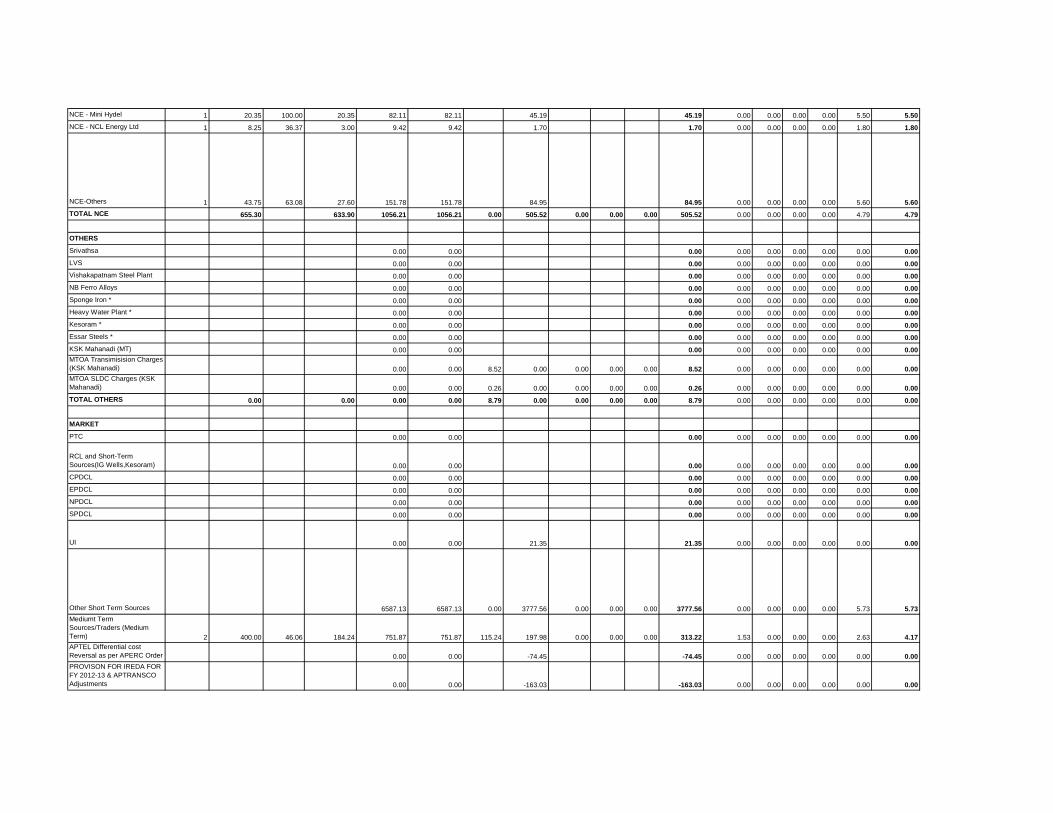
NCE - Mini Hydel 1 20.35 100.00 20.35 82.11 82.11 45.19 45.19 0.00 0.00 0.00 0.00 5.50 5.50
NCE - NCL Energy Ltd 1 8.25 36.37 3.00 9.42 9.42 1.70 1.70 0.00 0.00 0.00 0.00 1.80 1.80
NCE-Others 1 43.75 63.08 27.60 151.78 151.78 84.95 84.95 0.00 0.00 0.00 0.00 5.60 5.60
TOTAL NCE 655.30 633.90 1056.21 1056.21 0.00 505.52 0.00 0.00 0.00 505.52 0.00 0.00 0.00 0.00 4.79 4.79
OTHERS
Srivathsa 0.00 0.00 0.00 0.00 0.00 0.00 0.00 0.00 0.00
LVS 0.00 0.00 0.00 0.00 0.00 0.00 0.00 0.00 0.00
Vishakapatnam Steel Plant 0.00 0.00 0.00 0.00 0.00 0.00 0.00 0.00 0.00
NB Ferro Alloys 0.00 0.00 0.00 0.00 0.00 0.00 0.00 0.00 0.00
Sponge Iron * 0.00 0.00 0.00 0.00 0.00 0.00 0.00 0.00 0.00
Heavy Water Plant * 0.00 0.00 0.00 0.00 0.00 0.00 0.00 0.00 0.00
Kesoram * 0.00 0.00 0.00 0.00 0.00 0.00 0.00 0.00 0.00
Essar Steels * 0.00 0.00 0.00 0.00 0.00 0.00 0.00 0.00 0.00
KSK Mahanadi (MT) 0.00 0.00 0.00 0.00 0.00 0.00 0.00 0.00 0.00
MTOA Transimisision Charges
(KSK Mahanadi) 0.00 0.00 8.52 0.00 0.00 0.00 0.00 8.52 0.00 0.00 0.00 0.00 0.00 0.00
MTOA SLDC Charges (KSK
Mahanadi) 0.00 0.00 0.26 0.00 0.00 0.00 0.00 0.26 0.00 0.00 0.00 0.00 0.00 0.00
TOTAL OTHERS 0.00 0.00 0.00 0.00 8.79 0.00 0.00 0.00 0.00 8.79 0.00 0.00 0.00 0.00 0.00 0.00
MARKET
PTC 0.00 0.00 0.00 0.00 0.00 0.00 0.00 0.00 0.00
RCL and Short-Term
Sources(IG Wells,Kesoram) 0.00 0.00 0.00 0.00 0.00 0.00 0.00 0.00 0.00
CPDCL 0.00 0.00 0.00 0.00 0.00 0.00 0.00 0.00 0.00
EPDCL 0.00 0.00 0.00 0.00 0.00 0.00 0.00 0.00 0.00
NPDCL 0.00 0.00 0.00 0.00 0.00 0.00 0.00 0.00 0.00
SPDCL 0.00 0.00 0.00 0.00 0.00 0.00 0.00 0.00 0.00
UI 0.00 0.00 21.35 21.35 0.00 0.00 0.00 0.00 0.00 0.00
Other Short Term Sources 6587.13 6587.13 0.00 3777.56 0.00 0.00 0.00 3777.56 0.00 0.00 0.00 0.00 5.73 5.73
Mediumt Term
Sources/Traders (Medium
Term) 2 400.00 46.06 184.24 751.87 751.87 115.24 197.98 0.00 0.00 0.00 313.22 1.53 0.00 0.00 0.00 2.63 4.17
APTEL Differential cost
Reversal as per APERC Order 0.00 0.00 -74.45 -74.45 0.00 0.00 0.00 0.00 0.00 0.00
PROVISON FOR IREDA FOR
FY 2012-13 & APTRANSCO
Adjustments 0.00 0.00 -163.03 -163.03 0.00 0.00 0.00 0.00 0.00 0.00

Bi-lateral Sales( PTC etc.) 0.00 0.00 -693.05 -693.05 0.00 0.00 0.00 0.00 0.00 0.00
Pool Purchase 0.00 0.00 63.83 63.83 0.00 0.00 0.00 0.00 0.00 0.00
POSOCO SRLDC Fees and
Charges 0.00 0.00 0.00 2.25 0.00 0.00 0.00 2.25 0.00 0.00 0.00 0.00 0.00 0.00
UI Underdrawal, ISTand
adjustments -191.20 -191.20 -63.53 -63.53 0.00 0.00 0.00 0.00 3.32 3.32
TOTAL MARKET 400.00 184.24 7147.80 7147.80 115.24 3068.91 0.00 0.00 0.00 3184.15 0.16 0.00 0.00 0.00 4.29 4.45
TOTAL (From All Sources) 23830.79 7947.08 39125.35 39125.35 3113.19 10377.24 7.36 54.31 0.00 13552.09 0.80 0.00 0.01 0.00 2.65 3.46
2014-15
Generating Station
Plant Type
Must Run =
1
Others = 2
Plant CapacityDISCOM's
share
DISCOM's
share
(MW) (%) (MW) Net Availability Dispatch Fixed Variable Incentive Inc. Tax Others Total Fixed Inctv Inc. Tax Others Variable Total
TSGENCO
Thermal
VTPS I 2 420.00 38.02 159.68 3066.44 3066.44 183.12 922.62 1105.74 0.60 0.00 0.00 0.00 3.01 3.61
VTPS II 2 420.00 38.02 159.68 0.00 0.00 0.00 0.00 0.00 0.00 0.00 0.00 0.00 0.00 0.00
VTPS III 2 420.00 38.02 159.68 0.00 0.00 0.00 0.00 0.00 0.00 0.00 0.00 0.00 0.00 0.00
VTPS IV 2 500.00 38.02 190.10 1284.06 1284.06 191.40 371.52 562.92 1.49 0.00 0.00 0.00 2.89 4.38
RTPP I 2 420.00 38.02 159.68 898.66 898.66 84.30 323.43 407.74 0.94 0.00 0.00 0.00 3.60 4.54
RTPP Stage-II 2 420.00 38.02 159.68 1021.71 1021.71 154.96 347.83 502.79 1.52 0.00 0.00 0.00 3.40 4.92
RTPP Stage-III 2 210.00 38.02 79.84 476.99 476.99 117.53 164.95 282.49 2.46 0.00 0.00 0.00 3.46 5.92
KTPS A 2 240.00 38.02 91.25 1500.59 1500.59 138.10 386.27 524.37 0.92 0.00 0.00 0.00 2.57 3.49
KTPS B 2 240.00 38.02 91.25 0.00 0.00 0.00 0.00 0.00 0.00 0.00 0.00 0.00 0.00 0.00
KTPS C 2 240.00 38.02 91.25 0.00 0.00 0.00 0.00 0.00 0.00 0.00 0.00 0.00 0.00 0.00
KTPS D 2 500.00 38.02 190.10 1176.04 1176.04 83.25 244.38 327.63 0.71 0.00 0.00 0.00 2.08 2.79
KTPS Stage VI 2 500.00 38.02 190.10 1398.74 1398.74 217.36 420.78 638.15 1.55 0.00 0.00 0.00 3.01 4.56
RTS B 2 62.50 38.02 23.76 64.48 64.48 20.06 4.78 24.84 3.11 0.00 0.00 0.00 0.74 3.85
NTS 2 0.00 0.00 0.00 0.00 0.00 0.00 0.00 0.00 0.00 0.00 0.00 0.00 0.00 0.00
Kakatiya Thermal Power Plant
Stage I 2 500.00 38.02 190.10 1468.10 1468.10 251.70 335.43 587.13 1.71 0.00 0.00 0.00 2.28 4.00
Kakatiya Thermal Power Plant
Stage II 600.00 70.55 423.31 0.00 0.00 0.00 0.00 0.00 0.00 0.00 0.00 0.00
Damodaram Sanjeevaiah
Thermal power plant - I 0.00 0.00 0.00 0.00 0.00 0.00 0.00 0.00 0.00 0.00
Damodaram Sanjeevaiah
Thermal power plant - II 0.00 0.00 0.00
0.00 0.00
0.00 0.00
Note:
1) Details of NCE Plant wise to be filled in Form 1.4 [i,ii,iii,iv]
2) Hydro cost break up details to be provided based on appropriate methodology. In case it is not possible to
Availability and Dispatch (MU) Cost (Rs. Crs.)Unit Cost
(Rs. / kWh)

0.00 0.00
0.00 0.00
Adv. I.Tax, Incentive,
Others(20% adj) 0.00 0.00 12.61 15.88 -0.06 28.44 0.00 0.00 0.00 0.00 0.00 0.00
TOTAL THERMAL 5692.50 2359.48 12355.83 12355.83 1441.79 3522.00 12.61 15.88 -0.06 4992.23 1.17 0.01 0.01 0.00 2.85 4.04
MACHKUND PH AP Share 1 84.00 38.02 31.94 69.21 69.21 5.59 0.00 5.59 0.81 0.00 0.00 0.00 0.00 0.81
TUNGBHADRA PH AP Share 1 57.60 38.02 21.90 51.23 51.23 3.83 0.00 3.83 0.75 0.00 0.00 0.00 0.00 0.75
USL 1 240.00 38.02 91.25 36.82 36.82 2.87 0.00 2.87 0.78 0.00 0.00 0.00 0.00 0.78
LSR 1 460.00 38.02 174.89 100.77 100.77 5.50 0.00 5.50 0.55 0.00 0.00 0.00 0.00 0.55
DONKARAYI 1 25.00 38.02 9.51 10.05 10.05 0.30 0.00 0.30 0.30 0.00 0.00 0.00 0.00 0.30
SSLM 1 770.00 38.02 292.75 35.26 35.26 10.08 0.00 10.08 2.86 0.00 0.00 0.00 0.00 2.86
NSPH 1 815.60 38.02 310.09 387.16 387.16 51.27 0.00 51.27 1.32 0.00 0.00 0.00 0.00 1.32
NSRCPH 1 90.00 38.02 34.22 0.00 0.00 0.96 0.00 0.96 0.00 0.00 0.00 0.00 0.00 0.00
NSLCPH 1 60.00 38.02 22.81 16.53 16.53 3.77 0.00 3.77 2.28 0.00 0.00 0.00 0.00 2.28
POCHAMPAD PH 1 27.00 38.02 10.27 3.45 3.45 4.81 0.00 4.81 13.94 0.00 0.00 0.00 0.00 13.94
NIZAMSAGAR PH 1 10.00 38.02 3.80 1.60 1.60 1.78 0.00 1.78 11.16 0.00 0.00 0.00 0.00 11.16
PABM 1 20.00 38.02 7.60 -0.03 -0.03 0.60 0.00 0.60 -214.78 0.00 0.00 0.00 0.00 -214.78
MINI HYDRO&OTHERS 1 1.00 38.02 0.38 0.28 0.28 0.37 0.00 0.37 13.29 0.00 0.00 0.00 0.00 13.29
SINGUR 1 15.00 38.02 5.70 2.41 2.41 3.24 0.00 3.24 13.43 0.00 0.00 0.00 0.00 13.43
SSLM LCPH 1 900.00 38.02 342.18 682.92 682.92 190.94 0.00 190.94 2.80 0.00 0.00 0.00 0.00 2.80
Nagarjunasagar Tail Pond
Dam Power House 1 50.00 38.02 19.01 0.00 0.00 0.00 0.00 0.00 0.00 0.00 0.00 0.00 0.00 0.00
Priyadarshini Jurala Hydro
Electric Project- AP Share 1 234.00 38.02 88.97 0.00 0.00 0.00 0.00 0.00 0.00 0.00 0.00 0.00 0.00 0.00
Lower Jurala Hydro Electric
Project 1 240.00 70.55 169.32 79.98 79.98 27.52 0.00 27.52 3.44 0.00 0.00 0.00 0.00 3.44
POCHAMPAD Stig-II 1 9.00 38.02 3.42 1.28 1.28 0.00 0.00 0.00 0.00 0.00 0.00 0.00 0.00 0.00
PULICHINTAL(New Project) 1 120.00 70.55 84.66 0.00 0.00 0.00 0.00 0.00 0.00 0.00 0.00 0.00 0.00 0.00
Mini Hydel & Others
(Peddapalli, Palair) 1 11.16 38.02 4.24 0.32 0.32 1.65 0.00 1.65 52.37 0.00 0.00 0.00 0.00 52.37
Ramagiri Wind Mills (AP) 0.00 0.00 0.00 0.00 0.00 0.00 0.00 0.00 0.00 0.00 0.00 0.00 0.00 0.00
Pochampad Stage IV 0.31 0.31 1.89 0.00 1.89 60.39 0.00 0.00 0.00 0.00 60.39
Suppl. Allocation of 100% to
TS from TSHydel 952.37 952.37 0.00 0.00 0.00 0.00 0.00 0.00 0.00
0.00 0.00 0.00 0.00 0.00 0.00 0.00 0.00 0.00
TOTAL HYDRO 4239.36 1728.92 2431.92 2431.92 316.97 0.00 0.00 0.00 0.00 316.97 1.30 0.00 0.00 0.00 0.00 1.30
TOTAL TSGENCO 9931.86 4088.39 14787.75 14787.75 1758.75 3522.00 12.61 15.88 -0.06 5309.19 1.19 0.01 0.01 0.00 2.38 3.59
Central Generating Stations
NTPC
NTPC (SR)
NTPC (SR) 2 2100.00 12.51 262.68 1944.62 1944.62 109.56 478.07 587.63 0.56 0.00 0.00 0.00 2.46 3.02
NTPC (SR) Stage III 2 500.00 13.16 65.79 490.47 490.47 45.23 124.62 169.85 0.92 0.00 0.00 0.00 2.54 3.46
Total NTPC(SR) 2600.00 328.47 2435.08 2435.08 154.79 602.69 0.00 0.00 0.00 757.48 0.64 0.00 0.00 0.00 2.48 3.11
NTPC (ER)

Farakka 0.00 0.00 -0.06 -0.03 -0.09 0.00 0.00 0.00 0.00 0.00 0.00
Kahalgaon 0.00 0.00 0.05 0.00 0.05 0.00 0.00 0.00 0.00 0.00 0.00
Talcher - Stage 1 0.00 0.00 0.00 0.00 0.00 0.00 0.00 0.00 0.00 0.00 0.00
Talcher Stage 2 2 2000.00 8.07 161.42 1154.23 1154.23 90.64 168.49 259.12 0.79 0.00 0.00 0.00 1.46 2.24
Others 0.00 0.00 -0.15 0.00 -0.15 0.00 0.00 0.00 0.00 0.00 0.00
Total NTPC(ER) 2000.00 161.42 1154.23 1154.23 90.48 168.46 0.00 0.00 0.00 258.93 0.78 0.00 0.00 0.00 1.46 2.24
Total NTPC 4600.00 489.89 3589.31 3589.31 245.26 771.14 0.00 0.00 0.00 1016.41 0.68 0.00 0.00 0.00 2.15 2.83
NLC TS-II
Stage-I 630.00 6.98 43.99 308.22 308.22 19.05 68.79 87.84 0.62 0.00 0.00 0.00 2.23 2.85
Stage-II 840.00 9.27 77.83 539.20 539.20 33.79 151.93 185.71 0.63 0.00 0.00 0.00 2.82 3.44
Total NLC 1470.00 121.82 847.41 847.41 52.84 220.71 0.00 0.00 0.00 273.55 0.62 0.00 0.00 0.00 2.60 3.23
NPC
NPC-MAPS 440.00 3.77 16.58 83.02 83.02 0.00 17.25 17.25 0.00 0.00 0.00 0.00 2.08 2.08
NPC-Kaiga unit I 440.00 11.72 51.58 330.83 330.83 3.75 99.01 102.76 0.11 0.00 0.00 0.00 2.99 3.11
NPC-Kaiga unit II 440.00 12.42 54.63 374.49 374.49 0.00 114.66 114.66 0.00 0.00 0.00 0.00 3.06 3.06
Total NPC 1320.00 122.79 788.34 788.34 3.75 230.93 0.00 0.00 0.00 234.67 0.05 0.00 0.00 0.00 2.93 2.98
NTPC - Simhadri
NTPC Simhadri Stage I 2 1000.00 38.02 380.20 2799.97 2799.97 259.43 735.25 994.68 0.93 0.00 0.00 0.00 2.63 3.55
NTPC Simhadri Stage II 2 1000.00 17.46 174.61 1232.92 1232.92 210.91 319.91 530.82 1.71 0.00 0.00 0.00 2.59 4.31
Total NTPC- Simhadri 2000.00 554.81 4032.89 4032.89 470.34 1055.16 0.00 0.00 0.00 1525.50 1.17 0.00 0.00 0.00 2.62 3.78
CGS - New
Vallur Thermal Power Plant 2 1500.00 6.12 91.80 307.46 307.46 55.66 59.59 115.25 1.81 0.00 0.00 0.00 1.94 3.75
NTPC NVVNL Bundled Power
Coal 173.90 173.90 1.22 52.36 53.57 0.07 0.00 0.00 0.00 3.01 3.08
TOTAL CGS 10890.00 1381.12 9739.32 9739.32 829.07 2389.88 0.00 0.00 0.00 3218.96 0.85 0.00 0.00 0.00 2.45 3.31
APGPCL
APGPCL I - Allocated capacity 2 16.00 29.41 4.71 11.78 11.78 1.35 3.26 4.61 1.15 0.00 0.00 0.00 2.76 3.91
APGPCL I - Unutilised
capacity 2 0.00 0.58 0.58 0.00 0.16 0.16 0.00 0.00 0.00 0.00 2.77 2.77
APGPCL II - Allocated
capacity 2 42.79 29.41 12.59 39.94 39.94 1.87 10.44 12.31 0.47 0.00 0.00 0.00 2.61 3.08
APGPCL II - Unutilised
capacity 2 0.00 0.52 0.52 0.00 0.14 0.14 0.00 0.00 0.00 0.00 2.61 2.61
Total APGPCL 58.79 17.29 52.82 52.82 3.22 13.99 0.00 0.00 0.00 17.22 0.61 0.00 0.00 0.00 2.65 3.26
IPPS
GVK 2 216.00 38.02 82.12 220.02 220.02 41.30 65.88 107.18 1.88 0.00 0.00 0.00 2.99 4.87
Spectrum 2 205.00 38.02 77.94 208.04 208.04 47.61 65.46 113.07 2.29 0.00 0.00 0.00 3.15 5.43
Kondapalli (Naphtha) 361.92 38.02 137.60 0.00 0.00 0.00 0.00 0.00 0.00 0.00 0.00 0.00 0.00 0.00
Kondapalli (Gas) 2 1108.00 35.28 390.85 191.03 191.03 46.06 98.70 144.76 2.41 0.00 0.00 0.00 5.17 7.58
BSES 2 220.00 38.02 83.64 63.53 63.53 4.55 15.99 20.55 0.72 0.00 0.00 0.00 2.52 3.23
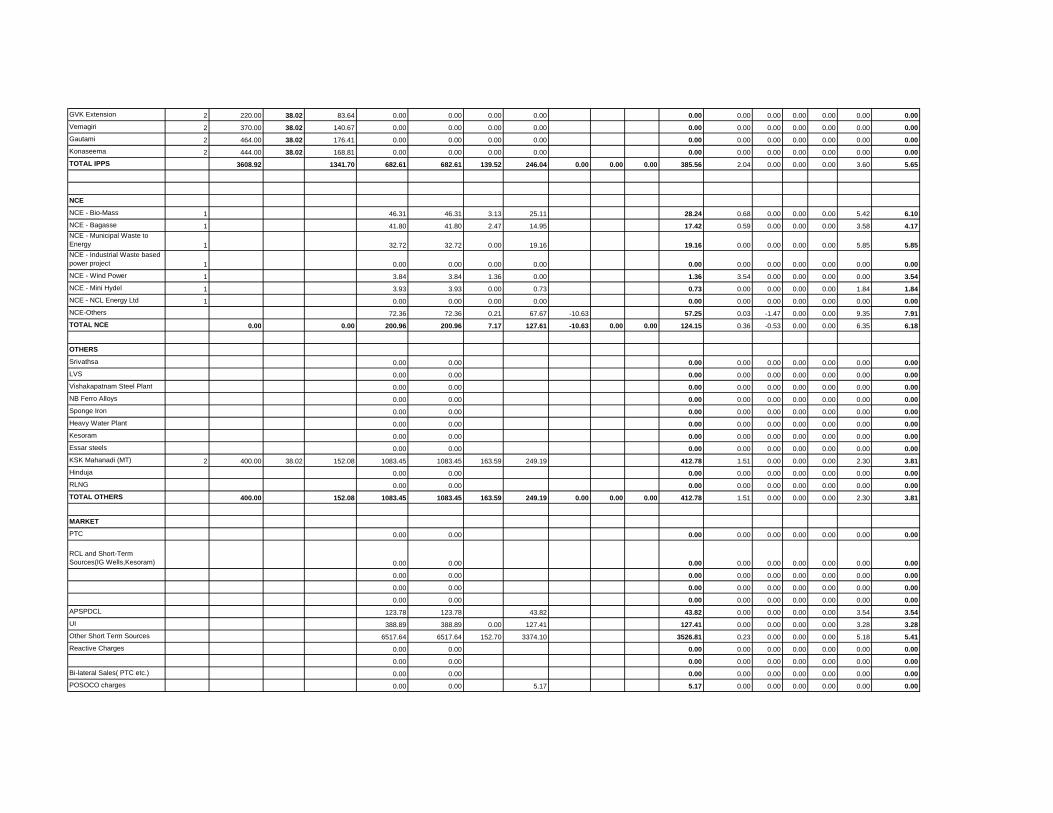
GVK Extension 2 220.00 38.02 83.64 0.00 0.00 0.00 0.00 0.00 0.00 0.00 0.00 0.00 0.00 0.00
Vemagiri 2 370.00 38.02 140.67 0.00 0.00 0.00 0.00 0.00 0.00 0.00 0.00 0.00 0.00 0.00
Gautami 2 464.00 38.02 176.41 0.00 0.00 0.00 0.00 0.00 0.00 0.00 0.00 0.00 0.00 0.00
Konaseema 2 444.00 38.02 168.81 0.00 0.00 0.00 0.00 0.00 0.00 0.00 0.00 0.00 0.00 0.00
TOTAL IPPS 3608.92 1341.70 682.61 682.61 139.52 246.04 0.00 0.00 0.00 385.56 2.04 0.00 0.00 0.00 3.60 5.65
NCE
NCE - Bio-Mass 1 46.31 46.31 3.13 25.11 28.24 0.68 0.00 0.00 0.00 5.42 6.10
NCE - Bagasse 1 41.80 41.80 2.47 14.95 17.42 0.59 0.00 0.00 0.00 3.58 4.17
NCE - Municipal Waste to
Energy 1 32.72 32.72 0.00 19.16 19.16 0.00 0.00 0.00 0.00 5.85 5.85
NCE - Industrial Waste based
power project 1 0.00 0.00 0.00 0.00 0.00 0.00 0.00 0.00 0.00 0.00 0.00
NCE - Wind Power 1 3.84 3.84 1.36 0.00 1.36 3.54 0.00 0.00 0.00 0.00 3.54
NCE - Mini Hydel 1 3.93 3.93 0.00 0.73 0.73 0.00 0.00 0.00 0.00 1.84 1.84
NCE - NCL Energy Ltd 1 0.00 0.00 0.00 0.00 0.00 0.00 0.00 0.00 0.00 0.00 0.00
NCE-Others 72.36 72.36 0.21 67.67 -10.63 57.25 0.03 -1.47 0.00 0.00 9.35 7.91
TOTAL NCE 0.00 0.00 200.96 200.96 7.17 127.61 -10.63 0.00 0.00 124.15 0.36 -0.53 0.00 0.00 6.35 6.18
OTHERS
Srivathsa 0.00 0.00 0.00 0.00 0.00 0.00 0.00 0.00 0.00
LVS 0.00 0.00 0.00 0.00 0.00 0.00 0.00 0.00 0.00
Vishakapatnam Steel Plant 0.00 0.00 0.00 0.00 0.00 0.00 0.00 0.00 0.00
NB Ferro Alloys 0.00 0.00 0.00 0.00 0.00 0.00 0.00 0.00 0.00
Sponge Iron 0.00 0.00 0.00 0.00 0.00 0.00 0.00 0.00 0.00
Heavy Water Plant 0.00 0.00 0.00 0.00 0.00 0.00 0.00 0.00 0.00
Kesoram 0.00 0.00 0.00 0.00 0.00 0.00 0.00 0.00 0.00
Essar steels 0.00 0.00 0.00 0.00 0.00 0.00 0.00 0.00 0.00
KSK Mahanadi (MT) 2 400.00 38.02 152.08 1083.45 1083.45 163.59 249.19 412.78 1.51 0.00 0.00 0.00 2.30 3.81
Hinduja 0.00 0.00 0.00 0.00 0.00 0.00 0.00 0.00 0.00
RLNG 0.00 0.00 0.00 0.00 0.00 0.00 0.00 0.00 0.00
TOTAL OTHERS 400.00 152.08 1083.45 1083.45 163.59 249.19 0.00 0.00 0.00 412.78 1.51 0.00 0.00 0.00 2.30 3.81
MARKET
PTC 0.00 0.00 0.00 0.00 0.00 0.00 0.00 0.00 0.00
RCL and Short-Term
Sources(IG Wells,Kesoram) 0.00 0.00 0.00 0.00 0.00 0.00 0.00 0.00 0.00
0.00 0.00 0.00 0.00 0.00 0.00 0.00 0.00 0.00
0.00 0.00 0.00 0.00 0.00 0.00 0.00 0.00 0.00
0.00 0.00 0.00 0.00 0.00 0.00 0.00 0.00 0.00
APSPDCL 123.78 123.78 43.82 43.82 0.00 0.00 0.00 0.00 3.54 3.54
UI 388.89 388.89 0.00 127.41 127.41 0.00 0.00 0.00 0.00 3.28 3.28
Other Short Term Sources 6517.64 6517.64 152.70 3374.10 3526.81 0.23 0.00 0.00 0.00 5.18 5.41
Reactive Charges 0.00 0.00 0.00 0.00 0.00 0.00 0.00 0.00 0.00
0.00 0.00 0.00 0.00 0.00 0.00 0.00 0.00 0.00
Bi-lateral Sales( PTC etc.) 0.00 0.00 0.00 0.00 0.00 0.00 0.00 0.00 0.00
POSOCO charges 0.00 0.00 5.17 5.17 0.00 0.00 0.00 0.00 0.00 0.00
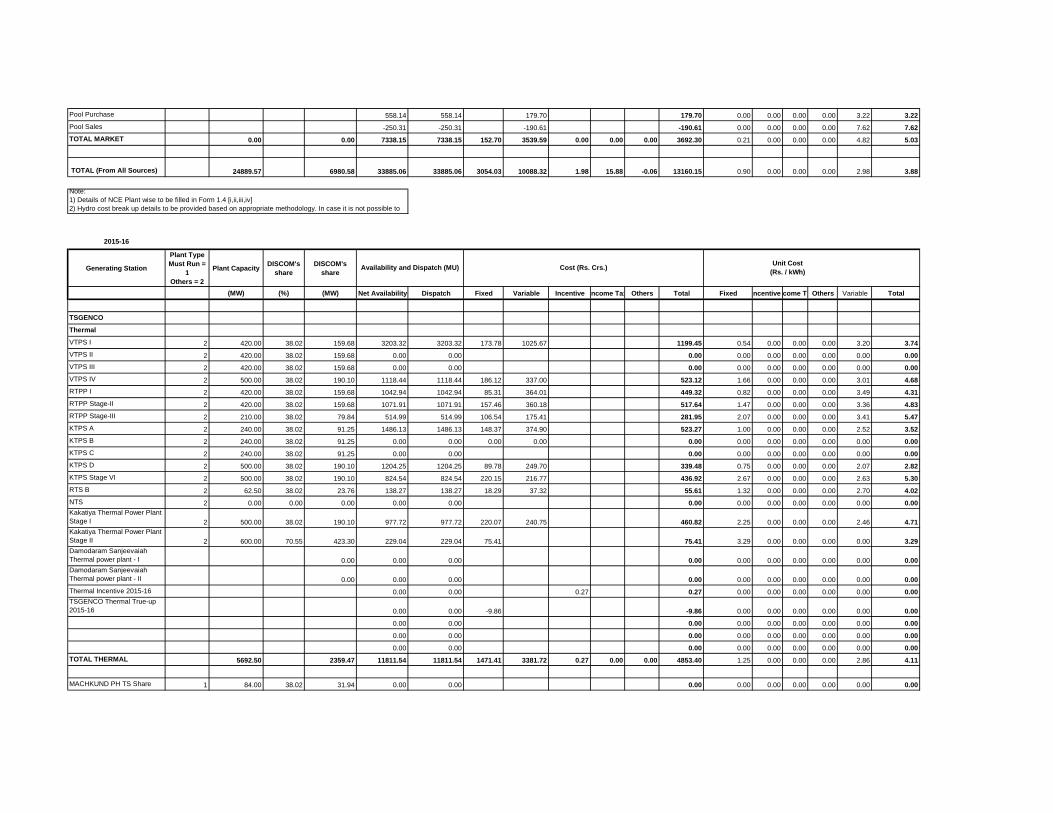
Pool Purchase 558.14 558.14 179.70 179.70 0.00 0.00 0.00 0.00 3.22 3.22
Pool Sales -250.31 -250.31 -190.61 -190.61 0.00 0.00 0.00 0.00 7.62 7.62
TOTAL MARKET 0.00 0.00 7338.15 7338.15 152.70 3539.59 0.00 0.00 0.00 3692.30 0.21 0.00 0.00 0.00 4.82 5.03
TOTAL (From All Sources) 24889.57 6980.58 33885.06 33885.06 3054.03 10088.32 1.98 15.88 -0.06 13160.15 0.90 0.00 0.00 0.00 2.98 3.88
2015-16
Generating Station
Plant Type
Must Run =
1
Others = 2
Plant CapacityDISCOM's
share
DISCOM's
share
(MW) (%) (MW) Net Availability Dispatch Fixed Variable Incentive Income Tax Others Total Fixed IncentivesIncome TaxOthers Variable Total
TSGENCO
Thermal
VTPS I 2 420.00 38.02 159.68 3203.32 3203.32 173.78 1025.67 1199.45 0.54 0.00 0.00 0.00 3.20 3.74
VTPS II 2 420.00 38.02 159.68 0.00 0.00 0.00 0.00 0.00 0.00 0.00 0.00 0.00
VTPS III 2 420.00 38.02 159.68 0.00 0.00 0.00 0.00 0.00 0.00 0.00 0.00 0.00
VTPS IV 2 500.00 38.02 190.10 1118.44 1118.44 186.12 337.00 523.12 1.66 0.00 0.00 0.00 3.01 4.68
RTPP I 2 420.00 38.02 159.68 1042.94 1042.94 85.31 364.01 449.32 0.82 0.00 0.00 0.00 3.49 4.31
RTPP Stage-II 2 420.00 38.02 159.68 1071.91 1071.91 157.46 360.18 517.64 1.47 0.00 0.00 0.00 3.36 4.83
RTPP Stage-III 2 210.00 38.02 79.84 514.99 514.99 106.54 175.41 281.95 2.07 0.00 0.00 0.00 3.41 5.47
KTPS A 2 240.00 38.02 91.25 1486.13 1486.13 148.37 374.90 523.27 1.00 0.00 0.00 0.00 2.52 3.52
KTPS B 2 240.00 38.02 91.25 0.00 0.00 0.00 0.00 0.00 0.00 0.00 0.00 0.00 0.00 0.00
KTPS C 2 240.00 38.02 91.25 0.00 0.00 0.00 0.00 0.00 0.00 0.00 0.00 0.00
KTPS D 2 500.00 38.02 190.10 1204.25 1204.25 89.78 249.70 339.48 0.75 0.00 0.00 0.00 2.07 2.82
KTPS Stage VI 2 500.00 38.02 190.10 824.54 824.54 220.15 216.77 436.92 2.67 0.00 0.00 0.00 2.63 5.30
RTS B 2 62.50 38.02 23.76 138.27 138.27 18.29 37.32 55.61 1.32 0.00 0.00 0.00 2.70 4.02
NTS 2 0.00 0.00 0.00 0.00 0.00 0.00 0.00 0.00 0.00 0.00 0.00 0.00
Kakatiya Thermal Power Plant
Stage I 2 500.00 38.02 190.10 977.72 977.72 220.07 240.75 460.82 2.25 0.00 0.00 0.00 2.46 4.71
Kakatiya Thermal Power Plant
Stage II 2 600.00 70.55 423.30 229.04 229.04 75.41 75.41 3.29 0.00 0.00 0.00 0.00 3.29
Damodaram Sanjeevaiah
Thermal power plant - I 0.00 0.00 0.00 0.00 0.00 0.00 0.00 0.00 0.00 0.00
Damodaram Sanjeevaiah
Thermal power plant - II 0.00 0.00 0.00 0.00 0.00 0.00 0.00 0.00 0.00 0.00
Thermal Incentive 2015-16 0.00 0.00 0.27 0.27 0.00 0.00 0.00 0.00 0.00 0.00
TSGENCO Thermal True-up
2015-16 0.00 0.00 -9.86 -9.86 0.00 0.00 0.00 0.00 0.00 0.00
0.00 0.00 0.00 0.00 0.00 0.00 0.00 0.00 0.00
0.00 0.00 0.00 0.00 0.00 0.00 0.00 0.00 0.00
0.00 0.00 0.00 0.00 0.00 0.00 0.00 0.00 0.00
TOTAL THERMAL 5692.50 2359.47 11811.54 11811.54 1471.41 3381.72 0.27 0.00 0.00 4853.40 1.25 0.00 0.00 0.00 2.86 4.11
MACHKUND PH TS Share 1 84.00 38.02 31.94 0.00 0.00 0.00 0.00 0.00 0.00 0.00 0.00 0.00
Unit Cost
(Rs. / kWh)
Note:
1) Details of NCE Plant wise to be filled in Form 1.4 [i,ii,iii,iv]
2) Hydro cost break up details to be provided based on appropriate methodology. In case it is not possible to
Availability and Dispatch (MU) Cost (Rs. Crs.)

TUNGBHADRA PH TSShare 1 57.60 38.02 21.90 0.00 0.00 0.00 0.00 0.00 0.00 0.00 0.00 0.00
USL 1 240.00 38.02 91.25 0.00 0.00 0.00 0.00 0.00 0.00 0.00 0.00 0.00
LSR 1 460.00 38.02 174.89 0.00 0.00 0.00 0.00 0.00 0.00 0.00 0.00 0.00
DONKARAYI 1 25.00 38.02 9.51 0.00 0.00 0.00 0.00 0.00 0.00 0.00 0.00 0.00
SSLM 1 770.00 38.02 292.75 0.00 0.00 0.00 0.00 0.00 0.00 0.00 0.00 0.00
NSPH 1 815.00 38.02 309.86 62.11 62.11 98.60 98.60 15.87 0.00 0.00 0.00 0.00 15.87
NSRCPH 1 90.00 38.02 34.22 0.00 0.00 0.00 0.00 0.00 0.00 0.00 0.00 0.00
NSLCPH 1 60.00 38.02 22.81 0.00 0.00 7.25 7.25 -131812.91 0.00 0.00 0.00 0.00 -131812.91
POCHAMPAD PH 1 27.00 38.02 10.27 -0.13 -0.13 8.16 8.16 -650.92 0.00 0.00 0.00 0.00 -650.92
NIZAMSAGAR PH 1 10.00 38.02 3.80 -0.13 -0.13 3.02 3.02 -224.22 0.00 0.00 0.00 0.00 -224.22
PABM 1 20.00 38.02 7.60 0.00 0.00 0.00 0.00 0.00 0.00 0.00 0.00 0.00
MINI HYDRO&OTHERS 1 1.00 38.02 0.38 0.00 0.00 0.00 0.00 0.00 0.00 0.00 0.00 0.00
SINGUR 1 15.00 38.02 5.70 -0.19 -0.19 4.53 4.53 -237.05 0.00 0.00 0.00 0.00 -237.05
SSLM LCPH 1 900.00 38.02 342.18 103.71 103.71 333.91 333.91 32.20 0.00 0.00 0.00 0.00 32.20
Nagarjunasagar Tail Pond
Dam Power House 1 50.00 38.02 19.01 0.00 0.00 0.00 0.00 0.00 0.00 0.00 0.00 0.00
Priyadarshini Jurala Hydro
Electric Project- TS Share 1 234.00 19.01 44.48 14.25 14.25 43.32 43.32 30.40 0.00 0.00 0.00 0.00 30.40
Lower Jurala Hydro Electric
Project 1 240.00 70.55 169.32 1.88 1.88 14.16 14.16 75.29 0.00 0.00 0.00 0.00 75.29
POCHAMPAD Stig-II 1 9.00 38.02 3.42 0.00 0.00 3.77 3.77 0.00 0.00 0.00 0.00 0.00 0.00
PULICHINTAL(New Project) 1 120.00 70.55 84.66 0.00 0.00 0.00 0.00 0.00 0.00 0.00 0.00 0.00
Mini Hydel & Others
(Peddapalli, Palair) 1 11.16 38.02 4.24 0.00 0.00 4.16 4.16 29927.87 0.00 0.00 0.00 0.00 29927.87
APGENCO HYDEL 0.00 73.78 73.78 9.71 0.00 9.71 1.32 0.00 0.00 0.00 0.00 1.32
Lower Jurala Hydro Electric
Project Unit-II 4.21 4.21 15.36 15.36 36.46 0.00 0.00 0.00 0.00 36.46
TSGENCO Hydel True-up
2014-15 0.00 0.00 -35.69 -35.69 0.00 0.00 0.00 0.00 0.00 0.00
TSGENCO Hydel 100% alloc.
2014-15 0.00 0.00 201.27 201.27 0.00 0.00 0.00 0.00 0.00 0.00
TOTAL HYDRO 4238.76 1684.20 259.50 259.50 711.55 0.00 0.00 0.00 0.00 711.55 27.42 0.00 0.00 0.00 0.00 27.42
TOTAL TSGENCO 9931.26 4043.67 12071.04 12071.04 2182.96 3381.72 0.27 0.00 0.00 5564.95 1.81 0.00 0.00 0.00 2.80 4.61
Central Generating Stations
NTPC
NTPC (SR)
NTPC (SR) 2 2100.00 12.51 262.71 1675.76 1675.76 81.58 373.57 455.15 0.49 0.00 0.00 0.00 2.23 2.72
NTPC (SR) Stage III 2 500.00 13.16 65.80 407.15 407.15 34.34 91.09 125.43 0.84 0.00 0.00 0.00 2.24 3.08
Total NTPC(SR) 2600.00 328.51 2082.91 2082.91 115.92 464.66 0.00 0.00 0.00 580.59 0.56 0.00 0.00 0.00 2.23 2.79
NTPC (ER)
Farakka 0.00 0.00 -0.01 0.00 -0.01 0.00 0.00 0.00 0.00 0.00 0.00
Kahalgaon 0.00 0.00 0.00 0.00 0.00 0.00 0.00 0.00 0.00 0.00 0.00
Talcher - Stage 1 0.00 0.00 0.01 0.00 0.01 0.00 0.00 0.00 0.00 0.00 0.00
Talcher Stage 2 2 2000.00 8.07 161.40 1128.98 1128.98 81.27 145.79 227.06 0.72 0.00 0.00 0.00 1.29 2.01
Others 0.00 0.00 0.00 0.00 0.00 0.00 0.00 0.00 0.00
Total NTPC(ER) 2000.00 161.40 1128.98 1128.98 81.27 145.79 0.00 0.00 0.00 227.06 0.72 0.00 0.00 0.00 1.29 2.01
Total NTPC 4600.00 489.91 3211.89 3211.89 197.19 610.45 0.00 0.00 0.00 807.65 0.61 0.00 0.00 0.00 1.90 2.51
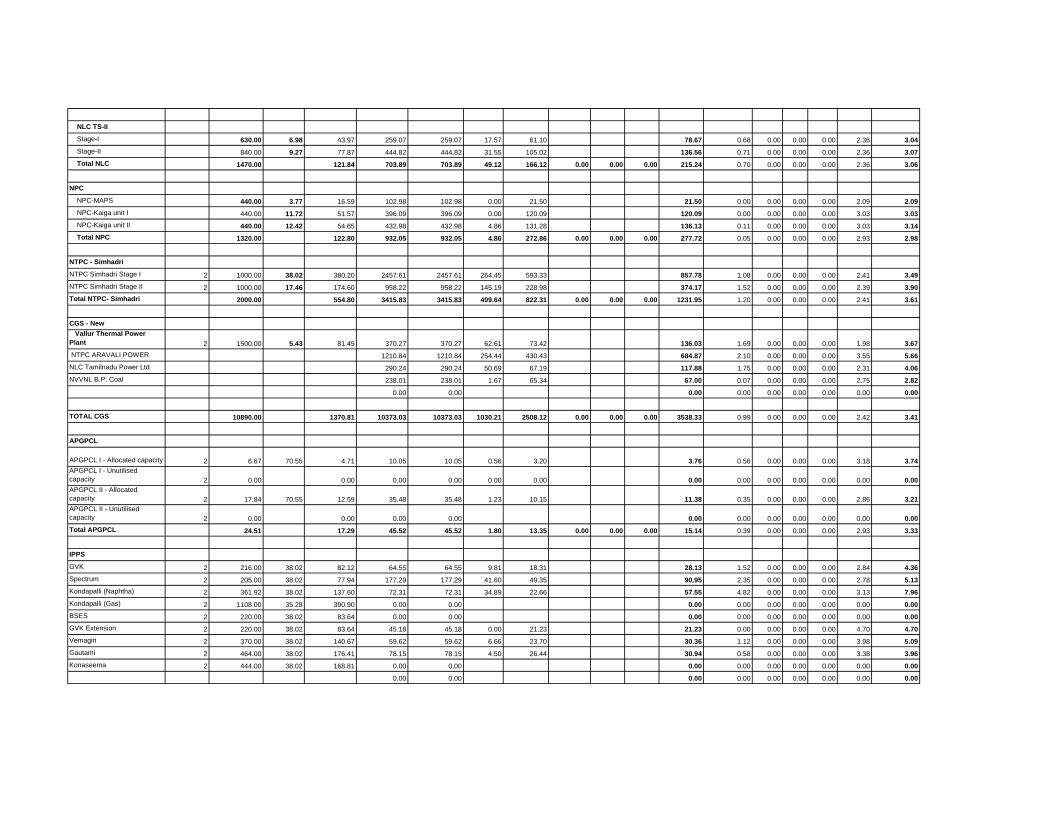
NLC TS-II
Stage-I 630.00 6.98 43.97 259.07 259.07 17.57 61.10 78.67 0.68 0.00 0.00 0.00 2.36 3.04
Stage-II 840.00 9.27 77.87 444.82 444.82 31.55 105.02 136.56 0.71 0.00 0.00 0.00 2.36 3.07
Total NLC 1470.00 121.84 703.89 703.89 49.12 166.12 0.00 0.00 0.00 215.24 0.70 0.00 0.00 0.00 2.36 3.06
NPC
NPC-MAPS 440.00 3.77 16.59 102.98 102.98 0.00 21.50 21.50 0.00 0.00 0.00 0.00 2.09 2.09
NPC-Kaiga unit I 440.00 11.72 51.57 396.09 396.09 0.00 120.09 120.09 0.00 0.00 0.00 0.00 3.03 3.03
NPC-Kaiga unit II 440.00 12.42 54.65 432.98 432.98 4.86 131.28 136.13 0.11 0.00 0.00 0.00 3.03 3.14
Total NPC 1320.00 122.80 932.05 932.05 4.86 272.86 0.00 0.00 0.00 277.72 0.05 0.00 0.00 0.00 2.93 2.98
NTPC - Simhadri
NTPC Simhadri Stage I 2 1000.00 38.02 380.20 2457.61 2457.61 264.45 593.33 857.78 1.08 0.00 0.00 0.00 2.41 3.49
NTPC Simhadri Stage II 2 1000.00 17.46 174.60 958.22 958.22 145.19 228.98 374.17 1.52 0.00 0.00 0.00 2.39 3.90
Total NTPC- Simhadri 2000.00 554.80 3415.83 3415.83 409.64 822.31 0.00 0.00 0.00 1231.95 1.20 0.00 0.00 0.00 2.41 3.61
CGS - New
Vallur Thermal Power
Plant 2 1500.00 5.43 81.45 370.27 370.27 62.61 73.42 136.03 1.69 0.00 0.00 0.00 1.98 3.67
NTPC ARAVALI POWER 1210.84 1210.84 254.44 430.43 684.87 2.10 0.00 0.00 0.00 3.55 5.66
NLC Tamilnadu Power Ltd 290.24 290.24 50.69 67.19 117.88 1.75 0.00 0.00 0.00 2.31 4.06
NVVNL B.P. Coal 238.01 238.01 1.67 65.34 67.00 0.07 0.00 0.00 0.00 2.75 2.82
0.00 0.00 0.00 0.00 0.00 0.00 0.00 0.00 0.00
TOTAL CGS 10890.00 1370.81 10373.03 10373.03 1030.21 2508.12 0.00 0.00 0.00 3538.33 0.99 0.00 0.00 0.00 2.42 3.41
APGPCL
APGPCL I - Allocated capacity 2 6.67 70.55 4.71 10.05 10.05 0.56 3.20 3.76 0.56 0.00 0.00 0.00 3.18 3.74
APGPCL I - Unutilised
capacity 2 0.00 0.00 0.00 0.00 0.00 0.00 0.00 0.00 0.00 0.00 0.00 0.00 0.00
APGPCL II - Allocated
capacity 2 17.84 70.55 12.59 35.48 35.48 1.23 10.15 11.38 0.35 0.00 0.00 0.00 2.86 3.21
APGPCL II - Unutilised
capacity 2 0.00 0.00 0.00 0.00 0.00 0.00 0.00 0.00 0.00 0.00 0.00
Total APGPCL 24.51 17.29 45.52 45.52 1.80 13.35 0.00 0.00 0.00 15.14 0.39 0.00 0.00 0.00 2.93 3.33
IPPS
GVK 2 216.00 38.02 82.12 64.55 64.55 9.81 18.31 28.13 1.52 0.00 0.00 0.00 2.84 4.36
Spectrum 2 205.00 38.02 77.94 177.29 177.29 41.60 49.35 90.95 2.35 0.00 0.00 0.00 2.78 5.13
Kondapalli (Naphtha) 2 361.92 38.02 137.60 72.31 72.31 34.89 22.66 57.55 4.82 0.00 0.00 0.00 3.13 7.96
Kondapalli (Gas) 2 1108.00 35.28 390.90 0.00 0.00 0.00 0.00 0.00 0.00 0.00 0.00 0.00
BSES 2 220.00 38.02 83.64 0.00 0.00 0.00 0.00 0.00 0.00 0.00 0.00 0.00
GVK Extension 2 220.00 38.02 83.64 45.18 45.18 0.00 21.23 21.23 0.00 0.00 0.00 0.00 4.70 4.70
Vemagiri 2 370.00 38.02 140.67 59.62 59.62 6.66 23.70 30.36 1.12 0.00 0.00 0.00 3.98 5.09
Gautami 2 464.00 38.02 176.41 78.15 78.15 4.50 26.44 30.94 0.58 0.00 0.00 0.00 3.38 3.96
Konaseema 2 444.00 38.02 168.81 0.00 0.00 0.00 0.00 0.00 0.00 0.00 0.00 0.00
0.00 0.00 0.00 0.00 0.00 0.00 0.00 0.00 0.00

TOTAL IPPS 3608.92 1341.75 497.10 497.10 97.46 161.70 0.00 0.00 0.00 259.17 1.96 0.00 0.00 0.00 3.25 5.21
NCE
NCE - Bio-Mass 1 51.00 21.99 11.21 40.61 40.61 28.20 -1.55 26.64 6.94 0.00 0.00 -0.38 0.00 6.56
NCE - Bagasse 1 73.80 43.86 32.37 25.15 25.15 10.22 10.22 4.06 0.00 0.00 0.00 0.00 4.06
NCE - Municipal Waste to
Energy 1 6.60 35.48 2.34 0.00 0.00 0.00 0.00 0.00 0.00 0.00 0.00 0.00
NCE - Industrial Waste based
power project 1 11.00 100.00 11.00 38.18 38.18 23.96 23.96 6.28 0.00 0.00 0.00 0.00 6.28
NCE - Wind Power 1 0.00 0.00 0.00 0.00 0.00 0.00 0.00 0.00 0.00 0.00 0.00 0.00
NCE - Mini Hydel 1 7.55 65.03 4.91 0.11 0.11 0.02 0.02 2.17 0.00 0.00 0.00 0.00 2.17
NCE - NCL Energy Ltd 1 0.00 0.00 0.00 0.00 0.00 0.00 0.00 0.00 0.00 0.00 0.00 0.00
NCE-Others 1 150.00 93.37 140.06 172.60 172.60 106.77 39.49 -9.47 136.79 6.19 0.00 0.00 -0.55 2.29 7.93
TOTAL NCE 299.95 201.89 276.65 276.65 169.17 39.49 0.00 0.00 -11.03 197.64 6.12 0.00 0.00 -0.40 1.43 7.14
OTHERS
Srivathsa 0.00 0.00 0.00 0.00 0.00 0.00 0.00 0.00 0.00
LVS 0.00 0.00 0.00 0.00 0.00 0.00 0.00 0.00 0.00
Vishakapatnam Steel Plant 0.00 0.00 0.00 0.00 0.00 0.00 0.00 0.00 0.00
NB Ferro Alloys 0.00 0.00 0.00 0.00 0.00 0.00 0.00 0.00 0.00
KSK Mahanadi (MT) 2 400.00 38.02 152.08 1583.15 1583.15 591.34 591.34 0.00 0.00 0.00 0.00 3.74 3.74
Hinduja 2 0.00 0.00 0.00 0.00 0.00 0.00 0.00 0.00 0.00 0.00
Thermal Power Unit 1 2 500.00 38.02 190.10 1418.52 1418.52 282.52 252.65 535.17 1.99 0.00 0.00 0.00 1.78 3.77
Thermal Power Unit 2 600.00 70.55 423.30 0.00 0.00 0.00 0.00 0.00 0.00 0.00 0.00 0.00
0.00 0.00 0.00 0.00 0.00 0.00 0.00 0.00 0.00
0.00 0.00 0.00 0.00 0.00 0.00 0.00 0.00 0.00
0.00 0.00 0.00 0.00 0.00 0.00 0.00 0.00 0.00
TOTAL OTHERS 1500.00 765.48 3001.67 3001.67 282.52 843.98 0.00 0.00 0.00 1126.50 0.94 0.00 0.00 0.00 2.81 3.75
MARKET
PTC 0.00 0.00 0.00 0.00 0.00 0.00 0.00 0.00 0.00
RCL and Short-Term
Sources(IG Wells,Kesoram) 0.00 0.00 0.00 0.00 0.00 0.00 0.00 0.00 0.00
CPDCL 0.00 0.00 0.00 0.00 0.00 0.00 0.00 0.00 0.00
EPDCL 0.00 0.00 0.00 0.00 0.00 0.00 0.00 0.00 0.00
NPDCL 0.00 0.00 0.00 0.00 0.00 0.00 0.00 0.00 0.00
SPDCL 0.00 0.00 0.00 0.00 0.00 0.00 0.00 0.00 0.00
UI 288.22 288.22 0.00 -17.75 -17.75 0.00 0.00 0.00 0.00 -0.62 -0.62
Other Short Term Sources 8188.77 8188.77 0.00 4582.96 4582.96 0.00 0.00 0.00 0.00 5.60 5.60
Puducherry reactive charges 0.00 0.00 0.01 0.00 0.01 0.00 0.00 0.00 0.00 0.00 0.00
Wheeling KPTCL 0.00 0.00 2.76 0.00 2.76 0.00 0.00 0.00 0.00 0.00 0.00
Wheeling Tantransco/Asset
Maintenance 0.00 0.00 0.18 0.00 0.18 0.00 0.00 0.00 0.00 0.00 0.00
Reactive 0.00 0.00 2.77 0.00 2.77 0.00 0.00 0.00 0.00 0.00 0.00
STOA/Others 0.00 0.00 198.22 7.90 206.12 0.00 0.00 0.00 0.00 0.00 0.00
Conjestion charges 0.00 0.00 0.00 0.14 0.14 0.00 0.00 0.00 0.00 0.00 0.00

0.00 0.00 0.00 0.00 0.00 0.00 0.00 0.00 0.00
TOTAL MARKET 0.00 0.00 8476.99 8476.99 203.95 4573.24 0.00 0.00 0.00 4777.19 0.24 0.00 0.00 0.00 5.39 5.64
TOTAL (From All Sources) 26254.64 7740.89 34742.02 34742.02 3968.06 11521.60 0.27 0.00 -11.03 15478.91 1.14 0.00 0.00 0.00 3.32 4.46
2016-17
Generating Station
Plant Type
Must Run =
1
Others = 2
Plant CapacityDISCOM's
share
DISCOM's
share
(MW) (%) (MW) Net Availability Dispatch Fixed Variable Incentive Income Tax Others Total Fixed IncentivesIncome TaxOthers Variable Total
TSGENCO
Thermal
VTPS I 2 420 38% 159.68 1013.80 1013.80 83.14 324.41 - - - 407.56 0.82 0.00 0.00 0.00 3.20 4.02
VTPS II 2 420 38% 159.68 1013.80 1005.18 83.14 321.66 - - - 404.80 0.83 0.00 0.00 0.00 3.20 4.03
VTPS III 2 420 38% 159.68 1013.80 923.09 83.14 295.39 - - - 378.53 0.90 0.00 0.00 0.00 3.20 4.10
VTPS IV 2 500 38% 190.10 1368.53 1368.53 165.62 413.30 - - - 578.92 1.21 0.00 0.00 0.00 3.02 4.23
RTPP I 2 420 38% 159.68 1051.81 791.63 101.78 300.03 - - - 401.80 1.29 0.00 0.00 0.00 3.79 5.08
RTPP Stage-II 2 420 38% 159.68 1054.48 1054.48 161.59 330.59 - - - 492.18 1.53 0.00 0.00 0.00 3.14 4.67
RTPP Stage-III 2 210 38% 79.84 518.80 431.87 108.31 163.68 - - - 271.98 2.51 0.00 0.00 0.00 3.79 6.30
KTPS A 2 240 38% 91.25 495.10 495.10 66.86 138.64 - 2.23 23.92 231.65 1.35 0.00 0.04 0.48 2.80 4.68
KTPS B 2 240 38% 91.25 495.10 495.10 66.86 138.64 - 2.23 23.92 231.65 1.35 0.00 0.04 0.48 2.80 4.68
KTPS C 2 240 38% 91.25 516.95 516.95 66.86 144.76 - 2.23 23.92 237.77 1.29 0.00 0.04 0.46 2.80 4.60
KTPS D 2 500 38% 190.10 1130.06 1130.06 101.32 240.22 - 4.64 49.84 396.01 0.90 0.00 0.04 0.44 2.13 3.50
KTPS Stage VI 2 500 38% 190.10 1189.68 1189.68 214.78 336.80 - 4.64 49.84 606.05 1.81 0.00 0.04 0.42 2.83 5.09
RTS B 2 63 38% 23.76 151.69 138.01 18.98 45.89 - 0.58 6.23 71.68 1.38 0.00 0.04 0.45 3.32 5.19
NTS 2 - 0.00 0.00 0.00 - - - - - 0.00 0.00 0.00 0.00 0.00 0.00 0.00
Kakatiya Thermal Power Plant
Stage I 2 500 38% 190.10 1149.75 1149.75 215.03 306.56 - 4.64 49.84 576.06 1.87 0.00 0.04 0.43 2.67 5.01
Kakatiya Thermal Power Plant
Stage II 2 600 71% 423.30 2159.73 2159.73 659.80 572.71 - - - 1232.51 3.06 0.00 0.00 0.00 2.65 5.71
0.00 0.00 0.00 0.00 0.00 0.00 0.00 0.00 0.00
0.00 0.00 0.00 0.00 0.00 0.00 0.00 0.00 0.00
0.00 0.00 0.00 0.00 0.00 0.00 0.00 0.00 0.00
TOTAL THERMAL 5692.50 2359.44 14323.08 13862.97 2197.21 4073.27 0.00 21.17 227.51 6519.16 1.58 0.00 0.02 0.16 2.94 4.70
MACHKUND PH TS Share 1 84 38% 31.94 50.29 50.29 11.23 - - - - 11.23 2.23 0.00 0.00 0.00 0.00 2.23
TUNGBHADRA PH TSShare 1 58 38% 21.90 4.88 4.88 7.66 - - - - 7.66 15.69 0.00 0.00 0.00 0.00 15.69
USL 1 240 38% 91.25 0.00 0.00 - - - - - 0.00 0.00 0.00 0.00 0.00 0.00 0.00
LSR 1 460 38% 174.89 0.00 0.00 - - - - - 0.00 0.00 0.00 0.00 0.00 0.00 0.00
DONKARAYI 1 25 38% 9.50 0.00 0.00 - - - - - 0.00 0.00 0.00 0.00 0.00 0.00 0.00
SSLM 1 770 38% 292.75 0.00 0.00 - - - - - 0.00 0.00 0.00 0.00 0.00 0.00 0.00
NSPH 1 816 38% 310.09 175.64 175.64 132.59 - - - - 132.59 7.55 0.00 0.00 0.00 0.00 7.55
Note:
1) Details of NCE Plant wise to be filled in Form 1.4 [i,ii,iii,iv]
2) Hydro cost break up details to be provided based on appropriate methodology. In case it is not possible to
Availability and Dispatch (MU) Cost (Rs. Crs.)Unit Cost
(Rs. / kWh)

NSRCPH 1 90 38% 34.22 0.00 0.00 - - - - - 0.00 0.00 0.00 0.00 0.00 0.00 0.00
NSLCPH 1 60 38% 22.81 8.98 8.98 9.76 - - - - 9.76 10.86 0.00 0.00 0.00 0.00 10.86
POCHAMPAD PH 1 27 38% 10.27 17.60 17.60 12.35 - - - - 12.35 7.01 0.00 0.00 0.00 0.00 7.01
NIZAMSAGAR PH 1 10 38% 3.80 3.87 3.87 4.58 - - - - 4.58 11.81 0.00 0.00 0.00 0.00 11.81
PABM 1 20 38% 7.60 0.00 0.00 - - - - - 0.00 0.00 0.00 0.00 0.00 0.00 0.00
MINI HYDRO&OTHERS 1 1 38% 0.38 0.00 0.00 - - - - - 0.00 0.00 0.00 0.00 0.00 0.00 0.00
SINGUR 1 15 38% 5.70 3.38 3.38 6.86 - - - - 6.86 20.32 0.00 0.00 0.00 0.00 20.32
SSLM LCPH 1 900 38% 342.17 276.72 276.72 336.81 - - - - 336.81 12.17 0.00 0.00 0.00 0.00 12.17
Nagarjunasagar Tail Pond
Dam Power House 1 50 38% 19.01 0.00 0.00 - - - - - 0.00 0.00 0.00 0.00 0.00 0.00 0.00
Priyadarshini Jurala Hydro
Electric Project-TSShare 1 234 19% 44.48 52.70 52.70 43.64 - - - - 43.64 8.28 0.00 0.00 0.00 0.00 8.28
Lower Jurala Hydro Electric
Project 1 240 71% 169.32 99.60 99.60 151.66 - - - - 151.66 15.23 0.00 0.00 0.00 0.00 15.23
POCHAMPAD PH Stage 2 1 9 38% 3.42 5.58 5.58 4.94 - - - - 4.94 8.85 0.00 0.00 0.00 0.00 8.85
PULICHINTAL(New Project) 1 120 71% 84.66 19.98 19.98 15.06 - - - - 15.06 7.54 0.00 0.00 0.00 0.00 7.54
Mini hydel & others 1 0.00 1.07 1.07 3.90 - - - - 3.90 36.46 0.00 0.00 0.00 0.00 36.46
Ramagiri wind mills 0.00 0.00 0.00 - - - - - 0.00 0.00 0.00 0.00 0.00 0.00 0.00
0.00 0.00 0.00 0.00 0.00 0.00 0.00 0.00 0.00
0.00 0.00 0.00 0.00 0.00 0.00 0.00 0.00 0.00
TOTAL HYDRO 4228.20 1680.16 720.30 720.30 741.04 0.00 0.00 0.00 0.00 741.04 10.29 0.00 0.00 0.00 0.00 10.29
TOTAL TSGENCO 9920.70 4039.60 15043.38 14583.27 2938.25 4073.27 0.00 21.17 227.51 7260.19 2.01 0.00 0.01 0.16 2.79 4.98
Central Generating Stations
NTPC
NTPC (SR)
NTPC (SR) 2 2,100 13% 262.68 1758.05 1758.05 85.86 368.27 3.51 - - 457.65 0.49 0.02 0.00 0.00 2.09 2.60
NTPC (SR) Stage III 2 500 13% 65.79 423.12 423.12 36.09 90.22 - - - 126.31 0.85 0.00 0.00 0.00 2.13 2.99
Total NTPC(SR) 2600.00 328.47 2181.17 2181.17 121.95 458.49 3.51 0.00 0.00 583.96 0.56 0.02 0.00 0.00 2.10 2.68
NTPC (ER)
Farakka - - 0.00 0.00 0.00 - - - - 0.00 0.00 0.00 0.00 0.00 0.00 0.00
Kahalgaon - - 0.00 0.00 0.00 0.05 - - - 0.06 0.00 0.00 0.00 0.00 0.00 0.00
Talcher - Stage 1 - - 0.00 0.00 0.03 - - - - 0.03 0.00 0.00 0.00 0.00 0.00 0.00
Talcher Stage 2 2 2,000 8% 161.42 1123.64 1123.64 84.51 179.98 1.56 - - 266.05 0.75 0.01 0.00 0.00 1.60 2.37
Others - - 0.00 0.00 - - - - - 0.00 0.00 0.00 0.00 0.00 0.00 0.00
Total NTPC(ER) 2000.00 161.42 1123.64 1123.64 84.54 180.04 1.56 0.00 0.00 266.13 0.75 0.01 0.00 0.00 1.60 2.37
Total NTPC 4600.00 489.89 3304.81 3304.81 206.48 638.53 5.07 0.00 0.00 850.09 0.62 0.02 0.00 0.00 1.93 2.57
NLC TS-II
Stage-I 630 7% 43.99 207.44 187.54 16.49 55.31 - - - 71.80 0.88 0.00 0.00 0.00 2.95 3.83
Stage-II 840 9% 77.83 413.63 413.63 34.72 126.74 0.04 - - 161.49 0.84 0.00 0.00 0.00 3.06 3.90
Total NLC 1470.00 121.82 621.07 601.17 51.20 182.04 0.04 0.00 0.00 233.29 0.85 0.00 0.00 0.00 3.03 3.88
NPC
NPC-MAPS 440 4% 16.58 91.53 91.53 - 19.94 - - - 19.94 0.00 0.00 0.00 0.00 2.18 2.18
NPC-Kaiga unit I 440 12% 51.58 329.91 329.91 - 103.13 - - - 103.13 0.00 0.00 0.00 0.00 3.13 3.13
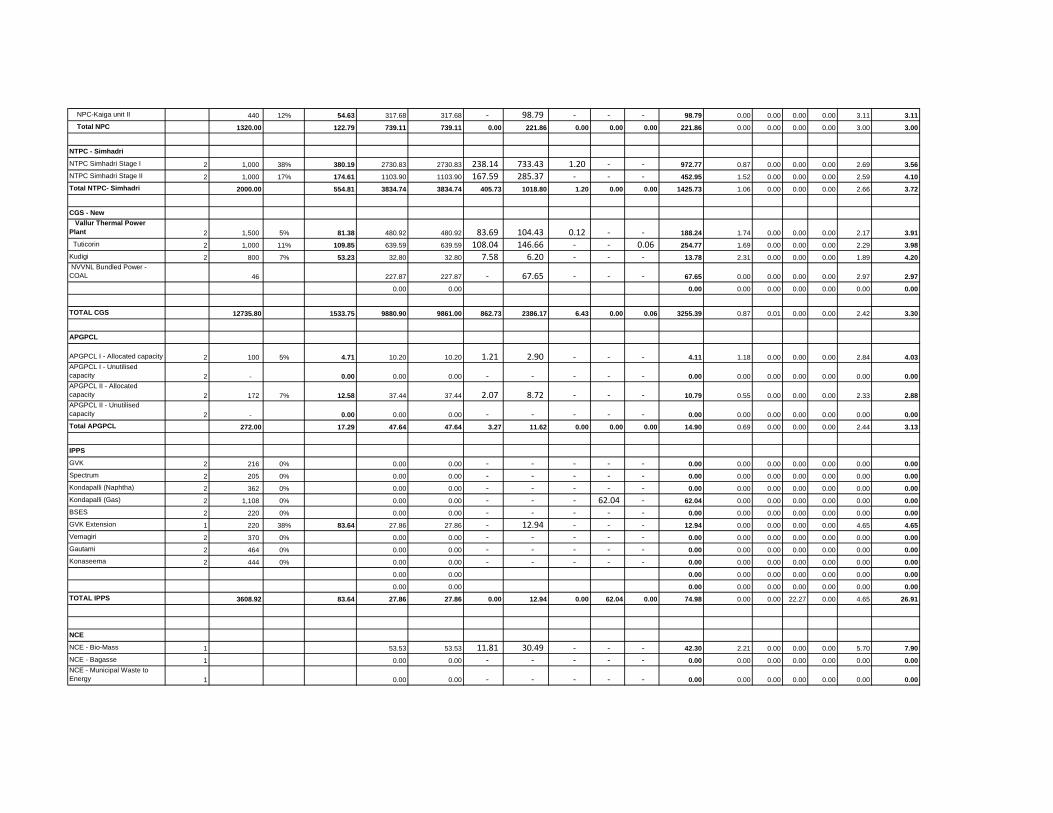
NPC-Kaiga unit II 440 12% 54.63 317.68 317.68 - 98.79 - - - 98.79 0.00 0.00 0.00 0.00 3.11 3.11
Total NPC 1320.00 122.79 739.11 739.11 0.00 221.86 0.00 0.00 0.00 221.86 0.00 0.00 0.00 0.00 3.00 3.00
NTPC - Simhadri
NTPC Simhadri Stage I 2 1,000 38% 380.19 2730.83 2730.83 238.14 733.43 1.20 - - 972.77 0.87 0.00 0.00 0.00 2.69 3.56
NTPC Simhadri Stage II 2 1,000 17% 174.61 1103.90 1103.90 167.59 285.37 - - - 452.95 1.52 0.00 0.00 0.00 2.59 4.10
Total NTPC- Simhadri 2000.00 554.81 3834.74 3834.74 405.73 1018.80 1.20 0.00 0.00 1425.73 1.06 0.00 0.00 0.00 2.66 3.72
CGS - New
Vallur Thermal Power
Plant 2 1,500 5% 81.38 480.92 480.92 83.69 104.43 0.12 - - 188.24 1.74 0.00 0.00 0.00 2.17 3.91
Tuticorin 2 1,000 11% 109.85 639.59 639.59 108.04 146.66 - - 0.06 254.77 1.69 0.00 0.00 0.00 2.29 3.98
Kudigi 2 800 7% 53.23 32.80 32.80 7.58 6.20 - - - 13.78 2.31 0.00 0.00 0.00 1.89 4.20
NVVNL Bundled Power -
COAL 46 227.87 227.87 - 67.65 - - - 67.65 0.00 0.00 0.00 0.00 2.97 2.97
0.00 0.00 0.00 0.00 0.00 0.00 0.00 0.00 0.00
TOTAL CGS 12735.80 1533.75 9880.90 9861.00 862.73 2386.17 6.43 0.00 0.06 3255.39 0.87 0.01 0.00 0.00 2.42 3.30
APGPCL
APGPCL I - Allocated capacity 2 100 5% 4.71 10.20 10.20 1.21 2.90 - - - 4.11 1.18 0.00 0.00 0.00 2.84 4.03
APGPCL I - Unutilised
capacity 2 - 0.00 0.00 0.00 - - - - - 0.00 0.00 0.00 0.00 0.00 0.00 0.00
APGPCL II - Allocated
capacity 2 172 7% 12.58 37.44 37.44 2.07 8.72 - - - 10.79 0.55 0.00 0.00 0.00 2.33 2.88
APGPCL II - Unutilised
capacity 2 - 0.00 0.00 0.00 - - - - - 0.00 0.00 0.00 0.00 0.00 0.00 0.00
Total APGPCL 272.00 17.29 47.64 47.64 3.27 11.62 0.00 0.00 0.00 14.90 0.69 0.00 0.00 0.00 2.44 3.13
IPPS
GVK 2 216 0% 0.00 0.00 - - - - - 0.00 0.00 0.00 0.00 0.00 0.00 0.00
Spectrum 2 205 0% 0.00 0.00 - - - - - 0.00 0.00 0.00 0.00 0.00 0.00 0.00
Kondapalli (Naphtha) 2 362 0% 0.00 0.00 - - - - - 0.00 0.00 0.00 0.00 0.00 0.00 0.00
Kondapalli (Gas) 2 1,108 0% 0.00 0.00 - - - 62.04 - 62.04 0.00 0.00 0.00 0.00 0.00 0.00
BSES 2 220 0% 0.00 0.00 - - - - - 0.00 0.00 0.00 0.00 0.00 0.00 0.00
GVK Extension 1 220 38% 83.64 27.86 27.86 - 12.94 - - - 12.94 0.00 0.00 0.00 0.00 4.65 4.65
Vemagiri 2 370 0% 0.00 0.00 - - - - - 0.00 0.00 0.00 0.00 0.00 0.00 0.00
Gautami 2 464 0% 0.00 0.00 - - - - - 0.00 0.00 0.00 0.00 0.00 0.00 0.00
Konaseema 2 444 0% 0.00 0.00 - - - - - 0.00 0.00 0.00 0.00 0.00 0.00 0.00
0.00 0.00 0.00 0.00 0.00 0.00 0.00 0.00 0.00
0.00 0.00 0.00 0.00 0.00 0.00 0.00 0.00 0.00
TOTAL IPPS 3608.92 83.64 27.86 27.86 0.00 12.94 0.00 62.04 0.00 74.98 0.00 0.00 22.27 0.00 4.65 26.91
NCE
NCE - Bio-Mass 1 53.53 53.53 11.81 30.49 - - - 42.30 2.21 0.00 0.00 0.00 5.70 7.90
NCE - Bagasse 1 0.00 0.00 - - - - - 0.00 0.00 0.00 0.00 0.00 0.00 0.00
NCE - Municipal Waste to
Energy 1 0.00 0.00 - - - - - 0.00 0.00 0.00 0.00 0.00 0.00 0.00
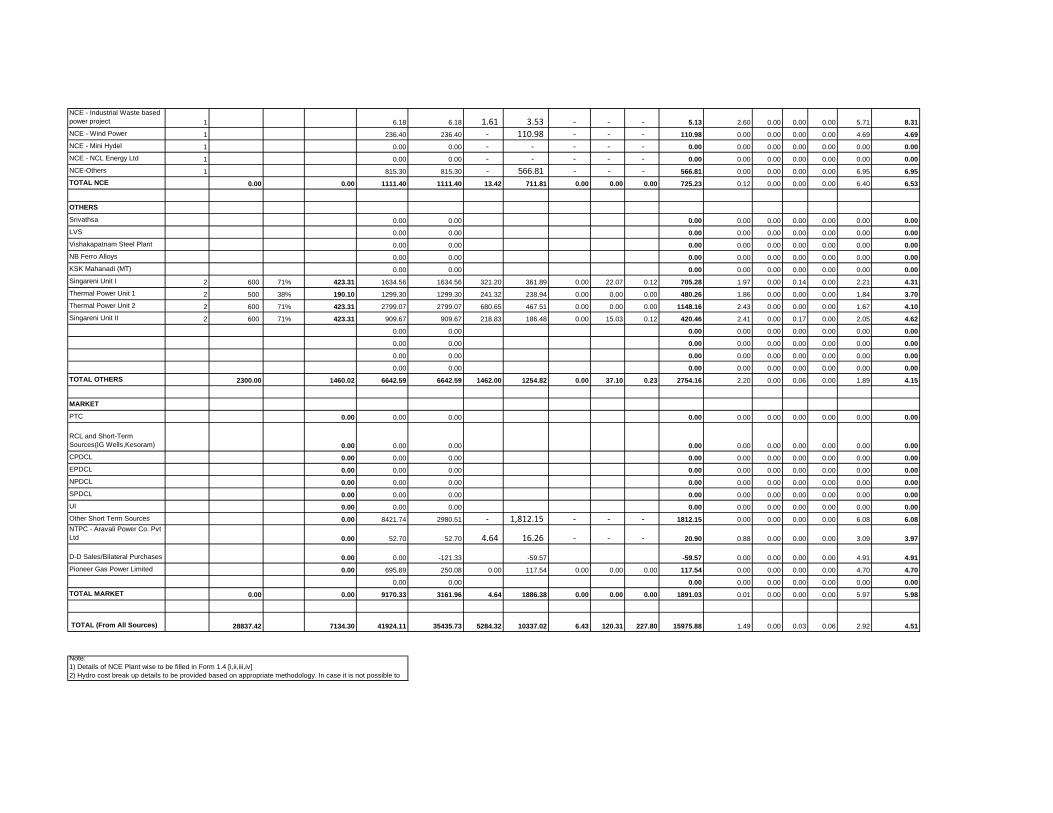
NCE - Industrial Waste based
power project 1 6.18 6.18 1.61 3.53 - - - 5.13 2.60 0.00 0.00 0.00 5.71 8.31
NCE - Wind Power 1 236.40 236.40 - 110.98 - - - 110.98 0.00 0.00 0.00 0.00 4.69 4.69
NCE - Mini Hydel 1 0.00 0.00 - - - - - 0.00 0.00 0.00 0.00 0.00 0.00 0.00
NCE - NCL Energy Ltd 1 0.00 0.00 - - - - - 0.00 0.00 0.00 0.00 0.00 0.00 0.00
NCE-Others 1 815.30 815.30 - 566.81 - - - 566.81 0.00 0.00 0.00 0.00 6.95 6.95
TOTAL NCE 0.00 0.00 1111.40 1111.40 13.42 711.81 0.00 0.00 0.00 725.23 0.12 0.00 0.00 0.00 6.40 6.53
OTHERS
Srivathsa 0.00 0.00 0.00 0.00 0.00 0.00 0.00 0.00 0.00
LVS 0.00 0.00 0.00 0.00 0.00 0.00 0.00 0.00 0.00
Vishakapatnam Steel Plant 0.00 0.00 0.00 0.00 0.00 0.00 0.00 0.00 0.00
NB Ferro Alloys 0.00 0.00 0.00 0.00 0.00 0.00 0.00 0.00 0.00
KSK Mahanadi (MT) 0.00 0.00 0.00 0.00 0.00 0.00 0.00 0.00 0.00
Singareni Unit I 2 600 71% 423.31 1634.56 1634.56 321.20 361.89 0.00 22.07 0.12 705.28 1.97 0.00 0.14 0.00 2.21 4.31
Thermal Power Unit 1 2 500 38% 190.10 1299.30 1299.30 241.32 238.94 0.00 0.00 0.00 480.26 1.86 0.00 0.00 0.00 1.84 3.70
Thermal Power Unit 2 2 600 71% 423.31 2799.07 2799.07 680.65 467.51 0.00 0.00 0.00 1148.16 2.43 0.00 0.00 0.00 1.67 4.10
Singareni Unit II 2 600 71% 423.31 909.67 909.67 218.83 186.48 0.00 15.03 0.12 420.46 2.41 0.00 0.17 0.00 2.05 4.62
0.00 0.00 0.00 0.00 0.00 0.00 0.00 0.00 0.00
0.00 0.00 0.00 0.00 0.00 0.00 0.00 0.00 0.00
0.00 0.00 0.00 0.00 0.00 0.00 0.00 0.00 0.00
0.00 0.00 0.00 0.00 0.00 0.00 0.00 0.00 0.00
TOTAL OTHERS 2300.00 1460.02 6642.59 6642.59 1462.00 1254.82 0.00 37.10 0.23 2754.16 2.20 0.00 0.06 0.00 1.89 4.15
MARKET
PTC 0.00 0.00 0.00 0.00 0.00 0.00 0.00 0.00 0.00 0.00
RCL and Short-Term
Sources(IG Wells,Kesoram) 0.00 0.00 0.00 0.00 0.00 0.00 0.00 0.00 0.00 0.00
CPDCL 0.00 0.00 0.00 0.00 0.00 0.00 0.00 0.00 0.00 0.00
EPDCL 0.00 0.00 0.00 0.00 0.00 0.00 0.00 0.00 0.00 0.00
NPDCL 0.00 0.00 0.00 0.00 0.00 0.00 0.00 0.00 0.00 0.00
SPDCL 0.00 0.00 0.00 0.00 0.00 0.00 0.00 0.00 0.00 0.00
UI 0.00 0.00 0.00 0.00 0.00 0.00 0.00 0.00 0.00 0.00
Other Short Term Sources 0.00 8421.74 2980.51 - 1,812.15 - - - 1812.15 0.00 0.00 0.00 0.00 6.08 6.08
NTPC - Aravali Power Co. Pvt
Ltd 0.00 52.70 52.70 4.64 16.26 - - - 20.90 0.88 0.00 0.00 0.00 3.09 3.97
D-D Sales/Bilateral Purchases 0.00 0.00 -121.33 -59.57 -59.57 0.00 0.00 0.00 0.00 4.91 4.91
Pioneer Gas Power Limited 0.00 695.89 250.08 0.00 117.54 0.00 0.00 0.00 117.54 0.00 0.00 0.00 0.00 4.70 4.70
0.00 0.00 0.00 0.00 0.00 0.00 0.00 0.00 0.00
TOTAL MARKET 0.00 0.00 9170.33 3161.96 4.64 1886.38 0.00 0.00 0.00 1891.03 0.01 0.00 0.00 0.00 5.97 5.98
TOTAL (From All Sources) 28837.42 7134.30 41924.11 35435.73 5284.32 10337.02 6.43 120.31 227.80 15975.88 1.49 0.00 0.03 0.06 2.92 4.51
Note:
1) Details of NCE Plant wise to be filled in Form 1.4 [i,ii,iii,iv]
2) Hydro cost break up details to be provided based on appropriate methodology. In case it is not possible to

2017-18
Generating Station
Plant Type
Must Run =
1
Others = 2
Plant CapacityDISCOM's
share
DISCOM's
share
(MW) (%) (MW) Net Availability Dispatch Fixed Variable Incentive Income Tax Others Total Fixed IncentivesIncome TaxOthers Variable Total
TSGENCO
Thermal
VTPS I 2 420 38% 159.68 1021.15 304.38 85.35 99.35 0.00 0.00 0.00 184.70 2.80 0.00 0.00 0.00 3.26 6.07
VTPS II 2 420 38% 159.68 1021.15 181.05 85.35 59.10 0.00 0.00 0.00 144.45 4.71 0.00 0.00 0.00 3.26 7.98
VTPS III 2 420 38% 159.68 1021.15 180.89 85.35 59.04 0.00 0.00 0.00 144.39 4.72 0.00 0.00 0.00 3.26 7.98
VTPS IV 2 500 38% 190.10 1232.30 700.62 173.62 209.61 0.00 0.00 0.00 383.23 2.48 0.00 0.00 0.00 2.99 5.47
RTPP I 2 420 38% 159.68 1018.35 90.20 103.20 32.77 0.00 0.00 0.00 135.97 11.44 0.00 0.00 0.00 3.63 15.07
RTPP Stage-II 2 420 38% 159.68 1018.35 467.10 157.53 149.37 0.00 0.00 0.00 306.90 3.37 0.00 0.00 0.00 3.20 6.57
RTPP Stage-III 2 210 38% 79.84 509.17 62.16 105.28 22.58 0.00 0.00 0.00 127.87 16.94 0.00 0.00 0.00 3.63 20.57
KTPS A 2 240 38% 91.25 577.44 577.44 71.13 144.36 0.00 0.00 26.38 241.87 1.23 0.00 0.00 0.46 2.50 4.19
KTPS B 2 240 38% 91.25 577.44 577.44 71.13 144.36 0.00 0.00 26.38 241.87 1.23 0.00 0.00 0.46 2.50 4.19
KTPS C 2 240 38% 91.25 577.44 577.44 71.13 144.36 0.00 0.00 26.38 241.87 1.23 0.00 0.00 0.46 2.50 4.19
KTPS D 2 500 38% 190.10 1212.32 1212.32 118.61 262.86 0.00 0.00 54.97 436.44 0.98 0.00 0.00 0.45 2.17 3.60
KTPS Stage VI 2 500 38% 190.10 1232.30 1232.30 214.63 308.08 0.00 0.00 54.97 577.67 1.74 0.00 0.00 0.45 2.50 4.69
RTS B 2 63 38% 23.76 151.54 26.84 19.41 9.10 0.00 0.00 6.87 35.38 7.23 0.00 0.00 2.56 3.39 13.18
NTS 2 - 0.00 0.00 0.00 0.00 0.00 0.00 0.00 0.00 0.00 0.00 0.00 0.00 0.00 0.00 0.00
Kakatiya Thermal Power Plant
Stage I 2 500 38% 190.10 1232.30 1232.30 214.54 308.08 0.00 0.00 54.97 577.58 1.74 0.00 0.00 0.45 2.50 4.69
Kakatiya Thermal Power Plant
Stage II 2 600 71% 423.30 2744.04 2744.04 747.10 686.01 0.00 0.00 0.00 1433.11 2.72 0.00 0.00 0.00 2.50 5.22
Damodaram Sanjeevaiah
Thermal power plant - 0.00 0.00 0.00 0.00 0.00 0.00 0.00 0.00 0.00 0.00 0.00 0.00 0.00 0.00
0.00 0.00 0.00 0.00 0.00 0.00 0.00 0.00 0.00
0.00 0.00 0.00 0.00 0.00 0.00 0.00 0.00 0.00
TOTAL THERMAL 5692.50 2359.44 15146.45 10166.54 2323.35 2639.02 0.00 0.00 250.93 5213.31 2.29 0.00 0.00 0.25 2.60 5.13
MACHKUND PH TS Share 1 84.00 0.38 31.94 42.56 42.56 11.66 0.00 0.00 0.00 0.00 11.66 2.74 0.00 0.00 0.00 0.00 2.74
TUNGBHADRA PH TS Share 1 57.60 0.38 21.90 18.86 18.86 8.00 0.00 0.00 0.00 0.00 8.00 4.24 0.00 0.00 0.00 0.00 4.24
USL 1 240.00 0.38 91.25 0.00 0.00 0.00 0.00 0.00 0.00 0.00 0.00 0.00 0.00 0.00 0.00 0.00 0.00
LSR 1 460.00 0.38 174.89 0.00 0.00 0.00 0.00 0.00 0.00 0.00 0.00 0.00 0.00 0.00 0.00 0.00 0.00
DONKARAYI 1 25.00 0.38 9.50 0.00 0.00 0.00 0.00 0.00 0.00 0.00 0.00 0.00 0.00 0.00 0.00 0.00 0.00
SSLM 1 770.00 0.38 292.75 0.00 0.00 0.00 0.00 0.00 0.00 0.00 0.00 0.00 0.00 0.00 0.00 0.00 0.00
NSPH 1 815.60 0.38 310.09 348.12 348.12 170.69 0.00 0.00 0.00 0.00 170.69 4.90 0.00 0.00 0.00 0.00 4.90
NSRCPH 1 90.00 0.38 34.22 0.00 0.00 0.00 0.00 0.00 0.00 0.00 0.00 0.00 0.00 0.00 0.00 0.00 0.00
NSLCPH 1 60.00 0.38 22.81 16.00 16.00 12.56 0.00 0.00 0.00 0.00 12.56 7.85 0.00 0.00 0.00 0.00 7.85
POCHAMPAD PH 1 27.00 0.38 10.27 13.14 13.14 13.48 0.00 0.00 0.00 0.00 13.48 10.26 0.00 0.00 0.00 0.00 10.26
NIZAMSAGAR PH 1 10.00 0.38 3.80 6.06 6.06 5.00 0.00 0.00 0.00 0.00 5.00 8.24 0.00 0.00 0.00 0.00 8.24
PABM 1 20.00 0.38 7.60 0.00 0.00 0.00 0.00 0.00 0.00 0.00 0.00 0.00 0.00 0.00 0.00 0.00 0.00
MINI HYDRO&OTHERS 1 1.00 0.38 0.38 0.00 0.00 0.00 0.00 0.00 0.00 0.00 0.00 0.00 0.00 0.00 0.00 0.00 0.00
SINGUR 1 15.00 0.38 5.70 6.26 6.26 7.49 0.00 0.00 0.00 0.00 7.49 11.97 0.00 0.00 0.00 0.00 11.97
SSLM LCPH 1 900.00 0.38 342.17 333.28 333.28 339.61 0.00 0.00 0.00 0.00 339.61 10.19 0.00 0.00 0.00 0.00 10.19
Availability and Dispatch (MU) Cost (Rs. Crs.)Unit Cost
(Rs. / kWh)
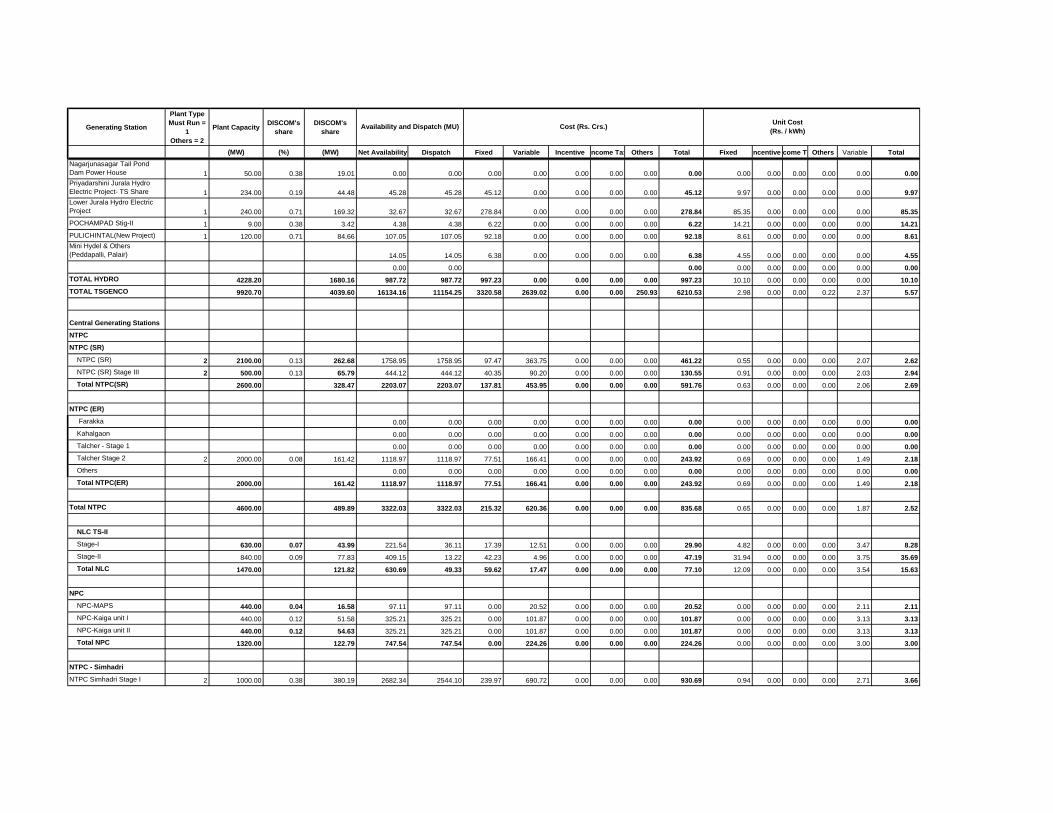
Generating Station
Plant Type
Must Run =
1
Others = 2
Plant CapacityDISCOM's
share
DISCOM's
share
(MW) (%) (MW) Net Availability Dispatch Fixed Variable Incentive Income Tax Others Total Fixed IncentivesIncome TaxOthers Variable Total
Availability and Dispatch (MU) Cost (Rs. Crs.)Unit Cost
(Rs. / kWh)
Nagarjunasagar Tail Pond
Dam Power House 1 50.00 0.38 19.01 0.00 0.00 0.00 0.00 0.00 0.00 0.00 0.00 0.00 0.00 0.00 0.00 0.00 0.00
Priyadarshini Jurala Hydro
Electric Project- TS Share 1 234.00 0.19 44.48 45.28 45.28 45.12 0.00 0.00 0.00 0.00 45.12 9.97 0.00 0.00 0.00 0.00 9.97
Lower Jurala Hydro Electric
Project 1 240.00 0.71 169.32 32.67 32.67 278.84 0.00 0.00 0.00 0.00 278.84 85.35 0.00 0.00 0.00 0.00 85.35
POCHAMPAD Stig-II 1 9.00 0.38 3.42 4.38 4.38 6.22 0.00 0.00 0.00 0.00 6.22 14.21 0.00 0.00 0.00 0.00 14.21
PULICHINTAL(New Project) 1 120.00 0.71 84.66 107.05 107.05 92.18 0.00 0.00 0.00 0.00 92.18 8.61 0.00 0.00 0.00 0.00 8.61
Mini Hydel & Others
(Peddapalli, Palair) 14.05 14.05 6.38 0.00 0.00 0.00 0.00 6.38 4.55 0.00 0.00 0.00 0.00 4.55
0.00 0.00 0.00 0.00 0.00 0.00 0.00 0.00 0.00
TOTAL HYDRO 4228.20 1680.16 987.72 987.72 997.23 0.00 0.00 0.00 0.00 997.23 10.10 0.00 0.00 0.00 0.00 10.10
TOTAL TSGENCO 9920.70 4039.60 16134.16 11154.25 3320.58 2639.02 0.00 0.00 250.93 6210.53 2.98 0.00 0.00 0.22 2.37 5.57
Central Generating Stations
NTPC
NTPC (SR)
NTPC (SR) 2 2100.00 0.13 262.68 1758.95 1758.95 97.47 363.75 0.00 0.00 0.00 461.22 0.55 0.00 0.00 0.00 2.07 2.62
NTPC (SR) Stage III 2 500.00 0.13 65.79 444.12 444.12 40.35 90.20 0.00 0.00 0.00 130.55 0.91 0.00 0.00 0.00 2.03 2.94
Total NTPC(SR) 2600.00 328.47 2203.07 2203.07 137.81 453.95 0.00 0.00 0.00 591.76 0.63 0.00 0.00 0.00 2.06 2.69
NTPC (ER)
Farakka 0.00 0.00 0.00 0.00 0.00 0.00 0.00 0.00 0.00 0.00 0.00 0.00 0.00 0.00
Kahalgaon 0.00 0.00 0.00 0.00 0.00 0.00 0.00 0.00 0.00 0.00 0.00 0.00 0.00 0.00
Talcher - Stage 1 0.00 0.00 0.00 0.00 0.00 0.00 0.00 0.00 0.00 0.00 0.00 0.00 0.00 0.00
Talcher Stage 2 2 2000.00 0.08 161.42 1118.97 1118.97 77.51 166.41 0.00 0.00 0.00 243.92 0.69 0.00 0.00 0.00 1.49 2.18
Others 0.00 0.00 0.00 0.00 0.00 0.00 0.00 0.00 0.00 0.00 0.00 0.00 0.00 0.00
Total NTPC(ER) 2000.00 161.42 1118.97 1118.97 77.51 166.41 0.00 0.00 0.00 243.92 0.69 0.00 0.00 0.00 1.49 2.18
Total NTPC 4600.00 489.89 3322.03 3322.03 215.32 620.36 0.00 0.00 0.00 835.68 0.65 0.00 0.00 0.00 1.87 2.52
NLC TS-II
Stage-I 630.00 0.07 43.99 221.54 36.11 17.39 12.51 0.00 0.00 0.00 29.90 4.82 0.00 0.00 0.00 3.47 8.28
Stage-II 840.00 0.09 77.83 409.15 13.22 42.23 4.96 0.00 0.00 0.00 47.19 31.94 0.00 0.00 0.00 3.75 35.69
Total NLC 1470.00 121.82 630.69 49.33 59.62 17.47 0.00 0.00 0.00 77.10 12.09 0.00 0.00 0.00 3.54 15.63
NPC
NPC-MAPS 440.00 0.04 16.58 97.11 97.11 0.00 20.52 0.00 0.00 0.00 20.52 0.00 0.00 0.00 0.00 2.11 2.11
NPC-Kaiga unit I 440.00 0.12 51.58 325.21 325.21 0.00 101.87 0.00 0.00 0.00 101.87 0.00 0.00 0.00 0.00 3.13 3.13
NPC-Kaiga unit II 440.00 0.12 54.63 325.21 325.21 0.00 101.87 0.00 0.00 0.00 101.87 0.00 0.00 0.00 0.00 3.13 3.13
Total NPC 1320.00 122.79 747.54 747.54 0.00 224.26 0.00 0.00 0.00 224.26 0.00 0.00 0.00 0.00 3.00 3.00
NTPC - Simhadri
NTPC Simhadri Stage I 2 1000.00 0.38 380.19 2682.34 2544.10 239.97 690.72 0.00 0.00 0.00 930.69 0.94 0.00 0.00 0.00 2.71 3.66

Generating Station
Plant Type
Must Run =
1
Others = 2
Plant CapacityDISCOM's
share
DISCOM's
share
(MW) (%) (MW) Net Availability Dispatch Fixed Variable Incentive Income Tax Others Total Fixed IncentivesIncome TaxOthers Variable Total
Availability and Dispatch (MU) Cost (Rs. Crs.)Unit Cost
(Rs. / kWh)
NTPC Simhadri Stage II 2 1000.00 0.17 174.61 1231.92 918.13 183.83 250.83 0.00 0.00 0.00 434.67 2.00 0.00 0.00 0.00 2.73 4.73
Total NTPC- Simhadri 2000.00 554.81 3914.26 3462.22 423.80 941.55 0.00 0.00 0.00 1365.36 1.22 0.00 0.00 0.00 2.72 3.94
CGS - New
Vallur Thermal Power Plant 2 1500.00 0.05 81.38 532.33 532.33 76.01 110.78 0.00 0.00 0.00 186.79 1.43 0.00 0.00 0.00 2.08 3.51
Tuticorin 2 1000.00 0.11 109.85 747.11 747.11 111.16 172.96 0.00 0.00 0.13 284.24 1.49 0.00 0.00 0.00 2.32 3.80
Kudigi 2 800.00 0.07 53.23 724.22 724.22 167.30 136.88 0.00 0.00 0.00 304.17 2.31 0.00 0.00 0.00 1.89 4.20
NVVNL Bundled Power -Coal 237.34 237.34 0.00 69.57 0.00 0.00 0.00 69.57 0.00 0.00 0.00 0.00 2.93 2.93
TOTAL CGS 12690.00 1533.75 10855.53 9822.14 1053.21 2293.82 0.00 0.00 0.13 3347.16 1.07 0.00 0.00 0.00 2.34 3.41
APGPCL
APGPCL I - Allocated capacity 2 100.00 0.05 4.71 14.11 14.11 0.53 3.29 0.00 0.00 0.00 3.82 0.38 0.00 0.00 0.00 2.33 2.71
APGPCL I - Unutilised
capacity 2 0.00 0.00 0.00 0.00 0.00 0.00 0.00 0.00 0.00 0.00 0.00 0.00 0.00 0.00 0.00 0.00
APGPCL II - Allocated
capacity 2 172.00 0.07 12.58 50.46 50.46 2.14 10.49 0.00 0.00 0.00 12.63 0.42 0.00 0.00 0.00 2.08 2.50
APGPCL II - Unutilised
capacity 2 0.00 0.00 0.00 0.00 0.00 0.00 0.00 0.00 0.00 0.00 0.00
Total APGPCL 272.00 17.29 64.57 64.57 2.67 13.77 0.00 0.00 0.00 16.45 0.41 0.00 0.00 0.00 2.13 2.55
IPPS
GVK 0.00 0.00 0.00 0.00 0.00 0.00 0.00 0.00 0.00
Spectrum 0.00 0.00 0.00 0.00 0.00 0.00 0.00 0.00 0.00
Kondapalli (Naphtha) 0.00 0.00 0.00 0.00 0.00 0.00 0.00 0.00 0.00
Kondapalli (Gas) 0.00 0.00 0.00 0.00 0.00 0.00 0.00 0.00 0.00
BSES 0.00 0.00 0.00 0.00 0.00 0.00 0.00 0.00 0.00
GVK Extension 0.00 0.00 0.00 0.00 0.00 0.00 0.00 0.00 0.00
Vemagiri 0.00 0.00 0.00 0.00 0.00 0.00 0.00 0.00 0.00
Gautami 0.00 0.00 0.00 0.00 0.00 0.00 0.00 0.00 0.00
Konaseema 0.00 0.00 0.00 0.00 0.00 0.00 0.00 0.00 0.00
0.00 0.00 0.00 0.00 0.00 0.00 0.00 0.00 0.00
TOTAL IPPS 0.00 0.00 0.00 0.00 0.00 0.00 0.00 0.00 0.00 0.00 0.00 0.00 0.00 0.00 0.00 0.00
NCE
NCE - Bio-Mass 1 56.52 56.52 8.40 24.70 0.00 0.00 0.00 33.10 1.49 0.00 0.00 0.00 4.37 5.86
NCE - Bagasse 1 0.40 0.40 0.06 0.11 0.00 0.00 0.00 0.17 1.41 0.00 0.00 0.00 2.78 4.19
NCE - Municipal Waste to
Energy 1 64.57 64.57 21.95 24.73 0.00 0.00 0.00 46.68 3.40 0.00 0.00 0.00 3.83 7.23
NCE - Industrial Waste based
power project 1 5.52 5.52 2.41 0.90 0.00 0.00 0.00 3.32 4.37 0.00 0.00 0.00 1.64 6.01
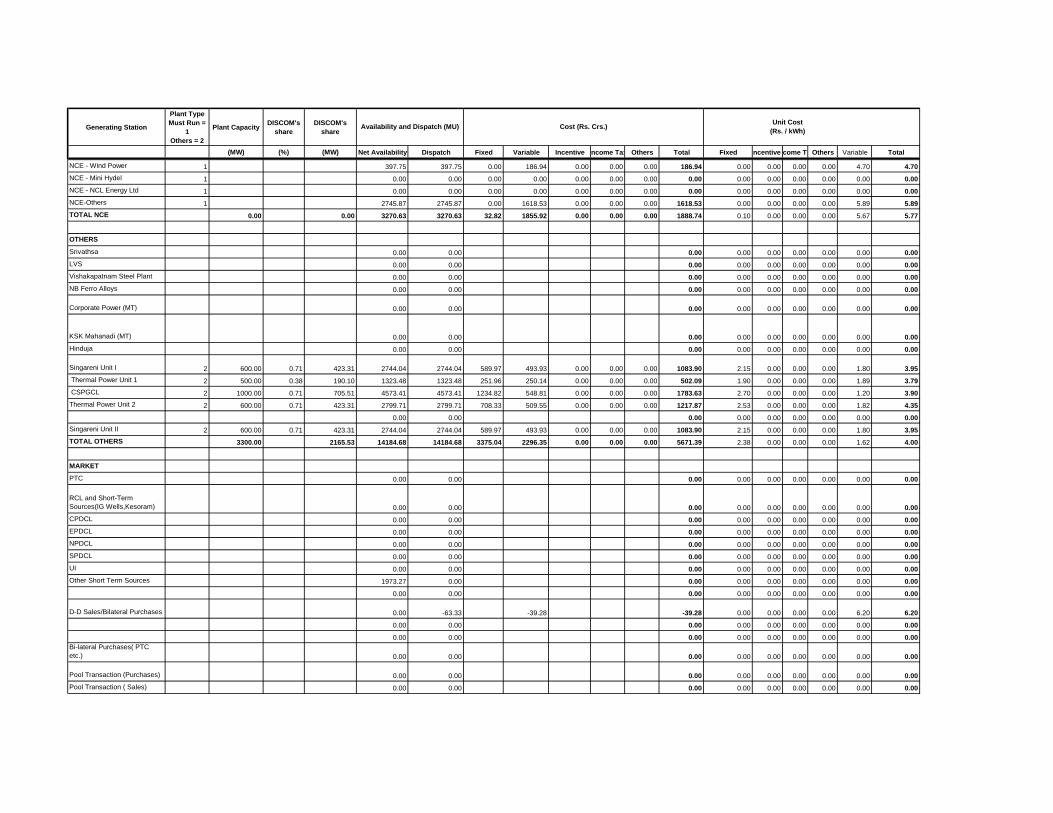
Generating Station
Plant Type
Must Run =
1
Others = 2
Plant CapacityDISCOM's
share
DISCOM's
share
(MW) (%) (MW) Net Availability Dispatch Fixed Variable Incentive Income Tax Others Total Fixed IncentivesIncome TaxOthers Variable Total
Availability and Dispatch (MU) Cost (Rs. Crs.)Unit Cost
(Rs. / kWh)
NCE - Wind Power 1 397.75 397.75 0.00 186.94 0.00 0.00 0.00 186.94 0.00 0.00 0.00 0.00 4.70 4.70
NCE - Mini Hydel 1 0.00 0.00 0.00 0.00 0.00 0.00 0.00 0.00 0.00 0.00 0.00 0.00 0.00 0.00
NCE - NCL Energy Ltd 1 0.00 0.00 0.00 0.00 0.00 0.00 0.00 0.00 0.00 0.00 0.00 0.00 0.00 0.00
NCE-Others 1 2745.87 2745.87 0.00 1618.53 0.00 0.00 0.00 1618.53 0.00 0.00 0.00 0.00 5.89 5.89
TOTAL NCE 0.00 0.00 3270.63 3270.63 32.82 1855.92 0.00 0.00 0.00 1888.74 0.10 0.00 0.00 0.00 5.67 5.77
OTHERS
Srivathsa 0.00 0.00 0.00 0.00 0.00 0.00 0.00 0.00 0.00
LVS 0.00 0.00 0.00 0.00 0.00 0.00 0.00 0.00 0.00
Vishakapatnam Steel Plant 0.00 0.00 0.00 0.00 0.00 0.00 0.00 0.00 0.00
NB Ferro Alloys 0.00 0.00 0.00 0.00 0.00 0.00 0.00 0.00 0.00
Corporate Power (MT) 0.00 0.00 0.00 0.00 0.00 0.00 0.00 0.00 0.00
KSK Mahanadi (MT) 0.00 0.00 0.00 0.00 0.00 0.00 0.00 0.00 0.00
Hinduja 0.00 0.00 0.00 0.00 0.00 0.00 0.00 0.00 0.00
Singareni Unit I 2 600.00 0.71 423.31 2744.04 2744.04 589.97 493.93 0.00 0.00 0.00 1083.90 2.15 0.00 0.00 0.00 1.80 3.95
Thermal Power Unit 1 2 500.00 0.38 190.10 1323.48 1323.48 251.96 250.14 0.00 0.00 0.00 502.09 1.90 0.00 0.00 0.00 1.89 3.79
CSPGCL 2 1000.00 0.71 705.51 4573.41 4573.41 1234.82 548.81 0.00 0.00 0.00 1783.63 2.70 0.00 0.00 0.00 1.20 3.90
Thermal Power Unit 2 2 600.00 0.71 423.31 2799.71 2799.71 708.33 509.55 0.00 0.00 0.00 1217.87 2.53 0.00 0.00 0.00 1.82 4.35
0.00 0.00 0.00 0.00 0.00 0.00 0.00 0.00 0.00
Singareni Unit II 2 600.00 0.71 423.31 2744.04 2744.04 589.97 493.93 0.00 0.00 0.00 1083.90 2.15 0.00 0.00 0.00 1.80 3.95
TOTAL OTHERS 3300.00 2165.53 14184.68 14184.68 3375.04 2296.35 0.00 0.00 0.00 5671.39 2.38 0.00 0.00 0.00 1.62 4.00
MARKET
PTC 0.00 0.00 0.00 0.00 0.00 0.00 0.00 0.00 0.00
RCL and Short-Term
Sources(IG Wells,Kesoram) 0.00 0.00 0.00 0.00 0.00 0.00 0.00 0.00 0.00
CPDCL 0.00 0.00 0.00 0.00 0.00 0.00 0.00 0.00 0.00
EPDCL 0.00 0.00 0.00 0.00 0.00 0.00 0.00 0.00 0.00
NPDCL 0.00 0.00 0.00 0.00 0.00 0.00 0.00 0.00 0.00
SPDCL 0.00 0.00 0.00 0.00 0.00 0.00 0.00 0.00 0.00
UI 0.00 0.00 0.00 0.00 0.00 0.00 0.00 0.00 0.00
Other Short Term Sources 1973.27 0.00 0.00 0.00 0.00 0.00 0.00 0.00 0.00
0.00 0.00 0.00 0.00 0.00 0.00 0.00 0.00 0.00
D-D Sales/Bilateral Purchases 0.00 -63.33 -39.28 -39.28 0.00 0.00 0.00 0.00 6.20 6.20
0.00 0.00 0.00 0.00 0.00 0.00 0.00 0.00 0.00
0.00 0.00 0.00 0.00 0.00 0.00 0.00 0.00 0.00
Bi-lateral Purchases( PTC
etc.) 0.00 0.00 0.00 0.00 0.00 0.00 0.00 0.00 0.00
Pool Transaction (Purchases) 0.00 0.00 0.00 0.00 0.00 0.00 0.00 0.00 0.00
Pool Transaction ( Sales) 0.00 0.00 0.00 0.00 0.00 0.00 0.00 0.00 0.00

Generating Station
Plant Type
Must Run =
1
Others = 2
Plant CapacityDISCOM's
share
DISCOM's
share
(MW) (%) (MW) Net Availability Dispatch Fixed Variable Incentive Income Tax Others Total Fixed IncentivesIncome TaxOthers Variable Total
Availability and Dispatch (MU) Cost (Rs. Crs.)Unit Cost
(Rs. / kWh)
0.00 0.00 0.00 0.00 0.00 0.00 0.00
TOTAL MARKET 0.00 0.00 1973.27 -63.33 0.00 -39.28 0.00 0.00 0.00 -39.28 0.00 0.00 0.00 0.00 6.20 6.20
TOTAL (From All Sources) 26182.70 7756.17 46482.84 38432.93 7784.33 9059.61 0.00 0.00 251.06 17095.00 2.03 0.00 0.00 0.07 2.36 4.45

Form 1.4(i)
NCE Generation (Base
Year)
Plant
Capacity
DISCOM'
s share
DISCOM's
share
(MW) (%) (MW) Net
Availability Dispatch Fixed Variable Incentive Inc. Tax Others Total Fixed
Incentive
s Inc. Tax Others Variable Total
Bio-Mass GAYATHRI AGRO Nalgonda 6.00 100.00 6.00 1.72 1.72 9.27 9.27 0.00 0.00 0.00 0.00 53.74 53.74
Bio-Mass SARO POWER Mahaboobnagar 6.00 100.00 6.00 15.84 15.84 19.50 19.50 0.00 0.00 0.00 0.00 12.30 12.30
Bio-Mass MY HOME POWER Paancheru, Medak 8.00 100.00 8.00 0.00 0.00 18.78 18.78 0.00 0.00 0.00 0.00 0.00 0.00
Bio-Mass SRI RAYALASEEMA G.EGY Kurnool 6.00 100.00 6.00 0.00 0.00 0.50 0.50 0.00 0.00 0.00 0.00 0.00 0.00
Bio-Mass SUCHAND POWERGEN Kurnool 6.00 100.00 6.00 0.00 0.00 7.17 7.17 0.00 0.00 0.00 0.00 0.00 0.00
Bio-Mass Surya Teja
Beechpally village,
Itikyala mandal,
Mahaboobnagar district 6.00 100.00 6.00 20.30 20.30 15.93 15.93 0.00 0.00 0.00 0.00 7.85 7.85
Bio-Mass Agri Gold Projects Limited
Dupadu village,
Thripurantakam mandal,
Prakasam district 2.00 100.00 0.00 0.00 0.00 0.00 0.00 0.00 0.00 0.00 0.00 0.00 0.00
Bio-Mass 0.00 0.00 0.00 0.00 0.00 0.00 0.00
TOTAL Bio-mass 40.00 38.00 37.87 37.87 0.00 71.14 0.00 0.00 0.00 71.14 0.00 0.00 0.00 0.00 18.79 18.79
Bagasse GANAPATHI SUGAR
Fasalwadi village,
Sangareddy mandal, Medak
district 15.00 100.00 15.00 26.95 26.95 8.42 8.42 0.00 0.00 0.00 0.00 3.12 3.12
Bagasse 0.00 0.00 0.00 0.00 0.00 0.00 0.00
Bagasse 0.00 0.00 0.00 0.00 0.00 0.00 0.00
TOTAL Bagasse 15.00 15.00 26.95 26.95 0.00 8.42 0.00 0.00 0.00 8.42 0.00 0.00 0.00 0.00 3.12 3.12
Municipal Waste to
Energy 0.00 0.00 0.00 0.00 0.00 0.00 0.00
Municipal Waste to
Energy 0.00 0.00 0.00 0.00 0.00 0.00 0.00
Municipal Waste to
Energy 0.00 0.00 0.00 0.00 0.00 0.00 0.00
TOTAL Municipal
Waste to Energy 0.00 0.00 0.00 0.00 0.00 0.00 0.00 0.00 0.00 0.00 0.00 0.00 0.00 0.00 0.00 0.00
Industrial Waste
based power project Shravana Power
Takkalapalli village,
Yacharam mandal, Ranga
Reddy district. 7.50 100.00 7.50 18.22 18.22 19.06 19.06 0.00 0.00 0.00 0.00 10.46 10.46
Industrial Waste
based power project SLT Power Limited
Pochampalli village &
Mandal, Nalgonda district 3.50 100.00 3.50 0.00 0.00 0.00 0.00 0.00 0.00 0.00 0.00 0.00 0.00
Industrial Waste
based power project 0.00 0.00 0.00 0.00 0.00 0.00 0.00
Industrial Waste
based power project 0.00 0.00 0.00 0.00 0.00 0.00 0.00
TOTAL Industrial
Waste 11.00 11.00 18.22 18.22 0.00 19.06 0.00 0.00 0.00 19.06 0.00 0.00 0.00 0.00 10.46 10.46
Wind Power Arts & Crafts ExportsKondameedipalli, Kurnool
district 0.80 100.00 0.80 1.45 1.45 0.50 0.50 0.00 0.00 0.00 0.00 3.48 3.48
Wind Power Canara Cement PipesKondameedipalli, Kurnool
district 0.80 100.00 0.80 1.40 1.40 0.49 0.49 0.00 0.00 0.00 0.00 3.47 3.47
Unit Cost
(Rs. / kWh)
Plant wise NCE Generation and Cost Details for Base Year. The total should be consistent with values provided in Form 1.4 under NCE.
TYPE Name Location
Availability and Dispatch
(MU) Cost (Rs. Crs.)
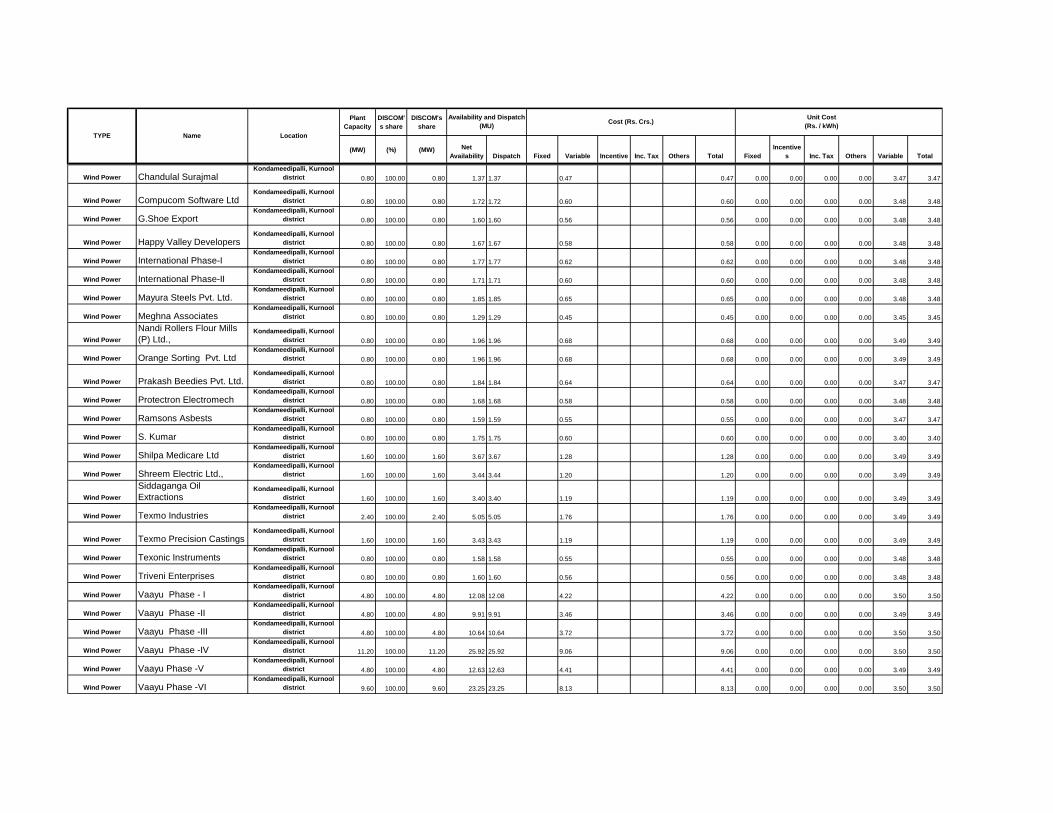
Plant
Capacity
DISCOM'
s share
DISCOM's
share
(MW) (%) (MW) Net
Availability Dispatch Fixed Variable Incentive Inc. Tax Others Total Fixed
Incentive
s Inc. Tax Others Variable Total
Unit Cost
(Rs. / kWh)
TYPE Name Location
Availability and Dispatch
(MU) Cost (Rs. Crs.)
Wind Power Chandulal SurajmalKondameedipalli, Kurnool
district 0.80 100.00 0.80 1.37 1.37 0.47 0.47 0.00 0.00 0.00 0.00 3.47 3.47
Wind Power Compucom Software LtdKondameedipalli, Kurnool
district 0.80 100.00 0.80 1.72 1.72 0.60 0.60 0.00 0.00 0.00 0.00 3.48 3.48
Wind Power G.Shoe ExportKondameedipalli, Kurnool
district 0.80 100.00 0.80 1.60 1.60 0.56 0.56 0.00 0.00 0.00 0.00 3.48 3.48
Wind Power Happy Valley DevelopersKondameedipalli, Kurnool
district 0.80 100.00 0.80 1.67 1.67 0.58 0.58 0.00 0.00 0.00 0.00 3.48 3.48
Wind Power International Phase-IKondameedipalli, Kurnool
district 0.80 100.00 0.80 1.77 1.77 0.62 0.62 0.00 0.00 0.00 0.00 3.48 3.48
Wind Power International Phase-IIKondameedipalli, Kurnool
district 0.80 100.00 0.80 1.71 1.71 0.60 0.60 0.00 0.00 0.00 0.00 3.48 3.48
Wind Power Mayura Steels Pvt. Ltd.Kondameedipalli, Kurnool
district 0.80 100.00 0.80 1.85 1.85 0.65 0.65 0.00 0.00 0.00 0.00 3.48 3.48
Wind Power Meghna AssociatesKondameedipalli, Kurnool
district 0.80 100.00 0.80 1.29 1.29 0.45 0.45 0.00 0.00 0.00 0.00 3.45 3.45
Wind Power
Nandi Rollers Flour Mills
(P) Ltd.,Kondameedipalli, Kurnool
district 0.80 100.00 0.80 1.96 1.96 0.68 0.68 0.00 0.00 0.00 0.00 3.49 3.49
Wind Power Orange Sorting Pvt. LtdKondameedipalli, Kurnool
district 0.80 100.00 0.80 1.96 1.96 0.68 0.68 0.00 0.00 0.00 0.00 3.49 3.49
Wind Power Prakash Beedies Pvt. Ltd.Kondameedipalli, Kurnool
district 0.80 100.00 0.80 1.84 1.84 0.64 0.64 0.00 0.00 0.00 0.00 3.47 3.47
Wind Power Protectron Electromech Kondameedipalli, Kurnool
district 0.80 100.00 0.80 1.68 1.68 0.58 0.58 0.00 0.00 0.00 0.00 3.48 3.48
Wind Power Ramsons AsbestsKondameedipalli, Kurnool
district 0.80 100.00 0.80 1.59 1.59 0.55 0.55 0.00 0.00 0.00 0.00 3.47 3.47
Wind Power S. KumarKondameedipalli, Kurnool
district 0.80 100.00 0.80 1.75 1.75 0.60 0.60 0.00 0.00 0.00 0.00 3.40 3.40
Wind Power Shilpa Medicare LtdKondameedipalli, Kurnool
district 1.60 100.00 1.60 3.67 3.67 1.28 1.28 0.00 0.00 0.00 0.00 3.49 3.49
Wind Power Shreem Electric Ltd.,Kondameedipalli, Kurnool
district 1.60 100.00 1.60 3.44 3.44 1.20 1.20 0.00 0.00 0.00 0.00 3.49 3.49
Wind Power
Siddaganga Oil
ExtractionsKondameedipalli, Kurnool
district 1.60 100.00 1.60 3.40 3.40 1.19 1.19 0.00 0.00 0.00 0.00 3.49 3.49
Wind Power Texmo IndustriesKondameedipalli, Kurnool
district 2.40 100.00 2.40 5.05 5.05 1.76 1.76 0.00 0.00 0.00 0.00 3.49 3.49
Wind Power Texmo Precision CastingsKondameedipalli, Kurnool
district 1.60 100.00 1.60 3.43 3.43 1.19 1.19 0.00 0.00 0.00 0.00 3.49 3.49
Wind Power Texonic InstrumentsKondameedipalli, Kurnool
district 0.80 100.00 0.80 1.58 1.58 0.55 0.55 0.00 0.00 0.00 0.00 3.48 3.48
Wind Power Triveni EnterprisesKondameedipalli, Kurnool
district 0.80 100.00 0.80 1.60 1.60 0.56 0.56 0.00 0.00 0.00 0.00 3.48 3.48
Wind Power Vaayu Phase - IKondameedipalli, Kurnool
district 4.80 100.00 4.80 12.08 12.08 4.22 4.22 0.00 0.00 0.00 0.00 3.50 3.50
Wind Power Vaayu Phase -IIKondameedipalli, Kurnool
district 4.80 100.00 4.80 9.91 9.91 3.46 3.46 0.00 0.00 0.00 0.00 3.49 3.49
Wind Power Vaayu Phase -IIIKondameedipalli, Kurnool
district 4.80 100.00 4.80 10.64 10.64 3.72 3.72 0.00 0.00 0.00 0.00 3.50 3.50
Wind Power Vaayu Phase -IVKondameedipalli, Kurnool
district 11.20 100.00 11.20 25.92 25.92 9.06 9.06 0.00 0.00 0.00 0.00 3.50 3.50
Wind Power Vaayu Phase -VKondameedipalli, Kurnool
district 4.80 100.00 4.80 12.63 12.63 4.41 4.41 0.00 0.00 0.00 0.00 3.49 3.49
Wind Power Vaayu Phase -VIKondameedipalli, Kurnool
district 9.60 100.00 9.60 23.25 23.25 8.13 8.13 0.00 0.00 0.00 0.00 3.50 3.50
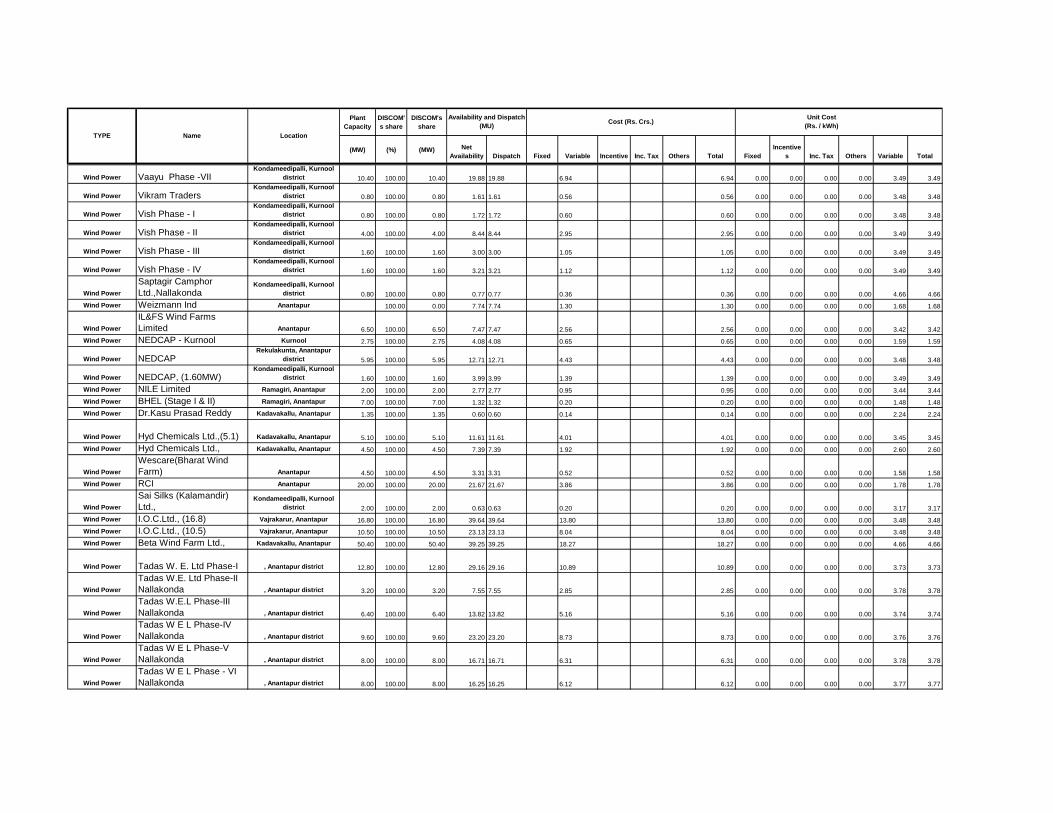
Plant
Capacity
DISCOM'
s share
DISCOM's
share
(MW) (%) (MW) Net
Availability Dispatch Fixed Variable Incentive Inc. Tax Others Total Fixed
Incentive
s Inc. Tax Others Variable Total
Unit Cost
(Rs. / kWh)
TYPE Name Location
Availability and Dispatch
(MU) Cost (Rs. Crs.)
Wind Power Vaayu Phase -VIIKondameedipalli, Kurnool
district 10.40 100.00 10.40 19.88 19.88 6.94 6.94 0.00 0.00 0.00 0.00 3.49 3.49
Wind Power Vikram TradersKondameedipalli, Kurnool
district 0.80 100.00 0.80 1.61 1.61 0.56 0.56 0.00 0.00 0.00 0.00 3.48 3.48
Wind Power Vish Phase - IKondameedipalli, Kurnool
district 0.80 100.00 0.80 1.72 1.72 0.60 0.60 0.00 0.00 0.00 0.00 3.48 3.48
Wind Power Vish Phase - IIKondameedipalli, Kurnool
district 4.00 100.00 4.00 8.44 8.44 2.95 2.95 0.00 0.00 0.00 0.00 3.49 3.49
Wind Power Vish Phase - IIIKondameedipalli, Kurnool
district 1.60 100.00 1.60 3.00 3.00 1.05 1.05 0.00 0.00 0.00 0.00 3.49 3.49
Wind Power Vish Phase - IVKondameedipalli, Kurnool
district 1.60 100.00 1.60 3.21 3.21 1.12 1.12 0.00 0.00 0.00 0.00 3.49 3.49
Wind Power
Saptagir Camphor
Ltd.,NallakondaKondameedipalli, Kurnool
district 0.80 100.00 0.80 0.77 0.77 0.36 0.36 0.00 0.00 0.00 0.00 4.66 4.66
Wind Power Weizmann Ind Anantapur 100.00 0.00 7.74 7.74 1.30 1.30 0.00 0.00 0.00 0.00 1.68 1.68
Wind Power
IL&FS Wind Farms
Limited Anantapur 6.50 100.00 6.50 7.47 7.47 2.56 2.56 0.00 0.00 0.00 0.00 3.42 3.42
Wind Power NEDCAP - Kurnool Kurnool 2.75 100.00 2.75 4.08 4.08 0.65 0.65 0.00 0.00 0.00 0.00 1.59 1.59
Wind Power NEDCAPRekulakunta, Anantapur
district 5.95 100.00 5.95 12.71 12.71 4.43 4.43 0.00 0.00 0.00 0.00 3.48 3.48
Wind Power NEDCAP, (1.60MW)Kondameedipalli, Kurnool
district 1.60 100.00 1.60 3.99 3.99 1.39 1.39 0.00 0.00 0.00 0.00 3.49 3.49
Wind Power NILE Limited Ramagiri, Anantapur 2.00 100.00 2.00 2.77 2.77 0.95 0.95 0.00 0.00 0.00 0.00 3.44 3.44
Wind Power BHEL (Stage I & II) Ramagiri, Anantapur 7.00 100.00 7.00 1.32 1.32 0.20 0.20 0.00 0.00 0.00 0.00 1.48 1.48
Wind Power Dr.Kasu Prasad Reddy Kadavakallu, Anantapur 1.35 100.00 1.35 0.60 0.60 0.14 0.14 0.00 0.00 0.00 0.00 2.24 2.24
Wind Power Hyd Chemicals Ltd.,(5.1) Kadavakallu, Anantapur 5.10 100.00 5.10 11.61 11.61 4.01 4.01 0.00 0.00 0.00 0.00 3.45 3.45
Wind Power Hyd Chemicals Ltd., Kadavakallu, Anantapur 4.50 100.00 4.50 7.39 7.39 1.92 1.92 0.00 0.00 0.00 0.00 2.60 2.60
Wind Power
Wescare(Bharat Wind
Farm) Anantapur 4.50 100.00 4.50 3.31 3.31 0.52 0.52 0.00 0.00 0.00 0.00 1.58 1.58
Wind Power RCI Anantapur 20.00 100.00 20.00 21.67 21.67 3.86 3.86 0.00 0.00 0.00 0.00 1.78 1.78
Wind Power
Sai Silks (Kalamandir)
Ltd.,Kondameedipalli, Kurnool
district 2.00 100.00 2.00 0.63 0.63 0.20 0.20 0.00 0.00 0.00 0.00 3.17 3.17
Wind Power I.O.C.Ltd., (16.8) Vajrakarur, Anantapur 16.80 100.00 16.80 39.64 39.64 13.80 13.80 0.00 0.00 0.00 0.00 3.48 3.48
Wind Power I.O.C.Ltd., (10.5) Vajrakarur, Anantapur 10.50 100.00 10.50 23.13 23.13 8.04 8.04 0.00 0.00 0.00 0.00 3.48 3.48
Wind Power Beta Wind Farm Ltd., Kadavakallu, Anantapur 50.40 100.00 50.40 39.25 39.25 18.27 18.27 0.00 0.00 0.00 0.00 4.66 4.66
Wind Power Tadas W. E. Ltd Phase-I , Anantapur district 12.80 100.00 12.80 29.16 29.16 10.89 10.89 0.00 0.00 0.00 0.00 3.73 3.73
Wind Power
Tadas W.E. Ltd Phase-II
Nallakonda , Anantapur district 3.20 100.00 3.20 7.55 7.55 2.85 2.85 0.00 0.00 0.00 0.00 3.78 3.78
Wind Power
Tadas W.E.L Phase-III
Nallakonda , Anantapur district 6.40 100.00 6.40 13.82 13.82 5.16 5.16 0.00 0.00 0.00 0.00 3.74 3.74
Wind Power
Tadas W E L Phase-IV
Nallakonda , Anantapur district 9.60 100.00 9.60 23.20 23.20 8.73 8.73 0.00 0.00 0.00 0.00 3.76 3.76
Wind Power
Tadas W E L Phase-V
Nallakonda , Anantapur district 8.00 100.00 8.00 16.71 16.71 6.31 6.31 0.00 0.00 0.00 0.00 3.78 3.78
Wind Power
Tadas W E L Phase - VI
Nallakonda , Anantapur district 8.00 100.00 8.00 16.25 16.25 6.12 6.12 0.00 0.00 0.00 0.00 3.77 3.77
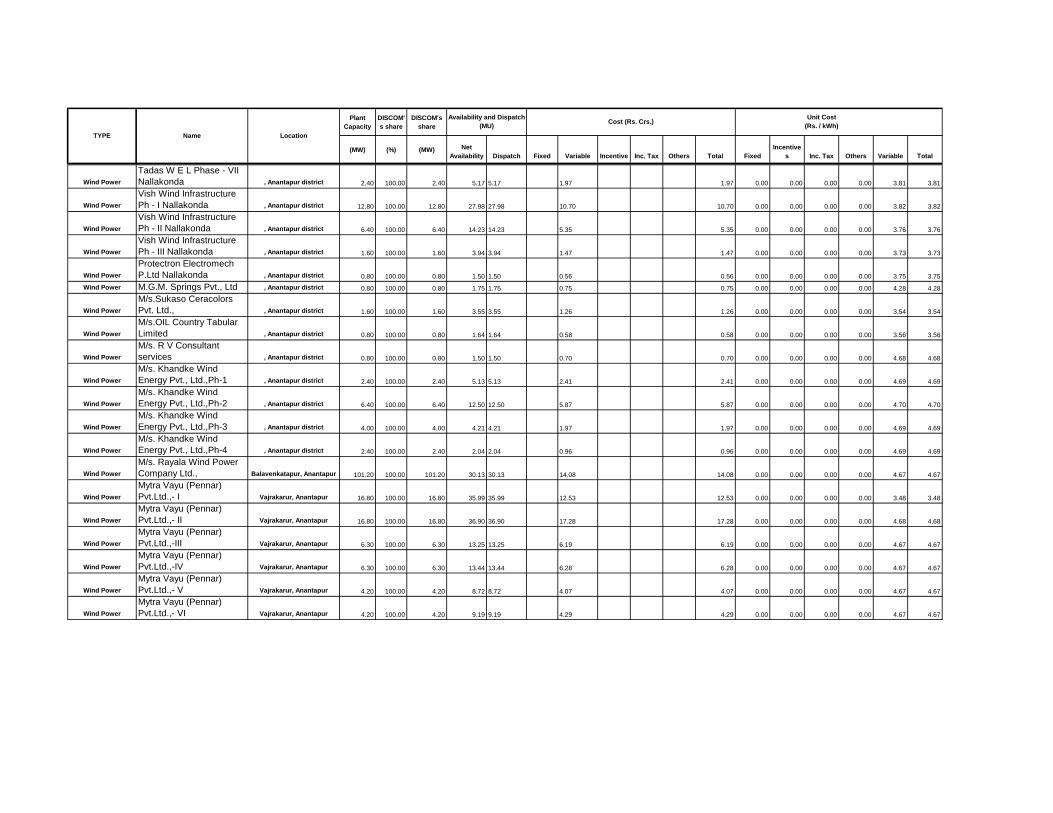
Plant
Capacity
DISCOM'
s share
DISCOM's
share
(MW) (%) (MW) Net
Availability Dispatch Fixed Variable Incentive Inc. Tax Others Total Fixed
Incentive
s Inc. Tax Others Variable Total
Unit Cost
(Rs. / kWh)
TYPE Name Location
Availability and Dispatch
(MU) Cost (Rs. Crs.)
Wind Power
Tadas W E L Phase - VII
Nallakonda , Anantapur district 2.40 100.00 2.40 5.17 5.17 1.97 1.97 0.00 0.00 0.00 0.00 3.81 3.81
Wind Power
Vish Wind Infrastructure
Ph - I Nallakonda , Anantapur district 12.80 100.00 12.80 27.98 27.98 10.70 10.70 0.00 0.00 0.00 0.00 3.82 3.82
Wind Power
Vish Wind Infrastructure
Ph - II Nallakonda , Anantapur district 6.40 100.00 6.40 14.23 14.23 5.35 5.35 0.00 0.00 0.00 0.00 3.76 3.76
Wind Power
Vish Wind Infrastructure
Ph - III Nallakonda , Anantapur district 1.60 100.00 1.60 3.94 3.94 1.47 1.47 0.00 0.00 0.00 0.00 3.73 3.73
Wind Power
Protectron Electromech
P.Ltd Nallakonda , Anantapur district 0.80 100.00 0.80 1.50 1.50 0.56 0.56 0.00 0.00 0.00 0.00 3.75 3.75
Wind Power M.G.M. Springs Pvt., Ltd , Anantapur district 0.80 100.00 0.80 1.75 1.75 0.75 0.75 0.00 0.00 0.00 0.00 4.28 4.28
Wind Power
M/s.Sukaso Ceracolors
Pvt. Ltd., , Anantapur district 1.60 100.00 1.60 3.55 3.55 1.26 1.26 0.00 0.00 0.00 0.00 3.54 3.54
Wind Power
M/s.OIL Country Tabular
Limited , Anantapur district 0.80 100.00 0.80 1.64 1.64 0.58 0.58 0.00 0.00 0.00 0.00 3.56 3.56
Wind Power
M/s. R V Consultant
services , Anantapur district 0.80 100.00 0.80 1.50 1.50 0.70 0.70 0.00 0.00 0.00 0.00 4.68 4.68
Wind Power
M/s. Khandke Wind
Energy Pvt., Ltd.,Ph-1 , Anantapur district 2.40 100.00 2.40 5.13 5.13 2.41 2.41 0.00 0.00 0.00 0.00 4.69 4.69
Wind Power
M/s. Khandke Wind
Energy Pvt., Ltd.,Ph-2 , Anantapur district 6.40 100.00 6.40 12.50 12.50 5.87 5.87 0.00 0.00 0.00 0.00 4.70 4.70
Wind Power
M/s. Khandke Wind
Energy Pvt., Ltd.,Ph-3 , Anantapur district 4.00 100.00 4.00 4.21 4.21 1.97 1.97 0.00 0.00 0.00 0.00 4.69 4.69
Wind Power
M/s. Khandke Wind
Energy Pvt., Ltd.,Ph-4 , Anantapur district 2.40 100.00 2.40 2.04 2.04 0.96 0.96 0.00 0.00 0.00 0.00 4.69 4.69
Wind Power
M/s. Rayala Wind Power
Company Ltd., Balavenkatapur, Anantapur 101.20 100.00 101.20 30.13 30.13 14.08 14.08 0.00 0.00 0.00 0.00 4.67 4.67
Wind Power
Mytra Vayu (Pennar)
Pvt.Ltd.,- I Vajrakarur, Anantapur 16.80 100.00 16.80 35.99 35.99 12.53 12.53 0.00 0.00 0.00 0.00 3.48 3.48
Wind Power
Mytra Vayu (Pennar)
Pvt.Ltd.,- II Vajrakarur, Anantapur 16.80 100.00 16.80 36.90 36.90 17.28 17.28 0.00 0.00 0.00 0.00 4.68 4.68
Wind Power
Mytra Vayu (Pennar)
Pvt.Ltd.,-III Vajrakarur, Anantapur 6.30 100.00 6.30 13.25 13.25 6.19 6.19 0.00 0.00 0.00 0.00 4.67 4.67
Wind Power
Mytra Vayu (Pennar)
Pvt.Ltd.,-IV Vajrakarur, Anantapur 6.30 100.00 6.30 13.44 13.44 6.28 6.28 0.00 0.00 0.00 0.00 4.67 4.67
Wind Power
Mytra Vayu (Pennar)
Pvt.Ltd.,- V Vajrakarur, Anantapur 4.20 100.00 4.20 8.72 8.72 4.07 4.07 0.00 0.00 0.00 0.00 4.67 4.67
Wind Power
Mytra Vayu (Pennar)
Pvt.Ltd.,- VI Vajrakarur, Anantapur 4.20 100.00 4.20 9.19 9.19 4.29 4.29 0.00 0.00 0.00 0.00 4.67 4.67
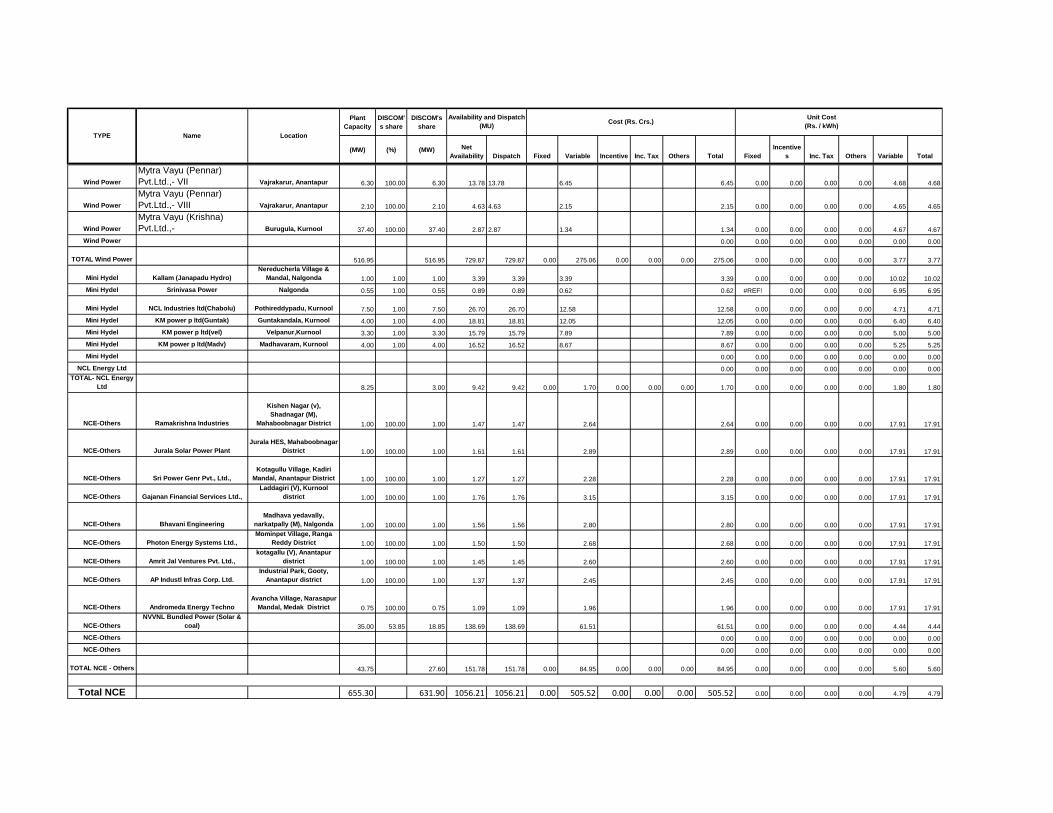
Plant
Capacity
DISCOM'
s share
DISCOM's
share
(MW) (%) (MW) Net
Availability Dispatch Fixed Variable Incentive Inc. Tax Others Total Fixed
Incentive
s Inc. Tax Others Variable Total
Unit Cost
(Rs. / kWh)
TYPE Name Location
Availability and Dispatch
(MU) Cost (Rs. Crs.)
Wind Power
Mytra Vayu (Pennar)
Pvt.Ltd.,- VII Vajrakarur, Anantapur 6.30 100.00 6.30 13.78 13.78 6.45 6.45 0.00 0.00 0.00 0.00 4.68 4.68
Wind Power
Mytra Vayu (Pennar)
Pvt.Ltd.,- VIII Vajrakarur, Anantapur 2.10 100.00 2.10 4.63 4.63 2.15 2.15 0.00 0.00 0.00 0.00 4.65 4.65
Wind Power
Mytra Vayu (Krishna)
Pvt.Ltd.,- Burugula, Kurnool 37.40 100.00 37.40 2.87 2.87 1.34 1.34 0.00 0.00 0.00 0.00 4.67 4.67
Wind Power 0.00 0.00 0.00 0.00 0.00 0.00 0.00
TOTAL Wind Power 516.95 516.95 729.87 729.87 0.00 275.06 0.00 0.00 0.00 275.06 0.00 0.00 0.00 0.00 3.77 3.77
Mini Hydel Kallam (Janapadu Hydro)
Nereducherla Village &
Mandal, Nalgonda 1.00 1.00 1.00 3.39 3.39 3.39 3.39 0.00 0.00 0.00 0.00 10.02 10.02
Mini Hydel Srinivasa Power Nalgonda 0.55 1.00 0.55 0.89 0.89 0.62 0.62 #REF! 0.00 0.00 0.00 6.95 6.95
Mini Hydel NCL Industries ltd(Chabolu) Pothireddypadu, Kurnool 7.50 1.00 7.50 26.70 26.70 12.58 12.58 0.00 0.00 0.00 0.00 4.71 4.71
Mini Hydel KM power p ltd(Guntak) Guntakandala, Kurnool 4.00 1.00 4.00 18.81 18.81 12.05 12.05 0.00 0.00 0.00 0.00 6.40 6.40
Mini Hydel KM power p ltd(vel) Velpanur,Kurnool 3.30 1.00 3.30 15.79 15.79 7.89 7.89 0.00 0.00 0.00 0.00 5.00 5.00
Mini Hydel KM power p ltd(Madv) Madhavaram, Kurnool 4.00 1.00 4.00 16.52 16.52 8.67 8.67 0.00 0.00 0.00 0.00 5.25 5.25
Mini Hydel 0.00 0.00 0.00 0.00 0.00 0.00 0.00
NCL Energy Ltd 0.00 0.00 0.00 0.00 0.00 0.00 0.00
TOTAL- NCL Energy
Ltd 8.25 3.00 9.42 9.42 0.00 1.70 0.00 0.00 0.00 1.70 0.00 0.00 0.00 0.00 1.80 1.80
NCE-Others Ramakrishna Industries
Kishen Nagar (v),
Shadnagar (M),
Mahaboobnagar District 1.00 100.00 1.00 1.47 1.47 2.64 2.64 0.00 0.00 0.00 0.00 17.91 17.91
NCE-Others Jurala Solar Power Plant
Jurala HES, Mahaboobnagar
District 1.00 100.00 1.00 1.61 1.61 2.89 2.89 0.00 0.00 0.00 0.00 17.91 17.91
NCE-Others Sri Power Genr Pvt., Ltd.,
Kotagullu Village, Kadiri
Mandal, Anantapur District 1.00 100.00 1.00 1.27 1.27 2.28 2.28 0.00 0.00 0.00 0.00 17.91 17.91
NCE-Others Gajanan Financial Services Ltd.,
Laddagiri (V), Kurnool
district 1.00 100.00 1.00 1.76 1.76 3.15 3.15 0.00 0.00 0.00 0.00 17.91 17.91
NCE-Others Bhavani Engineering
Madhava yedavally,
narkatpally (M), Nalgonda 1.00 100.00 1.00 1.56 1.56 2.80 2.80 0.00 0.00 0.00 0.00 17.91 17.91
NCE-Others Photon Energy Systems Ltd.,
Mominpet Village, Ranga
Reddy District 1.00 100.00 1.00 1.50 1.50 2.68 2.68 0.00 0.00 0.00 0.00 17.91 17.91
NCE-Others Amrit Jal Ventures Pvt. Ltd.,
kotagallu (V), Anantapur
district 1.00 100.00 1.00 1.45 1.45 2.60 2.60 0.00 0.00 0.00 0.00 17.91 17.91
NCE-Others AP Industl Infras Corp. Ltd.
Industrial Park, Gooty,
Anantapur district 1.00 100.00 1.00 1.37 1.37 2.45 2.45 0.00 0.00 0.00 0.00 17.91 17.91
NCE-Others Andromeda Energy Techno
Avancha Village, Narasapur
Mandal, Medak District 0.75 100.00 0.75 1.09 1.09 1.96 1.96 0.00 0.00 0.00 0.00 17.91 17.91
NCE-Others
NVVNL Bundled Power (Solar &
coal) 35.00 53.85 18.85 138.69 138.69 61.51 61.51 0.00 0.00 0.00 0.00 4.44 4.44
NCE-Others 0.00 0.00 0.00 0.00 0.00 0.00 0.00
NCE-Others 0.00 0.00 0.00 0.00 0.00 0.00 0.00
TOTAL NCE - Others 43.75 27.60 151.78 151.78 0.00 84.95 0.00 0.00 0.00 84.95 0.00 0.00 0.00 0.00 5.60 5.60
Total NCE 655.30 631.90 1056.21 1056.21 0.00 505.52 0.00 0.00 0.00 505.52 0.00 0.00 0.00 0.00 4.79 4.79
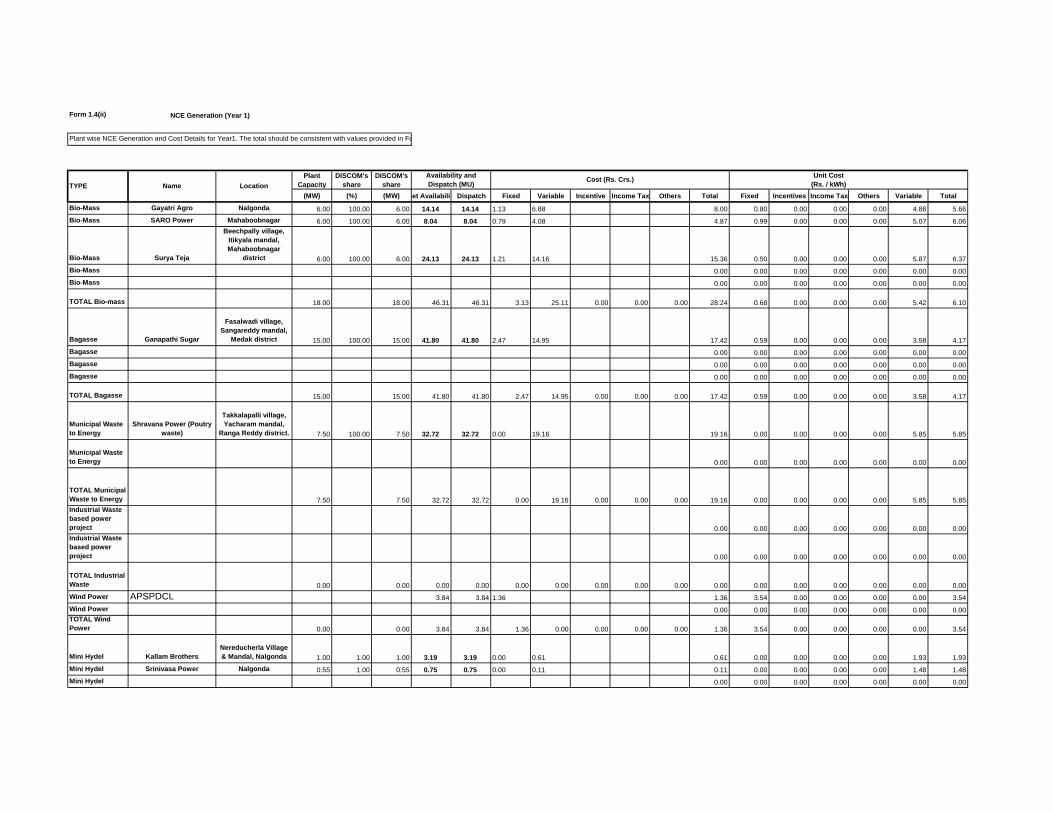
Form 1.4(ii)
Plant
Capacity
DISCOM's
share
DISCOM's
share
(MW) (%) (MW) Net AvailabilityDispatch Fixed Variable Incentive Income Tax Others Total Fixed Incentives Income Tax Others Variable Total
Bio-Mass Gayatri Agro Nalgonda 6.00 100.00 6.00 14.14 14.14 1.13 6.88 8.00 0.80 0.00 0.00 0.00 4.86 5.66
Bio-Mass SARO Power Mahaboobnagar 6.00 100.00 6.00 8.04 8.04 0.79 4.08 4.87 0.99 0.00 0.00 0.00 5.07 6.06
Bio-Mass Surya Teja
Beechpally village,
Itikyala mandal,
Mahaboobnagar
district 6.00 100.00 6.00 24.13 24.13 1.21 14.16 15.36 0.50 0.00 0.00 0.00 5.87 6.37
Bio-Mass 0.00 0.00 0.00 0.00 0.00 0.00 0.00
Bio-Mass 0.00 0.00 0.00 0.00 0.00 0.00 0.00
TOTAL Bio-mass 18.00 18.00 46.31 46.31 3.13 25.11 0.00 0.00 0.00 28.24 0.68 0.00 0.00 0.00 5.42 6.10
Bagasse Ganapathi Sugar
Fasalwadi village,
Sangareddy mandal,
Medak district 15.00 100.00 15.00 41.80 41.80 2.47 14.95 17.42 0.59 0.00 0.00 0.00 3.58 4.17
Bagasse 0.00 0.00 0.00 0.00 0.00 0.00 0.00
Bagasse 0.00 0.00 0.00 0.00 0.00 0.00 0.00
Bagasse 0.00 0.00 0.00 0.00 0.00 0.00 0.00
TOTAL Bagasse 15.00 15.00 41.80 41.80 2.47 14.95 0.00 0.00 0.00 17.42 0.59 0.00 0.00 0.00 3.58 4.17
Municipal Waste
to Energy
Shravana Power (Poutry
waste)
Takkalapalli village,
Yacharam mandal,
Ranga Reddy district. 7.50 100.00 7.50 32.72 32.72 0.00 19.16 19.16 0.00 0.00 0.00 0.00 5.85 5.85
Municipal Waste
to Energy 0.00 0.00 0.00 0.00 0.00 0.00 0.00
TOTAL Municipal
Waste to Energy 7.50 7.50 32.72 32.72 0.00 19.16 0.00 0.00 0.00 19.16 0.00 0.00 0.00 0.00 5.85 5.85
Industrial Waste
based power
project 0.00 0.00 0.00 0.00 0.00 0.00 0.00
Industrial Waste
based power
project 0.00 0.00 0.00 0.00 0.00 0.00 0.00
TOTAL Industrial
Waste 0.00 0.00 0.00 0.00 0.00 0.00 0.00 0.00 0.00 0.00 0.00 0.00 0.00 0.00 0.00 0.00
Wind Power APSPDCL 3.84 3.84 1.36 1.36 3.54 0.00 0.00 0.00 0.00 3.54
Wind Power 0.00 0.00 0.00 0.00 0.00 0.00 0.00
TOTAL Wind
Power 0.00 0.00 3.84 3.84 1.36 0.00 0.00 0.00 0.00 1.36 3.54 0.00 0.00 0.00 0.00 3.54
Mini Hydel Kallam Brothers
Nereducherla Village
& Mandal, Nalgonda 1.00 1.00 1.00 3.19 3.19 0.00 0.61 0.61 0.00 0.00 0.00 0.00 1.93 1.93
Mini Hydel Srinivasa Power Nalgonda 0.55 1.00 0.55 0.75 0.75 0.00 0.11 0.11 0.00 0.00 0.00 0.00 1.48 1.48
Mini Hydel 0.00 0.00 0.00 0.00 0.00 0.00 0.00
Unit Cost
(Rs. / kWh)
NCE Generation (Year 1)
Plant wise NCE Generation and Cost Details for Year1. The total should be consistent with values provided in Form 1.4 under NCE.
TYPE Name Location
Availability and
Dispatch (MU) Cost (Rs. Crs.)
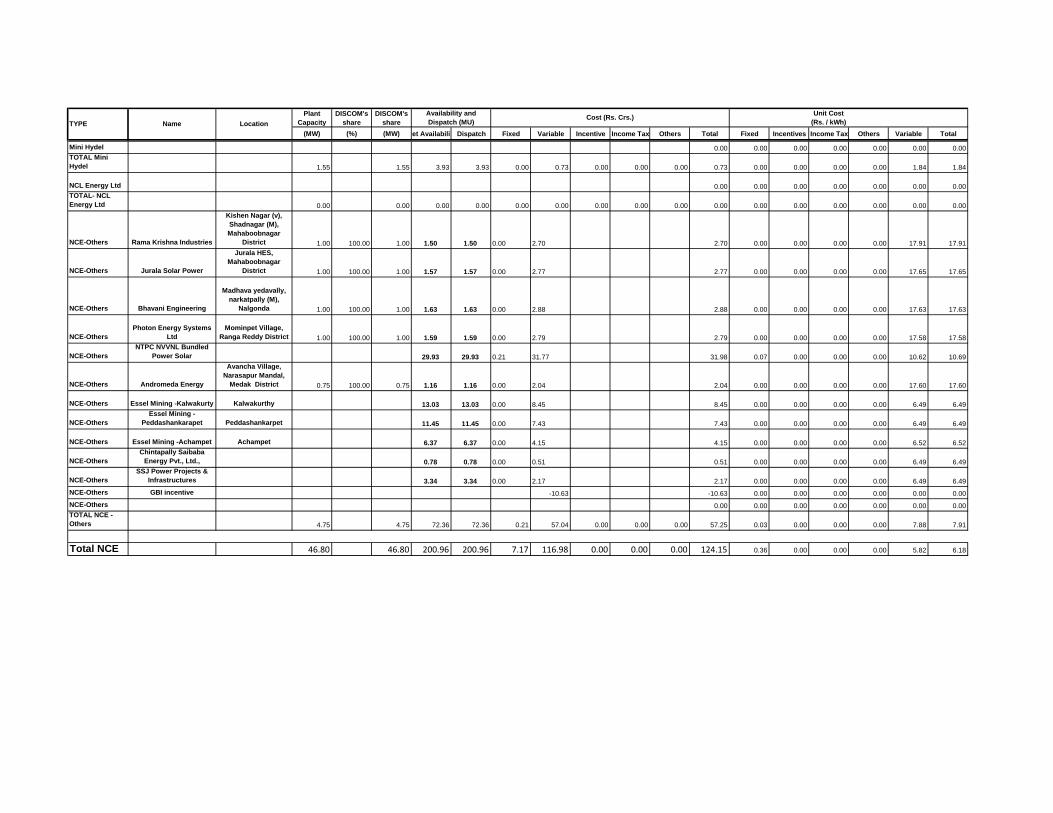
Plant
Capacity
DISCOM's
share
DISCOM's
share
(MW) (%) (MW) Net AvailabilityDispatch Fixed Variable Incentive Income Tax Others Total Fixed Incentives Income Tax Others Variable Total
Unit Cost
(Rs. / kWh)TYPE Name Location
Availability and
Dispatch (MU) Cost (Rs. Crs.)
Mini Hydel 0.00 0.00 0.00 0.00 0.00 0.00 0.00
TOTAL Mini
Hydel 1.55 1.55 3.93 3.93 0.00 0.73 0.00 0.00 0.00 0.73 0.00 0.00 0.00 0.00 1.84 1.84
NCL Energy Ltd 0.00 0.00 0.00 0.00 0.00 0.00 0.00
TOTAL- NCL
Energy Ltd 0.00 0.00 0.00 0.00 0.00 0.00 0.00 0.00 0.00 0.00 0.00 0.00 0.00 0.00 0.00 0.00
NCE-Others Rama Krishna Industries
Kishen Nagar (v),
Shadnagar (M),
Mahaboobnagar
District 1.00 100.00 1.00 1.50 1.50 0.00 2.70 2.70 0.00 0.00 0.00 0.00 17.91 17.91
NCE-Others Jurala Solar Power
Jurala HES,
Mahaboobnagar
District 1.00 100.00 1.00 1.57 1.57 0.00 2.77 2.77 0.00 0.00 0.00 0.00 17.65 17.65
NCE-Others Bhavani Engineering
Madhava yedavally,
narkatpally (M),
Nalgonda 1.00 100.00 1.00 1.63 1.63 0.00 2.88 2.88 0.00 0.00 0.00 0.00 17.63 17.63
NCE-Others
Photon Energy Systems
Ltd
Mominpet Village,
Ranga Reddy District 1.00 100.00 1.00 1.59 1.59 0.00 2.79 2.79 0.00 0.00 0.00 0.00 17.58 17.58
NCE-Others
NTPC NVVNL Bundled
Power Solar 29.93 29.93 0.21 31.77 31.98 0.07 0.00 0.00 0.00 10.62 10.69
NCE-Others Andromeda Energy
Avancha Village,
Narasapur Mandal,
Medak District 0.75 100.00 0.75 1.16 1.16 0.00 2.04 2.04 0.00 0.00 0.00 0.00 17.60 17.60
NCE-Others Essel Mining -Kalwakurty Kalwakurthy 13.03 13.03 0.00 8.45 8.45 0.00 0.00 0.00 0.00 6.49 6.49
NCE-Others
Essel Mining -
Peddashankarapet Peddashankarpet 11.45 11.45 0.00 7.43 7.43 0.00 0.00 0.00 0.00 6.49 6.49
NCE-Others Essel Mining -Achampet Achampet 6.37 6.37 0.00 4.15 4.15 0.00 0.00 0.00 0.00 6.52 6.52
NCE-Others
Chintapally Saibaba
Energy Pvt., Ltd., 0.78 0.78 0.00 0.51 0.51 0.00 0.00 0.00 0.00 6.49 6.49
NCE-Others
SSJ Power Projects &
Infrastructures 3.34 3.34 0.00 2.17 2.17 0.00 0.00 0.00 0.00 6.49 6.49
NCE-Others GBI incentive -10.63 -10.63 0.00 0.00 0.00 0.00 0.00 0.00
NCE-Others 0.00 0.00 0.00 0.00 0.00 0.00 0.00
TOTAL NCE -
Others 4.75 4.75 72.36 72.36 0.21 57.04 0.00 0.00 0.00 57.25 0.03 0.00 0.00 0.00 7.88 7.91
Total NCE 46.80 46.80 200.96 200.96 7.17 116.98 0.00 0.00 0.00 124.15 0.36 0.00 0.00 0.00 5.82 6.18

Form 1.4(iii)
NCE Generation (Year
2)
Plant
Capacity
DISCOM'
s share
DISCOM's
share
(MW) (%) (MW) Net
Availability Dispatch Fixed Variable Incentive Inc. Tax Others Total Fixed
Incentiv
es Inc. Tax Others
Variabl
e Total
Bio-Mass Gayatri Agro Nalgonda 6.00 100.00 6.00 6.44 6.44 4.34 4.34 6.75 0.00 0.00 0.00 0.00 6.75
Bio-Mass Saro Power Mahabubnagar 6.00 100.00 6.00 1.70 1.70 1.08 1.08 6.34 0.00 0.00 0.00 0.00 6.34
Bio-Mass Surya Teja
Bichapally in
Mahabubnagar 6.00 100.00 6.00 32.47 32.47 22.76 22.76 7.01 0.00 0.00 0.00 0.00 7.01
Bio-Mass My Home Industries NCE Patancheru in Medak 10.00 100.00 10.00 0.02 0.02 0.00 0.00 0.00 0.00 0.00 0.00
Bio-Mass Bio Mass Subsidy -5.75 -5.75 0.00 0.00 0.00 0.00 0.00 0.00
Bio-Mass 0.00 0.00 0.00 0.00 0.00 0.00 0.00
TOTAL Bio-mass 28.00 28.00 40.61 40.61 28.20 0.00 0.00 0.00 -5.75 22.45 6.94 0.00 0.00 -1.42 0.00 5.53
Bagasse Ganapathi sugars
Fasalwadi village,
Sangareddy mandal,
Medak district 15.00 100.00 15.00 25.15 25.15 10.22 10.22 4.06 0.00 0.00 0.00 0.00 4.06
Bagasse 0.00 0.00 0.00 0.00 0.00 0.00 0.00
TOTAL Bagasse 15.00 15.00 25.15 25.15 10.22 0.00 0.00 0.00 0.00 10.22 4.06 0.00 0.00 0.00 0.00 4.06
Municipal Waste to Energy 0.00 0.00 0.00 0.00 0.00 0.00 0.00
Municipal Waste to Energy 0.00 0.00 0.00 0.00 0.00 0.00 0.00
TOTAL Municipal Waste to Energy 0.00 0.00 0.00 0.00 0.00 0.00 0.00 0.00 0.00 0.00 0.00 0.00 0.00 0.00 0.00 0.00
Industrial Waste based power
project shravana power
Takkalapalli (V),
Yacharam(M), Ranga
Reddy district 7.50 100.00 7.50 38.18 38.18 23.96 23.96 6.28 0.00 0.00 0.00 0.00 6.28
Industrial Waste based power
project 0.00 0.00 0.00 0.00 0.00 0.00 0.00
Industrial Waste based power
project 0.00 0.00 0.00 0.00 0.00 0.00 0.00
TOTAL Industrial Waste 7.50 7.50 38.18 38.18 23.96 0.00 0.00 0.00 0.00 23.96 6.28 0.00 0.00 0.00 0.00 6.28
Wind Power 0.00 0.00 0.00 0.00 0.00 0.00 0.00
Wind Power 0.00 0.00 0.00 0.00 0.00 0.00 0.00
Wind Power 0.00 0.00 0.00 0.00 0.00 0.00 0.00
TOTAL Wind Power 0.00 0.00 0.00 0.00 0.00 0.00 0.00 0.00 0.00 0.00 0.00 0.00 0.00 0.00 0.00 0.00
Mini Hydel 0.00 0.00 0.00 0.00 0.00 0.00 0.00
Mini Hydel Kallam Brothers
Nelakondapally,
Khammam 4.00 100.00 4.00 0.08 0.08 0.02 0.02 #REF! 0.00 0.00 0.00 0.00 2.15
Mini Hydel Srinivas Power (P) Ltd.,
132/33 KV Miryalaguda
SS, Nalgonda 0.55 100.00 0.55 0.03 0.03 0.01 0.01 2.22 0.00 0.00 0.00 0.00 2.22
Mini Hydel 0.00 0.00 0.00 0.00 0.00 0.00 0.00
Mini Hydel 0.00 0.00 0.00 0.00 0.00 0.00 0.00
Mini Hydel 0.00 0.00 0.00 0.00 0.00 0.00 0.00
TOTAL Mini Hydel 4.55 4.55 0.11 0.11 0.02 0.00 0.00 0.00 0.00 0.02 2.17 0.00 0.00 0.00 0.00 2.17
NCL Energy Ltd 0.00 0.00 0.00 0.00 0.00 0.00 0.00
NCL Energy Ltd 0.00 0.00 0.00 0.00 0.00 0.00 0.00
Unit Cost
(Rs. / kWh)
Plant wise NCE Generation and Cost Details for Base Year. The total should be consistent with values provided in Form 1.4 under NCE.
TYPE Name Location
Availability and Dispatch
(MU) Cost (Rs. Crs.)
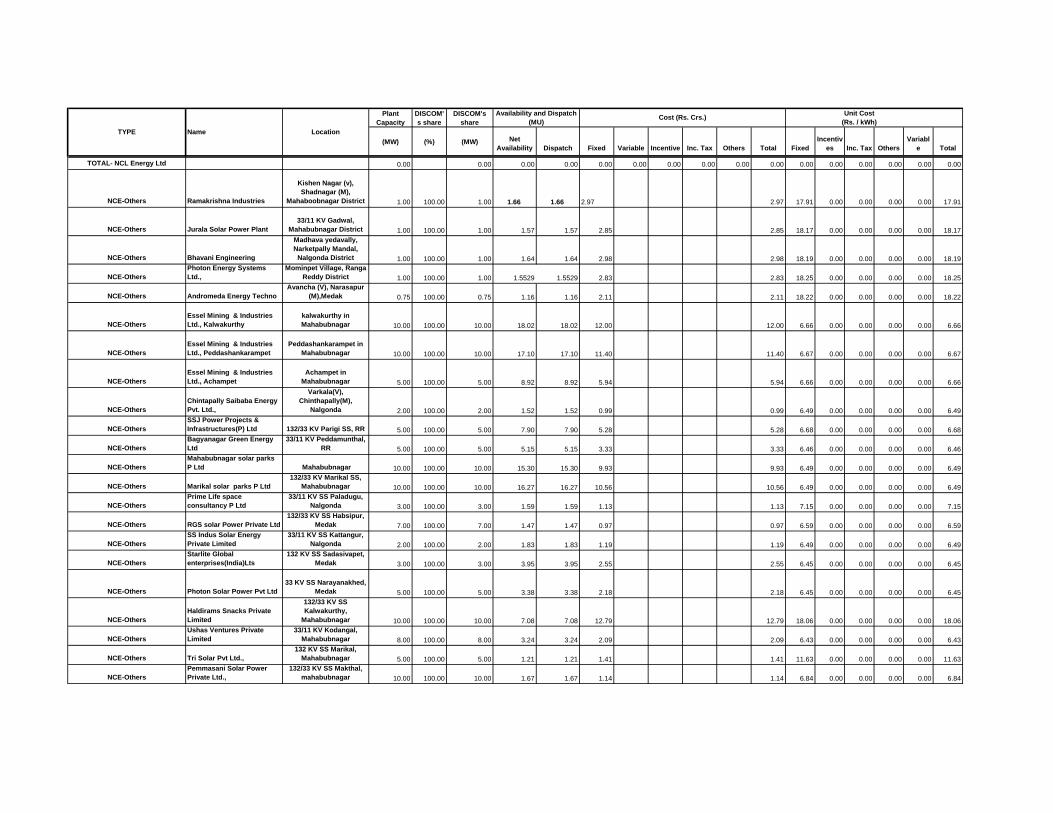
Plant
Capacity
DISCOM'
s share
DISCOM's
share
(MW) (%) (MW) Net
Availability Dispatch Fixed Variable Incentive Inc. Tax Others Total Fixed
Incentiv
es Inc. Tax Others
Variabl
e Total
Unit Cost
(Rs. / kWh)
TYPE Name Location
Availability and Dispatch
(MU) Cost (Rs. Crs.)
TOTAL- NCL Energy Ltd 0.00 0.00 0.00 0.00 0.00 0.00 0.00 0.00 0.00 0.00 0.00 0.00 0.00 0.00 0.00 0.00
NCE-Others Ramakrishna Industries
Kishen Nagar (v),
Shadnagar (M),
Mahaboobnagar District 1.00 100.00 1.00 1.66 1.66 2.97 2.97 17.91 0.00 0.00 0.00 0.00 17.91
NCE-Others Jurala Solar Power Plant
33/11 KV Gadwal,
Mahabubnagar District 1.00 100.00 1.00 1.57 1.57 2.85 2.85 18.17 0.00 0.00 0.00 0.00 18.17
NCE-Others Bhavani Engineering
Madhava yedavally,
Narketpally Mandal,
Nalgonda District 1.00 100.00 1.00 1.64 1.64 2.98 2.98 18.19 0.00 0.00 0.00 0.00 18.19
NCE-Others
Photon Energy Systems
Ltd.,
Mominpet Village, Ranga
Reddy District 1.00 100.00 1.00 1.5529 1.5529 2.83 2.83 18.25 0.00 0.00 0.00 0.00 18.25
NCE-Others Andromeda Energy Techno
Avancha (V), Narasapur
(M),Medak 0.75 100.00 0.75 1.16 1.16 2.11 2.11 18.22 0.00 0.00 0.00 0.00 18.22
NCE-Others
Essel Mining & Industries
Ltd., Kalwakurthy
kalwakurthy in
Mahabubnagar 10.00 100.00 10.00 18.02 18.02 12.00 12.00 6.66 0.00 0.00 0.00 0.00 6.66
NCE-Others
Essel Mining & Industries
Ltd., Peddashankarampet
Peddashankarampet in
Mahabubnagar 10.00 100.00 10.00 17.10 17.10 11.40 11.40 6.67 0.00 0.00 0.00 0.00 6.67
NCE-Others
Essel Mining & Industries
Ltd., Achampet
Achampet in
Mahabubnagar 5.00 100.00 5.00 8.92 8.92 5.94 5.94 6.66 0.00 0.00 0.00 0.00 6.66
NCE-Others
Chintapally Saibaba Energy
Pvt. Ltd.,
Varkala(V),
Chinthapally(M),
Nalgonda 2.00 100.00 2.00 1.52 1.52 0.99 0.99 6.49 0.00 0.00 0.00 0.00 6.49
NCE-Others
SSJ Power Projects &
Infrastructures(P) Ltd 132/33 KV Parigi SS, RR 5.00 100.00 5.00 7.90 7.90 5.28 5.28 6.68 0.00 0.00 0.00 0.00 6.68
NCE-Others
Bagyanagar Green Energy
Ltd
33/11 KV Peddamunthal,
RR 5.00 100.00 5.00 5.15 5.15 3.33 3.33 6.46 0.00 0.00 0.00 0.00 6.46
NCE-Others
Mahabubnagar solar parks
P Ltd Mahabubnagar 10.00 100.00 10.00 15.30 15.30 9.93 9.93 6.49 0.00 0.00 0.00 0.00 6.49
NCE-Others Marikal solar parks P Ltd
132/33 KV Marikal SS,
Mahabubnagar 10.00 100.00 10.00 16.27 16.27 10.56 10.56 6.49 0.00 0.00 0.00 0.00 6.49
NCE-Others
Prime Life space
consultancy P Ltd
33/11 KV SS Paladugu,
Nalgonda 3.00 100.00 3.00 1.59 1.59 1.13 1.13 7.15 0.00 0.00 0.00 0.00 7.15
NCE-Others RGS solar Power Private Ltd
132/33 KV SS Habsipur,
Medak 7.00 100.00 7.00 1.47 1.47 0.97 0.97 6.59 0.00 0.00 0.00 0.00 6.59
NCE-Others
SS Indus Solar Energy
Private Limited
33/11 KV SS Kattangur,
Nalgonda 2.00 100.00 2.00 1.83 1.83 1.19 1.19 6.49 0.00 0.00 0.00 0.00 6.49
NCE-Others
Starlite Global
enterprises(India)Lts
132 KV SS Sadasivapet,
Medak 3.00 100.00 3.00 3.95 3.95 2.55 2.55 6.45 0.00 0.00 0.00 0.00 6.45
NCE-Others Photon Solar Power Pvt Ltd
33 KV SS Narayanakhed,
Medak 5.00 100.00 5.00 3.38 3.38 2.18 2.18 6.45 0.00 0.00 0.00 0.00 6.45
NCE-Others
Haldirams Snacks Private
Limited
132/33 KV SS
Kalwakurthy,
Mahabubnagar 10.00 100.00 10.00 7.08 7.08 12.79 12.79 18.06 0.00 0.00 0.00 0.00 18.06
NCE-Others
Ushas Ventures Private
Limited
33/11 KV Kodangal,
Mahabubnagar 8.00 100.00 8.00 3.24 3.24 2.09 2.09 6.43 0.00 0.00 0.00 0.00 6.43
NCE-Others Tri Solar Pvt Ltd.,
132 KV SS Marikal,
Mahabubnagar 5.00 100.00 5.00 1.21 1.21 1.41 1.41 11.63 0.00 0.00 0.00 0.00 11.63
NCE-Others
Pemmasani Solar Power
Private Ltd.,
132/33 KV SS Makthal,
mahabubnagar 10.00 100.00 10.00 1.67 1.67 1.14 1.14 6.84 0.00 0.00 0.00 0.00 6.84

Plant
Capacity
DISCOM'
s share
DISCOM's
share
(MW) (%) (MW) Net
Availability Dispatch Fixed Variable Incentive Inc. Tax Others Total Fixed
Incentiv
es Inc. Tax Others
Variabl
e Total
Unit Cost
(Rs. / kWh)
TYPE Name Location
Availability and Dispatch
(MU) Cost (Rs. Crs.)
NCE-Others
M/s.Winsol Solar Fields
(Polepally) Pvt Ltd.,
Jadcherla,
Mahabubnagar 25.00 100.00 25.00 0.07 0.07 0.05 0.05 6.90 0.00 0.00 0.00 0.00 6.90
NCE-Others
M/s.SP Solren Private
Limited
Almpur(V&M),
Maheboobnagar 10.00 100.00 10.00 1.67 1.67 1.12 1.12 6.67 0.00 0.00 0.00 0.00 6.67
NCE-Others
M/s.Vcarve Renewable
Energy Private Limited
33/11 KV SS Kulkulpally,
Mahabubnagar 3.00 100.00 3.00 0.28 0.28 0.19 0.19 6.75 0.00 0.00 0.00 0.00 6.75
NCE-Others
M/s.Sunborne Energy
Andhra (P) Ltd.,
132/33 KV Ieeza SS,
Mahabubnagar 35.00 100.00 35.00 9.98 9.98 6.44 6.44 6.45 0.00 0.00 0.00 0.00 6.45
NCE-Others
Global Coal & Mining (P)
Ltd., 132/33 KV SS Parigi, RR 10.00 100.00 10.00 0.18 0.18 0.12 0.12 6.51 0.00 0.00 0.00 0.00 6.51
NCE-Others NVVNL B.P. Solar 37.24 37.24 0.26 39.49 39.75 0.07 0.00 0.00 0.00 10.61 10.68
NCE-Others GBI Claims Receivables -9.47 -9.47 0.00 0.00 0.00 0.00 0.00 0.00
NCE-Others 0.00 0.00 0.00 0.00 0.00 0.00 0.00
NCE-Others 0.00 0.00 0.00 0.00 0.00 0.00 0.00
TOTAL NCE - Others 197.75 197.75 172.60 172.60 106.77 39.49 0.00 0.00 -9.47 136.79 6.19 0.00 0.00 -0.55 2.29 7.93
Total NCE 252.80 252.80 276.65 276.65 169.17 39.49 0.00 0.00 -15.22 193.44 6.12 0.00 0.00 -0.55 1.43 6.99

Form 1.4(iv)
NCE Generation
(Year 3)
Plant
Capacity
DISCOM's
share
DISCOM's
share
(MW) (%) (MW) Net
Availability Dispatch Fixed Variable Incentive Inc. Tax Others Total Fixed
Incentiv
es Inc. Tax Others Variable Total
Bio-Mass Gayatri Agro Nalgonda 6.00 100.00 6.00 11.55 11.55 2.55 6.58 9.13 2.21 0.00 0.00 0.00 5.69 7.90
Bio-Mass Saro Power Mahabubnagar 6.00 100.00 6.00 13.74 13.74 3.04 7.83 10.86 2.21 0.00 0.00 0.00 5.70 7.91
Bio-Mass Surya Teja
Bichapally in
Mahabubnagar 6.00 100.00 6.00 28.24 28.24 6.23 16.09 22.32 2.21 0.00 0.00 0.00 5.70 7.90
Bio-Mass 0.00 0.00 0.00 0.00 0.00 0.00 0.00
Bio-Mass 0.00 0.00 0.00 0.00 0.00 0.00 0.00
TOTAL Bio-mass 18.00 18.00 53.53 53.53 11.82 30.49 0.00 0.00 0.00 42.31 2.21 0.00 0.00 0.00 5.70 7.90
Bagasse 0.00 0.00 0.00 0.00 0.00 0.00 0.00
Bagasse 0.00 0.00 0.00 0.00 0.00 0.00 0.00
Bagasse 0.00 0.00 0.00 0.00 0.00 0.00 0.00
Bagasse 0.00 0.00 0.00 0.00 0.00 0.00 0.00
TOTAL Bagasse 0.00 0.00 0.00 0.00 0.00 0.00 0.00 0.00 0.00 0.00 0.00 0.00 0.00 0.00 0.00 0.00
Municipal Waste to Energy 0.00 0.00 0.00 0.00 0.00 0.00 0.00
Municipal Waste to Energy 0.00 0.00 0.00 0.00 0.00 0.00 0.00
Municipal Waste to Energy 0.00 0.00 0.00 0.00 0.00 0.00 0.00
TOTAL Municipal Waste to
Energy 0.00 0.00 0.00 0.00 0.00 0.00 0.00 0.00 0.00 0.00 0.00 0.00 0.00 0.00 0.00 0.00
Industrial Waste based power
project shravana power
Takkalapalli (V),
Yacharam(M),
Ranga Reddy
district 7.50 100.00 7.50 6.18 6.18 1.61 3.53 5.14 2.61 0.00 0.00 0.00 5.71 8.32
TOTAL Industrial Waste 7.50 7.50 6.18 6.18 1.61 3.53 0.00 0.00 0.00 5.14 2.61 0.00 0.00 0.00 5.71 8.32
Wind Power Mytra Vayu Medak 236.40 236.40 110.98 110.98 0.00 0.00 0.00 0.00 4.69 4.69
Wind Power 0.00 0.00 0.00 0.00 0.00 0.00 0.00
Wind Power 0.00 0.00 0.00 0.00 0.00 0.00 0.00
Wind Power 0.00 0.00 0.00 0.00 0.00 0.00 0.00
TOTAL Wind Power 0.00 0.00 236.40 236.40 0.00 110.98 0.00 0.00 0.00 110.98 0.00 0.00 0.00 0.00 4.69 4.69
Mini Hydel 0.00 0.00 0.00 0.00 0.00 0.00 0.00
Mini Hydel 0.00 0.00 0.00 0.00 0.00 0.00 0.00
Mini Hydel 0.00 0.00 0.00 0.00 0.00 0.00 0.00
TOTAL Mini Hydel 0.00 0.00 0.00 0.00 0.00 0.00 0.00 0.00 0.00 0.00 0.00 0.00 0.00 0.00 0.00 0.00
NCL Energy Ltd 0.00 0.00 0.00 0.00 0.00 0.00 0.00
NCL Energy Ltd 0.00 0.00 0.00 0.00 0.00 0.00 0.00
TOTAL- NCL Energy Ltd 0.00 0.00 0.00 0.00 0.00 0.00 0.00 0.00 0.00 0.00 0.00 0.00 0.00 0.00 0.00 0.00
Unit Cost
(Rs. / kWh)
Plant wise NCE Generation and Cost Details for Base Year. The total should be consistent with values provided in Form 1.4 under NCE.
TYPE Name Location
Availability and
Dispatch (MU) Cost (Rs. Crs.)

Plant
Capacity
DISCOM's
share
DISCOM's
share
(MW) (%) (MW) Net
Availability Dispatch Fixed Variable Incentive Inc. Tax Others Total Fixed
Incentiv
es Inc. Tax Others Variable Total
Unit Cost
(Rs. / kWh)
TYPE Name Location
Availability and
Dispatch (MU) Cost (Rs. Crs.)
NCE-Others Ramakrishna Industries
Kishen Nagar (v),
Shadnagar (M),
Mahaboobnagar
District 1.00 1.64 1.64 2.93 2.93 0.00 0.00 0.00 0.00 17.91 17.91
NCE-Others Bhavani Engineering
Madhava
yedavally,
Narketpally
Mandal, Nalgonda
District 1.00 1.72 1.72 3.07 3.07 0.00 0.00 0.00 0.00 17.91 17.91
NCE-Others
Photon Energy Systems
Ltd.,
Mominpet Village,
Ranga Reddy
District 1.00 1.42 1.42 2.54 2.54 0.00 0.00 0.00 0.00 17.91 17.91
NCE-Others
Andromeda Energy
Techno
Avancha (V),
Narasapur
(M),Medak 0.75 1.10 1.10 1.98 1.98 0.00 0.00 0.00 0.00 17.91 17.91
NCE-Others Jurala Solar Power Plant
33/11 KV Gadwal,
Mahabubnagar
District 1.00 1.52 1.52 2.72 2.72 0.00 0.00 0.00 0.00 17.91 17.91
NCE-Others
Essel Mining & Industries
Ltd., Kalwakurthy Mahabubnagar 10.00 17.84 17.84 11.51 11.51 0.00 0.00 0.00 0.00 6.45 6.45
NCE-Others
Essel Mining & Industries
Ltd., Peddashankarampet Mahabubnagar 10.00 16.77 16.77 10.73 10.73 0.00 0.00 0.00 0.00 6.40 6.40
NCE-Others
Essel Mining & Industries
Ltd., Achampet Mahabubnagar 5.00 8.81 8.81 5.59 5.59 0.00 0.00 0.00 0.00 6.35 6.35
NCE-Others 0.00 0.00 0.00 0.00 0.00 0.00 0.00
NCE-Others
Chintapally Saibaba
Energy Pvt. Ltd.,
Varkala(V),
Chinthapally(M),
Nalgonda 2.00 2.50 2.50 1.54 1.54 0.00 0.00 0.00 0.00 6.16 6.16
NCE-Others
SSJ Power Projects &
Infrastructures(P) Ltd
132/33 KV Parigi
SS, RR 5.00 7.35 7.35 4.77 4.77 0.00 0.00 0.00 0.00 6.49 6.49
NCE-Others
Bhagyanagar Green
Energy Ltd.,
33/11 KV
Peddamunthal,
RR 5.00 7.17 7.17 4.55 4.55 0.00 0.00 0.00 0.00 6.35 6.35
NCE-Others
Mahabubnagar Solar
Parks (P) Ltd., Mahabubnagar 10.00 20.01 20.01 12.94 12.94 0.00 0.00 0.00 0.00 6.47 6.47
NCE-Others
Marikal Solar Parks (P)
Ltd
132/33 KV Marikal
SS,
Mahabubnagar 10.00 20.15 20.15 13.03 13.03 0.00 0.00 0.00 0.00 6.47 6.47
NCE-Others
Prime Life Space
Consultancy (P) Ltd.,
33/11 KV SS
Paladugu,
Nalgonda 3.00 4.83 4.83 3.26 3.26 0.00 0.00 0.00 0.00 6.75 6.75
NCE-Others
R.G.S.Solar Power Private
Limited
132/33 KV SS
Habsipur, Medak 1.00 1.78 1.78 1.15 1.15 0.00 0.00 0.00 0.00 6.48 6.48
NCE-Others
Starlite Global
Enterprises (India) Ltd.,
33/11 KV SS
Kattangur,
Nalgonda 3.00 5.39 5.39 3.45 3.45 0.00 0.00 0.00 0.00 6.40 6.40
NCE-Others
Photon Solar Power Pvt
Ltd.,
132 KV SS
Sadasivapet,
Medak 5.00 7.59 7.59 4.44 4.44 0.00 0.00 0.00 0.00 5.85 5.85
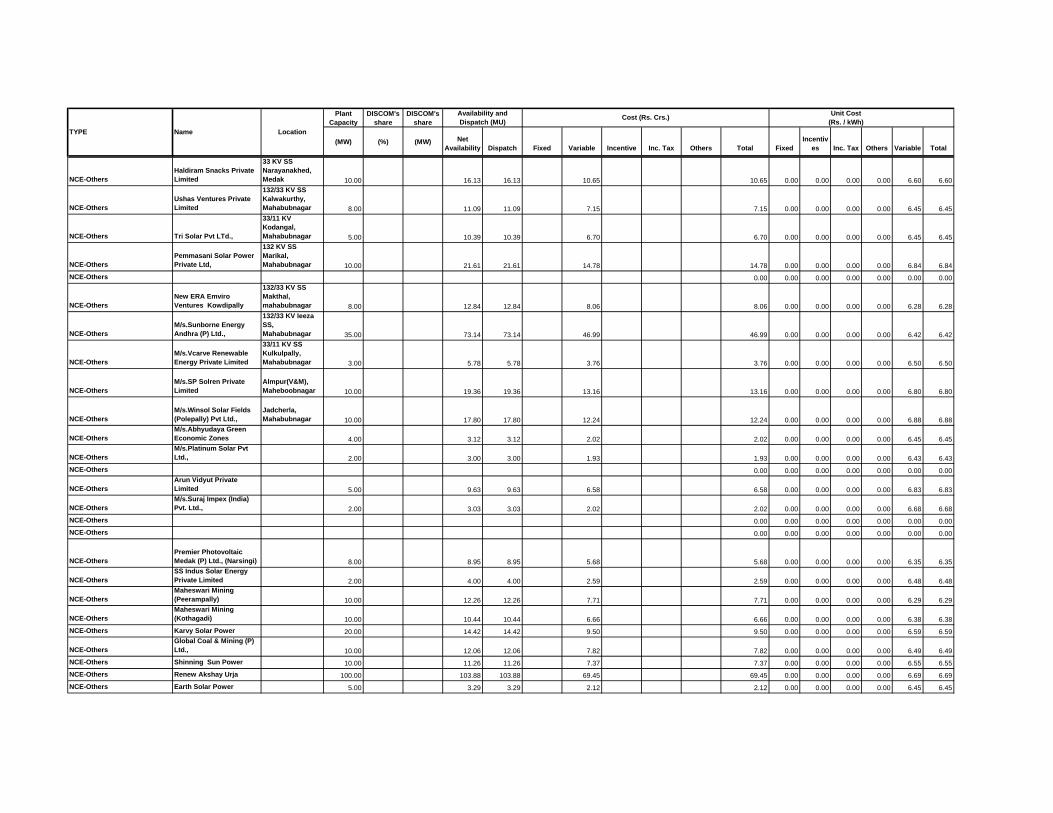
Plant
Capacity
DISCOM's
share
DISCOM's
share
(MW) (%) (MW) Net
Availability Dispatch Fixed Variable Incentive Inc. Tax Others Total Fixed
Incentiv
es Inc. Tax Others Variable Total
Unit Cost
(Rs. / kWh)
TYPE Name Location
Availability and
Dispatch (MU) Cost (Rs. Crs.)
NCE-Others
Haldiram Snacks Private
Limited
33 KV SS
Narayanakhed,
Medak 10.00 16.13 16.13 10.65 10.65 0.00 0.00 0.00 0.00 6.60 6.60
NCE-Others
Ushas Ventures Private
Limited
132/33 KV SS
Kalwakurthy,
Mahabubnagar 8.00 11.09 11.09 7.15 7.15 0.00 0.00 0.00 0.00 6.45 6.45
NCE-Others Tri Solar Pvt LTd.,
33/11 KV
Kodangal,
Mahabubnagar 5.00 10.39 10.39 6.70 6.70 0.00 0.00 0.00 0.00 6.45 6.45
NCE-Others
Pemmasani Solar Power
Private Ltd,
132 KV SS
Marikal,
Mahabubnagar 10.00 21.61 21.61 14.78 14.78 0.00 0.00 0.00 0.00 6.84 6.84
NCE-Others 0.00 0.00 0.00 0.00 0.00 0.00 0.00
NCE-Others
New ERA Emviro
Ventures Kowdipally
132/33 KV SS
Makthal,
mahabubnagar 8.00 12.84 12.84 8.06 8.06 0.00 0.00 0.00 0.00 6.28 6.28
NCE-Others
M/s.Sunborne Energy
Andhra (P) Ltd.,
132/33 KV Ieeza
SS,
Mahabubnagar 35.00 73.14 73.14 46.99 46.99 0.00 0.00 0.00 0.00 6.42 6.42
NCE-Others
M/s.Vcarve Renewable
Energy Private Limited
33/11 KV SS
Kulkulpally,
Mahabubnagar 3.00 5.78 5.78 3.76 3.76 0.00 0.00 0.00 0.00 6.50 6.50
NCE-Others
M/s.SP Solren Private
Limited
Almpur(V&M),
Maheboobnagar 10.00 19.36 19.36 13.16 13.16 0.00 0.00 0.00 0.00 6.80 6.80
NCE-Others
M/s.Winsol Solar Fields
(Polepally) Pvt Ltd.,
Jadcherla,
Mahabubnagar 10.00 17.80 17.80 12.24 12.24 0.00 0.00 0.00 0.00 6.88 6.88
NCE-Others
M/s.Abhyudaya Green
Economic Zones 4.00 3.12 3.12 2.02 2.02 0.00 0.00 0.00 0.00 6.45 6.45
NCE-Others
M/s.Platinum Solar Pvt
Ltd., 2.00 3.00 3.00 1.93 1.93 0.00 0.00 0.00 0.00 6.43 6.43
NCE-Others 0.00 0.00 0.00 0.00 0.00 0.00 0.00
NCE-Others
Arun Vidyut Private
Limited 5.00 9.63 9.63 6.58 6.58 0.00 0.00 0.00 0.00 6.83 6.83
NCE-Others
M/s.Suraj Impex (India)
Pvt. Ltd., 2.00 3.03 3.03 2.02 2.02 0.00 0.00 0.00 0.00 6.68 6.68
NCE-Others 0.00 0.00 0.00 0.00 0.00 0.00 0.00
NCE-Others 0.00 0.00 0.00 0.00 0.00 0.00 0.00
NCE-Others
Premier Photovoltaic
Medak (P) Ltd., (Narsingi) 8.00 8.95 8.95 5.68 5.68 0.00 0.00 0.00 0.00 6.35 6.35
NCE-Others
SS Indus Solar Energy
Private Limited 2.00 4.00 4.00 2.59 2.59 0.00 0.00 0.00 0.00 6.48 6.48
NCE-Others
Maheswari Mining
(Peerampally) 10.00 12.26 12.26 7.71 7.71 0.00 0.00 0.00 0.00 6.29 6.29
NCE-Others
Maheswari Mining
(Kothagadi) 10.00 10.44 10.44 6.66 6.66 0.00 0.00 0.00 0.00 6.38 6.38
NCE-Others Karvy Solar Power 20.00 14.42 14.42 9.50 9.50 0.00 0.00 0.00 0.00 6.59 6.59
NCE-Others
Global Coal & Mining (P)
Ltd., 10.00 12.06 12.06 7.82 7.82 0.00 0.00 0.00 0.00 6.49 6.49
NCE-Others Shinning Sun Power 10.00 11.26 11.26 7.37 7.37 0.00 0.00 0.00 0.00 6.55 6.55
NCE-Others Renew Akshay Urja 100.00 103.88 103.88 69.45 69.45 0.00 0.00 0.00 0.00 6.69 6.69
NCE-Others Earth Solar Power 5.00 3.29 3.29 2.12 2.12 0.00 0.00 0.00 0.00 6.45 6.45

Plant
Capacity
DISCOM's
share
DISCOM's
share
(MW) (%) (MW) Net
Availability Dispatch Fixed Variable Incentive Inc. Tax Others Total Fixed
Incentiv
es Inc. Tax Others Variable Total
Unit Cost
(Rs. / kWh)
TYPE Name Location
Availability and
Dispatch (MU) Cost (Rs. Crs.)
NCE-Others
Premier Photo Medak (P)
Ltd., Digwal 8.00 8.82 8.82 5.69 5.69 0.00 0.00 0.00 0.00 6.45 6.45
NCE-Others International Solar 5.00 2.66 2.66 1.76 1.76 0.00 0.00 0.00 0.00 6.60 6.60
NCE-Others
ReNew Akshay
(Sadashivpet) 24.00 27.19 27.19 18.39 18.39 0.00 0.00 0.00 0.00 6.77 6.77
NCE-Others Kirthi Power Solutions 1.99 1.54 1.54 0.99 0.99 0.00 0.00 0.00 0.00 6.45 6.45
NCE-Others Nirjara Solaire Urja 10.00 10.66 10.66 7.35 7.35 0.00 0.00 0.00 0.00 6.89 6.89
NCE-Others Dayakara Solar Power 20.82 20.82 14.23 14.23 0.00 0.00 0.00 0.00 6.83 6.83
NCE-Others Cleansolar power 8.15 8.15 5.62 5.62 0.00 0.00 0.00 0.00 6.89 6.89
NCE-Others Grahati Solar Energy 12.90 12.90 8.67 8.67 0.00 0.00 0.00 0.00 6.72 6.72
NCE-Others
Sparkman Solar Energy
Pvt Ltd 1.17 1.17 0.78 0.78 0.00 0.00 0.00 0.00 6.70 6.70
NCE-Others
Plants gets added by 31-
12.2016 268.00 206.34 206.34 158.18 158.18 0.00 0.00 0.00 0.00 7.67 7.67
NCE-Others 0.00 0.00 0.00 0.00 0.00 0.00 0.00
NCE-Others 0.00 0.00 0.00 0.00 0.00 0.00 0.00
TOTAL NCE - Others 677.74 0.00 815.30 815.30 0.00 566.81 0.00 0.00 0.00 566.81 0.00 0.00 0.00 0.00 6.95 6.95
Total NCE 703.24 25.50 1111.41 1111.41 13.43 711.81 0.00 0.00 0.00 725.24 0.12 0.00 0.00 0.00 6.40 6.53

Form 1.4(v) NCE Generation ( Year 4)
Plant
Capacity
DISCOM's
share
DISCOM's
share
(MW) (%) (MW)Net
Availability Dispatch Fixed Variable Incentive Inc. Tax Others Total Fixed
Incentiv
es Inc. Tax Others Variable Total
Bio-Mass Gayatri Agro Nalgonda 6.00 100.00 6.00 12.99 12.99 1.93 5.68 7.61 1.49 0.00 0.00 0.00 4.37 5.86
Bio-Mass Saro Power Mahabubnagar 6.00 100.00 6.00 12.24 12.24 1.82 5.35 7.17 1.49 0.00 0.00 0.00 4.37 5.86
Bio-Mass Surya Teja
Bichapally in
Mahabubnagar 6.00 100.00 6.00 31.29 31.29 4.65 13.67 18.33 1.49 0.00 0.00 0.00 4.37 5.86
Bio-Mass 0.00 0.00 0.00 0.00 0.00 0.00 0.00
Bio-Mass 0.00 0.00 0.00 0.00 0.00 0.00 0.00
Bio-Mass 0.00 0.00 0.00 0.00 0.00 0.00 0.00
TOTAL Bio-mass 18.00 18.00 56.52 56.52 8.40 24.70 0.00 0.00 0.00 33.10 1.49 0.00 0.00 0.00 4.37 5.86
Bagasse Ganpathi Sugar
Fasalwadi village,
Sangareddy
mandal, Medak
district 0.40 0.40 0.06 0.11 0.17 1.41 0.00 0.00 0.00 2.78 4.19
Bagasse 0.00 0.00 0.00 0.00 0.00 0.00 0.00
Bagasse 0.00 0.00 0.00 0.00 0.00 0.00 0.00
Bagasse 0.00 0.00 0.00 0.00 0.00 0.00 0.00
TOTAL Bagasse 0.00 0.00 0.40 0.40 0.06 0.11 0.00 0.00 0.00 0.17 1.41 0.00 0.00 0.00 2.78 4.19
Municipal Waste to Energy RDF Ltd. 21.52 21.52 7.32 8.24 15.56 3.40 0.00 0.00 0.00 3.83 7.23
Municipal Waste to Energy Sri Venkateshwara 21.52 21.52 7.32 8.24 15.56 3.40 0.00 0.00 0.00 3.83 7.23
Municipal Waste to Energy Hema Sri 21.52 21.52 7.32 8.24 15.56 3.40 0.00 0.00 0.00 3.83 7.23
Municipal Waste to Energy 0.00 0.00 0.00 0.00 0.00 0.00 0.00TOTAL Municipal Waste to
Energy 0.00 0.00 64.57 64.57 21.95 24.72 0.00 0.00 0.00 46.67 3.40 0.00 0.00 0.00 3.83 7.23Industrial Waste based power
project shravana power
Takkalapalli (V),
Yacharam(M), 5.52 5.52 2.41 0.90 3.32 4.37 0.00 0.00 0.00 1.64 6.01Industrial Waste based power
project 0.00 0.00 0.00 0.00 0.00 0.00 0.00Industrial Waste based power
project 0.00 0.00 0.00 0.00 0.00 0.00 0.00
TOTAL Industrial Waste 0.00 0.00 5.52 5.52 2.41 0.90 0.00 0.00 0.00 3.32 4.37 0.00 0.00 0.00 1.64 6.01
Wind Power Mytra Vayu Medak 397.75 397.75 0.00 186.94 186.94 0.00 0.00 0.00 0.00 4.70 4.70
Wind Power 0.00 0.00 0.00 0.00 0.00 0.00 0.00
Wind Power 0.00 0.00 0.00 0.00 0.00 0.00 0.00
Wind Power 0.00 0.00 0.00 0.00 0.00 0.00 0.00
TOTAL Wind Power 0.00 0.00 397.75 397.75 0.00 186.94 0.00 0.00 0.00 186.94 0.00 0.00 0.00 0.00 4.70 4.70
Mini Hydel 0.00 0.00 0.00 0.00 0.00 0.00 0.00
Mini Hydel 0.00 0.00 0.00 0.00 0.00 0.00 0.00
Mini Hydel 0.00 0.00 0.00 0.00 0.00 0.00 0.00
TOTAL Mini Hydel 0.00 0.00 0.00 0.00 0.00 0.00 0.00 0.00 0.00 0.00 0.00 0.00 0.00 0.00 0.00 0.00
NCL Energy Ltd 0.00 0.00 0.00 0.00 0.00 0.00 0.00
NCL Energy Ltd 0.00 0.00 0.00 0.00 0.00 0.00 0.00
NCL Energy Ltd 0.00 0.00 0.00 0.00 0.00 0.00 0.00
TOTAL- NCL Energy Ltd 0.00 0.00 0.00 0.00 0.00 0.00 0.00 0.00 0.00 0.00 0.00 0.00 0.00 0.00 0.00 0.00
NCE-Others Ramakrishna Industries
Kishen Nagar (v),
Shadnagar (M),
Mahaboobnagar
District 1.00 1.64 1.64 2.93 2.93 0.00 0.00 0.00 0.00 17.91 17.91
Unit Cost
(Rs. / kWh)
Plant wise NCE Generation and Cost Details for Year2. The total should be consistent with values provided in Form 1.4 under NCE.
TYPE Name Location
Availability and
Dispatch (MU) Cost (Rs. Crs.)
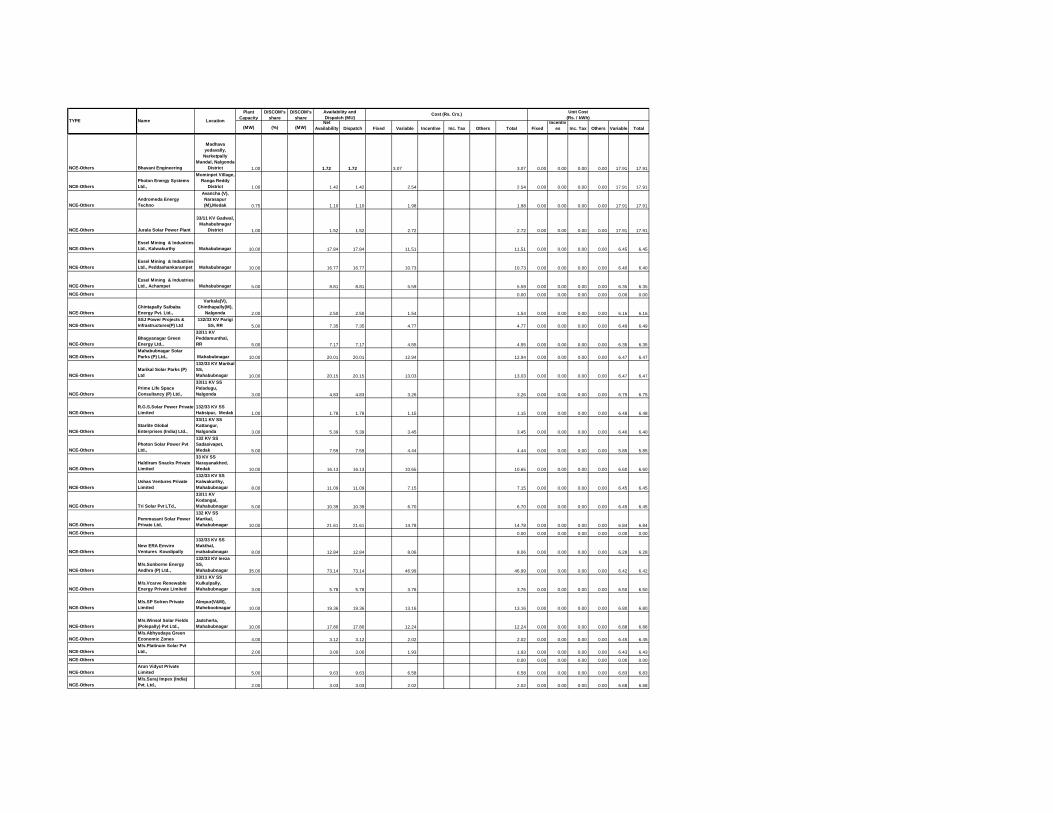
Plant
Capacity
DISCOM's
share
DISCOM's
share
(MW) (%) (MW)Net
Availability Dispatch Fixed Variable Incentive Inc. Tax Others Total Fixed
Incentiv
es Inc. Tax Others Variable Total
Unit Cost
(Rs. / kWh)TYPE Name Location
Availability and
Dispatch (MU) Cost (Rs. Crs.)
NCE-Others Bhavani Engineering
Madhava
yedavally,
Narketpally
Mandal, Nalgonda
District 1.00 1.72 1.72 3.07 3.07 0.00 0.00 0.00 0.00 17.91 17.91
NCE-Others
Photon Energy Systems
Ltd.,
Mominpet Village,
Ranga Reddy
District 1.00 1.42 1.42 2.54 2.54 0.00 0.00 0.00 0.00 17.91 17.91
NCE-Others
Andromeda Energy
Techno
Avancha (V),
Narasapur
(M),Medak 0.75 1.10 1.10 1.98 1.98 0.00 0.00 0.00 0.00 17.91 17.91
NCE-Others Jurala Solar Power Plant
33/11 KV Gadwal,
Mahabubnagar
District 1.00 1.52 1.52 2.72 2.72 0.00 0.00 0.00 0.00 17.91 17.91
NCE-Others
Essel Mining & Industries
Ltd., Kalwakurthy Mahabubnagar 10.00 17.84 17.84 11.51 11.51 0.00 0.00 0.00 0.00 6.45 6.45
NCE-Others
Essel Mining & Industries
Ltd., Peddashankarampet Mahabubnagar 10.00 16.77 16.77 10.73 10.73 0.00 0.00 0.00 0.00 6.40 6.40
NCE-Others
Essel Mining & Industries
Ltd., Achampet Mahabubnagar 5.00 8.81 8.81 5.59 5.59 0.00 0.00 0.00 0.00 6.35 6.35
NCE-Others 0.00 0.00 0.00 0.00 0.00 0.00 0.00
NCE-Others
Chintapally Saibaba
Energy Pvt. Ltd.,
Varkala(V),
Chinthapally(M),
Nalgonda 2.00 2.50 2.50 1.54 1.54 0.00 0.00 0.00 0.00 6.16 6.16
NCE-Others
SSJ Power Projects &
Infrastructures(P) Ltd
132/33 KV Parigi
SS, RR 5.00 7.35 7.35 4.77 4.77 0.00 0.00 0.00 0.00 6.49 6.49
NCE-Others
Bhagyanagar Green
Energy Ltd.,
33/11 KV
Peddamunthal,
RR 5.00 7.17 7.17 4.55 4.55 0.00 0.00 0.00 0.00 6.35 6.35
NCE-Others
Mahabubnagar Solar
Parks (P) Ltd., Mahabubnagar 10.00 20.01 20.01 12.94 12.94 0.00 0.00 0.00 0.00 6.47 6.47
NCE-Others
Marikal Solar Parks (P)
Ltd
132/33 KV Marikal
SS,
Mahabubnagar 10.00 20.15 20.15 13.03 13.03 0.00 0.00 0.00 0.00 6.47 6.47
NCE-Others
Prime Life Space
Consultancy (P) Ltd.,
33/11 KV SS
Paladugu,
Nalgonda 3.00 4.83 4.83 3.26 3.26 0.00 0.00 0.00 0.00 6.75 6.75
NCE-Others
R.G.S.Solar Power Private
Limited
132/33 KV SS
Habsipur, Medak 1.00 1.78 1.78 1.15 1.15 0.00 0.00 0.00 0.00 6.48 6.48
NCE-Others
Starlite Global
Enterprises (India) Ltd.,
33/11 KV SS
Kattangur,
Nalgonda 3.00 5.39 5.39 3.45 3.45 0.00 0.00 0.00 0.00 6.40 6.40
NCE-Others
Photon Solar Power Pvt
Ltd.,
132 KV SS
Sadasivapet,
Medak 5.00 7.59 7.59 4.44 4.44 0.00 0.00 0.00 0.00 5.85 5.85
NCE-Others
Haldiram Snacks Private
Limited
33 KV SS
Narayanakhed,
Medak 10.00 16.13 16.13 10.65 10.65 0.00 0.00 0.00 0.00 6.60 6.60
NCE-Others
Ushas Ventures Private
Limited
132/33 KV SS
Kalwakurthy,
Mahabubnagar 8.00 11.09 11.09 7.15 7.15 0.00 0.00 0.00 0.00 6.45 6.45
NCE-Others Tri Solar Pvt LTd.,
33/11 KV
Kodangal,
Mahabubnagar 5.00 10.39 10.39 6.70 6.70 0.00 0.00 0.00 0.00 6.45 6.45
NCE-Others
Pemmasani Solar Power
Private Ltd,
132 KV SS
Marikal,
Mahabubnagar 10.00 21.61 21.61 14.78 14.78 0.00 0.00 0.00 0.00 6.84 6.84
NCE-Others 0.00 0.00 0.00 0.00 0.00 0.00 0.00
NCE-Others
New ERA Emviro
Ventures Kowdipally
132/33 KV SS
Makthal,
mahabubnagar 8.00 12.84 12.84 8.06 8.06 0.00 0.00 0.00 0.00 6.28 6.28
NCE-Others
M/s.Sunborne Energy
Andhra (P) Ltd.,
132/33 KV Ieeza
SS,
Mahabubnagar 35.00 73.14 73.14 46.99 46.99 0.00 0.00 0.00 0.00 6.42 6.42
NCE-Others
M/s.Vcarve Renewable
Energy Private Limited
33/11 KV SS
Kulkulpally,
Mahabubnagar 3.00 5.78 5.78 3.76 3.76 0.00 0.00 0.00 0.00 6.50 6.50
NCE-Others
M/s.SP Solren Private
Limited
Almpur(V&M),
Maheboobnagar 10.00 19.36 19.36 13.16 13.16 0.00 0.00 0.00 0.00 6.80 6.80
NCE-Others
M/s.Winsol Solar Fields
(Polepally) Pvt Ltd.,
Jadcherla,
Mahabubnagar 10.00 17.80 17.80 12.24 12.24 0.00 0.00 0.00 0.00 6.88 6.88
NCE-Others
M/s.Abhyudaya Green
Economic Zones 4.00 3.12 3.12 2.02 2.02 0.00 0.00 0.00 0.00 6.45 6.45
NCE-Others
M/s.Platinum Solar Pvt
Ltd., 2.00 3.00 3.00 1.93 1.93 0.00 0.00 0.00 0.00 6.43 6.43
NCE-Others 0.00 0.00 0.00 0.00 0.00 0.00 0.00
NCE-Others
Arun Vidyut Private
Limited 5.00 9.63 9.63 6.58 6.58 0.00 0.00 0.00 0.00 6.83 6.83
NCE-Others
M/s.Suraj Impex (India)
Pvt. Ltd., 2.00 3.03 3.03 2.02 2.02 0.00 0.00 0.00 0.00 6.68 6.68
Plant
Capacity
DISCOM's
share
DISCOM's
share
(MW) (%) (MW)Net
Availability Dispatch Fixed Variable Incentive Inc. Tax Others Total Fixed
Incentiv
es Inc. Tax Others Variable Total
Unit Cost
(Rs. / kWh)TYPE Name Location
Availability and
Dispatch (MU) Cost (Rs. Crs.)

Plant
Capacity
DISCOM's
share
DISCOM's
share
(MW) (%) (MW)Net
Availability Dispatch Fixed Variable Incentive Inc. Tax Others Total Fixed
Incentiv
es Inc. Tax Others Variable Total
Unit Cost
(Rs. / kWh)TYPE Name Location
Availability and
Dispatch (MU) Cost (Rs. Crs.)
NCE-Others 0.00 0.00 0.00 0.00 0.00 0.00 0.00
NCE-Others
Premier Photovoltaic
Medak (P) Ltd., (Narsingi) 8.00 8.95 8.95 5.68 5.68 0.00 0.00 0.00 0.00 6.35 6.35
NCE-Others
SS Indus Solar Energy
Private Limited 2.00 4.00 4.00 2.59 2.59 0.00 0.00 0.00 0.00 6.48 6.48
NCE-Others
Maheswari Mining
(Peerampally) 10.00 12.26 12.26 7.71 7.71 0.00 0.00 0.00 0.00 6.29 6.29
NCE-Others
Maheswari Mining
(Kothagadi) 10.00 10.44 10.44 6.66 6.66 0.00 0.00 0.00 0.00 6.38 6.38
NCE-Others Karvy Solar Power 20.00 14.42 14.42 9.50 9.50 0.00 0.00 0.00 0.00 6.59 6.59
NCE-Others
Global Coal & Mining (P)
Ltd., 10.00 12.06 12.06 7.82 7.82 0.00 0.00 0.00 0.00 6.49 6.49
NCE-Others Shinning Sun Power 10.00 11.26 11.26 7.37 7.37 0.00 0.00 0.00 0.00 6.55 6.55
NCE-Others Renew Akshay Urja 100.00 103.88 103.88 69.45 69.45 0.00 0.00 0.00 0.00 6.69 6.69
NCE-Others Earth Solar Power 5.00 3.29 3.29 2.12 2.12 0.00 0.00 0.00 0.00 6.45 6.45
NCE-Others
Premier Photo Medak (P)
Ltd., Digwal 8.00 8.82 8.82 5.69 5.69 0.00 0.00 0.00 0.00 6.45 6.45
NCE-Others International Solar 5.00 2.66 2.66 1.76 1.76 0.00 0.00 0.00 0.00 6.60 6.60
NCE-Others
ReNew Akshay
(Sadashivpet) 24.00 27.19 27.19 18.39 18.39 0.00 0.00 0.00 0.00 6.77 6.77
NCE-Others Kirthi Power Solutions 1.99 1.54 1.54 0.99 0.99 0.00 0.00 0.00 0.00 6.45 6.45
NCE-Others Nirjara Solaire Urja 10.00 10.66 10.66 7.35 7.35 0.00 0.00 0.00 0.00 6.89 6.89
NCE-Others Dayakara Solar Power 20.82 20.82 14.23 14.23 0.00 0.00 0.00 0.00 6.83 6.83
NCE-Others Cleansolar power 8.15 8.15 5.62 5.62 0.00 0.00 0.00 0.00 6.89 6.89
NCE-Others Grahati Solar Energy 12.90 12.90 8.67 8.67 0.00 0.00 0.00 0.00 6.72 6.72
NCE-Others
Sparkman Solar Energy
Pvt Ltd 1.17 1.17 0.78 0.78 0.00 0.00 0.00 0.00 6.70 6.70
NCE-Others Plants added in 2016 268.00 206.34 206.34 158.18 158.18 0.00 0.00 0.00 0.00 7.67 7.67
NCE-Others
Plants need to be added
under 2000MW 898.00 1930.57 1930.57 1051.72 1051.72 0.00 0.00 0.00 0.00 5.45 5.45
NCE-Others 0.00 0.00 0.00 0.00 0.00 0.00 0.00
NCE-Others 0.00 0.00 0.00 0.00 0.00 0.00 0.00
NCE-Others 0.00 0.00 0.00 0.00 0.00 0.00 0.00
TOTAL NCE - Others 1575.74 0.00 2745.87 2745.87 0.00 1618.53 0.00 0.00 0.00 1618.53 0.00 0.00 0.00 0.00 5.89 5.89
Total NCE 1593.74 18.00 3270.63 3270.63 32.82 1855.91 0.00 0.00 0.00 1888.73 0.10 0.00 0.00 0.00 5.67 5.77
Form 1.4a Power Purchase and Procurement Cost (For Non-regulated Business#)
Base Year
Generating Station
Plant Type
Must Run = 1
Others = 2
Plant
Capacity
DISCOM's
share
DISCOM's
share
(MW) (%) (MW) Net Availability Dispatch Fixed Variable Incntv Inc. Tax Others Total Fixed Inctv Inc. Tax Others Variable Total
TSGENCO
Thermal
VTPS I 3750.23 0.00 0.00 0.00 0.00 0.00 0.00 0.00
VTPS II 0.00 0.00 0.00 0.00 0.00 0.00 0.00 0.00
VTPS III 0.00 0.00 0.00 0.00 0.00 0.00 0.00 0.00
VTPS IV 1657.89 0.00 0.00 0.00 0.00 0.00 0.00 0.00
RTPP I 1063.04 0.00 0.00 0.00 0.00 0.00 0.00 0.00
RTPP Stage-II 1269.51 0.00 0.00 0.00 0.00 0.00 0.00 0.00
RTPP Stage-III 590.95 0.00 0.00 0.00 0.00 0.00 0.00 0.00
KTPS A 1752.21 0.00 0.00 0.00 0.00 0.00 0.00 0.00
KTPS B 0.00 0.00 0.00 0.00 0.00 0.00 0.00 0.00
KTPS C 0.00 0.00 0.00 0.00 0.00 0.00 0.00 0.00
KTPS D 0.00 0.00 0.00 0.00 0.00 0.00 0.00 0.00
KTPS Stage VI 1491.67 0.00 0.00 0.00 0.00 0.00 0.00 0.00
RTS B 184.57 0.00 0.00 0.00 0.00 0.00 0.00 0.00
NTS 0.00 0.00 0.00 0.00 0.00 0.00 0.00 0.00
Kakatiya Thermal Power Plant Stage I 1353.37 0.00 0.00 0.00 0.00 0.00 0.00 0.00
Kakatiya Thermal Power Plant Stage II 0.00 0.00 0.00 0.00 0.00 0.00 0.00 0.00
0.00 0.00 0.00 0.00 0.00 0.00 0.00 0.00
0.00 0.00 0.00 0.00 0.00 0.00 0.00 0.00
TOTAL THERMAL 0.00 0.00 13113.44 0.00 0.00 0.00 0.00 0.00 0.00 0.00 0.00 0.00 0.00 0.00 0.00 0.00
MACHKUND PH AP Share 143.12 0.00 0.00 0.00 0.00 0.00 0.00 0.00
TUNGBHADRA PH AP Share 70.50 0.00 0.00 0.00 0.00 0.00 0.00 0.00
USL 207.92 0.00 0.00 0.00 0.00 0.00 0.00 0.00
LSR 574.66 0.00 0.00 0.00 0.00 0.00 0.00 0.00
DONKARAYI 53.12 0.00 0.00 0.00 0.00 0.00 0.00 0.00
SSLM 680.25 0.00 0.00 0.00 0.00 0.00 0.00 0.00
NSPH 614.45 0.00 0.00 0.00 0.00 0.00 0.00 0.00
NSRCPH 96.45 0.00 0.00 0.00 0.00 0.00 0.00 0.00
NSLCPH 44.68 0.00 0.00 0.00 0.00 0.00 0.00 0.00
POCHAMPAD PH 29.58 0.00 0.00 0.00 0.00 0.00 0.00 0.00
NIZAMSAGAR PH 5.78 0.00 0.00 0.00 0.00 0.00 0.00 0.00
PABM 2.20 0.00 0.00 0.00 0.00 0.00 0.00 0.00
MINI HYDRO&OTHERS 4.32 0.00 0.00 0.00 0.00 0.00 0.00 0.00
SINGUR 1.98 0.00 0.00 0.00 0.00 0.00 0.00 0.00
SSLM LCPH 610.39 0.00 0.00 0.00 0.00 0.00 0.00 0.00
# Refer to Notes for the definition
Availability and Dispatch
(MU) Cost (Rs. Crs.)
Unit Cost
(Rs. / kWh)
NOT APPLICABLE

Nagarjunasagar Tail Pond Dam Power
House 0.00 0.00 0.00 0.00 0.00 0.00 0.00 0.00
Priyadarshini Jurala Hydro Electric Project-
AP Share 122.73 0.00 0.00 0.00 0.00 0.00 0.00 0.00
Lower Jurala Hydro Electric Project 0.00 0.00 0.00 0.00 0.00 0.00 0.00 0.00
8.84 0.00 0.00 0.00 0.00 0.00 0.00 0.00
0.00 0.00 0.00 0.00 0.00 0.00 0.00 0.00
TOTAL HYDRO 0.00 0.00 3270.96 0.00 0.00 0.00 0.00 0.00 0.00 0.00 0.00 0.00 0.00 0.00 0.00 0.00
TOTAL TSGENCO 0.00 0.00 16384.40 0.00 0.00 0.00 0.00 0.00 0.00 0.00 0.00 0.00 0.00 0.00 0.00 0.00
Central Generating Stations
NTPC
NTPC (SR)
NTPC (SR) 2188.24 0.00 0.00 0.00 0.00 0.00 0.00 0.00
NTPC (SR) Stage III 610.35 0.00 0.00 0.00 0.00 0.00 0.00 0.00
Total NTPC(SR) 0.00 0.00 2798.59 0.00 0.00 0.00 0.00 0.00 0.00 0.00 0.00 0.00 0.00 0.00 0.00 0.00
NTPC (ER)
Farakka 9.42 0.00 0.00 0.00 0.00 0.00 0.00 0.00
Kahalgaon 4.19 0.00 0.00 0.00 0.00 0.00 0.00 0.00
Talcher - Stage 1 6.07 0.00 0.00 0.00 0.00 0.00 0.00 0.00
Talcher Stage 2 1255.09 0.00 0.00 0.00 0.00 0.00 0.00 0.00
Others 0.00 0.00 0.00 0.00 0.00 0.00 0.00 0.00
Total NTPC(ER) 0.00 0.00 1274.78 0.00 0.00 0.00 0.00 0.00 0.00 0.00 0.00 0.00 0.00 0.00 0.00 0.00
Total NTPC 0.00 0.00 4073.37 0.00 0.00 0.00 0.00 0.00 0.00 0.00 0.00 0.00 0.00 0.00 0.00 0.00
NLC TS-II
Stage-I 377.48 0.00 0.00 0.00 0.00 0.00 0.00 0.00
Stage-II 660.13 0.00 0.00 0.00 0.00 0.00 0.00 0.00
Total NLC 0.00 0.00 1037.61 0.00 0.00 0.00 0.00 0.00 0.00 0.00 0.00 0.00 0.00 0.00 0.00 0.00
NPC
NPC-MAPS 80.58 0.00 0.00 0.00 0.00 0.00 0.00 0.00
NPC-Kaiga unit I 430.51 0.00 0.00 0.00 0.00 0.00 0.00 0.00
NPC-Kaiga unit II 436.84 0.00 0.00 0.00 0.00 0.00 0.00 0.00
Total NPC 0.00 0.00 947.93 0.00 0.00 0.00 0.00 0.00 0.00 0.00 0.00 0.00 0.00 0.00 0.00 0.00
NTPC - Simhadri
NTPC Simhadri Stage I 3305.53 0.00 0.00 0.00 0.00 0.00 0.00 0.00
NTPC Simhadri Stage II 1470.36 0.00 0.00 0.00 0.00 0.00 0.00 0.00
Total NTPC- Simhadri 0.00 0.00 4775.89 0.00 0.00 0.00 0.00 0.00 0.00 0.00 0.00 0.00 0.00 0.00 0.00 0.00
CGS - New
241.51 0.00 0.00 0.00 0.00 0.00 0.00 0.00
0.00 0.00 0.00 0.00 0.00 0.00 0.00 0.00
0.00 0.00 0.00 0.00 0.00 0.00 0.00 0.00
0.00 0.00 0.00 0.00 0.00 0.00 0.00 0.00
0.00 0.00 0.00 0.00 0.00 0.00 0.00 0.00
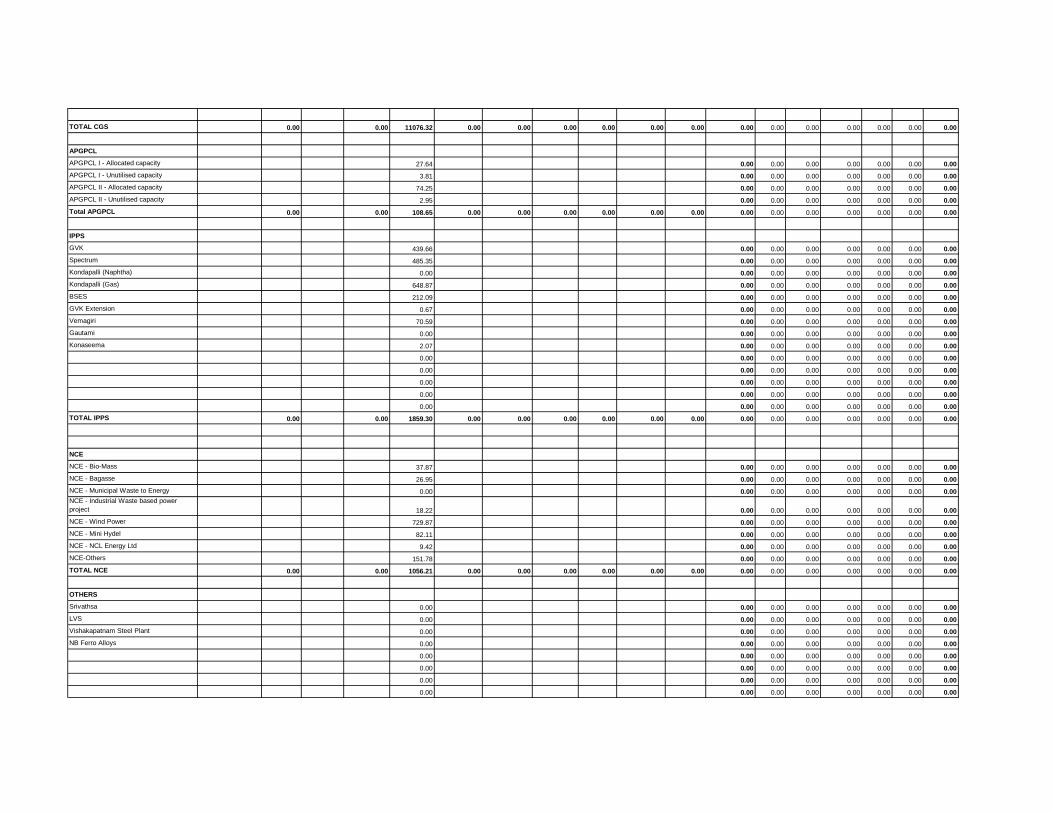
TOTAL CGS 0.00 0.00 11076.32 0.00 0.00 0.00 0.00 0.00 0.00 0.00 0.00 0.00 0.00 0.00 0.00 0.00
APGPCL
APGPCL I - Allocated capacity 27.64 0.00 0.00 0.00 0.00 0.00 0.00 0.00
APGPCL I - Unutilised capacity 3.81 0.00 0.00 0.00 0.00 0.00 0.00 0.00
APGPCL II - Allocated capacity 74.25 0.00 0.00 0.00 0.00 0.00 0.00 0.00
APGPCL II - Unutilised capacity 2.95 0.00 0.00 0.00 0.00 0.00 0.00 0.00
Total APGPCL 0.00 0.00 108.65 0.00 0.00 0.00 0.00 0.00 0.00 0.00 0.00 0.00 0.00 0.00 0.00 0.00
IPPS
GVK 439.66 0.00 0.00 0.00 0.00 0.00 0.00 0.00
Spectrum 485.35 0.00 0.00 0.00 0.00 0.00 0.00 0.00
Kondapalli (Naphtha) 0.00 0.00 0.00 0.00 0.00 0.00 0.00 0.00
Kondapalli (Gas) 648.87 0.00 0.00 0.00 0.00 0.00 0.00 0.00
BSES 212.09 0.00 0.00 0.00 0.00 0.00 0.00 0.00
GVK Extension 0.67 0.00 0.00 0.00 0.00 0.00 0.00 0.00
Vemagiri 70.59 0.00 0.00 0.00 0.00 0.00 0.00 0.00
Gautami 0.00 0.00 0.00 0.00 0.00 0.00 0.00 0.00
Konaseema 2.07 0.00 0.00 0.00 0.00 0.00 0.00 0.00
0.00 0.00 0.00 0.00 0.00 0.00 0.00 0.00
0.00 0.00 0.00 0.00 0.00 0.00 0.00 0.00
0.00 0.00 0.00 0.00 0.00 0.00 0.00 0.00
0.00 0.00 0.00 0.00 0.00 0.00 0.00 0.00
0.00 0.00 0.00 0.00 0.00 0.00 0.00 0.00
TOTAL IPPS 0.00 0.00 1859.30 0.00 0.00 0.00 0.00 0.00 0.00 0.00 0.00 0.00 0.00 0.00 0.00 0.00
NCE
NCE - Bio-Mass 37.87 0.00 0.00 0.00 0.00 0.00 0.00 0.00
NCE - Bagasse 26.95 0.00 0.00 0.00 0.00 0.00 0.00 0.00
NCE - Municipal Waste to Energy 0.00 0.00 0.00 0.00 0.00 0.00 0.00 0.00
NCE - Industrial Waste based power
project 18.22 0.00 0.00 0.00 0.00 0.00 0.00 0.00
NCE - Wind Power 729.87 0.00 0.00 0.00 0.00 0.00 0.00 0.00
NCE - Mini Hydel 82.11 0.00 0.00 0.00 0.00 0.00 0.00 0.00
NCE - NCL Energy Ltd 9.42 0.00 0.00 0.00 0.00 0.00 0.00 0.00
NCE-Others 151.78 0.00 0.00 0.00 0.00 0.00 0.00 0.00
TOTAL NCE 0.00 0.00 1056.21 0.00 0.00 0.00 0.00 0.00 0.00 0.00 0.00 0.00 0.00 0.00 0.00 0.00
OTHERS
Srivathsa 0.00 0.00 0.00 0.00 0.00 0.00 0.00 0.00
LVS 0.00 0.00 0.00 0.00 0.00 0.00 0.00 0.00
Vishakapatnam Steel Plant 0.00 0.00 0.00 0.00 0.00 0.00 0.00 0.00
NB Ferro Alloys 0.00 0.00 0.00 0.00 0.00 0.00 0.00 0.00
0.00 0.00 0.00 0.00 0.00 0.00 0.00 0.00
0.00 0.00 0.00 0.00 0.00 0.00 0.00 0.00
0.00 0.00 0.00 0.00 0.00 0.00 0.00 0.00
0.00 0.00 0.00 0.00 0.00 0.00 0.00 0.00

0.00 0.00 0.00 0.00 0.00 0.00 0.00 0.00
0.00 0.00 0.00 0.00 0.00 0.00 0.00 0.00
0.00 0.00 0.00 0.00 0.00 0.00 0.00 0.00
TOTAL OTHERS 0.00 0.00 0.00 0.00 0.00 0.00 0.00 0.00 0.00 0.00 0.00 0.00 0.00 0.00 0.00 0.00
MARKET
PTC 0.00 0.00 0.00 0.00 0.00 0.00 0.00 0.00
RCL and Short-Term Sources(IG
Wells,Kesoram) 0.00 0.00 0.00 0.00 0.00 0.00 0.00 0.00
CPDCL 0.00 0.00 0.00 0.00 0.00 0.00 0.00 0.00
EPDCL 0.00 0.00 0.00 0.00 0.00 0.00 0.00 0.00
NPDCL 0.00 0.00 0.00 0.00 0.00 0.00 0.00 0.00
SPDCL 0.00 0.00 0.00 0.00 0.00 0.00 0.00 0.00
UI 0.00 0.00 0.00 0.00 0.00 0.00 0.00 0.00
Other Short Term Sources 6587.13 0.00 0.00 0.00 0.00 0.00 0.00 0.00
751.87 0.00 0.00 0.00 0.00 0.00 0.00 0.00
0.00 0.00 0.00 0.00 0.00 0.00 0.00 0.00
0.00 0.00 0.00 0.00 0.00 0.00 0.00 0.00
0.00 0.00 0.00 0.00 0.00 0.00 0.00 0.00
0.00 0.00 0.00 0.00 0.00 0.00 0.00 0.00
0.00 0.00 0.00 0.00 0.00 0.00 0.00 0.00
-191.20 0.00 0.00 0.00 0.00 0.00 0.00 0.00
TOTAL MARKET 0.00 0.00 7147.80 0.00 0.00 0.00 0.00 0.00 0.00 0.00 0.00 0.00 0.00 0.00 0.00 0.00
TOTAL (From All Sources) 0.00 0.00 37632.68 0.00 0.00 0.00 0.00 0.00 0.00 0.00 0.00 0.00 0.00 0.00 0.00 0.00
2014-15
Generating Station
Plant Type
Must Run = 1
Others = 2
Plant
Capacity
DISCOM's
share
DISCOM's
share
(MW) (%) (MW) Net Availability Dispatch Fixed Variable Incentive Income Tax Others Total Fixed Incentives Income Tax Others Variable Total
TSGENCO
Thermal
VTPS I 3066.44 0.00 0.00 0.00 0.00 0.00 0.00 0.00
VTPS II 0.00 0.00 0.00 0.00 0.00 0.00 0.00 0.00
VTPS III 0.00 0.00 0.00 0.00 0.00 0.00 0.00 0.00
VTPS IV 1284.06 0.00 0.00 0.00 0.00 0.00 0.00 0.00
RTPP I 898.66 0.00 0.00 0.00 0.00 0.00 0.00 0.00
RTPP Stage-II 1021.71 0.00 0.00 0.00 0.00 0.00 0.00 0.00
RTPP Stage-III 476.99 0.00 0.00 0.00 0.00 0.00 0.00 0.00
KTPS A 1500.59 0.00 0.00 0.00 0.00 0.00 0.00 0.00
KTPS B 0.00 0.00 0.00 0.00 0.00 0.00 0.00 0.00
KTPS C 0.00 0.00 0.00 0.00 0.00 0.00 0.00 0.00
KTPS D 1176.04 0.00 0.00 0.00 0.00 0.00 0.00 0.00
Note: Hydro cost break up details need to be provided based on appropriate methodology. In case it is not possible to
segregate the cost
station wise, provide the total details in the empty rows in the TSGENCO Hydro stations section saying ALL
Availability and Dispatch
(MU) Cost (Rs. Crs.)
Unit Cost
(Rs. / kWh)

KTPS Stage VI 1398.74 0.00 0.00 0.00 0.00 0.00 0.00 0.00
RTS B 64.48 0.00 0.00 0.00 0.00 0.00 0.00 0.00
NTS 0.00 0.00 0.00 0.00 0.00 0.00 0.00 0.00
Kakatiya Thermal Power Plant Stage I 1468.10 0.00 0.00 0.00 0.00 0.00 0.00 0.00
Kakatiya Thermal Power Plant Stage II 0.00 0.00 0.00 0.00 0.00 0.00 0.00 0.00
0.00 0.00 0.00 0.00 0.00 0.00 0.00 0.00
0.00 0.00 0.00 0.00 0.00 0.00 0.00 0.00
TOTAL THERMAL 0.00 0.00 12355.83 0.00 0.00 0.00 0.00 0.00 0.00 0.00 0.00 0.00 0.00 0.00 0.00 0.00
MACHKUND PH AP Share 69.21 0.00 0.00 0.00 0.00 0.00 0.00 0.00
TUNGBHADRA PH AP Share 51.23 0.00 0.00 0.00 0.00 0.00 0.00 0.00
USL 36.82 0.00 0.00 0.00 0.00 0.00 0.00 0.00
LSR 100.77 0.00 0.00 0.00 0.00 0.00 0.00 0.00
DONKARAYI 10.05 0.00 0.00 0.00 0.00 0.00 0.00 0.00
SSLM 35.26 0.00 0.00 0.00 0.00 0.00 0.00 0.00
NSPH 387.16 0.00 0.00 0.00 0.00 0.00 0.00 0.00
NSRCPH 0.00 0.00 0.00 0.00 0.00 0.00 0.00 0.00
NSLCPH 16.53 0.00 0.00 0.00 0.00 0.00 0.00 0.00
POCHAMPAD PH 3.45 0.00 0.00 0.00 0.00 0.00 0.00 0.00
NIZAMSAGAR PH 1.60 0.00 0.00 0.00 0.00 0.00 0.00 0.00
PABM -0.03 0.00 0.00 0.00 0.00 0.00 0.00 0.00
MINI HYDRO&OTHERS 0.28 0.00 0.00 0.00 0.00 0.00 0.00 0.00
SINGUR 2.41 0.00 0.00 0.00 0.00 0.00 0.00 0.00
SSLM LCPH 682.92 0.00 0.00 0.00 0.00 0.00 0.00 0.00
Nagarjunasagar Tail Pond Dam Power
House 0.00 0.00 0.00 0.00 0.00 0.00 0.00 0.00
Priyadarshini Jurala Hydro Electric Project-
AP Share 0.00 0.00 0.00 0.00 0.00 0.00 0.00 0.00
Lower Jurala Hydro Electric Project 79.98 0.00 0.00 0.00 0.00 0.00 0.00 0.00
1.28 0.00 0.00 0.00 0.00 0.00 0.00 0.00
0.00 0.00 0.00 0.00 0.00 0.00 0.00 0.00
TOTAL HYDRO 0.00 0.00 1478.92 0.00 0.00 0.00 0.00 0.00 0.00 0.00 0.00 0.00 0.00 0.00 0.00 0.00
TOTAL TSGENCO 0.00 0.00 13834.75 0.00 0.00 0.00 0.00 0.00 0.00 0.00 0.00 0.00 0.00 0.00 0.00 0.00
Central Generating Stations
NTPC
NTPC (SR)
NTPC (SR) 1944.62 0.00 0.00 0.00 0.00 0.00 0.00 0.00
NTPC (SR) Stage III 490.47 0.00 0.00 0.00 0.00 0.00 0.00 0.00
Total NTPC(SR) 0.00 0.00 2435.08 0.00 0.00 0.00 0.00 0.00 0.00 0.00 0.00 0.00 0.00 0.00 0.00 0.00
NTPC (ER)
Farakka 0.00 0.00 0.00 0.00 0.00 0.00 0.00 0.00
Kahalgaon 0.00 0.00 0.00 0.00 0.00 0.00 0.00 0.00
Talcher - Stage 1 0.00 0.00 0.00 0.00 0.00 0.00 0.00 0.00
Talcher Stage 2 1154.23 0.00 0.00 0.00 0.00 0.00 0.00 0.00
Others 0.00 0.00 0.00 0.00 0.00 0.00 0.00 0.00
Total NTPC(ER) 0.00 0.00 1154.23 0.00 0.00 0.00 0.00 0.00 0.00 0.00 0.00 0.00 0.00 0.00 0.00 0.00

Total NTPC 0.00 0.00 3589.31 0.00 0.00 0.00 0.00 0.00 0.00 0.00 0.00 0.00 0.00 0.00 0.00 0.00
NLC TS-II
Stage-I 308.22 0.00 0.00 0.00 0.00 0.00 0.00 0.00
Stage-II 539.20 0.00 0.00 0.00 0.00 0.00 0.00 0.00
Total NLC 0.00 0.00 847.41 0.00 0.00 0.00 0.00 0.00 0.00 0.00 0.00 0.00 0.00 0.00 0.00 0.00
NPC
NPC-MAPS 83.02 0.00 0.00 0.00 0.00 0.00 0.00 0.00
NPC-Kaiga unit I 330.83 0.00 0.00 0.00 0.00 0.00 0.00 0.00
NPC-Kaiga unit II 374.49 0.00 0.00 0.00 0.00 0.00 0.00 0.00
Total NPC 0.00 0.00 788.34 0.00 0.00 0.00 0.00 0.00 0.00 0.00 0.00 0.00 0.00 0.00 0.00 0.00
NTPC - Simhadri
NTPC Simhadri Stage I 2799.97 0.00 0.00 0.00 0.00 0.00 0.00 0.00
NTPC Simhadri Stage II 1232.92 0.00 0.00 0.00 0.00 0.00 0.00 0.00
Total NTPC- Simhadri 0.00 0.00 4032.89 0.00 0.00 0.00 0.00 0.00 0.00 0.00 0.00 0.00 0.00 0.00 0.00 0.00
CGS - New
307.46 0.00 0.00 0.00 0.00 0.00 0.00 0.00
173.90 0.00 0.00 0.00 0.00 0.00 0.00 0.00
0.00 0.00 0.00 0.00 0.00 0.00 0.00 0.00
0.00 0.00 0.00 0.00 0.00 0.00 0.00 0.00
0.00 0.00 0.00 0.00 0.00 0.00 0.00 0.00
TOTAL CGS 0.00 0.00 9739.32 0.00 0.00 0.00 0.00 0.00 0.00 0.00 0.00 0.00 0.00 0.00 0.00 0.00
APGPCL
APGPCL I - Allocated capacity 11.78 0.00 0.00 0.00 0.00 0.00 0.00 0.00
APGPCL I - Unutilised capacity 0.58 0.00 0.00 0.00 0.00 0.00 0.00 0.00
APGPCL II - Allocated capacity 39.94 0.00 0.00 0.00 0.00 0.00 0.00 0.00
APGPCL II - Unutilised capacity 0.52 0.00 0.00 0.00 0.00 0.00 0.00 0.00
Total APGPCL 0.00 0.00 52.82 0.00 0.00 0.00 0.00 0.00 0.00 0.00 0.00 0.00 0.00 0.00 0.00 0.00
IPPS
GVK 220.02 0.00 0.00 0.00 0.00 0.00 0.00 0.00
Spectrum 208.04 0.00 0.00 0.00 0.00 0.00 0.00 0.00
Kondapalli (Naphtha) 0.00 0.00 0.00 0.00 0.00 0.00 0.00 0.00
Kondapalli (Gas) 191.03 0.00 0.00 0.00 0.00 0.00 0.00 0.00
BSES 63.53 0.00 0.00 0.00 0.00 0.00 0.00 0.00
GVK Extension 0.00 0.00 0.00 0.00 0.00 0.00 0.00 0.00
Vemagiri 0.00 0.00 0.00 0.00 0.00 0.00 0.00 0.00
Gautami 0.00 0.00 0.00 0.00 0.00 0.00 0.00 0.00
Konaseema 0.00 0.00 0.00 0.00 0.00 0.00 0.00 0.00
0.00 0.00 0.00 0.00 0.00 0.00 0.00 0.00
0.00 0.00 0.00 0.00 0.00 0.00 0.00 0.00
0.00 0.00 0.00 0.00 0.00 0.00 0.00 0.00
0.00 0.00 0.00 0.00 0.00 0.00 0.00 0.00
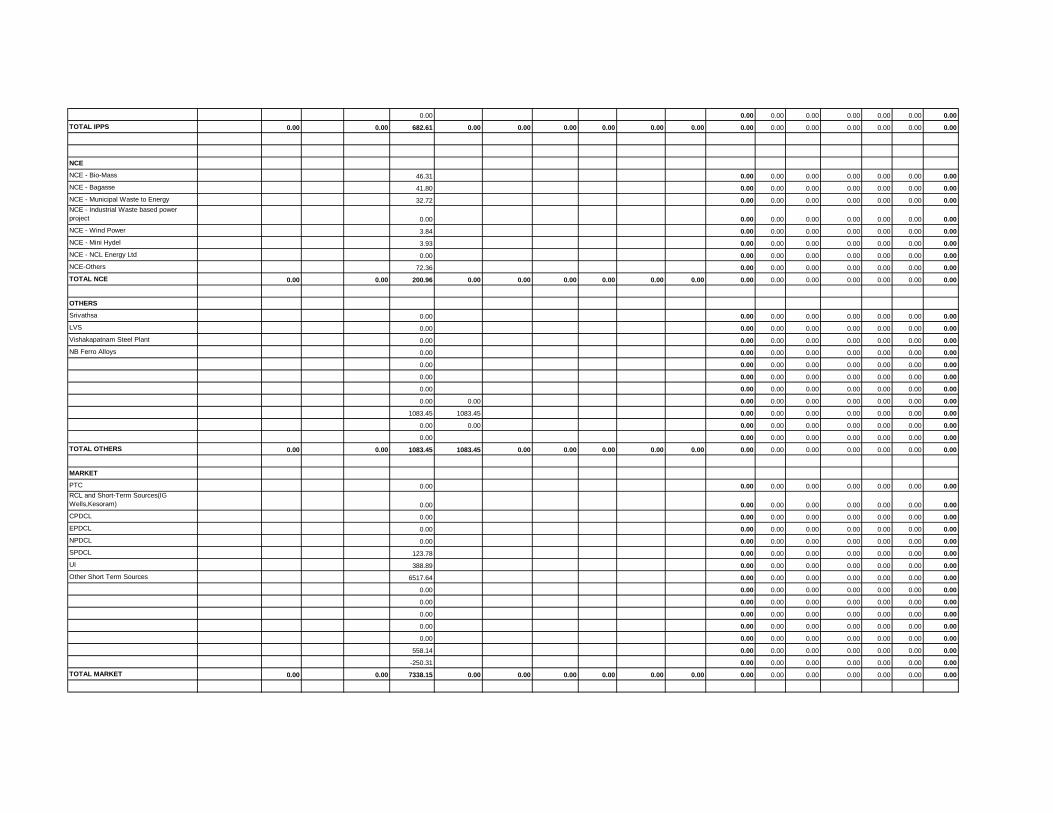
0.00 0.00 0.00 0.00 0.00 0.00 0.00 0.00
TOTAL IPPS 0.00 0.00 682.61 0.00 0.00 0.00 0.00 0.00 0.00 0.00 0.00 0.00 0.00 0.00 0.00 0.00
NCE
NCE - Bio-Mass 46.31 0.00 0.00 0.00 0.00 0.00 0.00 0.00
NCE - Bagasse 41.80 0.00 0.00 0.00 0.00 0.00 0.00 0.00
NCE - Municipal Waste to Energy 32.72 0.00 0.00 0.00 0.00 0.00 0.00 0.00
NCE - Industrial Waste based power
project 0.00 0.00 0.00 0.00 0.00 0.00 0.00 0.00
NCE - Wind Power 3.84 0.00 0.00 0.00 0.00 0.00 0.00 0.00
NCE - Mini Hydel 3.93 0.00 0.00 0.00 0.00 0.00 0.00 0.00
NCE - NCL Energy Ltd 0.00 0.00 0.00 0.00 0.00 0.00 0.00 0.00
NCE-Others 72.36 0.00 0.00 0.00 0.00 0.00 0.00 0.00
TOTAL NCE 0.00 0.00 200.96 0.00 0.00 0.00 0.00 0.00 0.00 0.00 0.00 0.00 0.00 0.00 0.00 0.00
OTHERS
Srivathsa 0.00 0.00 0.00 0.00 0.00 0.00 0.00 0.00
LVS 0.00 0.00 0.00 0.00 0.00 0.00 0.00 0.00
Vishakapatnam Steel Plant 0.00 0.00 0.00 0.00 0.00 0.00 0.00 0.00
NB Ferro Alloys 0.00 0.00 0.00 0.00 0.00 0.00 0.00 0.00
0.00 0.00 0.00 0.00 0.00 0.00 0.00 0.00
0.00 0.00 0.00 0.00 0.00 0.00 0.00 0.00
0.00 0.00 0.00 0.00 0.00 0.00 0.00 0.00
0.00 0.00 0.00 0.00 0.00 0.00 0.00 0.00 0.00
1083.45 1083.45 0.00 0.00 0.00 0.00 0.00 0.00 0.00
0.00 0.00 0.00 0.00 0.00 0.00 0.00 0.00 0.00
0.00 0.00 0.00 0.00 0.00 0.00 0.00 0.00
TOTAL OTHERS 0.00 0.00 1083.45 1083.45 0.00 0.00 0.00 0.00 0.00 0.00 0.00 0.00 0.00 0.00 0.00 0.00
MARKET
PTC 0.00 0.00 0.00 0.00 0.00 0.00 0.00 0.00
RCL and Short-Term Sources(IG
Wells,Kesoram) 0.00 0.00 0.00 0.00 0.00 0.00 0.00 0.00
CPDCL 0.00 0.00 0.00 0.00 0.00 0.00 0.00 0.00
EPDCL 0.00 0.00 0.00 0.00 0.00 0.00 0.00 0.00
NPDCL 0.00 0.00 0.00 0.00 0.00 0.00 0.00 0.00
SPDCL 123.78 0.00 0.00 0.00 0.00 0.00 0.00 0.00
UI 388.89 0.00 0.00 0.00 0.00 0.00 0.00 0.00
Other Short Term Sources 6517.64 0.00 0.00 0.00 0.00 0.00 0.00 0.00
0.00 0.00 0.00 0.00 0.00 0.00 0.00 0.00
0.00 0.00 0.00 0.00 0.00 0.00 0.00 0.00
0.00 0.00 0.00 0.00 0.00 0.00 0.00 0.00
0.00 0.00 0.00 0.00 0.00 0.00 0.00 0.00
0.00 0.00 0.00 0.00 0.00 0.00 0.00 0.00
558.14 0.00 0.00 0.00 0.00 0.00 0.00 0.00
-250.31 0.00 0.00 0.00 0.00 0.00 0.00 0.00
TOTAL MARKET 0.00 0.00 7338.15 0.00 0.00 0.00 0.00 0.00 0.00 0.00 0.00 0.00 0.00 0.00 0.00 0.00
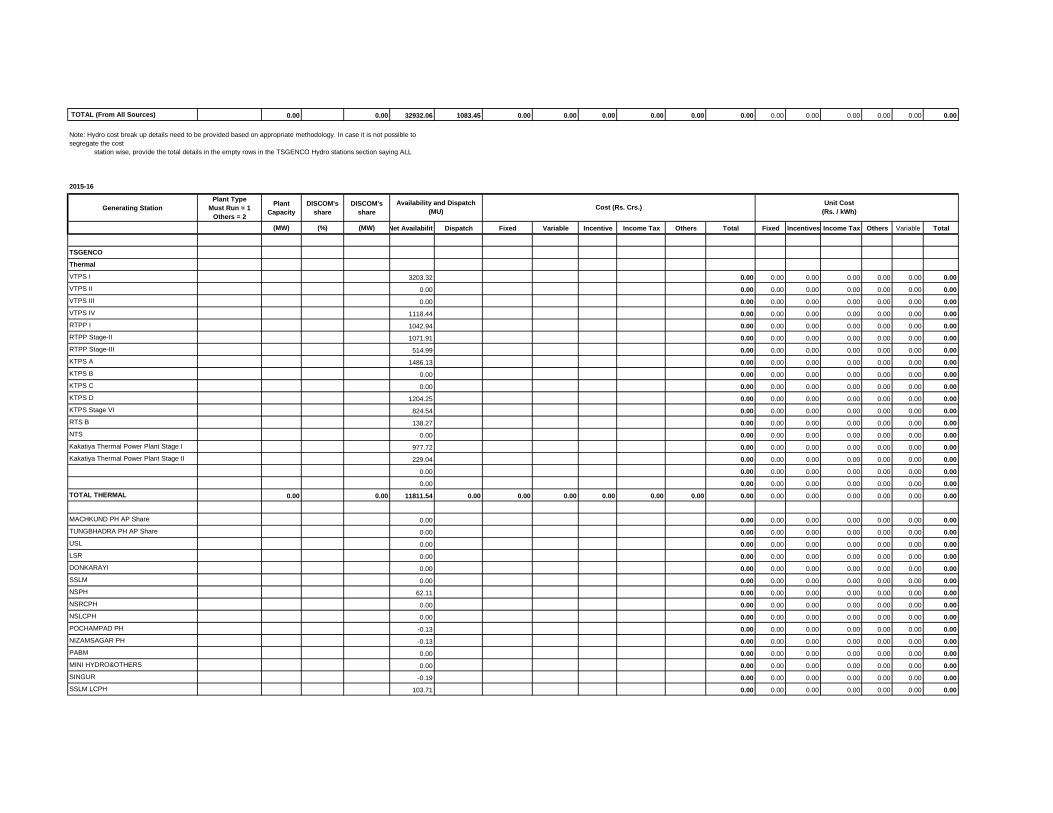
TOTAL (From All Sources) 0.00 0.00 32932.06 1083.45 0.00 0.00 0.00 0.00 0.00 0.00 0.00 0.00 0.00 0.00 0.00 0.00
2015-16
Generating Station
Plant Type
Must Run = 1
Others = 2
Plant
Capacity
DISCOM's
share
DISCOM's
share
(MW) (%) (MW) Net Availability Dispatch Fixed Variable Incentive Income Tax Others Total Fixed Incentives Income Tax Others Variable Total
TSGENCO
Thermal
VTPS I 3203.32 0.00 0.00 0.00 0.00 0.00 0.00 0.00
VTPS II 0.00 0.00 0.00 0.00 0.00 0.00 0.00 0.00
VTPS III 0.00 0.00 0.00 0.00 0.00 0.00 0.00 0.00
VTPS IV 1118.44 0.00 0.00 0.00 0.00 0.00 0.00 0.00
RTPP I 1042.94 0.00 0.00 0.00 0.00 0.00 0.00 0.00
RTPP Stage-II 1071.91 0.00 0.00 0.00 0.00 0.00 0.00 0.00
RTPP Stage-III 514.99 0.00 0.00 0.00 0.00 0.00 0.00 0.00
KTPS A 1486.13 0.00 0.00 0.00 0.00 0.00 0.00 0.00
KTPS B 0.00 0.00 0.00 0.00 0.00 0.00 0.00 0.00
KTPS C 0.00 0.00 0.00 0.00 0.00 0.00 0.00 0.00
KTPS D 1204.25 0.00 0.00 0.00 0.00 0.00 0.00 0.00
KTPS Stage VI 824.54 0.00 0.00 0.00 0.00 0.00 0.00 0.00
RTS B 138.27 0.00 0.00 0.00 0.00 0.00 0.00 0.00
NTS 0.00 0.00 0.00 0.00 0.00 0.00 0.00 0.00
Kakatiya Thermal Power Plant Stage I 977.72 0.00 0.00 0.00 0.00 0.00 0.00 0.00
Kakatiya Thermal Power Plant Stage II 229.04 0.00 0.00 0.00 0.00 0.00 0.00 0.00
0.00 0.00 0.00 0.00 0.00 0.00 0.00 0.00
0.00 0.00 0.00 0.00 0.00 0.00 0.00 0.00
TOTAL THERMAL 0.00 0.00 11811.54 0.00 0.00 0.00 0.00 0.00 0.00 0.00 0.00 0.00 0.00 0.00 0.00 0.00
MACHKUND PH AP Share 0.00 0.00 0.00 0.00 0.00 0.00 0.00 0.00
TUNGBHADRA PH AP Share 0.00 0.00 0.00 0.00 0.00 0.00 0.00 0.00
USL 0.00 0.00 0.00 0.00 0.00 0.00 0.00 0.00
LSR 0.00 0.00 0.00 0.00 0.00 0.00 0.00 0.00
DONKARAYI 0.00 0.00 0.00 0.00 0.00 0.00 0.00 0.00
SSLM 0.00 0.00 0.00 0.00 0.00 0.00 0.00 0.00
NSPH 62.11 0.00 0.00 0.00 0.00 0.00 0.00 0.00
NSRCPH 0.00 0.00 0.00 0.00 0.00 0.00 0.00 0.00
NSLCPH 0.00 0.00 0.00 0.00 0.00 0.00 0.00 0.00
POCHAMPAD PH -0.13 0.00 0.00 0.00 0.00 0.00 0.00 0.00
NIZAMSAGAR PH -0.13 0.00 0.00 0.00 0.00 0.00 0.00 0.00
PABM 0.00 0.00 0.00 0.00 0.00 0.00 0.00 0.00
MINI HYDRO&OTHERS 0.00 0.00 0.00 0.00 0.00 0.00 0.00 0.00
SINGUR -0.19 0.00 0.00 0.00 0.00 0.00 0.00 0.00
SSLM LCPH 103.71 0.00 0.00 0.00 0.00 0.00 0.00 0.00
Note: Hydro cost break up details need to be provided based on appropriate methodology. In case it is not possible to
segregate the cost
station wise, provide the total details in the empty rows in the TSGENCO Hydro stations section saying ALL
Availability and Dispatch
(MU) Cost (Rs. Crs.)
Unit Cost
(Rs. / kWh)
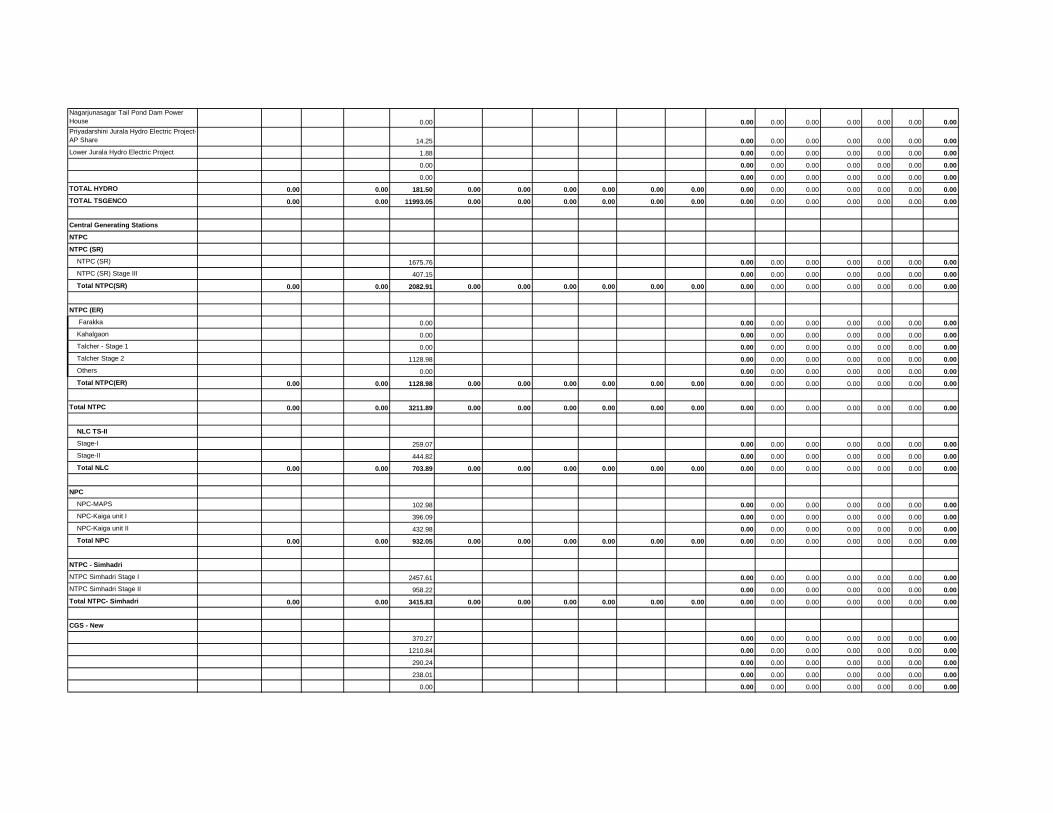
Nagarjunasagar Tail Pond Dam Power
House 0.00 0.00 0.00 0.00 0.00 0.00 0.00 0.00
Priyadarshini Jurala Hydro Electric Project-
AP Share 14.25 0.00 0.00 0.00 0.00 0.00 0.00 0.00
Lower Jurala Hydro Electric Project 1.88 0.00 0.00 0.00 0.00 0.00 0.00 0.00
0.00 0.00 0.00 0.00 0.00 0.00 0.00 0.00
0.00 0.00 0.00 0.00 0.00 0.00 0.00 0.00
TOTAL HYDRO 0.00 0.00 181.50 0.00 0.00 0.00 0.00 0.00 0.00 0.00 0.00 0.00 0.00 0.00 0.00 0.00
TOTAL TSGENCO 0.00 0.00 11993.05 0.00 0.00 0.00 0.00 0.00 0.00 0.00 0.00 0.00 0.00 0.00 0.00 0.00
Central Generating Stations
NTPC
NTPC (SR)
NTPC (SR) 1675.76 0.00 0.00 0.00 0.00 0.00 0.00 0.00
NTPC (SR) Stage III 407.15 0.00 0.00 0.00 0.00 0.00 0.00 0.00
Total NTPC(SR) 0.00 0.00 2082.91 0.00 0.00 0.00 0.00 0.00 0.00 0.00 0.00 0.00 0.00 0.00 0.00 0.00
NTPC (ER)
Farakka 0.00 0.00 0.00 0.00 0.00 0.00 0.00 0.00
Kahalgaon 0.00 0.00 0.00 0.00 0.00 0.00 0.00 0.00
Talcher - Stage 1 0.00 0.00 0.00 0.00 0.00 0.00 0.00 0.00
Talcher Stage 2 1128.98 0.00 0.00 0.00 0.00 0.00 0.00 0.00
Others 0.00 0.00 0.00 0.00 0.00 0.00 0.00 0.00
Total NTPC(ER) 0.00 0.00 1128.98 0.00 0.00 0.00 0.00 0.00 0.00 0.00 0.00 0.00 0.00 0.00 0.00 0.00
Total NTPC 0.00 0.00 3211.89 0.00 0.00 0.00 0.00 0.00 0.00 0.00 0.00 0.00 0.00 0.00 0.00 0.00
NLC TS-II
Stage-I 259.07 0.00 0.00 0.00 0.00 0.00 0.00 0.00
Stage-II 444.82 0.00 0.00 0.00 0.00 0.00 0.00 0.00
Total NLC 0.00 0.00 703.89 0.00 0.00 0.00 0.00 0.00 0.00 0.00 0.00 0.00 0.00 0.00 0.00 0.00
NPC
NPC-MAPS 102.98 0.00 0.00 0.00 0.00 0.00 0.00 0.00
NPC-Kaiga unit I 396.09 0.00 0.00 0.00 0.00 0.00 0.00 0.00
NPC-Kaiga unit II 432.98 0.00 0.00 0.00 0.00 0.00 0.00 0.00
Total NPC 0.00 0.00 932.05 0.00 0.00 0.00 0.00 0.00 0.00 0.00 0.00 0.00 0.00 0.00 0.00 0.00
NTPC - Simhadri
NTPC Simhadri Stage I 2457.61 0.00 0.00 0.00 0.00 0.00 0.00 0.00
NTPC Simhadri Stage II 958.22 0.00 0.00 0.00 0.00 0.00 0.00 0.00
Total NTPC- Simhadri 0.00 0.00 3415.83 0.00 0.00 0.00 0.00 0.00 0.00 0.00 0.00 0.00 0.00 0.00 0.00 0.00
CGS - New
370.27 0.00 0.00 0.00 0.00 0.00 0.00 0.00
1210.84 0.00 0.00 0.00 0.00 0.00 0.00 0.00
290.24 0.00 0.00 0.00 0.00 0.00 0.00 0.00
238.01 0.00 0.00 0.00 0.00 0.00 0.00 0.00
0.00 0.00 0.00 0.00 0.00 0.00 0.00 0.00
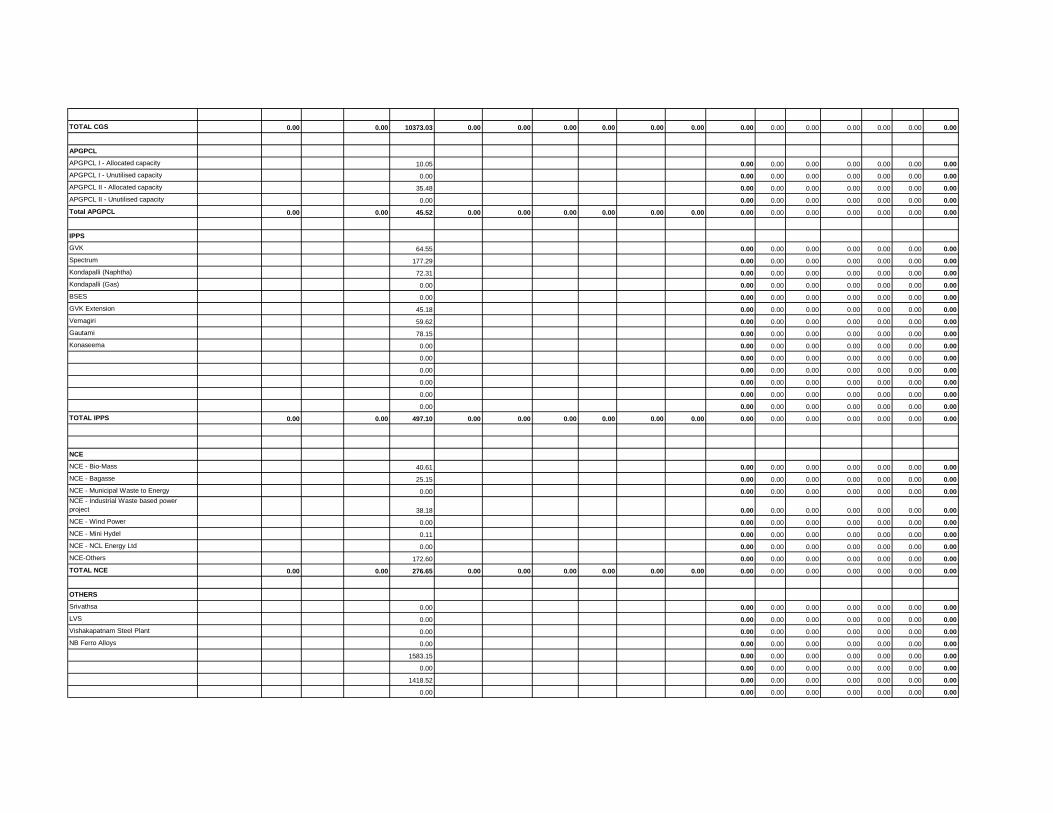
TOTAL CGS 0.00 0.00 10373.03 0.00 0.00 0.00 0.00 0.00 0.00 0.00 0.00 0.00 0.00 0.00 0.00 0.00
APGPCL
APGPCL I - Allocated capacity 10.05 0.00 0.00 0.00 0.00 0.00 0.00 0.00
APGPCL I - Unutilised capacity 0.00 0.00 0.00 0.00 0.00 0.00 0.00 0.00
APGPCL II - Allocated capacity 35.48 0.00 0.00 0.00 0.00 0.00 0.00 0.00
APGPCL II - Unutilised capacity 0.00 0.00 0.00 0.00 0.00 0.00 0.00 0.00
Total APGPCL 0.00 0.00 45.52 0.00 0.00 0.00 0.00 0.00 0.00 0.00 0.00 0.00 0.00 0.00 0.00 0.00
IPPS
GVK 64.55 0.00 0.00 0.00 0.00 0.00 0.00 0.00
Spectrum 177.29 0.00 0.00 0.00 0.00 0.00 0.00 0.00
Kondapalli (Naphtha) 72.31 0.00 0.00 0.00 0.00 0.00 0.00 0.00
Kondapalli (Gas) 0.00 0.00 0.00 0.00 0.00 0.00 0.00 0.00
BSES 0.00 0.00 0.00 0.00 0.00 0.00 0.00 0.00
GVK Extension 45.18 0.00 0.00 0.00 0.00 0.00 0.00 0.00
Vemagiri 59.62 0.00 0.00 0.00 0.00 0.00 0.00 0.00
Gautami 78.15 0.00 0.00 0.00 0.00 0.00 0.00 0.00
Konaseema 0.00 0.00 0.00 0.00 0.00 0.00 0.00 0.00
0.00 0.00 0.00 0.00 0.00 0.00 0.00 0.00
0.00 0.00 0.00 0.00 0.00 0.00 0.00 0.00
0.00 0.00 0.00 0.00 0.00 0.00 0.00 0.00
0.00 0.00 0.00 0.00 0.00 0.00 0.00 0.00
0.00 0.00 0.00 0.00 0.00 0.00 0.00 0.00
TOTAL IPPS 0.00 0.00 497.10 0.00 0.00 0.00 0.00 0.00 0.00 0.00 0.00 0.00 0.00 0.00 0.00 0.00
NCE
NCE - Bio-Mass 40.61 0.00 0.00 0.00 0.00 0.00 0.00 0.00
NCE - Bagasse 25.15 0.00 0.00 0.00 0.00 0.00 0.00 0.00
NCE - Municipal Waste to Energy 0.00 0.00 0.00 0.00 0.00 0.00 0.00 0.00
NCE - Industrial Waste based power
project 38.18 0.00 0.00 0.00 0.00 0.00 0.00 0.00
NCE - Wind Power 0.00 0.00 0.00 0.00 0.00 0.00 0.00 0.00
NCE - Mini Hydel 0.11 0.00 0.00 0.00 0.00 0.00 0.00 0.00
NCE - NCL Energy Ltd 0.00 0.00 0.00 0.00 0.00 0.00 0.00 0.00
NCE-Others 172.60 0.00 0.00 0.00 0.00 0.00 0.00 0.00
TOTAL NCE 0.00 0.00 276.65 0.00 0.00 0.00 0.00 0.00 0.00 0.00 0.00 0.00 0.00 0.00 0.00 0.00
OTHERS
Srivathsa 0.00 0.00 0.00 0.00 0.00 0.00 0.00 0.00
LVS 0.00 0.00 0.00 0.00 0.00 0.00 0.00 0.00
Vishakapatnam Steel Plant 0.00 0.00 0.00 0.00 0.00 0.00 0.00 0.00
NB Ferro Alloys 0.00 0.00 0.00 0.00 0.00 0.00 0.00 0.00
1583.15 0.00 0.00 0.00 0.00 0.00 0.00 0.00
0.00 0.00 0.00 0.00 0.00 0.00 0.00 0.00
1418.52 0.00 0.00 0.00 0.00 0.00 0.00 0.00
0.00 0.00 0.00 0.00 0.00 0.00 0.00 0.00
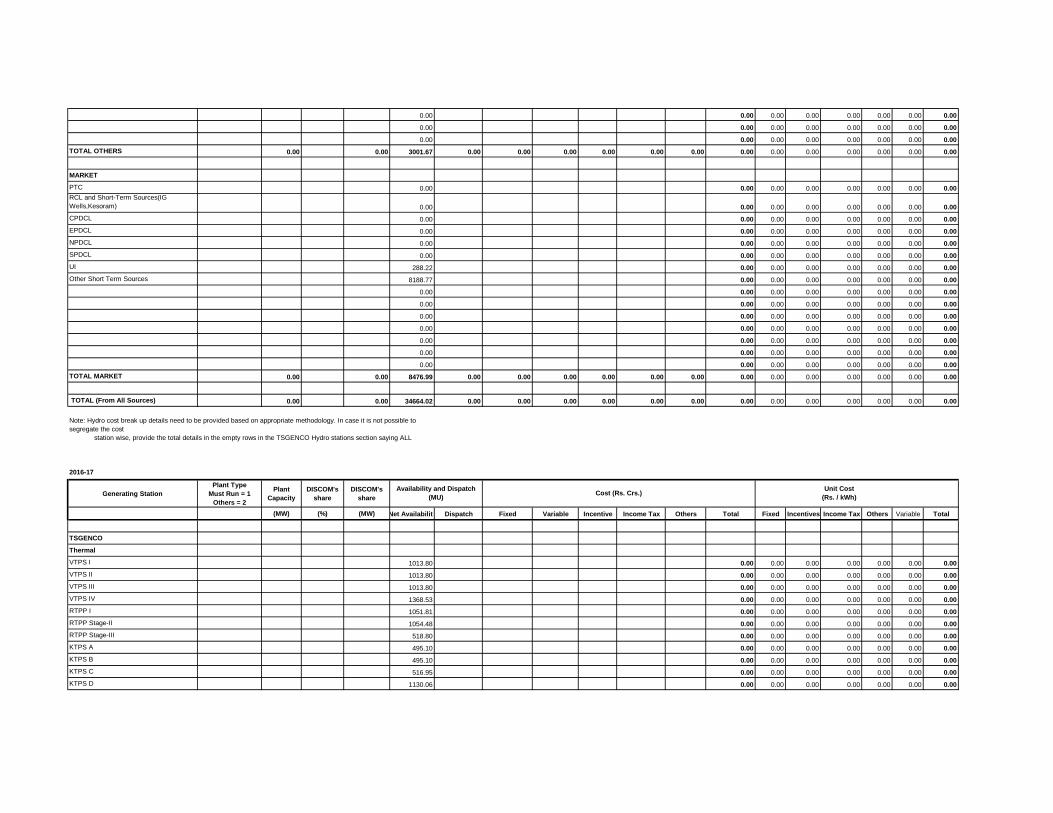
0.00 0.00 0.00 0.00 0.00 0.00 0.00 0.00
0.00 0.00 0.00 0.00 0.00 0.00 0.00 0.00
0.00 0.00 0.00 0.00 0.00 0.00 0.00 0.00
TOTAL OTHERS 0.00 0.00 3001.67 0.00 0.00 0.00 0.00 0.00 0.00 0.00 0.00 0.00 0.00 0.00 0.00 0.00
MARKET
PTC 0.00 0.00 0.00 0.00 0.00 0.00 0.00 0.00
RCL and Short-Term Sources(IG
Wells,Kesoram) 0.00 0.00 0.00 0.00 0.00 0.00 0.00 0.00
CPDCL 0.00 0.00 0.00 0.00 0.00 0.00 0.00 0.00
EPDCL 0.00 0.00 0.00 0.00 0.00 0.00 0.00 0.00
NPDCL 0.00 0.00 0.00 0.00 0.00 0.00 0.00 0.00
SPDCL 0.00 0.00 0.00 0.00 0.00 0.00 0.00 0.00
UI 288.22 0.00 0.00 0.00 0.00 0.00 0.00 0.00
Other Short Term Sources 8188.77 0.00 0.00 0.00 0.00 0.00 0.00 0.00
0.00 0.00 0.00 0.00 0.00 0.00 0.00 0.00
0.00 0.00 0.00 0.00 0.00 0.00 0.00 0.00
0.00 0.00 0.00 0.00 0.00 0.00 0.00 0.00
0.00 0.00 0.00 0.00 0.00 0.00 0.00 0.00
0.00 0.00 0.00 0.00 0.00 0.00 0.00 0.00
0.00 0.00 0.00 0.00 0.00 0.00 0.00 0.00
0.00 0.00 0.00 0.00 0.00 0.00 0.00 0.00
TOTAL MARKET 0.00 0.00 8476.99 0.00 0.00 0.00 0.00 0.00 0.00 0.00 0.00 0.00 0.00 0.00 0.00 0.00
TOTAL (From All Sources) 0.00 0.00 34664.02 0.00 0.00 0.00 0.00 0.00 0.00 0.00 0.00 0.00 0.00 0.00 0.00 0.00
2016-17
Generating Station
Plant Type
Must Run = 1
Others = 2
Plant
Capacity
DISCOM's
share
DISCOM's
share
(MW) (%) (MW) Net Availability Dispatch Fixed Variable Incentive Income Tax Others Total Fixed Incentives Income Tax Others Variable Total
TSGENCO
Thermal
VTPS I 1013.80 0.00 0.00 0.00 0.00 0.00 0.00 0.00
VTPS II 1013.80 0.00 0.00 0.00 0.00 0.00 0.00 0.00
VTPS III 1013.80 0.00 0.00 0.00 0.00 0.00 0.00 0.00
VTPS IV 1368.53 0.00 0.00 0.00 0.00 0.00 0.00 0.00
RTPP I 1051.81 0.00 0.00 0.00 0.00 0.00 0.00 0.00
RTPP Stage-II 1054.48 0.00 0.00 0.00 0.00 0.00 0.00 0.00
RTPP Stage-III 518.80 0.00 0.00 0.00 0.00 0.00 0.00 0.00
KTPS A 495.10 0.00 0.00 0.00 0.00 0.00 0.00 0.00
KTPS B 495.10 0.00 0.00 0.00 0.00 0.00 0.00 0.00
KTPS C 516.95 0.00 0.00 0.00 0.00 0.00 0.00 0.00
KTPS D 1130.06 0.00 0.00 0.00 0.00 0.00 0.00 0.00
Availability and Dispatch
(MU) Cost (Rs. Crs.)
Unit Cost
(Rs. / kWh)
Note: Hydro cost break up details need to be provided based on appropriate methodology. In case it is not possible to
segregate the cost
station wise, provide the total details in the empty rows in the TSGENCO Hydro stations section saying ALL

KTPS Stage VI 1189.68 0.00 0.00 0.00 0.00 0.00 0.00 0.00
RTS B 151.69 0.00 0.00 0.00 0.00 0.00 0.00 0.00
NTS 0.00 0.00 0.00 0.00 0.00 0.00 0.00 0.00
Kakatiya Thermal Power Plant Stage I 1149.75 0.00 0.00 0.00 0.00 0.00 0.00 0.00
Kakatiya Thermal Power Plant Stage II 2159.73 0.00 0.00 0.00 0.00 0.00 0.00 0.00
0.00 0.00 0.00 0.00 0.00 0.00 0.00 0.00
0.00 0.00 0.00 0.00 0.00 0.00 0.00 0.00
0.00 0.00 0.00 0.00 0.00 0.00 0.00 0.00
0.00 0.00 0.00 0.00 0.00 0.00 0.00 0.00
0.00 0.00 0.00 0.00 0.00 0.00 0.00 0.00
0.00 0.00 0.00 0.00 0.00 0.00 0.00 0.00
0.00 0.00 0.00 0.00 0.00 0.00 0.00 0.00
0.00 0.00 0.00 0.00 0.00 0.00 0.00 0.00
0.00 0.00 0.00 0.00 0.00 0.00 0.00 0.00
0.00 0.00 0.00 0.00 0.00 0.00 0.00 0.00
TOTAL THERMAL 0.00 0.00 14323.08 0.00 0.00 0.00 0.00 0.00 0.00 0.00 0.00 0.00 0.00 0.00 0.00 0.00
MACHKUND PH AP Share 50.29 0.00 0.00 0.00 0.00 0.00 0.00 0.00
TUNGBHADRA PH AP Share 4.88 0.00 0.00 0.00 0.00 0.00 0.00 0.00
USL 0.00 0.00 0.00 0.00 0.00 0.00 0.00 0.00
LSR 0.00 0.00 0.00 0.00 0.00 0.00 0.00 0.00
DONKARAYI 0.00 0.00 0.00 0.00 0.00 0.00 0.00 0.00
SSLM 0.00 0.00 0.00 0.00 0.00 0.00 0.00 0.00
NSPH 175.64 0.00 0.00 0.00 0.00 0.00 0.00 0.00
NSRCPH 0.00 0.00 0.00 0.00 0.00 0.00 0.00 0.00
NSLCPH 8.98 0.00 0.00 0.00 0.00 0.00 0.00 0.00
POCHAMPAD PH 17.60 0.00 0.00 0.00 0.00 0.00 0.00 0.00
NIZAMSAGAR PH 3.87 0.00 0.00 0.00 0.00 0.00 0.00 0.00
PABM 0.00 0.00 0.00 0.00 0.00 0.00 0.00 0.00
MINI HYDRO&OTHERS 0.00 0.00 0.00 0.00 0.00 0.00 0.00 0.00
SINGUR 3.38 0.00 0.00 0.00 0.00 0.00 0.00 0.00
SSLM LCPH 276.72 0.00 0.00 0.00 0.00 0.00 0.00 0.00
Nagarjunasagar Tail Pond Dam Power
House 0.00 0.00 0.00 0.00 0.00 0.00 0.00 0.00
Priyadarshini Jurala Hydro Electric Project-
AP Share 52.70 0.00 0.00 0.00 0.00 0.00 0.00 0.00
Lower Jurala Hydro Electric Project 99.60 0.00 0.00 0.00 0.00 0.00 0.00 0.00
POCHAMPAD PH Stage 2 5.58 0.00 0.00 0.00 0.00 0.00 0.00 0.00
PULICHINTAL(New Project) 19.98 0.00 0.00 0.00 0.00 0.00 0.00 0.00
1.07 0.00 0.00 0.00 0.00 0.00 0.00 0.00
0.00 0.00 0.00 0.00 0.00 0.00 0.00 0.00
0.00 0.00 0.00 0.00 0.00 0.00 0.00 0.00
0.00 0.00 0.00 0.00 0.00 0.00 0.00 0.00
0.00 0.00 0.00 0.00 0.00 0.00 0.00 0.00
720.30 0.00 0.00 0.00 0.00 0.00 0.00 0.00
0.00 0.00 0.00 0.00 0.00 0.00 0.00 0.00
TOTAL HYDRO 0.00 0.00 1440.60 0.00 0.00 0.00 0.00 0.00 0.00 0.00 0.00 0.00 0.00 0.00 0.00 0.00
TOTAL TSGENCO 0.00 0.00 15763.68 0.00 0.00 0.00 0.00 0.00 0.00 0.00 0.00 0.00 0.00 0.00 0.00 0.00

Central Generating Stations
NTPC
NTPC (SR)
NTPC (SR) 1758.05 0.00 0.00 0.00 0.00 0.00 0.00 0.00
NTPC (SR) Stage III 423.12 0.00 0.00 0.00 0.00 0.00 0.00 0.00
Total NTPC(SR) 0.00 0.00 2181.17 0.00 0.00 0.00 0.00 0.00 0.00 0.00 0.00 0.00 0.00 0.00 0.00 0.00
NTPC (ER)
Farakka 0.00 0.00 0.00 0.00 0.00 0.00 0.00 0.00
Kahalgaon 0.00 0.00 0.00 0.00 0.00 0.00 0.00 0.00
Talcher - Stage 1 0.00 0.00 0.00 0.00 0.00 0.00 0.00 0.00
Talcher Stage 2 1123.64 0.00 0.00 0.00 0.00 0.00 0.00 0.00
Others 0.00 0.00 0.00 0.00 0.00 0.00 0.00 0.00
Total NTPC(ER) 0.00 0.00 1123.64 0.00 0.00 0.00 0.00 0.00 0.00 0.00 0.00 0.00 0.00 0.00 0.00 0.00
Total NTPC 0.00 0.00 3304.81 0.00 0.00 0.00 0.00 0.00 0.00 0.00 0.00 0.00 0.00 0.00 0.00 0.00
NLC TS-II
Stage-I 207.44 0.00 0.00 0.00 0.00 0.00 0.00 0.00
Stage-II 413.63 0.00 0.00 0.00 0.00 0.00 0.00 0.00
Total NLC 0.00 0.00 621.07 0.00 0.00 0.00 0.00 0.00 0.00 0.00 0.00 0.00 0.00 0.00 0.00 0.00
NPC
NPC-MAPS 91.53 0.00 0.00 0.00 0.00 0.00 0.00 0.00
NPC-Kaiga unit I 329.91 0.00 0.00 0.00 0.00 0.00 0.00 0.00
NPC-Kaiga unit II 317.68 0.00 0.00 0.00 0.00 0.00 0.00 0.00
Total NPC 0.00 0.00 739.11 0.00 0.00 0.00 0.00 0.00 0.00 0.00 0.00 0.00 0.00 0.00 0.00 0.00
NTPC - Simhadri
NTPC Simhadri Stage I 2730.83 0.00 0.00 0.00 0.00 0.00 0.00 0.00
NTPC Simhadri Stage II 1103.90 0.00 0.00 0.00 0.00 0.00 0.00 0.00
Total NTPC- Simhadri 0.00 0.00 3834.74 0.00 0.00 0.00 0.00 0.00 0.00 0.00 0.00 0.00 0.00 0.00 0.00 0.00
CGS - New
480.92 0.00 0.00 0.00 0.00 0.00 0.00 0.00
639.59 0.00 0.00 0.00 0.00 0.00 0.00 0.00
32.80 0.00 0.00 0.00 0.00 0.00 0.00 0.00
227.87 0.00 0.00 0.00 0.00 0.00 0.00 0.00
0.00 0.00 0.00 0.00 0.00 0.00 0.00 0.00
TOTAL CGS 0.00 0.00 9880.90 0.00 0.00 0.00 0.00 0.00 0.00 0.00 0.00 0.00 0.00 0.00 0.00 0.00
APGPCL
APGPCL I - Allocated capacity 10.20 0.00 0.00 0.00 0.00 0.00 0.00 0.00
APGPCL I - Unutilised capacity 0.00 0.00 0.00 0.00 0.00 0.00 0.00 0.00
APGPCL II - Allocated capacity 37.44 0.00 0.00 0.00 0.00 0.00 0.00 0.00
APGPCL II - Unutilised capacity 0.00 0.00 0.00 0.00 0.00 0.00 0.00 0.00
Total APGPCL 0.00 0.00 47.64 0.00 0.00 0.00 0.00 0.00 0.00 0.00 0.00 0.00 0.00 0.00 0.00 0.00

IPPS
GVK 0.00 0.00 0.00 0.00 0.00 0.00 0.00 0.00
Spectrum 0.00 0.00 0.00 0.00 0.00 0.00 0.00 0.00
Kondapalli (Naphtha) 0.00 0.00 0.00 0.00 0.00 0.00 0.00 0.00
Kondapalli (Gas) 0.00 0.00 0.00 0.00 0.00 0.00 0.00 0.00
BSES 0.00 0.00 0.00 0.00 0.00 0.00 0.00 0.00
GVK Extension 27.86 0.00 0.00 0.00 0.00 0.00 0.00 0.00
Vemagiri 0.00 0.00 0.00 0.00 0.00 0.00 0.00 0.00
Gautami 0.00 0.00 0.00 0.00 0.00 0.00 0.00 0.00
Konaseema 0.00 0.00 0.00 0.00 0.00 0.00 0.00 0.00
0.00 0.00 0.00 0.00 0.00 0.00 0.00 0.00
0.00 0.00 0.00 0.00 0.00 0.00 0.00 0.00
0.00 0.00 0.00 0.00 0.00 0.00 0.00 0.00
0.00 0.00 0.00 0.00 0.00 0.00 0.00 0.00
0.00 0.00 0.00 0.00 0.00 0.00 0.00 0.00
TOTAL IPPS 0.00 0.00 27.86 0.00 0.00 0.00 0.00 0.00 0.00 0.00 0.00 0.00 0.00 0.00 0.00 0.00
NCE
NCE - Bio-Mass 53.53 0.00 0.00 0.00 0.00 0.00 0.00 0.00
NCE - Bagasse 0.00 0.00 0.00 0.00 0.00 0.00 0.00 0.00
NCE - Municipal Waste to Energy 0.00 0.00 0.00 0.00 0.00 0.00 0.00 0.00
NCE - Industrial Waste based power
project 6.18 0.00 0.00 0.00 0.00 0.00 0.00 0.00
NCE - Wind Power 236.40 0.00 0.00 0.00 0.00 0.00 0.00 0.00
NCE - Mini Hydel 0.00 0.00 0.00 0.00 0.00 0.00 0.00 0.00
NCE - NCL Energy Ltd 0.00 0.00 0.00 0.00 0.00 0.00 0.00 0.00
NCE-Others 815.30 0.00 0.00 0.00 0.00 0.00 0.00 0.00
TOTAL NCE 0.00 0.00 1111.40 0.00 0.00 0.00 0.00 0.00 0.00 0.00 0.00 0.00 0.00 0.00 0.00 0.00
OTHERS
Srivathsa 0.00 0.00 0.00 0.00 0.00 0.00 0.00 0.00
LVS 0.00 0.00 0.00 0.00 0.00 0.00 0.00 0.00
Vishakapatnam Steel Plant 0.00 0.00 0.00 0.00 0.00 0.00 0.00 0.00
NB Ferro Alloys 0.00 0.00 0.00 0.00 0.00 0.00 0.00 0.00
0.00 0.00 0.00 0.00 0.00 0.00 0.00 0.00
1634.56 0.00 0.00 0.00 0.00 0.00 0.00 0.00
1299.30 0.00 0.00 0.00 0.00 0.00 0.00 0.00
2799.07 0.00 0.00 0.00 0.00 0.00 0.00 0.00
909.67 0.00 0.00 0.00 0.00 0.00 0.00 0.00
0.00 0.00 0.00 0.00 0.00 0.00 0.00 0.00
0.00 0.00 0.00 0.00 0.00 0.00 0.00 0.00
0.00 0.00 0.00 0.00 0.00 0.00 0.00 0.00
0.00 0.00 0.00 0.00 0.00 0.00 0.00 0.00
TOTAL OTHERS 0.00 0.00 6642.59 0.00 0.00 0.00 0.00 0.00 0.00 0.00 0.00 0.00 0.00 0.00 0.00 0.00
MARKET
PTC 0.00 0.00 0.00 0.00 0.00 0.00 0.00 0.00

RCL and Short-Term Sources(IG
Wells,Kesoram) 0.00 0.00 0.00 0.00 0.00 0.00 0.00 0.00
CPDCL 0.00 0.00 0.00 0.00 0.00 0.00 0.00 0.00
EPDCL 0.00 0.00 0.00 0.00 0.00 0.00 0.00 0.00
NPDCL 0.00 0.00 0.00 0.00 0.00 0.00 0.00 0.00
SPDCL 0.00 0.00 0.00 0.00 0.00 0.00 0.00 0.00
UI 0.00 0.00 0.00 0.00 0.00 0.00 0.00 0.00
Other Short Term Sources 8421.74 0.00 0.00 0.00 0.00 0.00 0.00 0.00
52.70 0.00 0.00 0.00 0.00 0.00 0.00 0.00
0.00 0.00 0.00 0.00 0.00 0.00 0.00 0.00
695.89 0.00 0.00 0.00 0.00 0.00 0.00 0.00
0.00 0.00 0.00 0.00 0.00 0.00 0.00 0.00
0.00 0.00 0.00 0.00 0.00 0.00 0.00 0.00
0.00 0.00 0.00 0.00 0.00 0.00 0.00 0.00
0.00 0.00 0.00 0.00 0.00 0.00 0.00 0.00
0.00 0.00 0.00 0.00 0.00 0.00 0.00 0.00
TOTAL MARKET 0.00 0.00 9170.33 0.00 0.00 0.00 0.00 0.00 0.00 0.00 0.00 0.00 0.00 0.00 0.00 0.00
TOTAL (From All Sources) 0.00 0.00 42644.41 0.00 0.00 0.00 0.00 0.00 0.00 0.00 0.00 0.00 0.00 0.00 0.00 0.00
Note: Hydro cost break up details need to be provided based on appropriate methodology. In case it is not possible to
segregate the cost
station wise, provide the total details in the empty rows in the TSGENCO Hydro stations section saying ALL

2017-18
Generating Station
Plant Type
Must Run = 1
Others = 2
Plant
Capacity
DISCOM's
share
DISCOM's
share
(MW) (%) (MW) Net Availability Dispatch Fixed Variable Incentive Income Tax Others Total Fixed Incentives Income Tax Others Variable Total
TSGENCO
Thermal
VTPS I 1021.15 0.00 0.00 0.00 0.00 0.00 0.00 0.00
VTPS II 1021.15 0.00 0.00 0.00 0.00 0.00 0.00 0.00
VTPS III 1021.15 0.00 0.00 0.00 0.00 0.00 0.00 0.00
VTPS IV 1232.30 0.00 0.00 0.00 0.00 0.00 0.00 0.00
RTPP I 1018.35 0.00 0.00 0.00 0.00 0.00 0.00 0.00
RTPP Stage-II 1018.35 0.00 0.00 0.00 0.00 0.00 0.00 0.00
RTPP Stage-III 509.17 0.00 0.00 0.00 0.00 0.00 0.00 0.00
KTPS A 577.44 0.00 0.00 0.00 0.00 0.00 0.00 0.00
KTPS B 577.44 0.00 0.00 0.00 0.00 0.00 0.00 0.00
KTPS C 577.44 0.00 0.00 0.00 0.00 0.00 0.00 0.00
KTPS D 1212.32 0.00 0.00 0.00 0.00 0.00 0.00 0.00
KTPS Stage VI 1232.30 0.00 0.00 0.00 0.00 0.00 0.00 0.00
RTS B 151.54 0.00 0.00 0.00 0.00 0.00 0.00 0.00
NTS 0.00 0.00 0.00 0.00 0.00 0.00 0.00 0.00
Kakatiya Thermal Power Plant Stage I 1232.30 0.00 0.00 0.00 0.00 0.00 0.00 0.00
Kakatiya Thermal Power Plant Stage II 2744.04 0.00 0.00 0.00 0.00 0.00 0.00 0.00
0.00 0.00 0.00 0.00 0.00 0.00 0.00 0.00
0.00 0.00 0.00 0.00 0.00 0.00 0.00 0.00
0.00 0.00 0.00 0.00 0.00 0.00 0.00 0.00
0.00 0.00 0.00 0.00 0.00 0.00 0.00 0.00
0.00 0.00 0.00 0.00 0.00 0.00 0.00 0.00
0.00 0.00 0.00 0.00 0.00 0.00 0.00 0.00
0.00 0.00 0.00 0.00 0.00 0.00 0.00 0.00
0.00 0.00 0.00 0.00 0.00 0.00 0.00 0.00
0.00 0.00 0.00 0.00 0.00 0.00 0.00 0.00
0.00 0.00 0.00 0.00 0.00 0.00 0.00 0.00
TOTAL THERMAL 0.00 0.00 15146.45 0.00 0.00 0.00 0.00 0.00 0.00 0.00 0.00 0.00 0.00 0.00 0.00 0.00
MACHKUND PH AP Share 42.56 0.00 0.00 0.00 0.00 0.00 0.00 0.00
TUNGBHADRA PH AP Share 18.86 0.00 0.00 0.00 0.00 0.00 0.00 0.00
USL 0.00 0.00 0.00 0.00 0.00 0.00 0.00 0.00
LSR 0.00 0.00 0.00 0.00 0.00 0.00 0.00 0.00
DONKARAYI 0.00 0.00 0.00 0.00 0.00 0.00 0.00 0.00
SSLM 0.00 0.00 0.00 0.00 0.00 0.00 0.00 0.00
NSPH 348.12 0.00 0.00 0.00 0.00 0.00 0.00 0.00
NSRCPH 0.00 0.00 0.00 0.00 0.00 0.00 0.00 0.00
NSLCPH 16.00 0.00 0.00 0.00 0.00 0.00 0.00 0.00
POCHAMPAD PH 13.14 0.00 0.00 0.00 0.00 0.00 0.00 0.00
NIZAMSAGAR PH 6.06 0.00 0.00 0.00 0.00 0.00 0.00 0.00
PABM 0.00 0.00 0.00 0.00 0.00 0.00 0.00 0.00
Availability and Dispatch
(MU) Cost (Rs. Crs.)
Unit Cost
(Rs. / kWh)

Generating Station
Plant Type
Must Run = 1
Others = 2
Plant
Capacity
DISCOM's
share
DISCOM's
share
(MW) (%) (MW) Net Availability Dispatch Fixed Variable Incentive Income Tax Others Total Fixed Incentives Income Tax Others Variable Total
Availability and Dispatch
(MU) Cost (Rs. Crs.)
Unit Cost
(Rs. / kWh)
MINI HYDRO&OTHERS 0.00 0.00 0.00 0.00 0.00 0.00 0.00 0.00
SINGUR 6.26 0.00 0.00 0.00 0.00 0.00 0.00 0.00
SSLM LCPH 333.28 0.00 0.00 0.00 0.00 0.00 0.00 0.00
Nagarjunasagar Tail Pond Dam Power
House 0.00 0.00 0.00 0.00 0.00 0.00 0.00 0.00
Priyadarshini Jurala Hydro Electric Project-
AP Share 45.28 0.00 0.00 0.00 0.00 0.00 0.00 0.00
Lower Jurala Hydro Electric Project 32.67 0.00 0.00 0.00 0.00 0.00 0.00 0.00
0.00 0.00 0.00 0.00 0.00 0.00 0.00 0.00
0.00 0.00 0.00 0.00 0.00 0.00 0.00 0.00
987.72 0.00 0.00 0.00 0.00 0.00 0.00 0.00
16134.16 0.00 0.00 0.00 0.00 0.00 0.00 0.00
0.00 0.00 0.00 0.00 0.00 0.00 0.00 0.00
0.00 0.00 0.00 0.00 0.00 0.00 0.00 0.00
0.00 0.00 0.00 0.00 0.00 0.00 0.00 0.00
0.00 0.00 0.00 0.00 0.00 0.00 0.00 0.00
1758.95 0.00 0.00 0.00 0.00 0.00 0.00 0.00
TOTAL HYDRO 0.00 0.00 19743.07 0.00 0.00 0.00 0.00 0.00 0.00 0.00 0.00 0.00 0.00 0.00 0.00 0.00
TOTAL TSGENCO 0.00 0.00 34889.51 0.00 0.00 0.00 0.00 0.00 0.00 0.00 0.00 0.00 0.00 0.00 0.00 0.00
Central Generating Stations
NTPC
NTPC (SR)
NTPC (SR) 1758.95 0.00 0.00 0.00 0.00 0.00 0.00 0.00
NTPC (SR) Stage III 444.12 0.00 0.00 0.00 0.00 0.00 0.00 0.00
Total NTPC(SR) 0.00 0.00 2203.07 0.00 0.00 0.00 0.00 0.00 0.00 0.00 0.00 0.00 0.00 0.00 0.00 0.00
NTPC (ER)
Farakka 0.00 0.00 0.00 0.00 0.00 0.00 0.00 0.00
Kahalgaon 0.00 0.00 0.00 0.00 0.00 0.00 0.00 0.00
Talcher - Stage 1 0.00 0.00 0.00 0.00 0.00 0.00 0.00 0.00
Talcher Stage 2 1118.97 0.00 0.00 0.00 0.00 0.00 0.00 0.00
Others 0.00 0.00 0.00 0.00 0.00 0.00 0.00 0.00
Total NTPC(ER) 0.00 0.00 1118.97 0.00 0.00 0.00 0.00 0.00 0.00 0.00 0.00 0.00 0.00 0.00 0.00 0.00
Total NTPC 0.00 0.00 3322.03 0.00 0.00 0.00 0.00 0.00 0.00 0.00 0.00 0.00 0.00 0.00 0.00 0.00
NLC TS-II
Stage-I 221.54 0.00 0.00 0.00 0.00 0.00 0.00 0.00
Stage-II 409.15 0.00 0.00 0.00 0.00 0.00 0.00 0.00
Total NLC 0.00 0.00 630.69 0.00 0.00 0.00 0.00 0.00 0.00 0.00 0.00 0.00 0.00 0.00 0.00 0.00
NPC
NPC-MAPS 97.11 0.00 0.00 0.00 0.00 0.00 0.00 0.00
NPC-Kaiga unit I 325.21 0.00 0.00 0.00 0.00 0.00 0.00 0.00
NPC-Kaiga unit II 325.21 0.00 0.00 0.00 0.00 0.00 0.00 0.00
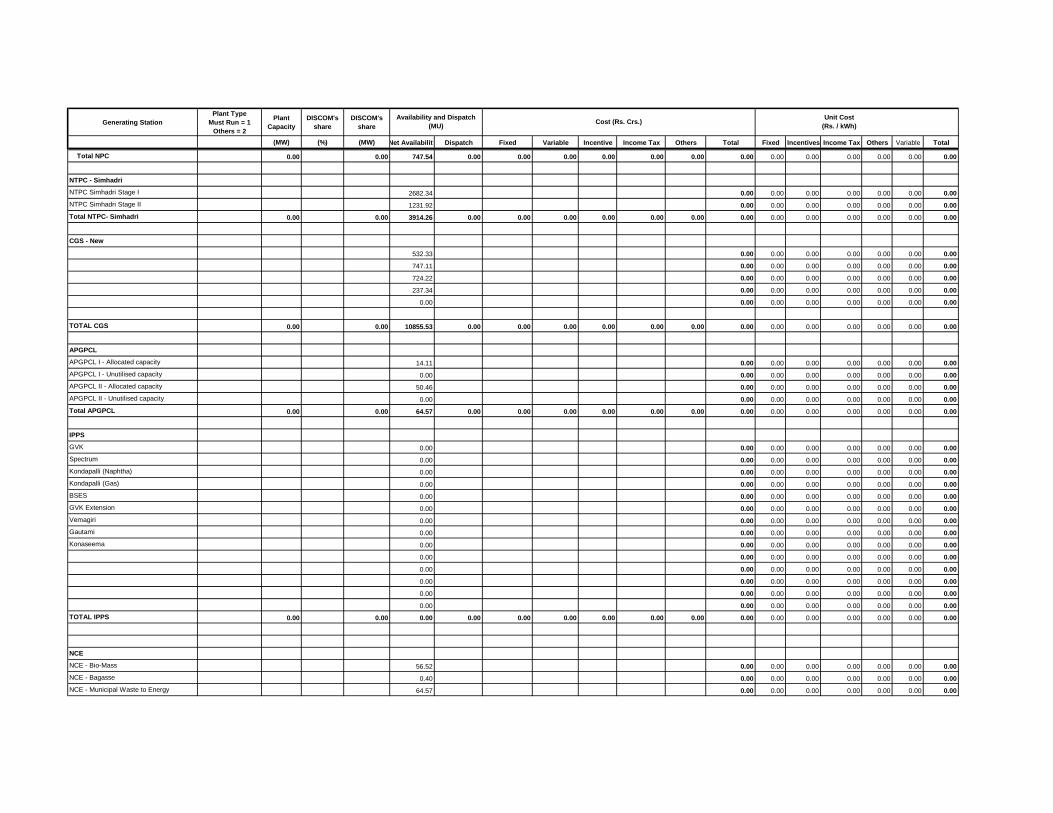
Generating Station
Plant Type
Must Run = 1
Others = 2
Plant
Capacity
DISCOM's
share
DISCOM's
share
(MW) (%) (MW) Net Availability Dispatch Fixed Variable Incentive Income Tax Others Total Fixed Incentives Income Tax Others Variable Total
Availability and Dispatch
(MU) Cost (Rs. Crs.)
Unit Cost
(Rs. / kWh)
Total NPC 0.00 0.00 747.54 0.00 0.00 0.00 0.00 0.00 0.00 0.00 0.00 0.00 0.00 0.00 0.00 0.00
NTPC - Simhadri
NTPC Simhadri Stage I 2682.34 0.00 0.00 0.00 0.00 0.00 0.00 0.00
NTPC Simhadri Stage II 1231.92 0.00 0.00 0.00 0.00 0.00 0.00 0.00
Total NTPC- Simhadri 0.00 0.00 3914.26 0.00 0.00 0.00 0.00 0.00 0.00 0.00 0.00 0.00 0.00 0.00 0.00 0.00
CGS - New
532.33 0.00 0.00 0.00 0.00 0.00 0.00 0.00
747.11 0.00 0.00 0.00 0.00 0.00 0.00 0.00
724.22 0.00 0.00 0.00 0.00 0.00 0.00 0.00
237.34 0.00 0.00 0.00 0.00 0.00 0.00 0.00
0.00 0.00 0.00 0.00 0.00 0.00 0.00 0.00
TOTAL CGS 0.00 0.00 10855.53 0.00 0.00 0.00 0.00 0.00 0.00 0.00 0.00 0.00 0.00 0.00 0.00 0.00
APGPCL
APGPCL I - Allocated capacity 14.11 0.00 0.00 0.00 0.00 0.00 0.00 0.00
APGPCL I - Unutilised capacity 0.00 0.00 0.00 0.00 0.00 0.00 0.00 0.00
APGPCL II - Allocated capacity 50.46 0.00 0.00 0.00 0.00 0.00 0.00 0.00
APGPCL II - Unutilised capacity 0.00 0.00 0.00 0.00 0.00 0.00 0.00 0.00
Total APGPCL 0.00 0.00 64.57 0.00 0.00 0.00 0.00 0.00 0.00 0.00 0.00 0.00 0.00 0.00 0.00 0.00
IPPS
GVK 0.00 0.00 0.00 0.00 0.00 0.00 0.00 0.00
Spectrum 0.00 0.00 0.00 0.00 0.00 0.00 0.00 0.00
Kondapalli (Naphtha) 0.00 0.00 0.00 0.00 0.00 0.00 0.00 0.00
Kondapalli (Gas) 0.00 0.00 0.00 0.00 0.00 0.00 0.00 0.00
BSES 0.00 0.00 0.00 0.00 0.00 0.00 0.00 0.00
GVK Extension 0.00 0.00 0.00 0.00 0.00 0.00 0.00 0.00
Vemagiri 0.00 0.00 0.00 0.00 0.00 0.00 0.00 0.00
Gautami 0.00 0.00 0.00 0.00 0.00 0.00 0.00 0.00
Konaseema 0.00 0.00 0.00 0.00 0.00 0.00 0.00 0.00
0.00 0.00 0.00 0.00 0.00 0.00 0.00 0.00
0.00 0.00 0.00 0.00 0.00 0.00 0.00 0.00
0.00 0.00 0.00 0.00 0.00 0.00 0.00 0.00
0.00 0.00 0.00 0.00 0.00 0.00 0.00 0.00
0.00 0.00 0.00 0.00 0.00 0.00 0.00 0.00
TOTAL IPPS 0.00 0.00 0.00 0.00 0.00 0.00 0.00 0.00 0.00 0.00 0.00 0.00 0.00 0.00 0.00 0.00
NCE
NCE - Bio-Mass 56.52 0.00 0.00 0.00 0.00 0.00 0.00 0.00
NCE - Bagasse 0.40 0.00 0.00 0.00 0.00 0.00 0.00 0.00
NCE - Municipal Waste to Energy 64.57 0.00 0.00 0.00 0.00 0.00 0.00 0.00
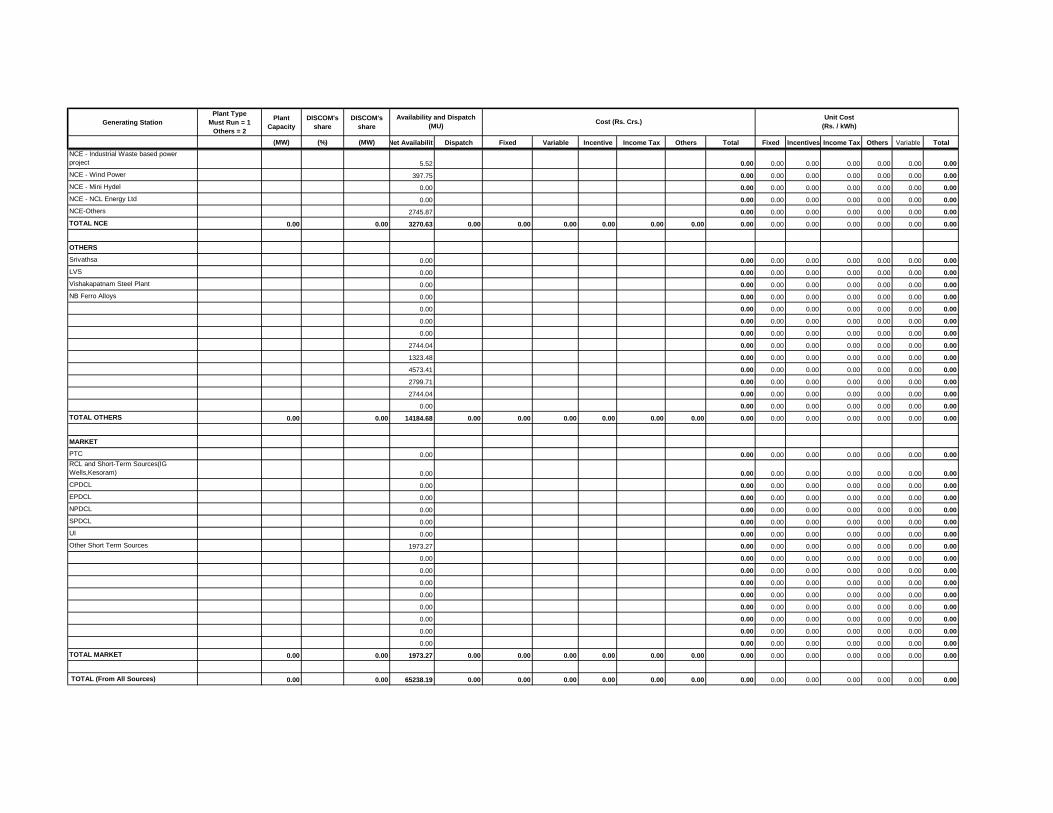
Generating Station
Plant Type
Must Run = 1
Others = 2
Plant
Capacity
DISCOM's
share
DISCOM's
share
(MW) (%) (MW) Net Availability Dispatch Fixed Variable Incentive Income Tax Others Total Fixed Incentives Income Tax Others Variable Total
Availability and Dispatch
(MU) Cost (Rs. Crs.)
Unit Cost
(Rs. / kWh)
NCE - Industrial Waste based power
project 5.52 0.00 0.00 0.00 0.00 0.00 0.00 0.00
NCE - Wind Power 397.75 0.00 0.00 0.00 0.00 0.00 0.00 0.00
NCE - Mini Hydel 0.00 0.00 0.00 0.00 0.00 0.00 0.00 0.00
NCE - NCL Energy Ltd 0.00 0.00 0.00 0.00 0.00 0.00 0.00 0.00
NCE-Others 2745.87 0.00 0.00 0.00 0.00 0.00 0.00 0.00
TOTAL NCE 0.00 0.00 3270.63 0.00 0.00 0.00 0.00 0.00 0.00 0.00 0.00 0.00 0.00 0.00 0.00 0.00
OTHERS
Srivathsa 0.00 0.00 0.00 0.00 0.00 0.00 0.00 0.00
LVS 0.00 0.00 0.00 0.00 0.00 0.00 0.00 0.00
Vishakapatnam Steel Plant 0.00 0.00 0.00 0.00 0.00 0.00 0.00 0.00
NB Ferro Alloys 0.00 0.00 0.00 0.00 0.00 0.00 0.00 0.00
0.00 0.00 0.00 0.00 0.00 0.00 0.00 0.00
0.00 0.00 0.00 0.00 0.00 0.00 0.00 0.00
0.00 0.00 0.00 0.00 0.00 0.00 0.00 0.00
2744.04 0.00 0.00 0.00 0.00 0.00 0.00 0.00
1323.48 0.00 0.00 0.00 0.00 0.00 0.00 0.00
4573.41 0.00 0.00 0.00 0.00 0.00 0.00 0.00
2799.71 0.00 0.00 0.00 0.00 0.00 0.00 0.00
2744.04 0.00 0.00 0.00 0.00 0.00 0.00 0.00
0.00 0.00 0.00 0.00 0.00 0.00 0.00 0.00
TOTAL OTHERS 0.00 0.00 14184.68 0.00 0.00 0.00 0.00 0.00 0.00 0.00 0.00 0.00 0.00 0.00 0.00 0.00
MARKET
PTC 0.00 0.00 0.00 0.00 0.00 0.00 0.00 0.00
RCL and Short-Term Sources(IG
Wells,Kesoram) 0.00 0.00 0.00 0.00 0.00 0.00 0.00 0.00
CPDCL 0.00 0.00 0.00 0.00 0.00 0.00 0.00 0.00
EPDCL 0.00 0.00 0.00 0.00 0.00 0.00 0.00 0.00
NPDCL 0.00 0.00 0.00 0.00 0.00 0.00 0.00 0.00
SPDCL 0.00 0.00 0.00 0.00 0.00 0.00 0.00 0.00
UI 0.00 0.00 0.00 0.00 0.00 0.00 0.00 0.00
Other Short Term Sources 1973.27 0.00 0.00 0.00 0.00 0.00 0.00 0.00
0.00 0.00 0.00 0.00 0.00 0.00 0.00 0.00
0.00 0.00 0.00 0.00 0.00 0.00 0.00 0.00
0.00 0.00 0.00 0.00 0.00 0.00 0.00 0.00
0.00 0.00 0.00 0.00 0.00 0.00 0.00 0.00
0.00 0.00 0.00 0.00 0.00 0.00 0.00 0.00
0.00 0.00 0.00 0.00 0.00 0.00 0.00 0.00
0.00 0.00 0.00 0.00 0.00 0.00 0.00 0.00
0.00 0.00 0.00 0.00 0.00 0.00 0.00 0.00
TOTAL MARKET 0.00 0.00 1973.27 0.00 0.00 0.00 0.00 0.00 0.00 0.00 0.00 0.00 0.00 0.00 0.00 0.00
TOTAL (From All Sources) 0.00 0.00 65238.19 0.00 0.00 0.00 0.00 0.00 0.00 0.00 0.00 0.00 0.00 0.00 0.00 0.00
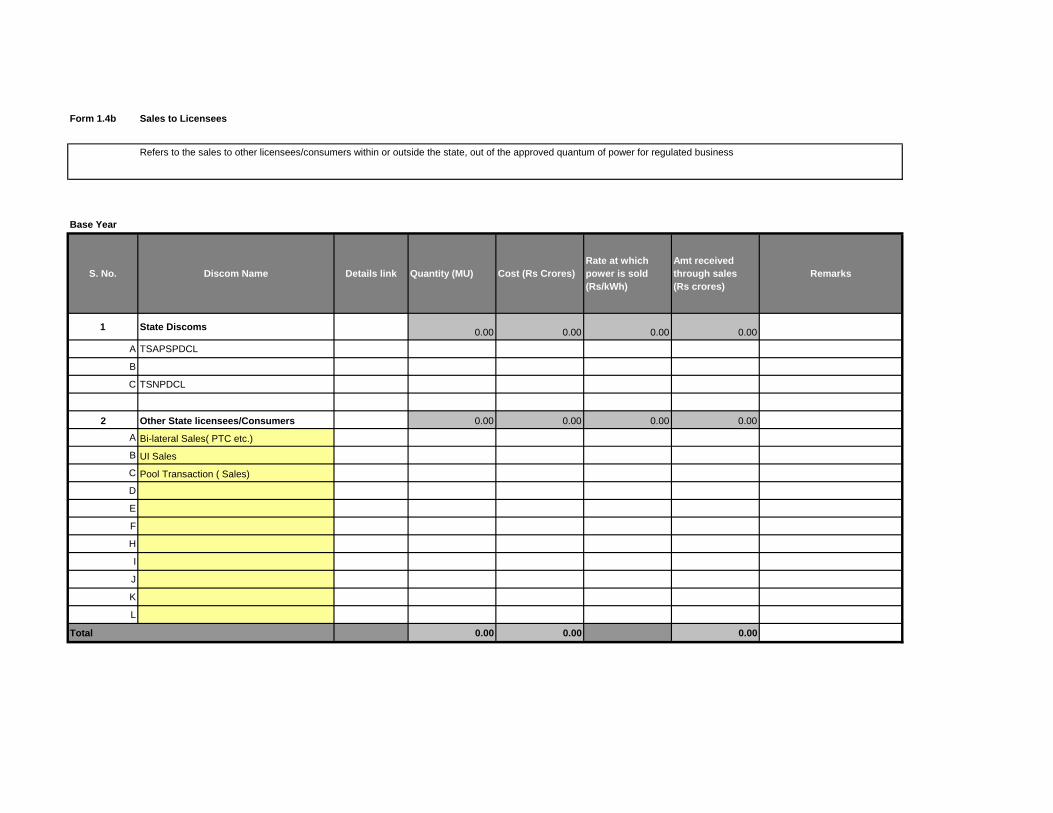
Form 1.4b Sales to Licensees
Base Year
S. No. Discom Name Details link Quantity (MU) Cost (Rs Crores)
Rate at which
power is sold
(Rs/kWh)
Amt received
through sales
(Rs crores)
Remarks
1 State Discoms0.00 0.00 0.00 0.00
A TSAPSPDCL
B
C TSNPDCL
2 Other State licensees/Consumers 0.00 0.00 0.00 0.00
A Bi-lateral Sales( PTC etc.)
B UI Sales
C Pool Transaction ( Sales)
D
E
F
H
I
J
K
L
Total 0.00 0.00 0.00
Refers to the sales to other licensees/consumers within or outside the state, out of the approved quantum of power for regulated business

2014-15
S. No. Discom Name Details link Quantity (MU) Cost (Rs Crores)
Rate at which
power is sold
(Rs/kWh)
Amt received
through sales
(Rs crores)
Remarks
1 State Discoms0.00 0.00 0.00 0.00
A TSSPDCL
B
C TSNPDCL
D
2 Other State licensees/Consumers 0.00 0.00 0.00 0.00
A Bi-lateral Sales( PTC etc.)
B UI Sales
C Pool Transaction ( Sales)
D
E
F
H
I
J
K
L
Total 0.00 0.00 0.00

2015-16
S. No. Discom Name Details link Quantity (MU) Cost (Rs Crores)
Rate at which
power is sold
(Rs/kWh)
Amt received
through sales
(Rs crores)
Remarks
1 State Discoms0.00 0.00 0.00 0.00
A TSSPDCL
B
C TSNPDCL
D
2 Other State licensees/Consumers 0.00 0.00 0.00 0.00
A Bi-lateral Sales( PTC etc.)
B UI Sales
C Pool Transaction ( Sales)
D Inter state sales
E
F
H
I
J
K
L
Total 0.00 0.00 0.00

2016-17
S. No. Discom Name Details link Quantity (MU) Cost (Rs Crores)
Rate at which
power is sold
(Rs/kWh)
Amt received
through sales
(Rs crores)
Remarks
1 State Discoms0.00 0.00 0.00 0.00
A TSSPDCL
B
C TSNPDCL
D
2 Other State licensees/Consumers 0.00 0.00 0.00 0.00
A Bi-lateral Sales( PTC etc.)
B UI Sales
C Pool Transaction ( Sales)
D Inter state sales
E
F
H
I
J
K
L
Total 0.00 0.00 0.00
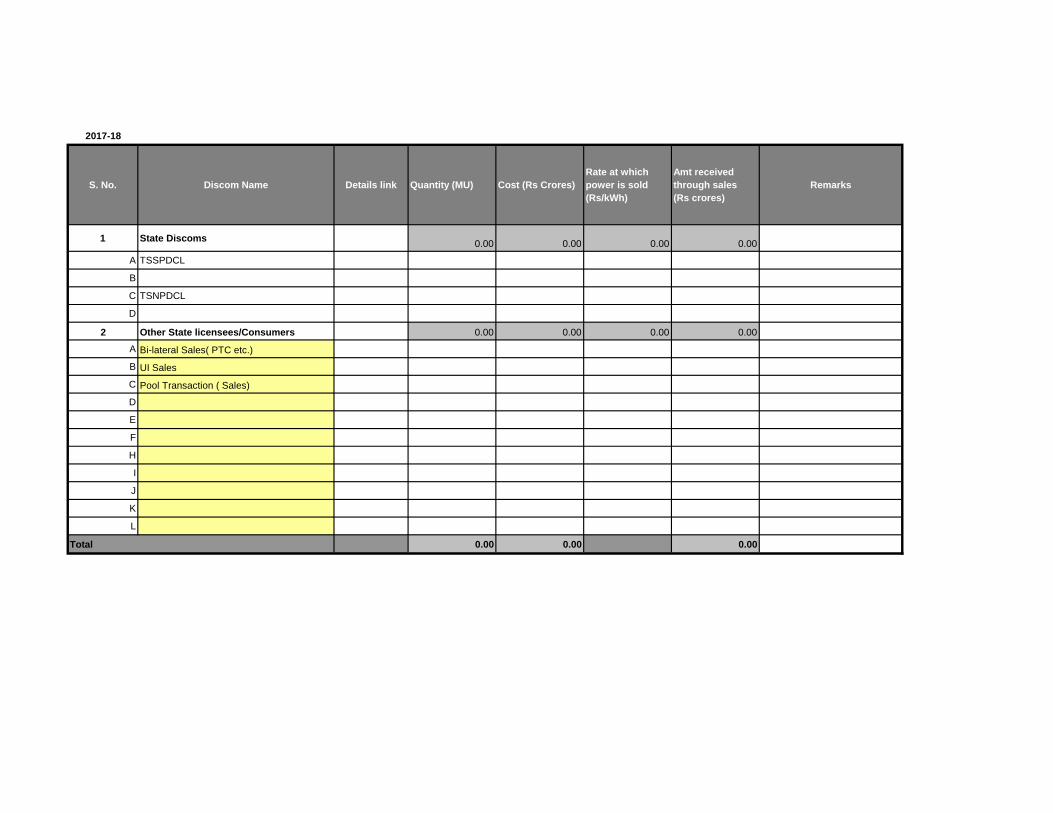
2017-18
S. No. Discom Name Details link Quantity (MU) Cost (Rs Crores)
Rate at which
power is sold
(Rs/kWh)
Amt received
through sales
(Rs crores)
Remarks
1 State Discoms0.00 0.00 0.00 0.00
A TSSPDCL
B
C TSNPDCL
D
2 Other State licensees/Consumers 0.00 0.00 0.00 0.00
A Bi-lateral Sales( PTC etc.)
B UI Sales
C Pool Transaction ( Sales)
D
E
F
H
I
J
K
L
Total 0.00 0.00 0.00

Form 1.4c Discom-Discom Purchases
The information relates to the quantum of power purchased from Discoms within the state and forming part of Form 1.4.
Base Year
S. No. Discom Name Details link Quantity (MU) Cost (Rs Crores) Rate (Rs/kWh) Remarks
1 TSSPDCL 0.00
2 0.00
3 TSNPDCL 0.00
4 0.00
5 0.00
6 0.00
Total 0.00 0.00 0.00
2014-15
S. No. Discom Name Details link Quantity (MU) Cost (Rs Crores) Rate (Rs/kWh) Remarks
1 TSSPDCL 0.00
2 0.00
3 TSNPDCL 0.00
4 0.00
5 0.00
6 0.00
Total 0.00 0.00 0.00
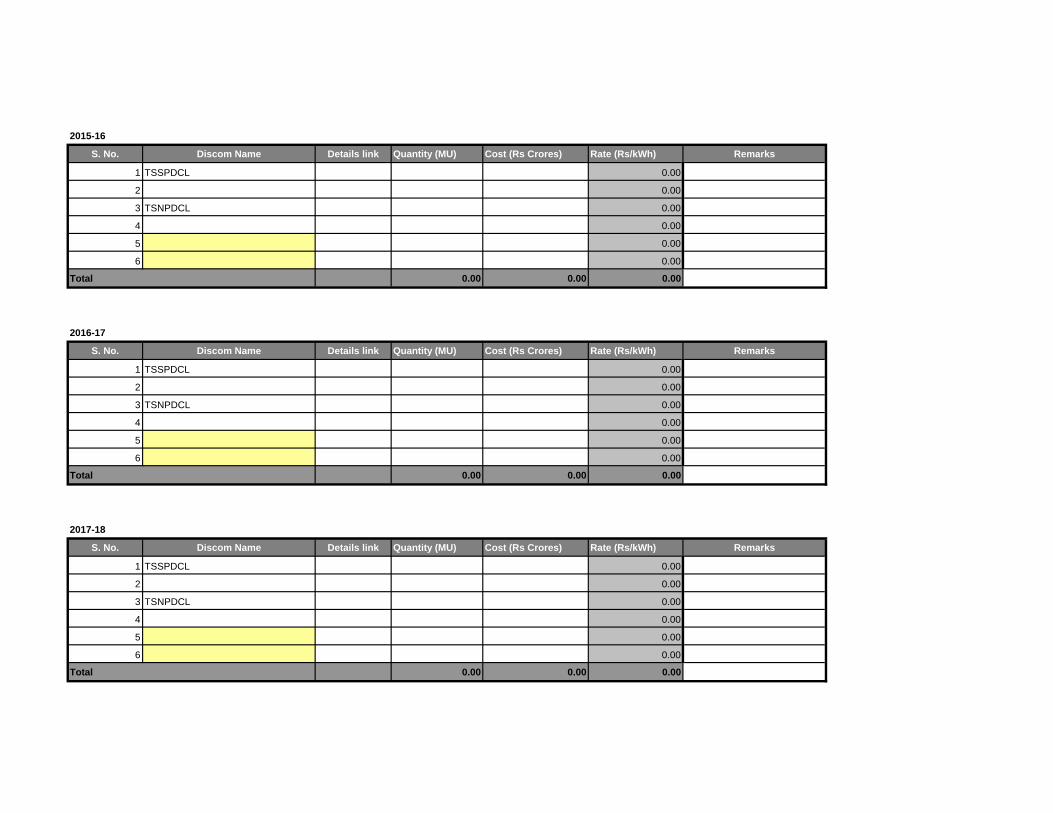
2015-16
S. No. Discom Name Details link Quantity (MU) Cost (Rs Crores) Rate (Rs/kWh) Remarks
1 TSSPDCL 0.00
2 0.00
3 TSNPDCL 0.00
4 0.00
5 0.00
6 0.00
Total 0.00 0.00 0.00
2016-17
S. No. Discom Name Details link Quantity (MU) Cost (Rs Crores) Rate (Rs/kWh) Remarks
1 TSSPDCL 0.00
2 0.00
3 TSNPDCL 0.00
4 0.00
5 0.00
6 0.00
Total 0.00 0.00 0.00
2017-18
S. No. Discom Name Details link Quantity (MU) Cost (Rs Crores) Rate (Rs/kWh) Remarks
1 TSSPDCL 0.00
2 0.00
3 TSNPDCL 0.00
4 0.00
5 0.00
6 0.00
Total 0.00 0.00 0.00
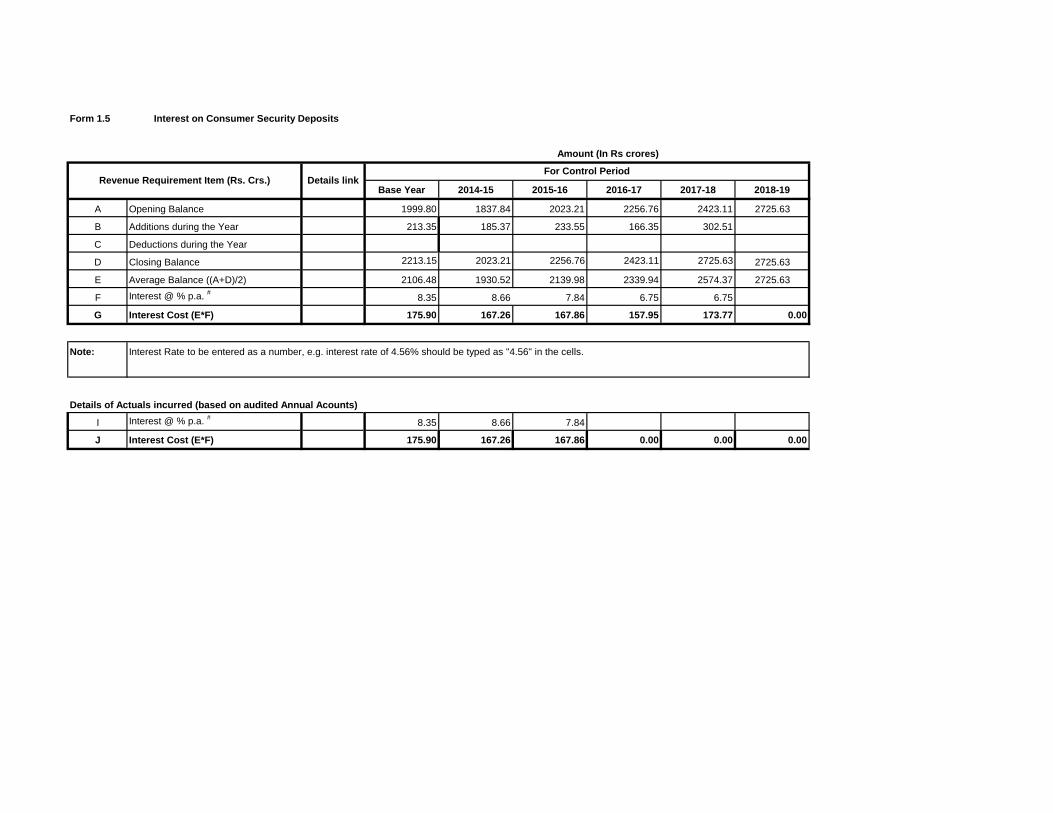
Form 1.5
Amount (In Rs crores)
Base Year 2014-15 2015-16 2016-17 2017-18 2018-19
A Opening Balance 1999.80 1837.84 2023.21 2256.76 2423.11 2725.63
B Additions during the Year 213.35 185.37 233.55 166.35 302.51
C Deductions during the Year
D Closing Balance 2213.15 2023.21 2256.76 2423.11 2725.63 2725.63
E Average Balance ((A+D)/2) 2106.48 1930.52 2139.98 2339.94 2574.37 2725.63
F Interest @ % p.a. #
8.35 8.66 7.84 6.75 6.75
G Interest Cost (E*F) 175.90 167.26 167.86 157.95 173.77 0.00
Note: Interest Rate to be entered as a number, e.g. interest rate of 4.56% should be typed as "4.56" in the cells.
Details of Actuals incurred (based on audited Annual Acounts)
I Interest @ % p.a. #
8.35 8.66 7.84
J Interest Cost (E*F) 175.90 167.26 167.86 0.00 0.00 0.00
Interest on Consumer Security Deposits
Revenue Requirement Item (Rs. Crs.) Details linkFor Control Period
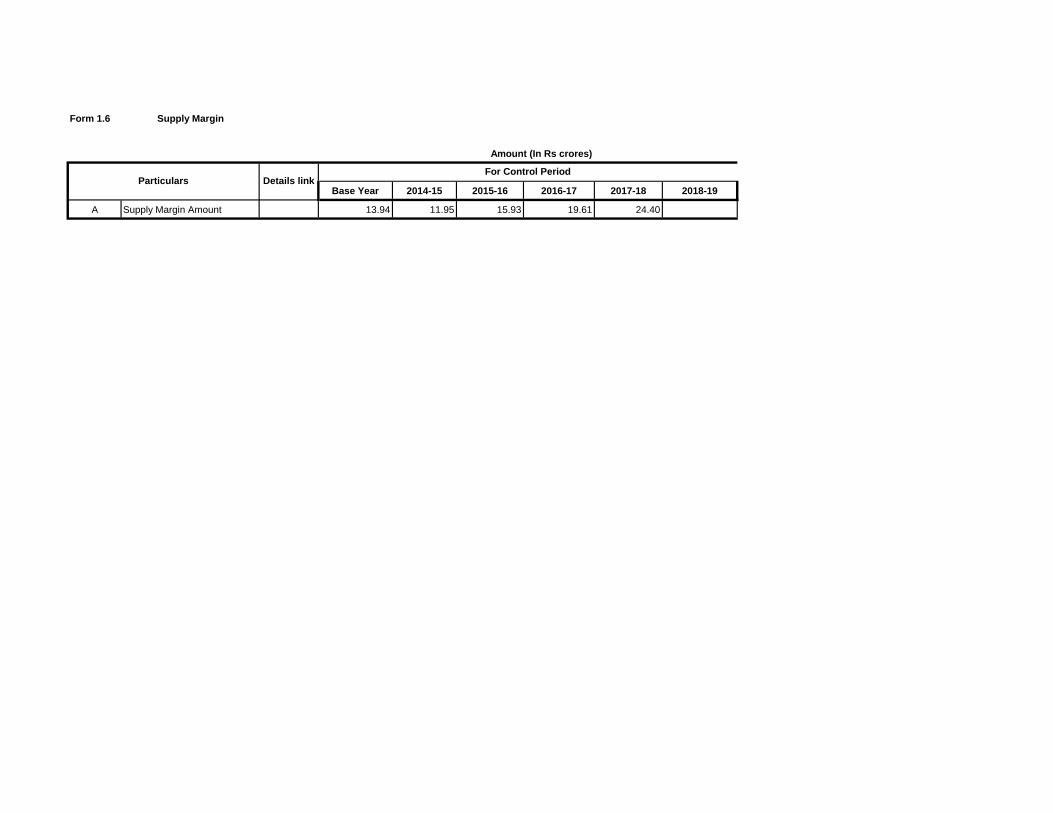
Form 1.6 Supply Margin
Amount (In Rs crores)
Base Year 2014-15 2015-16 2016-17 2017-18 2018-19
A Supply Margin Amount 13.94 11.95 15.93 19.61 24.40
Particulars Details linkFor Control Period
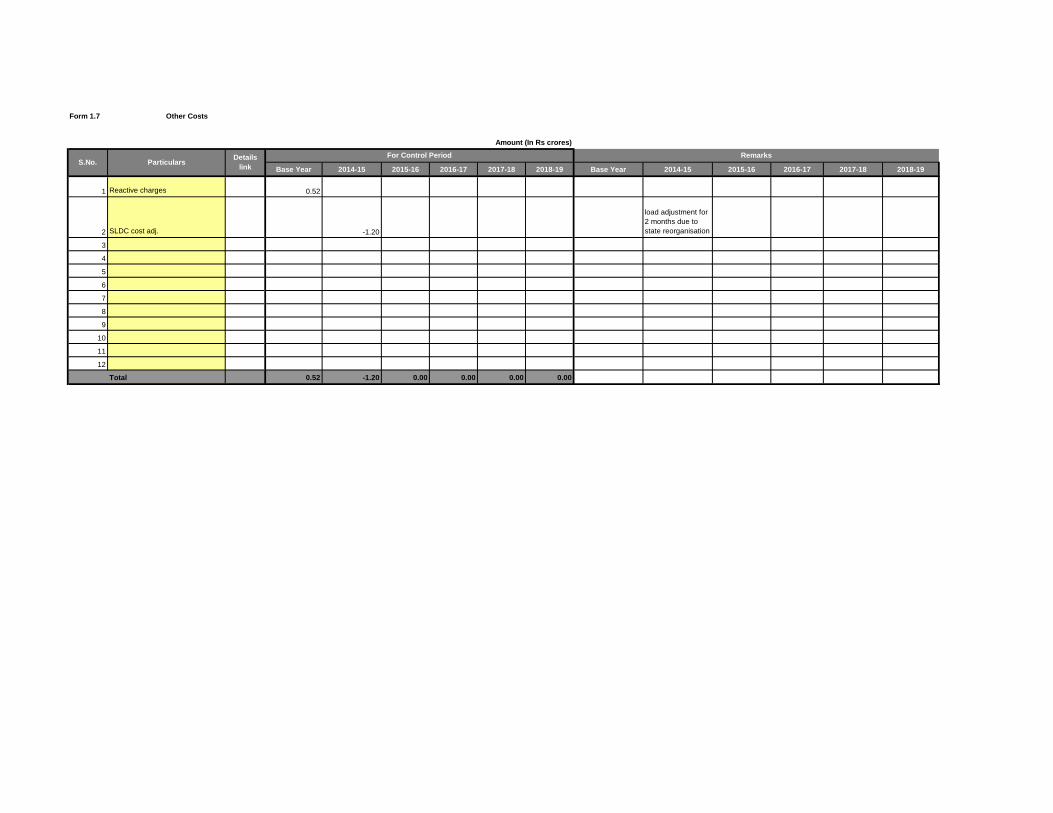
Form 1.7
Amount (In Rs crores)
Base Year 2014-15 2015-16 2016-17 2017-18 2018-19 Base Year 2014-15 2015-16 2016-17 2017-18 2018-19
1 Reactive charges 0.52
2 SLDC cost adj. -1.20
load adjustment for
2 months due to
state reorganisation
3
4
5
6
7
8
9
10
11
12
Total 0.52 -1.20 0.00 0.00 0.00 0.00
Remarks
Other Costs
S.No. ParticularsDetails
link
For Control Period
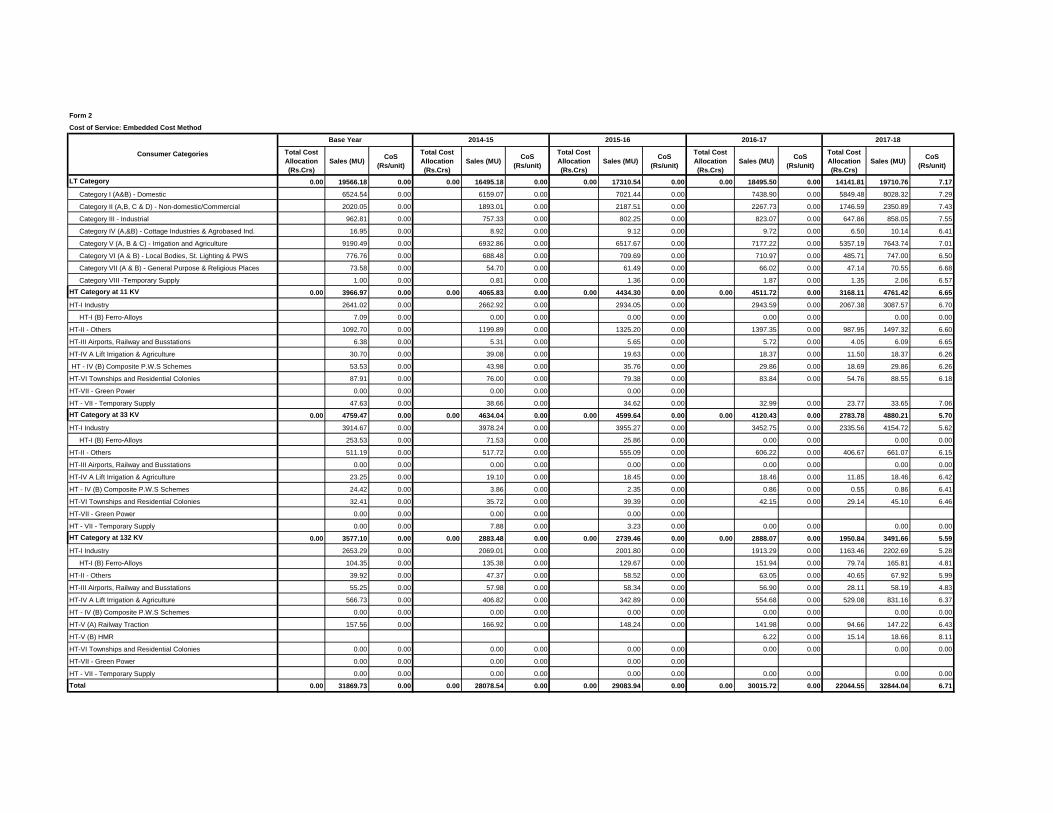
Form 2
Cost of Service: Embedded Cost Method
Total Cost
Allocation
(Rs.Crs)
Sales (MU)CoS
(Rs/unit)
Total Cost
Allocation
(Rs.Crs)
Sales (MU)CoS
(Rs/unit)
Total Cost
Allocation
(Rs.Crs)
Sales (MU)CoS
(Rs/unit)
Total Cost
Allocation
(Rs.Crs)
Sales (MU)CoS
(Rs/unit)
Total Cost
Allocation
(Rs.Crs)
Sales (MU)CoS
(Rs/unit)
LT Category 0.00 19566.18 0.00 0.00 16495.18 0.00 0.00 17310.54 0.00 0.00 18495.50 0.00 14141.81 19710.76 7.17
Category I (A&B) - Domestic 6524.54 0.00 6159.07 0.00 7021.44 0.00 7438.90 0.00 5849.48 8028.32 7.29
Category II (A,B, C & D) - Non-domestic/Commercial 2020.05 0.00 1893.01 0.00 2187.51 0.00 2267.73 0.00 1746.59 2350.89 7.43
Category III - Industrial 962.81 0.00 757.33 0.00 802.25 0.00 823.07 0.00 647.86 858.05 7.55
Category IV (A,&B) - Cottage Industries & Agrobased Ind. 16.95 0.00 8.92 0.00 9.12 0.00 9.72 0.00 6.50 10.14 6.41
Category V (A, B & C) - Irrigation and Agriculture 9190.49 0.00 6932.86 0.00 6517.67 0.00 7177.22 0.00 5357.19 7643.74 7.01
Category VI (A & B) - Local Bodies, St. Lighting & PWS 776.76 0.00 688.48 0.00 709.69 0.00 710.97 0.00 485.71 747.00 6.50
Category VII (A & B) - General Purpose & Religious Places 73.58 0.00 54.70 0.00 61.49 0.00 66.02 0.00 47.14 70.55 6.68
Category VIII -Temporary Supply 1.00 0.00 0.81 0.00 1.36 0.00 1.87 0.00 1.35 2.06 6.57
HT Category at 11 KV 0.00 3966.97 0.00 0.00 4065.83 0.00 0.00 4434.30 0.00 0.00 4511.72 0.00 3168.11 4761.42 6.65
HT-I Industry 2641.02 0.00 2662.92 0.00 2934.05 0.00 2943.59 0.00 2067.38 3087.57 6.70
HT-I (B) Ferro-Alloys 7.09 0.00 0.00 0.00 0.00 0.00 0.00 0.00 0.00 0.00
HT-II - Others 1092.70 0.00 1199.89 0.00 1325.20 0.00 1397.35 0.00 987.95 1497.32 6.60
HT-III Airports, Railway and Busstations 6.38 0.00 5.31 0.00 5.65 0.00 5.72 0.00 4.05 6.09 6.65
HT-IV A Lift Irrigation & Agriculture 30.70 0.00 39.08 0.00 19.63 0.00 18.37 0.00 11.50 18.37 6.26
HT - IV (B) Composite P.W.S Schemes 53.53 0.00 43.98 0.00 35.76 0.00 29.86 0.00 18.69 29.86 6.26
HT-VI Townships and Residential Colonies 87.91 0.00 76.00 0.00 79.38 0.00 83.84 0.00 54.76 88.55 6.18
HT-VII - Green Power 0.00 0.00 0.00 0.00 0.00 0.00
HT - VII - Temporary Supply 47.63 0.00 38.66 0.00 34.62 0.00 32.99 0.00 23.77 33.65 7.06
HT Category at 33 KV 0.00 4759.47 0.00 0.00 4634.04 0.00 0.00 4599.64 0.00 0.00 4120.43 0.00 2783.78 4880.21 5.70
HT-I Industry 3914.67 0.00 3978.24 0.00 3955.27 0.00 3452.75 0.00 2335.56 4154.72 5.62
HT-I (B) Ferro-Alloys 253.53 0.00 71.53 0.00 25.86 0.00 0.00 0.00 0.00 0.00
HT-II - Others 511.19 0.00 517.72 0.00 555.09 0.00 606.22 0.00 406.67 661.07 6.15
HT-III Airports, Railway and Busstations 0.00 0.00 0.00 0.00 0.00 0.00 0.00 0.00 0.00 0.00
HT-IV A Lift Irrigation & Agriculture 23.25 0.00 19.10 0.00 18.45 0.00 18.46 0.00 11.85 18.46 6.42
HT - IV (B) Composite P.W.S Schemes 24.42 0.00 3.86 0.00 2.35 0.00 0.86 0.00 0.55 0.86 6.41
HT-VI Townships and Residential Colonies 32.41 0.00 35.72 0.00 39.39 0.00 42.15 0.00 29.14 45.10 6.46
HT-VII - Green Power 0.00 0.00 0.00 0.00 0.00 0.00
HT - VII - Temporary Supply 0.00 0.00 7.88 0.00 3.23 0.00 0.00 0.00 0.00 0.00
HT Category at 132 KV 0.00 3577.10 0.00 0.00 2883.48 0.00 0.00 2739.46 0.00 0.00 2888.07 0.00 1950.84 3491.66 5.59
HT-I Industry 2653.29 0.00 2069.01 0.00 2001.80 0.00 1913.29 0.00 1163.46 2202.69 5.28
HT-I (B) Ferro-Alloys 104.35 0.00 135.38 0.00 129.67 0.00 151.94 0.00 79.74 165.81 4.81
HT-II - Others 39.92 0.00 47.37 0.00 58.52 0.00 63.05 0.00 40.65 67.92 5.99
HT-III Airports, Railway and Busstations 55.25 0.00 57.98 0.00 58.34 0.00 56.90 0.00 28.11 58.19 4.83
HT-IV A Lift Irrigation & Agriculture 566.73 0.00 406.82 0.00 342.89 0.00 554.68 0.00 529.08 831.16 6.37
HT - IV (B) Composite P.W.S Schemes 0.00 0.00 0.00 0.00 0.00 0.00 0.00 0.00 0.00 0.00
HT-V (A) Railway Traction 157.56 0.00 166.92 0.00 148.24 0.00 141.98 0.00 94.66 147.22 6.43
HT-V (B) HMR 6.22 0.00 15.14 18.66 8.11
HT-VI Townships and Residential Colonies 0.00 0.00 0.00 0.00 0.00 0.00 0.00 0.00 0.00 0.00
HT-VII - Green Power 0.00 0.00 0.00 0.00 0.00 0.00
HT - VII - Temporary Supply 0.00 0.00 0.00 0.00 0.00 0.00 0.00 0.00 0.00 0.00
Total 0.00 31869.73 0.00 0.00 28078.54 0.00 0.00 29083.94 0.00 0.00 30015.72 0.00 22044.55 32844.04 6.71
Consumer Categories
Base Year 2014-15 2015-16 2016-17 2017-18

Form 4
Total Sales, MU 31869.73 28078.54 29083.94 30015.72 32844.04 0.00
Sales ( LT, 11kV, 33kV) (MU) Form 3 28292.62 25195.06 26344.48 27127.65 29352.38 0.00
EHT Sales (MU) Form 3 3577.10 2883.48 2739.46 2888.07 3491.66 0.00
Total Losses, MU 7255.62 5806.52 5658.08 5420.01 5588.89 0.00
Distribution System Losses (MU) Form 4a 4847.47 4164.90 3814.08 3430.56 3582.87 0.00
Transmission System Losses (MU) 2408.16 1641.63 1844.00 1989.45 2006.02 0.00
Total Losses, (%) 18.54 17.14 16.29 15.30 14.54 0.00
Transmission Losses (%) 6.15 4.84 5.31 5.61 5.22 0.00
Distribution System Losses(%) Form 4a 14.63 14.19 12.65 11.23 10.88 0.00
Input to Distribution System 33140.09 29359.95 30158.56 30558.21 32935.25 0.00
Power Purchase Requirement (MU) 39125.35 33885.06 34742.02 35435.73 38432.93 0.00
Availability Form 4.1 39125.35 33885.06 34742.02 41924.11 46482.84 0.00
Dispatch Form 4.2 39125.35 33885.06 34742.02 35435.73 38432.93 0.00
Surplus /(deficit) 0.00 0.00 0.00 6488.38 8049.91 0.00
Note:
1. Transmission Losses percentage e.g. 4.52 % to be entered in numbers as 4.52 in Form 4b only
2. Transmission Losses to include PGCIL Losses.
3. The Transmission Losses percentage should be consistent with calculations in Form 4b
2017-18 2018-19
Power Purchase Requirement
Particulars Detail Links Base Year 2014-15 2015-16 2016-17

Form A New Consumer Categories
Notes:
1 Add any proposed category here, in the tables provided under corresponding voltage levels.
2 Select the category which is being modified/replaced in the EXISTING CATEGORY Field.
3 Provide the name of the proposed category in the PROPOSED CATEGORY Field
4 Modifications of Slabs/SubCategories should be done in the Form 7/ Form 12. See the notes in the corresponding Forms for detailed instructions
For LT Category For HT Category - 11kV
For HT Category - 33kV For HT Category - 132kV
Modification/Replacement of existing Category Existing Category Proposed Category Remarks
Modification/Replacement of existing Category Existing Category Proposed Category RemarksModification/Replacement of existing
CategoryExisting Category Proposed Category Remarks
Modification/Replacement of existing
CategoryExisting Category Proposed Category Remarks
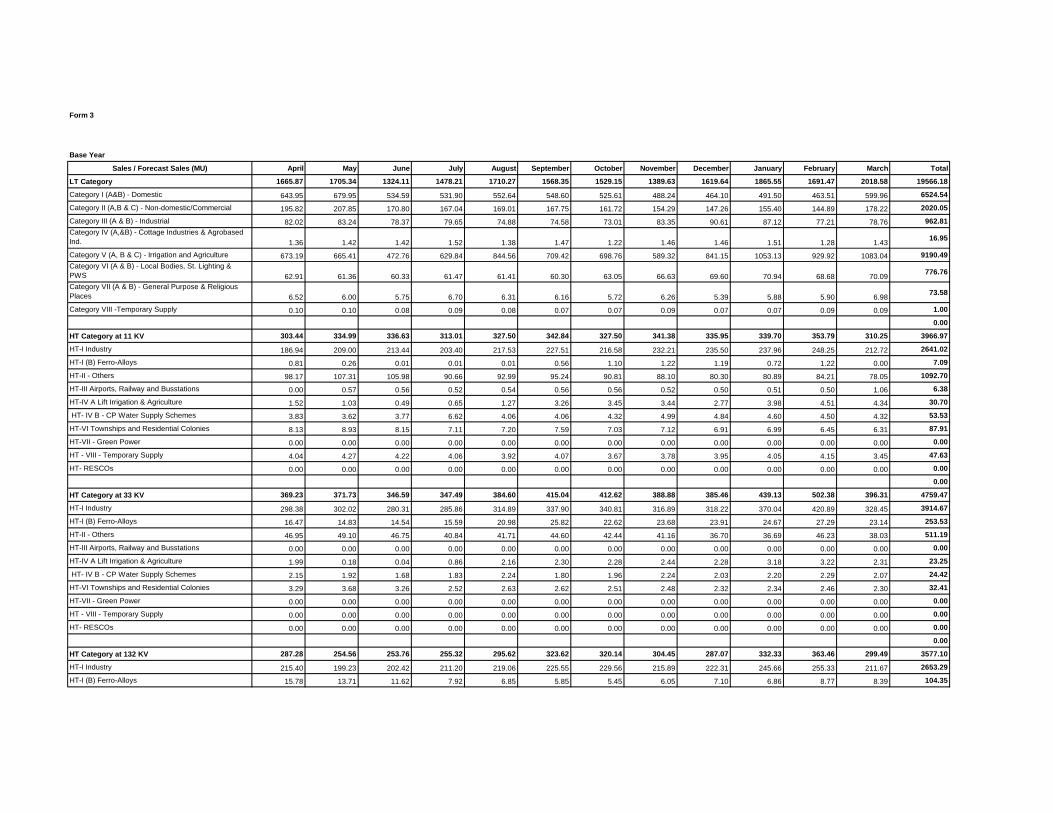
Form 3
10061 10062 10063 10064 10065 10066 10067 10068 10069 10070 10071 10072Base Year
Sales / Forecast Sales (MU) April May June July August September October November December January February March Total
LT Category 1665.87 1705.34 1324.11 1478.21 1710.27 1568.35 1529.15 1389.63 1619.64 1865.55 1691.47 2018.58 19566.18
Category I (A&B) - Domestic 643.95 679.95 534.59 531.90 552.64 548.60 525.61 488.24 464.10 491.50 463.51 599.96 6524.54
Category II (A,B & C) - Non-domestic/Commercial 195.82 207.85 170.80 167.04 169.01 167.75 161.72 154.29 147.26 155.40 144.89 178.22 2020.05
Category III (A & B) - Industrial 82.02 83.24 78.37 79.65 74.88 74.58 73.01 83.35 90.61 87.12 77.21 78.76 962.81
Category IV (A,&B) - Cottage Industries & Agrobased
Ind. 1.36 1.42 1.42 1.52 1.38 1.47 1.22 1.46 1.46 1.51 1.28 1.4316.95
Category V (A, B & C) - Irrigation and Agriculture 673.19 665.41 472.76 629.84 844.56 709.42 698.76 589.32 841.15 1053.13 929.92 1083.04 9190.49
Category VI (A & B) - Local Bodies, St. Lighting &
PWS 62.91 61.36 60.33 61.47 61.41 60.30 63.05 66.63 69.60 70.94 68.68 70.09776.76
Category VII (A & B) - General Purpose & Religious
Places 6.52 6.00 5.75 6.70 6.31 6.16 5.72 6.26 5.39 5.88 5.90 6.9873.58
Category VIII -Temporary Supply 0.10 0.10 0.08 0.09 0.08 0.07 0.07 0.09 0.07 0.07 0.09 0.09 1.00
0.00
HT Category at 11 KV 303.44 334.99 336.63 313.01 327.50 342.84 327.50 341.38 335.95 339.70 353.79 310.25 3966.97
HT-I Industry 186.94 209.00 213.44 203.40 217.53 227.51 216.58 232.21 235.50 237.96 248.25 212.72 2641.02
HT-I (B) Ferro-Alloys 0.81 0.26 0.01 0.01 0.01 0.56 1.10 1.22 1.19 0.72 1.22 0.00 7.09
HT-II - Others 98.17 107.31 105.98 90.66 92.99 95.24 90.81 88.10 80.30 80.89 84.21 78.05 1092.70
HT-III Airports, Railway and Busstations 0.00 0.57 0.56 0.52 0.54 0.56 0.56 0.52 0.50 0.51 0.50 1.06 6.38
HT-IV A Lift Irrigation & Agriculture 1.52 1.03 0.49 0.65 1.27 3.26 3.45 3.44 2.77 3.98 4.51 4.34 30.70
HT- IV B - CP Water Supply Schemes 3.83 3.62 3.77 6.62 4.06 4.06 4.32 4.99 4.84 4.60 4.50 4.32 53.53
HT-VI Townships and Residential Colonies 8.13 8.93 8.15 7.11 7.20 7.59 7.03 7.12 6.91 6.99 6.45 6.31 87.91
HT-VII - Green Power 0.00 0.00 0.00 0.00 0.00 0.00 0.00 0.00 0.00 0.00 0.00 0.00 0.00
HT - VIII - Temporary Supply 4.04 4.27 4.22 4.06 3.92 4.07 3.67 3.78 3.95 4.05 4.15 3.45 47.63
HT- RESCOs 0.00 0.00 0.00 0.00 0.00 0.00 0.00 0.00 0.00 0.00 0.00 0.00 0.00
0.00
HT Category at 33 KV 369.23 371.73 346.59 347.49 384.60 415.04 412.62 388.88 385.46 439.13 502.38 396.31 4759.47
HT-I Industry 298.38 302.02 280.31 285.86 314.89 337.90 340.81 316.89 318.22 370.04 420.89 328.45 3914.67
HT-I (B) Ferro-Alloys 16.47 14.83 14.54 15.59 20.98 25.82 22.62 23.68 23.91 24.67 27.29 23.14 253.53
HT-II - Others 46.95 49.10 46.75 40.84 41.71 44.60 42.44 41.16 36.70 36.69 46.23 38.03 511.19
HT-III Airports, Railway and Busstations 0.00 0.00 0.00 0.00 0.00 0.00 0.00 0.00 0.00 0.00 0.00 0.00 0.00
HT-IV A Lift Irrigation & Agriculture 1.99 0.18 0.04 0.86 2.16 2.30 2.28 2.44 2.28 3.18 3.22 2.31 23.25
HT- IV B - CP Water Supply Schemes 2.15 1.92 1.68 1.83 2.24 1.80 1.96 2.24 2.03 2.20 2.29 2.07 24.42
HT-VI Townships and Residential Colonies 3.29 3.68 3.26 2.52 2.63 2.62 2.51 2.48 2.32 2.34 2.46 2.30 32.41
HT-VII - Green Power 0.00 0.00 0.00 0.00 0.00 0.00 0.00 0.00 0.00 0.00 0.00 0.00 0.00
HT - VIII - Temporary Supply 0.00 0.00 0.00 0.00 0.00 0.00 0.00 0.00 0.00 0.00 0.00 0.00 0.00
HT- RESCOs 0.00 0.00 0.00 0.00 0.00 0.00 0.00 0.00 0.00 0.00 0.00 0.00 0.00
0.00
HT Category at 132 KV 287.28 254.56 253.76 255.32 295.62 323.62 320.14 304.45 287.07 332.33 363.46 299.49 3577.10
HT-I Industry 215.40 199.23 202.42 211.20 219.06 225.55 229.56 215.89 222.31 245.66 255.33 211.67 2653.29
HT-I (B) Ferro-Alloys 15.78 13.71 11.62 7.92 6.85 5.85 5.45 6.05 7.10 6.86 8.77 8.39 104.35

HT-II - Others 3.71 4.25 4.14 3.43 3.19 3.50 3.18 3.24 2.86 2.67 2.95 2.80 39.92
HT-III Airports, Railway and Busstations 5.09 5.39 5.29 4.57 4.55 4.84 4.68 4.38 4.01 4.09 4.28 4.08 55.25
HT-IV A Lift Irrigation & Agriculture 35.38 19.47 17.85 15.99 50.34 70.81 64.23 61.33 38.39 57.30 77.33 58.31 566.73
HT- IV B - CP Water Supply Schemes 0.00 0.00 0.00 0.00 0.00 0.00 0.00 0.00 0.00 0.00 0.00 0.00 0.00
HT-V Railway Traction 11.92 12.53 12.44 12.22 11.63 13.07 13.03 13.55 12.39 15.75 14.79 14.24 157.56
HT-VI Townships and Residential Colonies 0.00 0.00 0.00 0.00 0.00 0.00 0.00 0.00 0.00 0.00 0.00 0.00 0.00
HT-VII - Green Power 0.00 0.00 0.00 0.00 0.00 0.00 0.00 0.00 0.00 0.00 0.00 0.00 0.00
HT - VIII - Temporary Supply 0.00 0.00 0.00 0.00 0.00 0.00 0.00 0.00 0.00 0.00 0.00 0.00 0.00
HT- RESCOs 0.00 0.00 0.00 0.00 0.00 0.00 0.00 0.00 0.00 0.00 0.00 0.00 0.00
0.00
Total 2625.82 2666.62 2261.08 2394.04 2718.00 2649.85 2589.41 2424.35 2628.12 2976.71 2911.10 3024.62 31869.73
2014-15
Sales / Forecast Sales (MU) April May June July August September October November December January February March Total
LT Category 1454.62 1326.12 1259.41 1356.07 1471.05 1453.63 1415.96 1195.53 1324.26 1342.00 1275.46 1621.07 16495.18
Category I (A&B) - Domestic 584.11 627.06 553.80 478.30 507.10 535.54 461.68 451.20 470.51 442.21 464.19 583.37 6159.07
Category II (A,B & C) - Non-domestic/Commercial 172.88 186.28 167.00 150.18 151.72 161.81 142.33 144.33 148.51 140.44 149.26 178.29 1893.01
Category III (A & B) - Industrial 61.00 65.61 59.51 59.89 58.56 61.30 55.84 65.91 73.73 66.72 62.28 66.99 757.33
Category IV (A,&B) - Cottage Industries & Agrobased
Ind. 0.74 0.76 0.67 0.77 0.66 0.72 0.71 0.79 0.82 0.75 0.70 0.838.92
Category V (A, B & C) - Irrigation and Agriculture 574.45 385.41 418.36 605.91 691.16 631.92 693.16 470.88 566.65 628.57 539.32 727.07 6932.86
Category VI (A & B) - Local Bodies, St. Lighting &
PWS 56.87 56.65 55.44 56.34 57.15 57.69 57.95 57.77 59.24 59.11 55.02 59.26688.48
Category VII (A & B) - General Purpose & Religious
Places 4.51 4.29 4.57 4.64 4.64 4.59 4.22 4.58 4.75 4.12 4.60 5.1954.70
Category VIII -Temporary Supply 0.07 0.07 0.06 0.04 0.06 0.06 0.07 0.08 0.06 0.08 0.09 0.08 0.81
0.00
HT Category at 11 KV 337.89 348.84 369.49 325.83 324.77 345.07 315.74 332.29 343.39 342.02 351.69 328.80 4065.83
HT-I Industry 217.86 218.92 232.89 213.13 213.62 225.27 200.65 216.66 232.57 234.02 236.58 220.74 2662.92
HT-I (B) Ferro-Alloys 0.00 0.00 0.00 0.00 0.00 0.00 0.00 0.00 0.00 0.00 0.00 0.00 0.00
HT-II - Others 100.45 114.26 120.88 99.24 96.39 102.81 97.28 97.40 93.63 89.49 96.05 92.01 1199.89
HT-III Airports, Railway and Busstations 0.38 0.50 0.42 0.35 0.35 0.50 0.50 0.50 0.46 0.45 0.45 0.45 5.31
HT-IV A Lift Irrigation & Agriculture 5.54 1.13 0.66 0.87 1.75 3.11 4.40 4.25 3.28 4.57 5.09 4.45 39.08
HT- IV B - CP Water Supply Schemes 3.61 3.71 3.56 3.04 3.39 3.70 3.67 4.12 4.07 4.07 4.10 2.94 43.98
HT-VI Townships and Residential Colonies 6.62 7.20 7.69 6.28 6.00 6.25 6.26 6.00 5.90 6.04 6.21 5.54 76.00
HT-VII - Green Power 0.00 0.00 0.00 0.00 0.00 0.00 0.00 0.00 0.00 0.00 0.00 0.00 0.00
HT -VIII - Temporary Supply 3.43 3.13 3.37 2.93 3.28 3.43 2.98 3.36 3.48 3.40 3.20 2.67 38.66
HT - RESCOs 0.00 0.00 0.00 0.00 0.00 0.00 0.00 0.00 0.00 0.00 0.00 0.00 0.00
0.00
HT Category at 33 KV 396.09 371.83 425.87 391.86 388.22 386.86 375.96 367.60 390.09 381.61 385.07 372.99 4634.04
HT-I Industry 340.44 314.68 362.67 336.43 332.93 330.30 318.27 313.29 338.10 331.39 334.78 324.96 3978.24
HT-I (B) Ferro-Alloys 5.42 5.71 6.68 5.55 5.88 7.02 6.25 6.23 7.04 5.78 5.40 4.55 71.53
HT-II - Others 44.60 47.19 52.18 46.08 44.68 44.46 45.83 41.12 39.07 37.71 38.01 36.80 517.72
HT-III Airports, Railway and Busstations 0.00 0.00 0.00 0.00 0.00 0.00 0.00 0.00 0.00 0.00 0.00 0.00 0.00

HT-IV A Lift Irrigation & Agriculture 1.79 0.40 0.13 0.47 1.62 1.94 2.22 2.16 1.57 2.49 2.35 1.95 19.10
HT- IV B - CP Water Supply Schemes 0.39 0.38 0.32 0.35 0.31 0.30 0.31 0.31 0.33 0.29 0.31 0.26 3.86
HT-VI Townships and Residential Colonies 3.46 3.46 3.89 2.98 2.80 2.84 2.95 2.70 2.60 2.66 2.77 2.60 35.72
HT-VII - Green Power 0.00 0.00 0.00 0.00 0.00 0.00 0.00 0.00 0.00 0.00 0.00 0.00 0.00
HT -VIII - Temporary Supply 0.00 0.00 0.00 0.00 0.00 0.00 0.13 1.77 1.38 1.28 1.44 1.88 7.88
HT - RESCOs 0.00 0.00 0.00 0.00 0.00 0.00 0.00 0.00 0.00 0.00 0.00 0.00 0.00
0.00
HT Category at 132 KV 226.64 200.23 217.40 207.69 268.83 259.51 257.47 260.78 264.25 251.50 235.06 234.12 2883.48
HT-I Industry 156.68 150.00 156.13 159.46 169.73 178.30 170.96 179.47 186.53 204.39 180.54 176.81 2069.01
HT-I (B) Ferro-Alloys 7.34 8.59 8.84 11.83 12.70 9.19 13.67 14.61 12.69 13.27 12.12 10.53 135.38
HT-II - Others 3.79 4.14 4.75 4.38 4.13 4.16 4.02 3.56 3.46 3.41 3.68 3.88 47.37
HT-III Airports, Railway and Busstations 5.20 5.23 5.69 5.07 4.99 5.26 4.81 4.58 4.24 4.14 4.34 4.44 57.98
HT-IV A Lift Irrigation & Agriculture 38.29 16.87 27.38 11.89 63.19 48.88 50.58 45.73 44.52 12.01 20.69 26.78 406.82
HT- IV B - CP Water Supply Schemes 0.00 0.00 0.00 0.00 0.00 0.00 0.00 0.00 0.00 0.00 0.00 0.00 0.00
HT-V Railway Traction 15.34 15.40 14.62 15.06 14.10 13.71 13.44 12.82 12.80 14.27 13.69 11.68 166.92
HT-VI Townships and Residential Colonies 0.00 0.00 0.00 0.00 0.00 0.00 0.00 0.00 0.00 0.00 0.00 0.00 0.00
HT-VII - Green Power 0.00 0.00 0.00 0.00 0.00 0.00 0.00 0.00 0.00 0.00 0.00 0.00 0.00
HT -VIII - Temporary Supply 0.00 0.00 0.00 0.00 0.00 0.00 0.00 0.00 0.00 0.00 0.00 0.00 0.00
HT - RESCOs 0.00 0.00 0.00 0.00 0.00 0.00 0.00 0.00 0.00 0.00 0.00 0.00 0.00
0.00
Total 2415.25 2247.02 2272.17 2281.46 2452.87 2445.07 2365.14 2156.20 2321.99 2317.12 2247.27 2556.99 28078.54
2015-16
Sales / Forecast Sales (MU) April May June July August September October November December January February March Total
LT Category 1345.91 1475.90 1194.82 1579.18 1509.98 1399.14 1512.49 1360.73 1425.66 1414.72 1431.30 1660.71 17310.54
Category I (A&B) - Domestic 641.81 689.42 571.52 621.12 587.86 559.20 576.77 521.29 516.58 499.08 549.35 687.42 7021.44
Category II (A,B & C) - Non-domestic/Commercial 194.42 198.23 176.87 190.09 182.25 169.95 177.88 168.54 171.05 168.18 180.05 210.01 2187.51
Category III (A & B) - Industrial 69.29 64.19 63.44 64.76 64.80 59.44 62.03 66.84 73.58 74.82 68.22 70.85 802.25
Category IV (A,&B) - Cottage Industries & Agrobased
Ind. 0.80 0.76 0.74 0.74 0.79 0.67 0.77 0.70 0.84 0.66 0.80 0.849.12
Category V (A, B & C) - Irrigation and Agriculture 374.80 459.53 318.89 638.48 609.98 544.50 630.08 538.58 598.33 608.24 569.39 626.87 6517.67
Category VI (A & B) - Local Bodies, St. Lighting &
PWS 59.85 59.18 58.69 58.33 58.78 60.11 60.18 59.61 60.14 59.05 57.68 58.11709.69
Category VII (A & B) - General Purpose & Religious
Places 4.86 4.47 4.58 5.56 5.42 5.18 4.67 5.08 5.01 4.56 5.67 6.4561.49
Category VIII -Temporary Supply 0.08 0.12 0.09 0.10 0.10 0.09 0.11 0.10 0.12 0.14 0.14 0.17 1.36
0.00
HT Category at 11 KV 381.81 381.40 391.84 371.25 376.77 367.52 346.53 373.32 360.40 355.51 362.43 365.51 4434.30
HT-I Industry 250.97 246.57 250.49 245.98 247.99 240.60 227.82 241.31 246.52 247.79 246.65 241.35 2934.05
HT-I (B) Ferro-Alloys 0.00 0.00 0.00 0.00 0.00 0.00 0.00 0.00 0.00 0.00 0.00 0.00
HT-II - Others 113.66 120.07 126.38 111.45 114.93 113.59 105.72 110.78 100.13 94.79 102.86 110.85 1325.20
HT-III Airports, Railway and Busstations 0.51 0.53 0.56 0.46 0.49 0.46 0.44 0.50 0.42 0.40 0.41 0.48 5.65
HT-IV A Lift Irrigation & Agriculture 3.42 0.72 0.36 0.65 0.70 0.70 0.75 8.30 1.46 1.09 0.82 0.68 19.63
HT- IV B - CP Water Supply Schemes 3.31 3.13 3.23 3.16 3.02 2.79 2.96 3.42 2.87 2.76 2.65 2.47 35.76
HT-VI Townships and Residential Colonies 7.13 7.29 7.93 6.64 6.66 6.49 6.17 6.13 5.96 5.85 6.29 6.85 79.38
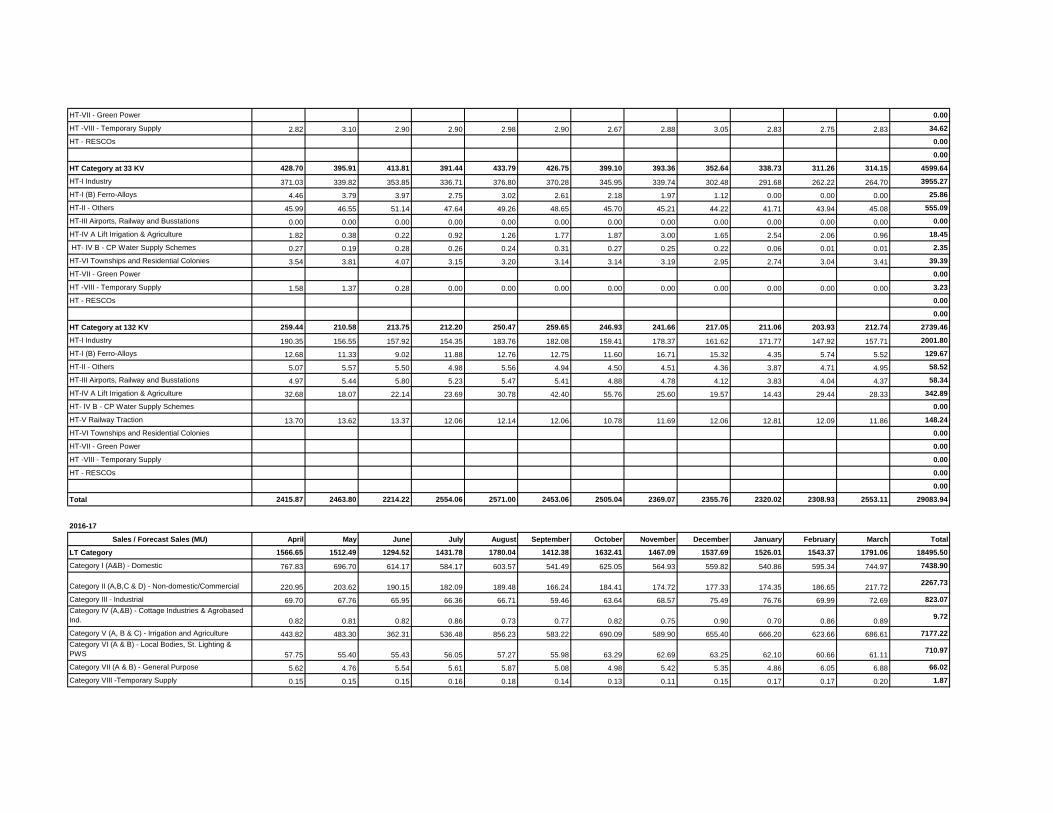
HT-VII - Green Power 0.00
HT -VIII - Temporary Supply 2.82 3.10 2.90 2.90 2.98 2.90 2.67 2.88 3.05 2.83 2.75 2.83 34.62
HT - RESCOs 0.00
0.00
HT Category at 33 KV 428.70 395.91 413.81 391.44 433.79 426.75 399.10 393.36 352.64 338.73 311.26 314.15 4599.64
HT-I Industry 371.03 339.82 353.85 336.71 376.80 370.28 345.95 339.74 302.48 291.68 262.22 264.70 3955.27
HT-I (B) Ferro-Alloys 4.46 3.79 3.97 2.75 3.02 2.61 2.18 1.97 1.12 0.00 0.00 0.00 25.86
HT-II - Others 45.99 46.55 51.14 47.64 49.26 48.65 45.70 45.21 44.22 41.71 43.94 45.08 555.09
HT-III Airports, Railway and Busstations 0.00 0.00 0.00 0.00 0.00 0.00 0.00 0.00 0.00 0.00 0.00 0.00 0.00
HT-IV A Lift Irrigation & Agriculture 1.82 0.38 0.22 0.92 1.26 1.77 1.87 3.00 1.65 2.54 2.06 0.96 18.45
HT- IV B - CP Water Supply Schemes 0.27 0.19 0.28 0.26 0.24 0.31 0.27 0.25 0.22 0.06 0.01 0.01 2.35
HT-VI Townships and Residential Colonies 3.54 3.81 4.07 3.15 3.20 3.14 3.14 3.19 2.95 2.74 3.04 3.41 39.39
HT-VII - Green Power 0.00
HT -VIII - Temporary Supply 1.58 1.37 0.28 0.00 0.00 0.00 0.00 0.00 0.00 0.00 0.00 0.00 3.23
HT - RESCOs 0.00
0.00
HT Category at 132 KV 259.44 210.58 213.75 212.20 250.47 259.65 246.93 241.66 217.05 211.06 203.93 212.74 2739.46
HT-I Industry 190.35 156.55 157.92 154.35 183.76 182.08 159.41 178.37 161.62 171.77 147.92 157.71 2001.80
HT-I (B) Ferro-Alloys 12.68 11.33 9.02 11.88 12.76 12.75 11.60 16.71 15.32 4.35 5.74 5.52 129.67
HT-II - Others 5.07 5.57 5.50 4.98 5.56 4.94 4.50 4.51 4.36 3.87 4.71 4.95 58.52
HT-III Airports, Railway and Busstations 4.97 5.44 5.80 5.23 5.47 5.41 4.88 4.78 4.12 3.83 4.04 4.37 58.34
HT-IV A Lift Irrigation & Agriculture 32.68 18.07 22.14 23.69 30.78 42.40 55.76 25.60 19.57 14.43 29.44 28.33 342.89
HT- IV B - CP Water Supply Schemes 0.00
HT-V Railway Traction 13.70 13.62 13.37 12.06 12.14 12.06 10.78 11.69 12.06 12.81 12.09 11.86 148.24
HT-VI Townships and Residential Colonies 0.00
HT-VII - Green Power 0.00
HT -VIII - Temporary Supply 0.00
HT - RESCOs 0.00
0.00
Total 2415.87 2463.80 2214.22 2554.06 2571.00 2453.06 2505.04 2369.07 2355.76 2320.02 2308.93 2553.11 29083.94
2016-17
Sales / Forecast Sales (MU) April May June July August September October November December January February March Total
LT Category 1566.65 1512.49 1294.52 1431.78 1780.04 1412.38 1632.41 1467.09 1537.69 1526.01 1543.37 1791.06 18495.50
Category I (A&B) - Domestic 767.83 696.70 614.17 584.17 603.57 541.49 625.05 564.93 559.82 540.86 595.34 744.97 7438.90
Category II (A,B,C & D) - Non-domestic/Commercial 220.95 203.62 190.15 182.09 189.48 166.24 184.41 174.72 177.33 174.35 186.65 217.722267.73
Category III - Industrial 69.70 67.76 65.95 66.36 66.71 59.46 63.64 68.57 75.49 76.76 69.99 72.69 823.07
Category IV (A,&B) - Cottage Industries & Agrobased
Ind. 0.82 0.81 0.82 0.86 0.73 0.77 0.82 0.75 0.90 0.70 0.86 0.899.72
Category V (A, B & C) - Irrigation and Agriculture 443.82 483.30 362.31 536.48 856.23 583.22 690.09 589.90 655.40 666.20 623.66 686.61 7177.22
Category VI (A & B) - Local Bodies, St. Lighting &
PWS 57.75 55.40 55.43 56.05 57.27 55.98 63.29 62.69 63.25 62.10 60.66 61.11710.97
Category VII (A & B) - General Purpose 5.62 4.76 5.54 5.61 5.87 5.08 4.98 5.42 5.35 4.86 6.05 6.88 66.02
Category VIII -Temporary Supply 0.15 0.15 0.15 0.16 0.18 0.14 0.13 0.11 0.15 0.17 0.17 0.20 1.87
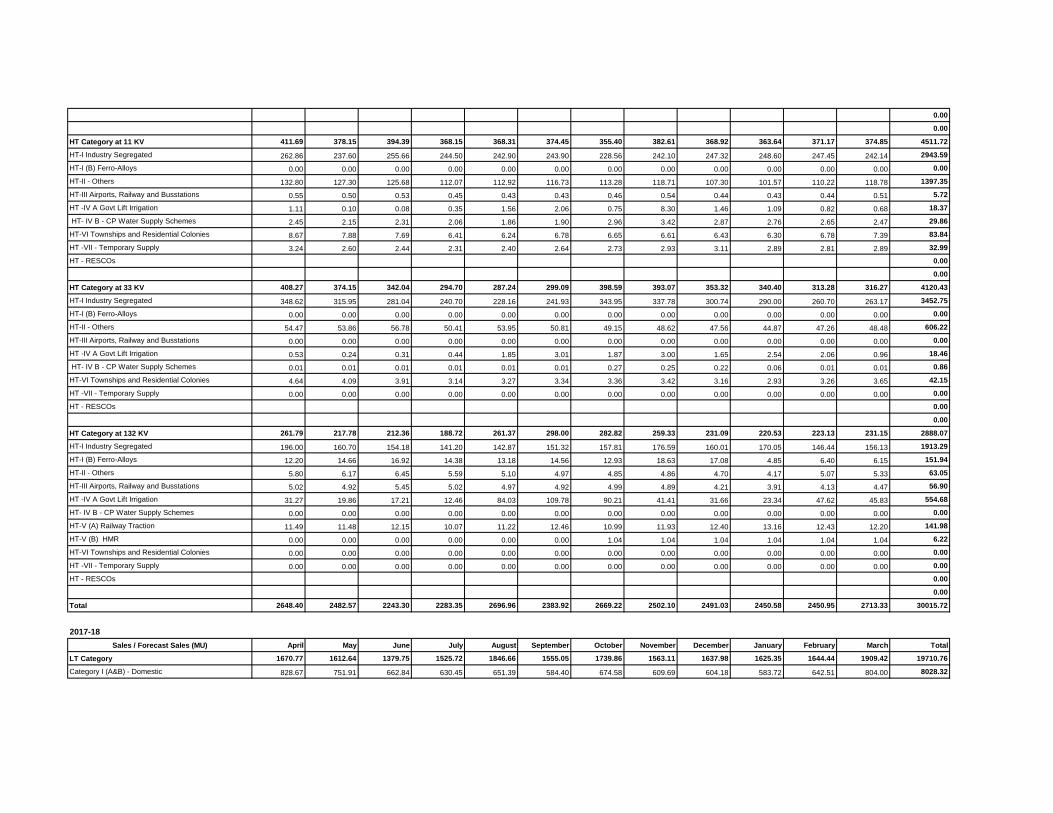
0.00
0.00
HT Category at 11 KV 411.69 378.15 394.39 368.15 368.31 374.45 355.40 382.61 368.92 363.64 371.17 374.85 4511.72
HT-I Industry Segregated 262.86 237.60 255.66 244.50 242.90 243.90 228.56 242.10 247.32 248.60 247.45 242.14 2943.59
HT-I (B) Ferro-Alloys 0.00 0.00 0.00 0.00 0.00 0.00 0.00 0.00 0.00 0.00 0.00 0.00 0.00
HT-II - Others 132.80 127.30 125.68 112.07 112.92 116.73 113.28 118.71 107.30 101.57 110.22 118.78 1397.35
HT-III Airports, Railway and Busstations 0.55 0.50 0.53 0.45 0.43 0.43 0.46 0.54 0.44 0.43 0.44 0.51 5.72
HT -IV A Govt Lift Irrigation 1.11 0.10 0.08 0.35 1.56 2.06 0.75 8.30 1.46 1.09 0.82 0.68 18.37
HT- IV B - CP Water Supply Schemes 2.45 2.15 2.31 2.06 1.86 1.90 2.96 3.42 2.87 2.76 2.65 2.47 29.86
HT-VI Townships and Residential Colonies 8.67 7.88 7.69 6.41 6.24 6.78 6.65 6.61 6.43 6.30 6.78 7.39 83.84
HT -VII - Temporary Supply 3.24 2.60 2.44 2.31 2.40 2.64 2.73 2.93 3.11 2.89 2.81 2.89 32.99
HT - RESCOs 0.00
0.00
HT Category at 33 KV 408.27 374.15 342.04 294.70 287.24 299.09 398.59 393.07 353.32 340.40 313.28 316.27 4120.43
HT-I Industry Segregated 348.62 315.95 281.04 240.70 228.16 241.93 343.95 337.78 300.74 290.00 260.70 263.17 3452.75
HT-I (B) Ferro-Alloys 0.00 0.00 0.00 0.00 0.00 0.00 0.00 0.00 0.00 0.00 0.00 0.00 0.00
HT-II - Others 54.47 53.86 56.78 50.41 53.95 50.81 49.15 48.62 47.56 44.87 47.26 48.48 606.22
HT-III Airports, Railway and Busstations 0.00 0.00 0.00 0.00 0.00 0.00 0.00 0.00 0.00 0.00 0.00 0.00 0.00
HT -IV A Govt Lift Irrigation 0.53 0.24 0.31 0.44 1.85 3.01 1.87 3.00 1.65 2.54 2.06 0.96 18.46
HT- IV B - CP Water Supply Schemes 0.01 0.01 0.01 0.01 0.01 0.01 0.27 0.25 0.22 0.06 0.01 0.01 0.86
HT-VI Townships and Residential Colonies 4.64 4.09 3.91 3.14 3.27 3.34 3.36 3.42 3.16 2.93 3.26 3.65 42.15
HT -VII - Temporary Supply 0.00 0.00 0.00 0.00 0.00 0.00 0.00 0.00 0.00 0.00 0.00 0.00 0.00
HT - RESCOs 0.00
0.00
HT Category at 132 KV 261.79 217.78 212.36 188.72 261.37 298.00 282.82 259.33 231.09 220.53 223.13 231.15 2888.07
HT-I Industry Segregated 196.00 160.70 154.18 141.20 142.87 151.32 157.81 176.59 160.01 170.05 146.44 156.13 1913.29
HT-I (B) Ferro-Alloys 12.20 14.66 16.92 14.38 13.18 14.56 12.93 18.63 17.08 4.85 6.40 6.15 151.94
HT-II - Others 5.80 6.17 6.45 5.59 5.10 4.97 4.85 4.86 4.70 4.17 5.07 5.33 63.05
HT-III Airports, Railway and Busstations 5.02 4.92 5.45 5.02 4.97 4.92 4.99 4.89 4.21 3.91 4.13 4.47 56.90
HT -IV A Govt Lift Irrigation 31.27 19.86 17.21 12.46 84.03 109.78 90.21 41.41 31.66 23.34 47.62 45.83 554.68
HT- IV B - CP Water Supply Schemes 0.00 0.00 0.00 0.00 0.00 0.00 0.00 0.00 0.00 0.00 0.00 0.00 0.00
HT-V (A) Railway Traction 11.49 11.48 12.15 10.07 11.22 12.46 10.99 11.93 12.40 13.16 12.43 12.20 141.98
HT-V (B) HMR 0.00 0.00 0.00 0.00 0.00 0.00 1.04 1.04 1.04 1.04 1.04 1.04 6.22
HT-VI Townships and Residential Colonies 0.00 0.00 0.00 0.00 0.00 0.00 0.00 0.00 0.00 0.00 0.00 0.00 0.00
HT -VII - Temporary Supply 0.00 0.00 0.00 0.00 0.00 0.00 0.00 0.00 0.00 0.00 0.00 0.00 0.00
HT - RESCOs 0.00
0.00
Total 2648.40 2482.57 2243.30 2283.35 2696.96 2383.92 2669.22 2502.10 2491.03 2450.58 2450.95 2713.33 30015.72
2017-18
Sales / Forecast Sales (MU) April May June July August September October November December January February March Total
LT Category 1670.77 1612.64 1379.75 1525.72 1846.66 1555.05 1739.86 1563.11 1637.98 1625.35 1644.44 1909.42 19710.76
Category I (A&B) - Domestic 828.67 751.91 662.84 630.45 651.39 584.40 674.58 609.69 604.18 583.72 642.51 804.00 8028.32
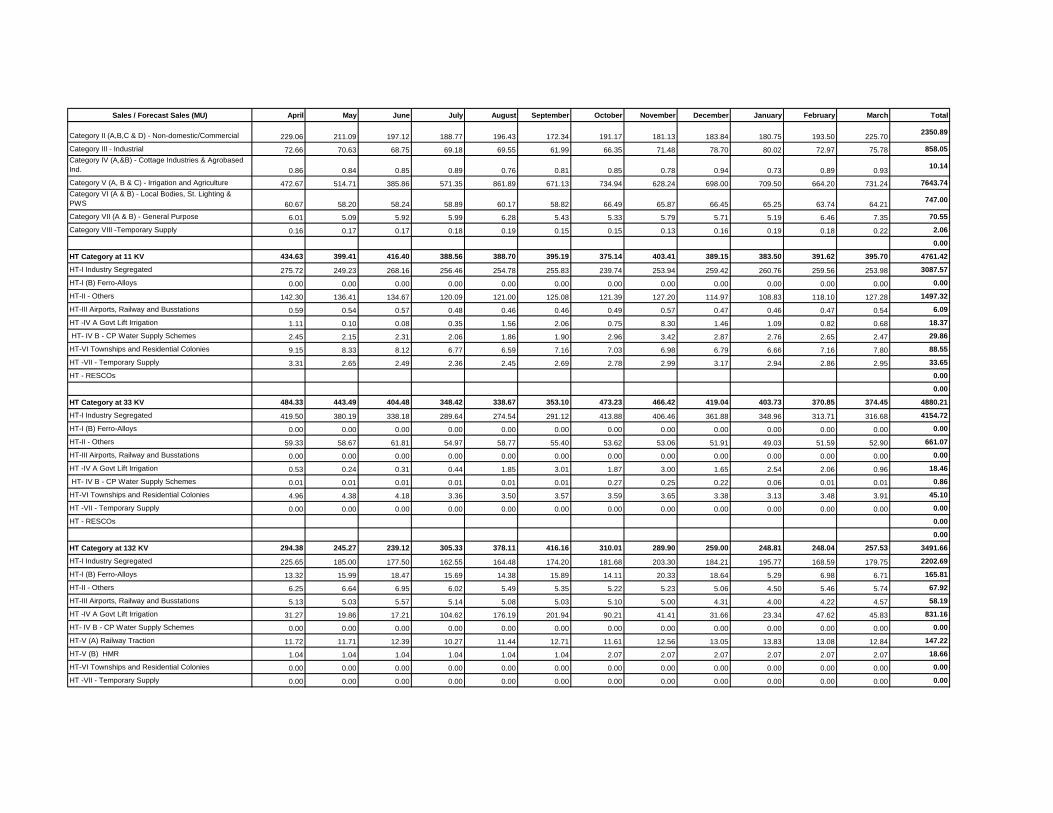
Sales / Forecast Sales (MU) April May June July August September October November December January February March Total
Category II (A,B,C & D) - Non-domestic/Commercial 229.06 211.09 197.12 188.77 196.43 172.34 191.17 181.13 183.84 180.75 193.50 225.702350.89
Category III - Industrial 72.66 70.63 68.75 69.18 69.55 61.99 66.35 71.48 78.70 80.02 72.97 75.78 858.05
Category IV (A,&B) - Cottage Industries & Agrobased
Ind. 0.86 0.84 0.85 0.89 0.76 0.81 0.85 0.78 0.94 0.73 0.89 0.9310.14
Category V (A, B & C) - Irrigation and Agriculture 472.67 514.71 385.86 571.35 861.89 671.13 734.94 628.24 698.00 709.50 664.20 731.24 7643.74
Category VI (A & B) - Local Bodies, St. Lighting &
PWS 60.67 58.20 58.24 58.89 60.17 58.82 66.49 65.87 66.45 65.25 63.74 64.21747.00
Category VII (A & B) - General Purpose 6.01 5.09 5.92 5.99 6.28 5.43 5.33 5.79 5.71 5.19 6.46 7.35 70.55
Category VIII -Temporary Supply 0.16 0.17 0.17 0.18 0.19 0.15 0.15 0.13 0.16 0.19 0.18 0.22 2.06
0.00
HT Category at 11 KV 434.63 399.41 416.40 388.56 388.70 395.19 375.14 403.41 389.15 383.50 391.62 395.70 4761.42
HT-I Industry Segregated 275.72 249.23 268.16 256.46 254.78 255.83 239.74 253.94 259.42 260.76 259.56 253.98 3087.57
HT-I (B) Ferro-Alloys 0.00 0.00 0.00 0.00 0.00 0.00 0.00 0.00 0.00 0.00 0.00 0.00 0.00
HT-II - Others 142.30 136.41 134.67 120.09 121.00 125.08 121.39 127.20 114.97 108.83 118.10 127.28 1497.32
HT-III Airports, Railway and Busstations 0.59 0.54 0.57 0.48 0.46 0.46 0.49 0.57 0.47 0.46 0.47 0.54 6.09
HT -IV A Govt Lift Irrigation 1.11 0.10 0.08 0.35 1.56 2.06 0.75 8.30 1.46 1.09 0.82 0.68 18.37
HT- IV B - CP Water Supply Schemes 2.45 2.15 2.31 2.06 1.86 1.90 2.96 3.42 2.87 2.76 2.65 2.47 29.86
HT-VI Townships and Residential Colonies 9.15 8.33 8.12 6.77 6.59 7.16 7.03 6.98 6.79 6.66 7.16 7.80 88.55
HT -VII - Temporary Supply 3.31 2.65 2.49 2.36 2.45 2.69 2.78 2.99 3.17 2.94 2.86 2.95 33.65
HT - RESCOs 0.00
0.00
HT Category at 33 KV 484.33 443.49 404.48 348.42 338.67 353.10 473.23 466.42 419.04 403.73 370.85 374.45 4880.21
HT-I Industry Segregated 419.50 380.19 338.18 289.64 274.54 291.12 413.88 406.46 361.88 348.96 313.71 316.68 4154.72
HT-I (B) Ferro-Alloys 0.00 0.00 0.00 0.00 0.00 0.00 0.00 0.00 0.00 0.00 0.00 0.00 0.00
HT-II - Others 59.33 58.67 61.81 54.97 58.77 55.40 53.62 53.06 51.91 49.03 51.59 52.90 661.07
HT-III Airports, Railway and Busstations 0.00 0.00 0.00 0.00 0.00 0.00 0.00 0.00 0.00 0.00 0.00 0.00 0.00
HT -IV A Govt Lift Irrigation 0.53 0.24 0.31 0.44 1.85 3.01 1.87 3.00 1.65 2.54 2.06 0.96 18.46
HT- IV B - CP Water Supply Schemes 0.01 0.01 0.01 0.01 0.01 0.01 0.27 0.25 0.22 0.06 0.01 0.01 0.86
HT-VI Townships and Residential Colonies 4.96 4.38 4.18 3.36 3.50 3.57 3.59 3.65 3.38 3.13 3.48 3.91 45.10
HT -VII - Temporary Supply 0.00 0.00 0.00 0.00 0.00 0.00 0.00 0.00 0.00 0.00 0.00 0.00 0.00
HT - RESCOs 0.00
0.00
HT Category at 132 KV 294.38 245.27 239.12 305.33 378.11 416.16 310.01 289.90 259.00 248.81 248.04 257.53 3491.66
HT-I Industry Segregated 225.65 185.00 177.50 162.55 164.48 174.20 181.68 203.30 184.21 195.77 168.59 179.75 2202.69
HT-I (B) Ferro-Alloys 13.32 15.99 18.47 15.69 14.38 15.89 14.11 20.33 18.64 5.29 6.98 6.71 165.81
HT-II - Others 6.25 6.64 6.95 6.02 5.49 5.35 5.22 5.23 5.06 4.50 5.46 5.74 67.92
HT-III Airports, Railway and Busstations 5.13 5.03 5.57 5.14 5.08 5.03 5.10 5.00 4.31 4.00 4.22 4.57 58.19
HT -IV A Govt Lift Irrigation 31.27 19.86 17.21 104.62 176.19 201.94 90.21 41.41 31.66 23.34 47.62 45.83 831.16
HT- IV B - CP Water Supply Schemes 0.00 0.00 0.00 0.00 0.00 0.00 0.00 0.00 0.00 0.00 0.00 0.00 0.00
HT-V (A) Railway Traction 11.72 11.71 12.39 10.27 11.44 12.71 11.61 12.56 13.05 13.83 13.08 12.84 147.22
HT-V (B) HMR 1.04 1.04 1.04 1.04 1.04 1.04 2.07 2.07 2.07 2.07 2.07 2.07 18.66
HT-VI Townships and Residential Colonies 0.00 0.00 0.00 0.00 0.00 0.00 0.00 0.00 0.00 0.00 0.00 0.00 0.00
HT -VII - Temporary Supply 0.00 0.00 0.00 0.00 0.00 0.00 0.00 0.00 0.00 0.00 0.00 0.00 0.00

Sales / Forecast Sales (MU) April May June July August September October November December January February March Total
HT - RESCOs 0.00
0.00
Total 2884.11 2700.81 2439.75 2568.03 2952.14 2719.50 2898.24 2722.84 2705.18 2661.39 2654.95 2937.10 32844.04

Form 4a Energy Losses (Distribution System)
Base Year 2014-15 2015-16 2016-17 2017-18
I. Losses in 33 KV System and Connected Equipment
(i)Total Energy delivered into 33 KV Distribution System
from EHT SSs A 32852.80 29289.5329986.28 30558.21 32935.25
(ii)Energy delivered by all other Generating Stations at
33kV B 287.29 71.58 130.67
(iii)Energy consumed by HT consumers at 33KV (Sales +
Third Party)X
4759.47 4635.244599.64 4120.43 4880.21
(iv)Energy Delivered into 11 KV and LT System from
33/11 KV SSs C 27336.71 23801.0024523.46 25218.51 26740.93
Losses (33 kV System) (A + B) - (C + X) 1043.91 924.88 993.85 1219.27 1314.12
% Losses (33 kV System) 100 x [(A+B)-(C+X)] / (A+B) 3.15 3.15 3.30 3.99 3.99
II. Losses in 11 KV System and Connected Equipment
(i) Energy delivered into 11 KV system from 33/11kV SSs C 27336.71 23801.00 24523.4625218.51 26740.93
(ii)Energy delivered into 11 KV Distribution System from
EHT SSs D 31.30
(iii)Energy delivered at 11kV from all other Generating
Stations E 10.31
(iv)Total Energy delivered into 11 KV and LT Distribution
System C+D+E 27336.71 23801.00 24565.07 25218.51 26740.93
(v)Energy consumed by HT consumers at 11KV (Sales +
Third Party) Y 3966.97 4065.954434.30 4511.72 4761.42
Particulars

Base Year 2014-15 2015-16 2016-17 2017-18Particulars
(vi) Total Output from 11kV to LT F 21978.30 18523.58 18882.87 19571.96 20802.91
Losses (11kV System) (C + D + E) - (Y + F) 1391.44 1211.47 1247.90 1134.83 1176.60
% Losses (11kV System)[(C+D+E)-(Y+F)] x 100 /
(C+D+E) 5.09 5.09 5.08 4.50 4.40
III. Losses in LT system and connected equipment
(i) Energy delivered to LT system from 11/400 V DTRs F 21978.30 18523.58 18882.8719571.96 20802.91
(ii) Energy sold to metered categories Z 10375.69 9562.17 10792.86 11318.28 12067.02
(iii) Energy sold to un-metered categories N 9190.49 6932.86 6517.67 7177.22 7643.74
Losses (LT System) F-(Z+N) 2412.12 2028.55 1572.33 1076.46 1092.15
% Losses (LT System) [F-(Z+N)] x 100 / (F) 10.98 10.95 8.33 5.50 5.25
IV. Total losses in the Distribution System
(i) Total Input to the distribution system A + B + D + E 33140.09 29361.12 30158.56 30558.21 32935.25
(ii) Total Output from the Distribution Sytem X + Y + Z + N 28292.62 25196.22 26344.48 27127.65 29352.38
(iii) EHT Sales G 3577.10 2883.48 2739.46 2888.07 3491.66
Distribution System Losses (A + B + D + E)-(X + Y + Z + N) 4847.47 4164.90 3814.08 3430.56 3582.87
% Distribution System Losses ( Excluding EHT
Sales)
[(A+B+D+E)-(X+Y+Z+N)] x
100 / (A+B+D+E) 14.63 14.19 12.65 11.23 10.88
% Distribution System Losses ( Including EHT
Sales)
[(A+B+D+E)-(X+Y+Z+N)] x
100 / (A+B+D+E +G) 13.20 12.92 11.59 10.26 9.84

Form 4b
Base Year 2014-15 2015-16 2016-17 2017-18 2018-19
Total Transmission Losses (Inclusive of PGCIL) (%)
Input to TSTransco Network (MU)
TSTransco Losses (%) 6.15 4.84 5.31 5.61 5.22
inclusive
of PGCIL
losses
inclusive
of PGCIL
losses
inclusive
of PGCIL
losses
inclusive
of PGCIL
losses
TSTransco Losses (MU)
Input to PGCIL (For CGS) (MU)
PGCIL Losses (%) (For CGS)
PGCIL Losses (MU) (For CGS)
2018-19Remarks
Transmission Losses
Relates to detailed calculation of the Transmission Losses percentage entered in Form 4. The working of the losses (MU & Form 4B - Transmission Losses
Particulars Detail Links Base Year 2014-15 2015-16 2016-17 2017-18
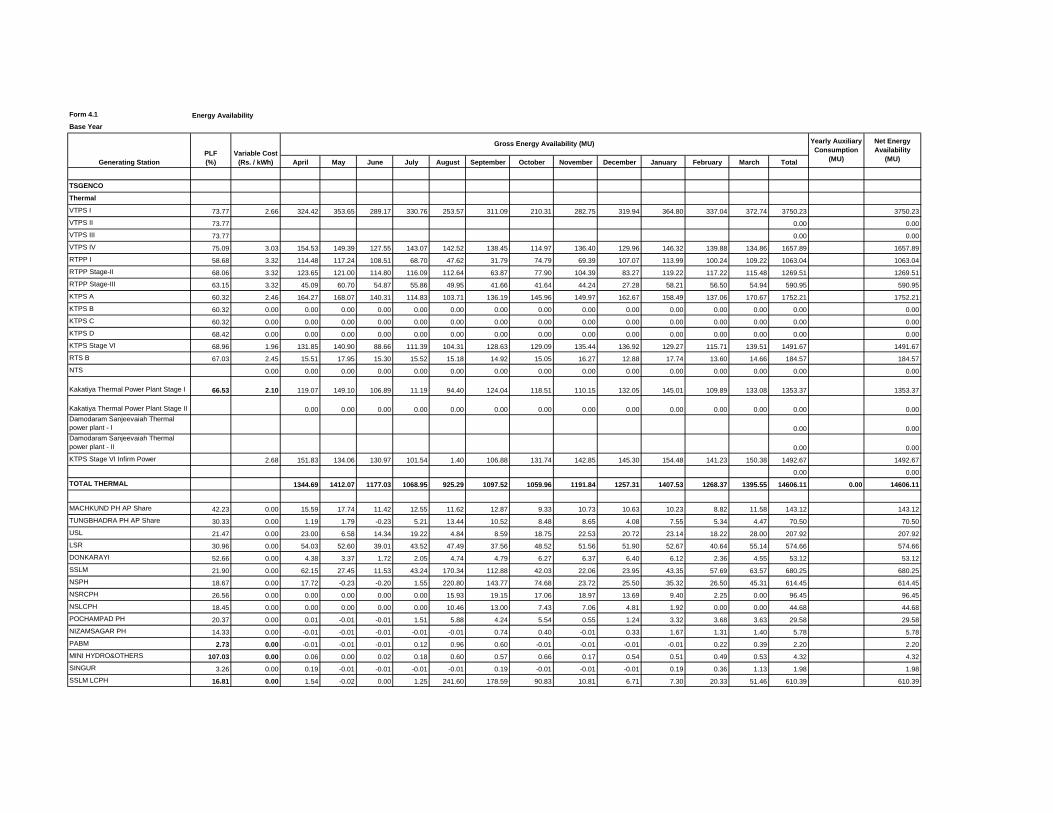
Form 4.1
Base Year
April May June July August September October November December January February March Total
TSGENCO
Thermal
VTPS I 73.77 2.66 324.42 353.65 289.17 330.76 253.57 311.09 210.31 282.75 319.94 364.80 337.04 372.74 3750.23 3750.23
VTPS II 73.77 0.00 0.00
VTPS III 73.77 0.00 0.00
VTPS IV 75.09 3.03 154.53 149.39 127.55 143.07 142.52 138.45 114.97 136.40 129.96 146.32 139.88 134.86 1657.89 1657.89
RTPP I 58.68 3.32 114.48 117.24 108.51 68.70 47.62 31.79 74.79 69.39 107.07 113.99 100.24 109.22 1063.04 1063.04
RTPP Stage-II 68.06 3.32 123.65 121.00 114.80 116.09 112.64 63.87 77.90 104.39 83.27 119.22 117.22 115.48 1269.51 1269.51
RTPP Stage-III 63.15 3.32 45.09 60.70 54.87 55.86 49.95 41.66 41.64 44.24 27.28 58.21 56.50 54.94 590.95 590.95
KTPS A 60.32 2.46 164.27 168.07 140.31 114.83 103.71 136.19 145.96 149.97 162.67 158.49 137.06 170.67 1752.21 1752.21
KTPS B 60.32 0.00 0.00 0.00 0.00 0.00 0.00 0.00 0.00 0.00 0.00 0.00 0.00 0.00 0.00 0.00
KTPS C 60.32 0.00 0.00 0.00 0.00 0.00 0.00 0.00 0.00 0.00 0.00 0.00 0.00 0.00 0.00 0.00
KTPS D 68.42 0.00 0.00 0.00 0.00 0.00 0.00 0.00 0.00 0.00 0.00 0.00 0.00 0.00 0.00 0.00
KTPS Stage VI 68.96 1.96 131.85 140.90 88.66 111.39 104.31 128.63 129.09 135.44 136.92 129.27 115.71 139.51 1491.67 1491.67
RTS B 67.03 2.45 15.51 17.95 15.30 15.52 15.18 14.92 15.05 16.27 12.88 17.74 13.60 14.66 184.57 184.57
NTS 0.00 0.00 0.00 0.00 0.00 0.00 0.00 0.00 0.00 0.00 0.00 0.00 0.00 0.00 0.00
Kakatiya Thermal Power Plant Stage I 66.53 2.10 119.07 149.10 106.89 11.19 94.40 124.04 118.51 110.15 132.05 145.01 109.89 133.08 1353.37 1353.37
Kakatiya Thermal Power Plant Stage II 0.00 0.00 0.00 0.00 0.00 0.00 0.00 0.00 0.00 0.00 0.00 0.00 0.00 0.00
Damodaram Sanjeevaiah Thermal
power plant - I 0.00 0.00
Damodaram Sanjeevaiah Thermal
power plant - II 0.00 0.00
KTPS Stage VI Infirm Power 2.68 151.83 134.06 130.97 101.54 1.40 106.88 131.74 142.85 145.30 154.48 141.23 150.38 1492.67 1492.67
0.00 0.00
TOTAL THERMAL 1344.69 1412.07 1177.03 1068.95 925.29 1097.52 1059.96 1191.84 1257.31 1407.53 1268.37 1395.55 14606.11 0.00 14606.11
MACHKUND PH AP Share 42.23 0.00 15.59 17.74 11.42 12.55 11.62 12.87 9.33 10.73 10.63 10.23 8.82 11.58 143.12 143.12
TUNGBHADRA PH AP Share 30.33 0.00 1.19 1.79 -0.23 5.21 13.44 10.52 8.48 8.65 4.08 7.55 5.34 4.47 70.50 70.50
USL 21.47 0.00 23.00 6.58 14.34 19.22 4.84 8.59 18.75 22.53 20.72 23.14 18.22 28.00 207.92 207.92
LSR 30.96 0.00 54.03 52.60 39.01 43.52 47.49 37.56 48.52 51.56 51.90 52.67 40.64 55.14 574.66 574.66
DONKARAYI 52.66 0.00 4.38 3.37 1.72 2.05 4.74 4.79 6.27 6.37 6.40 6.12 2.36 4.55 53.12 53.12
SSLM 21.90 0.00 62.15 27.45 11.53 43.24 170.34 112.88 42.03 22.06 23.95 43.35 57.69 63.57 680.25 680.25
NSPH 18.67 0.00 17.72 -0.23 -0.20 1.55 220.80 143.77 74.68 23.72 25.50 35.32 26.50 45.31 614.45 614.45
NSRCPH 26.56 0.00 0.00 0.00 0.00 0.00 15.93 19.15 17.06 18.97 13.69 9.40 2.25 0.00 96.45 96.45
NSLCPH 18.45 0.00 0.00 0.00 0.00 0.00 10.46 13.00 7.43 7.06 4.81 1.92 0.00 0.00 44.68 44.68
POCHAMPAD PH 20.37 0.00 0.01 -0.01 -0.01 1.51 5.88 4.24 5.54 0.55 1.24 3.32 3.68 3.63 29.58 29.58
NIZAMSAGAR PH 14.33 0.00 -0.01 -0.01 -0.01 -0.01 -0.01 0.74 0.40 -0.01 0.33 1.67 1.31 1.40 5.78 5.78
PABM 2.73 0.00 -0.01 -0.01 -0.01 0.12 0.96 0.60 -0.01 -0.01 -0.01 -0.01 0.22 0.39 2.20 2.20
MINI HYDRO&OTHERS 107.03 0.00 0.06 0.00 0.02 0.18 0.60 0.57 0.66 0.17 0.54 0.51 0.49 0.53 4.32 4.32
SINGUR 3.26 0.00 0.19 -0.01 -0.01 -0.01 -0.01 0.19 -0.01 -0.01 -0.01 0.19 0.36 1.13 1.98 1.98
SSLM LCPH 16.81 0.00 1.54 -0.02 0.00 1.25 241.60 178.59 90.83 10.81 6.71 7.30 20.33 51.46 610.39 610.39
Energy Availability
Generating Station
PLF
(%)
Variable Cost
(Rs. / kWh)
Gross Energy Availability (MU) Yearly Auxiliary
Consumption
(MU)
Net Energy
Availability
(MU)
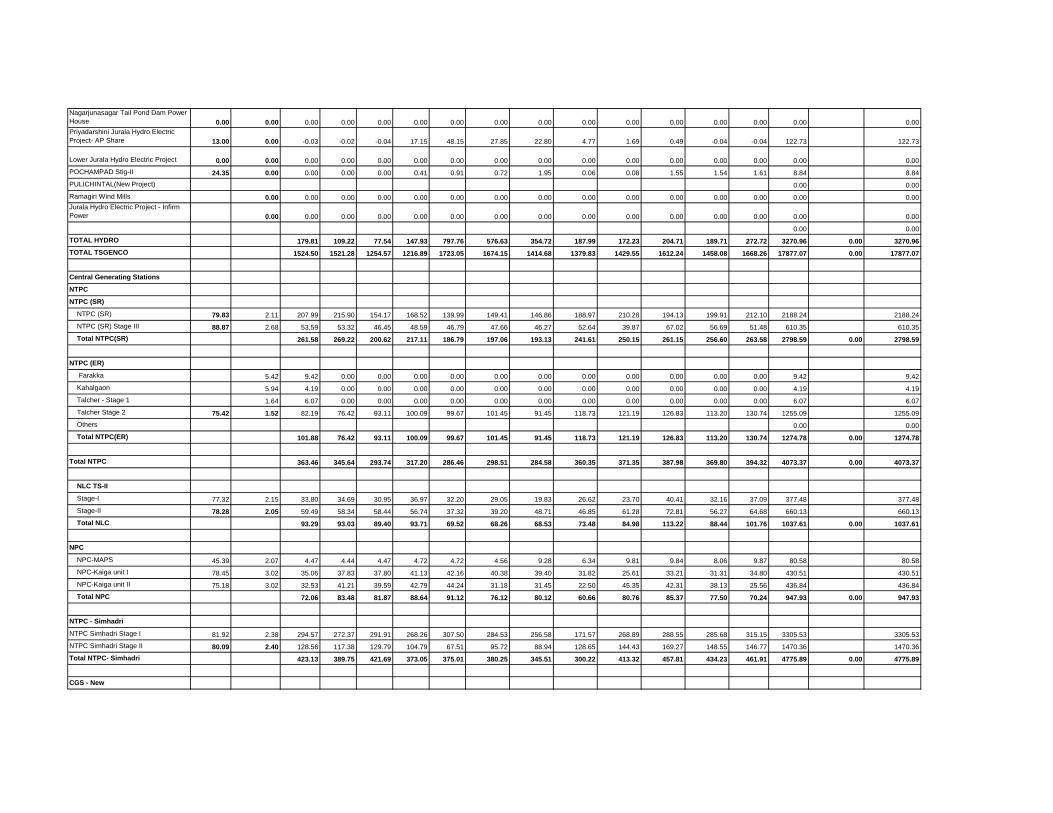
Nagarjunasagar Tail Pond Dam Power
House 0.00 0.00 0.00 0.00 0.00 0.00 0.00 0.00 0.00 0.00 0.00 0.00 0.00 0.00 0.00 0.00
Priyadarshini Jurala Hydro Electric
Project- AP Share 13.00 0.00 -0.03 -0.02 -0.04 17.15 48.15 27.85 22.80 4.77 1.69 0.49 -0.04 -0.04 122.73 122.73
Lower Jurala Hydro Electric Project 0.00 0.00 0.00 0.00 0.00 0.00 0.00 0.00 0.00 0.00 0.00 0.00 0.00 0.00 0.00 0.00
POCHAMPAD Stig-II 24.35 0.00 0.00 0.00 0.00 0.41 0.91 0.72 1.95 0.06 0.08 1.55 1.54 1.61 8.84 8.84
PULICHINTAL(New Project) 0.00 0.00
Ramagiri Wind Mills 0.00 0.00 0.00 0.00 0.00 0.00 0.00 0.00 0.00 0.00 0.00 0.00 0.00 0.00 0.00
Jurala Hydro Electric Project - Infirm
Power 0.00 0.00 0.00 0.00 0.00 0.00 0.00 0.00 0.00 0.00 0.00 0.00 0.00 0.00 0.00
0.00 0.00
TOTAL HYDRO 179.81 109.22 77.54 147.93 797.76 576.63 354.72 187.99 172.23 204.71 189.71 272.72 3270.96 0.00 3270.96
TOTAL TSGENCO 1524.50 1521.28 1254.57 1216.89 1723.05 1674.15 1414.68 1379.83 1429.55 1612.24 1458.08 1668.26 17877.07 0.00 17877.07
Central Generating Stations
NTPC
NTPC (SR)
NTPC (SR) 79.83 2.11 207.99 215.90 154.17 168.52 139.99 149.41 146.86 188.97 210.28 194.13 199.91 212.10 2188.24 2188.24
NTPC (SR) Stage III 88.87 2.68 53.59 53.32 46.45 48.59 46.79 47.66 46.27 52.64 39.87 67.02 56.69 51.48 610.35 610.35
Total NTPC(SR) 261.58 269.22 200.62 217.11 186.79 197.06 193.13 241.61 250.15 261.15 256.60 263.58 2798.59 0.00 2798.59
NTPC (ER)
Farakka 5.42 9.42 0.00 0.00 0.00 0.00 0.00 0.00 0.00 0.00 0.00 0.00 0.00 9.42 9.42
Kahalgaon 5.94 4.19 0.00 0.00 0.00 0.00 0.00 0.00 0.00 0.00 0.00 0.00 0.00 4.19 4.19
Talcher - Stage 1 1.64 6.07 0.00 0.00 0.00 0.00 0.00 0.00 0.00 0.00 0.00 0.00 0.00 6.07 6.07
Talcher Stage 2 75.42 1.52 82.19 76.42 93.11 100.09 99.67 101.45 91.45 118.73 121.19 126.83 113.20 130.74 1255.09 1255.09
Others 0.00 0.00
Total NTPC(ER) 101.88 76.42 93.11 100.09 99.67 101.45 91.45 118.73 121.19 126.83 113.20 130.74 1274.78 0.00 1274.78
Total NTPC 363.46 345.64 293.74 317.20 286.46 298.51 284.58 360.35 371.35 387.98 369.80 394.32 4073.37 0.00 4073.37
NLC TS-II
Stage-I 77.32 2.15 33.80 34.69 30.95 36.97 32.20 29.05 19.83 26.62 23.70 40.41 32.16 37.09 377.48 377.48
Stage-II 78.28 2.05 59.49 58.34 58.44 56.74 37.32 39.20 48.71 46.85 61.28 72.81 56.27 64.68 660.13 660.13
Total NLC 93.29 93.03 89.40 93.71 69.52 68.26 68.53 73.48 84.98 113.22 88.44 101.76 1037.61 0.00 1037.61
NPC
NPC-MAPS 45.39 2.07 4.47 4.44 4.47 4.72 4.72 4.56 9.28 6.34 9.81 9.84 8.06 9.87 80.58 80.58
NPC-Kaiga unit I 78.45 3.02 35.06 37.83 37.80 41.13 42.16 40.38 39.40 31.82 25.61 33.21 31.31 34.80 430.51 430.51
NPC-Kaiga unit II 75.18 3.02 32.53 41.21 39.59 42.79 44.24 31.18 31.45 22.50 45.35 42.31 38.13 25.56 436.84 436.84
Total NPC 72.06 83.48 81.87 88.64 91.12 76.12 80.12 60.66 80.76 85.37 77.50 70.24 947.93 0.00 947.93
NTPC - Simhadri
NTPC Simhadri Stage I 81.92 2.38 294.57 272.37 291.91 268.26 307.50 284.53 256.58 171.57 268.89 288.55 285.68 315.15 3305.53 3305.53
NTPC Simhadri Stage II 80.09 2.40 128.56 117.38 129.79 104.79 67.51 95.72 88.94 128.65 144.43 169.27 148.55 146.77 1470.36 1470.36
Total NTPC- Simhadri 423.13 389.75 421.69 373.05 375.01 380.25 345.51 300.22 413.32 457.81 434.23 461.91 4775.89 0.00 4775.89
CGS - New

Vallur Thermal Power Plant 27.08 2.14 14.04 10.27 7.84 16.88 4.68 17.35 21.84 21.81 20.63 47.94 31.36 26.88 241.51 241.51
TOTAL CGS 965.98 922.17 894.54 889.48 826.79 840.49 800.59 816.51 971.03 1092.32 1001.33 1055.10 11076.32 0.00 11076.32
APGPCL
APGPCL I - Allocated capacity 42.81 2.60 1.99 1.87 2.31 2.25 1.95 1.90 1.82 1.85 2.14 2.04 2.91 4.60 27.64 27.64
APGPCL I - Unutilised capacity 2.56 1.33 0.02 0.08 0.06 0.09 0.09 0.04 0.02 0.24 0.31 0.50 1.03 3.81 3.81
APGPCL II - Allocated capacity 43.00 2.77 6.99 6.67 7.06 7.91 6.87 6.64 6.45 6.45 8.04 7.40 3.76 0.00 74.25 74.25
APGPCL II - Unutilised capacity 2.83 1.75 1.20 0.00 0.00 0.00 0.00 0.00 0.00 0.00 0.00 0.00 0.00 2.95 2.95
Total APGPCL 12.07 9.76 9.45 10.22 8.92 8.63 8.31 8.32 10.43 9.75 7.17 5.63 108.65 0.00 108.65
IPPS
GVK 50.45 2.19 34.70 34.37 38.15 35.65 32.80 31.44 33.18 37.96 45.42 44.15 38.58 33.25 439.66 439.66
Spectrum 57.83 2.48 38.48 35.69 36.47 36.37 34.24 31.23 33.45 41.52 55.79 51.81 45.04 45.26 485.35 485.35
Kondapalli (Naphtha) 0.00 0.00 0.00 0.00 0.00 0.00 0.00 0.00 0.00 0.00 0.00 0.00 0.00 0.00 0.00
Kondapalli (Gas) 45.30 2.25 68.50 64.86 55.54 53.46 49.64 44.65 52.77 53.77 24.74 45.56 61.12 74.25 648.87 648.87
BSES 23.89 1.64 16.31 14.94 23.62 21.09 17.23 16.43 15.83 16.93 24.65 19.84 14.83 10.39 212.09 212.09
GVK Extension 0.08 0.00 0.45 0.22 0.00 0.00 0.00 0.00 0.00 0.00 0.00 0.00 0.00 0.67 0.67
Vemagiri 4.73 7.47 50.73 19.87 0.00 0.00 0.00 0.00 0.00 0.00 0.00 0.00 0.00 0.00 70.59 70.59
Gautami 0.00 0.00 0.00 0.00 0.00 0.00 0.00 0.00 0.00 0.00 0.00 0.00 0.00 0.00
Konaseema 2.07 0.00 0.00 0.00 0.00 0.00 0.00 0.00 0.00 0.00 0.00 0.00 2.07 2.07
0.00 0.00
TOTAL IPPS 210.79 170.19 154.00 146.58 133.92 123.75 135.23 150.18 150.60 161.37 159.56 163.14 1859.30 0.00 1859.30
NCE
NCE - Bio-Mass 10.81 18.79 1.93 0.98 2.76 2.02 0.14 1.65 2.91 3.54 4.69 6.48 6.82 3.95 37.87 37.87
NCE - Bagasse 20.51 3.12 2.45 0.00 0.00 0.00 0.00 0.00 0.00 0.00 4.65 5.18 6.69 7.98 26.95 26.95
NCE - Municipal Waste to Energy 0.00 0.00
NCE - Industrial Waste based power
project 18.91 10.46 2.56 2.95 2.50 2.77 1.10 1.14 0.00 0.00 0.00 0.00 3.44 1.76 18.22 18.22
NCE - Wind Power 16.12 3.77 16.50 38.71 105.65 125.51 127.83 50.27 53.29 20.32 22.70 47.58 38.37 83.15 729.87 729.87
NCE - Mini Hydel 46.06 5.50 0.00 0.06 0.00 0.00 7.44 10.01 12.53 11.70 11.29 10.67 10.75 7.65 82.11 82.11
NCE - NCL Energy Ltd 35.84 1.80 0.00 0.00 0.00 0.99 1.92 1.57 1.79 1.58 1.21 0.34 0.00 0.00 9.42 9.42
NCE-Others 62.78 5.60 5.32 7.77 8.02 8.62 12.15 13.22 14.41 15.39 16.55 16.64 15.89 17.79 151.78 151.78
TOTAL NCE 28.75 50.46 118.93 139.91 150.58 77.87 84.93 52.54 61.10 86.90 81.97 122.28 1056.21 0.00 1056.21
OTHERS
Srivathsa 0.00 0.00
LVS 0.00 0.00
Vishakapatnam Steel Plant 0.00 0.00
NB Ferro Alloys 0.00 0.00
Sponge Iron * 0.00 0.00
Heavy Water Plant * 0.00 0.00
Kesoram * 0.00 0.00
Essar Steels * 0.00 0.00
KSK Mahanadi (MT) 0.00 0.00
MTOA Transimisision Charges (KSK
Mahanadi) 0.00 0.00
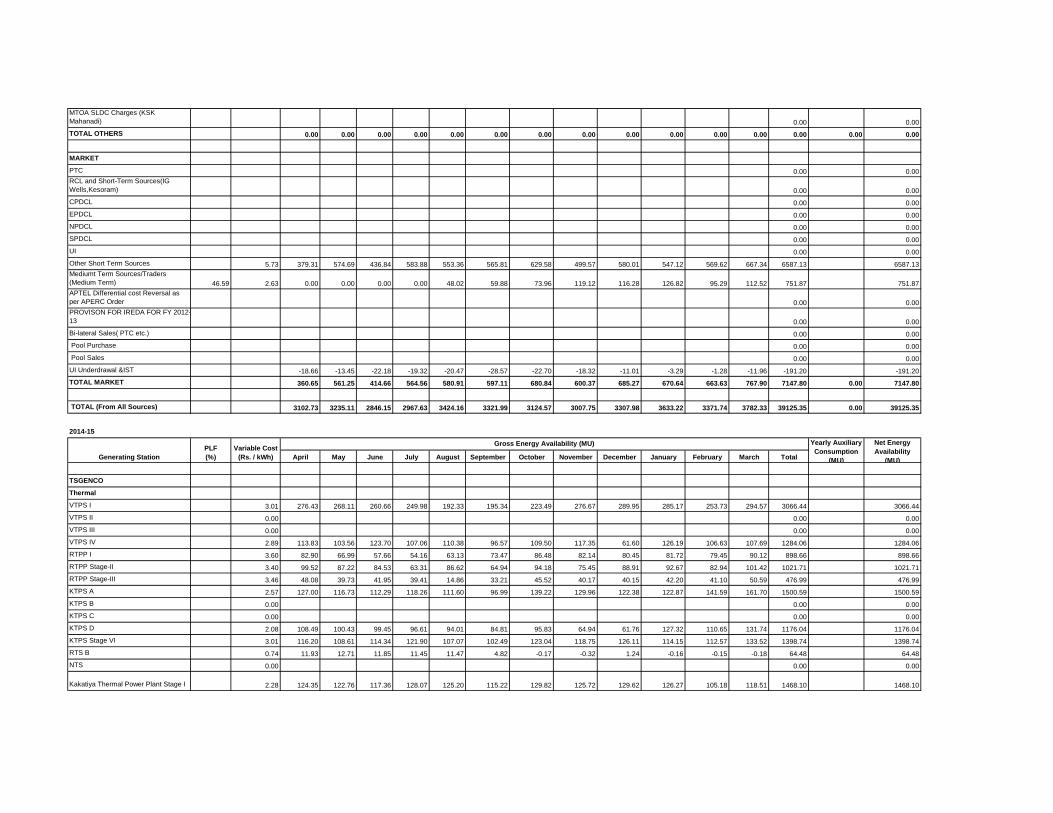
MTOA SLDC Charges (KSK
Mahanadi) 0.00 0.00
TOTAL OTHERS 0.00 0.00 0.00 0.00 0.00 0.00 0.00 0.00 0.00 0.00 0.00 0.00 0.00 0.00 0.00
MARKET
PTC 0.00 0.00
RCL and Short-Term Sources(IG
Wells,Kesoram) 0.00 0.00
CPDCL 0.00 0.00
EPDCL 0.00 0.00
NPDCL 0.00 0.00
SPDCL 0.00 0.00
UI 0.00 0.00
Other Short Term Sources 5.73 379.31 574.69 436.84 583.88 553.36 565.81 629.58 499.57 580.01 547.12 569.62 667.34 6587.13 6587.13
Mediumt Term Sources/Traders
(Medium Term) 46.59 2.63 0.00 0.00 0.00 0.00 48.02 59.88 73.96 119.12 116.28 126.82 95.29 112.52 751.87 751.87
APTEL Differential cost Reversal as
per APERC Order 0.00 0.00
PROVISON FOR IREDA FOR FY 2012-
13 0.00 0.00
Bi-lateral Sales( PTC etc.) 0.00 0.00
Pool Purchase 0.00 0.00
Pool Sales 0.00 0.00
UI Underdrawal &IST -18.66 -13.45 -22.18 -19.32 -20.47 -28.57 -22.70 -18.32 -11.01 -3.29 -1.28 -11.96 -191.20 -191.20
TOTAL MARKET 360.65 561.25 414.66 564.56 580.91 597.11 680.84 600.37 685.27 670.64 663.63 767.90 7147.80 0.00 7147.80
TOTAL (From All Sources) 3102.73 3235.11 2846.15 2967.63 3424.16 3321.99 3124.57 3007.75 3307.98 3633.22 3371.74 3782.33 39125.35 0.00 39125.35
2014-15
April May June July August September October November December January February March Total
TSGENCO
Thermal
VTPS I 3.01 276.43 268.11 260.66 249.98 192.33 195.34 223.49 276.67 289.95 285.17 253.73 294.57 3066.44 3066.44
VTPS II 0.00 0.00 0.00
VTPS III 0.00 0.00 0.00
VTPS IV 2.89 113.83 103.56 123.70 107.06 110.38 96.57 109.50 117.35 61.60 126.19 106.63 107.69 1284.06 1284.06
RTPP I 3.60 82.90 66.99 57.66 54.16 63.13 73.47 86.48 82.14 80.45 81.72 79.45 90.12 898.66 898.66
RTPP Stage-II 3.40 99.52 87.22 84.53 63.31 86.62 64.94 94.18 75.45 88.91 92.67 82.94 101.42 1021.71 1021.71
RTPP Stage-III 3.46 48.08 39.73 41.95 39.41 14.86 33.21 45.52 40.17 40.15 42.20 41.10 50.59 476.99 476.99
KTPS A 2.57 127.00 116.73 112.29 118.26 111.60 96.99 139.22 129.96 122.38 122.87 141.59 161.70 1500.59 1500.59
KTPS B 0.00 0.00 0.00
KTPS C 0.00 0.00 0.00
KTPS D 2.08 108.49 100.43 99.45 96.61 94.01 84.81 95.83 64.94 61.76 127.32 110.65 131.74 1176.04 1176.04
KTPS Stage VI 3.01 116.20 108.61 114.34 121.90 107.07 102.49 123.04 118.75 126.11 114.15 112.57 133.52 1398.74 1398.74
RTS B 0.74 11.93 12.71 11.85 11.45 11.47 4.82 -0.17 -0.32 1.24 -0.16 -0.15 -0.18 64.48 64.48
NTS 0.00 0.00 0.00
Kakatiya Thermal Power Plant Stage I 2.28 124.35 122.76 117.36 128.07 125.20 115.22 129.82 125.72 129.62 126.27 105.18 118.51 1468.10 1468.10
Generating Station
PLF
(%)
Variable Cost
(Rs. / kWh)
Gross Energy Availability (MU) Yearly Auxiliary
Consumption
(MU)
Net Energy
Availability
(MU)

Kakatiya Thermal Power Plant Stage II 0.00 0.00 0.00
Damodaram Sanjeevaiah Thermal
power plant - I 0.00 0.00 0.00
Damodaram Sanjeevaiah Thermal
power plant - II 0.00 0.00 0.00
0.00 0.00
TOTAL THERMAL 1108.72 1026.85 1023.79 990.22 916.68 867.88 1046.92 1030.83 1002.17 1118.39 1033.69 1189.67 12355.83 0.00 12355.83
MACHKUND PH AP Share 0.00 11.18 7.75 6.17 5.84 1.09 7.50 5.61 5.70 4.93 5.66 4.69 3.08 69.21 69.21
TUNGBHADRA PH AP Share 0.00 0.65 -0.22 -0.01 0.00 0.73 6.83 6.61 6.19 7.20 7.82 7.65 7.77 51.23 51.23
USL 0.00 21.77 15.04 0.01 0.00 0.00 0.00 0.00 0.00 0.00 0.00 0.00 0.00 36.82 36.82
LSR 0.00 49.72 49.16 1.89 0.00 0.00 0.00 0.00 0.00 0.00 0.00 0.00 0.00 100.77 100.77
DONKARAYI 0.00 4.95 4.89 0.22 0.00 0.00 0.00 0.00 0.00 0.00 0.00 0.00 0.00 10.05 10.05
SSLM 0.00 33.89 0.64 0.72 0.00 0.00 0.00 0.00 0.00 0.00 0.00 0.00 0.00 35.26 35.26
NSPH 0.00 3.60 -0.18 5.22 15.24 61.28 150.89 94.29 34.91 9.03 0.04 3.26 9.58 387.16 387.16
NSRCPH 0.00 0.00 0.00 0.00 0.00 0.00 0.00 0.00 0.00 0.00 0.00 0.00 0.00 0.00 0.00
NSLCPH 0.00 0.00 0.00 0.00 0.00 0.30 2.87 4.59 4.88 3.34 0.54 0.00 0.00 16.53 16.53
POCHAMPAD PH 0.00 1.66 -0.01 -0.01 -0.01 -0.01 0.11 0.76 0.00 0.82 0.00 0.06 0.08 3.45 3.45
NIZAMSAGAR PH 0.00 0.00 -0.01 -0.01 -0.01 0.23 0.72 0.63 -0.01 -0.01 -0.01 0.09 -0.01 1.60 1.60
PABM 0.00 -0.01 -0.01 0.00 0.00 0.00 0.00 0.00 0.00 0.00 0.00 0.00 0.00 -0.03 -0.03
MINI HYDRO&OTHERS 0.00 0.28 0.00 0.00 0.00 0.00 0.00 0.00 0.00 0.00 0.00 0.00 0.00 0.28 0.28
SINGUR 0.00 0.99 0.15 -0.01 0.22 0.07 0.14 0.13 0.25 0.10 0.06 0.15 0.16 2.41 2.41
SSLM LCPH 0.00 27.84 -0.19 -0.25 3.54 180.18 198.63 109.47 27.55 52.37 29.10 24.87 29.81 682.92 682.92
Nagarjunasagar Tail Pond Dam Power
House 0.00 0.00 0.00
Priyadarshini Jurala Hydro Electric
Project- AP Share 0.00 0.00 0.00
Lower Jurala Hydro Electric Project 0.00 -0.04 -0.05 -0.07 1.16 34.23 43.07 0.52 1.25 -0.01 0.00 0.00 -0.08 79.98 79.98
POCHAMPAD Stig-II 0.00 0.74 0.00 0.00 0.00 0.00 0.04 0.46 0.00 0.05 0.00 0.00 0.00 1.28 1.28
PULICHINTAL(New Project) 0.00 0.00 0.00 0.00 0.00 0.00 0.00 0.00 0.00 0.00 0.00 0.00 0.00 0.00 0.00
Mini Hydel & Others (Peddapalli,
Palair) 0.00 0.00 0.00 0.00 0.00 0.00 0.08 0.03 0.03 0.13 0.04 0.02 0.00 0.32 0.32
Ramagiri wind mills 0.00 0.00 0.00 0.00 0.00 0.00 0.00 0.00 0.00 0.00 0.00 0.00 0.00 0.00 0.00
Pochampad stage IV 0.00 0.31 0.00 0.00 0.00 0.00 0.00 0.00 0.00 0.00 0.00 0.00 0.00 0.31 0.31
Suppl. Allocation of 100% to TS from
TSHydel 0.00 -0.20 4.83 228.64 339.30 180.44 59.41 56.32 25.46 24.35 33.83 952.37 952.37
0.00 0.00
TOTAL HYDRO 157.55 76.94 13.66 30.81 506.74 750.18 403.54 140.15 134.27 68.70 65.14 84.22 2431.92 0.00 2431.92
TOTAL TSGENCO 1266.28 1103.79 1037.45 1021.03 1423.42 1618.05 1450.46 1170.99 1136.45 1187.10 1098.83 1273.90 14787.75 0.00 14787.75
Central Generating Stations
NTPC
NTPC (SR)
NTPC (SR) 2.46 176.73 142.24 137.82 160.61 173.05 120.54 150.97 166.39 194.33 177.68 168.33 175.92 1944.62 1944.62
NTPC (SR) Stage III 2.54 47.31 43.00 40.19 37.10 17.99 36.61 48.86 43.20 51.47 43.47 43.06 38.19 490.47 490.47
Total NTPC(SR) 224.04 185.24 178.01 197.71 191.05 157.15 199.83 209.59 245.80 221.15 211.40 214.11 2435.08 0.00 2435.08
NTPC (ER)
Farakka 0.00 0.00 0.00 0.00 0.00 0.00 0.00 0.00 0.00 0.00 0.00 0.00 0.00 0.00 0.00
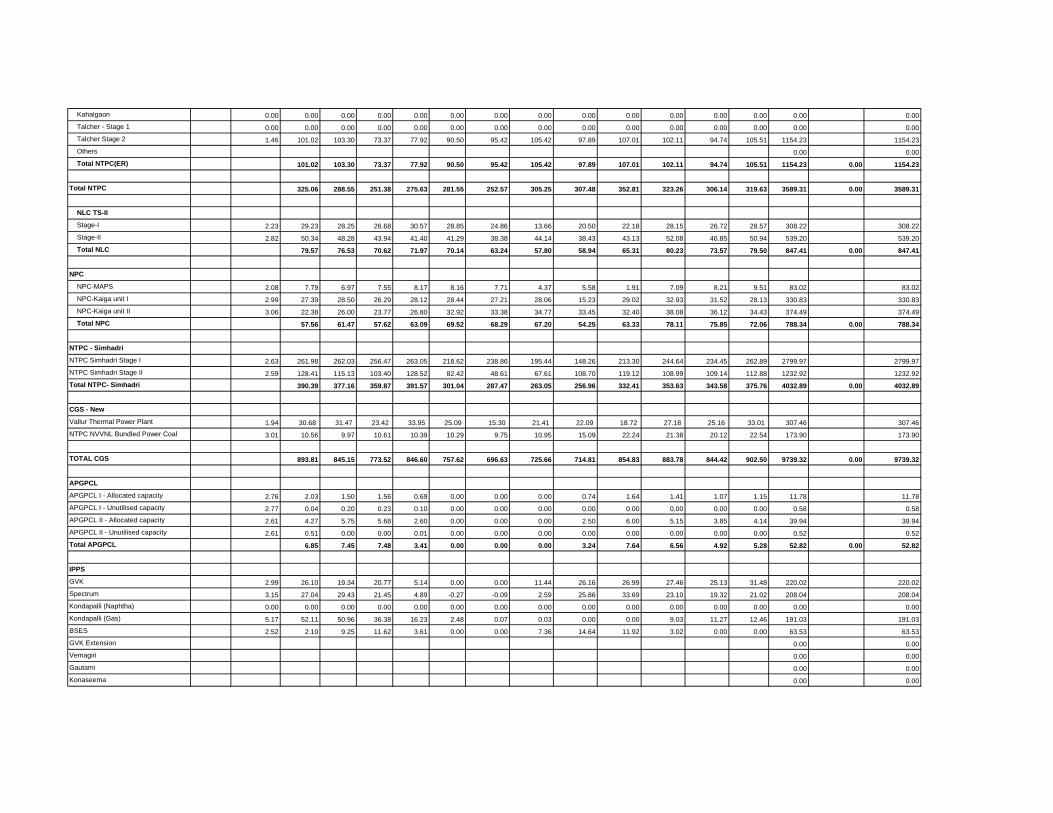
Kahalgaon 0.00 0.00 0.00 0.00 0.00 0.00 0.00 0.00 0.00 0.00 0.00 0.00 0.00 0.00 0.00
Talcher - Stage 1 0.00 0.00 0.00 0.00 0.00 0.00 0.00 0.00 0.00 0.00 0.00 0.00 0.00 0.00 0.00
Talcher Stage 2 1.46 101.02 103.30 73.37 77.92 90.50 95.42 105.42 97.89 107.01 102.11 94.74 105.51 1154.23 1154.23
Others 0.00 0.00
Total NTPC(ER) 101.02 103.30 73.37 77.92 90.50 95.42 105.42 97.89 107.01 102.11 94.74 105.51 1154.23 0.00 1154.23
Total NTPC 325.06 288.55 251.38 275.63 281.55 252.57 305.25 307.48 352.81 323.26 306.14 319.63 3589.31 0.00 3589.31
NLC TS-II
Stage-I 2.23 29.23 28.25 26.68 30.57 28.85 24.86 13.66 20.50 22.18 28.15 26.72 28.57 308.22 308.22
Stage-II 2.82 50.34 48.28 43.94 41.40 41.29 38.38 44.14 38.43 43.13 52.08 46.85 50.94 539.20 539.20
Total NLC 79.57 76.53 70.62 71.97 70.14 63.24 57.80 58.94 65.31 80.23 73.57 79.50 847.41 0.00 847.41
NPC
NPC-MAPS 2.08 7.79 6.97 7.55 8.17 8.16 7.71 4.37 5.58 1.91 7.09 8.21 9.51 83.02 83.02
NPC-Kaiga unit I 2.99 27.39 28.50 26.29 28.12 28.44 27.21 28.06 15.23 29.02 32.93 31.52 28.13 330.83 330.83
NPC-Kaiga unit II 3.06 22.38 26.00 23.77 26.80 32.92 33.38 34.77 33.45 32.40 38.08 36.12 34.43 374.49 374.49
Total NPC 57.56 61.47 57.62 63.09 69.52 68.29 67.20 54.25 63.33 78.11 75.85 72.06 788.34 0.00 788.34
NTPC - Simhadri
NTPC Simhadri Stage I 2.63 261.98 262.03 256.47 263.05 218.62 238.86 195.44 148.26 213.30 244.64 234.45 262.89 2799.97 2799.97
NTPC Simhadri Stage II 2.59 128.41 115.13 103.40 128.52 82.42 48.61 67.61 108.70 119.12 108.99 109.14 112.88 1232.92 1232.92
Total NTPC- Simhadri 390.39 377.16 359.87 391.57 301.04 287.47 263.05 256.96 332.41 353.63 343.58 375.76 4032.89 0.00 4032.89
CGS - New
Vallur Thermal Power Plant 1.94 30.68 31.47 23.42 33.95 25.09 15.30 21.41 22.09 18.72 27.18 25.16 33.01 307.46 307.46
NTPC NVVNL Bundled Power Coal 3.01 10.56 9.97 10.61 10.39 10.29 9.75 10.95 15.09 22.24 21.38 20.12 22.54 173.90 173.90
TOTAL CGS 893.81 845.15 773.52 846.60 757.62 696.63 725.66 714.81 854.83 883.78 844.42 902.50 9739.32 0.00 9739.32
APGPCL
APGPCL I - Allocated capacity 2.76 2.03 1.50 1.56 0.69 0.00 0.00 0.00 0.74 1.64 1.41 1.07 1.15 11.78 11.78
APGPCL I - Unutilised capacity 2.77 0.04 0.20 0.23 0.10 0.00 0.00 0.00 0.00 0.00 0.00 0.00 0.00 0.58 0.58
APGPCL II - Allocated capacity 2.61 4.27 5.75 5.68 2.60 0.00 0.00 0.00 2.50 6.00 5.15 3.85 4.14 39.94 39.94
APGPCL II - Unutilised capacity 2.61 0.51 0.00 0.00 0.01 0.00 0.00 0.00 0.00 0.00 0.00 0.00 0.00 0.52 0.52
Total APGPCL 6.85 7.45 7.48 3.41 0.00 0.00 0.00 3.24 7.64 6.56 4.92 5.28 52.82 0.00 52.82
IPPS
GVK 2.99 26.10 19.34 20.77 5.14 0.00 0.00 11.44 26.16 26.99 27.46 25.13 31.48 220.02 220.02
Spectrum 3.15 27.04 29.43 21.45 4.89 -0.27 -0.09 2.59 25.86 33.69 23.10 19.32 21.02 208.04 208.04
Kondapalli (Naphtha) 0.00 0.00 0.00 0.00 0.00 0.00 0.00 0.00 0.00 0.00 0.00 0.00 0.00 0.00 0.00
Kondapalli (Gas) 5.17 52.11 50.96 36.38 16.23 2.48 0.07 0.03 0.00 0.00 9.03 11.27 12.46 191.03 191.03
BSES 2.52 2.10 9.25 11.62 3.61 0.00 0.00 7.36 14.64 11.92 3.02 0.00 0.00 63.53 63.53
GVK Extension 0.00 0.00
Vemagiri 0.00 0.00
Gautami 0.00 0.00
Konaseema 0.00 0.00
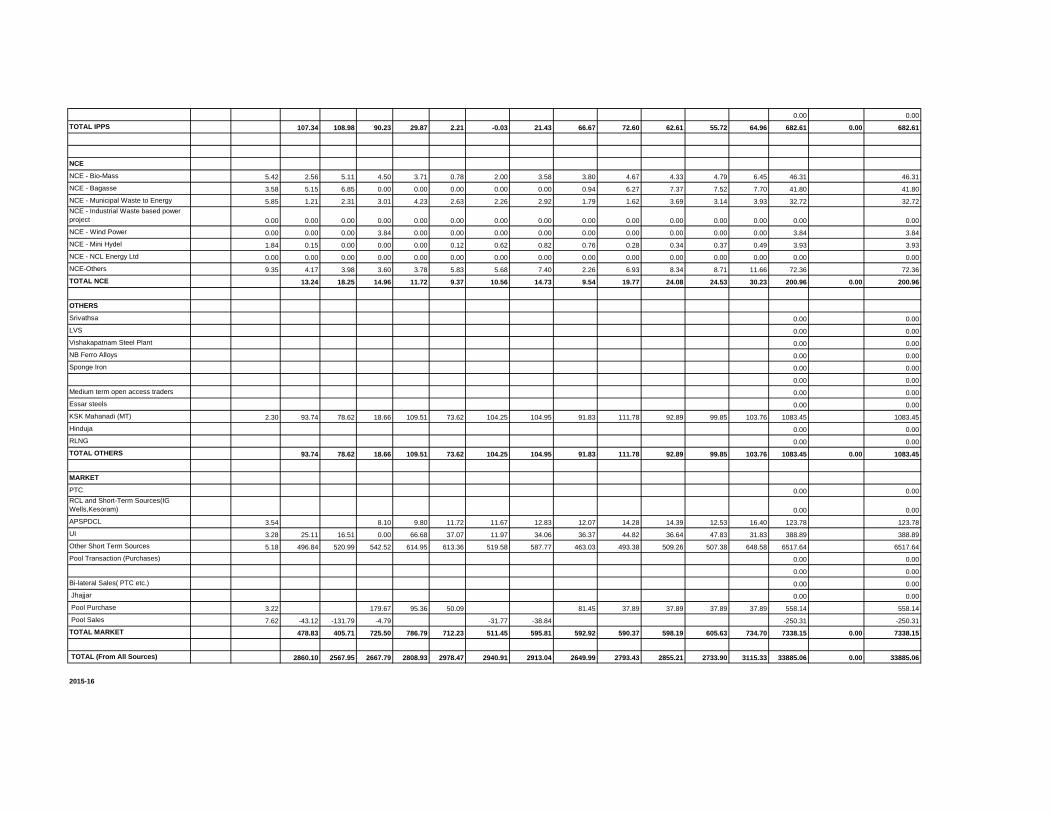
0.00 0.00
TOTAL IPPS 107.34 108.98 90.23 29.87 2.21 -0.03 21.43 66.67 72.60 62.61 55.72 64.96 682.61 0.00 682.61
NCE
NCE - Bio-Mass 5.42 2.56 5.11 4.50 3.71 0.78 2.00 3.58 3.80 4.67 4.33 4.79 6.45 46.31 46.31
NCE - Bagasse 3.58 5.15 6.85 0.00 0.00 0.00 0.00 0.00 0.94 6.27 7.37 7.52 7.70 41.80 41.80
NCE - Municipal Waste to Energy 5.85 1.21 2.31 3.01 4.23 2.63 2.26 2.92 1.79 1.62 3.69 3.14 3.93 32.72 32.72
NCE - Industrial Waste based power
project 0.00 0.00 0.00 0.00 0.00 0.00 0.00 0.00 0.00 0.00 0.00 0.00 0.00 0.00 0.00
NCE - Wind Power 0.00 0.00 0.00 3.84 0.00 0.00 0.00 0.00 0.00 0.00 0.00 0.00 0.00 3.84 3.84
NCE - Mini Hydel 1.84 0.15 0.00 0.00 0.00 0.12 0.62 0.82 0.76 0.28 0.34 0.37 0.49 3.93 3.93
NCE - NCL Energy Ltd 0.00 0.00 0.00 0.00 0.00 0.00 0.00 0.00 0.00 0.00 0.00 0.00 0.00 0.00 0.00
NCE-Others 9.35 4.17 3.98 3.60 3.78 5.83 5.68 7.40 2.26 6.93 8.34 8.71 11.66 72.36 72.36
TOTAL NCE 13.24 18.25 14.96 11.72 9.37 10.56 14.73 9.54 19.77 24.08 24.53 30.23 200.96 0.00 200.96
OTHERS
Srivathsa 0.00 0.00
LVS 0.00 0.00
Vishakapatnam Steel Plant 0.00 0.00
NB Ferro Alloys 0.00 0.00
Sponge Iron 0.00 0.00
0.00 0.00
Medium term open access traders 0.00 0.00
Essar steels 0.00 0.00
KSK Mahanadi (MT) 2.30 93.74 78.62 18.66 109.51 73.62 104.25 104.95 91.83 111.78 92.89 99.85 103.76 1083.45 1083.45
Hinduja 0.00 0.00
RLNG 0.00 0.00
TOTAL OTHERS 93.74 78.62 18.66 109.51 73.62 104.25 104.95 91.83 111.78 92.89 99.85 103.76 1083.45 0.00 1083.45
MARKET
PTC 0.00 0.00
RCL and Short-Term Sources(IG
Wells,Kesoram) 0.00 0.00
APSPDCL 3.54 8.10 9.80 11.72 11.67 12.83 12.07 14.28 14.39 12.53 16.40 123.78 123.78
UI 3.28 25.11 16.51 0.00 66.68 37.07 11.97 34.06 36.37 44.82 36.64 47.83 31.83 388.89 388.89
Other Short Term Sources 5.18 496.84 520.99 542.52 614.95 613.36 519.58 587.77 463.03 493.38 509.26 507.38 648.58 6517.64 6517.64
Pool Transaction (Purchases) 0.00 0.00
0.00 0.00
Bi-lateral Sales( PTC etc.) 0.00 0.00
Jhajjar 0.00 0.00
Pool Purchase 3.22 179.67 95.36 50.09 81.45 37.89 37.89 37.89 37.89 558.14 558.14
Pool Sales 7.62 -43.12 -131.79 -4.79 -31.77 -38.84 -250.31 -250.31
TOTAL MARKET 478.83 405.71 725.50 786.79 712.23 511.45 595.81 592.92 590.37 598.19 605.63 734.70 7338.15 0.00 7338.15
TOTAL (From All Sources) 2860.10 2567.95 2667.79 2808.93 2978.47 2940.91 2913.04 2649.99 2793.43 2855.21 2733.90 3115.33 33885.06 0.00 33885.06
2015-16
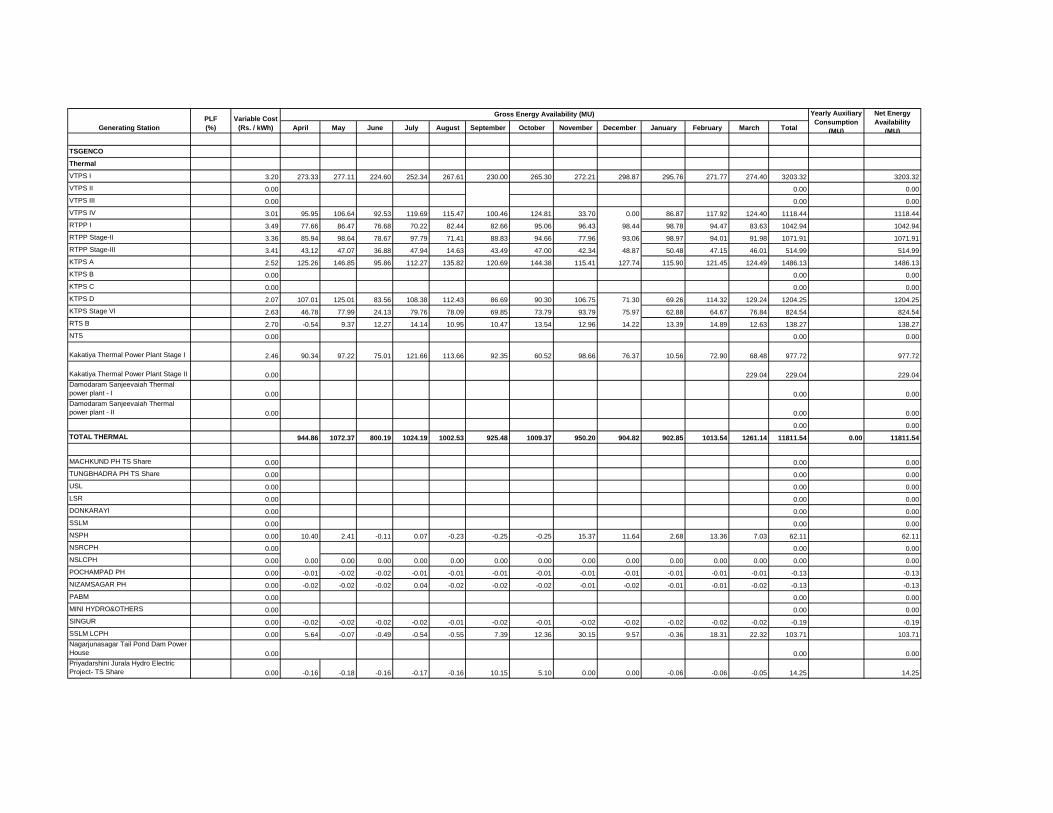
April May June July August September October November December January February March Total
TSGENCO
Thermal
VTPS I 3.20 273.33 277.11 224.60 252.34 267.61 230.00 265.30 272.21 298.87 295.76 271.77 274.40 3203.32 3203.32
VTPS II 0.00 0.00 0.00
VTPS III 0.00 0.00 0.00
VTPS IV 3.01 95.95 106.64 92.53 119.69 115.47 100.46 124.81 33.70 0.00 86.87 117.92 124.40 1118.44 1118.44
RTPP I 3.49 77.66 86.47 76.68 70.22 82.44 82.66 95.06 96.43 98.44 98.78 94.47 83.63 1042.94 1042.94
RTPP Stage-II 3.36 85.94 98.64 78.67 97.79 71.41 88.83 94.66 77.96 93.06 98.97 94.01 91.98 1071.91 1071.91
RTPP Stage-III 3.41 43.12 47.07 36.88 47.94 14.63 43.49 47.00 42.34 48.87 50.48 47.15 46.01 514.99 514.99
KTPS A 2.52 125.26 146.85 95.86 112.27 135.82 120.69 144.38 115.41 127.74 115.90 121.45 124.49 1486.13 1486.13
KTPS B 0.00 0.00 0.00
KTPS C 0.00 0.00 0.00
KTPS D 2.07 107.01 125.01 83.56 108.38 112.43 86.69 90.30 106.75 71.30 69.26 114.32 129.24 1204.25 1204.25
KTPS Stage VI 2.63 46.78 77.99 24.13 79.76 78.09 69.85 73.79 93.79 75.97 62.88 64.67 76.84 824.54 824.54
RTS B 2.70 -0.54 9.37 12.27 14.14 10.95 10.47 13.54 12.96 14.22 13.39 14.89 12.63 138.27 138.27
NTS 0.00 0.00 0.00
Kakatiya Thermal Power Plant Stage I 2.46 90.34 97.22 75.01 121.66 113.66 92.35 60.52 98.66 76.37 10.56 72.90 68.48 977.72 977.72
Kakatiya Thermal Power Plant Stage II 0.00 229.04 229.04 229.04
Damodaram Sanjeevaiah Thermal
power plant - I 0.00 0.00 0.00
Damodaram Sanjeevaiah Thermal
power plant - II 0.00 0.00 0.00
0.00 0.00
TOTAL THERMAL 944.86 1072.37 800.19 1024.19 1002.53 925.48 1009.37 950.20 904.82 902.85 1013.54 1261.14 11811.54 0.00 11811.54
MACHKUND PH TS Share 0.00 0.00 0.00
TUNGBHADRA PH TS Share 0.00 0.00 0.00
USL 0.00 0.00 0.00
LSR 0.00 0.00 0.00
DONKARAYI 0.00 0.00 0.00
SSLM 0.00 0.00 0.00
NSPH 0.00 10.40 2.41 -0.11 0.07 -0.23 -0.25 -0.25 15.37 11.64 2.68 13.36 7.03 62.11 62.11
NSRCPH 0.00 0.00 0.00
NSLCPH 0.00 0.00 0.00 0.00 0.00 0.00 0.00 0.00 0.00 0.00 0.00 0.00 0.00 0.00 0.00
POCHAMPAD PH 0.00 -0.01 -0.02 -0.02 -0.01 -0.01 -0.01 -0.01 -0.01 -0.01 -0.01 -0.01 -0.01 -0.13 -0.13
NIZAMSAGAR PH 0.00 -0.02 -0.02 -0.02 0.04 -0.02 -0.02 -0.02 -0.01 -0.02 -0.01 -0.01 -0.02 -0.13 -0.13
PABM 0.00 0.00 0.00
MINI HYDRO&OTHERS 0.00 0.00 0.00
SINGUR 0.00 -0.02 -0.02 -0.02 -0.02 -0.01 -0.02 -0.01 -0.02 -0.02 -0.02 -0.02 -0.02 -0.19 -0.19
SSLM LCPH 0.00 5.64 -0.07 -0.49 -0.54 -0.55 7.39 12.36 30.15 9.57 -0.36 18.31 22.32 103.71 103.71
Nagarjunasagar Tail Pond Dam Power
House 0.00 0.00 0.00
Priyadarshini Jurala Hydro Electric
Project- TS Share 0.00 -0.16 -0.18 -0.16 -0.17 -0.16 10.15 5.10 0.00 0.00 -0.06 -0.06 -0.05 14.25 14.25
Net Energy
Availability
(MU)Generating Station
PLF
(%)
Variable Cost
(Rs. / kWh)
Gross Energy Availability (MU) Yearly Auxiliary
Consumption
(MU)
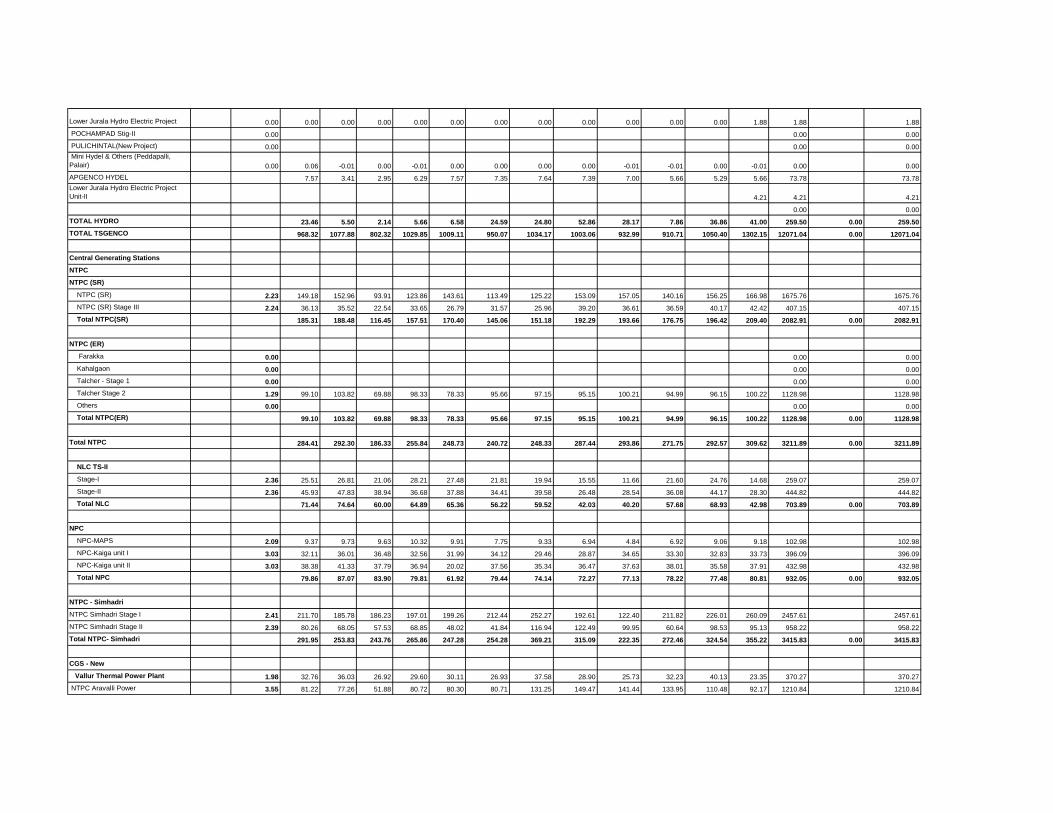
Lower Jurala Hydro Electric Project 0.00 0.00 0.00 0.00 0.00 0.00 0.00 0.00 0.00 0.00 0.00 0.00 1.88 1.88 1.88
POCHAMPAD Stig-II 0.00 0.00 0.00
PULICHINTAL(New Project) 0.00 0.00 0.00
Mini Hydel & Others (Peddapalli,
Palair) 0.00 0.06 -0.01 0.00 -0.01 0.00 0.00 0.00 0.00 -0.01 -0.01 0.00 -0.01 0.00 0.00
APGENCO HYDEL 7.57 3.41 2.95 6.29 7.57 7.35 7.64 7.39 7.00 5.66 5.29 5.66 73.78 73.78
Lower Jurala Hydro Electric Project
Unit-II 4.21 4.21 4.21
0.00 0.00
TOTAL HYDRO 23.46 5.50 2.14 5.66 6.58 24.59 24.80 52.86 28.17 7.86 36.86 41.00 259.50 0.00 259.50
TOTAL TSGENCO 968.32 1077.88 802.32 1029.85 1009.11 950.07 1034.17 1003.06 932.99 910.71 1050.40 1302.15 12071.04 0.00 12071.04
Central Generating Stations
NTPC
NTPC (SR)
NTPC (SR) 2.23 149.18 152.96 93.91 123.86 143.61 113.49 125.22 153.09 157.05 140.16 156.25 166.98 1675.76 1675.76
NTPC (SR) Stage III 2.24 36.13 35.52 22.54 33.65 26.79 31.57 25.96 39.20 36.61 36.59 40.17 42.42 407.15 407.15
Total NTPC(SR) 185.31 188.48 116.45 157.51 170.40 145.06 151.18 192.29 193.66 176.75 196.42 209.40 2082.91 0.00 2082.91
NTPC (ER)
Farakka 0.00 0.00 0.00
Kahalgaon 0.00 0.00 0.00
Talcher - Stage 1 0.00 0.00 0.00
Talcher Stage 2 1.29 99.10 103.82 69.88 98.33 78.33 95.66 97.15 95.15 100.21 94.99 96.15 100.22 1128.98 1128.98
Others 0.00 0.00 0.00
Total NTPC(ER) 99.10 103.82 69.88 98.33 78.33 95.66 97.15 95.15 100.21 94.99 96.15 100.22 1128.98 0.00 1128.98
Total NTPC 284.41 292.30 186.33 255.84 248.73 240.72 248.33 287.44 293.86 271.75 292.57 309.62 3211.89 0.00 3211.89
NLC TS-II
Stage-I 2.36 25.51 26.81 21.06 28.21 27.48 21.81 19.94 15.55 11.66 21.60 24.76 14.68 259.07 259.07
Stage-II 2.36 45.93 47.83 38.94 36.68 37.88 34.41 39.58 26.48 28.54 36.08 44.17 28.30 444.82 444.82
Total NLC 71.44 74.64 60.00 64.89 65.36 56.22 59.52 42.03 40.20 57.68 68.93 42.98 703.89 0.00 703.89
NPC
NPC-MAPS 2.09 9.37 9.73 9.63 10.32 9.91 7.75 9.33 6.94 4.84 6.92 9.06 9.18 102.98 102.98
NPC-Kaiga unit I 3.03 32.11 36.01 36.48 32.56 31.99 34.12 29.46 28.87 34.65 33.30 32.83 33.73 396.09 396.09
NPC-Kaiga unit II 3.03 38.38 41.33 37.79 36.94 20.02 37.56 35.34 36.47 37.63 38.01 35.58 37.91 432.98 432.98
Total NPC 79.86 87.07 83.90 79.81 61.92 79.44 74.14 72.27 77.13 78.22 77.48 80.81 932.05 0.00 932.05
NTPC - Simhadri
NTPC Simhadri Stage I 2.41 211.70 185.78 186.23 197.01 199.26 212.44 252.27 192.61 122.40 211.82 226.01 260.09 2457.61 2457.61
NTPC Simhadri Stage II 2.39 80.26 68.05 57.53 68.85 48.02 41.84 116.94 122.49 99.95 60.64 98.53 95.13 958.22 958.22
Total NTPC- Simhadri 291.95 253.83 243.76 265.86 247.28 254.28 369.21 315.09 222.35 272.46 324.54 355.22 3415.83 0.00 3415.83
CGS - New
Vallur Thermal Power Plant 1.98 32.76 36.03 26.92 29.60 30.11 26.93 37.58 28.90 25.73 32.23 40.13 23.35 370.27 370.27
NTPC Aravalli Power 3.55 81.22 77.26 51.88 80.72 80.30 80.71 131.25 149.47 141.44 133.95 110.48 92.17 1210.84 1210.84

NLC Tamillnadu Power Ltd. 0.00 0.00 8.00 10.24 16.22 22.41 30.28 40.43 40.59 42.11 52.85 27.14 290.24 290.24
NVVNL B.P.Coal 20.44 20.79 17.11 19.85 20.16 17.45 20.01 19.28 20.80 20.03 19.96 22.14 238.01 238.01
0.00 0.00
TOTAL CGS 862.09 841.90 677.90 806.82 770.06 778.15 970.31 954.92 862.09 908.43 986.93 953.44 10373.03 0.00 10373.03
APGPCL
APGPCL I - Allocated capacity 3.18 1.23 0.87 1.22 1.04 0.90 0.87 0.79 0.58 0.57 0.59 0.64 0.74 10.05 10.05
APGPCL I - Unutilised capacity 0.00 0.00
APGPCL II - Allocated capacity 2.86 4.28 3.02 4.30 3.69 3.15 2.89 2.65 1.96 1.97 2.23 2.35 2.98 35.48 35.48
APGPCL II - Unutilised capacity 0.00 0.00 0.00 0.00 0.00 0.00 0.00 0.00 0.00 0.00 0.00 0.00 0.00 0.00
Total APGPCL 5.52 3.88 5.51 4.73 4.05 3.76 3.45 2.54 2.55 2.82 2.99 3.72 45.52 0.00 45.52
IPPS
GVK 2.84 22.23 26.03 0.00 0.00 0.00 0.00 18.32 0.00 0.00 0.00 0.00 -2.02 64.55 64.55
Spectrum 2.78 16.28 20.90 23.80 20.92 12.78 9.96 7.76 11.42 20.05 15.53 12.35 5.56 177.29 177.29
Kondapalli (Naphtha) 3.13 9.98 3.99 1.96 1.19 4.37 5.38 9.81 14.32 15.87 5.06 0.00 0.38 72.31 72.31
Kondapalli (Gas) 0.00 0.00 0.00
BSES 0.00 0.00 0.00
GVK Extension 4.70 0.00 0.00 0.00 0.00 0.00 0.00 0.00 22.27 22.22 0.69 0.00 0.00 45.18 45.18
Vemagiri 3.98 18.65 40.98 0.00 0.00 0.00 0.00 0.00 0.00 0.00 0.00 0.00 0.00 59.62 59.62
Gautami 3.38 39.61 38.54 0.00 0.00 0.00 0.00 0.00 0.00 0.00 0.00 0.00 0.00 78.15 78.15
Konaseema 0.00 0.00 0.00
0.00 0.00
TOTAL IPPS 106.74 130.44 25.76 22.10 17.15 15.34 35.88 48.00 58.13 21.28 12.35 3.92 497.10 0.00 497.10
NCE
NCE - Bio-Mass 0.00 3.32 2.70 2.47 2.85 2.94 2.96 0.92 3.20 3.36 5.02 4.87 6.00 40.61 40.61
NCE - Bagasse 0.00 0.00 0.00 0.00 0.00 0.00 0.00 0.00 0.00 5.59 7.91 7.46 4.19 25.15 25.15
NCE - Municipal Waste to Energy 0.00 0.00 0.00
NCE - Industrial Waste based power
project 0.00 3.84 3.13 4.26 4.48 4.42 3.75 1.73 1.89 1.33 2.97 4.10 2.28 38.18 38.18
NCE - Wind Power 0.00 0.00 0.00
NCE - Mini Hydel 0.00 0.11 0.00 0.00 0.00 0.00 0.00 0.00 0.00 0.00 0.00 0.00 0.00 0.11 0.11
NCE - NCL Energy Ltd 0.00 0.00 0.00
NCE-Others 2.29 7.44 8.87 7.66 7.56 14.49 11.29 14.14 14.27 15.13 16.35 17.86 37.53 172.60 172.60
TOTAL NCE 14.72 14.70 14.38 14.89 21.85 18.00 16.79 19.36 25.40 32.25 34.29 50.00 276.65 0.00 276.65
OTHERS
Srivathsa 0.00 0.00
LVS 0.00 0.00
Vishakapatnam Steel Plant 0.00 0.00
NB Ferro Alloys 0.00 0.00
KSK Mahanadi (MT) 3.74 146.30 156.32 138.31 149.72 128.01 123.30 148.74 127.48 132.14 91.23 103.92 137.66 1583.15 1583.15
Hinduja 0.00 0.00
Thermal Power Unit 1 1.78 46.85 74.16 123.39 124.50 103.74 133.58 141.39 123.00 139.70 136.55 131.91 139.76 1418.52 1418.52
Thermal Power Unit 2 0.00 0.00 0.00
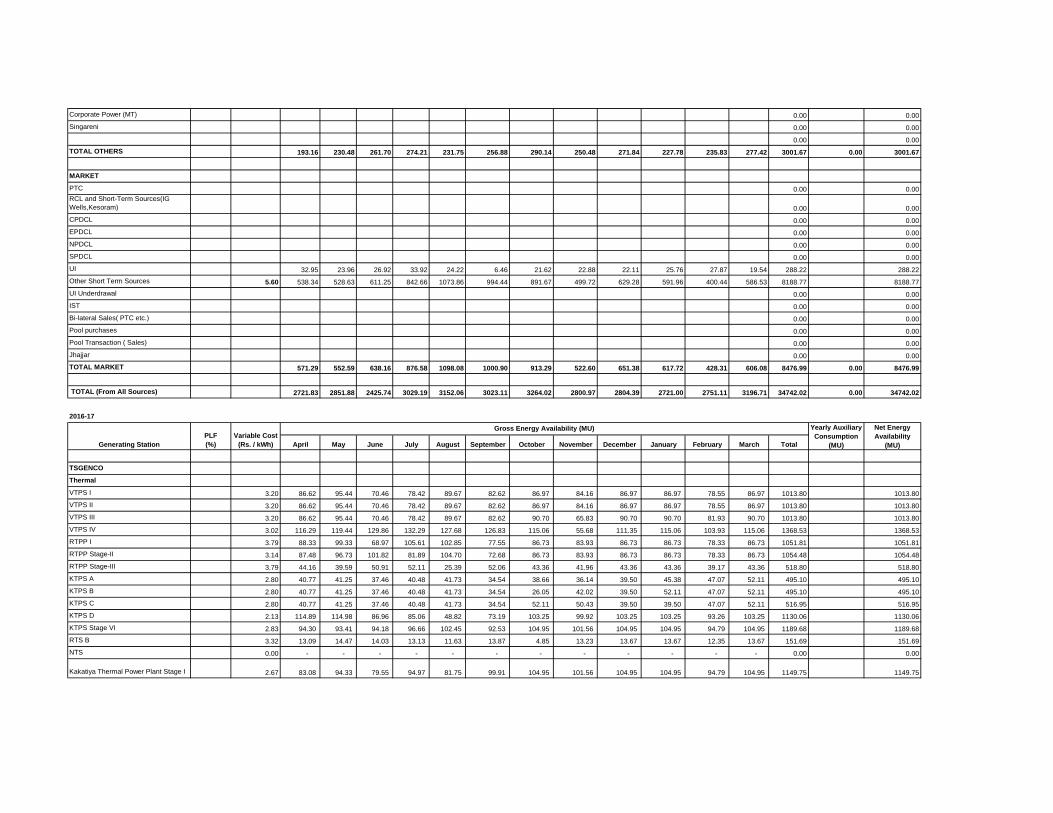
Corporate Power (MT) 0.00 0.00
Singareni 0.00 0.00
0.00 0.00
TOTAL OTHERS 193.16 230.48 261.70 274.21 231.75 256.88 290.14 250.48 271.84 227.78 235.83 277.42 3001.67 0.00 3001.67
MARKET
PTC 0.00 0.00
RCL and Short-Term Sources(IG
Wells,Kesoram) 0.00 0.00
CPDCL 0.00 0.00
EPDCL 0.00 0.00
NPDCL 0.00 0.00
SPDCL 0.00 0.00
UI 32.95 23.96 26.92 33.92 24.22 6.46 21.62 22.88 22.11 25.76 27.87 19.54 288.22 288.22
Other Short Term Sources 5.60 538.34 528.63 611.25 842.66 1073.86 994.44 891.67 499.72 629.28 591.96 400.44 586.53 8188.77 8188.77
UI Underdrawal 0.00 0.00
IST 0.00 0.00
Bi-lateral Sales( PTC etc.) 0.00 0.00
Pool purchases 0.00 0.00
Pool Transaction ( Sales) 0.00 0.00
Jhajjar 0.00 0.00
TOTAL MARKET 571.29 552.59 638.16 876.58 1098.08 1000.90 913.29 522.60 651.38 617.72 428.31 606.08 8476.99 0.00 8476.99
TOTAL (From All Sources) 2721.83 2851.88 2425.74 3029.19 3152.06 3023.11 3264.02 2800.97 2804.39 2721.00 2751.11 3196.71 34742.02 0.00 34742.02
2016-17
April May June July August September October November December January February March Total
TSGENCO
Thermal
VTPS I 3.20 86.62 95.44 70.46 78.42 89.67 82.62 86.97 84.16 86.97 86.97 78.55 86.97 1013.80 1013.80
VTPS II 3.20 86.62 95.44 70.46 78.42 89.67 82.62 86.97 84.16 86.97 86.97 78.55 86.97 1013.80 1013.80
VTPS III 3.20 86.62 95.44 70.46 78.42 89.67 82.62 90.70 65.83 90.70 90.70 81.93 90.70 1013.80 1013.80
VTPS IV 3.02 116.29 119.44 129.86 132.29 127.68 126.83 115.06 55.68 111.35 115.06 103.93 115.06 1368.53 1368.53
RTPP I 3.79 88.33 99.33 68.97 105.61 102.85 77.55 86.73 83.93 86.73 86.73 78.33 86.73 1051.81 1051.81
RTPP Stage-II 3.14 87.48 96.73 101.82 81.89 104.70 72.68 86.73 83.93 86.73 86.73 78.33 86.73 1054.48 1054.48
RTPP Stage-III 3.79 44.16 39.59 50.91 52.11 25.39 52.06 43.36 41.96 43.36 43.36 39.17 43.36 518.80 518.80
KTPS A 2.80 40.77 41.25 37.46 40.48 41.73 34.54 38.66 36.14 39.50 45.38 47.07 52.11 495.10 495.10
KTPS B 2.80 40.77 41.25 37.46 40.48 41.73 34.54 26.05 42.02 39.50 52.11 47.07 52.11 495.10 495.10
KTPS C 2.80 40.77 41.25 37.46 40.48 41.73 34.54 52.11 50.43 39.50 39.50 47.07 52.11 516.95 516.95
KTPS D 2.13 114.89 114.98 86.96 85.06 48.82 73.19 103.25 99.92 103.25 103.25 93.26 103.25 1130.06 1130.06
KTPS Stage VI 2.83 94.30 93.41 94.18 96.66 102.45 92.53 104.95 101.56 104.95 104.95 94.79 104.95 1189.68 1189.68
RTS B 3.32 13.09 14.47 14.03 13.13 11.63 13.87 4.85 13.23 13.67 13.67 12.35 13.67 151.69 151.69
NTS 0.00 - - - - - - - - - - - - 0.00 0.00
Kakatiya Thermal Power Plant Stage I 2.67 83.08 94.33 79.55 94.97 81.75 99.91 104.95 101.56 104.95 104.95 94.79 104.95 1149.75 1149.75
Generating Station
PLF
(%)
Variable Cost
(Rs. / kWh)
Gross Energy Availability (MU) Yearly Auxiliary
Consumption
(MU)
Net Energy
Availability
(MU)
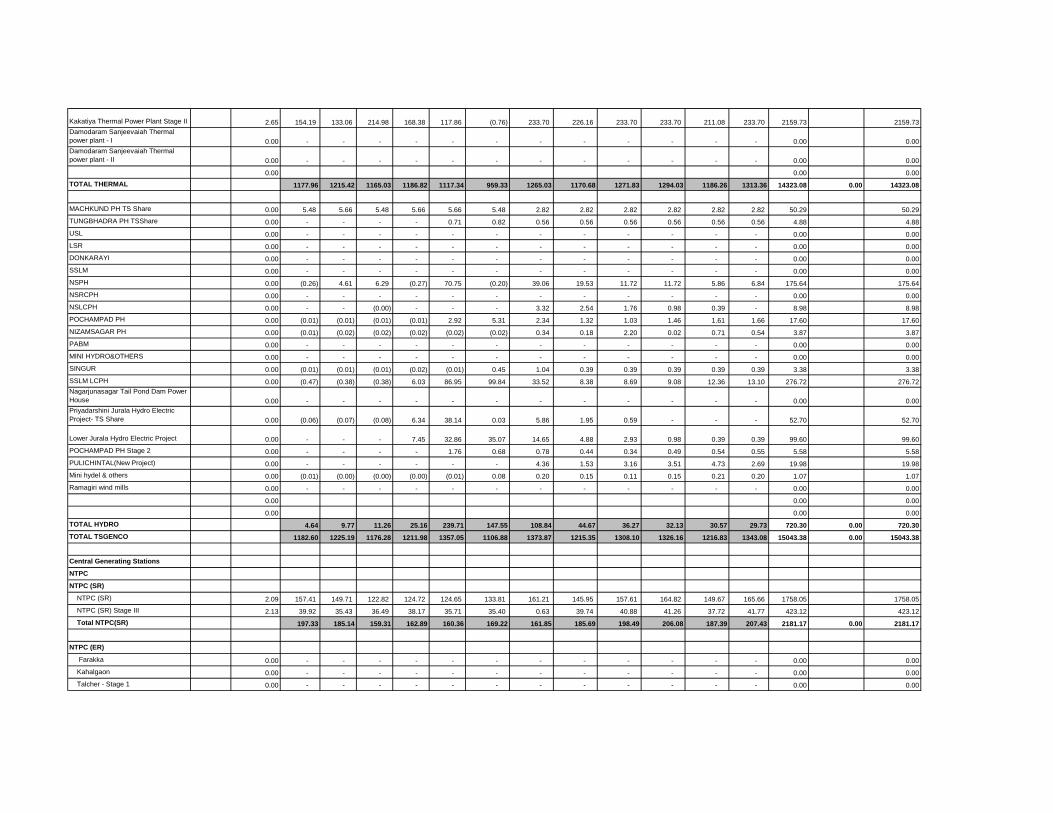
Kakatiya Thermal Power Plant Stage II 2.65 154.19 133.06 214.98 168.38 117.86 (0.76) 233.70 226.16 233.70 233.70 211.08 233.70 2159.73 2159.73
Damodaram Sanjeevaiah Thermal
power plant - I 0.00 - - - - - - - - - - - - 0.00 0.00
Damodaram Sanjeevaiah Thermal
power plant - II 0.00 - - - - - - - - - - - - 0.00 0.00
0.00 0.00 0.00
TOTAL THERMAL 1177.96 1215.42 1165.03 1186.82 1117.34 959.33 1265.03 1170.68 1271.83 1294.03 1186.26 1313.36 14323.08 0.00 14323.08
MACHKUND PH TS Share 0.00 5.48 5.66 5.48 5.66 5.66 5.48 2.82 2.82 2.82 2.82 2.82 2.82 50.29 50.29
TUNGBHADRA PH TSShare 0.00 - - - - 0.71 0.82 0.56 0.56 0.56 0.56 0.56 0.56 4.88 4.88
USL 0.00 - - - - - - - - - - - - 0.00 0.00
LSR 0.00 - - - - - - - - - - - - 0.00 0.00
DONKARAYI 0.00 - - - - - - - - - - - - 0.00 0.00
SSLM 0.00 - - - - - - - - - - - - 0.00 0.00
NSPH 0.00 (0.26) 4.61 6.29 (0.27) 70.75 (0.20) 39.06 19.53 11.72 11.72 5.86 6.84 175.64 175.64
NSRCPH 0.00 - - - - - - - - - - - - 0.00 0.00
NSLCPH 0.00 - - (0.00) - - - 3.32 2.54 1.76 0.98 0.39 - 8.98 8.98
POCHAMPAD PH 0.00 (0.01) (0.01) (0.01) (0.01) 2.92 5.31 2.34 1.32 1.03 1.46 1.61 1.66 17.60 17.60
NIZAMSAGAR PH 0.00 (0.01) (0.02) (0.02) (0.02) (0.02) (0.02) 0.34 0.18 2.20 0.02 0.71 0.54 3.87 3.87
PABM 0.00 - - - - - - - - - - - - 0.00 0.00
MINI HYDRO&OTHERS 0.00 - - - - - - - - - - - - 0.00 0.00
SINGUR 0.00 (0.01) (0.01) (0.01) (0.02) (0.01) 0.45 1.04 0.39 0.39 0.39 0.39 0.39 3.38 3.38
SSLM LCPH 0.00 (0.47) (0.38) (0.38) 6.03 86.95 99.84 33.52 8.38 8.69 9.08 12.36 13.10 276.72 276.72
Nagarjunasagar Tail Pond Dam Power
House 0.00 - - - - - - - - - - - - 0.00 0.00
Priyadarshini Jurala Hydro Electric
Project- TS Share 0.00 (0.06) (0.07) (0.08) 6.34 38.14 0.03 5.86 1.95 0.59 - - - 52.70 52.70
Lower Jurala Hydro Electric Project 0.00 - - - 7.45 32.86 35.07 14.65 4.88 2.93 0.98 0.39 0.39 99.60 99.60
POCHAMPAD PH Stage 2 0.00 - - - - 1.76 0.68 0.78 0.44 0.34 0.49 0.54 0.55 5.58 5.58
PULICHINTAL(New Project) 0.00 - - - - - - 4.36 1.53 3.16 3.51 4.73 2.69 19.98 19.98
Mini hydel & others 0.00 (0.01) (0.00) (0.00) (0.00) (0.01) 0.08 0.20 0.15 0.11 0.15 0.21 0.20 1.07 1.07
Ramagiri wind mills 0.00 - - - - - - - - - - - - 0.00 0.00
0.00 0.00 0.00
0.00 0.00 0.00
TOTAL HYDRO 4.64 9.77 11.26 25.16 239.71 147.55 108.84 44.67 36.27 32.13 30.57 29.73 720.30 0.00 720.30
TOTAL TSGENCO 1182.60 1225.19 1176.28 1211.98 1357.05 1106.88 1373.87 1215.35 1308.10 1326.16 1216.83 1343.08 15043.38 0.00 15043.38
Central Generating Stations
NTPC
NTPC (SR)
NTPC (SR) 2.09 157.41 149.71 122.82 124.72 124.65 133.81 161.21 145.95 157.61 164.82 149.67 165.66 1758.05 1758.05
NTPC (SR) Stage III 2.13 39.92 35.43 36.49 38.17 35.71 35.40 0.63 39.74 40.88 41.26 37.72 41.77 423.12 423.12
Total NTPC(SR) 197.33 185.14 159.31 162.89 160.36 169.22 161.85 185.69 198.49 206.08 187.39 207.43 2181.17 0.00 2181.17
NTPC (ER)
Farakka 0.00 - - - - - - - - - - - - 0.00 0.00
Kahalgaon 0.00 - - - - - - - - - - - - 0.00 0.00
Talcher - Stage 1 0.00 - - - - - - - - - - - - 0.00 0.00

Talcher Stage 2 1.60 96.49 94.65 89.34 101.21 84.33 68.47 86.74 99.81 103.16 103.16 93.12 103.16 1123.64 1123.64
Others 0.00 - - - - - - - - - - - - 0.00 0.00
Total NTPC(ER) 96.49 94.65 89.34 101.21 84.33 68.47 86.74 99.81 103.16 103.16 93.12 103.16 1123.64 0.00 1123.64
Total NTPC 293.82 279.79 248.65 264.10 244.69 237.69 248.59 285.50 301.65 309.24 280.51 310.59 3304.81 0.00 3304.81
NLC TS-II
Stage-I 2.95 13.77 18.14 18.35 15.69 24.50 21.45 13.44 8.96 12.98 19.90 19.18 21.09 207.44 207.44
Stage-II 3.06 29.68 32.81 25.35 28.05 37.42 38.61 31.06 36.74 37.81 40.03 36.21 39.85 413.63 413.63
Total NLC 43.45 50.95 43.71 43.73 61.92 60.05 44.51 45.71 50.79 59.93 55.39 60.94 621.07 0.00 621.07
NPC
NPC-MAPS 2.18 6.46 8.56 8.25 8.87 8.95 5.38 8.38 5.54 6.55 8.38 7.81 8.38 91.53 91.53
NPC-Kaiga unit I 3.13 22.70 24.63 26.37 34.38 34.20 32.65 25.83 25.83 25.83 25.83 25.83 25.83 329.91 329.91
NPC-Kaiga unit II 3.11 36.50 15.72 17.48 18.37 18.30 17.60 32.28 32.28 32.28 32.28 32.28 32.28 317.68 317.68
Total NPC 65.66 48.92 52.10 61.62 61.45 55.64 66.50 63.65 64.66 66.50 65.92 66.50 739.11 0.00 739.11
NTPC - Simhadri
NTPC Simhadri Stage I 2.69 253.66 231.07 210.62 233.63 231.20 209.16 231.92 224.32 231.92 231.92 209.49 231.92 2730.83 2730.83
NTPC Simhadri Stage II 2.59 94.03 87.72 85.01 84.80 90.04 80.60 107.08 90.84 72.84 107.08 96.78 107.08 1103.90 1103.90
Total NTPC- Simhadri 347.69 318.79 295.63 318.42 321.24 289.76 339.00 315.15 304.77 339.00 306.27 339.00 3834.74 0.00 3834.74
CGS - New
Vallur Thermal Power Plant 2.17 35.28 33.68 27.02 30.44 44.43 42.17 34.60 46.33 47.90 47.90 43.28 47.90 480.92 480.92
Tuticorin 2.29 36.07 46.08 29.45 49.69 50.18 57.59 63.01 61.00 63.01 63.22 57.18 63.11 639.59 639.59
Kudigi 1.89 - - - - - - - - - 11.29 10.21 11.29 32.80 32.80
NVVNL Bundled Power -COAL 21.04 19.97 16.81 17.61 17.60 17.11 19.62 19.62 19.62 19.62 19.62 19.62 227.87 227.87
0.00 0.00
TOTAL CGS 843.01 798.19 713.37 785.61 801.51 760.01 815.82 836.96 852.39 916.71 838.37 918.96 9880.90 0.00 9880.90
APGPCL
APGPCL I - Allocated capacity 2.84 0.71 0.59 1.10 0.65 0.38 0.35 0.57 1.16 1.20 1.20 1.08 1.20 10.20 10.20
APGPCL I - Unutilised capacity 0.00 - - - - - - - - - - - - 0.00 0.00
APGPCL II - Allocated capacity 2.33 2.82 2.29 4.33 2.51 1.40 1.16 2.08 4.15 4.29 4.23 3.88 4.29 37.44 37.44
APGPCL II - Unutilised capacity 0.00 - - - - - - - - - - - - 0.00 0.00
Total APGPCL 3.53 2.88 5.44 3.17 1.78 1.50 2.65 5.31 5.49 5.43 4.96 5.49 47.64 0.00 47.64
IPPS
GVK 0.00 - - - - - - - - - - - - 0.00 0.00
Spectrum 0.00 - - - - - - - - - - - - 0.00 0.00
Kondapalli (Naphtha) 0.00 - - - - - - - - - - - - 0.00 0.00
Kondapalli (Gas) 0.00 - - - - - - - - - - - - 0.00 0.00
BSES 0.00 - - - - - - - - - - - - 0.00 0.00
GVK Extension 4.65 - - - - - 27.86 - - - - - - 27.86 27.86
Vemagiri 0.00 - - - - - - - - - - - - 0.00 0.00
Gautami 0.00 - - - - - - - - - - - - 0.00 0.00
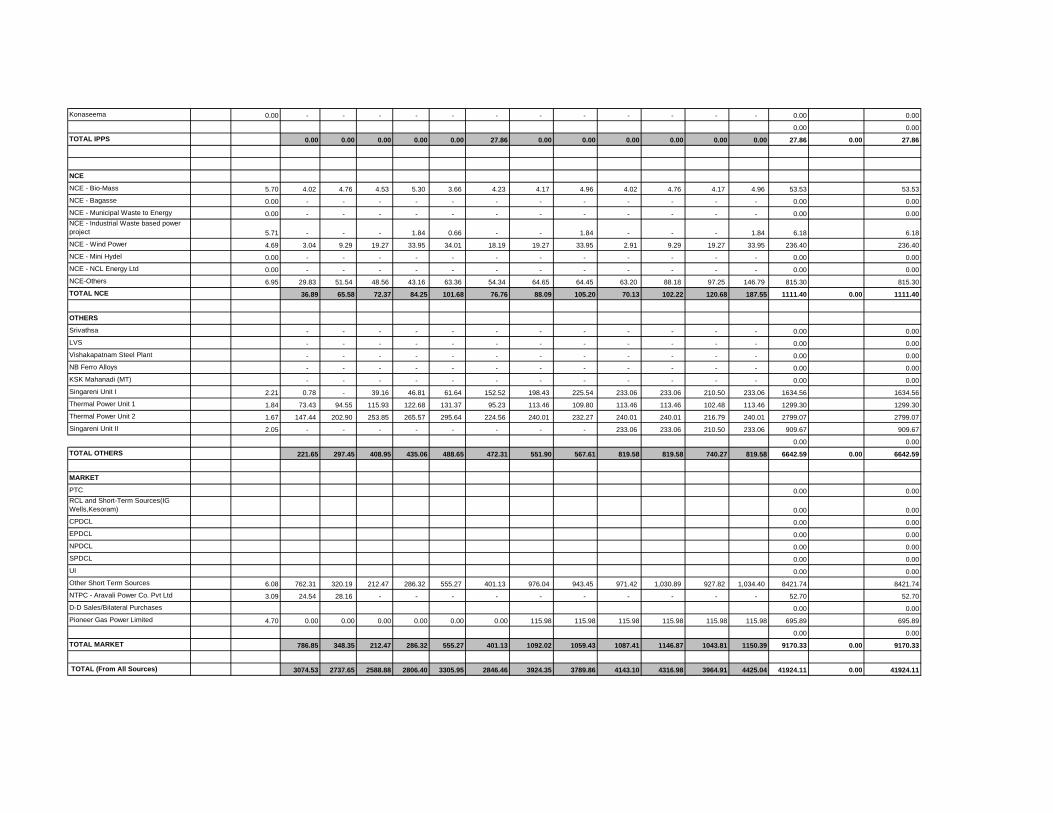
Konaseema 0.00 - - - - - - - - - - - - 0.00 0.00
0.00 0.00
TOTAL IPPS 0.00 0.00 0.00 0.00 0.00 27.86 0.00 0.00 0.00 0.00 0.00 0.00 27.86 0.00 27.86
NCE
NCE - Bio-Mass 5.70 4.02 4.76 4.53 5.30 3.66 4.23 4.17 4.96 4.02 4.76 4.17 4.96 53.53 53.53
NCE - Bagasse 0.00 - - - - - - - - - - - - 0.00 0.00
NCE - Municipal Waste to Energy 0.00 - - - - - - - - - - - - 0.00 0.00
NCE - Industrial Waste based power
project 5.71 - - - 1.84 0.66 - - 1.84 - - - 1.84 6.18 6.18
NCE - Wind Power 4.69 3.04 9.29 19.27 33.95 34.01 18.19 19.27 33.95 2.91 9.29 19.27 33.95 236.40 236.40
NCE - Mini Hydel 0.00 - - - - - - - - - - - - 0.00 0.00
NCE - NCL Energy Ltd 0.00 - - - - - - - - - - - - 0.00 0.00
NCE-Others 6.95 29.83 51.54 48.56 43.16 63.36 54.34 64.65 64.45 63.20 88.18 97.25 146.79 815.30 815.30
TOTAL NCE 36.89 65.58 72.37 84.25 101.68 76.76 88.09 105.20 70.13 102.22 120.68 187.55 1111.40 0.00 1111.40
OTHERS
Srivathsa - - - - - - - - - - - - 0.00 0.00
LVS - - - - - - - - - - - - 0.00 0.00
Vishakapatnam Steel Plant - - - - - - - - - - - - 0.00 0.00
NB Ferro Alloys - - - - - - - - - - - - 0.00 0.00
KSK Mahanadi (MT) - - - - - - - - - - - - 0.00 0.00
Singareni Unit I 2.21 0.78 - 39.16 46.81 61.64 152.52 198.43 225.54 233.06 233.06 210.50 233.06 1634.56 1634.56
Thermal Power Unit 1 1.84 73.43 94.55 115.93 122.68 131.37 95.23 113.46 109.80 113.46 113.46 102.48 113.46 1299.30 1299.30
Thermal Power Unit 2 1.67 147.44 202.90 253.85 265.57 295.64 224.56 240.01 232.27 240.01 240.01 216.79 240.01 2799.07 2799.07
Singareni Unit II 2.05 - - - - - - - - 233.06 233.06 210.50 233.06 909.67 909.67
0.00 0.00
TOTAL OTHERS 221.65 297.45 408.95 435.06 488.65 472.31 551.90 567.61 819.58 819.58 740.27 819.58 6642.59 0.00 6642.59
MARKET
PTC 0.00 0.00
RCL and Short-Term Sources(IG
Wells,Kesoram) 0.00 0.00
CPDCL 0.00 0.00
EPDCL 0.00 0.00
NPDCL 0.00 0.00
SPDCL 0.00 0.00
UI 0.00 0.00
Other Short Term Sources 6.08 762.31 320.19 212.47 286.32 555.27 401.13 976.04 943.45 971.42 1,030.89 927.82 1,034.40 8421.74 8421.74
NTPC - Aravali Power Co. Pvt Ltd 3.09 24.54 28.16 - - - - - - - - - - 52.70 52.70
D-D Sales/Bilateral Purchases 0.00 0.00
Pioneer Gas Power Limited 4.70 0.00 0.00 0.00 0.00 0.00 0.00 115.98 115.98 115.98 115.98 115.98 115.98 695.89 695.89
0.00 0.00
TOTAL MARKET 786.85 348.35 212.47 286.32 555.27 401.13 1092.02 1059.43 1087.41 1146.87 1043.81 1150.39 9170.33 0.00 9170.33
TOTAL (From All Sources) 3074.53 2737.65 2588.88 2806.40 3305.95 2846.46 3924.35 3789.86 4143.10 4316.98 3964.91 4425.04 41924.11 0.00 41924.11
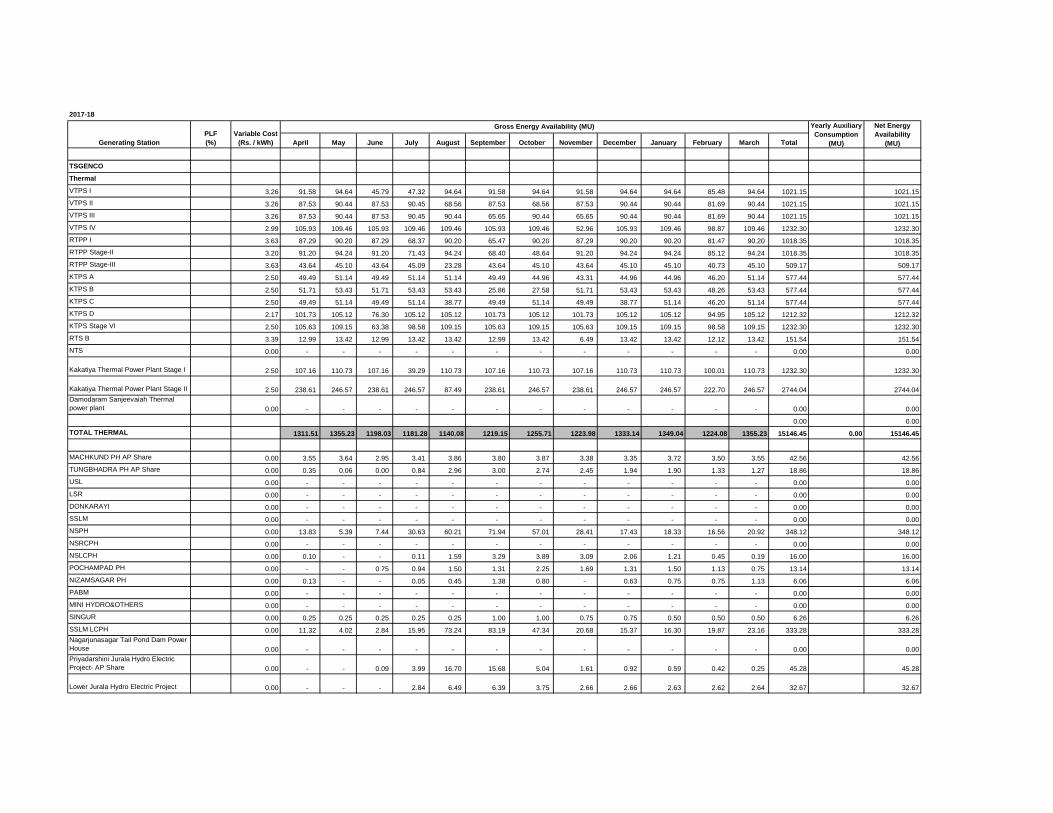
2017-18
April May June July August September October November December January February March Total
TSGENCO
Thermal
VTPS I 3.26 91.58 94.64 45.79 47.32 94.64 91.58 94.64 91.58 94.64 94.64 85.48 94.64 1021.15 1021.15
VTPS II 3.26 87.53 90.44 87.53 90.45 68.56 87.53 68.56 87.53 90.44 90.44 81.69 90.44 1021.15 1021.15
VTPS III 3.26 87.53 90.44 87.53 90.45 90.44 65.65 90.44 65.65 90.44 90.44 81.69 90.44 1021.15 1021.15
VTPS IV 2.99 105.93 109.46 105.93 109.46 109.46 105.93 109.46 52.96 105.93 109.46 98.87 109.46 1232.30 1232.30
RTPP I 3.63 87.29 90.20 87.29 68.37 90.20 65.47 90.20 87.29 90.20 90.20 81.47 90.20 1018.35 1018.35
RTPP Stage-II 3.20 91.20 94.24 91.20 71.43 94.24 68.40 48.64 91.20 94.24 94.24 85.12 94.24 1018.35 1018.35
RTPP Stage-III 3.63 43.64 45.10 43.64 45.09 23.28 43.64 45.10 43.64 45.10 45.10 40.73 45.10 509.17 509.17
KTPS A 2.50 49.49 51.14 49.49 51.14 51.14 49.49 44.96 43.31 44.96 44.96 46.20 51.14 577.44 577.44
KTPS B 2.50 51.71 53.43 51.71 53.43 53.43 25.86 27.58 51.71 53.43 53.43 48.26 53.43 577.44 577.44
KTPS C 2.50 49.49 51.14 49.49 51.14 38.77 49.49 51.14 49.49 38.77 51.14 46.20 51.14 577.44 577.44
KTPS D 2.17 101.73 105.12 76.30 105.12 105.12 101.73 105.12 101.73 105.12 105.12 94.95 105.12 1212.32 1212.32
KTPS Stage VI 2.50 105.63 109.15 63.38 98.58 109.15 105.63 109.15 105.63 109.15 109.15 98.58 109.15 1232.30 1232.30
RTS B 3.39 12.99 13.42 12.99 13.42 13.42 12.99 13.42 6.49 13.42 13.42 12.12 13.42 151.54 151.54
NTS 0.00 - - - - - - - - - - - - 0.00 0.00
Kakatiya Thermal Power Plant Stage I 2.50 107.16 110.73 107.16 39.29 110.73 107.16 110.73 107.16 110.73 110.73 100.01 110.73 1232.30 1232.30
Kakatiya Thermal Power Plant Stage II 2.50 238.61 246.57 238.61 246.57 87.49 238.61 246.57 238.61 246.57 246.57 222.70 246.57 2744.04 2744.04
Damodaram Sanjeevaiah Thermal
power plant 0.00 - - - - - - - - - - - - 0.00 0.00
0.00 0.00
TOTAL THERMAL 1311.51 1355.23 1198.03 1181.28 1140.08 1219.15 1255.71 1223.98 1333.14 1349.04 1224.08 1355.23 15146.45 0.00 15146.45
MACHKUND PH AP Share 0.00 3.55 3.64 2.95 3.41 3.86 3.80 3.87 3.38 3.35 3.72 3.50 3.55 42.56 42.56
TUNGBHADRA PH AP Share 0.00 0.35 0.06 0.00 0.84 2.96 3.00 2.74 2.45 1.94 1.90 1.33 1.27 18.86 18.86
USL 0.00 - - - - - - - - - - - - 0.00 0.00
LSR 0.00 - - - - - - - - - - - - 0.00 0.00
DONKARAYI 0.00 - - - - - - - - - - - - 0.00 0.00
SSLM 0.00 - - - - - - - - - - - - 0.00 0.00
NSPH 0.00 13.83 5.39 7.44 30.63 60.21 71.94 57.01 28.41 17.43 18.33 16.56 20.92 348.12 348.12
NSRCPH 0.00 - - - - - - - - - - - - 0.00 0.00
NSLCPH 0.00 0.10 - - 0.11 1.59 3.29 3.89 3.09 2.06 1.21 0.45 0.19 16.00 16.00
POCHAMPAD PH 0.00 - - 0.75 0.94 1.50 1.31 2.25 1.69 1.31 1.50 1.13 0.75 13.14 13.14
NIZAMSAGAR PH 0.00 0.13 - - 0.05 0.45 1.38 0.80 - 0.63 0.75 0.75 1.13 6.06 6.06
PABM 0.00 - - - - - - - - - - - - 0.00 0.00
MINI HYDRO&OTHERS 0.00 - - - - - - - - - - - - 0.00 0.00
SINGUR 0.00 0.25 0.25 0.25 0.25 0.25 1.00 1.00 0.75 0.75 0.50 0.50 0.50 6.26 6.26
SSLM LCPH 0.00 11.32 4.02 2.84 15.95 73.24 83.19 47.34 20.68 15.37 16.30 19.87 23.16 333.28 333.28
Nagarjunasagar Tail Pond Dam Power
House 0.00 - - - - - - - - - - - - 0.00 0.00
Priyadarshini Jurala Hydro Electric
Project- AP Share 0.00 - - 0.09 3.99 16.70 15.68 5.04 1.61 0.92 0.59 0.42 0.25 45.28 45.28
Lower Jurala Hydro Electric Project 0.00 - - - 2.84 6.49 6.39 3.75 2.66 2.66 2.63 2.62 2.64 32.67 32.67
Net Energy
Availability
(MU)Generating Station
PLF
(%)
Variable Cost
(Rs. / kWh)
Gross Energy Availability (MU) Yearly Auxiliary
Consumption
(MU)

April May June July August September October November December January February March Total
Net Energy
Availability
(MU)Generating Station
PLF
(%)
Variable Cost
(Rs. / kWh)
Gross Energy Availability (MU) Yearly Auxiliary
Consumption
(MU)
POCHAMPAD PH Stage 2 0.00 - - 0.25 0.31 0.50 0.44 0.75 0.56 0.44 0.50 0.38 0.25 4.38 4.38
Pulichintala New project 0.00 0.09 0.17 10.81 11.17 11.17 10.81 16.76 5.89 12.14 8.99 12.14 6.90 107.05 107.05
Mini hydel & others 0.00 0.01 0.01 0.50 1.01 1.51 1.60 1.69 1.66 1.51 1.68 1.69 1.19 14.05 14.05
Ramagiri wind mills 0.00 - - - - - - - - - - - - 0.00 0.00
0.00 0.00
TOTAL HYDRO 29.63 13.53 25.89 71.52 180.44 203.84 146.89 72.86 60.51 58.60 61.32 62.70 987.72 0.00 987.72
TOTAL TSGENCO 1341.14 1368.75 1223.92 1252.80 1320.51 1422.99 1402.60 1296.84 1393.64 1407.64 1285.40 1417.93 16134.16 0.00 16134.16
Central Generating Stations
NTPC
NTPC (SR)
NTPC (SR) 2.07 150.21 153.59 133.83 128.91 128.14 142.22 155.05 152.18 156.44 157.50 142.56 158.32 1758.95 1758.95
NTPC (SR) Stage III 2.03 36.56 37.37 36.13 36.93 37.33 36.13 37.54 36.97 38.20 38.20 34.53 38.23 444.12 444.12
Total NTPC(SR) 186.77 190.96 169.96 165.84 165.47 178.35 192.59 189.15 194.64 195.71 177.08 196.54 2203.07 0.00 2203.07
NTPC (ER)
Farakka 0.00 - - - - - - - - - - - - 0.00 0.00
Kahalgaon 0.00 - - - - - - - - - - - - 0.00 0.00
Talcher - Stage 1 0.00 - - - - - - - - - - - - 0.00 0.00
Talcher Stage 2 1.49 96.81 100.03 96.81 81.35 88.99 96.81 90.79 76.51 100.14 100.14 90.45 100.14 1118.97 1118.97
Others 0.00 - - - - - - - - - - - - 0.00 0.00
Total NTPC(ER) 96.81 100.03 96.81 81.35 88.99 96.81 90.79 76.51 100.14 100.14 90.45 100.14 1118.97 0.00 1118.97
Total NTPC 283.58 290.99 266.76 247.19 254.46 275.16 283.38 265.66 294.78 295.85 267.54 296.69 3322.03 0.00 3322.03
NLC TS-II
Stage-I 3.47 20.82 21.61 20.49 13.90 16.93 14.17 19.18 18.52 13.57 21.55 19.37 21.42 221.54 221.54
Stage-II 3.75 38.16 39.50 28.31 37.01 29.29 36.21 27.16 25.92 33.55 39.41 35.41 39.23 409.15 409.15
Total NLC 58.99 61.11 48.81 50.91 46.22 50.38 46.33 44.43 47.12 60.95 54.79 60.64 630.69 0.00 630.69
NPC
NPC-MAPS 2.11 8.02 8.31 7.74 8.10 8.35 7.84 8.35 7.77 8.28 8.35 7.63 8.38 97.11 97.11
NPC-Kaiga unit I 3.13 27.10 27.10 27.10 27.10 27.10 27.10 27.10 27.10 27.10 27.10 27.10 27.10 325.21 325.21
NPC-Kaiga unit II 3.13 27.10 27.10 27.10 27.10 27.10 27.10 27.10 27.10 27.10 27.10 27.10 27.10 325.21 325.21
Total NPC 62.23 62.51 61.94 62.30 62.55 62.05 62.55 61.97 62.48 62.55 61.83 62.59 747.54 0.00 747.54
NTPC - Simhadri
NTPC Simhadri Stage I 2.71 228.81 236.30 228.81 236.30 236.30 228.81 211.78 152.88 236.30 236.30 213.48 236.30 2682.34 2682.34
NTPC Simhadri Stage II 2.73 104.94 108.37 104.94 108.37 64.02 104.94 108.37 104.94 108.37 108.37 97.91 108.37 1231.92 1231.92
Total NTPC- Simhadri 333.74 344.67 333.74 344.67 300.32 333.74 320.15 257.81 344.67 344.67 311.39 344.67 3914.26 0.00 3914.26
CGS - New
Vallur Thermal Power Plant 2.08 46.65 47.99 45.82 42.35 33.74 46.03 41.63 45.20 46.70 46.92 42.38 46.92 532.33 532.33
Tuticorin 2.32 64.36 66.64 64.36 66.40 66.40 64.24 65.08 47.07 49.23 66.64 60.04 66.64 747.11 747.11
Kudigi 1.89 30.98 32.01 30.98 32.01 64.04 61.97 64.04 61.97 64.04 96.00 86.75 99.42 724.22 724.22
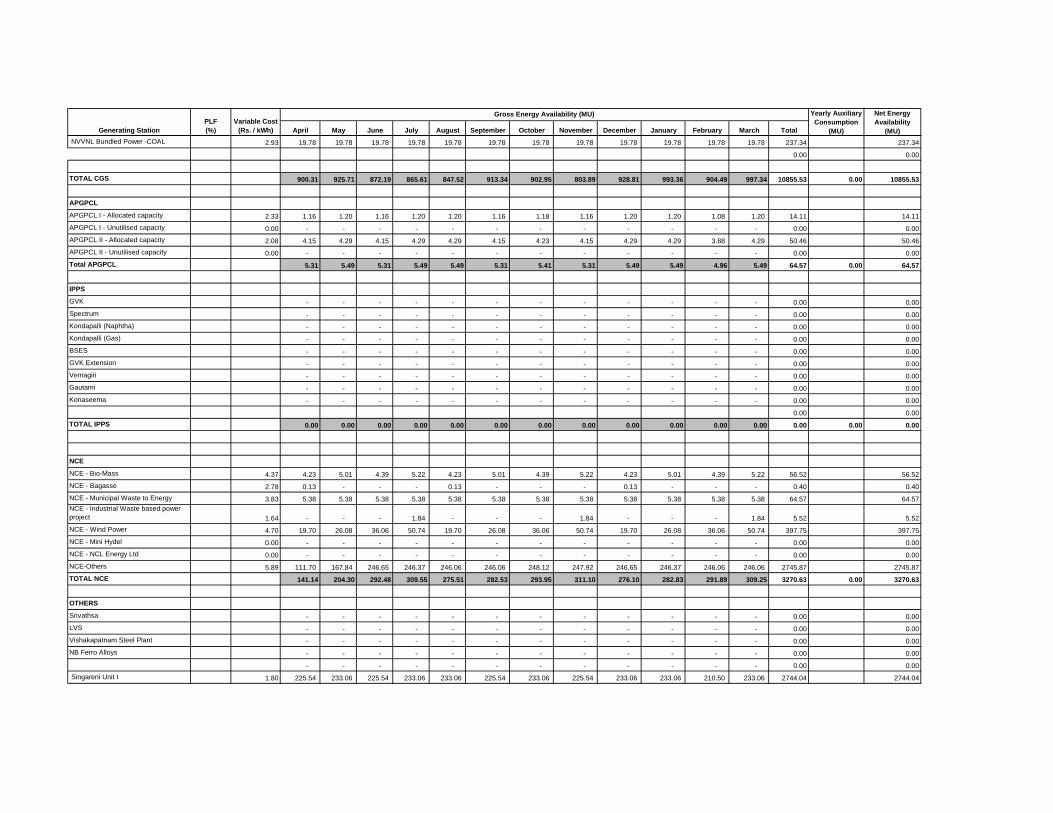
April May June July August September October November December January February March Total
Net Energy
Availability
(MU)Generating Station
PLF
(%)
Variable Cost
(Rs. / kWh)
Gross Energy Availability (MU) Yearly Auxiliary
Consumption
(MU)
NVVNL Bundled Power -COAL 2.93 19.78 19.78 19.78 19.78 19.78 19.78 19.78 19.78 19.78 19.78 19.78 19.78 237.34 237.34
0.00 0.00
TOTAL CGS 900.31 925.71 872.19 865.61 847.52 913.34 902.95 803.89 928.81 993.36 904.49 997.34 10855.53 0.00 10855.53
APGPCL
APGPCL I - Allocated capacity 2.33 1.16 1.20 1.16 1.20 1.20 1.16 1.18 1.16 1.20 1.20 1.08 1.20 14.11 14.11
APGPCL I - Unutilised capacity 0.00 - - - - - - - - - - - - 0.00 0.00
APGPCL II - Allocated capacity 2.08 4.15 4.29 4.15 4.29 4.29 4.15 4.23 4.15 4.29 4.29 3.88 4.29 50.46 50.46
APGPCL II - Unutilised capacity 0.00 - - - - - - - - - - - - 0.00 0.00
Total APGPCL 5.31 5.49 5.31 5.49 5.49 5.31 5.41 5.31 5.49 5.49 4.96 5.49 64.57 0.00 64.57
IPPS
GVK - - - - - - - - - - - - 0.00 0.00
Spectrum - - - - - - - - - - - - 0.00 0.00
Kondapalli (Naphtha) - - - - - - - - - - - - 0.00 0.00
Kondapalli (Gas) - - - - - - - - - - - - 0.00 0.00
BSES - - - - - - - - - - - - 0.00 0.00
GVK Extension - - - - - - - - - - - - 0.00 0.00
Vemagiri - - - - - - - - - - - - 0.00 0.00
Gautami - - - - - - - - - - - - 0.00 0.00
Konaseema - - - - - - - - - - - - 0.00 0.00
0.00 0.00
TOTAL IPPS 0.00 0.00 0.00 0.00 0.00 0.00 0.00 0.00 0.00 0.00 0.00 0.00 0.00 0.00 0.00
NCE
NCE - Bio-Mass 4.37 4.23 5.01 4.39 5.22 4.23 5.01 4.39 5.22 4.23 5.01 4.39 5.22 56.52 56.52
NCE - Bagasse 2.78 0.13 - - - 0.13 - - - 0.13 - - - 0.40 0.40
NCE - Municipal Waste to Energy 3.83 5.38 5.38 5.38 5.38 5.38 5.38 5.38 5.38 5.38 5.38 5.38 5.38 64.57 64.57
NCE - Industrial Waste based power
project 1.64 - - - 1.84 - - - 1.84 - - - 1.84 5.52 5.52
NCE - Wind Power 4.70 19.70 26.08 36.06 50.74 19.70 26.08 36.06 50.74 19.70 26.08 36.06 50.74 397.75 397.75
NCE - Mini Hydel 0.00 - - - - - - - - - - - - 0.00 0.00
NCE - NCL Energy Ltd 0.00 - - - - - - - - - - - - 0.00 0.00
NCE-Others 5.89 111.70 167.84 246.65 246.37 246.06 246.06 248.12 247.92 246.65 246.37 246.06 246.06 2745.87 2745.87
TOTAL NCE 141.14 204.30 292.48 309.55 275.51 282.53 293.95 311.10 276.10 282.83 291.89 309.25 3270.63 0.00 3270.63
OTHERS
Srivathsa - - - - - - - - - - - - 0.00 0.00
LVS - - - - - - - - - - - - 0.00 0.00
Vishakapatnam Steel Plant - - - - - - - - - - - - 0.00 0.00
NB Ferro Alloys - - - - - - - - - - - - 0.00 0.00
- - - - - - - - - - - - 0.00 0.00
Singareni Unit I 1.80 225.54 233.06 225.54 233.06 233.06 225.54 233.06 225.54 233.06 233.06 210.50 233.06 2744.04 2744.04

April May June July August September October November December January February March Total
Net Energy
Availability
(MU)Generating Station
PLF
(%)
Variable Cost
(Rs. / kWh)
Gross Energy Availability (MU) Yearly Auxiliary
Consumption
(MU)
Thermal Power Unit 1 1.89 108.78 112.40 108.78 112.40 112.40 108.78 112.40 108.78 112.40 112.40 101.53 112.40 1323.48 1323.48
CSPGCL 1.20 374.87 387.36 374.87 387.36 387.36 374.87 387.36 374.87 387.36 387.36 362.37 387.36 4573.41 4573.41
Thermal Power Unit 2 1.82 230.11 237.78 230.11 237.78 237.78 230.11 237.78 230.11 237.78 237.78 214.77 237.78 2799.71 2799.71
Manuguru Thermal Power Plant 0.00 - - - - - - - - - - - - 0.00 0.00
Singareni Unit II 1.80 225.54 233.06 225.54 233.06 233.06 225.54 233.06 225.54 233.06 233.06 210.50 233.06 2744.04 2744.04
0.00 0.00
TOTAL OTHERS 1164.84 1203.67 1164.84 1203.67 1203.67 1164.84 1203.67 1164.84 1203.67 1203.67 1099.68 1203.67 14184.68 0.00 14184.68
MARKET
PTC 0.00 0.00
RCL and Short-Term Sources(IG
Wells,Kesoram) 0.00 0.00
CPDCL 0.00 0.00
EPDCL 0.00 0.00
NPDCL 0.00 0.00
SPDCL 0.00 0.00
UI 0.00 0.00
Other Short Term Sources 6.20 1,038.56 934.70 - - - - - - - - - - 1973.27 1973.27
0.00 0.00
TOTAL MARKET 1038.56 934.70 0.00 0.00 0.00 0.00 0.00 0.00 0.00 0.00 0.00 0.00 1973.27 0.00 1973.27
TOTAL (From All Sources) 4591.30 4642.62 3558.75 3637.11 3652.69 3789.02 3808.58 3581.98 3807.70 3892.99 3586.41 3933.68 46482.84 0.00 46482.84
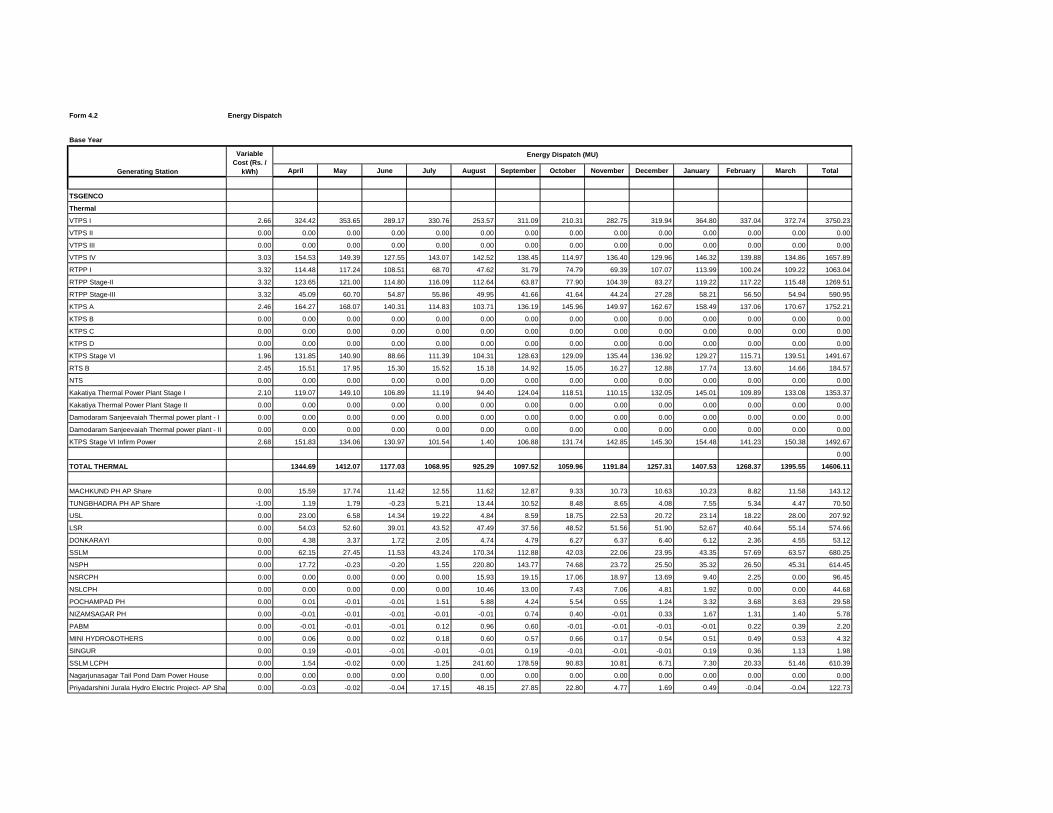
Form 4.2 Energy Dispatch
Base Year
April May June July August September October November December January February March Total
TSGENCO
Thermal
VTPS I 2.66 324.42 353.65 289.17 330.76 253.57 311.09 210.31 282.75 319.94 364.80 337.04 372.74 3750.23
VTPS II 0.00 0.00 0.00 0.00 0.00 0.00 0.00 0.00 0.00 0.00 0.00 0.00 0.00 0.00
VTPS III 0.00 0.00 0.00 0.00 0.00 0.00 0.00 0.00 0.00 0.00 0.00 0.00 0.00 0.00
VTPS IV 3.03 154.53 149.39 127.55 143.07 142.52 138.45 114.97 136.40 129.96 146.32 139.88 134.86 1657.89
RTPP I 3.32 114.48 117.24 108.51 68.70 47.62 31.79 74.79 69.39 107.07 113.99 100.24 109.22 1063.04
RTPP Stage-II 3.32 123.65 121.00 114.80 116.09 112.64 63.87 77.90 104.39 83.27 119.22 117.22 115.48 1269.51
RTPP Stage-III 3.32 45.09 60.70 54.87 55.86 49.95 41.66 41.64 44.24 27.28 58.21 56.50 54.94 590.95
KTPS A 2.46 164.27 168.07 140.31 114.83 103.71 136.19 145.96 149.97 162.67 158.49 137.06 170.67 1752.21
KTPS B 0.00 0.00 0.00 0.00 0.00 0.00 0.00 0.00 0.00 0.00 0.00 0.00 0.00 0.00
KTPS C 0.00 0.00 0.00 0.00 0.00 0.00 0.00 0.00 0.00 0.00 0.00 0.00 0.00 0.00
KTPS D 0.00 0.00 0.00 0.00 0.00 0.00 0.00 0.00 0.00 0.00 0.00 0.00 0.00 0.00
KTPS Stage VI 1.96 131.85 140.90 88.66 111.39 104.31 128.63 129.09 135.44 136.92 129.27 115.71 139.51 1491.67
RTS B 2.45 15.51 17.95 15.30 15.52 15.18 14.92 15.05 16.27 12.88 17.74 13.60 14.66 184.57
NTS 0.00 0.00 0.00 0.00 0.00 0.00 0.00 0.00 0.00 0.00 0.00 0.00 0.00 0.00
Kakatiya Thermal Power Plant Stage I 2.10 119.07 149.10 106.89 11.19 94.40 124.04 118.51 110.15 132.05 145.01 109.89 133.08 1353.37
Kakatiya Thermal Power Plant Stage II 0.00 0.00 0.00 0.00 0.00 0.00 0.00 0.00 0.00 0.00 0.00 0.00 0.00 0.00
Damodaram Sanjeevaiah Thermal power plant - I 0.00 0.00 0.00 0.00 0.00 0.00 0.00 0.00 0.00 0.00 0.00 0.00 0.00 0.00
Damodaram Sanjeevaiah Thermal power plant - II 0.00 0.00 0.00 0.00 0.00 0.00 0.00 0.00 0.00 0.00 0.00 0.00 0.00 0.00
KTPS Stage VI Infirm Power 2.68 151.83 134.06 130.97 101.54 1.40 106.88 131.74 142.85 145.30 154.48 141.23 150.38 1492.67
0.00
TOTAL THERMAL 1344.69 1412.07 1177.03 1068.95 925.29 1097.52 1059.96 1191.84 1257.31 1407.53 1268.37 1395.55 14606.11
MACHKUND PH AP Share 0.00 15.59 17.74 11.42 12.55 11.62 12.87 9.33 10.73 10.63 10.23 8.82 11.58 143.12
TUNGBHADRA PH AP Share -1.00 1.19 1.79 -0.23 5.21 13.44 10.52 8.48 8.65 4.08 7.55 5.34 4.47 70.50
USL 0.00 23.00 6.58 14.34 19.22 4.84 8.59 18.75 22.53 20.72 23.14 18.22 28.00 207.92
LSR 0.00 54.03 52.60 39.01 43.52 47.49 37.56 48.52 51.56 51.90 52.67 40.64 55.14 574.66
DONKARAYI 0.00 4.38 3.37 1.72 2.05 4.74 4.79 6.27 6.37 6.40 6.12 2.36 4.55 53.12
SSLM 0.00 62.15 27.45 11.53 43.24 170.34 112.88 42.03 22.06 23.95 43.35 57.69 63.57 680.25
NSPH 0.00 17.72 -0.23 -0.20 1.55 220.80 143.77 74.68 23.72 25.50 35.32 26.50 45.31 614.45
NSRCPH 0.00 0.00 0.00 0.00 0.00 15.93 19.15 17.06 18.97 13.69 9.40 2.25 0.00 96.45
NSLCPH 0.00 0.00 0.00 0.00 0.00 10.46 13.00 7.43 7.06 4.81 1.92 0.00 0.00 44.68
POCHAMPAD PH 0.00 0.01 -0.01 -0.01 1.51 5.88 4.24 5.54 0.55 1.24 3.32 3.68 3.63 29.58
NIZAMSAGAR PH 0.00 -0.01 -0.01 -0.01 -0.01 -0.01 0.74 0.40 -0.01 0.33 1.67 1.31 1.40 5.78
PABM 0.00 -0.01 -0.01 -0.01 0.12 0.96 0.60 -0.01 -0.01 -0.01 -0.01 0.22 0.39 2.20
MINI HYDRO&OTHERS 0.00 0.06 0.00 0.02 0.18 0.60 0.57 0.66 0.17 0.54 0.51 0.49 0.53 4.32
SINGUR 0.00 0.19 -0.01 -0.01 -0.01 -0.01 0.19 -0.01 -0.01 -0.01 0.19 0.36 1.13 1.98
SSLM LCPH 0.00 1.54 -0.02 0.00 1.25 241.60 178.59 90.83 10.81 6.71 7.30 20.33 51.46 610.39
Nagarjunasagar Tail Pond Dam Power House 0.00 0.00 0.00 0.00 0.00 0.00 0.00 0.00 0.00 0.00 0.00 0.00 0.00 0.00
Priyadarshini Jurala Hydro Electric Project- AP Share 0.00 -0.03 -0.02 -0.04 17.15 48.15 27.85 22.80 4.77 1.69 0.49 -0.04 -0.04 122.73
Generating Station
Variable
Cost (Rs. /
kWh)
Energy Dispatch (MU)

Lower Jurala Hydro Electric Project 0.00 0.00 0.00 0.00 0.00 0.00 0.00 0.00 0.00 0.00 0.00 0.00 0.00 0.00
POCHAMPAD Stig-II 0.00 0.00 0.00 0.00 0.41 0.91 0.72 1.95 0.06 0.08 1.55 1.54 1.61 8.84
PULICHINTAL(New Project) 0.00 0.00 0.00 0.00 0.00 0.00 0.00 0.00 0.00 0.00 0.00 0.00 0.00 0.00
Ramagiri Wind Mills 0.00 0.00 0.00 0.00 0.00 0.00 0.00 0.00 0.00 0.00 0.00 0.00 0.00 0.00
Jurala Hydro Electric Project - Infirm Power 0.00 0.00 0.00 0.00 0.00 0.00 0.00 0.00 0.00 0.00 0.00 0.00 0.00 0.00
0.00
TOTAL HYDRO 179.81 109.22 77.54 147.93 797.76 576.63 354.72 187.99 172.23 204.71 189.71 272.72 3270.96
TOTAL TSGENCO 1524.50 1521.28 1254.57 1216.89 1723.05 1674.15 1414.68 1379.83 1429.55 1612.24 1458.08 1668.26 17877.07
Central Generating Stations
NTPC
NTPC (SR)
NTPC (SR) 2.11 207.99 215.90 154.17 168.52 139.99 149.41 146.86 188.97 210.28 194.13 199.91 212.10 2188.24
NTPC (SR) Stage III 2.68 53.59 53.32 46.45 48.59 46.79 47.66 46.27 52.64 39.87 67.02 56.69 51.48 610.35
Total NTPC(SR) 261.58 269.22 200.62 217.11 186.79 197.06 193.13 241.61 250.15 261.15 256.60 263.58 2798.59
NTPC (ER)
Farakka 5.42 9.42 0.00 0.00 0.00 0.00 0.00 0.00 0.00 0.00 0.00 0.00 0.00 9.42
Kahalgaon 5.94 4.19 0.00 0.00 0.00 0.00 0.00 0.00 0.00 0.00 0.00 0.00 0.00 4.19
Talcher - Stage 1 1.64 6.07 0.00 0.00 0.00 0.00 0.00 0.00 0.00 0.00 0.00 0.00 0.00 6.07
Talcher Stage 2 1.52 82.19 76.42 93.11 100.09 99.67 101.45 91.45 118.73 121.19 126.83 113.20 130.74 1255.09
Others 0.00 0.00 0.00 0.00 0.00 0.00 0.00 0.00 0.00 0.00 0.00 0.00 0.00 0.00
Total NTPC(ER) 101.88 76.42 93.11 100.09 99.67 101.45 91.45 118.73 121.19 126.83 113.20 130.74 1274.78
Total NTPC 363.46 345.64 293.74 317.20 286.46 298.51 284.58 360.35 371.35 387.98 369.80 394.32 4073.37
NLC TS-II
Stage-I 2.15 33.80 34.69 30.95 36.97 32.20 29.05 19.83 26.62 23.70 40.41 32.16 37.09 377.48
Stage-II 2.05 59.49 58.34 58.44 56.74 37.32 39.20 48.71 46.85 61.28 72.81 56.27 64.68 660.13
Total NLC 93.29 93.03 89.40 93.71 69.52 68.26 68.53 73.48 84.98 113.22 88.44 101.76 1037.61
NPC
NPC-MAPS 2.07 4.47 4.44 4.47 4.72 4.72 4.56 9.28 6.34 9.81 9.84 8.06 9.87 80.58
NPC-Kaiga unit I 3.02 35.06 37.83 37.80 41.13 42.16 40.38 39.40 31.82 25.61 33.21 31.31 34.80 430.51
NPC-Kaiga unit II 3.02 32.53 41.21 39.59 42.79 44.24 31.18 31.45 22.50 45.35 42.31 38.13 25.56 436.84
Total NPC 72.06 83.48 81.87 88.64 91.12 76.12 80.12 60.66 80.76 85.37 77.50 70.24 947.93
NTPC - Simhadri
NTPC Simhadri Stage I 2.38 294.57 272.37 291.91 268.26 307.50 284.53 256.58 171.57 268.89 288.55 285.68 315.15 3305.53
NTPC Simhadri Stage II 2.40 128.56 117.38 129.79 104.79 67.51 95.72 88.94 128.65 144.43 169.27 148.55 146.77 1470.36
Total NTPC- Simhadri 423.13 389.75 421.69 373.05 375.01 380.25 345.51 300.22 413.32 457.81 434.23 461.91 4775.89
CGS - New
Vallur Thermal Power Plant 2.14 14.04 10.27 7.84 16.88 4.68 17.35 21.84 21.81 20.63 47.94 31.36 26.88 241.51
TOTAL CGS 965.98 922.17 894.54 889.48 826.79 840.49 800.59 816.51 971.03 1092.32 1001.33 1055.10 11076.32
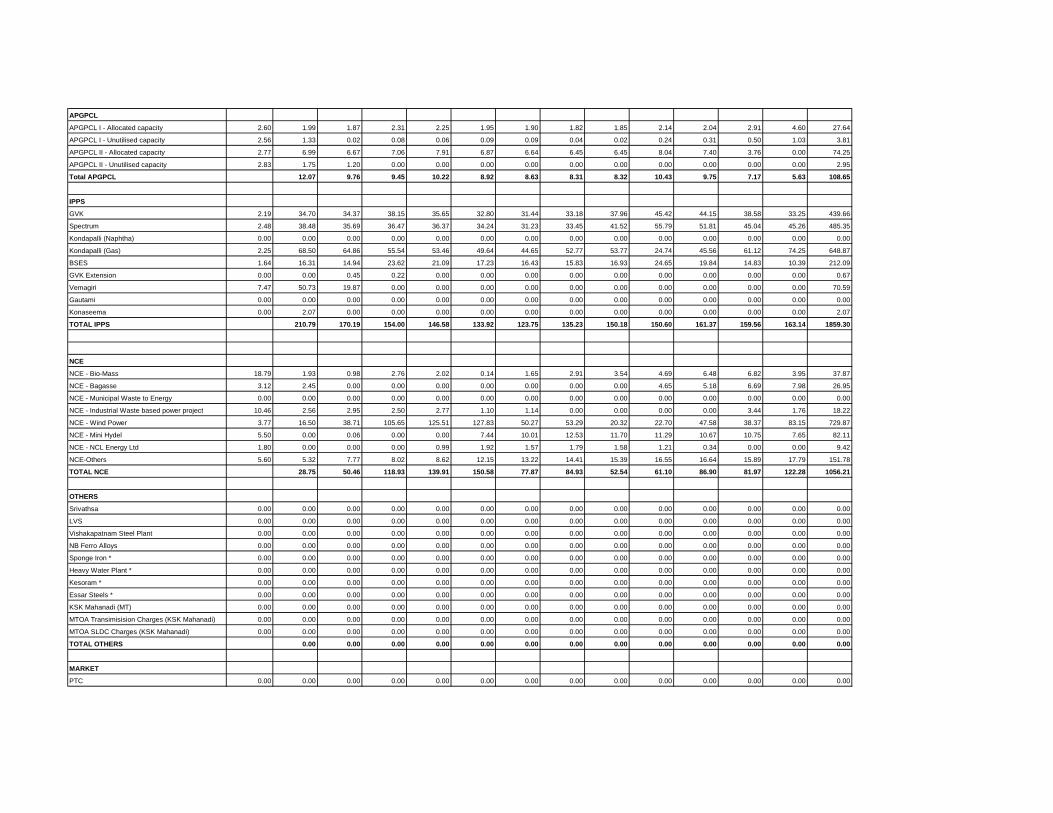
APGPCL
APGPCL I - Allocated capacity 2.60 1.99 1.87 2.31 2.25 1.95 1.90 1.82 1.85 2.14 2.04 2.91 4.60 27.64
APGPCL I - Unutilised capacity 2.56 1.33 0.02 0.08 0.06 0.09 0.09 0.04 0.02 0.24 0.31 0.50 1.03 3.81
APGPCL II - Allocated capacity 2.77 6.99 6.67 7.06 7.91 6.87 6.64 6.45 6.45 8.04 7.40 3.76 0.00 74.25
APGPCL II - Unutilised capacity 2.83 1.75 1.20 0.00 0.00 0.00 0.00 0.00 0.00 0.00 0.00 0.00 0.00 2.95
Total APGPCL 12.07 9.76 9.45 10.22 8.92 8.63 8.31 8.32 10.43 9.75 7.17 5.63 108.65
IPPS
GVK 2.19 34.70 34.37 38.15 35.65 32.80 31.44 33.18 37.96 45.42 44.15 38.58 33.25 439.66
Spectrum 2.48 38.48 35.69 36.47 36.37 34.24 31.23 33.45 41.52 55.79 51.81 45.04 45.26 485.35
Kondapalli (Naphtha) 0.00 0.00 0.00 0.00 0.00 0.00 0.00 0.00 0.00 0.00 0.00 0.00 0.00 0.00
Kondapalli (Gas) 2.25 68.50 64.86 55.54 53.46 49.64 44.65 52.77 53.77 24.74 45.56 61.12 74.25 648.87
BSES 1.64 16.31 14.94 23.62 21.09 17.23 16.43 15.83 16.93 24.65 19.84 14.83 10.39 212.09
GVK Extension 0.00 0.00 0.45 0.22 0.00 0.00 0.00 0.00 0.00 0.00 0.00 0.00 0.00 0.67
Vemagiri 7.47 50.73 19.87 0.00 0.00 0.00 0.00 0.00 0.00 0.00 0.00 0.00 0.00 70.59
Gautami 0.00 0.00 0.00 0.00 0.00 0.00 0.00 0.00 0.00 0.00 0.00 0.00 0.00 0.00
Konaseema 0.00 2.07 0.00 0.00 0.00 0.00 0.00 0.00 0.00 0.00 0.00 0.00 0.00 2.07
TOTAL IPPS 210.79 170.19 154.00 146.58 133.92 123.75 135.23 150.18 150.60 161.37 159.56 163.14 1859.30
NCE
NCE - Bio-Mass 18.79 1.93 0.98 2.76 2.02 0.14 1.65 2.91 3.54 4.69 6.48 6.82 3.95 37.87
NCE - Bagasse 3.12 2.45 0.00 0.00 0.00 0.00 0.00 0.00 0.00 4.65 5.18 6.69 7.98 26.95
NCE - Municipal Waste to Energy 0.00 0.00 0.00 0.00 0.00 0.00 0.00 0.00 0.00 0.00 0.00 0.00 0.00 0.00
NCE - Industrial Waste based power project 10.46 2.56 2.95 2.50 2.77 1.10 1.14 0.00 0.00 0.00 0.00 3.44 1.76 18.22
NCE - Wind Power 3.77 16.50 38.71 105.65 125.51 127.83 50.27 53.29 20.32 22.70 47.58 38.37 83.15 729.87
NCE - Mini Hydel 5.50 0.00 0.06 0.00 0.00 7.44 10.01 12.53 11.70 11.29 10.67 10.75 7.65 82.11
NCE - NCL Energy Ltd 1.80 0.00 0.00 0.00 0.99 1.92 1.57 1.79 1.58 1.21 0.34 0.00 0.00 9.42
NCE-Others 5.60 5.32 7.77 8.02 8.62 12.15 13.22 14.41 15.39 16.55 16.64 15.89 17.79 151.78
TOTAL NCE 28.75 50.46 118.93 139.91 150.58 77.87 84.93 52.54 61.10 86.90 81.97 122.28 1056.21
OTHERS
Srivathsa 0.00 0.00 0.00 0.00 0.00 0.00 0.00 0.00 0.00 0.00 0.00 0.00 0.00 0.00
LVS 0.00 0.00 0.00 0.00 0.00 0.00 0.00 0.00 0.00 0.00 0.00 0.00 0.00 0.00
Vishakapatnam Steel Plant 0.00 0.00 0.00 0.00 0.00 0.00 0.00 0.00 0.00 0.00 0.00 0.00 0.00 0.00
NB Ferro Alloys 0.00 0.00 0.00 0.00 0.00 0.00 0.00 0.00 0.00 0.00 0.00 0.00 0.00 0.00
Sponge Iron * 0.00 0.00 0.00 0.00 0.00 0.00 0.00 0.00 0.00 0.00 0.00 0.00 0.00 0.00
Heavy Water Plant * 0.00 0.00 0.00 0.00 0.00 0.00 0.00 0.00 0.00 0.00 0.00 0.00 0.00 0.00
Kesoram * 0.00 0.00 0.00 0.00 0.00 0.00 0.00 0.00 0.00 0.00 0.00 0.00 0.00 0.00
Essar Steels * 0.00 0.00 0.00 0.00 0.00 0.00 0.00 0.00 0.00 0.00 0.00 0.00 0.00 0.00
KSK Mahanadi (MT) 0.00 0.00 0.00 0.00 0.00 0.00 0.00 0.00 0.00 0.00 0.00 0.00 0.00 0.00
MTOA Transimisision Charges (KSK Mahanadi) 0.00 0.00 0.00 0.00 0.00 0.00 0.00 0.00 0.00 0.00 0.00 0.00 0.00 0.00
MTOA SLDC Charges (KSK Mahanadi) 0.00 0.00 0.00 0.00 0.00 0.00 0.00 0.00 0.00 0.00 0.00 0.00 0.00 0.00
TOTAL OTHERS 0.00 0.00 0.00 0.00 0.00 0.00 0.00 0.00 0.00 0.00 0.00 0.00 0.00
MARKET
PTC 0.00 0.00 0.00 0.00 0.00 0.00 0.00 0.00 0.00 0.00 0.00 0.00 0.00 0.00
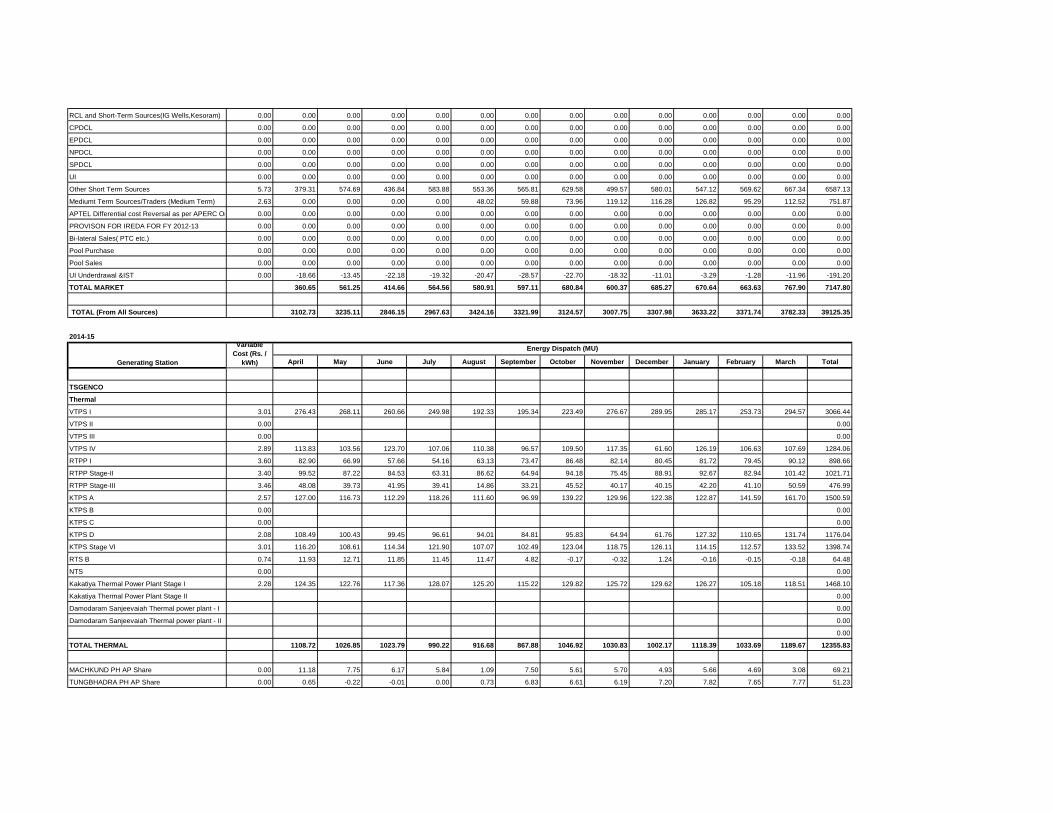
RCL and Short-Term Sources(IG Wells,Kesoram) 0.00 0.00 0.00 0.00 0.00 0.00 0.00 0.00 0.00 0.00 0.00 0.00 0.00 0.00
CPDCL 0.00 0.00 0.00 0.00 0.00 0.00 0.00 0.00 0.00 0.00 0.00 0.00 0.00 0.00
EPDCL 0.00 0.00 0.00 0.00 0.00 0.00 0.00 0.00 0.00 0.00 0.00 0.00 0.00 0.00
NPDCL 0.00 0.00 0.00 0.00 0.00 0.00 0.00 0.00 0.00 0.00 0.00 0.00 0.00 0.00
SPDCL 0.00 0.00 0.00 0.00 0.00 0.00 0.00 0.00 0.00 0.00 0.00 0.00 0.00 0.00
UI 0.00 0.00 0.00 0.00 0.00 0.00 0.00 0.00 0.00 0.00 0.00 0.00 0.00 0.00
Other Short Term Sources 5.73 379.31 574.69 436.84 583.88 553.36 565.81 629.58 499.57 580.01 547.12 569.62 667.34 6587.13
Mediumt Term Sources/Traders (Medium Term) 2.63 0.00 0.00 0.00 0.00 48.02 59.88 73.96 119.12 116.28 126.82 95.29 112.52 751.87
APTEL Differential cost Reversal as per APERC Order 0.00 0.00 0.00 0.00 0.00 0.00 0.00 0.00 0.00 0.00 0.00 0.00 0.00 0.00
PROVISON FOR IREDA FOR FY 2012-13 0.00 0.00 0.00 0.00 0.00 0.00 0.00 0.00 0.00 0.00 0.00 0.00 0.00 0.00
Bi-lateral Sales( PTC etc.) 0.00 0.00 0.00 0.00 0.00 0.00 0.00 0.00 0.00 0.00 0.00 0.00 0.00 0.00
Pool Purchase 0.00 0.00 0.00 0.00 0.00 0.00 0.00 0.00 0.00 0.00 0.00 0.00 0.00 0.00
Pool Sales 0.00 0.00 0.00 0.00 0.00 0.00 0.00 0.00 0.00 0.00 0.00 0.00 0.00 0.00
UI Underdrawal &IST 0.00 -18.66 -13.45 -22.18 -19.32 -20.47 -28.57 -22.70 -18.32 -11.01 -3.29 -1.28 -11.96 -191.20
TOTAL MARKET 360.65 561.25 414.66 564.56 580.91 597.11 680.84 600.37 685.27 670.64 663.63 767.90 7147.80
TOTAL (From All Sources) 3102.73 3235.11 2846.15 2967.63 3424.16 3321.99 3124.57 3007.75 3307.98 3633.22 3371.74 3782.33 39125.35
2014-15
April May June July August September October November December January February March Total
TSGENCO
Thermal
VTPS I 3.01 276.43 268.11 260.66 249.98 192.33 195.34 223.49 276.67 289.95 285.17 253.73 294.57 3066.44
VTPS II 0.00 0.00
VTPS III 0.00 0.00
VTPS IV 2.89 113.83 103.56 123.70 107.06 110.38 96.57 109.50 117.35 61.60 126.19 106.63 107.69 1284.06
RTPP I 3.60 82.90 66.99 57.66 54.16 63.13 73.47 86.48 82.14 80.45 81.72 79.45 90.12 898.66
RTPP Stage-II 3.40 99.52 87.22 84.53 63.31 86.62 64.94 94.18 75.45 88.91 92.67 82.94 101.42 1021.71
RTPP Stage-III 3.46 48.08 39.73 41.95 39.41 14.86 33.21 45.52 40.17 40.15 42.20 41.10 50.59 476.99
KTPS A 2.57 127.00 116.73 112.29 118.26 111.60 96.99 139.22 129.96 122.38 122.87 141.59 161.70 1500.59
KTPS B 0.00 0.00
KTPS C 0.00 0.00
KTPS D 2.08 108.49 100.43 99.45 96.61 94.01 84.81 95.83 64.94 61.76 127.32 110.65 131.74 1176.04
KTPS Stage VI 3.01 116.20 108.61 114.34 121.90 107.07 102.49 123.04 118.75 126.11 114.15 112.57 133.52 1398.74
RTS B 0.74 11.93 12.71 11.85 11.45 11.47 4.82 -0.17 -0.32 1.24 -0.16 -0.15 -0.18 64.48
NTS 0.00 0.00
Kakatiya Thermal Power Plant Stage I 2.28 124.35 122.76 117.36 128.07 125.20 115.22 129.82 125.72 129.62 126.27 105.18 118.51 1468.10
Kakatiya Thermal Power Plant Stage II 0.00
Damodaram Sanjeevaiah Thermal power plant - I 0.00
Damodaram Sanjeevaiah Thermal power plant - II 0.00
0.00
TOTAL THERMAL 1108.72 1026.85 1023.79 990.22 916.68 867.88 1046.92 1030.83 1002.17 1118.39 1033.69 1189.67 12355.83
MACHKUND PH AP Share 0.00 11.18 7.75 6.17 5.84 1.09 7.50 5.61 5.70 4.93 5.66 4.69 3.08 69.21
TUNGBHADRA PH AP Share 0.00 0.65 -0.22 -0.01 0.00 0.73 6.83 6.61 6.19 7.20 7.82 7.65 7.77 51.23
Generating Station
Variable
Cost (Rs. /
kWh)
Energy Dispatch (MU)
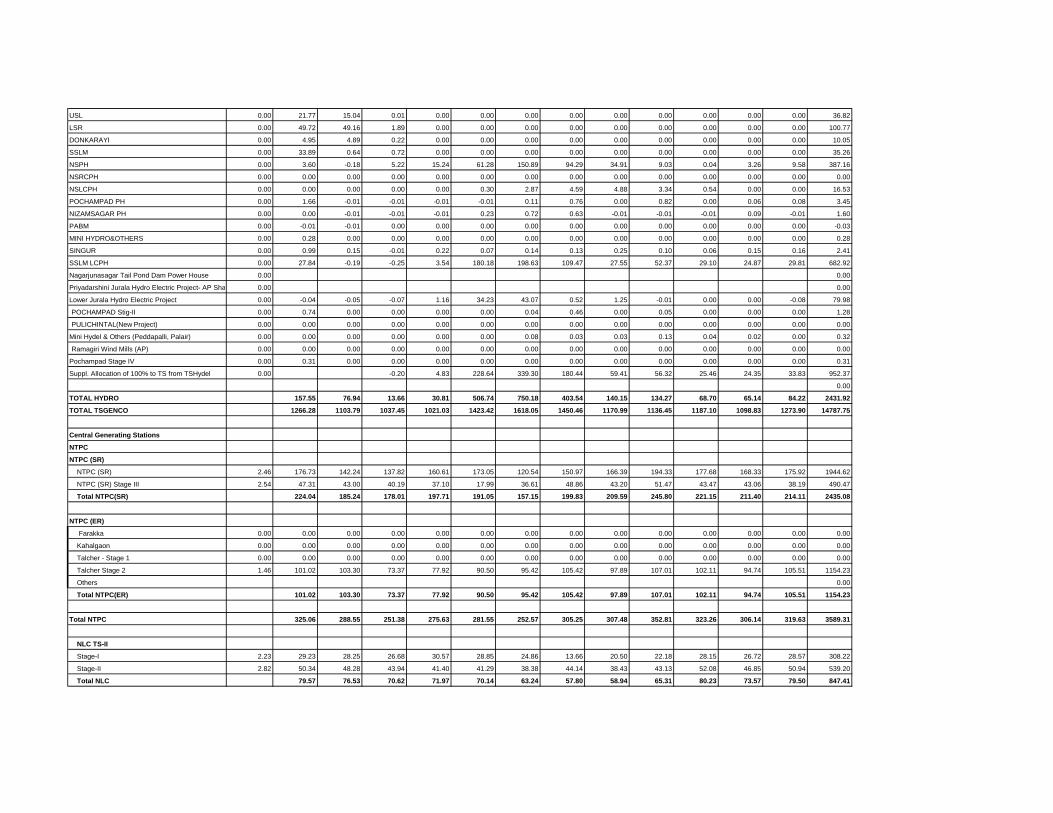
USL 0.00 21.77 15.04 0.01 0.00 0.00 0.00 0.00 0.00 0.00 0.00 0.00 0.00 36.82
LSR 0.00 49.72 49.16 1.89 0.00 0.00 0.00 0.00 0.00 0.00 0.00 0.00 0.00 100.77
DONKARAYI 0.00 4.95 4.89 0.22 0.00 0.00 0.00 0.00 0.00 0.00 0.00 0.00 0.00 10.05
SSLM 0.00 33.89 0.64 0.72 0.00 0.00 0.00 0.00 0.00 0.00 0.00 0.00 0.00 35.26
NSPH 0.00 3.60 -0.18 5.22 15.24 61.28 150.89 94.29 34.91 9.03 0.04 3.26 9.58 387.16
NSRCPH 0.00 0.00 0.00 0.00 0.00 0.00 0.00 0.00 0.00 0.00 0.00 0.00 0.00 0.00
NSLCPH 0.00 0.00 0.00 0.00 0.00 0.30 2.87 4.59 4.88 3.34 0.54 0.00 0.00 16.53
POCHAMPAD PH 0.00 1.66 -0.01 -0.01 -0.01 -0.01 0.11 0.76 0.00 0.82 0.00 0.06 0.08 3.45
NIZAMSAGAR PH 0.00 0.00 -0.01 -0.01 -0.01 0.23 0.72 0.63 -0.01 -0.01 -0.01 0.09 -0.01 1.60
PABM 0.00 -0.01 -0.01 0.00 0.00 0.00 0.00 0.00 0.00 0.00 0.00 0.00 0.00 -0.03
MINI HYDRO&OTHERS 0.00 0.28 0.00 0.00 0.00 0.00 0.00 0.00 0.00 0.00 0.00 0.00 0.00 0.28
SINGUR 0.00 0.99 0.15 -0.01 0.22 0.07 0.14 0.13 0.25 0.10 0.06 0.15 0.16 2.41
SSLM LCPH 0.00 27.84 -0.19 -0.25 3.54 180.18 198.63 109.47 27.55 52.37 29.10 24.87 29.81 682.92
Nagarjunasagar Tail Pond Dam Power House 0.00 0.00
Priyadarshini Jurala Hydro Electric Project- AP Share 0.00 0.00
Lower Jurala Hydro Electric Project 0.00 -0.04 -0.05 -0.07 1.16 34.23 43.07 0.52 1.25 -0.01 0.00 0.00 -0.08 79.98
POCHAMPAD Stig-II 0.00 0.74 0.00 0.00 0.00 0.00 0.04 0.46 0.00 0.05 0.00 0.00 0.00 1.28
PULICHINTAL(New Project) 0.00 0.00 0.00 0.00 0.00 0.00 0.00 0.00 0.00 0.00 0.00 0.00 0.00 0.00
Mini Hydel & Others (Peddapalli, Palair) 0.00 0.00 0.00 0.00 0.00 0.00 0.08 0.03 0.03 0.13 0.04 0.02 0.00 0.32
Ramagiri Wind Mills (AP) 0.00 0.00 0.00 0.00 0.00 0.00 0.00 0.00 0.00 0.00 0.00 0.00 0.00 0.00
Pochampad Stage IV 0.00 0.31 0.00 0.00 0.00 0.00 0.00 0.00 0.00 0.00 0.00 0.00 0.00 0.31
Suppl. Allocation of 100% to TS from TSHydel 0.00 -0.20 4.83 228.64 339.30 180.44 59.41 56.32 25.46 24.35 33.83 952.37
0.00
TOTAL HYDRO 157.55 76.94 13.66 30.81 506.74 750.18 403.54 140.15 134.27 68.70 65.14 84.22 2431.92
TOTAL TSGENCO 1266.28 1103.79 1037.45 1021.03 1423.42 1618.05 1450.46 1170.99 1136.45 1187.10 1098.83 1273.90 14787.75
Central Generating Stations
NTPC
NTPC (SR)
NTPC (SR) 2.46 176.73 142.24 137.82 160.61 173.05 120.54 150.97 166.39 194.33 177.68 168.33 175.92 1944.62
NTPC (SR) Stage III 2.54 47.31 43.00 40.19 37.10 17.99 36.61 48.86 43.20 51.47 43.47 43.06 38.19 490.47
Total NTPC(SR) 224.04 185.24 178.01 197.71 191.05 157.15 199.83 209.59 245.80 221.15 211.40 214.11 2435.08
NTPC (ER)
Farakka 0.00 0.00 0.00 0.00 0.00 0.00 0.00 0.00 0.00 0.00 0.00 0.00 0.00 0.00
Kahalgaon 0.00 0.00 0.00 0.00 0.00 0.00 0.00 0.00 0.00 0.00 0.00 0.00 0.00 0.00
Talcher - Stage 1 0.00 0.00 0.00 0.00 0.00 0.00 0.00 0.00 0.00 0.00 0.00 0.00 0.00 0.00
Talcher Stage 2 1.46 101.02 103.30 73.37 77.92 90.50 95.42 105.42 97.89 107.01 102.11 94.74 105.51 1154.23
Others 0.00
Total NTPC(ER) 101.02 103.30 73.37 77.92 90.50 95.42 105.42 97.89 107.01 102.11 94.74 105.51 1154.23
Total NTPC 325.06 288.55 251.38 275.63 281.55 252.57 305.25 307.48 352.81 323.26 306.14 319.63 3589.31
NLC TS-II
Stage-I 2.23 29.23 28.25 26.68 30.57 28.85 24.86 13.66 20.50 22.18 28.15 26.72 28.57 308.22
Stage-II 2.82 50.34 48.28 43.94 41.40 41.29 38.38 44.14 38.43 43.13 52.08 46.85 50.94 539.20
Total NLC 79.57 76.53 70.62 71.97 70.14 63.24 57.80 58.94 65.31 80.23 73.57 79.50 847.41
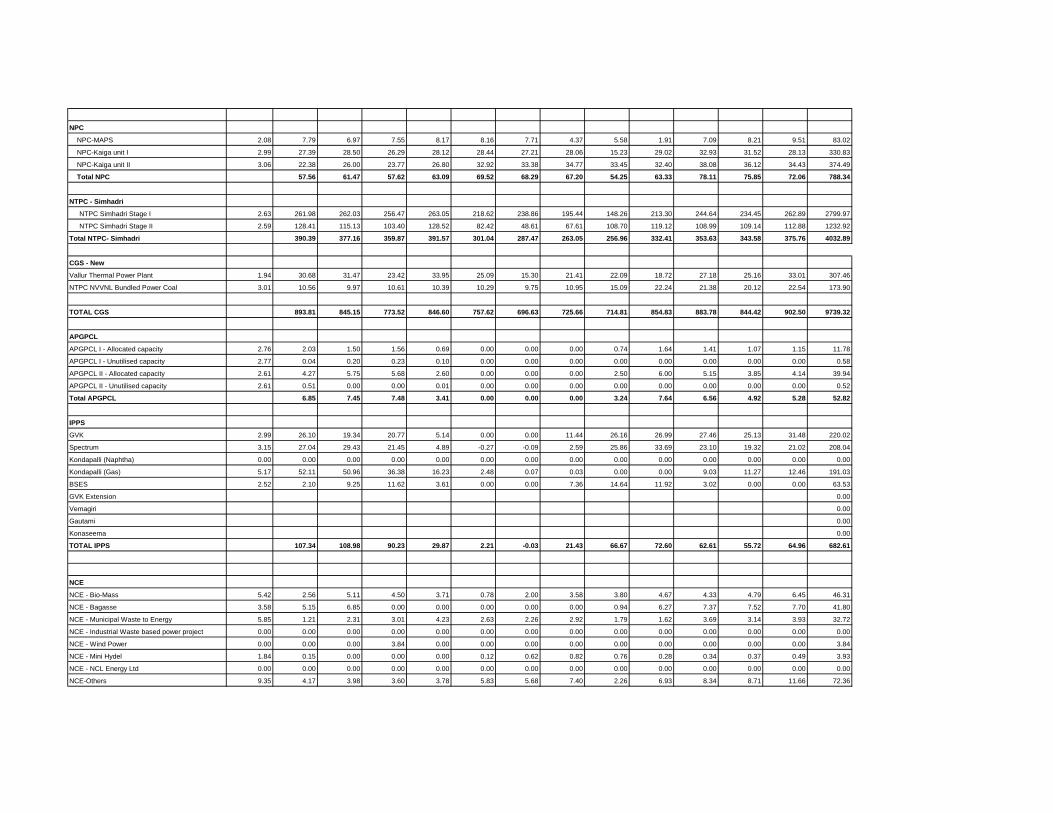
NPC
NPC-MAPS 2.08 7.79 6.97 7.55 8.17 8.16 7.71 4.37 5.58 1.91 7.09 8.21 9.51 83.02
NPC-Kaiga unit I 2.99 27.39 28.50 26.29 28.12 28.44 27.21 28.06 15.23 29.02 32.93 31.52 28.13 330.83
NPC-Kaiga unit II 3.06 22.38 26.00 23.77 26.80 32.92 33.38 34.77 33.45 32.40 38.08 36.12 34.43 374.49
Total NPC 57.56 61.47 57.62 63.09 69.52 68.29 67.20 54.25 63.33 78.11 75.85 72.06 788.34
NTPC - Simhadri
NTPC Simhadri Stage I 2.63 261.98 262.03 256.47 263.05 218.62 238.86 195.44 148.26 213.30 244.64 234.45 262.89 2799.97
NTPC Simhadri Stage II 2.59 128.41 115.13 103.40 128.52 82.42 48.61 67.61 108.70 119.12 108.99 109.14 112.88 1232.92
Total NTPC- Simhadri 390.39 377.16 359.87 391.57 301.04 287.47 263.05 256.96 332.41 353.63 343.58 375.76 4032.89
CGS - New
Vallur Thermal Power Plant 1.94 30.68 31.47 23.42 33.95 25.09 15.30 21.41 22.09 18.72 27.18 25.16 33.01 307.46
NTPC NVVNL Bundled Power Coal 3.01 10.56 9.97 10.61 10.39 10.29 9.75 10.95 15.09 22.24 21.38 20.12 22.54 173.90
TOTAL CGS 893.81 845.15 773.52 846.60 757.62 696.63 725.66 714.81 854.83 883.78 844.42 902.50 9739.32
APGPCL
APGPCL I - Allocated capacity 2.76 2.03 1.50 1.56 0.69 0.00 0.00 0.00 0.74 1.64 1.41 1.07 1.15 11.78
APGPCL I - Unutilised capacity 2.77 0.04 0.20 0.23 0.10 0.00 0.00 0.00 0.00 0.00 0.00 0.00 0.00 0.58
APGPCL II - Allocated capacity 2.61 4.27 5.75 5.68 2.60 0.00 0.00 0.00 2.50 6.00 5.15 3.85 4.14 39.94
APGPCL II - Unutilised capacity 2.61 0.51 0.00 0.00 0.01 0.00 0.00 0.00 0.00 0.00 0.00 0.00 0.00 0.52
Total APGPCL 6.85 7.45 7.48 3.41 0.00 0.00 0.00 3.24 7.64 6.56 4.92 5.28 52.82
IPPS
GVK 2.99 26.10 19.34 20.77 5.14 0.00 0.00 11.44 26.16 26.99 27.46 25.13 31.48 220.02
Spectrum 3.15 27.04 29.43 21.45 4.89 -0.27 -0.09 2.59 25.86 33.69 23.10 19.32 21.02 208.04
Kondapalli (Naphtha) 0.00 0.00 0.00 0.00 0.00 0.00 0.00 0.00 0.00 0.00 0.00 0.00 0.00 0.00
Kondapalli (Gas) 5.17 52.11 50.96 36.38 16.23 2.48 0.07 0.03 0.00 0.00 9.03 11.27 12.46 191.03
BSES 2.52 2.10 9.25 11.62 3.61 0.00 0.00 7.36 14.64 11.92 3.02 0.00 0.00 63.53
GVK Extension 0.00
Vemagiri 0.00
Gautami 0.00
Konaseema 0.00
TOTAL IPPS 107.34 108.98 90.23 29.87 2.21 -0.03 21.43 66.67 72.60 62.61 55.72 64.96 682.61
NCE
NCE - Bio-Mass 5.42 2.56 5.11 4.50 3.71 0.78 2.00 3.58 3.80 4.67 4.33 4.79 6.45 46.31
NCE - Bagasse 3.58 5.15 6.85 0.00 0.00 0.00 0.00 0.00 0.94 6.27 7.37 7.52 7.70 41.80
NCE - Municipal Waste to Energy 5.85 1.21 2.31 3.01 4.23 2.63 2.26 2.92 1.79 1.62 3.69 3.14 3.93 32.72
NCE - Industrial Waste based power project 0.00 0.00 0.00 0.00 0.00 0.00 0.00 0.00 0.00 0.00 0.00 0.00 0.00 0.00
NCE - Wind Power 0.00 0.00 0.00 3.84 0.00 0.00 0.00 0.00 0.00 0.00 0.00 0.00 0.00 3.84
NCE - Mini Hydel 1.84 0.15 0.00 0.00 0.00 0.12 0.62 0.82 0.76 0.28 0.34 0.37 0.49 3.93
NCE - NCL Energy Ltd 0.00 0.00 0.00 0.00 0.00 0.00 0.00 0.00 0.00 0.00 0.00 0.00 0.00 0.00
NCE-Others 9.35 4.17 3.98 3.60 3.78 5.83 5.68 7.40 2.26 6.93 8.34 8.71 11.66 72.36
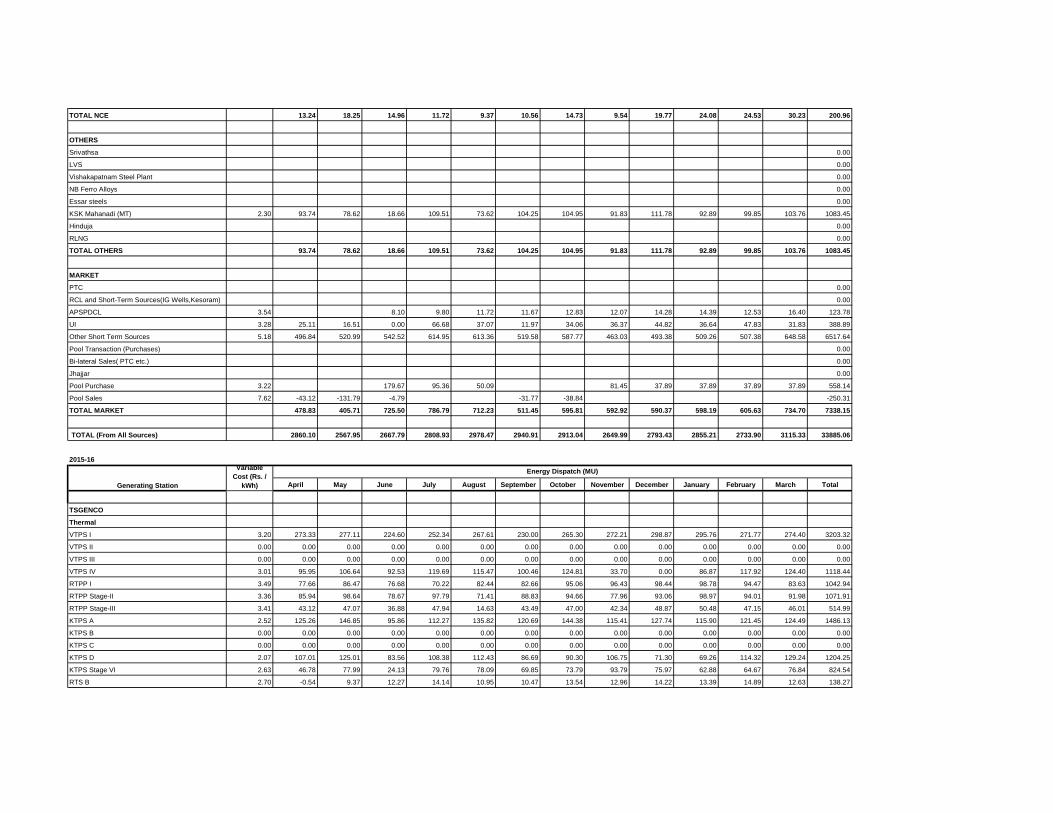
TOTAL NCE 13.24 18.25 14.96 11.72 9.37 10.56 14.73 9.54 19.77 24.08 24.53 30.23 200.96
OTHERS
Srivathsa 0.00
LVS 0.00
Vishakapatnam Steel Plant 0.00
NB Ferro Alloys 0.00
Essar steels 0.00
KSK Mahanadi (MT) 2.30 93.74 78.62 18.66 109.51 73.62 104.25 104.95 91.83 111.78 92.89 99.85 103.76 1083.45
Hinduja 0.00
RLNG 0.00
TOTAL OTHERS 93.74 78.62 18.66 109.51 73.62 104.25 104.95 91.83 111.78 92.89 99.85 103.76 1083.45
MARKET
PTC 0.00
RCL and Short-Term Sources(IG Wells,Kesoram) 0.00
APSPDCL 3.54 8.10 9.80 11.72 11.67 12.83 12.07 14.28 14.39 12.53 16.40 123.78
UI 3.28 25.11 16.51 0.00 66.68 37.07 11.97 34.06 36.37 44.82 36.64 47.83 31.83 388.89
Other Short Term Sources 5.18 496.84 520.99 542.52 614.95 613.36 519.58 587.77 463.03 493.38 509.26 507.38 648.58 6517.64
Pool Transaction (Purchases) 0.00
Bi-lateral Sales( PTC etc.) 0.00
Jhajjar 0.00
Pool Purchase 3.22 179.67 95.36 50.09 81.45 37.89 37.89 37.89 37.89 558.14
Pool Sales 7.62 -43.12 -131.79 -4.79 -31.77 -38.84 -250.31
TOTAL MARKET 478.83 405.71 725.50 786.79 712.23 511.45 595.81 592.92 590.37 598.19 605.63 734.70 7338.15
TOTAL (From All Sources) 2860.10 2567.95 2667.79 2808.93 2978.47 2940.91 2913.04 2649.99 2793.43 2855.21 2733.90 3115.33 33885.06
2015-16
April May June July August September October November December January February March Total
TSGENCO
Thermal
VTPS I 3.20 273.33 277.11 224.60 252.34 267.61 230.00 265.30 272.21 298.87 295.76 271.77 274.40 3203.32
VTPS II 0.00 0.00 0.00 0.00 0.00 0.00 0.00 0.00 0.00 0.00 0.00 0.00 0.00 0.00
VTPS III 0.00 0.00 0.00 0.00 0.00 0.00 0.00 0.00 0.00 0.00 0.00 0.00 0.00 0.00
VTPS IV 3.01 95.95 106.64 92.53 119.69 115.47 100.46 124.81 33.70 0.00 86.87 117.92 124.40 1118.44
RTPP I 3.49 77.66 86.47 76.68 70.22 82.44 82.66 95.06 96.43 98.44 98.78 94.47 83.63 1042.94
RTPP Stage-II 3.36 85.94 98.64 78.67 97.79 71.41 88.83 94.66 77.96 93.06 98.97 94.01 91.98 1071.91
RTPP Stage-III 3.41 43.12 47.07 36.88 47.94 14.63 43.49 47.00 42.34 48.87 50.48 47.15 46.01 514.99
KTPS A 2.52 125.26 146.85 95.86 112.27 135.82 120.69 144.38 115.41 127.74 115.90 121.45 124.49 1486.13
KTPS B 0.00 0.00 0.00 0.00 0.00 0.00 0.00 0.00 0.00 0.00 0.00 0.00 0.00 0.00
KTPS C 0.00 0.00 0.00 0.00 0.00 0.00 0.00 0.00 0.00 0.00 0.00 0.00 0.00 0.00
KTPS D 2.07 107.01 125.01 83.56 108.38 112.43 86.69 90.30 106.75 71.30 69.26 114.32 129.24 1204.25
KTPS Stage VI 2.63 46.78 77.99 24.13 79.76 78.09 69.85 73.79 93.79 75.97 62.88 64.67 76.84 824.54
RTS B 2.70 -0.54 9.37 12.27 14.14 10.95 10.47 13.54 12.96 14.22 13.39 14.89 12.63 138.27
Generating Station
Variable
Cost (Rs. /
kWh)
Energy Dispatch (MU)

NTS 0.00 0.00 0.00 0.00 0.00 0.00 0.00 0.00 0.00 0.00 0.00 0.00 0.00 0.00
Kakatiya Thermal Power Plant Stage I 2.46 90.34 97.22 75.01 121.66 113.66 92.35 60.52 98.66 76.37 10.56 72.90 68.48 977.72
Kakatiya Thermal Power Plant Stage II 0.00 0.00 0.00 0.00 0.00 0.00 0.00 0.00 0.00 0.00 0.00 0.00 229.04 229.04
Damodaram Sanjeevaiah Thermal power plant - I 0.00 0.00 0.00 0.00 0.00 0.00 0.00 0.00 0.00 0.00 0.00 0.00 0.00 0.00
Damodaram Sanjeevaiah Thermal power plant - II 0.00 0.00 0.00 0.00 0.00 0.00 0.00 0.00 0.00 0.00 0.00 0.00 0.00 0.00
0.00
TOTAL THERMAL 944.86 1072.37 800.19 1024.19 1002.53 925.48 1009.37 950.20 904.82 902.85 1013.54 1261.14 11811.54
MACHKUND PH TS Share 0.00 0.00 0.00
TUNGBHADRA PH TS Share 0.00 0.00 0.00 0.00 0.00 0.00 0.00 0.00 0.00 0.00 0.00 0.00 0.00 0.00
USL 0.00 0.00 0.00 0.00 0.00 0.00 0.00 0.00 0.00 0.00 0.00 0.00 0.00 0.00
LSR 0.00 0.00 0.00 0.00 0.00 0.00 0.00 0.00 0.00 0.00 0.00 0.00 0.00 0.00
DONKARAYI 0.00 0.00 0.00 0.00 0.00 0.00 0.00 0.00 0.00 0.00 0.00 0.00 0.00 0.00
SSLM 0.00 0.00 0.00 0.00 0.00 0.00 0.00 0.00 0.00 0.00 0.00 0.00 0.00 0.00
NSPH 0.00 10.40 2.41 -0.11 0.07 -0.23 -0.25 -0.25 15.37 11.64 2.68 13.36 7.03 62.11
NSRCPH 0.00 0.00 0.00 0.00 0.00 0.00 0.00 0.00 0.00 0.00 0.00 0.00 0.00 0.00
NSLCPH 0.00 0.00 0.00 0.00 0.00 0.00 0.00 0.00 0.00 0.00 0.00 0.00 0.00 0.00
POCHAMPAD PH 0.00 -0.01 -0.02 -0.02 -0.01 -0.01 -0.01 -0.01 -0.01 -0.01 -0.01 -0.01 -0.01 -0.13
NIZAMSAGAR PH 0.00 -0.02 -0.02 -0.02 0.04 -0.02 -0.02 -0.02 -0.01 -0.02 -0.01 -0.01 -0.02 -0.13
PABM 0.00 0.00 0.00 0.00 0.00 0.00 0.00 0.00 0.00 0.00 0.00 0.00 0.00 0.00
MINI HYDRO&OTHERS 0.00 0.00 0.00 0.00 0.00 0.00 0.00 0.00 0.00 0.00 0.00 0.00 0.00 0.00
SINGUR 0.00 -0.02 -0.02 -0.02 -0.02 -0.01 -0.02 -0.01 -0.02 -0.02 -0.02 -0.02 -0.02 -0.19
SSLM LCPH 0.00 5.64 -0.07 -0.49 -0.54 -0.55 7.39 12.36 30.15 9.57 -0.36 18.31 22.32 103.71
Nagarjunasagar Tail Pond Dam Power House 0.00 0.00 0.00 0.00 0.00 0.00 0.00 0.00 0.00 0.00 0.00 0.00 0.00 0.00
Priyadarshini Jurala Hydro Electric Project- TS Share 0.00 -0.16 -0.18 -0.16 -0.17 -0.16 10.15 5.10 0.00 0.00 -0.06 -0.06 -0.05 14.25
Lower Jurala Hydro Electric Project 0.00 0.00 0.00 0.00 0.00 0.00 0.00 0.00 0.00 0.00 0.00 0.00 1.88 1.88
POCHAMPAD Stig-II 0.00 0.00 0.00 0.00 0.00 0.00 0.00 0.00 0.00 0.00 0.00 0.00 0.00 0.00
PULICHINTAL(New Project) 0.00 0.00 0.00 0.00 0.00 0.00 0.00 0.00 0.00 0.00 0.00 0.00 0.00 0.00
Mini Hydel & Others (Peddapalli, Palair) 0.00 0.06 -0.01 0.00 -0.01 0.00 0.00 0.00 0.00 -0.01 -0.01 0.00 -0.01 0.00
Ramagiri Wind Mills (AP) 0.00 7.57 3.41 2.95 6.29 7.57 7.35 7.64 7.39 7.00 5.66 5.29 5.66 73.78
0.00 0.00 0.00 0.00 0.00 0.00 0.00 0.00 0.00 0.00 0.00 4.21 4.21
0.00
TOTAL HYDRO 23.46 5.50 2.14 5.66 6.58 24.59 24.80 52.86 28.17 7.86 36.86 41.00 259.50
TOTAL TSGENCO 968.32 1077.88 802.32 1029.85 1009.11 950.07 1034.17 1003.06 932.99 910.71 1050.40 1302.15 12071.04
Central Generating Stations
NTPC
NTPC (SR)
NTPC (SR) 2.23 149.18 152.96 93.91 123.86 143.61 113.49 125.22 153.09 157.05 140.16 156.25 166.98 1675.76
NTPC (SR) Stage III 2.24 36.13 35.52 22.54 33.65 26.79 31.57 25.96 39.20 36.61 36.59 40.17 42.42 407.15
Total NTPC(SR) 185.31 188.48 116.45 157.51 170.40 145.06 151.18 192.29 193.66 176.75 196.42 209.40 2082.91
NTPC (ER)
Farakka 0.00 0.00 0.00 0.00 0.00 0.00 0.00 0.00 0.00 0.00 0.00 0.00 0.00 0.00
Kahalgaon 0.00 0.00 0.00 0.00 0.00 0.00 0.00 0.00 0.00 0.00 0.00 0.00 0.00 0.00
Talcher - Stage 1 0.00 0.00 0.00 0.00 0.00 0.00 0.00 0.00 0.00 0.00 0.00 0.00 0.00 0.00
Talcher Stage 2 1.29 99.10 103.82 69.88 98.33 78.33 95.66 97.15 95.15 100.21 94.99 96.15 100.22 1128.98
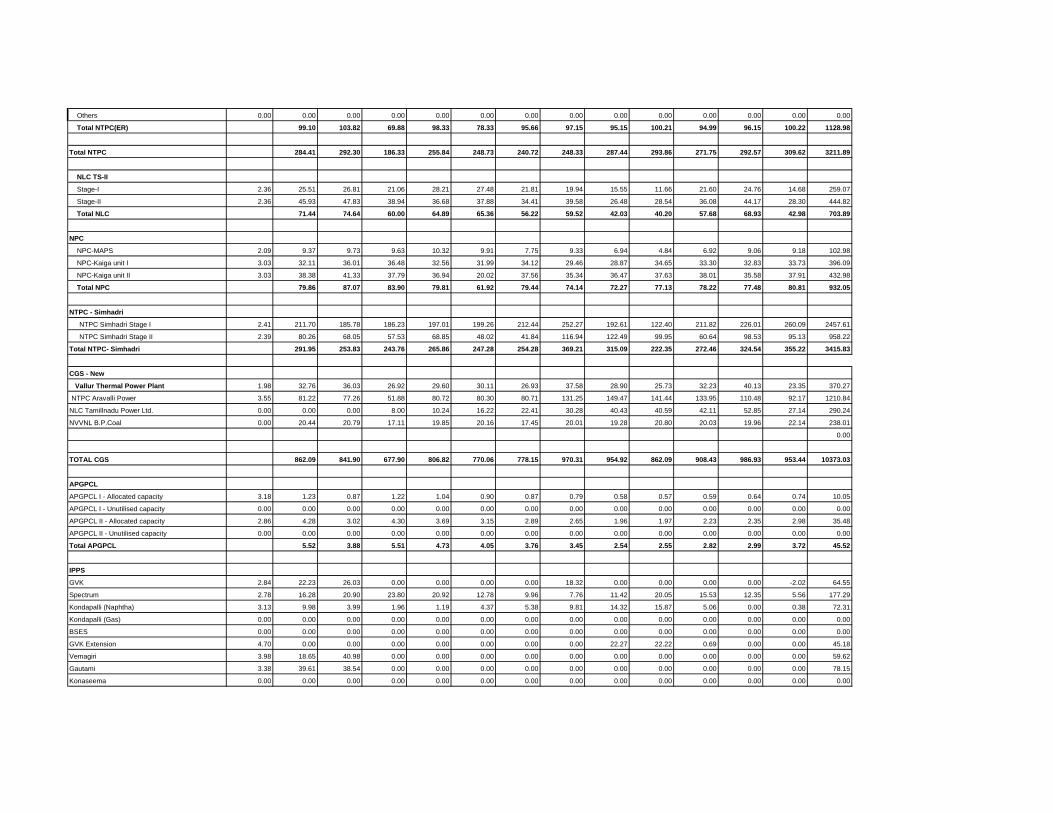
Others 0.00 0.00 0.00 0.00 0.00 0.00 0.00 0.00 0.00 0.00 0.00 0.00 0.00 0.00
Total NTPC(ER) 99.10 103.82 69.88 98.33 78.33 95.66 97.15 95.15 100.21 94.99 96.15 100.22 1128.98
Total NTPC 284.41 292.30 186.33 255.84 248.73 240.72 248.33 287.44 293.86 271.75 292.57 309.62 3211.89
NLC TS-II
Stage-I 2.36 25.51 26.81 21.06 28.21 27.48 21.81 19.94 15.55 11.66 21.60 24.76 14.68 259.07
Stage-II 2.36 45.93 47.83 38.94 36.68 37.88 34.41 39.58 26.48 28.54 36.08 44.17 28.30 444.82
Total NLC 71.44 74.64 60.00 64.89 65.36 56.22 59.52 42.03 40.20 57.68 68.93 42.98 703.89
NPC
NPC-MAPS 2.09 9.37 9.73 9.63 10.32 9.91 7.75 9.33 6.94 4.84 6.92 9.06 9.18 102.98
NPC-Kaiga unit I 3.03 32.11 36.01 36.48 32.56 31.99 34.12 29.46 28.87 34.65 33.30 32.83 33.73 396.09
NPC-Kaiga unit II 3.03 38.38 41.33 37.79 36.94 20.02 37.56 35.34 36.47 37.63 38.01 35.58 37.91 432.98
Total NPC 79.86 87.07 83.90 79.81 61.92 79.44 74.14 72.27 77.13 78.22 77.48 80.81 932.05
NTPC - Simhadri
NTPC Simhadri Stage I 2.41 211.70 185.78 186.23 197.01 199.26 212.44 252.27 192.61 122.40 211.82 226.01 260.09 2457.61
NTPC Simhadri Stage II 2.39 80.26 68.05 57.53 68.85 48.02 41.84 116.94 122.49 99.95 60.64 98.53 95.13 958.22
Total NTPC- Simhadri 291.95 253.83 243.76 265.86 247.28 254.28 369.21 315.09 222.35 272.46 324.54 355.22 3415.83
CGS - New
Vallur Thermal Power Plant 1.98 32.76 36.03 26.92 29.60 30.11 26.93 37.58 28.90 25.73 32.23 40.13 23.35 370.27
NTPC Aravalli Power 3.55 81.22 77.26 51.88 80.72 80.30 80.71 131.25 149.47 141.44 133.95 110.48 92.17 1210.84
NLC Tamillnadu Power Ltd. 0.00 0.00 0.00 8.00 10.24 16.22 22.41 30.28 40.43 40.59 42.11 52.85 27.14 290.24
NVVNL B.P.Coal 0.00 20.44 20.79 17.11 19.85 20.16 17.45 20.01 19.28 20.80 20.03 19.96 22.14 238.01
0.00
TOTAL CGS 862.09 841.90 677.90 806.82 770.06 778.15 970.31 954.92 862.09 908.43 986.93 953.44 10373.03
APGPCL
APGPCL I - Allocated capacity 3.18 1.23 0.87 1.22 1.04 0.90 0.87 0.79 0.58 0.57 0.59 0.64 0.74 10.05
APGPCL I - Unutilised capacity 0.00 0.00 0.00 0.00 0.00 0.00 0.00 0.00 0.00 0.00 0.00 0.00 0.00 0.00
APGPCL II - Allocated capacity 2.86 4.28 3.02 4.30 3.69 3.15 2.89 2.65 1.96 1.97 2.23 2.35 2.98 35.48
APGPCL II - Unutilised capacity 0.00 0.00 0.00 0.00 0.00 0.00 0.00 0.00 0.00 0.00 0.00 0.00 0.00 0.00
Total APGPCL 5.52 3.88 5.51 4.73 4.05 3.76 3.45 2.54 2.55 2.82 2.99 3.72 45.52
IPPS
GVK 2.84 22.23 26.03 0.00 0.00 0.00 0.00 18.32 0.00 0.00 0.00 0.00 -2.02 64.55
Spectrum 2.78 16.28 20.90 23.80 20.92 12.78 9.96 7.76 11.42 20.05 15.53 12.35 5.56 177.29
Kondapalli (Naphtha) 3.13 9.98 3.99 1.96 1.19 4.37 5.38 9.81 14.32 15.87 5.06 0.00 0.38 72.31
Kondapalli (Gas) 0.00 0.00 0.00 0.00 0.00 0.00 0.00 0.00 0.00 0.00 0.00 0.00 0.00 0.00
BSES 0.00 0.00 0.00 0.00 0.00 0.00 0.00 0.00 0.00 0.00 0.00 0.00 0.00 0.00
GVK Extension 4.70 0.00 0.00 0.00 0.00 0.00 0.00 0.00 22.27 22.22 0.69 0.00 0.00 45.18
Vemagiri 3.98 18.65 40.98 0.00 0.00 0.00 0.00 0.00 0.00 0.00 0.00 0.00 0.00 59.62
Gautami 3.38 39.61 38.54 0.00 0.00 0.00 0.00 0.00 0.00 0.00 0.00 0.00 0.00 78.15
Konaseema 0.00 0.00 0.00 0.00 0.00 0.00 0.00 0.00 0.00 0.00 0.00 0.00 0.00 0.00

0.00
TOTAL IPPS 106.74 130.44 25.76 22.10 17.15 15.34 35.88 48.00 58.13 21.28 12.35 3.92 497.10
NCE
NCE - Bio-Mass 0.00 3.32 2.70 2.47 2.85 2.94 2.96 0.92 3.20 3.36 5.02 4.87 6.00 40.61
NCE - Bagasse 0.00 0.00 0.00 0.00 0.00 0.00 0.00 0.00 0.00 5.59 7.91 7.46 4.19 25.15
NCE - Municipal Waste to Energy 0.00 0.00 0.00 0.00 0.00 0.00 0.00 0.00 0.00 0.00 0.00 0.00 0.00 0.00
NCE - Industrial Waste based power project 0.00 3.84 3.13 4.26 4.48 4.42 3.75 1.73 1.89 1.33 2.97 4.10 2.28 38.18
NCE - Wind Power 0.00 0.00 0.00 0.00 0.00 0.00 0.00 0.00 0.00 0.00 0.00 0.00 0.00 0.00
NCE - Mini Hydel 0.00 0.11 0.00 0.00 0.00 0.00 0.00 0.00 0.00 0.00 0.00 0.00 0.00 0.11
NCE - NCL Energy Ltd 0.00 0.00 0.00 0.00 0.00 0.00 0.00 0.00 0.00 0.00 0.00 0.00 0.00 0.00
NCE-Others 2.29 7.44 8.87 7.66 7.56 14.49 11.29 14.14 14.27 15.13 16.35 17.86 37.53 172.60
TOTAL NCE 14.72 14.70 14.38 14.89 21.85 18.00 16.79 19.36 25.40 32.25 34.29 50.00 276.65
OTHERS
Srivathsa 0.00 0.00 0.00 0.00 0.00 0.00 0.00 0.00 0.00 0.00 0.00 0.00 0.00 0.00
LVS 0.00 0.00 0.00 0.00 0.00 0.00 0.00 0.00 0.00 0.00 0.00 0.00 0.00 0.00
Vishakapatnam Steel Plant 0.00 0.00 0.00 0.00 0.00 0.00 0.00 0.00 0.00 0.00 0.00 0.00 0.00 0.00
NB Ferro Alloys 0.00 0.00 0.00 0.00 0.00 0.00 0.00 0.00 0.00 0.00 0.00 0.00 0.00 0.00
KSK Mahanadi (MT) 3.74 146.30 156.32 138.31 149.72 128.01 123.30 148.74 127.48 132.14 91.23 103.92 137.66 1583.15
Hinduja 0.00 0.00 0.00 0.00 0.00 0.00 0.00 0.00 0.00 0.00 0.00 0.00 0.00 0.00
Thermal Power Unit 1 1.78 46.85 74.16 123.39 124.50 103.74 133.58 141.39 123.00 139.70 136.55 131.91 139.76 1418.52
Thermal Power Unit 2 0.00 0.00 0.00 0.00 0.00 0.00 0.00 0.00 0.00 0.00 0.00 0.00 0.00 0.00
0.00
TOTAL OTHERS 193.16 230.48 261.70 274.21 231.75 256.88 290.14 250.48 271.84 227.78 235.83 277.42 3001.67
MARKET
PTC 0.00 0.00 0.00 0.00 0.00 0.00 0.00 0.00 0.00 0.00 0.00 0.00 0.00
RCL and Short-Term Sources(IG Wells,Kesoram) 0.00 0.00 0.00 0.00 0.00 0.00 0.00 0.00 0.00 0.00 0.00 0.00 0.00
CPDCL 0.00 0.00 0.00 0.00 0.00 0.00 0.00 0.00 0.00 0.00 0.00 0.00 0.00
EPDCL 0.00 0.00 0.00 0.00 0.00 0.00 0.00 0.00 0.00 0.00 0.00 0.00 0.00
NPDCL 0.00 0.00 0.00 0.00 0.00 0.00 0.00 0.00 0.00 0.00 0.00 0.00 0.00
SPDCL 0.00 0.00 0.00 0.00 0.00 0.00 0.00 0.00 0.00 0.00 0.00 0.00 0.00
UI 32.95 23.96 26.92 33.92 24.22 6.46 21.62 22.88 22.11 25.76 27.87 19.54 288.22
Other Short Term Sources 5.60 538.34 528.63 611.25 842.66 1073.86 994.44 891.67 499.72 629.28 591.96 400.44 586.53 8188.77
NTPC Aravali Power Co. Pvt. Ltd. 0.00
D-D Sales/Bilateral Purchases 0.00
0.00
TOTAL MARKET 571.29 552.59 638.16 876.58 1098.08 1000.90 913.29 522.60 651.38 617.72 428.31 606.08 8476.99
TOTAL (From All Sources) 2721.83 2851.88 2425.74 3029.19 3152.06 3023.11 3264.02 2800.97 2804.39 2721.00 2751.11 3196.71 34742.02
2016-17
April May June July August September October November December January February March TotalGenerating Station
Variable
Cost (Rs. /
kWh)
Energy Dispatch (MU)

TSGENCO
Thermal
VTPS I 3.20 86.62 95.44 70.46 78.42 89.67 82.62 86.97 84.16 86.97 86.97 78.55 86.97 1013.80
VTPS II 3.20 86.62 95.44 70.46 78.42 89.67 82.62 86.97 84.16 86.97 78.35 78.55 86.97 1005.18
VTPS III 3.20 86.62 95.44 70.46 78.42 89.67 82.62 90.70 65.83 90.70 - 81.93 90.70 923.09
VTPS IV 3.02 116.29 119.44 129.86 132.29 127.68 126.83 115.06 55.68 111.35 115.06 103.93 115.06 1368.53
RTPP I 3.79 88.33 99.33 68.97 105.61 102.85 77.55 86.73 83.93 - - 78.33 - 791.63
RTPP Stage-II 3.14 87.48 96.73 101.82 81.89 104.70 72.68 86.73 83.93 86.73 86.73 78.33 86.73 1054.48
RTPP Stage-III 3.79 44.16 39.59 50.91 52.11 25.39 52.06 43.36 41.96 4.12 - 39.17 39.04 431.87
KTPS A 2.80 40.77 41.25 37.46 40.48 41.73 34.54 38.66 36.14 39.50 45.38 47.07 52.11 495.10
KTPS B 2.80 40.77 41.25 37.46 40.48 41.73 34.54 26.05 42.02 39.50 52.11 47.07 52.11 495.10
KTPS C 2.80 40.77 41.25 37.46 40.48 41.73 34.54 52.11 50.43 39.50 39.50 47.07 52.11 516.95
KTPS D 2.13 114.89 114.98 86.96 85.06 48.82 73.19 103.25 99.92 103.25 103.25 93.26 103.25 1130.06
KTPS Stage VI 2.83 94.30 93.41 94.18 96.66 102.45 92.53 104.95 101.56 104.95 104.95 94.79 104.95 1189.68
RTS B 3.32 13.09 14.47 14.03 13.13 11.63 13.87 4.85 13.23 13.67 - 12.35 13.67 138.01
NTS 0.00 - - - - - - - - - - - - 0.00
Kakatiya Thermal Power Plant Stage I 2.67 83.08 94.33 79.55 94.97 81.75 99.91 104.95 101.56 104.95 104.95 94.79 104.95 1149.75
Kakatiya Thermal Power Plant Stage II 2.65 154.19 133.06 214.98 168.38 117.86 (0.76) 233.70 226.16 233.70 233.70 211.08 233.70 2159.73
Damodaram Sanjeevaiah Thermal power plant - I - - - - - - - - - - - - 0.00
Damodaram Sanjeevaiah Thermal power plant - II - - - - - - - - - - - - 0.00
0.00
0.00
TOTAL THERMAL 1177.96 1215.42 1165.03 1186.82 1117.34 959.33 1265.03 1170.68 1145.85 1050.94 1186.26 1222.31 13862.97
MACHKUND PH TS Share 0.00 5.48 5.66 5.48 5.66 5.66 5.48 2.82 2.82 2.82 2.82 2.82 2.82 50.29
TUNGBHADRA PH TS Share 0.00 - - - - 0.71 0.82 0.56 0.56 0.56 0.56 0.56 0.56 4.88
USL 0.00 - - - - - - - - - - - - 0.00
LSR 0.00 - - - - - - - - - - - - 0.00
DONKARAYI 0.00 - - - - - - - - - - - - 0.00
SSLM 0.00 - - - - - - - - - - - - 0.00
NSPH 0.00 (0.26) 4.61 6.29 (0.27) 70.75 (0.20) 39.06 19.53 11.72 11.72 5.86 6.84 175.64
NSRCPH 0.00 - - - - - - - - - - - - 0.00
NSLCPH 0.00 - - (0.00) - - - 3.32 2.54 1.76 0.98 0.39 - 8.98
POCHAMPAD PH 0.00 (0.01) (0.01) (0.01) (0.01) 2.92 5.31 2.34 1.32 1.03 1.46 1.61 1.66 17.60
NIZAMSAGAR PH 0.00 (0.01) (0.02) (0.02) (0.02) (0.02) (0.02) 0.34 0.18 2.20 0.02 0.71 0.54 3.87
PABM 0.00 - - - - - - - - - - - - 0.00
MINI HYDRO&OTHERS 0.00 - - - - - - - - - - - - 0.00
SINGUR 0.00 (0.01) (0.01) (0.01) (0.02) (0.01) 0.45 1.04 0.39 0.39 0.39 0.39 0.39 3.38
SSLM LCPH 0.00 (0.47) (0.38) (0.38) 6.03 86.95 99.84 33.52 8.38 8.69 9.08 12.36 13.10 276.72
Nagarjunasagar Tail Pond Dam Power House 0.00 - - - - - - - - - - - - 0.00
Priyadarshini Jurala Hydro Electric Project- TS Share 0.00 (0.06) (0.07) (0.08) 6.34 38.14 0.03 5.86 1.95 0.59 - - - 52.70
Lower Jurala Hydro Electric Project 0.00 - - - 7.45 32.86 35.07 14.65 4.88 2.93 0.98 0.39 0.39 99.60
POCHAMPAD PH Stage 2 0.00 - - - - 1.76 0.68 0.78 0.44 0.34 0.49 0.54 0.55 5.58
Pulichintala New project 0.00 - - - - - - 4.36 1.53 3.16 3.51 4.73 2.69 19.98
Mini hydel & others 0.00 (0.01) (0.00) (0.00) (0.00) (0.01) 0.08 0.20 0.15 0.11 0.15 0.21 0.20 1.07
Ramagiri wind mills - - - - - - - - - - - - 0.00
0.00

TOTAL HYDRO 4.64 9.77 11.26 25.16 239.71 147.55 108.84 44.67 36.27 32.13 30.57 29.73 720.30
TOTAL TSGENCO 1182.60 1225.19 1176.28 1211.98 1357.05 1106.88 1373.87 1215.35 1182.12 1083.07 1216.83 1252.04 14583.27
Central Generating Stations
NTPC
NTPC (SR)
NTPC (SR) 2.09 157.41 149.71 122.82 124.72 124.65 133.81 161.21 145.95 157.61 164.82 149.67 165.66 1758.05
NTPC (SR) Stage III 2.13 39.92 35.43 36.49 38.17 35.71 35.40 0.63 39.74 40.88 41.26 37.72 41.77 423.12
Total NTPC(SR) 197.33 185.14 159.31 162.89 160.36 169.22 161.85 185.69 198.49 206.08 187.39 207.43 2181.17
NTPC (ER)
Farakka - - - - - - - - - - - - 0.00
Kahalgaon - - - - - - - - - - - - 0.00
Talcher - Stage 1 - - - - - - - - - - - - 0.00
Talcher Stage 2 1.60 96.49 94.65 89.34 101.21 84.33 68.47 86.74 99.81 103.16 103.16 93.12 103.16 1123.64
Others - - - - - - - - - - - - 0.00
Total NTPC(ER) 96.49 94.65 89.34 101.21 84.33 68.47 86.74 99.81 103.16 103.16 93.12 103.16 1123.64
Total NTPC 293.82 279.79 248.65 264.10 244.69 237.69 248.59 285.50 301.65 309.24 280.51 310.59 3304.81
NLC TS-II
Stage-I 2.95 13.77 18.14 18.35 15.69 24.50 21.45 13.44 8.96 12.98 - 19.18 21.09 187.54
Stage-II 3.06 29.68 32.81 25.35 28.05 37.42 38.61 31.06 36.74 37.81 40.03 36.21 39.85 413.63
Total NLC 43.45 50.95 43.71 43.73 61.92 60.05 44.51 45.71 50.79 40.03 55.39 60.94 601.17
NPC
NPC-MAPS 2.18 6.46 8.56 8.25 8.87 8.95 5.38 8.38 5.54 6.55 8.38 7.81 8.38 91.53
NPC-Kaiga unit I 3.13 22.70 24.63 26.37 34.38 34.20 32.65 25.83 25.83 25.83 25.83 25.83 25.83 329.91
NPC-Kaiga unit II 3.11 36.50 15.72 17.48 18.37 18.30 17.60 32.28 32.28 32.28 32.28 32.28 32.28 317.68
Total NPC 65.66 48.92 52.10 61.62 61.45 55.64 66.50 63.65 64.66 66.50 65.92 66.50 739.11
NTPC - Simhadri
NTPC Simhadri Stage I 2.69 253.66 231.07 210.62 233.63 231.20 209.16 231.92 224.32 231.92 231.92 209.49 231.92 2730.83
NTPC Simhadri Stage II 2.59 94.03 87.72 85.01 84.80 90.04 80.60 107.08 90.84 72.84 107.08 96.78 107.08 1103.90
Total NTPC- Simhadri 347.69 318.79 295.63 318.42 321.24 289.76 339.00 315.15 304.77 339.00 306.27 339.00 3834.74
CGS - New
Vallur Thermal Power Plant 2.17 35.28 33.68 27.02 30.44 44.43 42.17 34.60 46.33 47.90 47.90 43.28 47.90 480.92
Tuticorin 2.29 36.07 46.08 29.45 49.69 50.18 57.59 63.01 61.00 63.01 63.22 57.18 63.11 639.59
Kudigi 1.89 - - - - - - - - - 11.29 10.21 11.29 32.80
NVVNL Bundled Power -COAL 0.00 21.04 19.97 16.81 17.61 17.60 17.11 19.62 19.62 19.62 19.62 19.62 19.62 227.87
0.00
TOTAL CGS 843.01 798.19 713.37 785.61 801.51 760.01 815.82 836.96 852.39 896.81 838.37 918.96 9861.00
APGPCL
APGPCL I - Allocated capacity 2.84 0.71 0.59 1.10 0.65 0.38 0.35 0.57 1.16 1.20 1.20 1.08 1.20 10.20
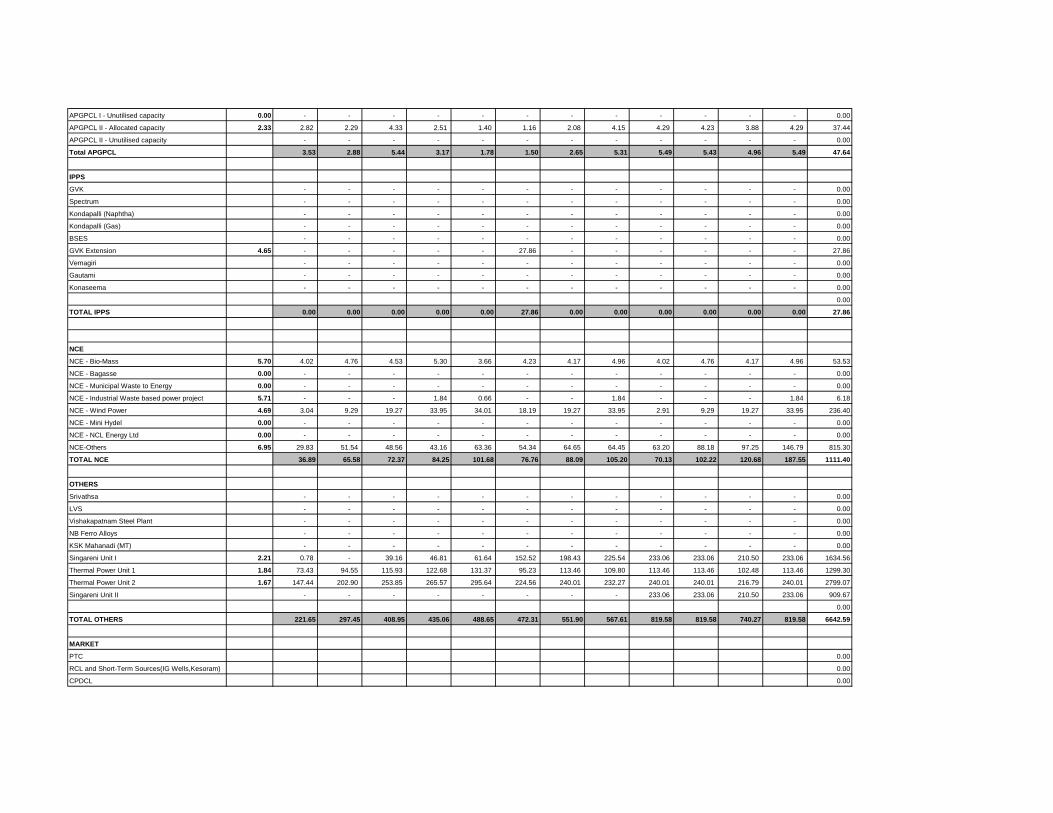
APGPCL I - Unutilised capacity 0.00 - - - - - - - - - - - - 0.00
APGPCL II - Allocated capacity 2.33 2.82 2.29 4.33 2.51 1.40 1.16 2.08 4.15 4.29 4.23 3.88 4.29 37.44
APGPCL II - Unutilised capacity - - - - - - - - - - - - 0.00
Total APGPCL 3.53 2.88 5.44 3.17 1.78 1.50 2.65 5.31 5.49 5.43 4.96 5.49 47.64
IPPS
GVK - - - - - - - - - - - - 0.00
Spectrum - - - - - - - - - - - - 0.00
Kondapalli (Naphtha) - - - - - - - - - - - - 0.00
Kondapalli (Gas) - - - - - - - - - - - - 0.00
BSES - - - - - - - - - - - - 0.00
GVK Extension 4.65 - - - - - 27.86 - - - - - - 27.86
Vemagiri - - - - - - - - - - - - 0.00
Gautami - - - - - - - - - - - - 0.00
Konaseema - - - - - - - - - - - - 0.00
0.00
TOTAL IPPS 0.00 0.00 0.00 0.00 0.00 27.86 0.00 0.00 0.00 0.00 0.00 0.00 27.86
NCE
NCE - Bio-Mass 5.70 4.02 4.76 4.53 5.30 3.66 4.23 4.17 4.96 4.02 4.76 4.17 4.96 53.53
NCE - Bagasse 0.00 - - - - - - - - - - - - 0.00
NCE - Municipal Waste to Energy 0.00 - - - - - - - - - - - - 0.00
NCE - Industrial Waste based power project 5.71 - - - 1.84 0.66 - - 1.84 - - - 1.84 6.18
NCE - Wind Power 4.69 3.04 9.29 19.27 33.95 34.01 18.19 19.27 33.95 2.91 9.29 19.27 33.95 236.40
NCE - Mini Hydel 0.00 - - - - - - - - - - - - 0.00
NCE - NCL Energy Ltd 0.00 - - - - - - - - - - - - 0.00
NCE-Others 6.95 29.83 51.54 48.56 43.16 63.36 54.34 64.65 64.45 63.20 88.18 97.25 146.79 815.30
TOTAL NCE 36.89 65.58 72.37 84.25 101.68 76.76 88.09 105.20 70.13 102.22 120.68 187.55 1111.40
OTHERS
Srivathsa - - - - - - - - - - - - 0.00
LVS - - - - - - - - - - - - 0.00
Vishakapatnam Steel Plant - - - - - - - - - - - - 0.00
NB Ferro Alloys - - - - - - - - - - - - 0.00
KSK Mahanadi (MT) - - - - - - - - - - - - 0.00
Singareni Unit I 2.21 0.78 - 39.16 46.81 61.64 152.52 198.43 225.54 233.06 233.06 210.50 233.06 1634.56
Thermal Power Unit 1 1.84 73.43 94.55 115.93 122.68 131.37 95.23 113.46 109.80 113.46 113.46 102.48 113.46 1299.30
Thermal Power Unit 2 1.67 147.44 202.90 253.85 265.57 295.64 224.56 240.01 232.27 240.01 240.01 216.79 240.01 2799.07
Singareni Unit II - - - - - - - - 233.06 233.06 210.50 233.06 909.67
0.00
TOTAL OTHERS 221.65 297.45 408.95 435.06 488.65 472.31 551.90 567.61 819.58 819.58 740.27 819.58 6642.59
MARKET
PTC 0.00
RCL and Short-Term Sources(IG Wells,Kesoram) 0.00
CPDCL 0.00

EPDCL 0.00
NPDCL 0.00
SPDCL 0.00
UI 0.00
Other Short Term Sources 6.08 762.31 320.19 212.47 286.32 555.27 401.13 363.79 79.02 - - - - 2980.51
NTPC - Aravali Power Co. Pvt Ltd 3.09 24.54 28.16 - - - - - - - - - - 52.70
D-D Sales/Bilateral Purchases 0.00 137 199 132 (24) (156) (35) (209) (17) (24) (44) (76) (5) -121.33
Pioneer Gas Power Limited 4.70 - - - - - - 115.98 115.98 - - 18.12 - 250.08
0.00
TOTAL MARKET 923.52 546.87 344.24 262.12 399.50 366.62 271.15 178.50 -23.50 -43.65 -58.30 -5.11 3161.96
TOTAL (From All Sources) 3211.20 2936.16 2720.65 2782.20 3150.18 2811.95 3103.49 2908.92 2906.21 2863.47 2862.80 3178.50 35435.73
2017-18
April May June July August September October November December January February March Total
TSGENCO
Thermal
VTPS I 3.26 91.58 - - - 94.64 - 94.64 14.22 - - 9.31 - 304.38
VTPS II 3.26 43.93 - - - 68.56 - 68.56 - - - - - 181.05
VTPS III 3.26 - - - - 90.44 - 90.44 - - - - - 180.89
VTPS IV 2.99 105.93 - - - 109.46 84.71 109.46 52.96 29.77 - 98.87 109.46 700.62
RTPP I 3.63 - - - - 90.20 - - - - - - - 90.20
RTPP Stage-II 3.20 91.20 - - - 94.24 - 48.64 91.20 - - 85.12 56.72 467.10
RTPP Stage-III 3.63 - - - - 23.28 - 38.89 - - - - - 62.16
KTPS A 2.50 49.49 51.14 49.49 51.14 51.14 49.49 44.96 43.31 44.96 44.96 46.20 51.14 577.44
KTPS B 2.50 51.71 53.43 51.71 53.43 53.43 25.86 27.58 51.71 53.43 53.43 48.26 53.43 577.44
KTPS C 2.50 49.49 51.14 49.49 51.14 38.77 49.49 51.14 49.49 38.77 51.14 46.20 51.14 577.44
KTPS D 2.17 101.73 105.12 76.30 105.12 105.12 101.73 105.12 101.73 105.12 105.12 94.95 105.12 1212.32
KTPS Stage VI 2.50 105.63 109.15 63.38 98.58 109.15 105.63 109.15 105.63 109.15 109.15 98.58 109.15 1232.30
RTS B 3.39 - - - - 13.42 - 13.42 - - - - - 26.84
NTS 0.00 - - - - - - - - - - - - 0.00
Kakatiya Thermal Power Plant Stage I 2.50 107.16 110.73 107.16 39.29 110.73 107.16 110.73 107.16 110.73 110.73 100.01 110.73 1232.30
Kakatiya Thermal Power Plant Stage II 2.50 238.61 246.57 238.61 246.57 87.49 238.61 246.57 238.61 246.57 246.57 222.70 246.57 2744.04
Damodaram Sanjeevaiah Thermal power plant - - - - - - - - - - - - 0.00
- - - - - - - - - - - - 0.00
0.00
0.00
TOTAL THERMAL 1036.46 727.29 636.15 645.29 1140.08 762.68 1159.30 856.02 738.50 721.10 850.20 893.47 10166.54
MACHKUND PH AP Share 0.00 3.55 3.64 2.95 3.41 3.86 3.80 3.87 3.38 3.35 3.72 3.50 3.55 42.56
TUNGBHADRA PH AP Share 0.00 0.35 0.06 0.00 0.84 2.96 3.00 2.74 2.45 1.94 1.90 1.33 1.27 18.86
USL 0.00 - - - - - - - - - - - - 0.00
LSR 0.00 - - - - - - - - - - - - 0.00
DONKARAYI 0.00 - - - - - - - - - - - - 0.00
Generating Station
Variable
Cost (Rs. /
kWh)
Energy Dispatch (MU)

April May June July August September October November December January February March TotalGenerating Station
Variable
Cost (Rs. /
kWh)
Energy Dispatch (MU)
SSLM 0.00 - - - - - - - - - - - - 0.00
NSPH 0.00 13.83 5.39 7.44 30.63 60.21 71.94 57.01 28.41 17.43 18.33 16.56 20.92 348.12
NSRCPH 0.00 - - - - - - - - - - - - 0.00
NSLCPH 0.00 0.10 - - 0.11 1.59 3.29 3.89 3.09 2.06 1.21 0.45 0.19 16.00
POCHAMPAD PH 0.00 - - 0.75 0.94 1.50 1.31 2.25 1.69 1.31 1.50 1.13 0.75 13.14
NIZAMSAGAR PH 0.00 0.13 - - 0.05 0.45 1.38 0.80 - 0.63 0.75 0.75 1.13 6.06
PABM 0.00 - - - - - - - - - - - - 0.00
MINI HYDRO&OTHERS 0.00 - - - - - - - - - - - - 0.00
SINGUR 0.00 0.25 0.25 0.25 0.25 0.25 1.00 1.00 0.75 0.75 0.50 0.50 0.50 6.26
SSLM LCPH 0.00 11.32 4.02 2.84 15.95 73.24 83.19 47.34 20.68 15.37 16.30 19.87 23.16 333.28
Nagarjunasagar Tail Pond Dam Power House 0.00 - - - - - - - - - - - - 0.00
Priyadarshini Jurala Hydro Electric Project- AP Share 0.00 - - 0.09 3.99 16.70 15.68 5.04 1.61 0.92 0.59 0.42 0.25 45.28
Lower Jurala Hydro Electric Project 0.00 - - - 2.84 6.49 6.39 3.75 2.66 2.66 2.63 2.62 2.64 32.67
POCHAMPAD Stig-II 0.00 - - 0.25 0.31 0.50 0.44 0.75 0.56 0.44 0.50 0.38 0.25 4.38
PULICHINTAL(New Project) 0.00 0.09 0.17 10.81 11.17 11.17 10.81 16.76 5.89 12.14 8.99 12.14 6.90 107.05
Mini Hydel & Others (Peddapalli, Palair) 0.00 0.01 0.01 0.50 1.01 1.51 1.60 1.69 1.66 1.51 1.68 1.69 1.19 14.05
Ramagiri Wind Mills (AP) - - - - - - - - - - - - 0.00
0.00
TOTAL HYDRO 29.63 13.53 25.89 71.52 180.44 203.84 146.89 72.86 60.51 58.60 61.32 62.70 987.72
TOTAL TSGENCO 1066.09 740.82 662.03 716.81 1320.51 966.53 1306.19 928.88 799.01 779.70 911.52 956.18 11154.25
Central Generating Stations
NTPC
NTPC (SR)
NTPC (SR) 2.07 150.21 153.59 133.83 128.91 128.14 142.22 155.05 152.18 156.44 157.50 142.56 158.32 1758.95
NTPC (SR) Stage III 2.03 36.56 37.37 36.13 36.93 37.33 36.13 37.54 36.97 38.20 38.20 34.53 38.23 444.12
Total NTPC(SR) 186.77 190.96 169.96 165.84 165.47 178.35 192.59 189.15 194.64 195.71 177.08 196.54 2203.07
NTPC (ER)
Farakka - - - - - - - - - - - - 0.00
Kahalgaon - - - - - - - - - - - - 0.00
Talcher - Stage 1 - - - - - - - - - - - - 0.00
Talcher Stage 2 1.49 96.81 100.03 96.81 81.35 88.99 96.81 90.79 76.51 100.14 100.14 90.45 100.14 1118.97
Others - - - - - - - - - - - - 0.00
Total NTPC(ER) 96.81 100.03 96.81 81.35 88.99 96.81 90.79 76.51 100.14 100.14 90.45 100.14 1118.97
Total NTPC 283.58 290.99 266.76 247.19 254.46 275.16 283.38 265.66 294.78 295.85 267.54 296.69 3322.03
NLC TS-II
Stage-I 3.47 - - - - 16.93 - 19.18 - - - - - 36.11
Stage-II 3.75 - - - - 13.22 - - - - - - - 13.22
Total NLC 0.00 0.00 0.00 0.00 30.16 0.00 19.18 0.00 0.00 0.00 0.00 0.00 49.33
NPC
NPC-MAPS 2.11 8.02 8.31 7.74 8.10 8.35 7.84 8.35 7.77 8.28 8.35 7.63 8.38 97.11

April May June July August September October November December January February March TotalGenerating Station
Variable
Cost (Rs. /
kWh)
Energy Dispatch (MU)
NPC-Kaiga unit I 3.13 27.10 27.10 27.10 27.10 27.10 27.10 27.10 27.10 27.10 27.10 27.10 27.10 325.21
NPC-Kaiga unit II 3.13 27.10 27.10 27.10 27.10 27.10 27.10 27.10 27.10 27.10 27.10 27.10 27.10 325.21
Total NPC 62.23 62.51 61.94 62.30 62.55 62.05 62.55 61.97 62.48 62.55 61.83 62.59 747.54
NTPC - Simhadri
NTPC Simhadri Stage I 2.71 228.81 236.30 90.56 236.30 236.30 228.81 211.78 152.88 236.30 236.30 213.48 236.30 2544.10
NTPC Simhadri Stage II 2.73 104.94 32.97 0.00 44.80 64.02 104.94 108.37 104.94 108.37 38.49 97.91 108.37 918.13
Total NTPC- Simhadri 333.74 269.26 90.56 281.10 300.32 333.74 320.15 257.81 344.67 274.79 311.39 344.67 3462.22
CGS - New
Vallur Thermal Power Plant 2.08 46.65 47.99 45.82 42.35 33.74 46.03 41.63 45.20 46.70 46.92 42.38 46.92 532.33
Tuticorin 2.32 64.36 66.64 64.36 66.40 66.40 64.24 65.08 47.07 49.23 66.64 60.04 66.64 747.11
Kudigi 1.89 30.98 32.01 30.98 32.01 64.04 61.97 64.04 61.97 64.04 96.00 86.75 99.42 724.22
NVVNL Bundled Power -COAL 2.93 19.78 19.78 19.78 19.78 19.78 19.78 19.78 19.78 19.78 19.78 19.78 19.78 237.34
0.00
TOTAL CGS 841.32 789.20 580.21 751.13 831.45 862.96 875.79 759.46 881.68 862.53 849.70 936.70 9822.14
APGPCL
APGPCL I - Allocated capacity 2.33 1.16 1.20 1.16 1.20 1.20 1.16 1.18 1.16 1.20 1.20 1.08 1.20 14.11
APGPCL I - Unutilised capacity 0.00 - - - - - - - - - - - - 0.00
APGPCL II - Allocated capacity 2.08 4.15 4.29 4.15 4.29 4.29 4.15 4.23 4.15 4.29 4.29 3.88 4.29 50.46
APGPCL II - Unutilised capacity - - - - - - - - - - - - 0.00
Total APGPCL 5.31 5.49 5.31 5.49 5.49 5.31 5.41 5.31 5.49 5.49 4.96 5.49 64.57
IPPS
GVK - - - - - - - - - - - - 0.00
Spectrum - - - - - - - - - - - - 0.00
Kondapalli (Naphtha) - - - - - - - - - - - - 0.00
Kondapalli (Gas) - - - - - - - - - - - - 0.00
BSES - - - - - - - - - - - - 0.00
GVK Extension - - - - - - - - - - - - 0.00
Vemagiri - - - - - - - - - - - - 0.00
Gautami - - - - - - - - - - - - 0.00
Konaseema - - - - - - - - - - - - 0.00
0.00
TOTAL IPPS 0.00 0.00 0.00 0.00 0.00 0.00 0.00 0.00 0.00 0.00 0.00 0.00 0.00
NCE
NCE - Bio-Mass 4.37 4.23 5.01 4.39 5.22 4.23 5.01 4.39 5.22 4.23 5.01 4.39 5.22 56.52
NCE - Bagasse 2.78 0.13 - - - 0.13 - - - 0.13 - - - 0.40
NCE - Municipal Waste to Energy 3.83 5.38 5.38 5.38 5.38 5.38 5.38 5.38 5.38 5.38 5.38 5.38 5.38 64.57
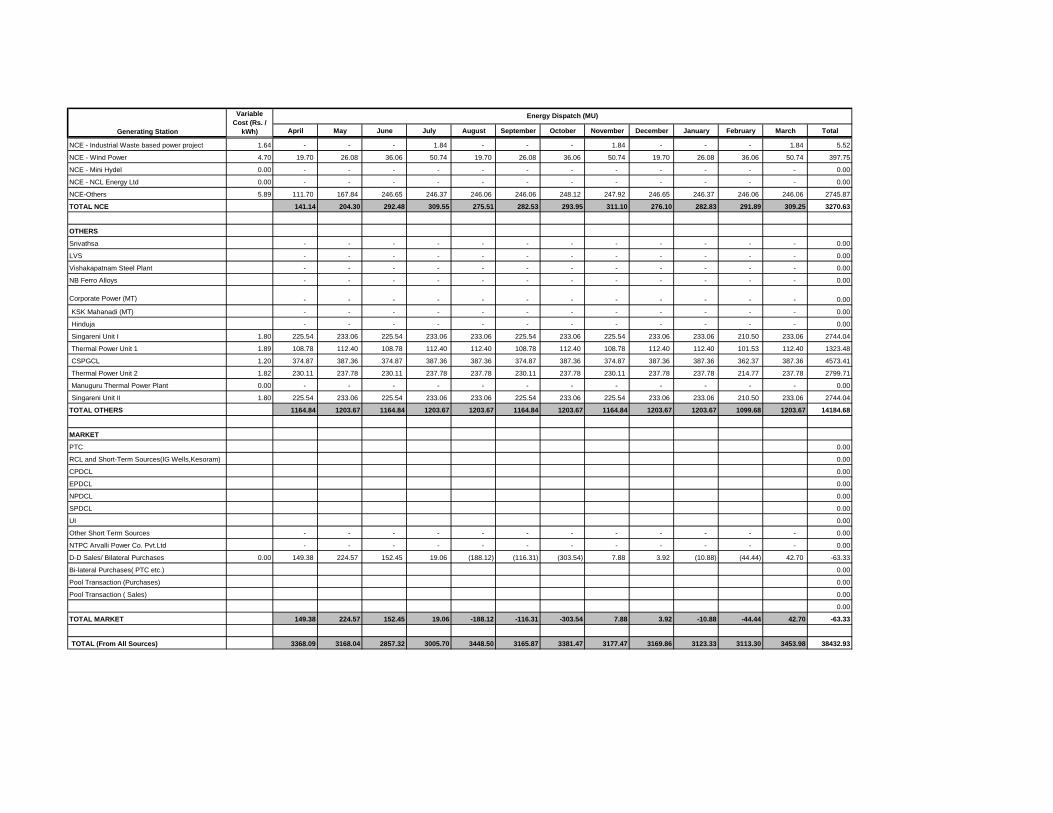
April May June July August September October November December January February March TotalGenerating Station
Variable
Cost (Rs. /
kWh)
Energy Dispatch (MU)
NCE - Industrial Waste based power project 1.64 - - - 1.84 - - - 1.84 - - - 1.84 5.52
NCE - Wind Power 4.70 19.70 26.08 36.06 50.74 19.70 26.08 36.06 50.74 19.70 26.08 36.06 50.74 397.75
NCE - Mini Hydel 0.00 - - - - - - - - - - - - 0.00
NCE - NCL Energy Ltd 0.00 - - - - - - - - - - - - 0.00
NCE-Others 5.89 111.70 167.84 246.65 246.37 246.06 246.06 248.12 247.92 246.65 246.37 246.06 246.06 2745.87
TOTAL NCE 141.14 204.30 292.48 309.55 275.51 282.53 293.95 311.10 276.10 282.83 291.89 309.25 3270.63
OTHERS
Srivathsa - - - - - - - - - - - - 0.00
LVS - - - - - - - - - - - - 0.00
Vishakapatnam Steel Plant - - - - - - - - - - - - 0.00
NB Ferro Alloys - - - - - - - - - - - - 0.00
Corporate Power (MT) - - - - - - - - - - - - 0.00
KSK Mahanadi (MT) - - - - - - - - - - - - 0.00
Hinduja - - - - - - - - - - - - 0.00
Singareni Unit I 1.80 225.54 233.06 225.54 233.06 233.06 225.54 233.06 225.54 233.06 233.06 210.50 233.06 2744.04
Thermal Power Unit 1 1.89 108.78 112.40 108.78 112.40 112.40 108.78 112.40 108.78 112.40 112.40 101.53 112.40 1323.48
CSPGCL 1.20 374.87 387.36 374.87 387.36 387.36 374.87 387.36 374.87 387.36 387.36 362.37 387.36 4573.41
Thermal Power Unit 2 1.82 230.11 237.78 230.11 237.78 237.78 230.11 237.78 230.11 237.78 237.78 214.77 237.78 2799.71
Manuguru Thermal Power Plant 0.00 - - - - - - - - - - - - 0.00
Singareni Unit II 1.80 225.54 233.06 225.54 233.06 233.06 225.54 233.06 225.54 233.06 233.06 210.50 233.06 2744.04
TOTAL OTHERS 1164.84 1203.67 1164.84 1203.67 1203.67 1164.84 1203.67 1164.84 1203.67 1203.67 1099.68 1203.67 14184.68
MARKET
PTC 0.00
RCL and Short-Term Sources(IG Wells,Kesoram) 0.00
CPDCL 0.00
EPDCL 0.00
NPDCL 0.00
SPDCL 0.00
UI 0.00
Other Short Term Sources - - - - - - - - - - - - 0.00
NTPC Arvalli Power Co. Pvt.Ltd - - - - - - - - - - - - 0.00
D-D Sales/ Bilateral Purchases 0.00 149.38 224.57 152.45 19.06 (188.12) (116.31) (303.54) 7.88 3.92 (10.88) (44.44) 42.70 -63.33
Bi-lateral Purchases( PTC etc.) 0.00
Pool Transaction (Purchases) 0.00
Pool Transaction ( Sales) 0.00
0.00
TOTAL MARKET 149.38 224.57 152.45 19.06 -188.12 -116.31 -303.54 7.88 3.92 -10.88 -44.44 42.70 -63.33
TOTAL (From All Sources) 3368.09 3168.04 2857.32 3005.70 3448.50 3165.87 3381.47 3177.47 3169.86 3123.33 3113.30 3453.98 38432.93

Form 5 Revenue from Current Tariffs
Gross Revenue Incentives Net Revenue SurchargeAdditional
surcharge
Gross
RevenueIncentives Net Revenue Surcharge
Additional
surcharge
LT Category 5620.64 0.00 5620.64 0.00 0.00 0.00 5620.64 5297.66 0.00 5297.66 0.00 0.00 0.00 5297.66
Category I (A&B) - Domestic 2453.91 0.00 2453.91 2453.91 2454.24 0.00 2454.24 2454.24
Category II (A,B,C & D) - Non-domestic/Commercial 1927.92 0.00 1927.92 1927.92 1815.73 0.00 1815.73 1815.73
Category III (A & B) - Industrial 716.07 0.00 716.07 716.07 569.46 0.00 569.46 569.46
Category IV (A,B &C) - Cottage Industries & Dhobighats 7.08 0.00 7.08 7.08 3.74 0.00 3.74 3.74
Category V (A,B & C) - Irrigation and Agriculture 48.29 0.00 48.29 48.29 25.68 0.00 25.68 25.68
Category VI (A & B) - Local Bodies, St. Lighting & PWS 415.65 0.00 415.65 415.65 389.90 0.00 389.90 389.90
Category VII (A & B) - General Purpose 50.77 0.00 50.77 50.77 37.10 0.00 37.10 37.10
Category VIII (A & B) -Temporary Supply 0.95 0.00 0.95 0.95 1.82 0.00 1.82 1.82
0.00 0.00 0.00 0.00 0.00 0.00
HT Category at 11 KV3218.56 0.00 3218.56 0.00 0.00 0.00 3218.56 3177.59 0.00 3177.59 0.00 0.00 0.00 3177.59
HT-I Industry Segregated 2025.23 0.00 2025.23 2025.23 1990.17 0.00 1990.17 1990.17
HT-I (B) Ferro-Alloys 3.85 0.00 3.85 3.85 0.00 0.00 0.00 0.00
HT-II - Others 1035.30 0.00 1035.30 1035.30 1033.65 0.00 1033.65 1033.65
HT-III Airports, Railways and Bustations 5.97 0.00 5.97 5.97 4.26 0.00 4.26 4.26
HT-IVA Lift Irrigation & Agriculture 21.92 0.00 21.92 21.92 22.77 0.00 22.77 22.77
HT - IV (B) Composite P.W.S Schemes 28.11 0.00 28.11 28.11 18.81 0.00 18.81 18.81
HT-VI Townships and Residential Colonies 53.92 0.00 53.92 53.92 44.39 0.00 44.39 44.39
HT-VII - Green Power 0.00 0.00 0.00 0.00 0.00 0.00 0.00 0.00
HT - Temporary Supply 44.26 0.00 44.26 44.26 63.54 0.00 63.54 63.54
RESCOs 0.00 0.00 0.00 0.00 0.00 0.00 0.00 0.00
HT Category at 33 KV3145.52 0.00 3145.52 0.00 0.00 0.00 3145.52 3011.21 0.00 3011.21 0.00 0.00 0.00 3011.21
HT-I Industry Segregated 2566.47 0.00 2566.47 2566.47 2514.79 0.00 2514.79 2514.79
Revenue from Current Tariffs (Rs. Crs.)
Base Year 2014-15
Retail Supply (Regulated Business) Surcharges (Open Access) Grid
Support
Charges
Total Revenue
Retail Supply (Regulated Business) Surcharges (Open Access) Grid
Support
Charges
Total Revenue
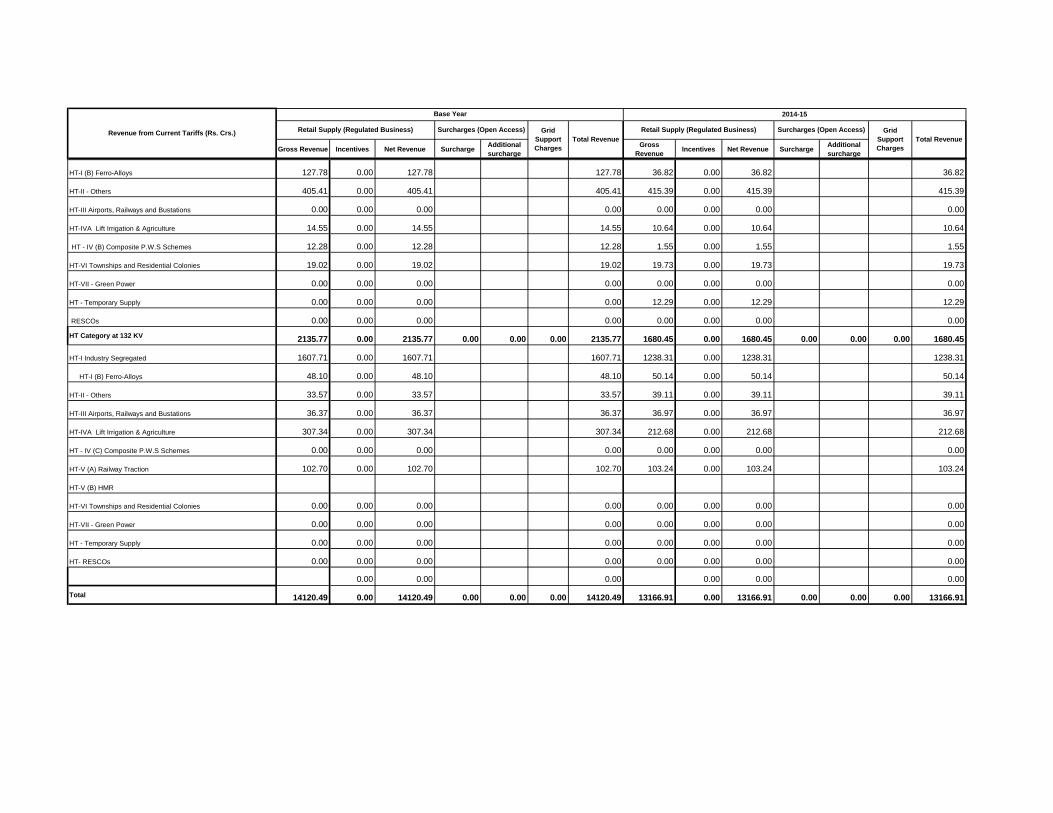
Gross Revenue Incentives Net Revenue SurchargeAdditional
surcharge
Gross
RevenueIncentives Net Revenue Surcharge
Additional
surcharge
Revenue from Current Tariffs (Rs. Crs.)
Base Year 2014-15
Retail Supply (Regulated Business) Surcharges (Open Access) Grid
Support
Charges
Total Revenue
Retail Supply (Regulated Business) Surcharges (Open Access) Grid
Support
Charges
Total Revenue
HT-I (B) Ferro-Alloys 127.78 0.00 127.78 127.78 36.82 0.00 36.82 36.82
HT-II - Others 405.41 0.00 405.41 405.41 415.39 0.00 415.39 415.39
HT-III Airports, Railways and Bustations 0.00 0.00 0.00 0.00 0.00 0.00 0.00 0.00
HT-IVA Lift Irrigation & Agriculture 14.55 0.00 14.55 14.55 10.64 0.00 10.64 10.64
HT - IV (B) Composite P.W.S Schemes 12.28 0.00 12.28 12.28 1.55 0.00 1.55 1.55
HT-VI Townships and Residential Colonies 19.02 0.00 19.02 19.02 19.73 0.00 19.73 19.73
HT-VII - Green Power 0.00 0.00 0.00 0.00 0.00 0.00 0.00 0.00
HT - Temporary Supply 0.00 0.00 0.00 0.00 12.29 0.00 12.29 12.29
RESCOs 0.00 0.00 0.00 0.00 0.00 0.00 0.00 0.00
HT Category at 132 KV2135.77 0.00 2135.77 0.00 0.00 0.00 2135.77 1680.45 0.00 1680.45 0.00 0.00 0.00 1680.45
HT-I Industry Segregated 1607.71 0.00 1607.71 1607.71 1238.31 0.00 1238.31 1238.31
HT-I (B) Ferro-Alloys 48.10 0.00 48.10 48.10 50.14 0.00 50.14 50.14
HT-II - Others 33.57 0.00 33.57 33.57 39.11 0.00 39.11 39.11
HT-III Airports, Railways and Bustations 36.37 0.00 36.37 36.37 36.97 0.00 36.97 36.97
HT-IVA Lift Irrigation & Agriculture 307.34 0.00 307.34 307.34 212.68 0.00 212.68 212.68
HT - IV (C) Composite P.W.S Schemes 0.00 0.00 0.00 0.00 0.00 0.00 0.00 0.00
HT-V (A) Railway Traction 102.70 0.00 102.70 102.70 103.24 0.00 103.24 103.24
HT-V (B) HMR
HT-VI Townships and Residential Colonies 0.00 0.00 0.00 0.00 0.00 0.00 0.00 0.00
HT-VII - Green Power 0.00 0.00 0.00 0.00 0.00 0.00 0.00 0.00
HT - Temporary Supply 0.00 0.00 0.00 0.00 0.00 0.00 0.00 0.00
HT- RESCOs 0.00 0.00 0.00 0.00 0.00 0.00 0.00 0.00
0.00 0.00 0.00 0.00 0.00 0.00
Total 14120.49 0.00 14120.49 0.00 0.00 0.00 14120.49 13166.91 0.00 13166.91 0.00 0.00 0.00 13166.91

Form 5
LT Category
Category I (A&B) - Domestic
Category II (A,B,C & D) - Non-domestic/Commercial
Category III (A & B) - Industrial
Category IV (A,B &C) - Cottage Industries & Dhobighats
Category V (A,B & C) - Irrigation and Agriculture
Category VI (A & B) - Local Bodies, St. Lighting & PWS
Category VII (A & B) - General Purpose
Category VIII (A & B) -Temporary Supply
HT Category at 11 KV
HT-I Industry Segregated
HT-I (B) Ferro-Alloys
HT-II - Others
HT-III Airports, Railways and Bustations
HT-IVA Lift Irrigation & Agriculture
HT - IV (B) Composite P.W.S Schemes
HT-VI Townships and Residential Colonies
HT-VII - Green Power
HT - Temporary Supply
RESCOs
HT Category at 33 KV
HT-I Industry Segregated
Revenue from Current Tariffs (Rs. Crs.)
Gross Revenue Incentives Net Revenue SurchargeAdditional
surcharge
6185.31 0.00 6185.31 0.00 0.00 0.00 6185.31
2861.78 0.00 2861.78 2861.78
2184.75 0.00 2184.75 2184.75
621.67 0.00 621.67 621.67
3.80 0.00 3.80 3.80
44.26 0.00 44.26 44.26
420.87 0.00 420.87 420.87
45.34 0.00 45.34 45.34
2.84 0.00 2.84 2.84
0.00 0.00 0.00
3778.80 0.00 3778.80 6.16 0.00 0.00 3784.96
2330.23 0.00 2330.23 6.16 2336.39
0.00 0.00 0.00 0.00
1293.37 0.00 1293.37 1293.37
6.08 0.00 6.08 6.08
12.45 0.00 12.45 12.45
28.05 0.00 28.05 28.05
51.73 0.00 51.73 51.73
0.00 0.00 0.00 0.00
56.89 0.00 56.89 56.89
0.00 0.00 0.00 0.00
3274.44 0.00 3274.44 0.00 0.00 0.00 3274.44
2742.21 0.00 2742.21 2742.21
2015-16
Surcharges (Open Access) Grid
Support
Charges
Total Revenue
Retail Supply (Regulated Business)
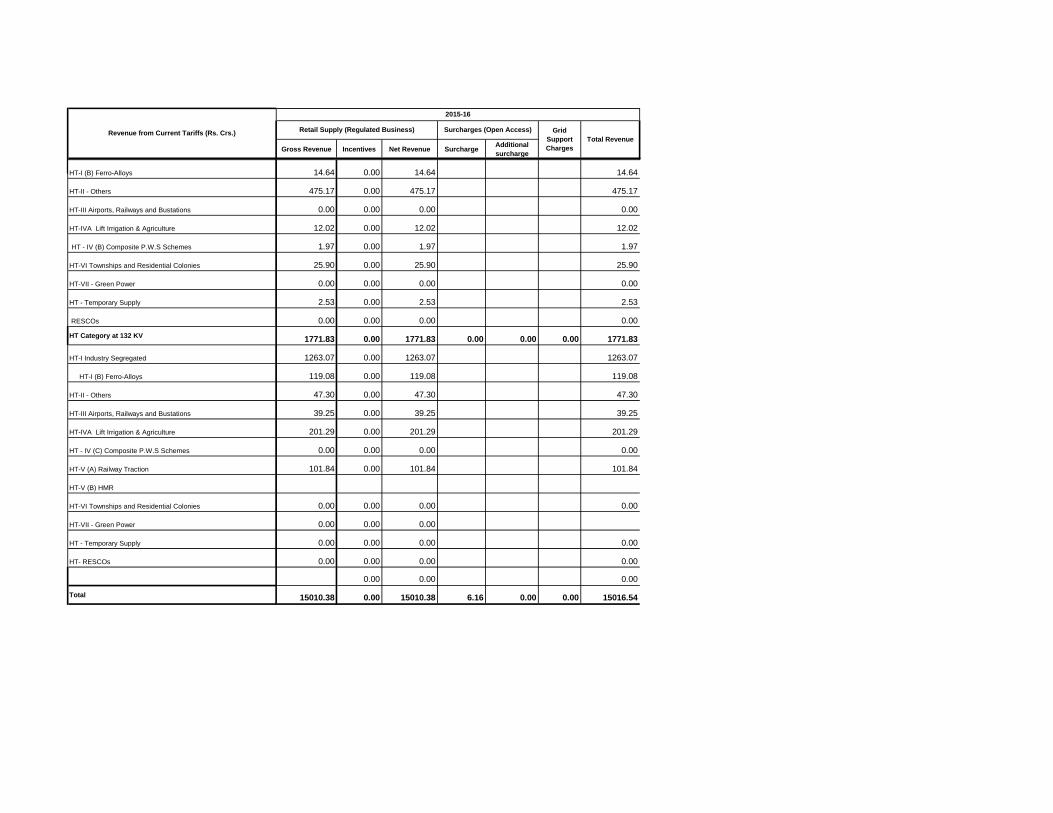
LT Category
Revenue from Current Tariffs (Rs. Crs.)
HT-I (B) Ferro-Alloys
HT-II - Others
HT-III Airports, Railways and Bustations
HT-IVA Lift Irrigation & Agriculture
HT - IV (B) Composite P.W.S Schemes
HT-VI Townships and Residential Colonies
HT-VII - Green Power
HT - Temporary Supply
RESCOs
HT Category at 132 KV
HT-I Industry Segregated
HT-I (B) Ferro-Alloys
HT-II - Others
HT-III Airports, Railways and Bustations
HT-IVA Lift Irrigation & Agriculture
HT - IV (C) Composite P.W.S Schemes
HT-V (A) Railway Traction
HT-V (B) HMR
HT-VI Townships and Residential Colonies
HT-VII - Green Power
HT - Temporary Supply
HT- RESCOs
Total
Gross Revenue Incentives Net Revenue SurchargeAdditional
surcharge
2015-16
Surcharges (Open Access) Grid
Support
Charges
Total Revenue
Retail Supply (Regulated Business)
14.64 0.00 14.64 14.64
475.17 0.00 475.17 475.17
0.00 0.00 0.00 0.00
12.02 0.00 12.02 12.02
1.97 0.00 1.97 1.97
25.90 0.00 25.90 25.90
0.00 0.00 0.00 0.00
2.53 0.00 2.53 2.53
0.00 0.00 0.00 0.00
1771.83 0.00 1771.83 0.00 0.00 0.00 1771.83
1263.07 0.00 1263.07 1263.07
119.08 0.00 119.08 119.08
47.30 0.00 47.30 47.30
39.25 0.00 39.25 39.25
201.29 0.00 201.29 201.29
0.00 0.00 0.00 0.00
101.84 0.00 101.84 101.84
0.00 0.00 0.00 0.00
0.00 0.00 0.00
0.00 0.00 0.00 0.00
0.00 0.00 0.00 0.00
0.00 0.00 0.00
15010.38 0.00 15010.38 6.16 0.00 0.00 15016.54

Form 5 a
Incentives at current Tariffs
Base Year 10003 10003
Data LinkNo. of
consumers
Incentive
Amount
LT Category Form-7 0 0.00
Category I (A&B) - Domestic
Category II (A & B) - Non-domestic/Commercial
Category LT-II (C) Advertising Hoardings
Category III (A & B) - Industrial
Category IV (A,B &C) - Cottage Industries & Dhobighats
Category V (A, B & C) - Irrigation and Agriculture
Category VI (A & B) - Local Bodies, St. Lighting & PWS
Category VII (A & B) - General Purpose
Category VIII (A & B) -Temporary Supply
HT Category at 11 KV 0 0.00
HT-I Industry Segregated
HT-I (B) Ferro-Alloys
HT-II - Others
HT-III Aviation activity at Airports
HT-IV A Lift Irrigation & Agriculture
HT - IV B Composite P.W.S Schemes
HT-VI Townships and Residential Colonies
HT-VII - Green Power
HT-Temporary Supply
HT- RESCOs
HT Category at 33 KV 0 0.00
HT-I Industry Segregated
Consumer Category
Load Factor Incentives
RemarksTotal
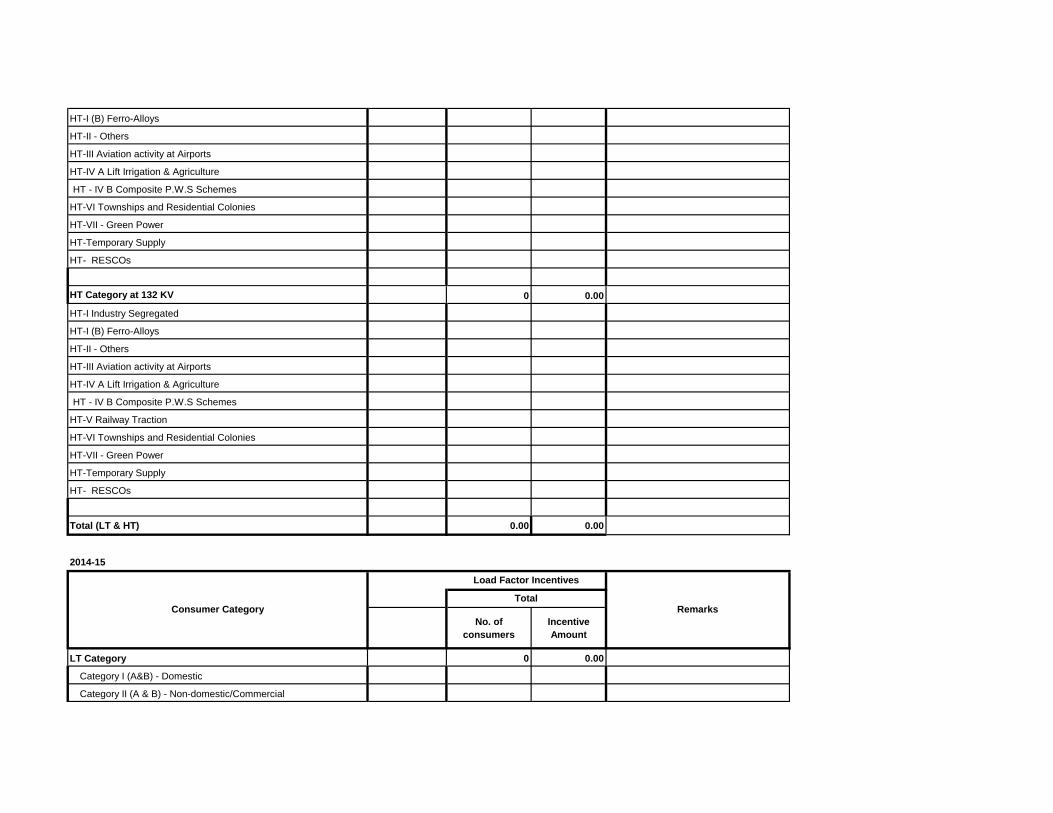
HT-I (B) Ferro-Alloys
HT-II - Others
HT-III Aviation activity at Airports
HT-IV A Lift Irrigation & Agriculture
HT - IV B Composite P.W.S Schemes
HT-VI Townships and Residential Colonies
HT-VII - Green Power
HT-Temporary Supply
HT- RESCOs
HT Category at 132 KV 0 0.00
HT-I Industry Segregated
HT-I (B) Ferro-Alloys
HT-II - Others
HT-III Aviation activity at Airports
HT-IV A Lift Irrigation & Agriculture
HT - IV B Composite P.W.S Schemes
HT-V Railway Traction
HT-VI Townships and Residential Colonies
HT-VII - Green Power
HT-Temporary Supply
HT- RESCOs
Total (LT & HT) 0.00 0.00
2014-15
No. of
consumers
Incentive
Amount
LT Category 0 0.00
Category I (A&B) - Domestic
Category II (A & B) - Non-domestic/Commercial
Consumer Category
Load Factor Incentives
RemarksTotal

Category LT-II (C) Advertising Hoardings
Category III (A & B) - Industrial
Category IV (A,B &C) - Cottage Industries & Dhobighats
Category V (A, B & C) - Irrigation and Agriculture
Category VI (A & B) - Local Bodies, St. Lighting & PWS
Category VII (A & B) - General Purpose
Category VIII (A & B) -Temporary Supply
HT Category at 11 KV 0 0.00
HT-I Industry Segregated
HT-I (B) Ferro-Alloys
HT-II - Others
HT-III Aviation activity at Airports
HT-IV A Lift Irrigation & Agriculture
HT - IV B Composite P.W.S Schemes
HT-VI Townships and Residential Colonies
HT-VII - Green Power
HT-Temporary Supply
HT- RESCOs
HT Category at 33 KV 0 0.00
HT-I Industry Segregated
HT-I (B) Ferro-Alloys
HT-II - Others
HT-III Aviation activity at Airports
HT-IV A Lift Irrigation & Agriculture
HT - IV B Composite P.W.S Schemes
HT-VI Townships and Residential Colonies
HT-VII - Green Power
HT-Temporary Supply
HT- RESCOs
HT Category at 132 KV 0 0.00
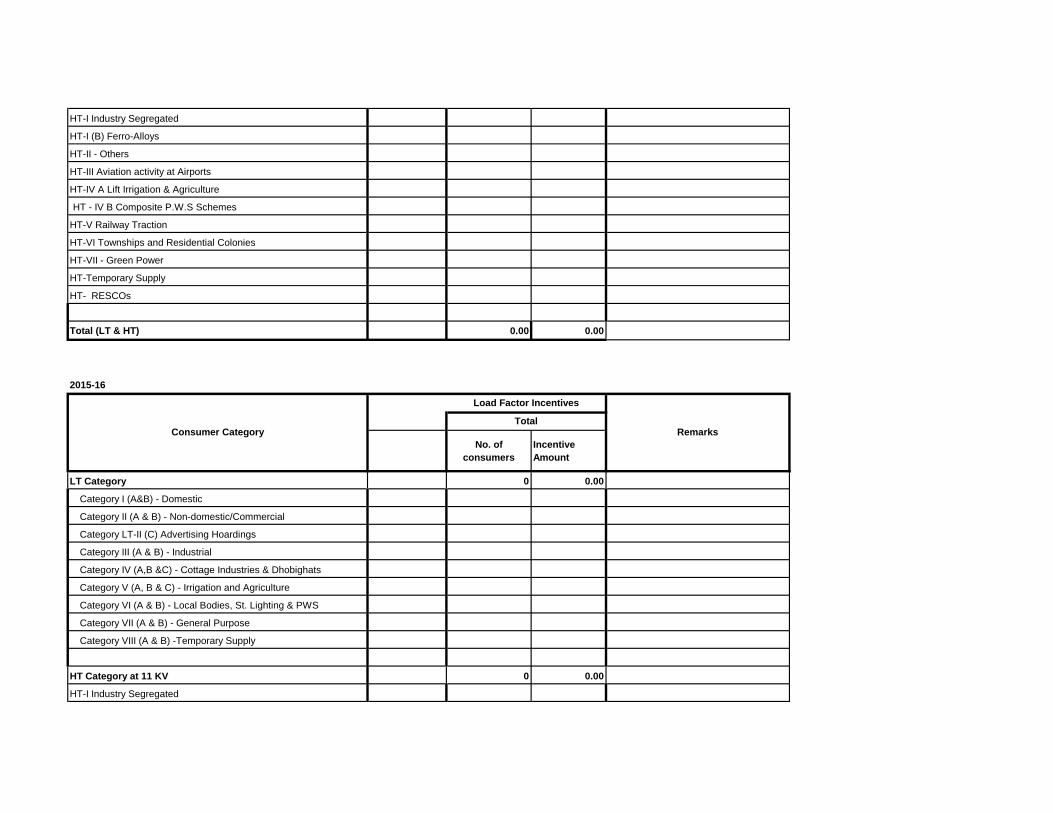
HT-I Industry Segregated
HT-I (B) Ferro-Alloys
HT-II - Others
HT-III Aviation activity at Airports
HT-IV A Lift Irrigation & Agriculture
HT - IV B Composite P.W.S Schemes
HT-V Railway Traction
HT-VI Townships and Residential Colonies
HT-VII - Green Power
HT-Temporary Supply
HT- RESCOs
Total (LT & HT) 0.00 0.00
2015-16
No. of
consumers
Incentive
Amount
LT Category 0 0.00
Category I (A&B) - Domestic
Category II (A & B) - Non-domestic/Commercial
Category LT-II (C) Advertising Hoardings
Category III (A & B) - Industrial
Category IV (A,B &C) - Cottage Industries & Dhobighats
Category V (A, B & C) - Irrigation and Agriculture
Category VI (A & B) - Local Bodies, St. Lighting & PWS
Category VII (A & B) - General Purpose
Category VIII (A & B) -Temporary Supply
HT Category at 11 KV 0 0.00
HT-I Industry Segregated
Consumer Category
Load Factor Incentives
RemarksTotal

HT-I (B) Ferro-Alloys
HT-II - Others
HT-III Airports, Railways and Bustations
HT-IV A Lift Irrigation and Agriculture
HT - IV (B) Composite P.W.S Schemes
HT-VI Townships and Residential Colonies
HT-VII - Green Power
HT-Temporary Supply
HT- RESCOs
HT Category at 33 KV 0 0.00
HT-I Industry Segregated
HT-I (B) Ferro-Alloys
HT-II - Others
HT-III Airports, Railways and Bustations
HT-IV A Lift Irrigation and Agriculture
HT - IV (B) Composite P.W.S Schemes
HT-VI Townships and Residential Colonies
HT-VII - Green Power
HT-Temporary Supply
HT- RESCOs
HT Category at 132 KV 0 0.00
HT-I Industry Segregated
HT-I (B) Ferro-Alloys
HT-II - Others
HT-III Airports, Railways and Bustations
HT-IV A Lift Irrigation and Agriculture
HT - IV (B) Composite P.W.S Schemes
HT-V Railway Traction
HT-VI Townships and Residential Colonies
HT-VII - Green Power
HT-Temporary Supply

HT- RESCOs
Total (LT & HT) 0.00 0.00
2016-17
No. of
consumers
Incentive
Amount
LT Category 0 0.00
Category I (A&B) - Domestic
Category II (A,B,C & D) - Non-domestic/Commercial
Category III - Industrial
Category IV (A & B) - Cottage Industries & Dhobighats
Category V (A, B & C) - Irrigation and Agriculture
Category VI (A & B) - Local Bodies, St. Lighting & PWS
Category VII (A & B) - General Purpose
Category VIII -Temporary Supply
HT Category at 11 KV 0 0.00
HT-I Industry Segregated
HT-I (B) Ferro-Alloys
HT-II - Others
HT-III Airports, Railways and Bustations
HT-IV (A) Lift Irrigation and Agriculture
HT - IV (B) Composite P.W.S Schemes
HT-VI Townships and Residential Colonies
HT-Temporary Supply
HT- RESCOs
HT Category at 33 KV 0 0.00
HT-I Industry Segregated
Consumer Category
Load Factor Incentives
RemarksTotal

HT-I (B) Ferro-Alloys
HT-II - Others
HT-III Airports, Railways and Bustations
HT-IV (A) Lift Irrigation and Agriculture
HT - IV (B) Composite P.W.S Schemes
HT-VI Townships and Residential Colonies
HT-Temporary Supply
HT- RESCOs
HT Category at 132 KV 0 0.00
HT-I Industry Segregated
HT-I (B) Ferro-Alloys
HT-II - Others
HT-III Airports, Railways and Bustations
HT-IV (A) Lift Irrigation and Agriculture
HT - IV (B) Composite P.W.S Schemes
HT-V (A) Railway Traction
HT-V (B) HMR
HT-VI Townships and Residential Colonies
HT-Temporary Supply
HT- RESCOs
Total (LT & HT) 0.00 0.00
2017-18
No. of
consumers
Incentive
Amount
LT Category 0 0.00
Category I (A&B) - Domestic
Category II (A,B,C & D) - Non-domestic/Commercial
Consumer Category
Load Factor Incentives
RemarksTotal
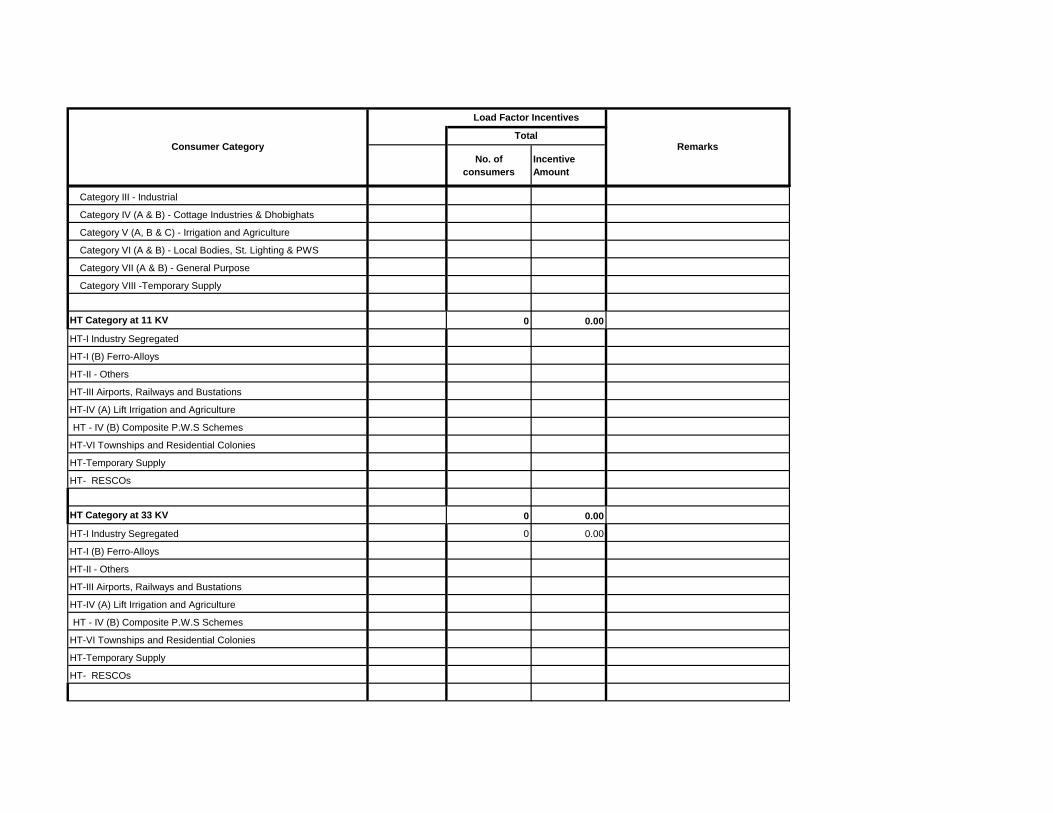
No. of
consumers
Incentive
Amount
Consumer Category
Load Factor Incentives
RemarksTotal
Category III - Industrial
Category IV (A & B) - Cottage Industries & Dhobighats
Category V (A, B & C) - Irrigation and Agriculture
Category VI (A & B) - Local Bodies, St. Lighting & PWS
Category VII (A & B) - General Purpose
Category VIII -Temporary Supply
HT Category at 11 KV 0 0.00
HT-I Industry Segregated
HT-I (B) Ferro-Alloys
HT-II - Others
HT-III Airports, Railways and Bustations
HT-IV (A) Lift Irrigation and Agriculture
HT - IV (B) Composite P.W.S Schemes
HT-VI Townships and Residential Colonies
HT-Temporary Supply
HT- RESCOs
HT Category at 33 KV 0 0.00
HT-I Industry Segregated 0 0.00
HT-I (B) Ferro-Alloys
HT-II - Others
HT-III Airports, Railways and Bustations
HT-IV (A) Lift Irrigation and Agriculture
HT - IV (B) Composite P.W.S Schemes
HT-VI Townships and Residential Colonies
HT-Temporary Supply
HT- RESCOs

No. of
consumers
Incentive
Amount
Consumer Category
Load Factor Incentives
RemarksTotal
HT Category at 132 KV 0 0.00
HT-I Industry Segregated
HT-I (B) Ferro-Alloys
HT-II - Others
HT-III Airports, Railways and Bustations
HT-IV (A) Lift Irrigation and Agriculture
HT - IV (B) Composite P.W.S Schemes
HT-V (A) Railway Traction
HT-V (B) HMR
HT-VI Townships and Residential Colonies
HT-Temporary Supply
HT- RESCOs
Total (LT & HT) 0.00 0.00

Form 5c Consumers served under Open Access as per Section 42 and Section 49 of E Act
The form refers to revenue from Open Access consumers served within or outside area of supply of the licensee
Base Year
Name of Area : Name of Area :
Revenue from Current Tariffs (Rs. Crs.) Detail LinksNumber of
consumers
Sales
(MU)
Average Supply
Rate
( Rs/kWh)
Amount
( In Rs crores)
Number of
consumers
Sales
(MU)
Average Supply
Rate
( Rs/kWh)
Amount
( In Rs crores)
LT Category 0 0.00 0.00 0 0.00 0.00
Category I (A&B) - Domestic
Category II (A,B & C) - Non-domestic/Commercial
Category III (A & B) - Industrial
Category IV (A,B &C) - Cottage Industries & Dhobighats
Category V (A, B & C) - Irrigation and Agriculture
Category V (B) - Agriculture (Tatkal)
Category VI (A & B) - Local Bodies, St. Lighting & PWS
Category VII (A & B) - General Purpose
Category VIII (A & B) -Temporary Supply
HT Category at 11 KV 0 0.00 0.00 0 0.00 0.00
HT-I Industry Segregated
HT-I (B) Ferro-Alloys
HT-II - Others
HT-III Aviation activity at Airports
HT-IV A Govt. Lift Irrigation Schemes
HT-IV B Agriculture
HT - IV (C) Composite P.W.S Schemes
HT-VI Townships and Residential Colonies
HT-VII - Green Power
HT- VIII - RESCOs
HT - IX -Temporary Supply
HT Category at 33 KV 0 0.00 0.00 0 0.00 0.00
HT-I Industry Segregated
HT-I Industrial Time of Day Incentive
HT-I Industrial Time-of-Day Tariff (10 AM to 2 PM)
HT-I (B) Ferro-Alloys
HT-II - Others
HT-III Aviation activity at Airports
HT-IV A Govt. Lift Irrigation Schemes
HT-IV B Agriculture
HT - IV (C) Composite P.W.S Schemes
HT-VI Townships and Residential Colonies
HT-VII - Green Power
Consumers to be classified as per their geographical area. Details for each area to be entered in the header in the field Name of Area (yellow cells in headers). Areas may be classified as
districts, regions or states or other licensee’s area of supply or any other suitable combination.
Area 1 Area 2
Zuari Cements, Kadapa

HT- VIII - RESCOs
HT - IX -Temporary Supply
HT Category at 132 KV 0 0.00 0.00 0 0.00 0.00
HT-I Industry Segregated
HT-I (B) Ferro-Alloys
HT-II - Others
HT-III Aviation activity at Airports
HT-IV A Govt. Lift Irrigation Schemes
HT-IV B Agriculture
HT- IV (C) Composite P.W.S Schemes
HT-V Railway Traction
HT-VI Townships and Residential Colonies
HT-VII - Green Power
HT- VIII - RESCOs
HT - IX -Temporary Supply
Total 0 0.00 0.00 0 0.00 0.00
2014-15
Name of Area : Name of Area :
Revenue from Current Tariffs (Rs. Crs.) Detail LinksNumber of
consumers
Sales
(MU)
Average Supply
Rate
( Rs/kWh)
Amount
( In Rs crores)
Number of
consumers
Sales
(MU)
Average Supply
Rate
( Rs/kWh)
Amount
( In Rs crores)
LT Category 0 0.00 0.00 0 0.00 0.00
Category I (A&B) - Domestic
Category II (A,B) - Non-domestic/Commercial
Category LT-II (C) Advertising Hoardings
Category III (A & B) - Industrial
Category IV (A,B &C) - Cottage Industries & Dhobighats
Category V (A, B & C) - Irrigation and Agriculture
Category V (B) - Agriculture (Tatkal)
Category VI (A & B) - Local Bodies, St. Lighting & PWS
Category VII (A & B) - General Purpose
Category VIII (A & B) -Temporary Supply
HT Category at 11 KV 0 0.00 0.00 0 0.00 0.00
HT-I Industry Segregated
HT-I (B) Ferro-Alloys
HT-II - Others
HT-III Aviation activity at Airports
HT-IV A Govt. Lift Irrigation Schemes
HT-IV B Agriculture
HT - IV (C) Composite P.W.S Schemes
HT-VI Townships and Residential Colonies
Zuari Cements, Kadapa
Area 1 Area 2

Name of Area : Name of Area :
Revenue from Current Tariffs (Rs. Crs.) Detail LinksNumber of
consumers
Sales
(MU)
Average Supply
Rate
( Rs/kWh)
Amount
( In Rs crores)
Number of
consumers
Sales
(MU)
Average Supply
Rate
( Rs/kWh)
Amount
( In Rs crores)
Zuari Cements, Kadapa
HT-VII - Green Power
HT- VIII - RESCOs
HT - IX -Temporary Supply
HT Category at 33 KV 0 0.00 0.00 0 0.00 0.00
HT-I Industry Segregated
HT-I (B) Ferro-Alloys
HT-II - Others
HT-III Aviation activity at Airports
HT-IV A Govt. Lift Irrigation Schemes
HT-IV B Agriculture
HT - IV (C) Composite P.W.S Schemes
HT-VI Townships and Residential Colonies
HT-VII - Green Power
HT- VIII - RESCOs
HT - IX -Temporary Supply
HT Category at 132 KV 0 0.00 0.00 0.00 0 0.00 0.00
HT-I Industry Segregated
HT-I (B) Ferro-Alloys
HT-II - Others
HT-III Aviation activity at Airports
HT-IV A Govt. Lift Irrigation Schemes
HT-IV B Agriculture
HT- IV (C) Composite P.W.S Schemes
HT-V Railway Traction
HT-VI Townships and Residential Colonies
HT-VII - Green Power
HT- VIII - RESCOs
HT - IX -Temporary Supply
Total 0 0.00 0.00 0 0.00 0.00
2015-16
Name of Area : Name of Area :
Revenue from Current Tariffs (Rs. Crs.) Detail LinksNumber of
consumers
Sales
(MU)
Average Supply
Rate
( Rs/kWh)
Amount
( In Rs crores)
Number of
consumers
Sales
(MU)
Average Supply
Rate
( Rs/kWh)
Amount
( In Rs crores)
LT Category 0 0.00 0.00 0 0.00 0.00
Category I (A&B) - Domestic
Area 1 Area 2

Name of Area : Name of Area :
Revenue from Current Tariffs (Rs. Crs.) Detail LinksNumber of
consumers
Sales
(MU)
Average Supply
Rate
( Rs/kWh)
Amount
( In Rs crores)
Number of
consumers
Sales
(MU)
Average Supply
Rate
( Rs/kWh)
Amount
( In Rs crores)
Zuari Cements, Kadapa
Category II (A,B & C) - Non-domestic/Commercial
Category III (A & B) - Industrial
Category IV (A,B &C) - Cottage Industries & Dhobighats
Category V (A, B & C) - Irrigation and Agriculture
Category V (B) - Agriculture (Tatkal)
Category VI (A & B) - Local Bodies, St. Lighting & PWS
Category VII (A & B) - General Purpose
Category VIII (A & B) -Temporary Supply
HT Category at 11 KV 0 0.00 0.00 0 0.00 0.00
HT-I Industry Segregated
HT-I (B) Ferro-Alloys
HT-II - Others
HT-III Aviation activity at Airports
HT-IV A Govt. Lift Irrigation Schemes
HT-IV B Agriculture
HT - IV (C) Composite P.W.S Schemes
HT-VI Townships and Residential Colonies
HT-VII - Green Power
HT- VIII - RESCOs
HT - IX -Temporary Supply
HT Category at 33 KV 0 0.00 0.00 0 0.00 0.00
HT-I Industry Segregated
HT-I Industrial Time of Day Incentive
HT-I Industrial Time-of-Day Tariff (10 AM to 2 PM)
HT-I (B) Ferro-Alloys
HT-II - Others
HT-III Aviation activity at Airports
HT-IV A Govt. Lift Irrigation Schemes
HT-IV B Agriculture
HT - IV (C) Composite P.W.S Schemes
HT-VI Townships and Residential Colonies
HT-VII - Green Power
HT- VIII - RESCOs
HT - IX -Temporary Supply
HT Category at 132 KV 0 0.00 0.00 0 0.00 0.00
HT-I Industry Segregated
HT-I (B) Ferro-Alloys
HT-II - Others
HT-III Aviation activity at Airports
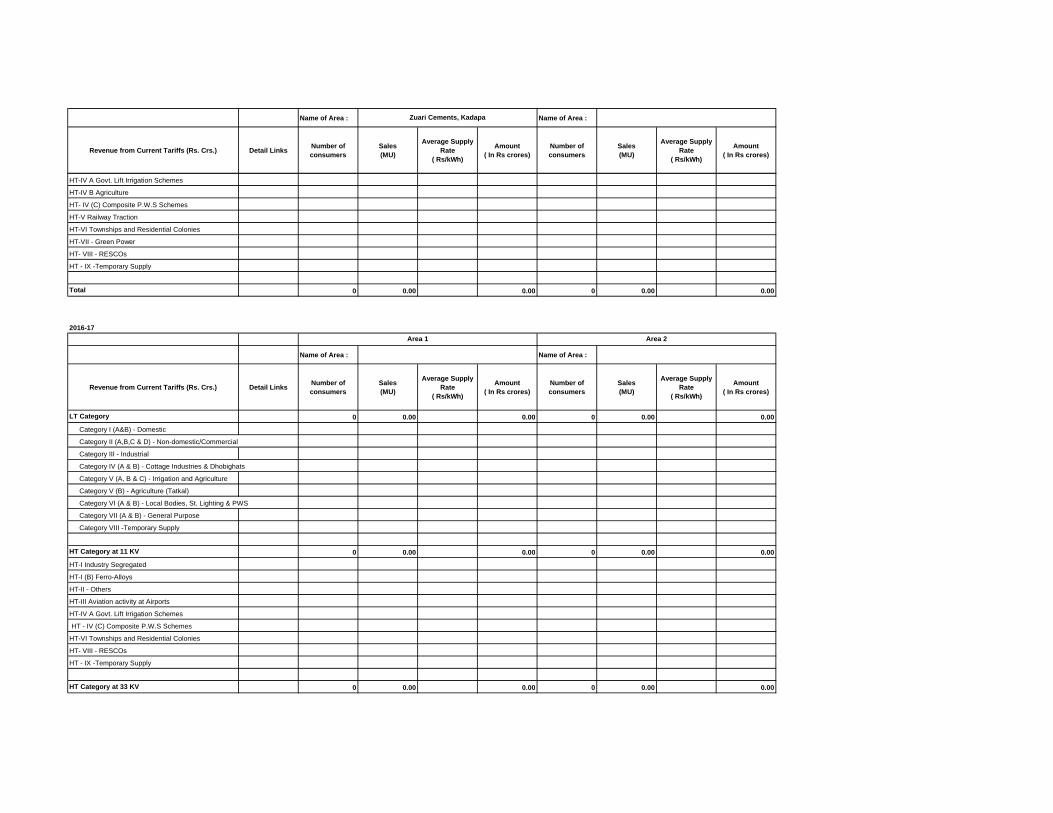
Name of Area : Name of Area :
Revenue from Current Tariffs (Rs. Crs.) Detail LinksNumber of
consumers
Sales
(MU)
Average Supply
Rate
( Rs/kWh)
Amount
( In Rs crores)
Number of
consumers
Sales
(MU)
Average Supply
Rate
( Rs/kWh)
Amount
( In Rs crores)
Zuari Cements, Kadapa
HT-IV A Govt. Lift Irrigation Schemes
HT-IV B Agriculture
HT- IV (C) Composite P.W.S Schemes
HT-V Railway Traction
HT-VI Townships and Residential Colonies
HT-VII - Green Power
HT- VIII - RESCOs
HT - IX -Temporary Supply
Total 0 0.00 0.00 0 0.00 0.00
2016-17
Name of Area : Name of Area :
Revenue from Current Tariffs (Rs. Crs.) Detail LinksNumber of
consumers
Sales
(MU)
Average Supply
Rate
( Rs/kWh)
Amount
( In Rs crores)
Number of
consumers
Sales
(MU)
Average Supply
Rate
( Rs/kWh)
Amount
( In Rs crores)
LT Category 0 0.00 0.00 0 0.00 0.00
Category I (A&B) - Domestic
Category II (A,B,C & D) - Non-domestic/Commercial
Category III - Industrial
Category IV (A & B) - Cottage Industries & Dhobighats
Category V (A, B & C) - Irrigation and Agriculture
Category V (B) - Agriculture (Tatkal)
Category VI (A & B) - Local Bodies, St. Lighting & PWS
Category VII (A & B) - General Purpose
Category VIII -Temporary Supply
HT Category at 11 KV 0 0.00 0.00 0 0.00 0.00
HT-I Industry Segregated
HT-I (B) Ferro-Alloys
HT-II - Others
HT-III Aviation activity at Airports
HT-IV A Govt. Lift Irrigation Schemes
HT - IV (C) Composite P.W.S Schemes
HT-VI Townships and Residential Colonies
HT- VIII - RESCOs
HT - IX -Temporary Supply
HT Category at 33 KV 0 0.00 0.00 0 0.00 0.00
Area 1 Area 2

Name of Area : Name of Area :
Revenue from Current Tariffs (Rs. Crs.) Detail LinksNumber of
consumers
Sales
(MU)
Average Supply
Rate
( Rs/kWh)
Amount
( In Rs crores)
Number of
consumers
Sales
(MU)
Average Supply
Rate
( Rs/kWh)
Amount
( In Rs crores)
Zuari Cements, Kadapa
HT-I Industry Segregated
HT-I (B) Ferro-Alloys
HT-II - Others
HT-III Aviation activity at Airports
HT-IV A Govt. Lift Irrigation Schemes
HT - IV (C) Composite P.W.S Schemes
HT-VI Townships and Residential Colonies
HT- VIII - RESCOs
HT - IX -Temporary Supply
HT Category at 132 KV 0 0.00 0.00 0 0.00 0.00
HT-I Industry Segregated
HT-I (B) Ferro-Alloys
HT-II - Others
HT-III Aviation activity at Airports
HT-IV A Govt. Lift Irrigation Schemes
HT- IV (C) Composite P.W.S Schemes
HT-V Railway Traction
HT-VI Townships and Residential Colonies
HT- VIII - RESCOs
HT - IX -Temporary Supply
Total 0 0.00 0.00 0 0.00 0.00
2017-18
Name of Area : Name of Area :
Revenue from Current Tariffs (Rs. Crs.) Detail LinksNumber of
consumers
Sales
(MU)
Average Supply
Rate
( Rs/kWh)
Amount
( In Rs crores)
Number of
consumers
Sales
(MU)
Average Supply
Rate
( Rs/kWh)
Amount
( In Rs crores)
LT Category 0 0.00 0.00 0 0.00 0.00
Category I (A&B) - Domestic
Category II (A,B,C & D) - Non-domestic/Commercial
Category III - Industrial
Category IV (A & B) - Cottage Industries & Dhobighats
Category V (A, B & C) - Irrigation and Agriculture
Category V (B) - Agriculture (Tatkal)
Category VI (A & B) - Local Bodies, St. Lighting & PWS
Category VII (A & B) - General Purpose
Category VIII -Temporary Supply
Area 1 Area 2

Name of Area : Name of Area :
Revenue from Current Tariffs (Rs. Crs.) Detail LinksNumber of
consumers
Sales
(MU)
Average Supply
Rate
( Rs/kWh)
Amount
( In Rs crores)
Number of
consumers
Sales
(MU)
Average Supply
Rate
( Rs/kWh)
Amount
( In Rs crores)
Zuari Cements, Kadapa
HT Category at 11 KV 0 0.00 0.00 0 0.00 0.00
HT-I Industry Segregated
HT-I (B) Ferro-Alloys
HT-II - Others
HT-III Airports, Bustations and Railway Stations
HT-IV (A) Irrigation and Agriculture
HT - IV (B) CP Water Supply Schemes
HT-VI Townships and Residential Colonies
HT - VII -Temporary Supply
HT - RESCOs
HT Category at 33 KV 0 0.00 0.00 0 0.00 0.00
HT-I Industry Segregated
HT-I (B) Ferro-Alloys
HT-II - Others
HT-III Airports, Bustations and Railway Stations
HT-IV (A) Irrigation and Agriculture
HT - IV (B) CP Water Supply Schemes
HT-VI Townships and Residential Colonies
HT - VII -Temporary Supply
HT - RESCOs
HT Category at 132 KV 0 0.00 0.00 0 0.00 0.00
HT-I Industry Segregated
HT-I (B) Ferro-Alloys
HT-II - Others
HT-III Airports, Bustations and Railway Stations
HT-IV (A) Irrigation and Agriculture
HT - IV (B) CP Water Supply Schemes
HT-V (A) Railway Traction
HT-V (B) HMR
HT-VI Townships and Residential Colonies
HT - VII -Temporary Supply
HT - RESCOs
Total 0 0.00 0.00 0 0.00 0.00
Form 6
Items of Non - Tariff Income
(Rs. Crs.)Detail Links Base Year 2014-15 2015-16 2016-17 2017-18 2018-19
Recoveries from theft of power or malpractices
Interest Income from Bank Deposits / Investments etc. 1.12 1.27 1.77
Interest income from staff advances and loans
Power Purchase Rebates earned
Securitisation benefits
Miscellaneous / Other Receipts 3.01 29.96 75.21
Others
Interest on ED 4.01 3.66 3.42
Reactive Income 0.28 2.43 2.83
Reconnection Fee LT 3.46 1.40 1.00
Reconnection Fee HT 0.11 0.06 0.05
Application Registration Fee 1.60 1.41 1.36
Grid Support charges 2.07 0.67 2.08
Capacitor surcharge 20.55
Total Non tariff income 15.66 40.86 108.27 0.00 0.00 0.00
Non-tariff Income at Current Charges
This form refers to income other than the income derived from tariffs and does not include cross subsidy surcharge, additional surcharge, etc.
Form 7 Total Revenue at Current Tariff and Charges
Base Year
Energy
Charges
(Rs/kWh)
or
(Rs/kVAh
)
Demand
charges
(Rs/kVA/Y
r)
Demand
charges
(Rs/HP/Yr)
Energy
Sales
(MU)
Energy
sales
(MVAh)
Connected
Load/
Contract
Demand
(MVA)
Connected
Load/
Contract
Demand
(HP)
Energy
Charges
(Rs
Crores)
Demand
/Fixed
charges
(Rs Crores)
Minimum
Charges
(Rs
Crores)
Customer
Charges
(Rs
crores)
Others
(Rs
Crores)
Gross Tariff
Revenue
(Rs Crores)
Surcharge
(Rs.Crs)
Additional
Surcharge
(Rs.Crs)
DirectApporti
oned
LT Total - (Existing Categories) 8350827 9720.00 2160.00 17742.00 2018.06 8957.69 5757303.35 5087.78 186.86 60.57 307.46 -22.03 5620.64 0.00 5620.64 0.00 0.00 0.00 10.80 0.73 5632.17
Category- Domestic (All) 6279122 0.00 0.00 6526 0 5820 0 2210.56 0.00 46.49 218.89 -22.03 2453.91 0.00 2453.91 0.00 0.00 0.00 6.84 0.39 2461.14
Cat I(A) Domestic - upto 50
units/month 2345769 1.45 732.92 1548.13106.27
0.00 46.49 59.29 -22.03 190.02 6.84 0.397.23
Cat I(B) Domestic - >50 and upto 100
units/month 1852998 0.00 0.00 1389.28 0.00 1109.06 0.00 260.50 0.00 0.00 66.71 0.00 327.210.00 0.00
0.00
0 - 50 units 1.45 875.78 0.00 126.99 0.00 0.00 0.00 126.99
51 - 100 units 1852998 2.60 513.50 1109.06 133.51 0.00 66.71 200.22
Cat I(c) Domestic- above 100 & upto
200 units/month 1415699 0.00 0.00 2221.80 0.00 1666.71 0.00 646.79 0.00 0.00 59.46 0.00 706.250.00 0.00
0.00
0 - 50 units 2.60 765.72 0.00 199.09 0.00 0.00 0.00 199.09
51 - 100 units 2.60 764.91 0.00 198.88 0.00 0.00 0.00 198.88
101 - 150 units 880703 3.60 542.03 955.71 195.13 0.00 36.99 232.12
151 - 200 units 534996 3.60 149.14 711.00 53.69 0.00 22.47 76.16
Cat-I(D) Domestic, > 200 Units/Month 664656 0.00 0.00 2181.70 0.00 1496.31 0.00 1197.01 0.00 0.00 33.43 0.00 1230.44 0.00 0.00 0.00
0 - 50 units 2.60 321.07 0.00 83.48 0.00 0.00 0.00 83.48
51 - 100 units 3.25 321.07 0.00 104.35 0.00 0.00 0.00 104.35
101 - 150 units 4.88 321.07 0.00 156.68 0.00 0.00 0.00 156.68
151 - 200 units 5.63 321.07 0.00 180.76 0.00 0.00 0.00 180.76
201 - 250 units 263174 6.38 206.83 435.76 131.96 0.00 12.63 144.59
251 - 300 units 148873 6.88 156.00 289.97 107.33 0.00 7.15 114.48
301 - 400 units 132519 7.38 109.53 314.94 80.83 0.00 7.16 87.99
401 - 500 units 52709 7.88 91.72 152.24 72.28 0.00 2.85 75.13
above 500units 67381 8.38 333.35 303.40 279.34 0.00 3.64 282.98
0.00 0.00 0.00 0.00 0.00
Category II - Non-domestic/Commrl
(A,B &C) 802824 4200.00 600.00 1044.23 1071.54 1931.28 0.00 1767.02 115.88 13.29 31.73 0.00 1927.92 0.001927.92
0.00 0.00 0.00 1.22 0.12 1929.26
Category II - Non-domestic/Commrl (A
& B) 801000 3600.00 0.00 1042.12 1071.07 1926.24 0.00 1764.18 115.57 13.29 31.64 0.00 1924.68 1.22 0.12
Lt - II (A) Upto 50 units/month 426461 5.40 600.00 0.00 127.38 0.00 520.47 0.00 68.79 31.23 13.29 14.47 0.00 127.78
0-50 units 426461 5.40 600.00 127.38 520.47 68.79 31.23 13.29 14.47 127.78
Lt - II (B) >50 Units/month 374539 3000.00 0.00 914.73 1071.07 1405.77 0.00 1695.39 84.35 0.00 17.17 0.00 1796.90
0-50 units 6.63 600.00 171.96 0.00 114.01 0.00 0.00 114.01
51- 100 units 134301 7.38 600.00 174.36 160.33 128.68 9.62 5.64 143.94
101- 300 units 136970 8.13 600.00 341.26 5.94 267.36 282.28 16.04 6.57 304.89
301- 500 units 35173 8.63 600.00 177.46 11.12 130.43 162.74 7.83 1.69 172.26
Above 500 units 68095 9.13 600.00 49.69 1054.01 847.64 1007.68 50.86 3.27 1061.81
LT-II (C) Advertising Hoardings 1824 11.03 600.00 600.00 2.11 0.47 5.04 2.85 0.30 0.09 0.00 3.24 0.00 0.00
Category III Industrial 52413 3480.00 0.00 110.33 946.52 1009.35 0.00 642.56 60.56 0.00 12.94 0.00 716.07 0.00 716.07 0.00 0.00 0.00 0.09 716.16
Category III - Industrial 52413 3480.00 0.00 110.33 946.52 1009.35 0.00 642.56 60.56 0.00 12.94 0.00 716.07
Industrial Normal 52413 6.08 600.00 110.33 946.52 1009.35 642.56 60.56 12.94 716.07
Pisciculture/Prawn culture 0 4.63 240.00 0.00 0.00 0.00 0.00 0.00
Consumer CategoriesNo of
consumers
Components of tariff Relevant sales related data Full year revenue excluding external subsidy
Incentiv
es
(Rs.
Crs)
Net
Revenue
from Tariff
(Rs.
Crores)
Surcharges
(Open Access)Grid
Support
Charge
s
(Rs.
Crs)
Non - tariff
Income
(Rs crores)Total
Revenue
( Net of
incentives)
(Rs.Crs)
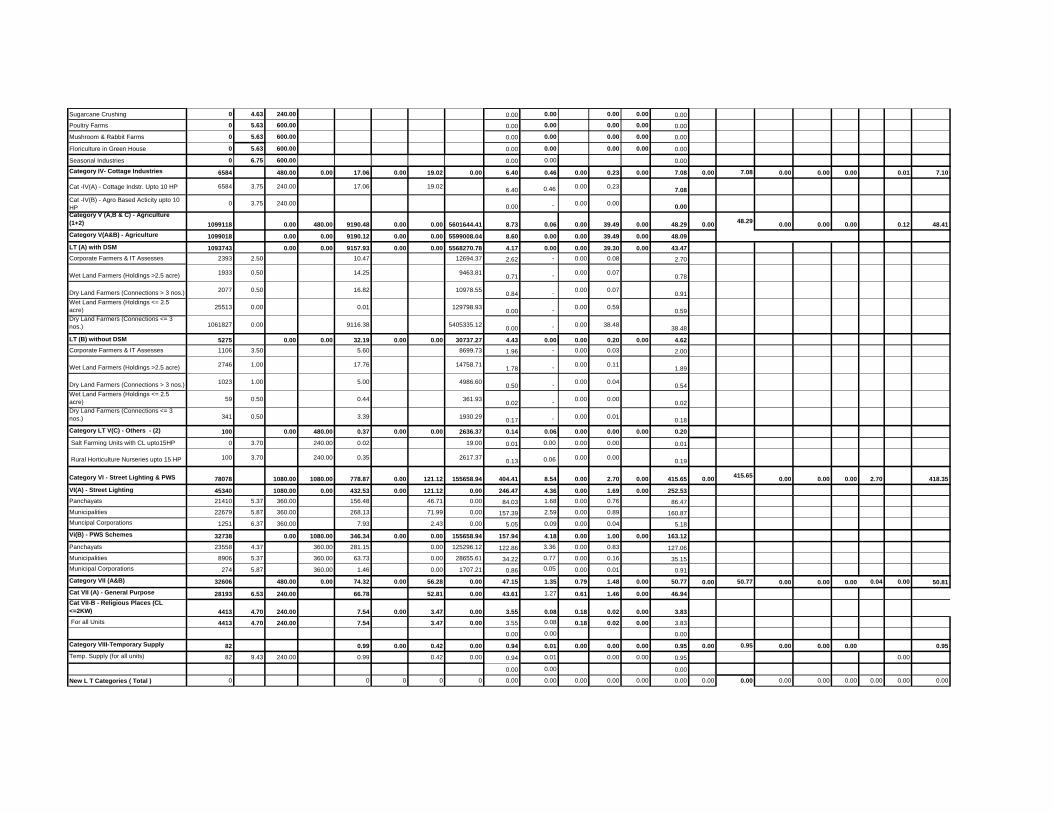
Sugarcane Crushing 0 4.63 240.00 0.00 0.00 0.00 0.00 0.00
Poultry Farms 0 5.63 600.00 0.00 0.00 0.00 0.00 0.00
Mushroom & Rabbit Farms 0 5.63 600.00 0.00 0.00 0.00 0.00 0.00
Floriculture in Green House 0 5.63 600.00 0.00 0.00 0.00 0.00 0.00
Seasonal Industries 0 6.75 600.00 0.00 0.00 0.00
Category IV- Cottage Industries 6584 480.00 0.00 17.06 0.00 19.02 0.00 6.40 0.46 0.00 0.23 0.00 7.08 0.00 7.08 0.00 0.00 0.00 0.01 7.10
Cat -IV(A) - Cottage Indstr. Upto 10 HP 6584 3.75 240.00 17.06 19.026.40 0.46 0.00 0.23
7.08
Cat -IV(B) - Agro Based Acticity upto 10
HP0 3.75 240.00
0.00 - 0.00 0.000.00
Category V (A,B & C) - Agriculture
(1+2) 1099118 0.00 480.00 9190.48 0.00 0.00 5601644.41 8.73 0.06 0.00 39.49 0.00 48.29 0.0048.29
0.00 0.00 0.00 0.12 48.41
Category V(A&B) - Agriculture 1099018 0.00 0.00 9190.12 0.00 0.00 5599008.04 8.60 0.00 0.00 39.49 0.00 48.09
LT (A) with DSM 1093743 0.00 0.00 9157.93 0.00 0.00 5568270.78 4.17 0.00 0.00 39.30 0.00 43.47
Corporate Farmers & IT Assesses 2393 2.50 10.47 12694.37 2.62 - 0.00 0.08 2.70
Wet Land Farmers (Holdings >2.5 acre) 1933 0.50 14.25 9463.810.71 - 0.00 0.07
0.78
Dry Land Farmers (Connections > 3 nos.) 2077 0.50 16.82 10978.550.84 - 0.00 0.07
0.91
Wet Land Farmers (Holdings <= 2.5
acre) 25513 0.00 0.01 129798.930.00 - 0.00 0.59
0.59
Dry Land Farmers (Connections <= 3
nos.) 1061827 0.00 9116.38 5405335.120.00 - 0.00 38.48
38.48
LT (B) without DSM 5275 0.00 0.00 32.19 0.00 0.00 30737.27 4.43 0.00 0.00 0.20 0.00 4.62
Corporate Farmers & IT Assesses 1106 3.50 5.60 8699.73 1.96 - 0.00 0.03 2.00
Wet Land Farmers (Holdings >2.5 acre) 2746 1.00 17.76 14758.711.78 - 0.00 0.11
1.89
Dry Land Farmers (Connections > 3 nos.) 1023 1.00 5.00 4986.600.50 - 0.00 0.04
0.54
Wet Land Farmers (Holdings <= 2.5
acre) 59 0.50 0.44 361.930.02 - 0.00 0.00
0.02
Dry Land Farmers (Connections <= 3
nos.) 341 0.50 3.39 1930.290.17 - 0.00 0.01
0.18
Category LT V(C) - Others - (2) 100 0.00 480.00 0.37 0.00 0.00 2636.37 0.14 0.06 0.00 0.00 0.00 0.20
Salt Farming Units with CL upto15HP 0 3.70 240.00 0.02 19.00 0.01 0.00 0.00 0.00 0.01
Rural Horticulture Nurseries upto 15 HP 100 3.70 240.00 0.35 2617.370.13 0.06 0.00 0.00
0.19
Category VI - Street Lighting & PWS 78078 1080.00 1080.00 778.87 0.00 121.12 155658.94 404.41 8.54 0.00 2.70 0.00 415.65 0.00415.65
0.00 0.00 0.00 2.70 418.35
VI(A) - Street Lighting 45340 1080.00 0.00 432.53 0.00 121.12 0.00 246.47 4.36 0.00 1.69 0.00 252.53
Panchayats 21410 5.37 360.00 156.48 46.71 0.00 84.03 1.68 0.00 0.76 86.47
Municipalities 22679 5.87 360.00 268.13 71.99 0.00 157.39 2.59 0.00 0.89 160.87
Muncipal Corporations 1251 6.37 360.00 7.93 2.43 0.00 5.05 0.09 0.00 0.04 5.18
Vi(B) - PWS Schemes 32738 0.00 1080.00 346.34 0.00 0.00 155658.94 157.94 4.18 0.00 1.00 0.00 163.12
Panchayats 23558 4.37 360.00 281.15 0.00 125296.12 122.86 3.36 0.00 0.83 127.06
Municipalities 8906 5.37 360.00 63.73 0.00 28655.61 34.22 0.77 0.00 0.16 35.15
Municipal Corporations 274 5.87 360.00 1.46 0.00 1707.21 0.86 0.05 0.00 0.01 0.91
Category VII (A&B) 32606 480.00 0.00 74.32 0.00 56.28 0.00 47.15 1.35 0.79 1.48 0.00 50.77 0.00 50.77 0.00 0.00 0.00 0.04 0.00 50.81
Cat VII (A) - General Purpose 28193 6.53 240.00 66.78 52.81 0.00 43.61 1.27 0.61 1.46 0.00 46.94
Cat VII-B - Religious Places (CL
<=2KW) 4413 4.70 240.00 7.54 0.00 3.47 0.00 3.55 0.08 0.18 0.02 0.00 3.83
For all Units 4413 4.70 240.00 7.54 3.47 0.00 3.55 0.08 0.18 0.02 0.00 3.83
0.00 0.00 0.00
Category VIII-Temporary Supply 82 0.99 0.00 0.42 0.00 0.94 0.01 0.00 0.00 0.00 0.95 0.00 0.95 0.00 0.00 0.00 0.95
Temp. Supply (for all units) 82 9.43 240.00 0.99 0.42 0.00 0.94 0.01 0.00 0.00 0.95 0.00
0.00 0.00 0.00
New L T Categories ( Total ) 0 0 0 0 0 0.00 0.00 0.00 0.00 0.00 0.00 0.00 0.00 0.00 0.00 0.00 0.00 0.00 0.00
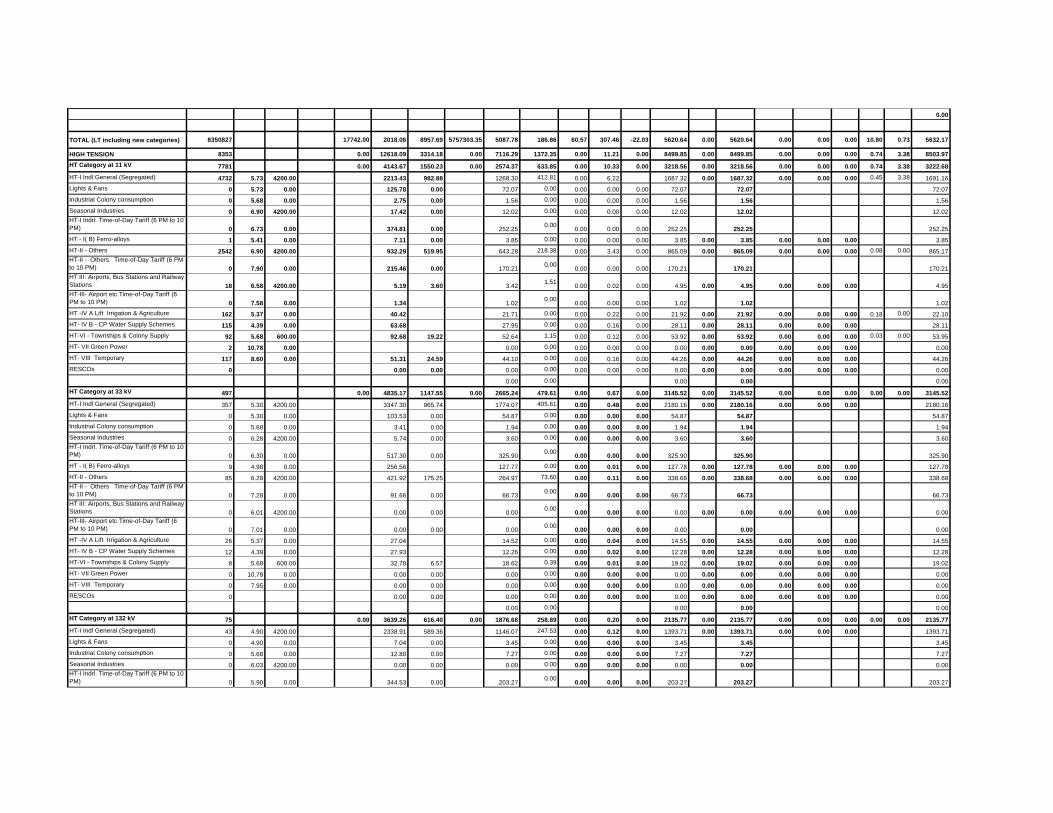
0.00
TOTAL (LT including new categories) 8350827 17742.00 2018.06 8957.69 5757303.35 5087.78 186.86 60.57 307.46 -22.03 5620.64 0.00 5620.64 0.00 0.00 0.00 10.80 0.73 5632.17
HIGH TENSION 8353 0.00 12618.09 3314.18 0.00 7116.29 1372.35 0.00 11.21 0.00 8499.85 0.00 8499.85 0.00 0.00 0.00 0.74 3.38 8503.97
HT Category at 11 kV 7781 0.00 4143.67 1550.23 0.00 2574.37 633.85 0.00 10.33 0.00 3218.56 0.00 3218.56 0.00 0.00 0.00 0.74 3.38 3222.68
HT-I Indl General (Segregated) 4732 5.73 4200.00 2213.43 982.88 1268.30 412.81 0.00 6.22 1687.32 0.00 1687.32 0.00 0.00 0.00 0.45 3.38 1691.16
Lights & Fans 0 5.73 0.00 125.78 0.00 72.07 0.00 0.00 0.00 0.00 72.07 72.07 72.07
Industrial Colony consumption 0 5.68 0.00 2.75 0.00 1.56 0.00 0.00 0.00 0.00 1.56 1.56 1.56
Seasonal Industries 0 6.90 4200.00 17.42 0.00 12.02 0.00 0.00 0.00 0.00 12.02 12.02 12.02
HT-I Indrl. Time-of-Day Tariff (6 PM to 10
PM) 0 6.73 0.00 374.81 0.00 252.250.00
0.00 0.00 0.00 252.25 252.25 252.25
HT - I( B) Ferro-alloys 1 5.41 0.00 7.11 0.00 3.85 0.00 0.00 0.00 0.00 3.85 0.00 3.85 0.00 0.00 0.00 3.85
HT-II - Others 2542 6.90 4200.00 932.29 519.95 643.28 218.38 0.00 3.43 0.00 865.09 0.00 865.09 0.00 0.00 0.00 0.08 0.00 865.17
HT-II - Others Time-of-Day Tariff (6 PM
to 10 PM) 0 7.90 0.00 215.46 0.00 170.210.00
0.00 0.00 0.00 170.21 170.21 170.21
HT III: Airports, Bus Stations and Railway
Stations 18 6.58 4200.00 5.19 3.60 3.421.51
0.00 0.02 0.00 4.95 0.00 4.95 0.00 0.00 0.00 4.95
HT-III- Airport etc Time-of-Day Tariff (6
PM to 10 PM) 0 7.58 0.00 1.34 1.020.00
0.00 0.00 0.00 1.02 1.02 1.02
HT -IV A Lift Irrigation & Agriculture 162 5.37 0.00 40.42 21.71 0.00 0.00 0.22 0.00 21.92 0.00 21.92 0.00 0.00 0.00 0.18 0.00 22.10
HT- IV B - CP Water Supply Schemes 115 4.39 0.00 63.68 27.95 0.00 0.00 0.16 0.00 28.11 0.00 28.11 0.00 0.00 0.00 28.11
HT-VI - Townships & Colony Supply 92 5.68 600.00 92.68 19.22 52.64 1.15 0.00 0.12 0.00 53.92 0.00 53.92 0.00 0.00 0.00 0.03 0.00 53.95
HT- VII Green Power 2 10.78 0.00 0.00 0.00 0.00 0.00 0.00 0.00 0.00 0.00 0.00 0.00 0.00 0.00
HT- VIII Temporary 117 8.60 0.00 51.31 24.59 44.10 0.00 0.00 0.16 0.00 44.26 0.00 44.26 0.00 0.00 0.00 44.26
RESCOs 0 0.00 0.00 0.00 0.00 0.00 0.00 0.00 0.00 0.00 0.00 0.00 0.00 0.00 0.00
0.00 0.00 0.00 0.00 0.00
HT Category at 33 kV 497 0.00 4835.17 1147.55 0.00 2665.24 479.61 0.00 0.67 0.00 3145.52 0.00 3145.52 0.00 0.00 0.00 0.00 0.00 3145.52
HT-I Indl General (Segregated) 357 5.30 4200.00 3347.30 965.74 1774.07 405.61 0.00 0.48 0.00 2180.16 0.00 2180.16 0.00 0.00 0.00 2180.16
Lights & Fans 0 5.30 0.00 103.53 0.00 54.87 0.00 0.00 0.00 0.00 54.87 54.87 54.87
Industrial Colony consumption 0 5.68 0.00 3.41 0.00 1.94 0.00 0.00 0.00 0.00 1.94 1.94 1.94
Seasonal Industries 0 6.28 4200.00 5.74 0.00 3.60 0.00 0.00 0.00 0.00 3.60 3.60 3.60
HT-I Indrl. Time-of-Day Tariff (6 PM to 10
PM) 0 6.30 0.00 517.30 0.00 325.900.00
0.00 0.00 0.00 325.90 325.90 325.90
HT - I( B) Ferro-alloys 9 4.98 0.00 256.56 127.77 0.00 0.00 0.01 0.00 127.78 0.00 127.78 0.00 0.00 0.00 127.78
HT-II - Others 85 6.28 4200.00 421.92 175.25 264.97 73.60 0.00 0.11 0.00 338.68 0.00 338.68 0.00 0.00 0.00 338.68
HT-II - Others Time-of-Day Tariff (6 PM
to 10 PM) 0 7.28 0.00 91.66 0.00 66.730.00
0.00 0.00 0.00 66.73 66.73 66.73
HT III: Airports, Bus Stations and Railway
Stations 0 6.01 4200.00 0.00 0.00 0.000.00
0.00 0.00 0.00 0.00 0.00 0.00 0.00 0.00 0.00 0.00
HT-III- Airport etc Time-of-Day Tariff (6
PM to 10 PM) 0 7.01 0.00 0.00 0.00 0.000.00
0.00 0.00 0.00 0.00 0.00 0.00
HT -IV A Lift Irrigation & Agriculture 26 5.37 0.00 27.04 14.52 0.00 0.00 0.04 0.00 14.55 0.00 14.55 0.00 0.00 0.00 14.55
HT- IV B - CP Water Supply Schemes 12 4.39 0.00 27.93 12.26 0.00 0.00 0.02 0.00 12.28 0.00 12.28 0.00 0.00 0.00 12.28
HT-VI - Townships & Colony Supply 8 5.68 600.00 32.78 6.57 18.62 0.39 0.00 0.01 0.00 19.02 0.00 19.02 0.00 0.00 0.00 19.02
HT- VII Green Power 0 10.78 0.00 0.00 0.00 0.00 0.00 0.00 0.00 0.00 0.00 0.00 0.00 0.00 0.00 0.00 0.00
HT- VIII Temporary 0 7.95 0.00 0.00 0.00 0.00 0.00 0.00 0.00 0.00 0.00 0.00 0.00 0.00 0.00 0.00 0.00
RESCOs 0 0.00 0.00 0.00 0.00 0.00 0.00 0.00 0.00 0.00 0.00 0.00 0.00 0.00 0.00
0.00 0.00 0.00 0.00 0.00
HT Category at 132 kV 75 0.00 3639.26 616.40 0.00 1876.68 258.89 0.00 0.20 0.00 2135.77 0.00 2135.77 0.00 0.00 0.00 0.00 0.00 2135.77
HT-I Indl General (Segregated) 43 4.90 4200.00 2338.91 589.36 1146.07 247.53 0.00 0.12 0.00 1393.71 0.00 1393.71 0.00 0.00 0.00 1393.71
Lights & Fans 0 4.90 0.00 7.04 0.00 3.45 0.00 0.00 0.00 0.00 3.45 3.45 3.45
Industrial Colony consumption 0 5.68 0.00 12.80 0.00 7.27 0.00 0.00 0.00 0.00 7.27 7.27 7.27
Seasonal Industries 0 6.03 4200.00 0.00 0.00 0.00 0.00 0.00 0.00 0.00 0.00 0.00 0.00
HT-I Indrl. Time-of-Day Tariff (6 PM to 10
PM) 0 5.90 0.00 344.53 0.00 203.270.00
0.00 0.00 0.00 203.27 203.27 203.27
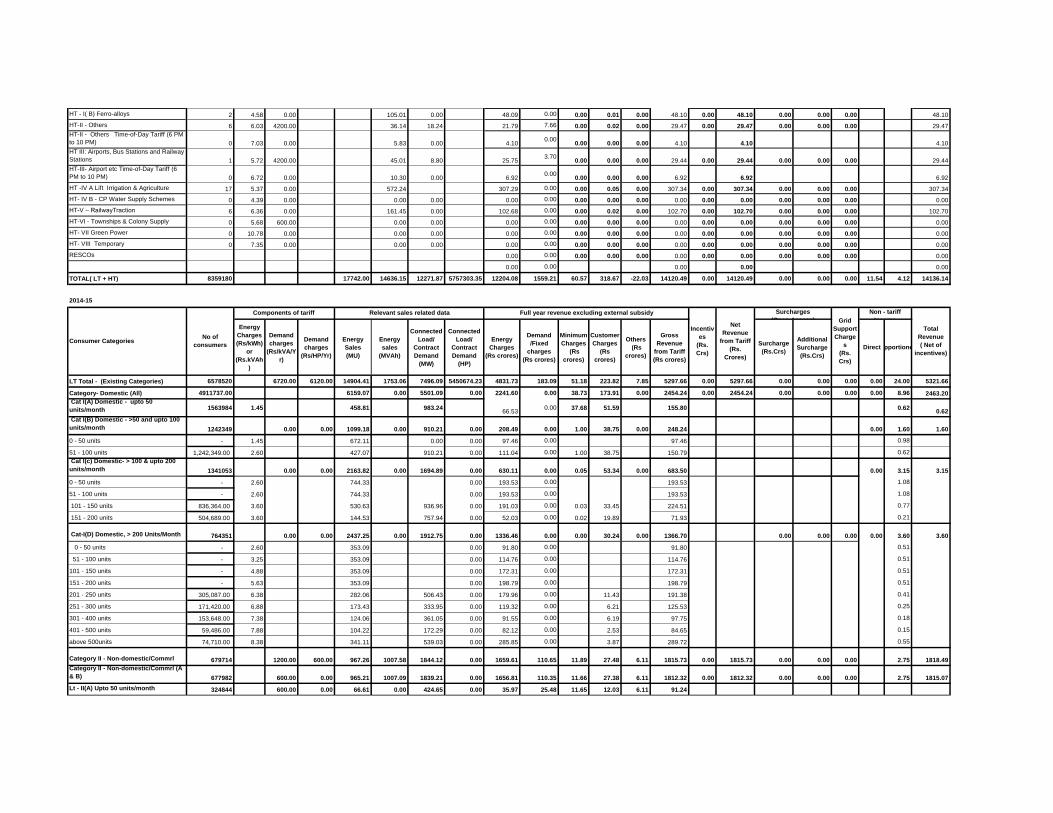
HT - I( B) Ferro-alloys 2 4.58 0.00 105.01 0.00 48.09 0.00 0.00 0.01 0.00 48.10 0.00 48.10 0.00 0.00 0.00 48.10
HT-II - Others 6 6.03 4200.00 36.14 18.24 21.79 7.66 0.00 0.02 0.00 29.47 0.00 29.47 0.00 0.00 0.00 29.47
HT-II - Others Time-of-Day Tariff (6 PM
to 10 PM) 0 7.03 0.00 5.83 0.00 4.100.00
0.00 0.00 0.00 4.10 4.10 4.10
HT III: Airports, Bus Stations and Railway
Stations 1 5.72 4200.00 45.01 8.80 25.753.70
0.00 0.00 0.00 29.44 0.00 29.44 0.00 0.00 0.00 29.44
HT-III- Airport etc Time-of-Day Tariff (6
PM to 10 PM) 0 6.72 0.00 10.30 0.00 6.920.00
0.00 0.00 0.00 6.92 6.92 6.92
HT -IV A Lift Irrigation & Agriculture 17 5.37 0.00 572.24 307.29 0.00 0.00 0.05 0.00 307.34 0.00 307.34 0.00 0.00 0.00 307.34
HT- IV B - CP Water Supply Schemes 0 4.39 0.00 0.00 0.00 0.00 0.00 0.00 0.00 0.00 0.00 0.00 0.00 0.00 0.00 0.00 0.00
HT-V – RailwayTraction 6 6.36 0.00 161.45 0.00 102.68 0.00 0.00 0.02 0.00 102.70 0.00 102.70 0.00 0.00 0.00 102.70
HT-VI - Townships & Colony Supply 0 5.68 600.00 0.00 0.00 0.00 0.00 0.00 0.00 0.00 0.00 0.00 0.00 0.00 0.00 0.00 0.00
HT- VII Green Power 0 10.78 0.00 0.00 0.00 0.00 0.00 0.00 0.00 0.00 0.00 0.00 0.00 0.00 0.00 0.00 0.00
HT- VIII Temporary 0 7.35 0.00 0.00 0.00 0.00 0.00 0.00 0.00 0.00 0.00 0.00 0.00 0.00 0.00 0.00 0.00
RESCOs 0.00 0.00 0.00 0.00 0.00 0.00 0.00 0.00 0.00 0.00 0.00 0.00
0.00 0.00 0.00 0.00 0.00
TOTAL( LT + HT) 8359180 17742.00 14636.15 12271.87 5757303.35 12204.08 1559.21 60.57 318.67 -22.03 14120.49 0.00 14120.49 0.00 0.00 0.00 11.54 4.12 14136.14
2014-15
Energy
Charges
(Rs/kWh)
or
(Rs.kVAh
)
Demand
charges
(Rs/kVA/Y
r)
Demand
charges
(Rs/HP/Yr)
Energy
Sales
(MU)
Energy
sales
(MVAh)
Connected
Load/
Contract
Demand
(MW)
Connected
Load/
Contract
Demand
(HP)
Energy
Charges
(Rs crores)
Demand
/Fixed
charges
(Rs crores)
Minimum
Charges
(Rs
crores)
Customer
Charges
(Rs
crores)
Others
(Rs
crores)
Gross
Revenue
from Tariff
(Rs crores)
Surcharge
(Rs.Crs)
Additional
Surcharge
(Rs.Crs)
DirectApportioned
LT Total - (Existing Categories) 6578520 6720.00 6120.00 14904.41 1753.06 7496.09 5450674.23 4831.73 183.09 51.18 223.82 7.85 5297.66 0.00 5297.66 0.00 0.00 0.00 0.00 24.00 5321.66
Category- Domestic (All) 4911737.00 6159.07 0.00 5501.09 0.00 2241.60 0.00 38.73 173.91 0.00 2454.24 0.00 2454.24 0.00 0.00 0.00 0.00 8.96 2463.20
Cat I(A) Domestic - upto 50
units/month 1563984 1.45 458.81 983.2466.53
0.00 37.68 51.59 155.80 0.620.62
Cat I(B) Domestic - >50 and upto 100
units/month 1242349 0.00 0.00 1099.18 0.00 910.21 0.00 208.49 0.00 1.00 38.75 0.00 248.24 0.00 1.60 1.60
0 - 50 units - 1.45 672.11 0.00 0.00 97.46 0.00 97.46 0.98
51 - 100 units 1,242,349.00 2.60 427.07 910.21 0.00 111.04 0.00 1.00 38.75 150.79 0.62
Cat I(c) Domestic- > 100 & upto 200
units/month 1341053 0.00 0.00 2163.82 0.00 1694.89 0.00 630.11 0.00 0.05 53.34 0.00 683.50 0.00 3.15 3.15
0 - 50 units - 2.60 744.33 0.00 193.53 0.00 193.53 1.08
51 - 100 units - 2.60 744.33 0.00 193.53 0.00 193.53 1.08
101 - 150 units 836,364.00 3.60 530.63 936.96 0.00 191.03 0.00 0.03 33.45 224.51 0.77
151 - 200 units 504,689.00 3.60 144.53 757.94 0.00 52.03 0.00 0.02 19.89 71.93 0.21
Cat-I(D) Domestic, > 200 Units/Month 764351 0.00 0.00 2437.25 0.00 1912.75 0.00 1336.46 0.00 0.00 30.24 0.00 1366.70 0.00 0.00 0.00 0.00 3.60 3.60
0 - 50 units - 2.60 353.09 0.00 91.80 0.00 91.80 0.51
51 - 100 units - 3.25 353.09 0.00 114.76 0.00 114.76 0.51
101 - 150 units - 4.88 353.09 0.00 172.31 0.00 172.31 0.51
151 - 200 units - 5.63 353.09 0.00 198.79 0.00 198.79 0.51
201 - 250 units 305,087.00 6.38 282.06 506.43 0.00 179.96 0.00 11.43 191.38 0.41
251 - 300 units 171,420.00 6.88 173.43 333.95 0.00 119.32 0.00 6.21 125.53 0.25
301 - 400 units 153,648.00 7.38 124.06 361.05 0.00 91.55 0.00 6.19 97.75 0.18
401 - 500 units 59,486.00 7.88 104.22 172.29 0.00 82.12 0.00 2.53 84.65 0.15
above 500units 74,710.00 8.38 341.11 539.03 0.00 285.85 0.00 3.87 289.72 0.55
Category II - Non-domestic/Commrl 679714 1200.00 600.00 967.26 1007.58 1844.12 0.00 1659.61 110.65 11.89 27.48 6.11 1815.73 0.00 1815.73 0.00 0.00 0.00 2.75 1818.49
Category II - Non-domestic/Commrl (A
& B) 677982 600.00 0.00 965.21 1007.09 1839.21 0.00 1656.81 110.35 11.66 27.38 6.11 1812.32 0.00 1812.32 0.00 0.00 0.00 2.75 1815.07
Lt - II(A) Upto 50 units/month 324844 600.00 0.00 66.61 0.00 424.65 0.00 35.97 25.48 11.65 12.03 6.11 91.24
Incentiv
es
(Rs.
Crs)
Net
Revenue
from Tariff
(Rs.
Crores)
Consumer CategoriesNo of
consumers
Components of tariff Relevant sales related data Full year revenue excluding external subsidy Surcharges
(Open Access) Grid
Support
Charge
s
(Rs.
Crs)
Non - tariff
Income
Total
Revenue
( Net of
incentives)

0-50 units 324844 5.40 600 66.61 424.65 0.00 35.97 25.48 11.65 12.03 6.11 91.24
Lt - II (B) >50 Units/month 353138.00 898.60 1007.09 1414.56 0.00 1620.84 84.87 0.01 15.35 0.00 1721.08
0-50 units 0 6.63 600.00 195.34 0.00 129.51 0.00 129.51
51- 100 units 118506 7.38 600.00 160.97 0.60 150.09 0.00 119.24 9.01 0.00 4.90 133.15
101- 300 units 131782 8.13 600.00 323.74 6.05 263.85 0.00 268.12 15.83 0.01 5.91 289.87
301- 500 units 35183 8.63 600.00 168.10 11.17 128.33 0.00 154.71 7.70 0.00 1.56 163.97
Above 500 units 67667 9.13 600.00 50.44 989.27 872.29 0.00 949.25 52.34 0.00 2.99 1004.58
LT-II (C) Advertising Hoardings 1732 11.03 600.00 600.00 2.05 0.49 4.91 0.00 2.80 0.29 0.23 0.09 3.41 0.00 3.41 3.41
Category III Industrial 39920 3480.00 3480.00 85.76 745.48 0.00 1054622.31 505.39 63.28 0.00 0.79 0.00 569.46 0.00 569.46 0.00 0.00 0.00 1.10 570.56
Category III - Industrial (1) 39920 3480.00 3480.00 85.76 745.48 0.00 1054622.31 505.39 63.28 0.00 0.79 0.00 569.46
Industrial Normal 39920 6.08 600.00 600.00 85.76 745.48 1054622.31 505.39 63.28 0.00 0.79 569.46
Pisciculture/Prawn culture 0 6.75 600.00 600.00 0.00 0.00 0.00 - 0.00
Sugarcane crushing 0 4.63 240.00 240.00 0.00 0.00 0.00 - 0.00
Poultry farms 0 4.63 240.00 240.00 0.00 0.00 0.00 - 0.00
Mushroom & Rabbit Farms 0 5.63 600.00 600.00 0.00 0.00 0.00 - 0.00
Floriculture in Green House 0 5.63 600.00 600.00 0.00 0.00 0.00 0.00 - 0.00
Seasonal Industries 0 5.63 600.00 600.00 0.00 0.00 0.00 0.00 0.00 0.00
Category IV- Cottage Industries &
Others 3568 480.00 480.00 8.92 0.00 0.00 13350.95 3.35 0.32 0.00 0.07 0.00 3.74 0.00 3.74 0.00 0.00 0.00 0.01 3.75
Cat -IV(A) - Cottage Indstr. Upto 10 HP3568 3.75 240.00 240.00 8.92 13350.95 3.35 0.32 0.07 3.74
Cat -IV(B) - Agro Based Acticity upto 10
HP 0 3.75 240.00 240.00 0.00 0.00 0.00 0.00 - 0.00
Category LT V(A,B&C) - Agriculture
(1+2+3) 860677 0.00 480.00 6932.86 0.00 0.00 4274532.19 6.95 0.00 0.00 18.73 0.00 25.68 0.00 25.68 0.00 0.00 0.00 10.09 35.76
Category V(A&B) - Agriculture 860677 0.00 0.00 6932.86 0.00 0.00 4274532.19 6.95 0.00 0.00 18.73 0.00 25.68
LT (A) with DSM 857319 0.00 0.00 6908.94 0.00 0.00 4254183.66 3.58 0.00 0.00 18.58 0.00 22.16
Corporate Farmers & IT Assesses 2317 2.50 9.83 0.00 12064.35 2.46 0.00 0.00 0.09 2.55
Wet Land Farmers (Holdings >2.5 acre) 400 0.50 8.96 0.00 1983.91 0.450.00
0.00 0.04 0.49
Dry Land Farmers (Connections > 3 nos.) 1657 0.50 13.48 0.00 8579.09 0.670.00
0.00 0.07 0.74
Wet Land Farmers (Holdings <= 2.5
acre) 21405 0.00 0.09 0.00 109302.98 0.000.00
0.00 0.65 0.65
Dry Land Farmers (Connections <= 3
nos.) 831540 0.00 6876.58 0.00 4122253.32 0.000.00
0.00 17.74 17.74
LT (B) without DSM 3358 0.00 0.00 23.91 0.00 0.00 20348.53 3.37 0.00 0.00 0.14 0.00 3.51
Corporate Farmers & IT Assesses 874 3.50 4.50 0.00 6367.29 1.57 0.00 0.00 0.03 1.61
Wet Land Farmers (Holdings >2.5 acre) 1469 1.00 12.74 0.00 7815.02 1.270.00
0.00 0.07 1.34
Dry Land Farmers (Connections > 3 nos.) 725 1.00 3.73 0.00 3512.07 0.370.00
0.00 0.03 0.40
Wet Land Farmers (Holdings <= 2.5
acre) 34 0.50 0.29 0.00 160.86 0.010.00
0.00 0.00 0.01
Dry Land Farmers (Connections <= 3
nos.) 256 0.50 2.66 0.00 2493.30 0.130.00
0.00 0.01 0.14 0.00
Category LT V(C) - Others - (2) 0 0.00 480.00 0.00 0.00 0.00 0.00 0.00 0.00 0.00 0.00 0.00 0.00 0.00 0.00
Salt Farming Units with CL upto15HP 0 3.70 240.00 0.00 0.00 0.00 0.00 - 0.00
Rural Horticulture Nurseries upto 15 HP 3.70 240.00 0.00 0.00 - 0.00
Category VI - Local Bodies, St.
Lighting & PWS 61494 1080.00 1080.00 694.55 0.00 110.67 108168.78 379.20 7.88 0.00 2.19 0.64 389.90 0.00 389.90 0.00 0.00 0.00 1.00 390.90
VI(A) - Street Lighting 39705 1080.00 0.00 429.18 0.00 110.67 0.00 256.64 3.98 0.00 1.41 0.24 262.27
Panchayats 14599 5.37 360.00 142.15 38.81 76.33 1.40 0.00 0.51 0.02 78.26
Municipalities 4319 5.87 360.00 50.64 12.22 29.73 0.44 0.00 0.15 0.02 30.34
Muncipal Corporations 20787 6.37 360.00 236.39 59.64 150.58 2.15 0.00 0.74 0.20 153.67
VI(B) PWS Schemes 21789 0.00 1080.00 265.37 0.00 0.00 108168.78 122.56 3.89 0.00 0.78 0.40 127.63

Panchayats 17473 4.37 360.00 207.96 87086.00 90.88 3.14 0.00 0.63 0.02 94.66
Muncipalities 2393 5.37 360.00 40.49 11050.02 21.74 0.40 0.00 0.09 0.38 22.61
Corporations 1923 5.87 360.00 16.92 10032.76 9.93 0.36 0.00 0.07 10.36
Category VII (A&B) 21329 480.00 0.00 55.17 0.00 39.66 0.00 34.86 0.95 0.46 0.65 0.17 37.10 0.00 37.10 0.00 0.00 0.00 0.08 37.18
Cat VII (A) - General Purpose 17806 6.53 240.00 48.81 36.62 0.00 31.87 0.88 0.46 0.51 0.17 33.89 33.89 33.89
Cat VII-B - Religious Places (CL
<=2KW) 3523 240.00 0.00 6.36 0.00 3.04 0.00 2.99 0.07 0.00 0.14 0.00 3.20 3.20 3.20
For All Units 3523 4.70 240.00 6.36 3.04 0.00 2.99 0.07 0.00 0.14 3.20
0.00 0.00 0.00 0.00
Category VIII-Temporary Supply 81 0.82 0.00 0.55 0.00 0.77 0.01 0.10 0.00 0.93 1.82 0.00 1.82 0.00 0.00 0.00 0.00 1.82
Temp. Supply (for ALL UNITS) 81 9.43 240.00 240.00 0.82 0.55 0.00 0.77 0.01 0.10 0.00 0.93 1.82
0.00 0.00 0.00
New L T Categories ( Total ) 0 0.00 0.00 0.00 0.00 0.00 0.00 0.00 0.00 0.00 0.00 0.00 0.00 0.00 0.00 0.00 0.00 0.00 0.00
0.00 0.00
TOTAL (LT including new categories) 6578520 14904.41 1753.06 7496.09 5450674.23 4831.73 183.09 51.18 223.82 7.85 5297.66 0.00 5297.66 0.00 0.00 0.00 0.00 24.00 5321.66
HIGH TENSION 7630 0.00 11609.09 3131.44 0.00 6635.36 1293.68 0.00 10.24 -70.03 7869.25 0.00 7869.25 0.00 0.00 0.00 0.00 16.85 7886.11
HT Category at 11 kV 7135 0.00 4074.17 1537.29 0.00 2542.85 631.98 0.00 9.49 -6.73 3177.59 0.00 3177.59 0.00 0.00 0.00 0.00 5.92 3183.51
HT-I Indl General (Segregated) 4161 5.73 4200.00 2102.30 997.57 1204.62 418.98 5.62 -50.00 1579.21 0.00 1579.21 0.00 0.00 0.00 2.98 1582.19
Lights & Fans 5.73 0.00 148.15 84.89 0.00 0.00 84.89 84.89 0.21 85.10
Industrial Colony consumption 5.68 0.00 2.57 1.46 0.00 0.00 1.46 1.46 0.00 1.47
Seasonal Industries 6.90 4200.00 27.79 19.17 0.00 0.00 19.17 19.17 0.04 19.21
HT-I Indrl. Time-of-Day Tariff (6 PM to 10
PM) 6.73 0.00 453.84 305.430.00
0.00 305.43 305.430.64
306.08
HT - I( B) Ferro-alloys 5.41 0.00 0.00 0.00 0.00 0.00 0.00 0.00 0.00 0.00 0.00 0.00 0.00
HT-II - Others (Non- Industrial) 2582 6.90 4200.00 904.86 503.42 624.35 211.44 3.49 13.10 852.38 0.00 852.38 0.00 0.00 0.00 1.40 853.78
HT-II Others - Time-of-Day Tariff (6 PM
to 10 PM) 7.90 0.00 229.45 181.270.00
0.00 181.27 181.270.34
181.61
HT III: Airports, Bus Stations and Railway
Stations 10 6.58 4200.00 4.25 1.52 2.800.64
0.01 3.45 0.00 3.45 0.00 0.00 0.000.01
3.45
HT-III - Aviation Time-of-Day Tariff (6 PM
to 10 PM) 7.58 0.00 1.07 0.810.00
0.00 0.81 0.810.00
0.81
HT -IV A Lift Irrigation & Agriculture 123 5.37 0.00 42.10 22.61 0.00 0.17 22.77 0.00 22.77 0.00 0.00 0.00 0.06 22.83
HT- IV B - CP Water Supply Schemes 63 4.39 0.00 42.65 18.72 0.00 0.09 18.81 0.00 18.81 0.00 0.00 0.00 0.06 18.87
HT-VI - Townships & Colony Supply 90 5.68 600.00 76.31 15.48 43.34 0.93 0.12 44.39 0.00 44.39 0.00 0.00 0.00 0.11 44.51
HT- VII Green Power 10.78 0.00 0.00 0.00 0.00 0.00 0.00 0.00 0.00 0.00 0.00 0.00 0.00
HT- VIII Temporary 106 8.60 0.00 38.83 19.31 33.37 0.00 30.17 63.54 0.00 63.54 0.00 0.00 0.00 0.06 63.60
RESCOs 0.00 0.00 0.00 0.00 0.00 0.00 0.00 0.00 0.00 0.00
0.00 0.00 0.00 0.00 0.00
HT Category at 33 kV 435 0.00 4648.81 1088.71 0.00 2593.11 449.42 0.00 0.59 -31.91 3011.21 0.00 3011.21 0.00 0.00 0.00 0.00 6.74 3017.95
HT-I Indl General (Segregated) 325 5.30 4200.00 3161.33 908.95 1675.51 381.76 0.44 -50.00 2007.70 0.00 2007.70 0.00 0.00 0.00 4.61 2012.32
Lights & Fans 5.30 0.00 139.17 73.76 0.00 0.00 73.76 73.76 0.20 73.96
Industrial Colony consumption 5.68 0.00 11.78 6.69 0.00 0.00 6.69 6.69 0.02 6.71
Seasonal Industries 6.28 4200.00 3.32 2.09 0.00 0.00 2.09 2.09 0.00 2.09
HT-I Indrl. Time-of-Day Tariff (6 PM to 10
PM) 6.30 0.00 673.88 424.550.00
0.00 424.55 424.550.96
425.50
HT - I( B) Ferro-alloys 3 4.98 0.00 73.94 36.82 0.00 0.00 36.82 0.00 36.82 0.00 0.00 0.00 0.10 36.93
HT-II - Others (Non- Industrial) 84 6.28 4200.00 424.69 160.10 266.71 67.24 0.11 13.10 347.16 0.00 347.16 0.00 0.00 0.00 0.61 347.78
HT-II Others - Time-of-Day Tariff (6 PM
to 10 PM) 7.28 0.00 93.72 68.230.00
0.00 68.23 68.230.14
68.37
HT III: Airports, Bus Stations and Railway
Stations 6.01 4200.00 0.000.00
0.00 0.00 0.00 0.00 0.00 0.00 0.000.00
0.00
HT-III - Aviation Time-of-Day Tariff (6 PM
to 10 PM) 7.01 0.00 0.000.00
0.00 0.00 0.000.00
0.00

HT -IV A Lift Irrigation & Agriculture 12 5.37 0.00 19.78 10.62 0.00 0.02 10.64 0.00 10.64 0.00 0.00 0.00 0.03 10.67
HT- IV B - CP Water Supply Schemes 1 4.39 0.00 3.52 1.54 0.00 0.00 1.55 0.00 1.55 0.00 0.00 0.00 0.01 1.55
HT-VI - Townships & Colony Supply 7 5.68 600.00 35.76 6.95 20.31 0.42 0.01 -1.01 19.73 0.00 19.73 0.00 0.00 0.00 0.05 19.78
HT- VII Green Power 10.78 0.00 0.00 0.00 0.00 0.00 0.00 0.00 0.00 0.00 0.00 0.00 0.00
HT- VIII Temporary 3 7.95 0.00 7.91 12.70 6.29 0.00 0.00 6.00 12.29 0.00 12.29 0.00 0.00 0.00 0.01 12.30
RESCOs 0.00 0.00 0.00 0.00 0.00 0.00 0.00 0.00 0.00
0.00 0.00 0.00 0.00 0.00
0.00 0.00 0.00 0.00 0.00
HT Category at 132 kV 60 0.00 2886.12 505.44 0.00 1499.39 212.28 0.00 0.16 -31.39 1680.45 0.00 1680.45 0.00 0.00 0.00 0.00 4.20 1684.64
HT-I Indl General (Segregated) 35 4.90 4200.00 1700.78 473.24 833.38 198.76 0.09 -22.49 1009.75 0.00 1009.75 0.00 0.00 0.00 2.45 1012.19
Lights & Fans 4.90 0.00 49.20 24.11 0.00 0.00 24.11 24.11 0.07 24.18
Industrial Colony consumption 5.68 0.00 15.17 8.62 0.00 0.00 8.62 8.62 0.02 8.64
Seasonal Industries 6.03 4200.00 0.00 0.00 0.00 0.00 0.00 0.00 0.00
HT-I Indrl. Time-of-Day Tariff (6 PM to 10
PM) 5.90 0.00 331.94 195.840.00
0.00 195.84 195.840.47
196.32
HT - I( B) Ferro-alloys 2 4.58 0.00 109.45 50.13 0.00 0.01 50.14 0.00 50.14 0.00 0.00 0.00 0.20 50.33
HT-II - Others (Non- Industrial) 7 6.03 4200.00 40.64 23.40 24.51 9.83 0.02 34.35 0.00 34.35 0.00 0.00 0.00 0.06 34.41
HT-II Others - Time-of-Day Tariff (6 PM
to 10 PM) 7.03 0.00 6.76 4.750.00
0.00 4.75 4.750.01
4.76
HT III: Airports, Bus Stations and Railway
Stations 1 5.72 4200.00 58.00 8.80 33.173.70
0.00 0.10 36.97 0.00 36.97 0.00 0.00 0.000.07
37.04
HT-III - Aviation Time-of-Day Tariff (6 PM
to 10 PM) 6.72 0.00 0.000.00
0.00 0.00 0.000.02
0.02
HT -IV A Lift Irrigation & Agriculture 10 5.37 0.00 407.07 218.60 0.00 0.03 -5.94 212.68 0.00 212.68 0.00 0.00 0.00 0.59 213.28
HT- IV B - CP Water Supply Schemes 4.39 0.00 0.00 0.00 0.00 0.00 0.00 0.00 0.00 0.00 0.00 0.00 0.00
HT-V – RailwayTraction 5 6.36 0.00 167.12 106.29 0.00 0.01 -3.06 103.24 0.00 103.24 0.00 0.00 0.00 0.24 103.48
HT-VI - Townships & Colony Supply 5.68 600.00 0.00 0.00 0.00 0.00 0.00 0.00 0.00 0.00 0.00 0.00 0.00
HT- VII Green Power 10.78 0.00 0.00 0.00 0.00 0.00 0.00 0.00 0.00 0.00 0.00 0.00 0.00
HT- VIII Temporary 7.35 0.00 0.00 0.00 0.00 0.00 0.00 0.00 0.00 0.00 0.00 0.00
RESCOs 0.00 0.00 0.00 0.00 0.00 0.00 0.00 0.00 0.00
0.00 0.00 0.00 0.00 0.00
0.00 0.00 0.00 0.00 0.00
TOTAL( LT + HT) 6586150 14904.41 13362.15 10627.53 5450674.23 11467.09 1476.77 51.18 234.05 -62.18 13166.91 0.00 13166.91 0.00 0.00 0.00 0.00 40.86 13207.77
2015-16
Energy
Charges
(Rs/kWh)
or
(Rs.kVAh
)
Demand
charges
(Rs/kVA/Y
r)
Demand
charges
(Rs/HP/Yr)
Energy
Sales
(MU)
Energy
sales
(MVAh)
Connected
Load/
Contract
Demand
(MW)
Connected
Load/
Contract
Demand
(HP)
Energy
Charges
(Rs
Crores)
Demand
/Fixed
charges
(Rs Crores)
Minimum
Charges
(Rs
Crores)
Customer
Charges
(Rs
crores)
Others
(Rs
Crores)
Gross Tariff
Revenue
(Rs Crores)
Surcharge
(Rs.Crs)
Additional
Surcharge
(Rs.Crs)
DirectApportioned
LT Total - (Existing Categories) 6916013 6288.00 2028.00 15516.96 1942.83 8145.04 5648470.00 5685.17 197.64 27.14 274.40 0.96 6185.31 0.00 6185.31 0.00 0.00 0.00 0.00 64.13 6249.44
Category- Domestic (All) 5159661 17.90 0.00 0.00 7021.44 0.00 5998.93 0.00 2649.17 0.00 19.55 191.08 1.98 2861.78 0.00 2861.78 0.00 25.79 2887.58
Cat I(A) Domestic - upto 50
units/month 1482727 1.45 381 111855.29
0.00 18 47 -2 118.091.40
Cat I(B) Domestic - >50 and upto 100
units/month 1177492 4.05 0.00 0.00 1166.79 0.00 933.67 0.00 224.13 0.00 1.20 46.54 -5.40 266.47 0.00 4.29 4.29
0 - 50 units 1.45 688.98 99.90 0.00 99.90 2.53
51 - 100 units 1,177,492.00 2.60 477.81 933.67 124.23 0.00 1.20 46.54 (5.40) 166.57 1.76
Cat I(c) Domestic- > 100 & upto 200
units/month 1522175 12.40 0.00 0.00 2507.09 0.00 1756.09 0.00 732.61 0.00 0.00 61.32 -1.75 792.18 0.00 9.21 9.21
0 - 50 units 2.60 849.73 220.93 0.00 220.93 3.12
51 - 100 units 2.60 849.73 220.93 0.00 220.93 3.12
101 - 150 units 902,184.00 3.60 629.43 957.66 226.60 0.00 37.67 (0.86) 263.41 2.31
Consumer CategoriesNo of
consumers
Components of tariff Relevant sales related data Full year revenue excluding external subsidy
Incentiv
es
(Rs.
Crs)
Net
Revenue
from Tariff
(Rs.
Crores)
Surcharges
(Open Access) Grid
Support
Charge
s
(Rs.
Crores)
Non - tariff
Income
Total
Revenue
( Net of
incentives)
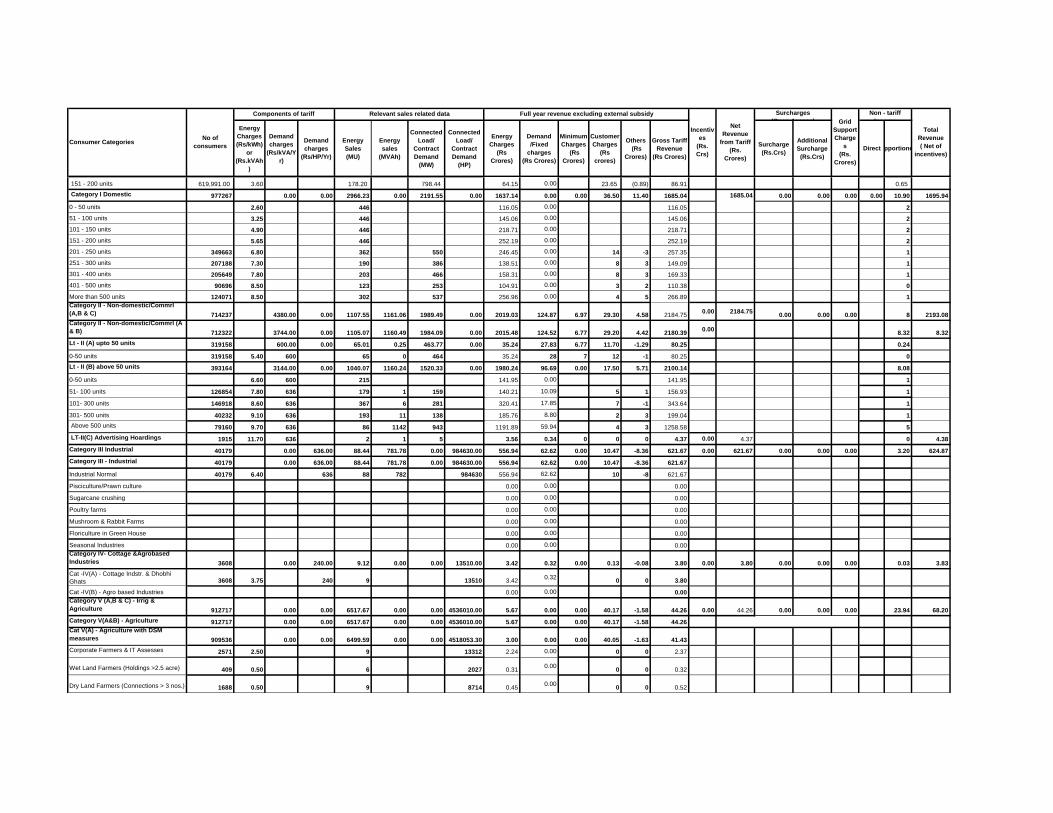
Energy
Charges
(Rs/kWh)
or
(Rs.kVAh
)
Demand
charges
(Rs/kVA/Y
r)
Demand
charges
(Rs/HP/Yr)
Energy
Sales
(MU)
Energy
sales
(MVAh)
Connected
Load/
Contract
Demand
(MW)
Connected
Load/
Contract
Demand
(HP)
Energy
Charges
(Rs
Crores)
Demand
/Fixed
charges
(Rs Crores)
Minimum
Charges
(Rs
Crores)
Customer
Charges
(Rs
crores)
Others
(Rs
Crores)
Gross Tariff
Revenue
(Rs Crores)
Surcharge
(Rs.Crs)
Additional
Surcharge
(Rs.Crs)
DirectApportionedConsumer Categories
No of
consumers
Components of tariff Relevant sales related data Full year revenue excluding external subsidy
Incentiv
es
(Rs.
Crs)
Net
Revenue
from Tariff
(Rs.
Crores)
Surcharges
(Open Access) Grid
Support
Charge
s
(Rs.
Crores)
Non - tariff
Income
Total
Revenue
( Net of
incentives)
151 - 200 units 619,991.00 3.60 178.20 798.44 64.15 0.00 23.65 (0.89) 86.91 0.65
Category I Domestic 977267 0.00 0.00 2966.23 0.00 2191.55 0.00 1637.14 0.00 0.00 36.50 11.40 1685.04 1685.04 0.00 0.00 0.00 0.00 10.90 1695.94
0 - 50 units 2.60 446 116.05 0.00 116.05 2
51 - 100 units 3.25 446 145.06 0.00 145.06 2
101 - 150 units 4.90 446 218.71 0.00 218.71 2
151 - 200 units 5.65 446 252.19 0.00 252.19 2
201 - 250 units 349663 6.80 362 550 246.45 0.00 14 -3 257.35 1
251 - 300 units 207188 7.30 190 386 138.51 0.00 8 3 149.09 1
301 - 400 units 205649 7.80 203 466 158.31 0.00 8 3 169.33 1
401 - 500 units 90696 8.50 123 253 104.91 0.00 3 2 110.38 0
More than 500 units 124071 8.50 302 537 256.96 0.00 4 5 266.89 1
Category II - Non-domestic/Commrl
(A,B & C) 714237 4380.00 0.00 1107.55 1161.06 1989.49 0.00 2019.03 124.87 6.97 29.30 4.58 2184.750.00 2184.75
0.00 0.00 0.00 8 2193.08
Category II - Non-domestic/Commrl (A
& B) 712322 3744.00 0.00 1105.07 1160.49 1984.09 0.00 2015.48 124.52 6.77 29.20 4.42 2180.390.00
8.32 8.32
Lt - II (A) upto 50 units 319158 600.00 0.00 65.01 0.25 463.77 0.00 35.24 27.83 6.77 11.70 -1.29 80.25 0.24
0-50 units 319158 5.40 600 65 0 464 35.24 28 7 12 -1 80.25 0
Lt - II (B) above 50 units 393164 3144.00 0.00 1040.07 1160.24 1520.33 0.00 1980.24 96.69 0.00 17.50 5.71 2100.14 8.08
0-50 units 6.60 600 215 141.95 0.00 141.95 1
51- 100 units 126854 7.80 636 179 1 159 140.21 10.09 5 1 156.93 1
101- 300 units 146918 8.60 636 367 6 281 320.41 17.85 7 -1 343.64 1
301- 500 units 40232 9.10 636 193 11 138 185.76 8.80 2 3 199.04 1
Above 500 units 79160 9.70 636 86 1142 943 1191.89 59.94 4 3 1258.58 5
LT-II(C) Advertising Hoardings 1915 11.70 636 2 1 5 3.56 0.34 0 0 0 4.37 0.00 4.37 0 4.38
Category III Industrial 40179 0.00 636.00 88.44 781.78 0.00 984630.00 556.94 62.62 0.00 10.47 -8.36 621.67 0.00 621.67 0.00 0.00 0.00 3.20 624.87
Category III - Industrial 40179 0.00 636.00 88.44 781.78 0.00 984630.00 556.94 62.62 0.00 10.47 -8.36 621.67
Industrial Normal 40179 6.40 636 88 782 984630 556.94 62.62 10 -8 621.67
Pisciculture/Prawn culture 0.00 0.00 0.00
Sugarcane crushing 0.00 0.00 0.00
Poultry farms 0.00 0.00 0.00
Mushroom & Rabbit Farms 0.00 0.00 0.00
Floriculture in Green House 0.00 0.00 0.00
Seasonal Industries 0.00 0.00 0.00
Category IV- Cottage &Agrobased
Industries 3608 0.00 240.00 9.12 0.00 0.00 13510.00 3.42 0.32 0.00 0.13 -0.08 3.80 0.00 3.80 0.00 0.00 0.00 0.03 3.83
Cat -IV(A) - Cottage Indstr. & Dhobhi
Ghats 3608 3.75 240 9 13510 3.420.32
0 0 3.80
Cat -IV(B) - Agro based Industries 0.00 0.00 0.00
Category V (A,B & C) - Irrig &
Agriculture 912717 0.00 0.00 6517.67 0.00 0.00 4536010.00 5.67 0.00 0.00 40.17 -1.58 44.26 0.00 44.26 0.00 0.00 0.00 23.94 68.20
Category V(A&B) - Agriculture 912717 0.00 0.00 6517.67 0.00 0.00 4536010.00 5.67 0.00 0.00 40.17 -1.58 44.26
Cat V(A) - Agriculture with DSM
measures 909536 0.00 0.00 6499.59 0.00 0.00 4518053.30 3.00 0.00 0.00 40.05 -1.63 41.43
Corporate Farmers & IT Assesses 2571 2.50 9 13312 2.24 0.00 0 0 2.37
Wet Land Farmers (Holdings >2.5 acre) 409 0.50 6 2027 0.310.00
0 0 0.32
Dry Land Farmers (Connections > 3 nos.) 1688 0.50 9 8714 0.450.00
0 0 0.52
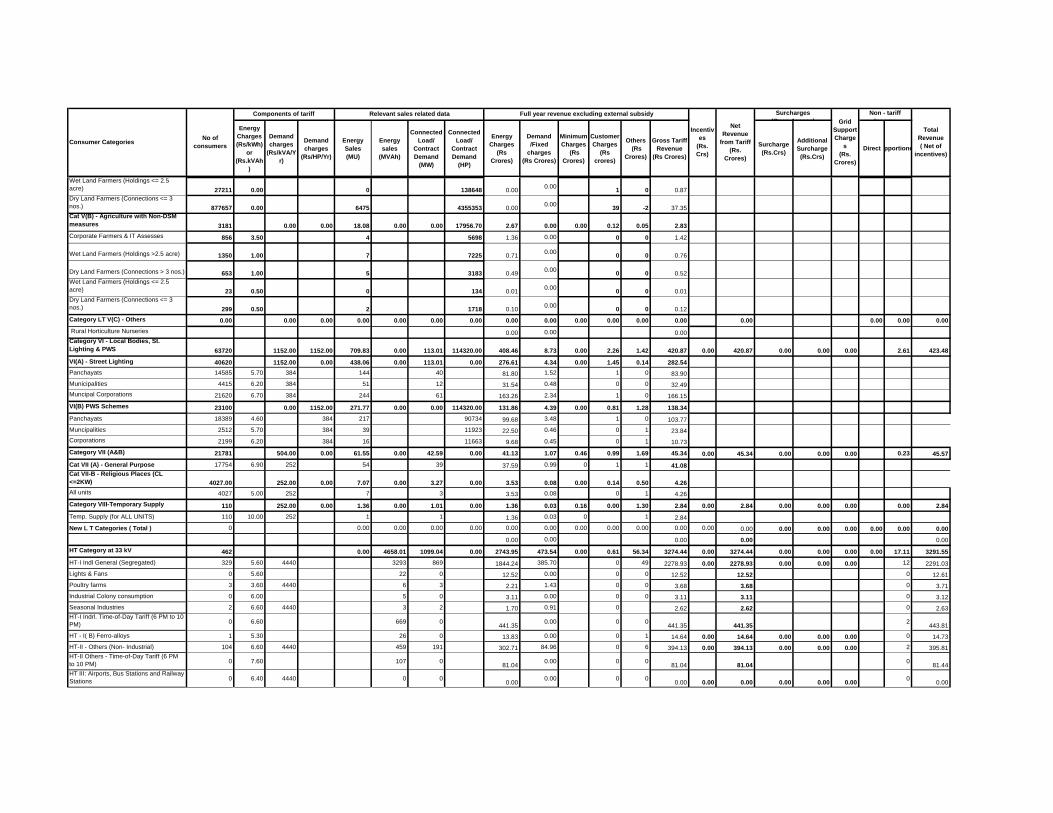
Energy
Charges
(Rs/kWh)
or
(Rs.kVAh
)
Demand
charges
(Rs/kVA/Y
r)
Demand
charges
(Rs/HP/Yr)
Energy
Sales
(MU)
Energy
sales
(MVAh)
Connected
Load/
Contract
Demand
(MW)
Connected
Load/
Contract
Demand
(HP)
Energy
Charges
(Rs
Crores)
Demand
/Fixed
charges
(Rs Crores)
Minimum
Charges
(Rs
Crores)
Customer
Charges
(Rs
crores)
Others
(Rs
Crores)
Gross Tariff
Revenue
(Rs Crores)
Surcharge
(Rs.Crs)
Additional
Surcharge
(Rs.Crs)
DirectApportionedConsumer Categories
No of
consumers
Components of tariff Relevant sales related data Full year revenue excluding external subsidy
Incentiv
es
(Rs.
Crs)
Net
Revenue
from Tariff
(Rs.
Crores)
Surcharges
(Open Access) Grid
Support
Charge
s
(Rs.
Crores)
Non - tariff
Income
Total
Revenue
( Net of
incentives)
Wet Land Farmers (Holdings <= 2.5
acre) 27211 0.00 0 138648 0.000.00
1 0 0.87
Dry Land Farmers (Connections <= 3
nos.) 877657 0.00 6475 4355353 0.000.00
39 -2 37.35
Cat V(B) - Agriculture with Non-DSM
measures 3181 0.00 0.00 18.08 0.00 0.00 17956.70 2.67 0.00 0.00 0.12 0.05 2.83
Corporate Farmers & IT Assesses 856 3.50 4 5698 1.36 0.00 0 0 1.42
Wet Land Farmers (Holdings >2.5 acre) 1350 1.00 7 7225 0.710.00
0 0 0.76
Dry Land Farmers (Connections > 3 nos.) 653 1.00 5 3183 0.490.00
0 0 0.52
Wet Land Farmers (Holdings <= 2.5
acre) 23 0.50 0 134 0.010.00
0 0 0.01
Dry Land Farmers (Connections <= 3
nos.) 299 0.50 2 1718 0.100.00
0 0 0.12
Category LT V(C) - Others 0.00 0.00 0.00 0.00 0.00 0.00 0.00 0.00 0.00 0.00 0.00 0.00 0.00 0.00 0.00 0.00 0.00
Rural Horticulture Nurseries 0.00 0.00 0.00
Category VI - Local Bodies, St.
Lighting & PWS 63720 1152.00 1152.00 709.83 0.00 113.01 114320.00 408.46 8.73 0.00 2.26 1.42 420.87 0.00 420.87 0.00 0.00 0.00 2.61 423.48
VI(A) - Street Lighting 40620 1152.00 0.00 438.06 0.00 113.01 0.00 276.61 4.34 0.00 1.45 0.14 282.54
Panchayats 14585 5.70 384 144 40 81.80 1.52 1 0 83.90
Municipalities 4415 6.20 384 51 12 31.54 0.48 0 0 32.49
Muncipal Corporations 21620 6.70 384 244 61 163.26 2.34 1 0 166.15
VI(B) PWS Schemes 23100 0.00 1152.00 271.77 0.00 0.00 114320.00 131.86 4.39 0.00 0.81 1.28 138.34
Panchayats 18389 4.60 384 217 90734 99.68 3.48 1 0 103.77
Muncipalities 2512 5.70 384 39 11923 22.50 0.46 0 1 23.84
Corporations 2199 6.20 384 16 11663 9.68 0.45 0 1 10.73
Category VII (A&B) 21781 504.00 0.00 61.55 0.00 42.59 0.00 41.13 1.07 0.46 0.99 1.69 45.34 0.00 45.34 0.00 0.00 0.00 0.23 45.57
Cat VII (A) - General Purpose 17754 6.90 252 54 39 37.59 0.99 0 1 1 41.08
Cat VII-B - Religious Places (CL
<=2KW) 4027.00 252.00 0.00 7.07 0.00 3.27 0.00 3.53 0.08 0.00 0.14 0.50 4.26
All units 4027 5.00 252 7 3 3.53 0.08 0 1 4.26
Category VIII-Temporary Supply 110 252.00 0.00 1.36 0.00 1.01 0.00 1.36 0.03 0.16 0.00 1.30 2.84 0.00 2.84 0.00 0.00 0.00 0.00 2.84
Temp. Supply (for ALL UNITS) 110 10.00 252 1 1 1.36 0.03 0 1 2.84
New L T Categories ( Total ) 0 0.00 0.00 0.00 0.00 0.00 0.00 0.00 0.00 0.00 0.00 0.00 0.00 0.00 0.00 0.00 0.00 0.00 0.00
0.00 0.00 0.00 0.00 0.00
HT Category at 33 kV 462 0.00 4658.01 1099.04 0.00 2743.95 473.54 0.00 0.61 56.34 3274.44 0.00 3274.44 0.00 0.00 0.00 0.00 17.11 3291.55
HT-I Indl General (Segregated) 329 5.60 4440 3293 869 1844.24 385.70 0 49 2278.93 0.00 2278.93 0.00 0.00 0.00 12 2291.03
Lights & Fans 0 5.60 22 0 12.52 0.00 0 0 12.52 12.52 0 12.61
Poultry farms 3 3.60 4440 6 3 2.21 1.43 0 0 3.68 3.68 0 3.71
Industrial Colony consumption 0 6.00 5 0 3.11 0.00 0 0 3.11 3.11 0 3.12
Seasonal Industries 2 6.60 4440 3 2 1.70 0.91 0 2.62 2.62 0 2.63
HT-I Indrl. Time-of-Day Tariff (6 PM to 10
PM) 0 6.60 669 0441.35
0.00 0 0441.35 441.35
2443.81
HT - I( B) Ferro-alloys 1 5.30 26 0 13.83 0.00 0 1 14.64 0.00 14.64 0.00 0.00 0.00 0 14.73
HT-II - Others (Non- Industrial) 104 6.60 4440 459 191 302.71 84.96 0 6 394.13 0.00 394.13 0.00 0.00 0.00 2 395.81
HT-II Others - Time-of-Day Tariff (6 PM
to 10 PM) 0 7.60 107 081.04
0.00 0 081.04 81.04
081.44
HT III: Airports, Bus Stations and Railway
Stations 0 6.40 4440 0 00.00
0.00 0 00.00 0.00 0.00 0.00 0.00 0.00
00.00

Energy
Charges
(Rs/kWh)
or
(Rs.kVAh
)
Demand
charges
(Rs/kVA/Y
r)
Demand
charges
(Rs/HP/Yr)
Energy
Sales
(MU)
Energy
sales
(MVAh)
Connected
Load/
Contract
Demand
(MW)
Connected
Load/
Contract
Demand
(HP)
Energy
Charges
(Rs
Crores)
Demand
/Fixed
charges
(Rs Crores)
Minimum
Charges
(Rs
Crores)
Customer
Charges
(Rs
crores)
Others
(Rs
Crores)
Gross Tariff
Revenue
(Rs Crores)
Surcharge
(Rs.Crs)
Additional
Surcharge
(Rs.Crs)
DirectApportionedConsumer Categories
No of
consumers
Components of tariff Relevant sales related data Full year revenue excluding external subsidy
Incentiv
es
(Rs.
Crs)
Net
Revenue
from Tariff
(Rs.
Crores)
Surcharges
(Open Access) Grid
Support
Charge
s
(Rs.
Crores)
Non - tariff
Income
Total
Revenue
( Net of
incentives)
HT-III - Time-of-Day Tariff (6 PM to 10
PM) 0 7.40 0 00.00
0.00 0 00.00 0.00
00.00
HT -IV A Lift Irrigation & Agriculture 14 5.70 22 24 12.48 0.00 0 0 12.02 0.00 12.02 0.00 0.00 0.00 0 12.10
HT- IV B - CP Water Supply Schemes 1 4.60 3 1 1.37 0.00 0 1 1.97 0.00 1.97 0.00 0.00 0.00 0 1.98
HT-VI - Townships & Colony Supply 8 6.00 636 40 8 24.13 0.54 0 1 25.90 0.00 25.90 0.00 0.00 0.00 0 26.05
HT- VII Green Power 0.00 0.00 0.00 0.00 0.00 0.00 0.00 0.00 0 0.00
HT- Temporary 9.90 3 3.26 0.00 0 -1 2.53 0.00 2.53 0.00 0.00 0.00 0 2.54
Rural co-operartives 0.00 0.00 0.00 0.00 0.00 0.00 0.00 0.00 0.00 0.00
0.00 0.00 0.00 0.00 0.00
HT Category at 132 kV 58 0.00 2766.38 938.23 0.00 1500.56 223.92 0.00 0.16 47.19 1771.83 0.00 1771.83 0.00 0.00 0.00 0.00 10.16 1781.99
HT-I Indl General (Segregated) 34 5.10 4440 1696 449 865.16 199.39 0 1 1065.26 0.00 1065.26 0.00 0.00 0.00 6 1071.49
Lights & Fans 0 5.10 1 0 0.36 0.00 0 0 0.36 0.36 0 0.37
Industrial Colony consumption 0 6.00 10 0 5.95 0.00 0 0 5.95 5.95 0 5.99
Seasonal Industries 0 6.40 4440 0 0 0.00 0.00 0 0 0.00 0.00 0 0.00
HT-I Indrl. Time-of-Day Tariff (6 PM to 10
PM) 0 6.10 314 0191.50
0.00 0 0191.50 191.50
1192.65
HT - I( B) Ferro-alloys 2 4.80 4440 130 24 62.53 10.75 0 46 119.08 0.00 119.08 0.00 0.00 0.00 0 119.56
HT-II - Others (Non- Industrial) 6 6.40 4440 51 22 32.75 9.65 0 -1 41.04 0.00 41.04 0.00 0.00 0.00 0 41.23
HT-II Others - Time-of-Day Tariff (6 PM
to 10 PM) 0 7.40 8 06.26
0.00 0 06.26 6.26
06.29
HT III: Airports, Bus Stations and Railway
Stations 1 6.00 4440 48 928.83
4.13 0 -131.84 0.00 31.84 0.00 0.00 0.00
032.02
HT-III - Time-of-Day Tariff (6 PM to 10
PM) 0 7.00 11 07.41
0.00 0 07.41 7.41
07.45
HT -IV A Lift Irrigation & Agriculture 10 5.70 346 369 197.30 0.00 0 4 201.29 0.00 201.29 0.00 0.00 0.00 1 202.56
HT- IV B - CP Water Supply Schemes 0 4.60 0 0.00 0.00 0 0 0.00 0.00 0.00 0.00 0.00 0.00 0 0.00
HT-V – RailwayTraction 5 6.80 151 64 102.51 0.00 0 -1 101.84 0.00 101.84 0.00 0.00 0.00 1 102.39
HT-VI - Townships & Colony Supply 0.00 0.00 0.00 0.00 0.00 0.00 0.00 0.00 0 0.00
HT- VII Green Power 0.00 0.00 0.00 0.00 0.00 0.00 0.00 0.00 0 0.00
HT- Temporary 0.00 0.00 0.00 0.00 0.00 0.00 0.00 0.00 0 0.00
Rural co-operartives 0.00 0.00 0.00 0.00 0.00 0.00 0.00 0.00 0.00
TOTAL( LT + HT) 6923851 15516.96 13962.03 11854.43 5648470.00 12945.96 1606.62 27.14 284.94 146 15010.38 0.00 15010.38 6.16 0.00 0.00 0.00 108.27 15124.81
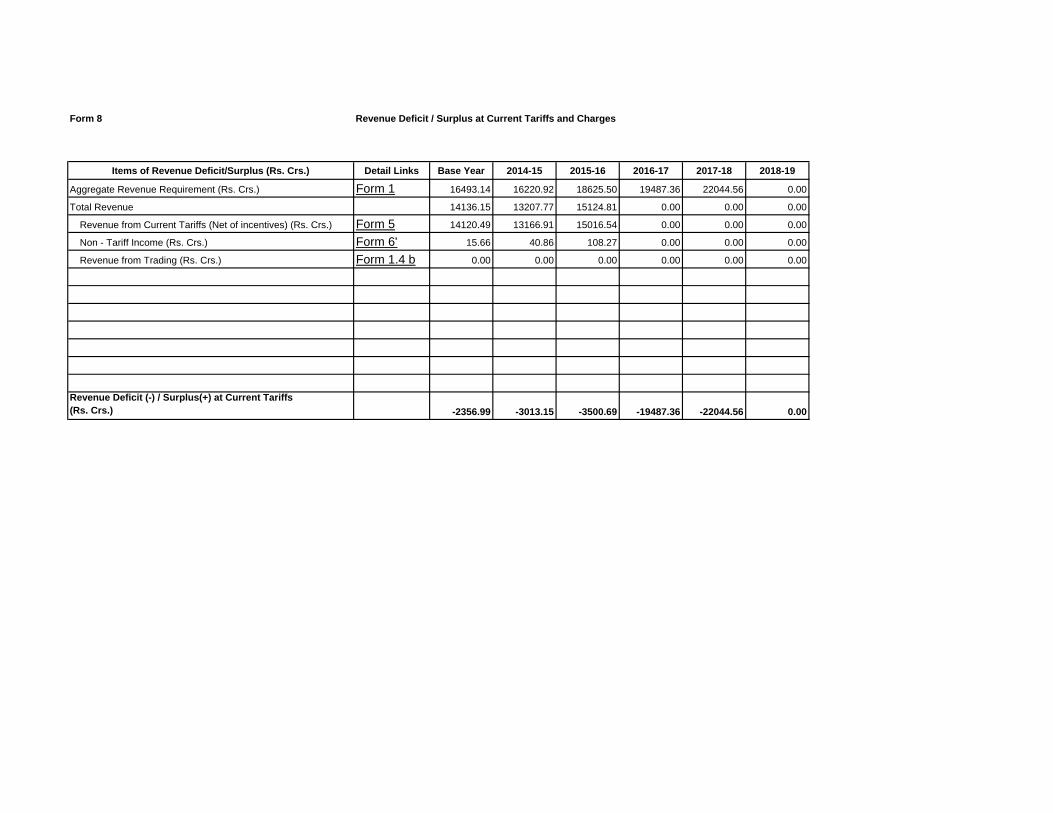
Form 8 Revenue Deficit / Surplus at Current Tariffs and Charges
Items of Revenue Deficit/Surplus (Rs. Crs.) Detail Links Base Year 2014-15 2015-16 2016-17 2017-18 2018-19
Aggregate Revenue Requirement (Rs. Crs.) Form 1 16493.14 16220.92 18625.50 19487.36 22044.56 0.00
Total Revenue 14136.15 13207.77 15124.81 0.00 0.00 0.00
Revenue from Current Tariffs (Net of incentives) (Rs. Crs.) Form 5 14120.49 13166.91 15016.54 0.00 0.00 0.00
Non - Tariff Income (Rs. Crs.) Form 6' 15.66 40.86 108.27 0.00 0.00 0.00
Revenue from Trading (Rs. Crs.) Form 1.4 b 0.00 0.00 0.00 0.00 0.00 0.00
Revenue Deficit (-) / Surplus(+) at Current Tariffs
(Rs. Crs.) -2356.99 -3013.15 -3500.69 -19487.36 -22044.56 0.00

Form 9 Revenue Deficit / Surplus and Proposed Adjustments
Items of Revenue Deficit/ Surplus (Rs. Crs.) Base Year 2014-15 2015-16 2016-17 2017-18 2018-19 Base Year 2014-15 2015-16 2016-17 2017-18 2018-19
A Aggregate Revenue Requirement 16493.14 16220.92 18625.50 20083.49 22044.56 0.00
B Revenue from Current Tariffs (Net of incentives) (Rs. Crs.) 14120.49 13166.91 15016.54 0.00 0.00 0.00
C Non - Tariff Income (Rs. Crs.) 15.66 40.86 108.27 0.00 0.00 0.00
D Revenue from Trading 0.00 0.00 0.00 0.00 0.00 0.00
E Revenue Deficit(-) / Surplus(+) at Current Tariff -2356.99 -3013.15 -3500.69 -20083.49 -22044.56 0.00
F Revenue changed through proposed tariff 0.00
G External subsidy available / contracted 1,627.49 1,014.35 723.79
H Any other means of adjustments 118.35 RLNG subsidy pertains to 2013-14 received from state government
Net Deficit / Surplus -729.50 -1998.79 -2658.55 -20083.49 -22044.56 0.00
Remarks

Form 13 Cost and Revenue
Base Year Amount in Rs crores
Consumer CategoryDetail
LinksCost of Service
Revenue from
Tariff & Charges
(Class Deficit) /
Class Surplus
(=Revenue from
Tariff & Charges -
CoS)
External
Subsidy
Cross
SubsidyRemarks
LT Category 0.00 5632.17 5632.17 0.00 5632.17
Category I (A&B) - Domestic Form 2 0.00 2461.14 2461.14 2461.14
Category II (A,B & C) - Non-domestic/Commercial Form 7 0.00 1929.26 1929.26 1929.26
Category III (A & B) - Industrial 0.00 716.16 716.16 716.16
Category IV (A,B &C) - Cottage Industries & Dhobighats 0.00 7.10 7.10 7.10
Category V (A, B & C) - Irrigation and Agriculture 0.00 48.41 48.41 48.41
Category VI (A & B) - Local Bodies, St. Lighting & PWS 0.00 418.35 418.35 418.35
Category VII (A & B) - General Purpose 0.00 50.81 50.81 50.81
Category VIII (A & B) -Temporary Supply 0.00 0.95 0.95 0.95
HT Category at 11 KV 0.00 3222.68 3222.68 0.00 3222.68
HT-I Industry Segregated 0.00 2029.06 2029.06 2029.06
HT-I (B) Ferro-Alloys 0.00 3.85 3.85 3.85
HT-II - Others 0.00 1035.38 1035.38 1035.38
HT-III Airports, Railway and Busstations 0.00 5.97 5.97 5.97
HT -IV A Lift Irrigation & Agriculture 0.00 22.10 22.10 22.10
HT- IV B - CP Water Supply Schemes 0.00 28.11 28.11 28.11
HT-VI Townships and Residential Colonies 0.00 53.95 53.95 53.95
HT-VII - Green Power 0.00 0.00 0.00 0.00
HT - VIII -Temporary Supply 0.00 44.26 44.26 44.26
HT- RESCOs 0.00 0.00 0.00 0.00
HT Category at 33 KV 0.00 3145.52 3145.52 0.00 3145.52
HT-I Industry Segregated 0.00 2566.47 2566.47 2566.47
HT-I (B) Ferro-Alloys 0.00 127.78 127.78 127.78
HT-II - Others 0.00 405.41 405.41 405.41
HT-III Aviation activity at Airports 0.00 0.00 0.00 0.00
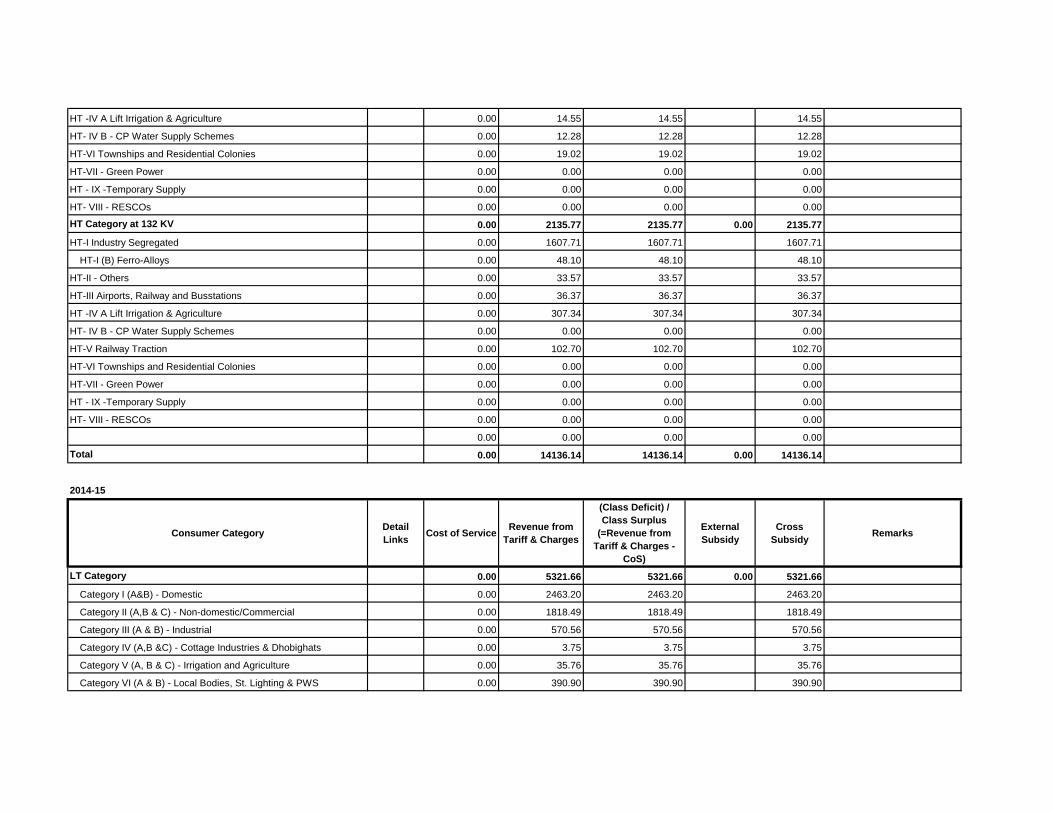
HT -IV A Lift Irrigation & Agriculture 0.00 14.55 14.55 14.55
HT- IV B - CP Water Supply Schemes 0.00 12.28 12.28 12.28
HT-VI Townships and Residential Colonies 0.00 19.02 19.02 19.02
HT-VII - Green Power 0.00 0.00 0.00 0.00
HT - IX -Temporary Supply 0.00 0.00 0.00 0.00
HT- VIII - RESCOs 0.00 0.00 0.00 0.00
HT Category at 132 KV 0.00 2135.77 2135.77 0.00 2135.77
HT-I Industry Segregated 0.00 1607.71 1607.71 1607.71
HT-I (B) Ferro-Alloys 0.00 48.10 48.10 48.10
HT-II - Others 0.00 33.57 33.57 33.57
HT-III Airports, Railway and Busstations 0.00 36.37 36.37 36.37
HT -IV A Lift Irrigation & Agriculture 0.00 307.34 307.34 307.34
HT- IV B - CP Water Supply Schemes 0.00 0.00 0.00 0.00
HT-V Railway Traction 0.00 102.70 102.70 102.70
HT-VI Townships and Residential Colonies 0.00 0.00 0.00 0.00
HT-VII - Green Power 0.00 0.00 0.00 0.00
HT - IX -Temporary Supply 0.00 0.00 0.00 0.00
HT- VIII - RESCOs 0.00 0.00 0.00 0.00
0.00 0.00 0.00 0.00
Total 0.00 14136.14 14136.14 0.00 14136.14
2014-15
Consumer CategoryDetail
LinksCost of Service
Revenue from
Tariff & Charges
(Class Deficit) /
Class Surplus
(=Revenue from
Tariff & Charges -
CoS)
External
Subsidy
Cross
SubsidyRemarks
LT Category 0.00 5321.66 5321.66 0.00 5321.66
Category I (A&B) - Domestic 0.00 2463.20 2463.20 2463.20
Category II (A,B & C) - Non-domestic/Commercial 0.00 1818.49 1818.49 1818.49
Category III (A & B) - Industrial 0.00 570.56 570.56 570.56
Category IV (A,B &C) - Cottage Industries & Dhobighats 0.00 3.75 3.75 3.75
Category V (A, B & C) - Irrigation and Agriculture 0.00 35.76 35.76 35.76
Category VI (A & B) - Local Bodies, St. Lighting & PWS 0.00 390.90 390.90 390.90

Category VII (A & B) - General Purpose 0.00 37.18 37.18 37.18
Category VIII (A & B) -Temporary Supply 0.00 1.82 1.82 1.82
0.00 0.00 0.00 0.00
HT Category at 11 KV 0.00 3183.51 3183.51 0.00 3183.51
HT-I Industry Segregated 0.00 1994.05 1994.05 1994.05
HT-I (B) Ferro-Alloys 0.00 0.00 0.00 0.00
HT-II - Others 0.00 1035.39 1035.39 1035.39
HT-III Airports, Railway and Busstations 0.00 4.26 4.26 4.26
HT -IV A Lift Irrigation & Agriculture 0.00 22.83 22.83 22.83
HT- IV B - CP Water Supply Schemes 0.00 18.87 18.87 18.87
HT-VI Townships and Residential Colonies 0.00 44.51 44.51 44.51
HT-VII - Green Power 0.00 0.00 0.00 0.00
HT- VIII -Temporary Supply 0.00 63.60 63.60 63.60
HT- RESCOs 0.00 0.00 0.00 0.00
0.00 0.00 0.00 0.00
HT Category at 33 KV 0.00 3017.95 3017.95 0.00 3017.95
HT-I Industry Segregated 0.00 2520.58 2520.58 2520.58
HT-I (B) Ferro-Alloys 0.00 36.93 36.93 36.93
HT-II - Others 0.00 416.15 416.15 416.15
HT-III Airports, Railway and Busstations 0.00 0.00 0.00 0.00
HT -IV A Lift Irrigation & Agriculture 0.00 10.67 10.67 10.67
HT- IV B - CP Water Supply Schemes 0.00 1.55 1.55 1.55
HT-VI Townships and Residential Colonies 0.00 19.78 19.78 19.78
HT-VII - Green Power 0.00 0.00 0.00 0.00
HT- VIII -Temporary Supply 0.00 12.30 12.30 12.30
HT- RESCOs 0.00 0.00 0.00 0.00
HT Category at 132 KV 0.00 1684.64 1684.64 0.00 1684.64
HT-I Industry Segregated 0.00 1241.32 1241.32 1241.32
HT-I (B) Ferro-Alloys 0.00 50.33 50.33 50.33
HT-II - Others 0.00 39.17 39.17 39.17
HT-III Airports, Railway and Busstations 0.00 37.06 37.06 37.06
HT -IV A Lift Irrigation & Agriculture 0.00 213.28 213.28 213.28
HT- IV B - CP Water Supply Schemes 0.00 0.00 0.00 0.00
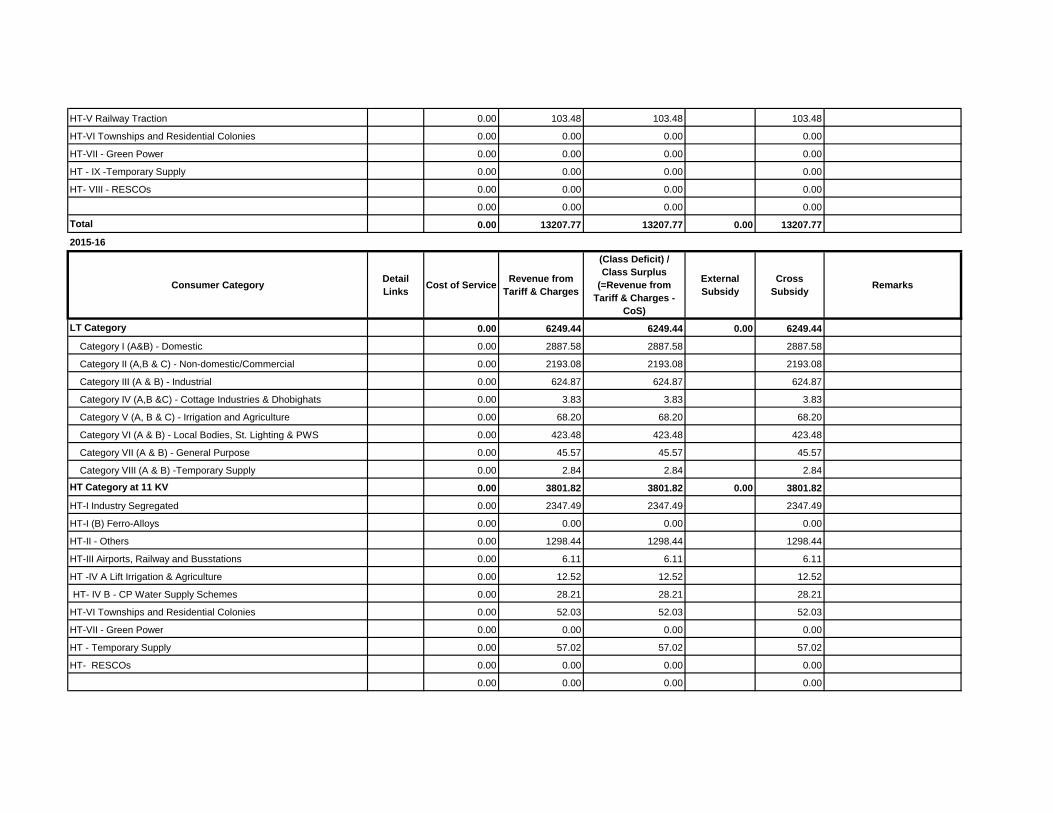
HT-V Railway Traction 0.00 103.48 103.48 103.48
HT-VI Townships and Residential Colonies 0.00 0.00 0.00 0.00
HT-VII - Green Power 0.00 0.00 0.00 0.00
HT - IX -Temporary Supply 0.00 0.00 0.00 0.00
HT- VIII - RESCOs 0.00 0.00 0.00 0.00
0.00 0.00 0.00 0.00
Total 0.00 13207.77 13207.77 0.00 13207.77
2015-16
Consumer CategoryDetail
LinksCost of Service
Revenue from
Tariff & Charges
(Class Deficit) /
Class Surplus
(=Revenue from
Tariff & Charges -
CoS)
External
Subsidy
Cross
SubsidyRemarks
LT Category 0.00 6249.44 6249.44 0.00 6249.44
Category I (A&B) - Domestic 0.00 2887.58 2887.58 2887.58
Category II (A,B & C) - Non-domestic/Commercial 0.00 2193.08 2193.08 2193.08
Category III (A & B) - Industrial 0.00 624.87 624.87 624.87
Category IV (A,B &C) - Cottage Industries & Dhobighats 0.00 3.83 3.83 3.83
Category V (A, B & C) - Irrigation and Agriculture 0.00 68.20 68.20 68.20
Category VI (A & B) - Local Bodies, St. Lighting & PWS 0.00 423.48 423.48 423.48
Category VII (A & B) - General Purpose 0.00 45.57 45.57 45.57
Category VIII (A & B) -Temporary Supply 0.00 2.84 2.84 2.84
HT Category at 11 KV 0.00 3801.82 3801.82 0.00 3801.82
HT-I Industry Segregated 0.00 2347.49 2347.49 2347.49
HT-I (B) Ferro-Alloys 0.00 0.00 0.00 0.00
HT-II - Others 0.00 1298.44 1298.44 1298.44
HT-III Airports, Railway and Busstations 0.00 6.11 6.11 6.11
HT -IV A Lift Irrigation & Agriculture 0.00 12.52 12.52 12.52
HT- IV B - CP Water Supply Schemes 0.00 28.21 28.21 28.21
HT-VI Townships and Residential Colonies 0.00 52.03 52.03 52.03
HT-VII - Green Power 0.00 0.00 0.00 0.00
HT - Temporary Supply 0.00 57.02 57.02 57.02
HT- RESCOs 0.00 0.00 0.00 0.00
0.00 0.00 0.00 0.00
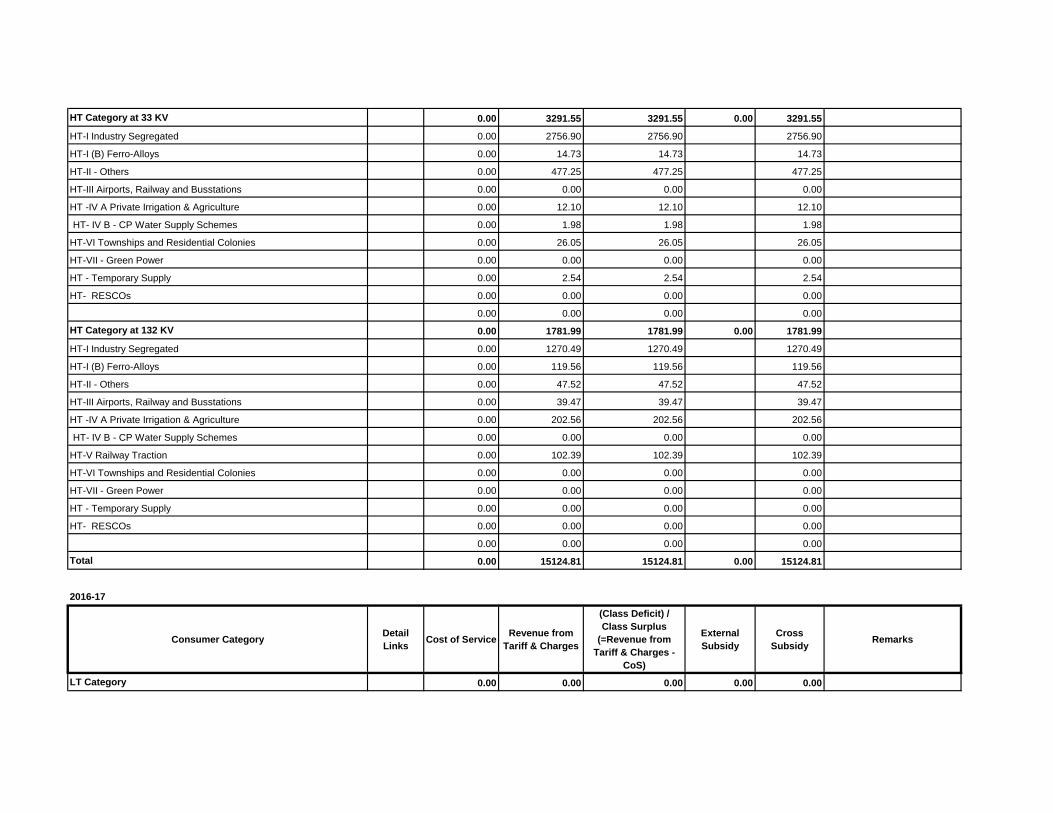
HT Category at 33 KV 0.00 3291.55 3291.55 0.00 3291.55
HT-I Industry Segregated 0.00 2756.90 2756.90 2756.90
HT-I (B) Ferro-Alloys 0.00 14.73 14.73 14.73
HT-II - Others 0.00 477.25 477.25 477.25
HT-III Airports, Railway and Busstations 0.00 0.00 0.00 0.00
HT -IV A Private Irrigation & Agriculture 0.00 12.10 12.10 12.10
HT- IV B - CP Water Supply Schemes 0.00 1.98 1.98 1.98
HT-VI Townships and Residential Colonies 0.00 26.05 26.05 26.05
HT-VII - Green Power 0.00 0.00 0.00 0.00
HT - Temporary Supply 0.00 2.54 2.54 2.54
HT- RESCOs 0.00 0.00 0.00 0.00
0.00 0.00 0.00 0.00
HT Category at 132 KV 0.00 1781.99 1781.99 0.00 1781.99
HT-I Industry Segregated 0.00 1270.49 1270.49 1270.49
HT-I (B) Ferro-Alloys 0.00 119.56 119.56 119.56
HT-II - Others 0.00 47.52 47.52 47.52
HT-III Airports, Railway and Busstations 0.00 39.47 39.47 39.47
HT -IV A Private Irrigation & Agriculture 0.00 202.56 202.56 202.56
HT- IV B - CP Water Supply Schemes 0.00 0.00 0.00 0.00
HT-V Railway Traction 0.00 102.39 102.39 102.39
HT-VI Townships and Residential Colonies 0.00 0.00 0.00 0.00
HT-VII - Green Power 0.00 0.00 0.00 0.00
HT - Temporary Supply 0.00 0.00 0.00 0.00
HT- RESCOs 0.00 0.00 0.00 0.00
0.00 0.00 0.00 0.00
Total 0.00 15124.81 15124.81 0.00 15124.81
2016-17
Consumer CategoryDetail
LinksCost of Service
Revenue from
Tariff & Charges
(Class Deficit) /
Class Surplus
(=Revenue from
Tariff & Charges -
CoS)
External
Subsidy
Cross
SubsidyRemarks
LT Category 0.00 0.00 0.00 0.00 0.00

Category I (A&B) - Domestic 0.00 0.00 0.00 0.00
Category II (A,B, C & D) - Non-domestic/Commercial 0.00 0.00 0.00 0.00
Category III - Industrial 0.00 0.00 0.00 0.00
Category IV (A & B) - Cottage Industries 0.00 0.00 0.00 0.00
Category V (A, B & C) - Irrigation and Agriculture 0.00 0.00 0.00 0.00
Category VI (A & B) - Local Bodies, St. Lighting & PWS 0.00 0.00 0.00 0.00
Category VII (A & B) - General Purpose 0.00 0.00 0.00 0.00
Category VIII -Temporary Supply 0.00 0.00 0.00 0.00
0.00 0.00 0.00
HT Category at 11 KV 0.00 0.00 0.00 0.00 0.00
HT-I Industry Segregated 0.00 0.00 0.00 0.00
HT-I (B) Ferro-Alloys 0.00 0.00 0.00 0.00
HT-II - Others 0.00 0.00 0.00 0.00
HT-III Airports, Railways and Bustations 0.00 0.00 0.00 0.00
HT -IV A Lift Irrigation and agricutlure 0.00 0.00 0.00 0.00
HT- IV B - CP Water Supply Schemes 0.00 0.00 0.00 0.00
HT-VI Townships and Residential Colonies 0.00 0.00 0.00 0.00
HT - VII Temporary Supply 0.00 0.00 0.00 0.00
HT- RESCOs 0.00 0.00 0.00 0.00
0.00 0.00 0.00 0.00
HT Category at 33 KV 0.00 0.00 0.00 0.00 0.00
HT-I Industry Segregated 0.00 0.00 0.00 0.00
HT-I (B) Ferro-Alloys 0.00 0.00 0.00 0.00
HT-II - Others 0.00 0.00 0.00 0.00
HT-III Airports, Railways and Bustations 0.00 0.00 0.00 0.00
HT -IV A Lift Irrigation and agricutlure 0.00 0.00 0.00 0.00
HT- IV B - CP Water Supply Schemes 0.00 0.00 0.00 0.00
HT-VI Townships and Residential Colonies 0.00 0.00 0.00 0.00
HT - VII Temporary Supply 0.00 0.00 0.00 0.00
HT- RESCOs 0.00 0.00 0.00 0.00
0.00 0.00 0.00 0.00
HT Category at 132 KV 0.00 0.00 0.00 0.00 0.00
HT-I Industry Segregated 0.00 0.00 0.00 0.00
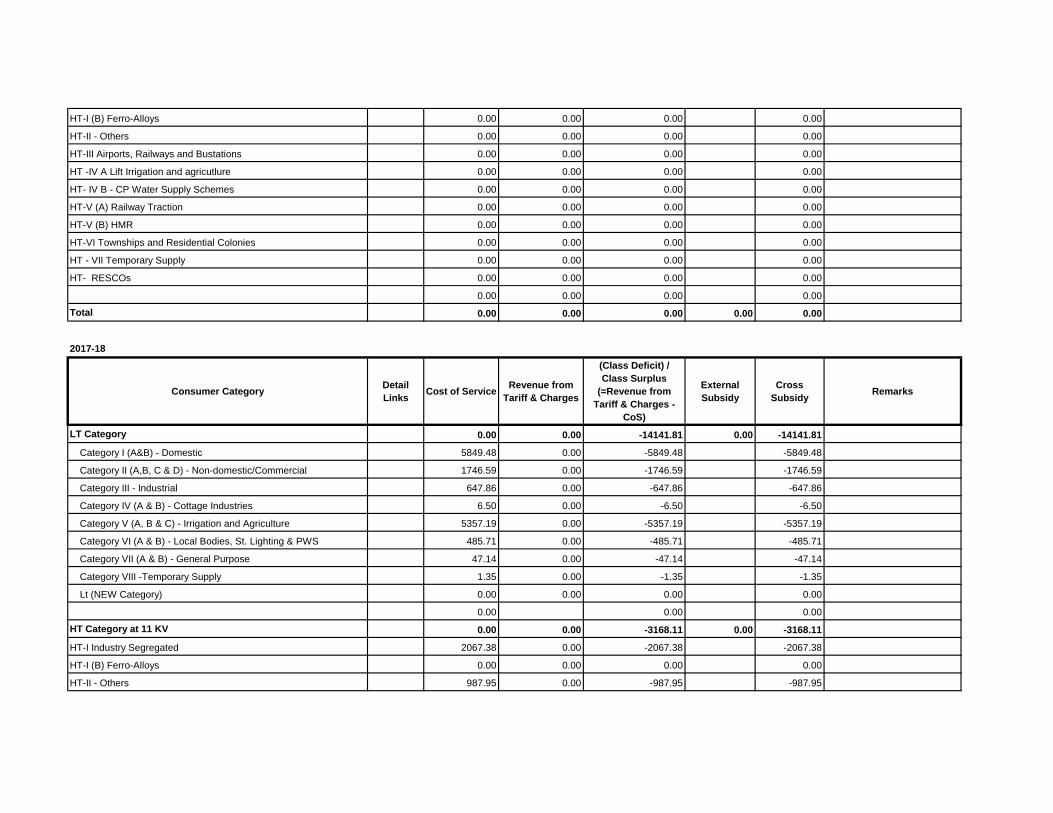
HT-I (B) Ferro-Alloys 0.00 0.00 0.00 0.00
HT-II - Others 0.00 0.00 0.00 0.00
HT-III Airports, Railways and Bustations 0.00 0.00 0.00 0.00
HT -IV A Lift Irrigation and agricutlure 0.00 0.00 0.00 0.00
HT- IV B - CP Water Supply Schemes 0.00 0.00 0.00 0.00
HT-V (A) Railway Traction 0.00 0.00 0.00 0.00
HT-V (B) HMR 0.00 0.00 0.00 0.00
HT-VI Townships and Residential Colonies 0.00 0.00 0.00 0.00
HT - VII Temporary Supply 0.00 0.00 0.00 0.00
HT- RESCOs 0.00 0.00 0.00 0.00
0.00 0.00 0.00 0.00
Total 0.00 0.00 0.00 0.00 0.00
2017-18
Consumer CategoryDetail
LinksCost of Service
Revenue from
Tariff & Charges
(Class Deficit) /
Class Surplus
(=Revenue from
Tariff & Charges -
CoS)
External
Subsidy
Cross
SubsidyRemarks
LT Category 0.00 0.00 -14141.81 0.00 -14141.81
Category I (A&B) - Domestic 5849.48 0.00 -5849.48 -5849.48
Category II (A,B, C & D) - Non-domestic/Commercial 1746.59 0.00 -1746.59 -1746.59
Category III - Industrial 647.86 0.00 -647.86 -647.86
Category IV (A & B) - Cottage Industries 6.50 0.00 -6.50 -6.50
Category V (A, B & C) - Irrigation and Agriculture 5357.19 0.00 -5357.19 -5357.19
Category VI (A & B) - Local Bodies, St. Lighting & PWS 485.71 0.00 -485.71 -485.71
Category VII (A & B) - General Purpose 47.14 0.00 -47.14 -47.14
Category VIII -Temporary Supply 1.35 0.00 -1.35 -1.35
Lt (NEW Category) 0.00 0.00 0.00 0.00
0.00 0.00 0.00
HT Category at 11 KV 0.00 0.00 -3168.11 0.00 -3168.11
HT-I Industry Segregated 2067.38 0.00 -2067.38 -2067.38
HT-I (B) Ferro-Alloys 0.00 0.00 0.00 0.00
HT-II - Others 987.95 0.00 -987.95 -987.95
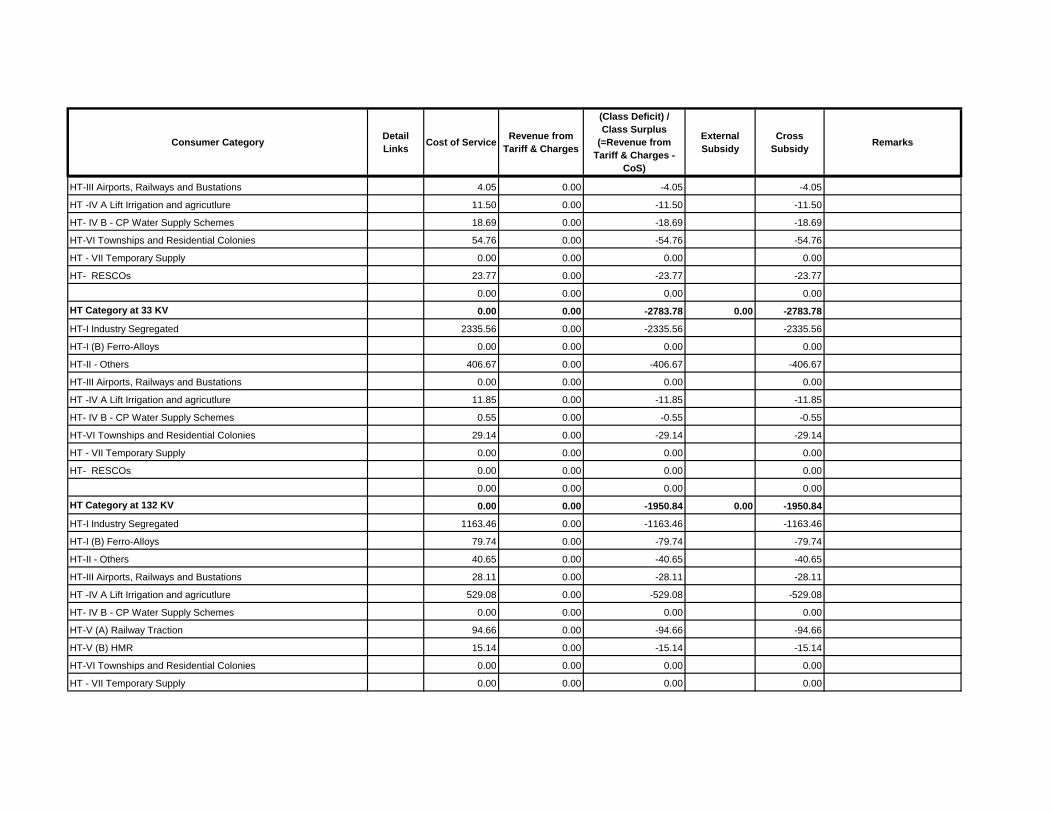
Consumer CategoryDetail
LinksCost of Service
Revenue from
Tariff & Charges
(Class Deficit) /
Class Surplus
(=Revenue from
Tariff & Charges -
CoS)
External
Subsidy
Cross
SubsidyRemarks
HT-III Airports, Railways and Bustations 4.05 0.00 -4.05 -4.05
HT -IV A Lift Irrigation and agricutlure 11.50 0.00 -11.50 -11.50
HT- IV B - CP Water Supply Schemes 18.69 0.00 -18.69 -18.69
HT-VI Townships and Residential Colonies 54.76 0.00 -54.76 -54.76
HT - VII Temporary Supply 0.00 0.00 0.00 0.00
HT- RESCOs 23.77 0.00 -23.77 -23.77
0.00 0.00 0.00 0.00
HT Category at 33 KV 0.00 0.00 -2783.78 0.00 -2783.78
HT-I Industry Segregated 2335.56 0.00 -2335.56 -2335.56
HT-I (B) Ferro-Alloys 0.00 0.00 0.00 0.00
HT-II - Others 406.67 0.00 -406.67 -406.67
HT-III Airports, Railways and Bustations 0.00 0.00 0.00 0.00
HT -IV A Lift Irrigation and agricutlure 11.85 0.00 -11.85 -11.85
HT- IV B - CP Water Supply Schemes 0.55 0.00 -0.55 -0.55
HT-VI Townships and Residential Colonies 29.14 0.00 -29.14 -29.14
HT - VII Temporary Supply 0.00 0.00 0.00 0.00
HT- RESCOs 0.00 0.00 0.00 0.00
0.00 0.00 0.00 0.00
HT Category at 132 KV 0.00 0.00 -1950.84 0.00 -1950.84
HT-I Industry Segregated 1163.46 0.00 -1163.46 -1163.46
HT-I (B) Ferro-Alloys 79.74 0.00 -79.74 -79.74
HT-II - Others 40.65 0.00 -40.65 -40.65
HT-III Airports, Railways and Bustations 28.11 0.00 -28.11 -28.11
HT -IV A Lift Irrigation and agricutlure 529.08 0.00 -529.08 -529.08
HT- IV B - CP Water Supply Schemes 0.00 0.00 0.00 0.00
HT-V (A) Railway Traction 94.66 0.00 -94.66 -94.66
HT-V (B) HMR 15.14 0.00 -15.14 -15.14
HT-VI Townships and Residential Colonies 0.00 0.00 0.00 0.00
HT - VII Temporary Supply 0.00 0.00 0.00 0.00
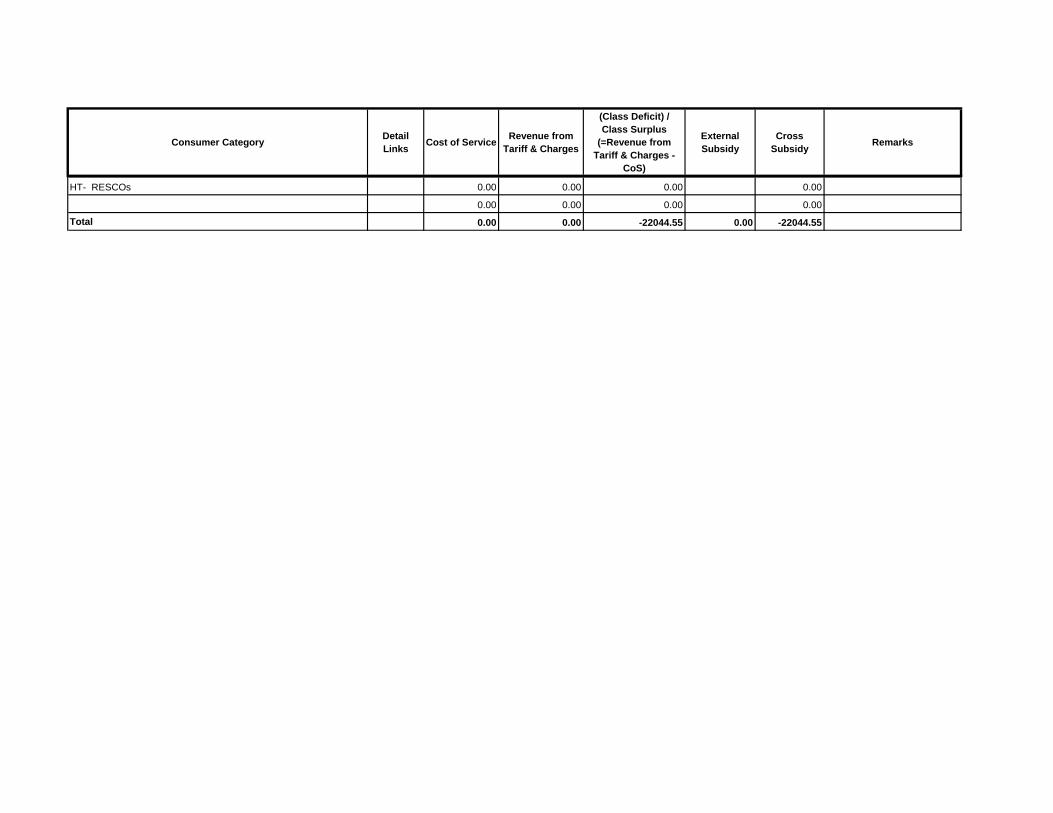
Consumer CategoryDetail
LinksCost of Service
Revenue from
Tariff & Charges
(Class Deficit) /
Class Surplus
(=Revenue from
Tariff & Charges -
CoS)
External
Subsidy
Cross
SubsidyRemarks
HT- RESCOs 0.00 0.00 0.00 0.00
0.00 0.00 0.00 0.00
Total 0.00 0.00 -22044.55 0.00 -22044.55