Southern Corridor Enumeration, Cape Town · of the major trends emerging from the analysis of the...
73
Southern Corridor Enumeration, Cape Town Summary Report 31 MARCH 2017 A member of the SA SDI Alliance
Transcript of Southern Corridor Enumeration, Cape Town · of the major trends emerging from the analysis of the...

Southern Corridor Enumeration, Cape Town
Summary Report
31 MARCH 2017
A member of the SA SDI Alliance

CONTENTS
LIST OF TABLES 4
LIST OF FIGURES 4
LIST OF ACRONYMS AND ABBREVIATIONS 5
1. INTRODUCTION 61.1. Background 6
1.2. Urbanisation 8
1.3. Population and demographic trends and informal settlements growth 8
1.4. Western Cape Government strategic objectives 9
1.4.1. Strategic directive 9
1.4.2. Catalytic projects: The Southern Corridor 9
1.4.3. The Airport Precinct and Kosovo informal settlements 9
1.4.4. TRA 5 and 5.1 10
1.5. Aim and structure of the report 10
2. ENUMERATION METHODOLOGY 122.1. Overall purpose of the enumeration studies 12
2.2. Project objectives 12
2.3. Project deliverables 13
2.4. Enumeration methodology: Participatory data collection 14
2.4.1. Implementation plan 14
2.4.2. Methodology and approach 15
2.4.3. Data collection questionnaire 17
2.4.4. Community-based mapping 17
2.4.5. Project steering committee meetings 18
2.4.6. Creating value through short term employment 18
3. LOCATIONAL ANALYSIS 203.1. Southern Corridor 20
3.2. Airport Precinct informal settlements 21
3.2.1. Locational map 21
3.2.2. Settlement histories 23
3.2.3. Contextual analysis 26
3.2.4. Land use planning considerations 26
3.2.5. Settlement leadership capacity 27
3.3. Kosovo 29
3.3.1. Locational map 29
3.3.2. Settlement history 29
3.3.3. Contextual analysis 30
3.3.4. Land use planning considerations 32
3.3.5. Settlement leadership capacity 33
3.4. Implications for settlement upgrading 34

4. ENUMERATION DATA TRENDS 354.1. Dwelling-type analysis 35
4.1.1. Approach 35
4.1.2. Data trends 36
4.1.3. Summary 44
4.2. Demographic profiles 45
4.2.1. Approach 45
4.2.2. Data trends 45
4.2.3. Summary 48
4.3. Socio-economic profiles 49
4.3.1. Approach 49
4.3.2. Data trends 49
4.3.3 Transport access 53
4.3.4 Medical services 55
4.3.5 Social grants 56
4.3.6. Summary 57
4.4. Access to basic services 58
4.5. Conclusion 60
5. PROFILE OF QUALIFIERS FOR HOUSING SUBSIDY 635.1. Western Cape Government housing subsidy criteria 63
5.2. Methodology 63
5.3. Limitations 64
5.4. Results 64
5.5. TRA 5 and 5.1 beneficiary profiles 67
6. RECOMMENDATIONS AND IMPLICATIONS FOR PLANNING AND DESIGN 686.1. Introduction 68
6.2. Maintain strong community networks 68
6.3. Land, planning and services 68
6.4. Options for tenure 68
6.5. Higher density housing typologies 68
6.6. Social development 68
7. CONCLUSION 69
REFERENCES 71
LIST OF CORE TEAM MEMBERS 72

Summary Report: Southern Corridor Enumeration, Cape Town
4
LIST OF TABLES
Table 1: Objectives of the enumeration studies as per Terms of Reference 12
Table 2: Deliverables as per terms of reference 13
Table 3: Implementation plan and deliverables 14
Table 4: Summary of enumeration services delivered 19
Table 5: Summaries of settlement profiles 22
Table 6: Properties implicated in Airport Precinct informal settlements 26
Table 7: Properties implicated by Kosovo informal settlement 32
Table 8: Percentage breakdown of structure ownership 36
Table 8A: TRA 5 and 5.1 – Means of obtaining dwelling unit 37
Table 9: Breakdown of main structure uses 38
Table 10: Number of rooms per structure 39
Table 11: Number of people per structure 40
Table 12: Structure sizes categorised 41
Table 13: Structure size per person categorised 42
Table 14: Number of years residents have lived in the settlement 43
Table 15: Breakdown of age categories 45
Table 16: Age of single person households 46
Table 17: Gender split of single person households in percentage terms 47
Table 18: Gender split of all residents 48
Table 19: Nationality of residents 48
Table 20: Employment status by gender for respondents aged 16 years and older - ALL settlements 49
Table 20A: Employment status TRA 5 and TRA 5.1 49
Table 21: Income distribution for all settlements 50
Table 21A: Income distribution–TRA 5 and 5.1 50
Table 22: Expenses distribution for all settlements 51
Table 23: First port of call for medical assistance 56
Table 24: Summary of social grants received 57
Table 25: Summary of access to basic services 59
Table 26: Summary of potential housing subsidy qualifiers BNG 65
Table 26: Summary of potential housing subsidy qualifiers BNG 66
Table 26A: Beneficiary profile – TRA 5 and 5.1 67
LIST OF FIGURES
Figure 1: Pre-implementation and field work process flow chart 16
Figure 2: Locational context of settlements in the Airport Precinct 21
Figure 3: Kosovo locational context 29
Figure 4: Transport for Cape Town graphical representation of the Philippi transport node 31
Figure 5: Mode of transport – Work 53
Figure 6: Mode of transport – School 53
Summary Report: Southern Corridor Enumeration, Cape Town
5
LIST OF ACRONYMS AND ABBREVIATIONS
BEPP - Built Environment Performance PlanCoCT - City of Cape TownCORC - Community Organisation Resource CentreDMS - Development Management SchemeEPWP - Expanded Public Works ProgrammeFEDUP - Federation of the Urban and Rural PoorGIS - Geographical Information SystemsGPS - Global Positioning SystemHDA - Housing Development AgencyICDG - Integrated Cities Development GrantIDA/TRA - Incremental Development Area/ Temporary Relocation AreaISN - Informal Settlement NetworkMEC - Member of the Executive CouncilMSEIZ - Metro South East Integration ZoneNGO - Non-Governmental OrganisationPMM - Professional Mobile MappingPSC - Project Steering CommitteeSASSA - South African Social Security AgencySC - Sub-CouncilSA SDI Alliance - South African Slum Dwellers International AllianceSDI - Slum Dwellers InternationalStatsSA - Statistics South AfricaUISP - Upgrading of Informal Settlement ProgrammeWCG - Western Cape Government
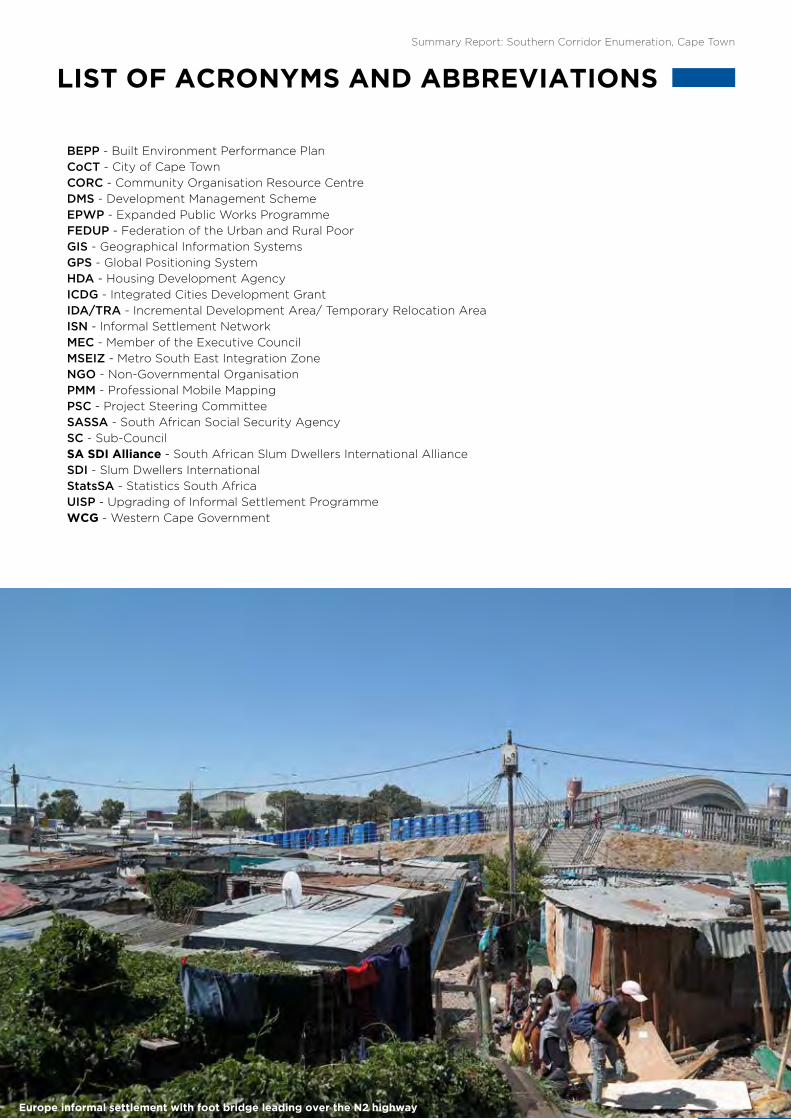
Europe informal settlement with foot bridge leading over the N2 highway

Summary Report: Southern Corridor Enumeration, Cape Town
6
Introduction01
1. INTRODUCTION
1.1. BACKGROUND
The Western Cape Government, in partnership with the City of Cape Town, identified the need to conduct in-depth, household level enumeration studies of the following eleven (11) informal settlements: Barcelona, Gxagxa, Kanana, Lusaka, Europe, Vukuzenzele, Thabo Mbeki, KTC, Hlazo Village, Tsunami IDA/TRA and Kosovo. Enumeration studies are a necessary step in the pre-planning phases of informal settlement upgrading. These settlements are located in the Airport Precinct which forms part of the Southern Corridor Integrated Human Settlements Programme. TRA 5 and 5.1 located on Symphony Way are also part of the Airport Precinct and were enumerated by Housing Development Agency (HDA) service provider Professional Mobile Mapping (PMM). Where possible, data of these reports is incorporated into this summary report.
Informal settlements have an evolutionary nature, and enumeration studies generate much needed data on settlement characteristics. The need for such detailed data for planning purposes is compounded by the inadequacy of census data collected every 10 years.
The Western Cape Government appointed the Community Organisation Resource Centre (CORC) through a competitive bidding process to undertake the task of conducting detailed enumeration studies in the above-mentioned 11 informal settlements.
This report is a high level aggregation of findings from the eleven enumeration studies. The purpose of the report is to provider the reader/ user with a summary of the major trends emerging from the analysis of the enumeration data collected. A shorter 5 page Executive Summary report of this report is available for those seeking a high level summary overview.
By understanding the trends in the enumeration data, more informed decisions can be made in the planning stages for informal settlement upgrading. By using the enumeration data, the proportion of potential qualifiers for a housing subsidy was calculated, but is subject to a final check against the Housing Subsidy Scheme database. The report also presents overarching recommendations to be considered in the planning of informal settlement upgrading initiatives.
The combined enumeration studies of settlements in the Southern Corridor yielded the following results:
• 13 enumerated settlements (all by CORC and community partners, FEDUP and ISN except TRA 5 and 5.1)
• 21 313 dwellings counted (of which 19 459 or 90% were enumerated)• 20 715 households recorded in 19 459 dwellings• A total population count of 48 794 people • An average household size of 2.3 people

Summary Report: Southern Corridor Enumeration, Cape Town
7
Proximity of Kanana informal settlement to N2 highway
Introduction01
Vukuzenzele proximity to airport and N2 highway
COMMUNITY VOICES“The advantages to be in Kanana are for work. There is this airport industria where most of the people of Kanana are working. We also have malls where some people are working. The train is not far from Kanana so some people take the train to go to Epping.” - Kanana resident
COMMUNITY VOICES“Most people are sick because of the dirtiness of the toilets and the waste. When the taxis pass, we inhale all those dirty things and then we get sick. Then our children will also get sick. The children are also not safe because they play there alongside the steps near the N2 road.” - Vukuzenzele resident

Summary Report: Southern Corridor Enumeration, Cape Town
8
Introduction011.2. URBANISATION
South Africa, like other developing countries, has seen a rapid rise of informal settlements in major cities.1 Chapter 8 of the National Development Plan provides insight into the formation of informal settlements. The growth of informal settlements is attributed to a number of factors that can be grouped under two broad categories i.e. urbanisation and population growth. In terms of urbanisation, people migrate into cities in search of economic opportunities, access to better amenities and services, and city-life. Informal settlements are often the first point of arrival for rural migrants, since affordable housing in well located areas is not always possible. With respect to population growth, census figures have shown a consistent increase in the population size and growth rates of the country. In addition, there is a growing phenomenon of young adults who split from families in order to set up home elsewhere in pursuit of independence. This further compounds the problems associated with housing demand.2
The Western Cape Province accounts for 11.2 % of South Africa’s total population with 5 823 000 residents. Of the total Provincial population, 64% lives in the City of Cape Town metropolitan area (StatsSA 2011). The population size in the Province increased by 2.6% per year between 2001 and 2011 while the average household size declined from 4 in 1990 to 3.4 in 2011, placing increased pressure on the demand for services and housing. It is expected that housing would be affected by increases in population size and the decline of household size, which puts an additional strain on the state’s available resources to provide adequate housing for the population.
1.3. POPULATION AND DEMOGRAPHIC TRENDS AND INFORMAL SETTLEMENTS GROWTH
Between 1994 and 2011, the number of informal settlements in South Africa increased from approximately 300 to about 2700 and it is estimated that 1.25 million households live in these settlements (NDHS, 2014). According to Statistics South Africa (Stats SA) 52000 more households In the Western Cape were living in informal settlement shacks (not in backyards) in 2013 than in 2001. At the time of the 2001 census, 142 706 households lived in informal settlement shacks (not in backyards) in the Western Cape, while at the time of the 2011 Census, 191 668 lived in informal settlement shacks (HDA, 2013:11). In 2013, approximately 193 000 households lived in 204 informal settlement areas in the City of Cape Town. This number increases each year.
These statistics clearly illustrate that government needs to address informality as a matter of priority. As a starting point, policy and implementation need to align to the Western Cape Department of Human Settlements’ strategic direction of allocating more resources to the Upgrading of Informal Settlements Programme (UISP) in order to improve the living conditions of informal settlement dwellers and those living in backyards who continue to wait for a housing opportunity.
1 HDA. 2013b. South Africa: Informal Settlements Status. 2 Todes, A. et al. 2010. Contemporary South African Urbanisation Dynamics. Urban Forum 21:331–348

Summary Report: Southern Corridor Enumeration, Cape Town
9
Introduction011.4. WESTERN CAPE GOVERNMENT STRATEGIC OBJECTIVES
1.4.1. Strategic directiveIn 2014, the national Minister of Human Settlements announced that the Department would embark on the delivery of catalytic human settlements projects to capitalise on the economies of scale of such projects. Subsequently, the Minister of the Western Cape Department of Human Settlements (WCDHS), Bonginkosi Madikizela announced in his 2015 Budget Speech that the Department had identified 5 catalytic and 9 priority projects in the province, which would be funded and jointly implemented with the National Department of Human Settlements (NDHS).
1.4.2. Catalytic projects: The Southern CorridorThe Southern Corridor Integrated Human Settlements Project (hereafter ‘the Southern Corridor’) is one of the catalytic projects and is comprised of several projects within the City of Cape Town’s area of jurisdiction. The Southern Corridor is a major component of the City of Cape Town’s Metro South East Integration Zone (MSEIZ) designated according to the guidelines set by National Treasury to access the performance-based Integrated Cities Development Grant (ICDG). These plans are more fully presented in the City of Cape Town Built Environment Performance Plans. The significance of the Southern Corridor is discussed more fully in section 3.
1.4.3. The Airport Precinct and Kosovo informal settlements The Airport Precinct and Kosovo are two projects that will be implemented through the Southern Corridor Project. The Airport Precinct consists of ten (10) informal settlements, namely: Barcelona, Gxagxa, Lusaka, Kanana, Vukuzenzele, Europe, Thabo Mbeki, KTC, Tsunami IDA/TRA, and Hlazo Village. These settlements form a strip of between 200 and 500 metres wide along the southern border of the N2. The majority of settlements border Steve Biko Street to the northwest and Borcherds Quarry Road to the southeast, stretching 2.5km in a northwest-southeast direction. The settlements of Barcelona, Gxagxa, Lusaka, Kanana, Vukuzenzele, and Europe were enumerated in the first phase of the government contract. Thabo Mbeki, KTC, Tsunami IDA/TRA and Hlazo Village were enumerated in the second phase of the contract and form part of the Airport Precinct.
Kosovo informal settlement is one of the densest settlements in Cape Town. The settlement is located on 28.64 hectares of partly City-owned, partly privately-owned land with a population density of 212 dwelling units per hectare. A total of 14 830 people make up 5824 households in Kosovo, with an average of 2.5 people per household. Kosovo is centrally located in the Philippi CBD node, and is bounded by the central railway line and Philippi Station to the north, Parkway Drive to the west, the R300 to the south and the Philippi Police Academy to the east. Kosovo is 23 km southeast of Cape Town’s CBD and only 1.7km (or a 20-minute walk) from the Philippi business centre.
COMMUNITY VOICESWe moved to Barcelona because we were renting in the location [township] and people were treated badly by the owners of the land. They [the owners] wanted us to share everything with them. Some were running away from the war that was happening in Crossroads back then and the halls were full. We were about six in the same room, so we decided to come here to Barcelona. - Barcelona resident

Summary Report: Southern Corridor Enumeration, Cape Town
10
1.4.4. TRA 5 and 5.1The Housing Development Agency (HDA) appointed Professional Mobile Mapping (PMM) to enumerate residents of TRA 5 and TRA 5.1 which are two Temporary Relocation Areas located on Symphony Way. These enumerations were conducted between 7 October and 13 November 2016.
Due to the differences in the data collected, it is not possible to insert TRA 5 and TRA 5.1 data into the data tables generated by CORC’s analysis. Only when explicit mention is made to TRA 5 and TRA 5.1, data for these settlements are incorporated. Therefore whenever a table refers to ‘all settlements’, data refers to all settlements enumerated by CORC and by implication excludes TRA 5 and TRA 5.1 data.
Data on TRA 5 and TRA 5.1 was incorporated into the following data tables:
Table 4: Enumeration key datesTable 5: Summaries of settlement profilesTable 8A: TRA 5 and 5.1 – Means of obtaining dwelling unitTable 9: Main usesTable 18: Gender split of all residentsTable 20A: Employment status- TRA 5 and 5.1Table 21A: Income distribution – TRA 5 and 5.1Table 25A: Beneficiary profile – TRA 5 and 5.1
1.5. AIM AND STRUCTURE OF THE REPORT
This first section presented a background to the need for enumeration studies in the identified catalytic projects, namely the Southern Corridor which incorporates the Airport Precinct and Kosovo. The Southern Corridor is also a major component of the City of Cape Town’s Metro South-East Integration Zone, and hence, a top investment priority according to National Treasury guidelines. In section 2, the purpose and objectives, deliverables, and service provider methodology is presented.
The remainder of the report is an overarching representation of the significant trends which emerged from the analysis of enumeration and spatial data. In section 3, the locational characteristics of the Airport Precinct and the strategic location of Kosovo are discussed. In line with the ‘urban network’ identification of the City of Cape Town, it is argued that the settlements represent a significant opportunity to demonstrate participatory upgrading. The constraints and risks are also alluded to. These need to be addressed with urgency. In section 4, key data trends for the 7 informal settlements in the study are presented. The presentation of key data trends focuses on the implications for generating a socio-economic and demographic profile and understanding community dynamics. In section 5, the discussion turns to data trends related to options for settlement planning and determining housing beneficiaries. Based on the empirical evidence of enumeration and spatial data, recommendations for settlement planning are presented in section 6, and the report is concluded in section 7.
Introduction01

Summary Report: Southern Corridor Enumeration, Cape Town
11
Overview of Kanana
Overview of Tsunami
Streetview of Vukuzenzele
Overview of KTC

Summary Report: Southern Corridor Enumeration, Cape Town
12
2. ENUMERATION METHODOLOGY
Enumeration methodology
022.1. OVERALL PURPOSE OF THE ENUMERATION STUDIES
The overall purpose of the enumeration study was to gather data and information at household level in order to understand the profile of households, social networks and the level of services in the informal settlement pockets that form part of the Southern Corridor and more specifically the Airport Precinct and Kosovo. The data and information gathered will assist the Department of Human Settlements to understand the status quo of each informal settlement pocket in order to develop credible settlement profiles which will assist with determining human settlement needs per household, informing decision making, and future planning for the informal settlement pockets. Detailed analysis of the enumeration is presented in the individual enumeration reports, while this Summary Report presents an overarching review of the trends as observed in individual reports.
2.2. PROJECT OBJECTIVES
The Department of Human Settlements communicated the following anticipated outcomes of the enumeration studies in the supporting documents of the Terms of Reference.
Table 1: Objectives of the enumeration studies as per Terms of Reference
Objective Description Outcome
1Negotiate, design, implement and manage a stakeholder participation process
Stakeholder mobilisation and sensitisation, and preparation for enumeration data collection
2 Conduct a household level enumeration exercise
Appointment and training of teams, and data collection.
3 Conduct GIS mapping of all households
Appointment and training of teams, and shack numbering and mapping.
4 Analyse the data collected for each settlement
Data collection and analysis through STATA and ArchGIS 10.
5Record existing social infrastructure and socio-economic opportunities
Spatial distribution of services in settlements
6Develop a database which will provide a profile of each household and each informal settlement
Database development, data analysis and reporting
Lusaka resident numbers a structure / spaza shop

Summary Report: Southern Corridor Enumeration, Cape Town
13
Enumeration methodology
022.3. PROJECT DELIVERABLES
In line with the project outcomes, the following deliverables were communicated in the Terms of Reference.
Table 2: Deliverables as per terms of reference
ToR Schedule
Deliverable Description
3.2.1 An inception reportDetailing the project plan, data collection methodology, analysis process, and outputs and milestones.
3.2.2 Pre-implementation report & fieldwork plan
Outlining the different elements involved in the implementation of the fieldwork process.
3.2.3Stakeholder participation and engagement plan
Presenting a strategy for stakeholder engagement during the enumeration.
3.2.4Collection of data in a database of households/ settlement conditions
Populated, standardised and structured database in a format that will support the development of settlement profiles.
3.2.5 Draft enumeration reports
Draft reports for input, comment and feedback from the Project Steering Committee.
3.2.6 Final enumeration reports
Final reports for input, comment and feedback from the Project Steering Committee.
3.2.7 Presentations to key stakeholders
Presentation on the findings and lessons learned from the study with recommendations.
3.2.8Final and close out project management report
Documenting the outputs and outcomes of the deliverables.
Overview of Europe

Summary Report: Southern Corridor Enumeration, Cape Town
14
Enumeration methodology
022.4. ENUMERATION METHODOLOGY: PARTICIPATORY DATA COLLECTION
2.4.1. Implementation planIn response to the Terms of Reference and deliverables communicated by the Department of Human Settlements, the service provider (CORC) developed an implementation plan which would see the scope of work carried out over six phases.
Table 3: Implementation plan and deliverables
Phase Description Deliverable
1 Project preparation and planning
• Inception report• Finalisation of the questionnaire • Pre-implementation report and fieldwork plan• Stakeholder participation and engagement
plan
2 Stakeholder engagement and informal settlement mobilisation
• Enumerators identified in each of 7 settlements
• GIS mapping teams identified in each of 7 settlements
3 Enumeration and mapping training and data collection implementation
• Enumeration training workshops• Mapping team workshops• Numbering of structures• Data collection (verified database)• GIS mapping (verified geo-spatial databases)• Verification of data and mapping • Database management and quality control• Combined spatial and enumeration database
4 Analysis and report writing
• Draft enumeration reports for each settlement• Draft higher level report with aggregated data
of enumeration data trends • Draft executive report outlining main findings
5 Final enumeration report production and presentation to key stakeholders
• Final household report for 7 settlements• Final higher level report with aggregated data
of enumeration data trends • Final executive report outlining main findings• Presentation of final reports to stakeholders
6 Final close out and management report
• General project information – processes followed, outputs and outcomes
• Management effectiveness – team leader report
• Lessons learned and recommendations• Administrative closure• Contract closure• Project close out approval• References

Summary Report: Southern Corridor Enumeration, Cape Town
15
Enumeration methodology
022.4.2. Methodology and approachCORC and its community partners FEDUP and ISN have more than ten years experience in conducting household level enumerations, and since 2009 have carried out 134 informal settlement enumerations across South African cities documenting household level data and spatial mapping of 65 400 informal settlement households. The collective experiences of empowering informal settlement residents to carry out primary data collection and mapping alongside established community committees has illustrated the power of working closely with communities to conduct such studies. This approach leads to deeper and more meaningful community participation, stronger community leadership, and opens possibilities for updating enumeration data on an ongoing basis.
More recently, the National Upgrading Support Programme (NUSP) acknowledged the methodologies of CORC and its community partners in Part 3 of its Informal Settlement Upgrading Resource Manual titled Building Partnerships.3 CORC applied this deep participatory data collection methodology throughout the implementation of the enumeration studies project, which included data collection with an approved questionnaire and a community-based mapping methodology.
The following flow diagram outlines the process designed in the implementation of the project.
3 NUSP, 2014. Resource Kit. http://upgradingsupport.org/resources
Kosovo residents note down structure numbers while enumerating

Summary Report: Southern Corridor Enumeration, Cape Town
16
Enumeration methodology
02
Figure 1: Pre-implementation and field work process flow chart
Final enumeration report, settlement maps and final datasets, engagement with stakeholders
DATA COLLECTION FIELDWORK: ENUMERATION
PREPARATION
Carry out field visits in order to identify stakeholders, hold discussions and understand settlement layout.
Training workshop and settlement familiarisation through satellite images
Prepare field maps (creating sections on the map), questionnaires, stationery etc.
Number all structures and indicate on field maps, update new structures on map
Collect spatial data using the GPS device.
Consolidate spatial data, household data onto a settlement register, link enumeration data and GIS maps
Hold stakeholder meetings on enumeration, identify community enumeration team, define roles, questionnaire review and design
Build awareness within the settlement through general meetings, or sectional/block meetings and an event launch. Community familiarises with the enumeration questionnaire
Administer house to house questionnaires
Record all disputes and issues requiring clarification or adjudication
Hold community meeting to discuss data outcomes and rectify on data disputes
Collect household information using the android and create a household database
Preliminary data analysis, create data tables for verification
Display data publicly within the settlement, issue house to house data verification forms
DATA VERIFICATION

Summary Report: Southern Corridor Enumeration, Cape Town
17
Enumeration methodology
022.4.3. Data collection questionnaireThe Department shared a two-page draft questionnaire used by the City of Cape Town when previously conducting household surveys. After the two-page questionnaire was reviewed by the Department and CORC, it was decided that the questionnaire should be amended and expanded in order to maximise the opportunity the study offered to gather appropriate data and information on the households and settlements. CORC developed a new questionnaire, based on its experience, which extended over 100 questions. These were pre-coded to the electronic Trimble devices used to conduct the enumeration. Enumeration teams were trained in all settlements.
2.4.4. Community-based mappingThe City of Cape Town provided the latest aerial photos for the Airport Precinct and Kosovo, and the service provider digitised the structures in ArcGIS 10. Common errors in GIS mapping for the purposes of informal settlement upgrading include not verifying aerial photographs with detailed mapping in the informal settlements. For example, from aerial photos a vehicle or an overhang might be misjudged as a structure. To avoid this error, the service provider maintained a strict policy of verifying first draft GIS maps with the community mapping team. The mapping team verified each structure identified from aerial photographs, and added new structures that might have been constructed since the aerial photography was taken.
The mapping exercises in the settlement enumeration involved the capturing of coordinates for each structure using the GPS component of the Trimble devices. New shack numbers were applied to shacks which is the common denominator/link between the enumeration database and the GIS data. This link between the enumeration and spatial database means that a detailed spatial analysis was carried out and that maps were generated to support planning considerations.
Barcelona residents study a map of their settlement ahead of enumerating structures

Summary Report: Southern Corridor Enumeration, Cape Town
18
2.4.5. Project steering committee meetingsThe Terms of Reference specified that a Project Steering Committee (PSC) would oversee the management of the enumeration studies project. Ten members of the Western Cape Government and two members of the service provider served on the PSC.
Monthly progress reports were compiled. Following the submission of draft reports, the Department’s comments and feedback were incorporated into the report. In some cases, requests for further information were incorporated in the reports. Finalised reports were submitted to the Department for sign off.
2.4.6. Creating value through short term employmentEach of the eleven settlements was exposed to the same methodology. The only difference related to the length of time required for data gathering, which was based on the settlements’ varying sizes. The use of a common methodology ensured that information and data across the settlements studied could be compared.
While the enumeration studies were executed, 633 short term employment opportunities were created which ranged from one to 50 days.
Enumeration methodology
02
Short term employment through data collection - Vukuzenzele residents note down structure numbers
CORC enumeration coordinator (centre right) explains functionality of the Trimble device

Su
mm
ary
Rep
ort
: So
uth
ern
Co
rrid
or
En
um
erat
ion
, Cap
e To
wn 19
Tab
le 4
: Sum
mar
y o
f en
umer
atio
n se
rvic
es
del
iver
ed
Barc
elo
na
Gxag
xa
/Ne
w
Re
stK
an
an
aL
usa
ka
Eu
rop
eV
uku
-ze
nze
leT
hab
o
Mb
eki
KT
CT
sun
am
iID
A/T
RA
Hla
zo
V
illa
ge
Ko
sov
oT
RA
5T
RA
5.1
Shac
k nu
mb
erin
gM
ay
2016
May
20
16M
ay
2016
27 A
pri
l -4
May
20
16
May
20
16
27 A
pri
l –4
May
20
16
Jan
. 20
17O
ct./
No
v.
2016
17-2
3 O
ct.
2016
27 A
pri
l-
4 M
ay
2016
27 A
pri
l –
4 M
ay
2016
7 O
ct.
2016
18 O
ct.
2016
Trai
ning
10 J
un
e 20
1621
Ap
ril
2016
3 J
un
e 20
161
Jun
e 20
1622
Ju
ne
2016
6 M
ay
2016
25 J
an.
2017
1 N
ove
mb
er
2016
25 O
ct.
2016
1 Ju
ne
2016
1 Ju
ne
2016
6 O
ct.
2016
17 O
cto
ber
20
16
Pha
se 1
co
llect
ion
11 –
30
Ju
ne
2016
22 A
pri
l –
6 M
ay
2016
4 –
28
Ju
ne
2016
2 –
18
Jun
e 20
1623
– 3
0
Jun
e 20
167
– 24
May
20
16
26 J
an.
– 21
Feb
. 20
16
2 –
23
No
vem
ber
20
16
26 O
ct. –
26
No
v.
2016
N/A
2 –
18
Jun
e 20
16
7 O
ct.
– 13
No
v.
2016
18 O
ct. –
13
N
ov.
20
16
Pha
se 2
co
llect
ion
11 S
ept.
- 4
O
ct. 2
016
N/A
6 –
29
S
ept.
20
16
5 –
21
Sep
t. 2
016
8 –
30
S
ept.
20
16N
/AN
/AN
/AN
/AN
/A5
– 21
S
ept.
20
16N
/AN
/A
Dur
atio
n3
mo
nth
s3
m
on
ths
3 m
on
ths
3 m
on
ths
3 m
on
ths
3 m
on
ths
26 d
ays
21 d
ays
1 m
on
th5
day
s3
mo
nth
s5
wee
ks1
mo
nth
Job
s cr
eate
d10
950
64
5058
43
82
566
012
109
93
Em
plo
ymen
t d
urat
ion
3 –
50
day
s1
– 15
d
ays
3 –
45
day
s3
– 3
0
day
s3
– 3
0
day
sN
/A3
– 3
0
day
s3
– 2
1 d
ays
5 –
30
d
ays
1 –
6
day
s3
– 5
0
day
s5
wee
ks1
mo
nth
t4 4
Jo
bs
wer
e cr
eate
d t
hro
ug
h a
co
mb
inat
ion
of
a sp
ecia
l Exp
and
ed P
ub
lic W
ork
s P
rog
ram
me
(EP
WP
) o
f th
e C
ity
of
Cap
e To
wn
, an
d e
mp
loym
ent
crea
ted
th
rou
gh
th
e w
ork
of
the
serv
ice
pro
vid
er in
th
e im
ple
men
tati
on
of
the
con
trac
ted
wo
rks.
Enu
mer
atio
n m
etho
do
log
y0
2

Summary Report: Southern Corridor Enumeration, Cape Town
20
Locational analysis
033.1. SOUTHERN CORRIDOR
National Treasury has developed guidelines for the eight metropolitan municipalities who qualify to access the performance-based, Integrated Cities Development Grant (ICDG). These guidelines stipulate that cities are required to promulgate so-called ‘urban network strategies’: a transport-oriented development framework which seeks to maximise the impact of public investments in the built environment. This includes the prioritisation of ‘corridors’, also called ‘Integration Zones’, which should be included in the city’s annual Built Environment Performance Plan (BEPP).
The City of Cape Town adopted two ‘Integration Zones’ in line with National Treasury guidelines to access the ICDG grant, of which the Metro South-East Integration Zone (MSEIZ) is one. In the City of Cape Town’s latest Built Environment Performance Plan (BEPP) 2016/17, which includes a supporting document Metro South-East Integration Zone: Area-wide Strategic Framework, the following statistics are presented about the MSEIZ:
• Approximately 31% of Cape Town’s formal dwellings, 51% of its backyard units, and 70% of the city’s informal dwellings (not in back yards) are located in the MSEIZ.
• MSEIZ suburbs with a lower proportion of formal dwellings to total dwellings than the city as a whole (78.4%) are Langa, Gugulethu, Nyanga, Crossroads, Philippi, and Khayelitsha.
• High unit densities (above 100 units/ha) occur in Langa, Philippi/Crossroads, Site B, C, and TR Section, and the rest of Khayelitsha.
• Parts of Philippi/Crossroads, Site B, C, and TR Section, and the rest of Khayelitsha are the worst off in terms of the Household Services Index.
According to the latest BEPP, the Southern Corridor Integrated Human Settlements Project (hereafter ‘the Southern Corridor’) is an “agglomeration of a large number of projects; grouped together to enable more flexible resource allocation and beneficiation of those in need in the event of local individual project circumstances changing” (page 11). Furthermore, settlements in the Airport Precinct have potential for in-situ upgrading and improvement.
3. LOCATIONAL ANALYSIS
It is clear, from the Provincial strategic directive and City of Cape Town core municipal documentation, that the Airport Precinct and Kosovo are strategic priorities for in-situ upgrading. The remainder of this section will present contextual analyses of these two informal areas. The Airport Precinct will first be discussed, followed by Kosovo. The topics discussed in this section are settlement history/ies, contextual analyses, land use planning considerations, and settlement leadership capacities.
The location of the site along the N2 national road and in close proximity to the airport and Phillipi industrial area provides an excellent opportunity for improving this precinct through formal development and providing additional commercial sites. The development will also improve the aesthetics of the area as the sites serve as a gateway to Cape Town for visitors landing at the airport.- Built Environment Performance Plan,
2016/17 review

Summary Report: Southern Corridor Enumeration, Cape Town
21
033.2. AIRPORT PRECINCT INFORMAL SETTLEMENTS
3.2.1. Locational mapInformal settlements are densely located to the south of the N2 between Borcherds Quarry and Airport Approach Roads, which include Kanana to the north, Barcelona, Europe and Vukuzenzele at the centre, and Lusaka to the south. Gxagxa falls beyond this immediate stretch of informal settlements south of the N2, but is included in the Airport Precinct and by implication in the Southern Corridor.
Four additional settlements were enumerated in phase 2 of the government contract. These settlements are Thabo Mbeki, KTC, Tsunami IDA/TRA and Hlazo Village. KTC settlement is located in close proximity to settlements directly adjacent to the Airport, while Thabo Mbeki is located further south. To the north of Thabo Mbeki, Tsunami IDA/TRA (a colloquial name for Delft TRA 1 and 2) is located on land previously reserved for Delft cemetery. Hlazo Village is a small settlement of 32 dwellings located on two 500 sqm plots to the south of Gugulethu cemetery.
According to enumeration data collected in the study, the settlements in the Airport Precinct extend over 95,6 hectares at an average population density of 191 dwelling units per hectare. If Gxagxa and Hlazo Village, two small settlements with densities of more than 300 dwelling units per hectare, are removed from the average population density, the population density decreases to 156 dwelling units per hectare. A total of 13 950 structures were counted in these ten settlements, home to 26 041 people. In TRA 5, 1565 households were counted and in TRA 5.1, 284 households were counted.
Figure 2: Locational context of settlements in the Airport Precinct
Locational analysis

Su
mm
ary
Rep
ort
: So
uth
ern
Co
rrid
or
En
um
erat
ion
, Cap
e To
wn 22
Kan
an
aB
arc
elo
na
Eu
rop
eV
uku
-ze
nze
leL
usa
ka
Gxag
xa/
Ne
w R
est
Th
ab
o
Mb
eki
KT
CT
sun
am
iID
A/T
RA
Hla
zo
V
illa
ge
Ko
sov
oT
RA
5T
RA
5.1
Year
fo
und
ed19
89
199
019
92
199
319
86
+/-
19
90
un
kno
wn
198
320
05
un
kno
wn
199
9U
nkn
ow
nU
nkn
ow
n
Land
o
ccup
ied
23,14
ha
25,6
ha
14,3
ha
4,4
ha
3,2
5 h
a0
,67
ha
10,3
ha
6,8
2 h
a10
ha
0,10
4 h
a28
,64
ha
6,5
ha
1,3h
a
Po
pul
atio
n d
ensi
ty15
9 d
u/h
a11
0 d
u/h
a12
6 d
u/h
a11
7 d
u/h
a26
6 d
u/h
a3
48
du
/ha
131
du
/ha
170
,4 d
u/h
a17
2 d
u/h
a3
07
du
/ha
212
du
/ha
153
du
/ha
218
du
/ha
Stru
ctur
es
coun
ted
34
1528
38
1813
517
86
723
313
49
116
217
243
26
110
99
525
8
Stru
ctur
es
enum
erat
ed3
03
626
06
1579
46
88
34
228
116
29
83
1611
2357
529
3524
2
% o
f to
tal
stru
ctur
es
enum
erat
ed9
1%9
2%8
7%9
1%9
6%
97%
86
%8
5%9
3%
72%
94
%9
4%
94
%
Ho
useh
old
s3
199
2723
1619
505
84
723
612
1511
09
168
535
5824
1450
268
Po
pul
atio
n6
69
76
456
4 2
06
128
521
08
48
33
150
2327
350
035
143
80
36
46
(es
t)52
1
Ave
. hh
size
2,1
2,4
2,6
2,5
2,5
2,8
2,6
2,1
2,1
1,52,
52,
33
1,84
Toile
ts8
2411
714
057
2229
728
162
93
118
8U
nkn
ow
nU
nkn
ow
n
Hh/
to
ilet
Rat
io
3,9
23,3
11,6
93
8,5
86
718
32
76U
nkn
ow
nU
nkn
ow
n
Tap
s 56
564
113
53
1419
132
42
Un
kno
wn
Un
kno
wn
Tap
s/ h
h ra
tio
57,1
48
,639
,439
169
,479
87
5813
016
34
2U
nkn
ow
nU
nkn
ow
n
Ele
ctri
city
47%
p
rep
aid
m
eter
s,
43
%
nei
gh
bo
urs
’m
eter
s co
nn
ecti
on
, 10
% n
o
elec
tric
ity
62%
p
rep
aid
m
eter
s, 3
1%
nei
gh
bo
urs
’m
eter
s co
nn
ecti
on
7% n
o
elec
tric
ity
81%
pre
pai
d
met
ers,
15%
n
eig
hb
ou
rs’
met
ers
con
nec
tio
n,
4%
no
el
ectr
icit
y
73%
p
rep
aid
m
eter
s
82%
p
rep
aid
m
eter
s, 1
5%
nei
gh
bo
urs
’m
eter
s co
nn
ecti
on
, 3
% n
o
elec
tric
ity
12%
pre
pai
d
met
ers,
45%
n
eig
hb
ou
rs’
met
ers
con
nec
tio
n,
43
% n
o
elec
tric
ity
64
%
pre
pai
d
met
ers,
24
%
con
nec
tio
n
to
nei
gh
bo
urs
’ m
eter
s, a
nd
12
% h
ave
no
el
ectr
icit
y
58%
p
rep
aid
m
eter
s,
22%
co
nn
ecti
on
to
n
eig
hb
ou
rs’
met
ers,
an
d 2
0%
w
ith
no
el
ectr
icit
y
No
el
ectr
icit
y
77%
pre
pai
d
met
ers,
23
%
con
nec
tio
n
to
nei
gh
bo
urs
’ m
eter
s
73%
p
rep
aid
m
eter
s, 1
3%
co
nn
ecti
on
to
n
eig
hb
ou
rs’
met
ers,
14
% n
o
elec
tric
ity
Un
kno
wn
Un
kno
wn
Tab
le 5
: Sum
mar
ies
of
sett
lem
ent
pro
file
s

Summary Report: Southern Corridor Enumeration, Cape Town
23
033.2.2. Settlement historiesNyanga (meaning ‘Moon’ in isiXhosa) was established in 1946 with 210 houses. By 1956 it was expanded to include the Nyanga Transit Camp and the settlement of Mau Mau. In 1958, a new township was built in Nyanga West, later re-named Gugulethu (meaning ‘Our Pride’ in isiXhosa). Under the oppressive apartheid regime, residents were not permitted to own their homes, as these were intended as housing for migrant labour alone. By 1963 the population of Gugulethu exceeded 27 000 residents. A lack of investment in the housing stock up to the 1990s and the rapid in-migration following the repeal of pass laws resulted in overcrowding and a massive demand for housing.
Settlements in the Airport Precinct share a very similar history. Backyarders of Gugulethu and Nyanga settlements first erected shacks on the open land between 1983 and 1993 and by the early 2000s the informal settlements were nearly fully built out. Studies of the growth patterns of these settlements are presented in each of the individual reports.
Barcelona, Europe, Kanana, Lusaka and Vukuzenzele settlements were all founded between 1986 and 1992 (see Table 5 above). Community accounts share similar experiences of clearing and occupying the land adjacent to the N2 motorway. Residents explained that within a few years the settlements grew rapidly due to the arrival of backyarders and rural migrants (mostly from the Eastern Cape). A part of the land was a discontinued landfill site, which complicates service provision and infrastructure development.
Other settlements in the Southern Corridor have different histories and origins:
The exact date of the establishment of Thabo Mbeki settlement, to the south of the Corridor, is unclear, but a close correlation between the settlement and the construction of an industrial park on Govan Mbeki road is evident from aerial photographs. The Metro Cash and Carry Khayelitsha was constructed around 2001, when the settlement grew more dense. By 2009 the construction of the industrial park at Spanner Crescent commenced, which appears to have been completed by 2013. During this time the settlement experienced growth.
The enumerated Temporary Relocation Areas include Tsunami, TRA 5 and TRA 5.1 which are all located on Symphony Way in the south of Delft. Tsunami was constructed in 2005 to accommodate relocated families from Joe Slovo informal settlement when the N2 Gateway project commenced. TRA’s 5 and 5.1 were constructed a few years later in 2010/11 to accommodate more relocated families and those affected by a massive fire in Joe Slovo settlement in 2009/10. The HDA oversaw the appointment of contractors, and by 2012 it was reported that 974 of the 1849 planned houses were completed in TRA 5 and 5.1.
Gxagxa / New Rest, Hlazo Village and KTC are examples of dense informal settlements located in previously zoned open spaces. Gxagxa was established in a storm water retention area, and continues to suffer localised flooding in rainy seasons. Hlazo Village is located on two 500sqm erven (Erven 88 and 57) in Guglethu on 60 Amplankeni Crescent. KTC, which residents claimed was founded in 1983, was established on an open space with vegetation and a religious structure owned by a church called Donkey Church. Initially the area was called Beirut but later changed to KTC. The name KTC, according to the leadership, comes from the Kataza Trading Company, a store that is still located in the area.
Locational analysis

Summary Report: Southern Corridor Enumeration, Cape Town
24
03 Locational analysis
Qualitative discussion with Gxagxa leaders about their settlement
Hlazo Village leaders share anecdotes about their settlement
COMMUNITY VOICES “The settlement was named after one of the community leaders whose surname was Hlazo. He was tipped to be the next councillor of that area but was shot and killed before he assumed that position. Due to his popularity the area was then named as Hlazo Village. The settlement has a number of old people staying in there.” - Hlazo Village resident

Summary Report: Southern Corridor Enumeration, Cape Town
25
Kanana residents record the history of their settlement
Europe residents share anecdotes about their settlement’s history
03 Locational analysis
COMMUNITY VOICES “It used to be a dumping site. This field was also used for men when they went for circumcision. There were many trees here so we cleaned the field and built our houses here. When we started there were not many people who lived here.” – Kanana resident
COMMUNITY VOICES “We used to fetch water at Gugulethu graveyard. It was far from where we stayed. Other women fetched water from the farms. They had to cross the road and some were hit by cars and died. When we reported this to the man that was in charge of us being here, he said that he didn’t have another option because he was still [building] our houses and that we would have to wait until they are done.” - Europe resident

Summary Report: Southern Corridor Enumeration, Cape Town
26
03
Table 6: Properties implicated in Airport Precinct informal settlements
Erf numbers Street address Settlements Current Zoning
477 11 Steve Biko DriveKanana, Barcelona, Europe, Vukuzenzele
Limited Use Zoning
112664-RE (potentially) 19 Pallotti Road Kanana
Transport 2: Public Road and Public Parking
301 16 Steve Biko Drive Gxagxa Open Space 2: Public Open Space
113276-RE Null Vukuzenzele, Lusaka
Transport 2: Public Road and Public Parking
Since 2008/09 the eastern section of KTC informal settlement has been upgraded with a housing project. Thabo Mbeki settlement has received increased sanitation services in the past few years. Tsunami IDA/TRA is located on land previously reserved for the Delft cemetery while Hlazo village is located on two 500 sqm General Business 3 properties.
Locational analysis
3.2.3. Contextual analysisSettlements in the Airport Precinct along the N2 are located approximately five kilometres southwest of Cape Town International Airport and about 18kms southeast of Cape Town’s Central Business District (CBD). The N2 motorway extends along the northern boundary and Klipfontein Road and NY111 form the southern boundary.
Other settlements in the Airport Precinct are located further south from settlements directly adjacent to the Airport, such as Thabo Mbeki and Tsunami IDA/TRA.
3.2.4. Land use planning considerationsPlanning applications for the purposes of land transfer, township establishment, development rights and land use management will be considered against the City of Cape Town Development Management Scheme (DMS), which is a schedule to the Municipal Planning By-law 2015 (as amended 2016). The DMS also specifies the City’s zoning regulations. The informal settlements are located within the Cape Flats District (District G), adopted in 2014. Policy 36 of the District Plan supports the incremental upgrading and formalisation of existing formal settlements.
Preliminary desktop research has revealed that the six informal settlements directly adjacent to the Airport (e.g. Kanana, Barcelona, Europe, Vukuzenzele, Lusaka and Gxagxa) are located on up to four properties, presented in Table 6. These properties are surrounded with Single Residential 2: Incremental Housing (SR2) and General Residential 3 zoning alongside local community services and open space (e.g. Community 1: Local, Community 2: Regional, and Open Space 2: Public Open Space). Opposite the N2 motorway, which acts as a strong boundary and limits access, the Airport Industria is predominantly General Industry 1. Based on the surrounding land uses, the neighbourhood is therefore predominantly residential.

Summary Report: Southern Corridor Enumeration, Cape Town
27
3.2.5. Settlement leadership capacityAll settlements enumerated in the Airport Precinct confirmed that active leadership committees frequently meet with their ward councilor and sub-council manager to discuss local development priorities. The leadership committees have different types of structures: some settlements have one central coordinating committee, while other settlements have block-level committees. Leaders interviewed during the enumeration also confirmed that links exist with other community-based organisations (CBOs) such as SANCO. Individual enumeration reports provide further insights into the leadership structures currently operational in informal settlements including the ward councillors and sub-council managers who were actively engaged in the enumeration studies.
03 Locational analysis
Residents and some of Kanana’s leadership
Some leaders of KTC and members of KTC’s security committee

Summary Report: Southern Corridor Enumeration, Cape Town
28
Residents and some leadership members in Thabo Mbeki
Some residents and leaders of Hlazo Village
Some members of Lusaka’s leadership
03 Locational analysis

Summary Report: Southern Corridor Enumeration, Cape Town
29
3.3. KOSOVO
3.3.1. Locational mapKosovo informal settlement is one of the densest settlements in Cape Town. The settlement is located on 28,64 hectares of partly City-owned, partly privately owned land with a population density of 212 dwelling units per hectare. Kosovo has an average of 2,5 people per household as 14 830 people make up 5 824 households.Kosovo is centrally located in the Philippi CBD node, and is bounded by the central railway line and Philippi Station to the north, Parkway Drive to the west, the R300 to the south and the Philippi Police Academy to the east. Kosovo is 23 km southeast of Cape Town’s Central Business District and only 1.7km (or a 20-minute walk) from the Philippi business centre.
Figure 3: Kosovo locational context
3.3.2. Settlement historyBackyarders of the neighbouring Samora Machel settlement occupied the land after years of paying high rentals to the owners of formal houses. Community accounts on the origin of the settlement name indicate that there is a close correlation between the Kosovo War (28 February 1998-11 June 1999) and the founding of the settlement. Over the past 18 years the settlement has experienced an intensification of newly built dwelling. More detailed analysis of the growth patterns since 1999 is presented in the individual enumeration reports. In 2018, two pockets of land to the west of the settlement were occupied more intensely. These sections are included as part of the area enumerated in Kosovo.
03 Locational analysis
Overview of structures in Kosovo

Summary Report: Southern Corridor Enumeration, Cape Town
30
03 Locational analysis
Kosovo leaders during qualitative discussion about their settlement and its history
3.3.3. Contextual analysisKosovo informal settlement is surrounded by the central railway line and Philippi Station to the north, Parkway Drive to the west, the R300 to the south and the Philippi Police Academy to the east. Kosovo is located 23km southeast of Cape Town’s Central Business District and only 1.7km or a 20-minute walk from the Philippi business centre. The high density and proximity to the R300 and central railway line are listed as constraints for future development. Part of the land is privately owned.
Kosovo could benefit from plans to transform the Philippi business district into a major transport hub. In July 2016 the City of Cape Town unveiled plans for the largest MyCiti Bus Rapid Transport (BRT) station in the city on the corner of Govan Mbeki and New Eisleben roads, set to transform Philippi business district by unlocking developable land in the vicinity of Philippi Village. The close proximity to Cape Town International Airport warrants a renewed focus on the job-intensive industrial development opportunities of the airport district, also referred to as an “aerotropolis”, a term describing the locational advantages of airport/long-haul logistics-oriented city planning.
The Philippi Economic Development Initiative (PEDI) has been set up to promote development opportunities with stakeholders and frequently engages with community structures such as informal traders. Any such development near Philippi train station will need to include Kosovo residents as stakeholders in the development process. In the near vicinity, the largest public service centre is the Mitchells Plain District Hospital and the Western Cape Rehabilitation Centre. Kosovo could benefit from these developments which have already commenced with housing projects on Govan Mbeki Road.
COMMUNITY VOICES “[We need] people to do a neighbourhood watch. If we can have all these things we can fight the crime together here in Kosovo. On weekends people are not sleeping; they work till the morning [and this] is when they get murdered. Even if you are inside your house you are not safe. You will hear the guns at night and the bullets can even go through the zincs [sheets of your structure].” - Kosovo resident

Fig
ure
4: T
rans
po
rt f
or
Cap
e To
wn
gra
phi
cal
rep
rese
ntat
ion
of
the
Phi
lipp
i tra
nsp
ort
no
de

Summary Report: Southern Corridor Enumeration, Cape Town
32
033.3.4. Land use planning considerationsPlanning applications in Kosovo will be assessed against the Khayelitsha/Mitchell’s Plain Greater Blue Downs District Plan (adopted in 2014). The District Plan supports incremental upgrading and formalisation of existing formal settlements. Kosovo stretches over a number of affected properties. Table 7 gives a breakdown of the implicated properties and their current zoning.
Erf Numbers Street AddressSection of
KosovoCurrent Zoning
CA678-1 46 LEONARD RADU Road North West Transport 1:
Transport Use
CA679-7-RE Null North East Transport 1: Transport Use
3109 Null Centre West Agricultural
CA695-2-RE Null Centre West Agricultural
Table 7: Properties implicated by Kosovo informal settlement
The current land use designation for the land Kosovo is founded on is therefore predominantly Agricultural, with parts of Transport 1 to the north of the settlement. The surrounding area is predominantly zoned Single Residential 2: Incremental Housing. As mentioned earlier, the plans to develop Philippi at the intersections of Govan Mbeki and New Eisleben roads is in an advanced stage. The land uses around this business node are predominantly General Industrial 1 and General Business 1. Philippi can therefore be described as a residential-lead mixed-use neighbourhood.
Specific development proposals are made for the interface between Philippi train station and Kosovo informal settlement. Plans to improve the living conditions of Kosovo informal settlement are also included in the City’s 2016/17 BEPP. The District Plan argues that public spaces should be afforded in Kosovo. It deems the interface between Kosovo and the Philippi train station an important intervention.
Locational analysis
The latest review of the BEPP argues that a strip of public facilities and commercial uses, starting with the existing Philippi SAPS Police Training on the eastern edge, should be extended into Kosovo.
It is proposed that the existing Ingulube Drive axis is extended south of Philippi Station by upgrading and developing hard public space as part of a new station forecourt as well as reinforcing the linear space associated with the proposed new road link west of Kosovo. This public space development should investigate the opportunity for the provision of market / informal trading infrastructure, particularly in the area around the station and be considered as part of an integrated intervention around the upgrading of Kosovo informal settlement.
- Khayelitsha / Mitchells Plain & Greater Blue Downs District Plan (2014:115)

Summary Report: Southern Corridor Enumeration, Cape Town
33
3.3.5. Settlement leadership capacityAt present the community has a leadership structure of 14 members. The settlement is divided into three sections, each with five leaders. Weekly meetings are held to discuss development, social and economic issues confronting the community, and to ensure that the community is presented as a united whole to city council structures. Sithembiso Mzobe is the Councillor for Ward 33, which incorporates the part of Philippi South West of New Eisleben road and south of Bristol road, Kabodi street and Govan Mbeki road. The area is also part of Sub Council (SC) 13, where Lunga Bobo is the Sub Council manager. Councillor Mzobe and SC Manager Bobo were great aids in working with CORC to access community structures in Kosovo.
03 Locational analysis
Spatially, the overall concept is to extend the central strip on the adjacent training college land across the site, within which all the public facilities and commercial uses required on the site are to be included. The remainder of the site is proposed exclusively for high density residential development. The private access road north of the existing stadium is proposed to become a high mobility public road, linking to Weltevrede Parkway at OR Tambo Drive. - Built Environment Performance Plan, 2016/17 review
It is proposed that mostly double storey clustered high-density subsidy housing is utilised as the housing typology for the majority of the site with social housing as part of central spine. With a school site and public open space, a density of 140du/ha is achievable on the site.
- Built Environment Performance Plan, 2016/17 review
Some members of Kosovo’s leadership

Summary Report: Southern Corridor Enumeration, Cape Town
34
3.4. IMPLICATIONS FOR SETTLEMENT UPGRADING
The enumeration studies present more detailed locational analyses related to each individual settlement. In section 3 informal settlements were clustered as the Airport Precinct and Kosovo. The strategic objectives of the ‘Southern Corridor’ as a joint initiative between the City of Cape Town and the Western Cape Government were discussed with a view on informal settlement upgrading. Philippi, and Kosovo informal settlement upgrading plans should be incorporated in the area’s development potential.
Other aspects to consider from a planning perspective:
• The largest settlements in the Airport Precinct are located on land zoned Limited Use. In the City of Cape Town’s Zoning Scheme, no change of existing uses or alteration of the external structure of an existing building or structure is permitted in Limited Use Zones. Rezoning of the land to allow township establishment will however require a departure from these zoning regulations.
• Sections of the land in the Airport Precinct incorporate a discontinued landfill site. Geotechnical studies in support of land rehabilitation will need to be carried out.
• The upgrading of informal settlements towards township establishment will require the acquisition of land for consolidation and potential roll-over development to make room for infrastructure development.
• Parts of the land on which Lusaka is located (property 113276-RE) fall within the 60 decibels noise zone of the Cape Town International Airport.
In section 4, trends in the enumeration data are presented with a view to informing planning considerations. Topics such as movement and commuting patterns, structure sizes, structure ownership, socio-economic data and access to services will be covered. Section 5 also presents trends in enumeration data, but this time with a view to establishing an indicative profile of potential housing subsidy qualifiers.
03 Locational analysis
Vukuzenzele enumerators, CORC supervisor and HoD examine map of structures

Summary Report: Southern Corridor Enumeration, Cape Town
35
Enumeration data trends
044.1. DWELLING-TYPE ANALYSIS
4.1.1. ApproachThe first set of enumeration questions were developed to establish a better understanding of the dynamics that pertain to structures. In these questions respondents were asked to indicate perceived ownership status, number of rooms per structure, number of people per structure, and floor sizes. Individual settlement enumeration data sets were merged to produce tables and figures specifically for this overarching summary report. For more detailed analyses at the settlement level, refer to individual enumeration reports.
The following section presents summary data of individual settlement reports which argue a central message: Young, single males have lived in small (less than 15 square meters), single room dwellings for about 5 years.
4. ENUMERATION DATA TRENDS
Impression of dwelling in Gxagxa
Dwelling in Vukuzenzele during numbering

Summary Report: Southern Corridor Enumeration, Cape Town
36
4.1.2. Data trendsThe study sought to determine structure ownership levels within the settlement. Each respondent was asked to indicate whether she/he owned the structure, paid rent or lived in it rent-free. The high degree of ownership (89% of all dwellings) could have implications for mobilising household-level finance for eventual housing consolidation since households might be concerned with investing in their primary asset: a secure residence. However, this will require greater security of tenure and also ground works including land rehabilitation and infrastructure development.
Settlement name
Own the structure
Pay rentLiving rent
freeTotal
Gxagxa+New Rest 263 10 9 282
Vukuzenzele 427 8 33 468
Lusaka 733 66 35 834
Europe 1452 34 87 1573
Barcelona 2055 52 496 2603
Kanana 2370 245 421 3036
Hlazo Village 22 1 0 23
KTC 845 16 119 980
Thabo Mbeki 1053 10 99 1162
Tsunami 1544 7 59 1610
Total 16327 481 1497 18305
Row Percentages
89% 3% 8% 100%
Table 8: Percentage breakdown of structure ownership
The table 8 above indicates that on average 89% of structures have been reported as owned by the occupants. Only 3% of structures enumerated indicated rent being paid, while another 8% indicated living rent-free. However, there are important local settlement dynamics to take into account. In Barcelona, 21% of residents, or 548 households, are subordinate to a lessor, which might translate into precarious security of occupation. A similar trend was noticed in Kanana informal settlement where 8,1% of households pay rent and 13,9% households reported living rent-free. Just over a fifth (21,9%) of Kanana residents, or 666 households, are subordinate to a lessor, which might translate into a precarious security of occupation. It might also be that those living rent-free are members of the household head’s family or a dependent.
Enumeration data trends
04

Summary Report: Southern Corridor Enumeration, Cape Town
37
Enumeration data trends
04Data collected for TRA 5 and TRA 5.1 by HDA service provider asked of residents to indicate the manner in which structures were allocated to them. Table 8A indicates the breakdown for TRA 5 and 5.1 (data sets were merged). In almost nine out of ten incidents, residents were either allocated the dwelling unit by HDA (61%) or by the committee (27%).
Frequency % Row
Allocated by Committee 343 27%
Allocated by Councillor 1 0%
Allocated by Municipality 1 0%
Bought 15 1%
Gift 1 0%
House-sitting 36 3%
Inherited 7 1%
Invaded 7 1%
It was empty when we moved in 5 0%
Other 3 0%
Relocated by HDA 770 61%
Renting 64 5%
Total 1253 100%Table 8A: TRA 5 and 5.1 – Means of obtaining dwelling unit
Overview impression of dwellings in Gxagxa

Su
mm
ary
Rep
ort
: So
uth
ern
Co
rrid
or
En
um
erat
ion
, Cap
e To
wn 38
Res
po
nd
ents
wer
e as
ked
ab
ou
t th
e m
ain
use
of
thei
r st
ruct
ure
. Wh
ere
they
ind
icat
ed u
ses
oth
er t
han
res
iden
tial
, th
is w
as r
eco
rded
in t
he
dat
abas
e b
ut
no
t re
flec
ted
in t
his
an
alys
is. T
able
9 p
rovi
des
th
e b
reak
do
wn
of
stru
ctu
re u
se.
Tab
le 9
: Bre
akd
own
of
mai
n st
ruct
ure
uses
Str
uctu
re
main
use
Gxag
xa /
N
ew
Re
stV
uku
-ze
nze
leL
usa
ka
Eu
rop
eB
arc
elo
na
Kan
an
aH
lazo
V
illa
ge
KT
CT
hab
o
Mb
eki
Tsu
nam
iK
oso
vo
TR
A 5
TR
A 5
.1T
ota
lR
ow
%
Res
iden
tial
o
nly
248
457
798
1417
240
326
61
238
5410
2415
67
5277
1450
268
184
47
92%
Res
iden
tial
an
d O
ther
34
113
614
018
737
50
111
138
43
33
18
516
150
78
%
To
tal
28
24
68
83
415
57
25
90
30
36
23
96
511
62
1610
56
08
153
52
84
199
54
100
%
Th
e m
ajo
rity
(9
2%)
of
resp
on
den
ts i
nd
icat
ed t
hat
th
eir
dw
ellin
gs
wer
e u
sed
fo
r re
sid
enti
al p
urp
ose
s o
nly
. S
eco
nd
ary
use
of
dw
ellin
gs
ran
ged
fro
m s
paz
a sh
op
s, p
lace
s o
f w
ors
hip
, crè
ches
, sh
ebee
ns,
hai
rdre
sser
s/b
eau
ty s
alo
ns,
an
d t
shis
a ny
amas
. Th
e in
div
idu
al e
nu
mer
atio
n
rep
ort
s al
so p
rese
nt
spat
ial a
nal
yses
of
the
dis
trib
uti
on
of
seco
nd
ary
use
s. B
ased
on
th
is a
nal
ysis
, an
ob
serv
able
tre
nd
is t
hat
bu
sin
esse
s te
nd
to
be
loca
ted
on
bu
sin
ess
thro
ug
h p
asse
s su
ch a
s ro
ads,
inte
rnal
str
eets
an
d o
ther
ro
ute
s o
f ci
rcu
lati
on
.
Dat
a co
llect
ed f
or
TR
A 5
an
d T
RA
5.1
by
HD
A s
ervi
ce p
rovi
der
ask
ed o
f re
sid
ents
to
ind
icat
e th
e m
ann
er in
wh
ich
str
uct
ure
s w
ere
allo
cate
d
to t
hem
. Tab
le 8
A in
dic
ates
th
e b
reak
do
wn
fo
r T
RA
5 a
nd
5.1
(dat
a se
ts w
ere
mer
ged
). In
alm
ost
nin
e o
ut
of
ten
inci
den
ts, r
esid
ents
wer
e ei
ther
allo
cate
d t
he
dw
ellin
g u
nit
by
HD
A (
61%
) o
r b
y th
e co
mm
itte
e (2
7%).
Sh
ebee
ns,
on
th
e o
ther
han
d, t
end
to
be
clu
ster
ed t
og
eth
er in
po
cket
s o
n t
he
edg
es o
f th
e se
ttle
men
t. In
th
ese
area
s, q
ual
itat
ive
inte
rvie
ws
also
ind
icat
ed t
hat
hig
her
rat
es o
f cr
ime
are
app
aren
t.
Enu
mer
atio
n d
ata
tren
ds
04
CO
MM
UN
ITY
VO
ICE
S“T
her
e is
on
e th
ing
th
at I
wan
t to
ask
fro
m t
he
mu
nic
ipal
ity.
As
you
kn
ow
we
live
in s
hac
ks a
nd
th
ere
are
also
peo
ple
sel
ling
alc
oh
ol.
They
[th
e m
un
icip
alit
y] m
ust
do
lic
ence
s so
th
at t
he
sheb
een
s m
ust
kn
ow
wh
en t
o o
pen
an
d w
hen
to
clo
se t
hei
r ta
vern
s. I
thin
k th
ere
will
be
less
cri
me.
” -
Ko
sovo
res
iden
t

Su
mm
ary
Rep
ort
: So
uth
ern
Co
rrid
or
En
um
erat
ion
, Cap
e To
wn 39
To b
ette
r u
nd
erst
and
th
e liv
ing
arr
ang
emen
ts f
or
resi
den
ts,
a q
ues
tio
n w
as a
sked
aro
un
d n
um
ber
of
roo
ms
in t
he
stru
ctu
re.
Tab
le 1
0
pro
vid
es a
n o
verv
iew
of
roo
ms
per
str
uct
ure
.
Tab
le 1
0: N
umb
er o
f ro
om
s p
er s
truc
ture
Ro
om
s p
er
stru
ctu
re
Gxag
xa
+ N
ew
R
est
Vu
ku
-ze
nze
leL
usa
ka
Eu
rop
eB
ar-
ce
lon
aK
an
an
aH
lazo
V
illa
ge
KT
CT
hab
o
Mb
eki
Tsu
nam
iK
oso
vo
To
tal
Ro
w%
(T
ota
l)
121
513
73
67
233
731
1274
193
293
80
130
413
506
339
40
%
251
204
356
38
06
67
89
04
350
286
274
1918
538
03
4%
312
86
88
292
46
752
80
173
271
31
851
279
917
%
44
2922
130
293
275
050
180
122
712
118
%
50
91
31
564
50
737
026
212
1%
60
20
219
160
16
04
500
%
6 a
nd
mo
re0
10
54
80
02
05
250
%
To
tal
28
24
68
83
410
73
22
37
30
36
23
910
116
216
104
38
116
016
100
%
No
data
co
lle
cte
d0
00
50
63
69
00
73
00
137
12
319
-
Th
e su
mm
ary
tab
le in
dic
ates
th
at, o
n a
vera
ge,
mo
st d
wel
ling
s h
ave
on
e o
r tw
o r
oo
ms.
Ho
wev
er, t
his
dat
a w
as n
ot
colle
cted
fo
r al
l str
uct
ure
s d
uri
ng
th
e en
um
erat
ion
. Th
is c
ou
ld h
ave
dis
tort
ed t
he
ove
rall
aver
ages
, an
d w
as r
emo
ved
fro
m t
he
ove
rall
tab
le. T
he
follo
win
g s
ettl
emen
ts
did
no
t co
nta
in c
om
ple
te d
ata
sets
on
th
e n
um
ber
of
roo
ms
per
str
uct
ure
:
• E
uro
pe:
50
6 s
tru
ctu
res
or
32%
of
tota
l str
uct
ure
s d
id n
ot
ind
icat
e th
e n
um
ber
of
roo
ms.
• B
arce
lon
a: 3
69
str
uct
ure
s o
r 14
% o
f to
tal s
tru
ctu
res
did
no
t in
dic
ate
the
nu
mb
er o
f ro
om
s.•
Ko
sovo
: 137
1 st
ruct
ure
s o
r 24
% o
f to
tal s
tru
ctu
res
did
no
t in
dic
ate
the
nu
mb
er o
f ro
om
s.•
KTC
: 73
dw
ellin
gs
of
7% o
f al
l dw
ellin
gs
did
no
t in
dic
ate
the
nu
mb
er o
f ro
om
s.
Enu
mer
atio
n d
ata
tren
ds
04

Su
mm
ary
Rep
ort
: So
uth
ern
Co
rrid
or
En
um
erat
ion
, Cap
e To
wn
40
Fu
rth
er d
isag
gre
gat
ion
rev
eals
a m
ore
nu
ance
d r
ead
ing
. In
Ko
sovo
, th
e m
ajo
rity
of
stru
ctu
res
hav
e tw
o r
oo
ms
(44
%)
and
31%
of
stru
ctu
res
are
sin
gle
ro
om
s. I
n t
he
sum
mar
y ta
ble
, Ko
sovo
acc
ou
nts
fo
r 27
% o
f th
e to
tal n
um
ber
of
stru
ctu
res,
an
d t
her
efo
re t
his
is n
ot
an a
ccu
rate
re
pre
sen
tati
on
of
the
Air
po
rt P
reci
nct
. Wh
en K
oso
vo is
rem
ove
d f
rom
th
e ta
ble
, sin
gle
ro
om
s ac
cou
nt
for
42%
of
all d
wel
ling
s in
th
e A
irp
ort
P
reci
nct
, fo
llow
ed b
y tw
o-r
oo
m s
tru
ctu
res
at 3
0%
an
d t
hre
e-ro
om
str
uct
ure
s at
17%
.
Ho
wev
er, e
ven
in t
he
Air
po
rt P
reci
nct
it is
diffi
cult
to
pre
sen
t a
conv
inci
ng
ave
rag
e n
um
ber
of
roo
ms
per
dw
ellin
g. S
ing
le r
oo
m s
tru
ctu
res
acco
un
t fo
r 4
4%
of
dw
ellin
gs
in L
usa
ka, 4
1% in
Kan
ana
and
33
% in
Bar
celo
na.
In E
uro
pe
sett
lem
ent,
ho
wev
er, t
he
mo
st c
om
mo
n s
tru
ctu
re
typ
e is
a t
wo
-ro
om
un
it (
35%
), f
ollo
wed
by
thre
e-ro
om
un
its
(27%
). I
n G
xag
xa,
wh
ere
dw
ellin
gs
are
bu
ilt o
n a
sm
all
par
cel
of
lan
d a
t a
den
sity
of
34
8 d
u/h
a, 7
6%
of
dw
ellin
gs
are
sin
gle
ro
om
s. O
ther
fac
tors
als
o in
flu
ence
th
e co
nfi
gu
rati
on
of
livin
g s
pac
es. I
n T
sun
ami,
it is
no
t su
rpri
sin
g t
hat
81%
of
all d
wel
ling
s ar
e si
ng
le r
oo
ms
du
e to
th
e p
re-d
efin
ed s
tan
dar
ds
asso
ciat
ed w
ith
th
e co
nst
ruct
ion
of
an I
ncr
emen
tal
Dev
elo
pm
ent
Are
a w
ith
th
e E
mer
gen
cy H
ou
sin
g P
rog
ram
me
sub
sid
y.
Un
der
stan
din
g t
he
con
fig
ura
tio
n o
f liv
ing
sp
aces
is o
f u
tmo
st im
po
rtan
ce t
o p
lan
nin
g c
on
sid
erat
ion
s. I
nd
ivid
ual
rep
ort
s p
rese
nt
evid
ence
w
hic
h s
ug
ges
ts t
hat
typ
ical
ly t
he
firs
t o
ccu
pan
ts c
laim
larg
er s
pac
es a
nd
bu
ild la
rger
ro
om
s. N
ewer
arr
ival
s ar
e o
ften
left
wit
h n
o c
ho
ice
bu
t to
bu
ild s
mal
ler
size
d o
ne-
roo
m s
hac
ks. T
he
qu
alit
y o
f o
pen
sp
aces
fo
r ch
ildre
n t
o p
lay
is a
lso
res
tric
ted
, wh
ich
mea
ns
that
th
ey t
end
to
p
lay
in t
he
stre
ets
and
on
info
rmal
fo
otp
ath
s. S
mal
l sin
gle
ro
om
dw
ellin
gs
ther
efo
re h
ave
to c
ater
to
all
the
nee
ds
of
the
resi
den
t an
d li
vin
g
spac
es a
re u
sed
sim
ult
aneo
usl
y fo
r st
ud
yin
g, p
layi
ng
, co
oki
ng
, was
hin
g, b
ath
ing
, an
d s
o f
ort
h.
Bas
ed o
n t
he
enu
mer
atio
n r
esu
lts,
Tab
le 1
1 p
rovi
des
dee
per
insi
gh
t in
to t
he
tota
l nu
mb
er o
f p
eop
le li
vin
g in
sid
e ea
ch s
tru
ctu
re. T
o e
ase
the
read
ing
of
dat
a, t
he
per
cen
tag
e sp
lit o
f p
eop
le p
er d
wel
ling
is p
rese
nte
d, r
ath
er t
han
th
e p
eop
le c
ou
nt.
Tab
le 1
1: N
umb
er o
f p
eop
le p
er s
truc
ture
Ro
om
s p
er
stru
ctu
re
Gxag
xa
+ N
ew
R
est
Vu
ku
-ze
nze
leL
usa
ka
Eu
rop
eB
ar-
ce
lon
aK
an
an
aH
lazo
V
illa
ge
KT
CT
hab
o
Mb
eki
Tsu
nam
iK
oso
vo
To
tal
Ro
w%
(T
ota
l)
112
314
83
1357
810
5814
5214
419
324
339
2077
68
45
37%
259
97
160
297
49
957
96
185
30
68
5012
45
428
323
%
36
28
013
625
839
04
133
156
200
281
1029
30
08
16%
428
67
119
206
315
312
012
216
610
170
721
43
12%
55
42
65
127
191
165
06
19
627
422
120
17%
64
1927
63
93
62
018
3710
168
501
3%
7 to
14
115
1450
60
530
223
32
104
354
2%
To
tal
28
24
68
83
415
79
26
06
30
36
23
98
311
62
1610
57
52
183
35
100
%
Enu
mer
atio
n d
ata
tren
ds
04

Su
mm
ary
Rep
ort
: So
uth
ern
Co
rrid
or
En
um
erat
ion
, Cap
e To
wn 41
Tab
le 1
2: S
truc
ture
siz
es
cate
go
rise
d
Str
uctu
re s
ize
cate
go
rise
d
Gxag
xa
+ N
ew
R
est
Vu
ku
-ze
nze
leL
usa
ka
Eu
rop
eB
ar-
ce
lon
aK
an
an
aH
lazo
V
illa
ge
KT
CT
hab
o
Mb
eki
Tsu
-n
am
iK
oso
vo
To
tal
Ro
w%
(T
ota
l)
2sq
m o
r le
ss0
00
02
00
02
20
60
%
2.0
1 -
5sq
m1
01
04
00
46
84
280
%
5.0
1 -
10sq
m27
1118
31
82
65
039
549
214
756
63
%
10.0
1 -
15sq
m10
34
110
914
337
24
60
1012
517
44
04
63
425
7515
%
15.0
1 -
20sq
m6
36
515
512
829
84
42
614
110
33
02
736
2439
14%
20.0
1 -
25sq
m3
659
153
155
288
452
310
911
220
075
523
2213
%
25.0
1 -
30
sqm
156
412
815
625
03
82
312
811
019
96
88
2123
12%
30
.01
- 35
sqm
94
88
414
121
426
81
93
94
267
586
180
510
%
35.0
1 -
40
sqm
84
36
012
220
522
20
82
724
54
40
129
98
%
40
.01
- 50
sqm
551
62
183
283
313
010
115
36
157
317
85
10%
50.0
1 -
60
sqm
522
249
822
017
00
559
816
265
973
6%
gre
ater
th
an
60
sqm
420
40
129
34
026
20
7418
214
249
1314
8%
To
tal
27
64
24
83
412
86
25
58
30
36
23
95
111
60
1610
50
77
172
35
100
%
Sin
gle
ho
use
ho
lds
rep
rese
nt
the
maj
ori
ty o
f h
ou
seh
old
s in
set
tlem
ents
en
um
erat
ed i
n t
he
Air
po
rt P
reci
nct
an
d K
oso
vo.
Tab
le 1
0 r
evea
ls
that
on
ave
rag
e si
ng
le p
erso
n h
ou
seh
old
s ac
cou
nt
for
39,5
% o
f al
l str
uct
ure
s. A
clo
se c
orr
elat
ion
exi
sts
bet
wee
n s
ing
le p
erso
n h
ou
seh
old
s (3
7%)
and
on
e ro
om
dw
ellin
gs
(40
%)
in t
he
Air
po
rt P
reci
nct
an
d K
oso
vo. T
his
has
imp
licat
ion
s fo
r fu
ture
ho
usi
ng
pro
visi
on
, bu
t th
is w
ill b
e d
iscu
ssed
un
der
pla
nn
ing
co
nsi
der
atio
ns
in s
ecti
on
7.
Clo
se t
o 5
0%
of
ho
use
ho
lds
in t
he
Air
po
rt P
reci
nct
are
co
mp
ose
d o
f tw
o t
o f
ou
r p
eop
le. T
his
sh
ow
s th
at t
her
e is
a c
lose
bal
ance
bet
wee
n
esta
blis
hed
fam
ilies
an
d y
ou
ng
sin
gle
ho
use
ho
lds.
Th
e fl
oo
r ar
eas
of
the
dw
ellin
gs
wer
e ca
lcu
late
d f
rom
GIS
dat
a fo
llow
ing
th
e m
app
ing
of
dw
ellin
gs
fro
m a
n a
eria
l ph
oto
gra
ph
. Th
is is
th
e m
ost
acc
ura
te d
ata
avai
lab
le in
th
e st
ud
y, b
ut
a lim
itat
ion
of
the
app
roac
h in
cal
cula
tio
ns
cou
ld r
esu
lt in
an
ove
rest
imat
ion
of
actu
al fl
oo
r si
ze b
ecau
se t
he
ove
rhan
gs
of
the
roo
fs c
ou
ld b
e la
rger
th
an t
he
flo
or
area
.
Enu
mer
atio
n d
ata
tren
ds
04

Su
mm
ary
Rep
ort
: So
uth
ern
Co
rrid
or
En
um
erat
ion
, Cap
e To
wn 42
Tab
le 1
3: S
truc
ture
siz
e p
er
per
son
cate
go
rise
d
Sq
uare
me
ters
p
er
pe
rso
n
av
ail
ab
le
cate
go
rise
d
Gxag
xa
+ N
ew
R
est
Vu
ku
-ze
nze
leL
u-s
aka
Eu
rop
eB
ar-
ce
lon
aK
an
an
aH
lazo
V
illa
ge
KT
CT
hab
o
Mb
eki
Tsu
-n
am
iK
oso
vo
To
tal
Ro
w%
(T
ota
l)
2sq
m o
r le
ss3
25
910
120
612
837
104
1%
2.0
1 -
5sq
m51
5211
49
919
93
202
7611
917
854
417
5410
%
5.0
1 -
10sq
m9
011
424
03
45
558
60
25
236
293
622
136
04
46
526
%
10.0
1 -
15sq
m6
28
413
428
458
155
68
210
248
372
104
935
88
21%
15.0
1 -
20sq
m3
857
101
167
354
36
34
132
153
214
64
722
30
13%
20.0
1 -
25sq
m16
33
84
106
231
327
174
97
794
46
149
49
%
25.0
1 -
30
sqm
525
5073
162
228
279
744
928
810
356
%
30
.01
- 35
sqm
424
31
49
118
159
13
34
159
201
720
4%
35.0
1 -
40
sqm
316
2535
81
124
023
256
135
473
3%
40
.01
- 50
sqm
113
254
510
413
60
38
30
417
557
13
%
50.0
1 -
60
sqm
02
728
538
10
2426
38
03
04
2%
gre
ater
th
an
60
sqm
32
1829
82
128
021
42
374
40
22%
To
tal
27
64
24
83
412
69
25
33
30
36
23
95
211
60
159
75
03
617
140
100
%
No
data
co
lle
cte
d6
44
03
107
30
03
12
137
1611
95
-
Dw
ellin
gs
in t
he
Air
po
rt P
reci
nct
an
d K
oso
vo a
re p
red
om
inan
tly
(57%
) sm
alle
r th
an 3
0 s
qu
are
met
ers,
as
Tab
le 1
2 in
dic
ated
. An
oth
er 1
8%
o
f d
wel
ling
s ar
e b
etw
een
30
an
d 4
0 s
qu
are
met
ers.
Th
e co
nce
ntr
atio
n o
f sm
all s
hac
ks s
epar
ated
by
info
rmal
ro
ads
and
fo
otp
ath
s sh
ou
ld
be
con
sid
ered
fo
r an
y fu
ture
set
tlem
ent
up
gra
de
and
eve
ntu
al h
ou
sin
g c
on
solid
atio
n. T
he
ind
ivid
ual
rep
ort
s fu
rth
er a
nal
yse
the
stru
ctu
re
size
s o
f si
ng
le h
ou
seh
old
s, w
hic
h a
lso
ind
icat
e th
at s
ing
le h
ou
seh
old
s liv
e in
sm
all s
tru
ctu
res.
Th
e h
igh
den
sity
of
the
sett
lem
ent
will
req
uir
e in
no
vati
ve t
enu
re t
ypes
, an
d c
on
solid
atio
n h
ou
sin
g m
igh
t n
eed
to
co
nsi
der
sm
alle
r ap
artm
ents
in h
igh
er-d
ensi
ty h
ou
sin
g t
ypo
log
ies.
In T
able
13
th
e to
tal fl
oo
r sp
ace
of
a d
wel
ling
was
div
ided
by
the
nu
mb
er o
f o
ccu
pan
ts t
o d
eriv
e an
est
imat
ed fl
oo
r sp
ace
per
occ
up
ant.
Th
e m
ajo
rity
(71
%)
of
occ
up
ants
hav
e le
ss t
han
20
sq
uar
e m
eter
s av
aila
ble
in a
sh
ack.
Th
is is
a p
relim
inar
y m
easu
re t
o in
dic
ate
the
issu
e o
f o
verc
row
din
g in
den
se in
form
al s
ettl
emen
ts.
Enu
mer
atio
n d
ata
tren
ds
04

Su
mm
ary
Rep
ort
: So
uth
ern
Co
rrid
or
En
um
erat
ion
, Cap
e To
wn
43
Sq
uare
me
ters
p
er
pe
rso
n
av
ail
ab
le
cate
go
rise
d
Gxag
xa
+ N
ew
R
est
Vu
ku
-ze
nze
leL
usa
ka
Eu
rop
eB
ar-
ce
lon
aK
an
an
aH
lazo
V
illa
ge
KT
CT
hab
o
Mb
eki
Tsu
-n
am
iK
oso
vo
To
tal
Ro
w%
(T
ota
l)
0 -
5 y
ears
186
43
050
112
98
234
819
144
564
98
018
81
34
7013
576
30
%
6 -
10
yea
rs15
028
54
47
89
514
7315
188
554
777
136
53
34
410
816
24%
11 -
15
year
s9
921
155
96
01
1056
1016
93
2855
122
025
5272
02
16%
16 -
20
yea
rs8
122
127
570
611
40
114
09
30
16
5315
3915
84
5619
%
21 -
25
year
s6
511
011
54
82
354
598
228
49
34
169
2276
5%
26 -
30
yea
rs14
2421
522
413
151
83
296
96
156
215
98
4%
mo
re t
han
30
ye
ars
04
00
00
00
00
935
939
2%
To
tal
59
512
85
211
24
20
66
50
26
70
43
52
32
73
150
35
00
144
47
44
86
310
0%
Tab
le 1
4: N
umb
er o
f ye
ars
resi
den
ts h
ave
lived
in t
he
sett
lem
ent
Res
iden
ts w
ere
also
ask
ed t
o i
nd
icat
e th
e n
um
ber
of
year
s th
ey h
ave
lived
in
th
e se
ttle
men
t. T
able
14
in
dic
ates
th
at o
n a
vera
ge
30
% o
f re
sid
ents
hav
e liv
ed i
n s
ettl
emen
ts f
or
less
th
an fi
ve y
ears
. F
rom
th
is d
ata,
Ko
sovo
ap
pea
rs t
o b
e th
e m
ost
est
ablis
hed
set
tlem
ent
sin
ce
27%
of
resi
den
ts h
ave
lived
in t
he
sett
lem
ent
for
16 –
20
yea
rs. H
ow
ever
, th
e in
flu
x o
ver
the
pas
t fi
ve y
ears
mea
ns
that
24
% o
f re
sid
ents
are
n
ewco
mer
s (a
nd
hav
e liv
ed in
th
e se
ttle
men
t fo
r le
ss t
han
five
yea
rs).
Oth
er s
ettl
emen
ts li
ke T
hab
o M
bek
i wh
ich
hav
e ex
iste
d s
ince
198
3 a
re
also
wel
l est
ablis
hed
sin
ce 2
1% o
f re
sid
ents
hav
e liv
ed in
th
e se
ttle
men
t fo
r 16
to
20
yea
rs.
Enu
mer
atio
n d
ata
tren
ds
04
CO
MM
UN
ITY
VO
ICE
S“I
wo
uld
ch
ang
e th
e n
atu
re o
f st
ruct
ure
s h
ere
in K
anan
a, t
he
stre
ets,
th
e d
rain
s an
d t
he
ligh
ts s
o t
hat
peo
ple
can
fee
l th
e d
emo
crac
y.”
– K
anan
a re
sid
ent

Summary Report: Southern Corridor Enumeration, Cape Town
44
4.1.3. SummaryIn conclusion, a trend in enumeration data related to dwellings types is observable. The competition for land in a dense informal settlement requires single households, which are often young men leaving their parents’ home, to live in smaller one-room shacks. When taking these statistics into account, the implications for settlement upgrading and eventual housing provision are significant. The high density of the settlement will require innovative tenure types, and consolidation housing might need to consider smaller apartments in higher-density housing typologies. Analyses of this data lead to the following conclusions:
• Single person households, which are predominantly male and younger than 35 years old (as established in the next section), are the predominant (37%) occupants of dwellings in the Airport Precinct and Kosovo.
• The majority (89%) of residents indicate that they own their structures. In a few cases, such as Barcelona and Kanana, a higher proportion of rental agreements were observed, which might require close attention to informal property transactions. This informal property market needs to be adequately understood when considering transfer of title, in which ever form it might be (e.g. administrative, communal, freehold, etc.).
• The highest proportion (43%) of dwellings are single rooms in the Airport Precinct. Two-room structures account for 34% of dwellings and 17% of dwellings have three rooms. Families tend to occupy two and three bedroom dwellings, while single households have single room dwellings. In Kosovo, Vukuzenzele, KTC and Europe, on the other hand, the majority of structures have two and three rooms.
• 58% of dwellings are smaller than 30 square meters. Readers are encouraged to refer to individual reports for breakdown of structure sizes.
• The majority of residents (30%) have lived in their respective settlements for less than five years.
Analyses indicate that there is a close relationship between young, single males who live in small (less than 30 square meters), single room dwellings for about 5 years.
Enumeration data trends
04
Gxagxa residents capture enumeration data in Trimble device

Summary Report: Southern Corridor Enumeration, Cape Town
45
Table 15: Breakdown of age categories
Age categories Frequency count PercentageCumulative percentage
0 to 5 years 5417 12 12
6 to 13 years 7039 16 28
14 to 18 years 2912 7 35
19 to 25 years 6217 14 49
26 to 30 years 5268 12 61
31 to 35 years 5596 13 73
36 to 40 years 4591 10 84
41 to 50 years 4894 11 95
51 to 60 years 1707 4 98
61 to 65 years 323 1 99
older than 65 350 1 100
Total 44314 100
4.2. DEMOGRAPHIC PROFILES
4.2.1. ApproachThe next set of enumeration questions sought to understand the demographics of informal settlements. In these questions, respondents were required to indicate their age, gender, and the proportion of foreigners. In the following section, major trends in enumeration data are presented with a view to ascertaining the implications of planning settlement upgrading and housing beneficiaries.
4.2.2. Data trendsEnumeration data confirms that the majority (73%) of residents are people younger than 35 years old. In keeping with trends presented in the previous section, this data might explain how children of parents who first settled on the land during the founding years of the settlements (e.g. 1986 to 1992) are entering adulthood. Since space is limited, they are forced to erect small one-room shacks and are generally single households.
In Table 15 above, the split of age groups is presented. A large portion (28%) of residents can be classified as children younger than 13 years old while a further 26% are older than 36 years old. The implications of a majority population younger than 35 years old need to be taken into account in all planning interventions. For example, the national and provincial ministers of Human Settlements have indicated that people older than 40 years will be prioritised for housing subsidies, although this is not official policy in the National Housing Code.
Enumeration data trends
04

Summary Report: Southern Corridor Enumeration, Cape Town
46
Due to the significant number of single person households, it was necessary to examine the age distribution of this population. Table 16 below provides the age distribution of single person households categorised.
Table 16: Age of single person households
Age categories Frequency count PercentageCumulative percentage
14 to 18 years 80 1 1
19 to 25 years 1256 19 21
26 to 30 years 1393 21 42
31 to 35 years 1351 21 63
36 to 40 years 906 14 77
41 to 50 years 966 15 91
51 to 60 years 395 6 97
61 to 65 years 84 1 99
older than 65 84 1 100
Total 6515 100
Enumeration data trends
04
Children in Europe play in unhygienic conditions next to the highway
The age split of single person households confirms that 62% of single households are younger than 35 years old, and most significantly, 21% is aged between 26 and 30 years old. The enumeration covered a broad spectrum of demographic data.

Summary Report: Southern Corridor Enumeration, Cape Town
47
Seven of ten single households, which cumulatively account for 37% of all households, are men. Although these young men live alone, it does not mean that they do not have financial dependents. Between 50% and 62% of respondents in different informal settlements reported that they have financial dependents living elsewhere. The reader is encouraged to refer to individual reports for more details.
Table 17: Gender split of single person households in percentage terms
Male Female Total
Gxagxa & New Rest 73,17 26,83 100
Vukuzenzele 79,73 20,27 100
Lusaka 66,44 33,56 100
Europe 73,84 26,16 100
Barcelona 68,49 31,51 100
Kanana 65,13 34,87 100
Kosovo 71,49 28,51 100
Total 70 30 100
GenderSettlement
Enumeration data trends
04
Male and female enumerators in Barcelona
Table 17 presents the gender breakdown of the settlement population in percentage terms.

Su
mm
ary
Rep
ort
: So
uth
ern
Co
rrid
or
En
um
erat
ion
, Cap
e To
wn
48
Tab
le 1
8: G
end
er s
plit
of
all r
esid
ents
Ge
nd
er
Gxag
xa/
Ne
w R
est
Vu
ku
-ze
nze
leL
u-
saka
Eu
rop
eB
ar-
ce
lon
aK
an
an
aH
lazo
V
illa
ge
KT
CT
hab
o
Mb
eki
Tsu
-n
am
iK
oso
vo
TR
A 5
TR
A 5
.1T
ota
lR
ow
%
Mal
e29
259
39
34
1912
286
329
30
189
2012
82
1611
66
5515
5524
621
811
45%
Fem
ale
30
16
92
1153
2252
3577
3723
1713
49
180
618
7475
5318
1924
726
36
355
%
To
tal
59
312
85
20
87
416
46
44
06
65
33
52
26
93
08
83
48
514
20
83
37
44
93
48
174
100
%
Ove
rall,
55
ou
t o
f ev
ery
100
peo
ple
are
wo
men
. Th
is is
slig
htl
y h
igh
er t
han
th
e n
atio
nal
ave
rag
e o
f 52
wo
men
per
eve
ry 10
0 p
eop
le (
Sta
tsS
A,
Cen
sus
2011
).
Set
tlem
ent
dat
a se
ts w
ere
mer
ged
to
avo
id a
ny i
nse
nsi
tivi
ties
to
war
ds
fore
ign
ers
livin
g i
n i
nfo
rmal
set
tlem
ents
. F
ore
ign
ers
hav
e b
een
su
bje
ct t
o s
pat
es o
f xe
no
ph
ob
ic v
iole
nce
sin
ce t
he
earl
y 20
00
s. T
able
19
bel
ow
co
nfi
rms
that
on
ly 2
% o
f th
e to
tal p
op
ula
tio
n a
re f
ore
ign
ers
or
per
man
ent
resi
den
ts.
4.2
.3. S
umm
ary
Th
is
sect
ion
o
f th
e su
mm
ary
rep
ort
p
rese
nte
d
ove
rarc
hin
g
dat
a o
n
the
dem
og
rap
hic
s o
f th
e se
ttle
men
ts.
Ind
ivid
ual
rep
ort
s co
nta
in m
ore
in
dep
th
anal
ysis
o
f si
ng
le
ho
use
ho
lds,
w
hic
h
wer
e co
nfi
rmed
to
b
e th
e h
igh
est
pro
po
rtio
n o
f h
ou
seh
old
co
nfi
gu
rati
on
s. D
ata
pre
sen
ted
in t
his
sec
tio
n in
dic
ates
th
e fo
llow
ing
:
• 73
% o
f th
e to
tal p
op
ula
tio
n is
yo
un
ger
th
an 3
5 ye
ars
old
, an
d 6
3%
of
sin
gle
ho
use
ho
lds
are
you
ng
er t
han
35
year
s o
ld.
• W
hile
55%
of
ever
y 10
0 r
esid
ents
are
wo
men
, men
acc
ou
nt
for
70%
of
sin
gle
ho
use
ho
lds,
wh
ich
was
est
ablis
hed
as
the
hig
hes
t p
rop
ort
ion
of
ho
use
ho
lds
(37%
).
Nati
on
ali
ty
Fre
qu
en
cy
co
un
tP
erc
en
tC
um
ula
tive
p
erc
en
t
RS
A4
313
89
7,9
97,
72
No
n-R
SA
69
21,6
99
,38
Per
man
ent
resi
den
t23
10
,510
0
To
tal
44
06
110
0
Tab
le 1
9: N
atio
nalit
y o
f re
sid
ents
Enu
mer
atio
n d
ata
tren
ds
04

Summary Report: Southern Corridor Enumeration, Cape Town
49
4.3. SOCIO-ECONOMIC PROFILES
4.3.1. ApproachAnother set of enumeration questions sought to understand the socio-economic profile of households. Questions on employment status, household income and expenditure, modes of transport, and social grants were asked. Individual reports deal with educational enrolment and attainment and commuting times in more detail. This content is not deemed significantly appropriate for this overarching summary report that focused on implications for planning settlement upgrading and beneficiaries for housing subsidies.
4.3.2. Data trendsQuestions around household income were aimed primarily at the household head, who was the primary respondent almost 90% of the time. In fewer cases where the household head was not the primary respondent, persons close to the day-to-day activities of the household (such as the spouse or partner) accounted for questions related to income and expenditure.
Employment status Male Female Total Total %
Employed 6021 3745 9766 41%
Self-employed 519 445 964 4%
Unemployed 4877 8435 13312 55%
Total 11417 12625 24042 100%
Table 20: Employment status by gender for respondents aged 16 years and older - ALL settlements
Enumeration data trends
04
Table 20A: Employment status TRA 5 and TRA 5.1
Employment status Male Female Total Total %
Employed 315 40 355 21%
Pensioner 39 1 40 2%
Self Employed 6 0 6 0%
Unemployed 1090 227 1317 77%
Total 1450 268 1718 100%
In TRA 5 and 5.1 employment status for the settlement was determined based on the status of the household head. In TRA 5, 75% of household heads are unemployment and in TRA 5.1 84% of households heads are unemployed.
Table 20 indicates that the average unemployment rate in settlements is 55%. The trend of a relatively young population with high unemployment and precarious livelihoods creates conditions of vulnerability, especially for women. Women account for 63% of the total unemployed population. In other circumstances, this could be an opportunity for entrepreneurial activity, but only 4% of working youth are reported to be self-employed.

Summary Report: Southern Corridor Enumeration, Cape Town
50
Income CategoryFrequency
countPercent
Cumulative percent
No Income 5055 27,71 27,71
R1 - R400 1119 6,13 33,84
R401 - R800 1614 8,85 42,69
R801 - R1500 4775 26,17 68,86
R1501 - R3500 4903 26,87 95,73
R3501 - R7500 723 3,96 99,69
R7501 - R15 000 51 0,28 99,97
Above 15 000 5 0,03 100
Total 18245 100
TRA 5 TRA 5.1 Total Total %
No Income 756 220 976 78%
Less than R 1000 9 0 9 1%
Between R1 001 & R2 000 30 5 35 3%
Between R2 001 & R3 500 116 16 132 11%
Between R3 501 & R5 000 53 15 68 5%
Between R5 001 and R7 000 11 2 13 1%
Between R7 001 and R10 000 15 0 15 1%
More than R10 000 5 0 5 0%
Total 995 258 1253 100%
Table 21: Income distribution for all settlements
Table 21A: Income distribution–TRA 5 and 5.1
In table 21, data on income was merged for all settlements to create an overarching indication of household income. Individual reports further analyse the income of single households. The majority (69%) of working age people earn less than R1500 per month while 27% earn between R1501 and R3500. More than a quarter (27%) of households reported earning no income at all.
Enumeration data trends
04
In TRA 5 and 5.1, household heads were asked to indicate their monthly income. The following statistics indicated that:
• 77.89% of household heads have no monthly income• 14.05% of household heads earn less than R3 500 per month• 7.66% of households heads earn between R3 501 and R10 000 per month and• 0.40% of household heads earn more than R10 000 per month.

Summary Report: Southern Corridor Enumeration, Cape Town
51
Enumeration data trends
04 ExpensesFrequency
countPercent
Cumulative percent
No Expenses 2744 15,24 15,24
R1 - R400 1113 6,18 21,41
R401 - R800 3361 18,66 40,08
R801 - R1500 6012 33,38 73,46
R1501 - R3500 4333 24,06 97,51
R3501 - R7500 405 2,25 99,76
Greater than R7500 43 0,24 100
Total 18011 100
Table 22: Expenses distribution for all settlements
The majority of respondents (73%) reported spending up to R1500 per month. There is a close connection with the previous data set presented in Table 21. Therefore it is most likely that residents break even every month, with no money left over for savings. It should be noted that the 2744 people reported to have no expenses could be seen as an indicator that such households could be dependent on other households for basic foods.
One of the few young, self-employed women in Lusaka
COMMUNITY VOICES“People have businesses here. Some sell alcohol because with that money they can send their children to school and feed their families. Spaza shop owners are more rare. Some of us sell meat. There are also loan sharks here. But there are those that are not employed and have no business. When you are unemployed there are many challenges. What would you do if you had no job, no business and no income but you have children?” - Lusaka resident

Summary Report: Southern Corridor Enumeration, Cape Town
52
Earning an income in KTC
by washing cars
Earning an income in KTC
through selling fruit and veg
Hairdressing as income
generation in Thabo Mbeki
Inside view of spaza shop in Kosovo
A small business in GxaGxa
Generating an income in Vuyo’s
hair salon in GxaGxa
Trading cosmetic products in
Kosovo
Selling tripe in Europe A taylor generates income in Kosovo

Summary Report: Southern Corridor Enumeration, Cape Town
53
Enumeration data trends
04
Figure 5: Mode of transport – Work
50
10
1214
24
25
1
42
Walk Bus Train Mini bus taxi
Own car
Other car
Other
30
40
20
4.3.3 Transport accessFigure 5 provides the percentage split for different modes of transport used to travel to work.
Located in the ‘southern corridor’, it is not surprising that the majority of working aged residents travel to work by train. Settlements in the Airport Precinct are also very close to the Airport Industria. Kosovo enjoys close proximity to the Philippi central business district, which will be the focus of a number of public and private investment schemes in the coming years. This explains the further reliance on minibus taxis, buses, and walking. Individual reports further elaborate on commuting/ journey times.
The enumeration data in Figure 6 appears to suggest that children are located within walking distances from their schools. This might also be an indication of lack of disposable income due to low wages to afford taxis or buses for children who live further away from schools.
Figure 6: Mode of transport – School
10
0
74
5
10
04
1
6
Walk Bus Train Mini bus taxi
Own car
Other car
Other
30
40
50
60
70
80
20

Summary Report: Southern Corridor Enumeration, Cape Town
54
Impression of transport at
Borcherd’s Quarry interchange
leading into Lusaka
Children at risk playing near the
highway in Vukuzenzele
Bus as a dominant transport mode in Hlazo VillageResidents walking home from work in Europe
Enumeration data trends
04
COMMUNITY VOICES“The transport is near but where I work is [also] near so I just walk to my work place. We can get transport any time. We do save money but we can’t say that is [really] our benefit.”- Europe resident

Summary Report: Southern Corridor Enumeration, Cape Town
55
Enumeration data trends
044.3.4 Medical servicesThe majority of residents indicated that they access medical facilities outside the settlement. This data is presented in Table 23. In fewer cases, settlements are located in close proximity to public hospitals and other medical facilities, such as the proximity of Kosovo to the Mitchells Plain District Hospital and the Western Cape Rehabilitation Centre. Despite this close proximity, some residents said that they cannot be treated at these facilities and still need to travel far distances to access clinics.
Chemist in Europe, a rare medical facility
COMMUNITY VOICES“We get TB, infections, rashes, diarrhoea and ring worms. I make sure that I cut my children’s hair weekly because of ring worms. We need to be near to a clinic because the clinic is far away. But we go there sometimes. When you go there you will wait the full day.” - Europe resident

Su
mm
ary
Rep
ort
: So
uth
ern
Co
rrid
or
En
um
erat
ion
, Cap
e To
wn 56
Enu
mer
atio
n d
ata
tren
ds
04 Fir
st p
lace
to
go
to
fo
r m
ed
ical
he
lpG
xag
xa +
N
ew
Re
stV
uku
-ze
nze
leL
usa
ka
Eu
rop
eB
ar-
ce
lon
aK
an
an
aH
lazo
Vil
lag
eK
TC
Th
ab
oM
be
ki
Tsu
nam
iK
oso
vo
To
tal
To
tal
%
Clin
ic in
set
tlem
ent
566
214
94
055
2710
100
022
56
34
3%
Clin
ic o
uts
ide
sett
lem
ent
210
238
637
1378
2010
226
713
570
051
82
119
92
66
%
Mo
bile
clin
ic6
3925
86
162
01
81
811
34
72%
Pu
blic
ho
spit
al8
121
1814
24
99
524
075
45
123
293
184
810
%
Pri
vate
do
cto
r1
55
718
47
01
111
1511
11%
San
go
ma
13
02
66
00
43
73
20
%
Oth
er0
00
00
00
83
310
2114
750
33
2918
%
Tota
l28
24
68
83
415
7725
94
30
33
239
7711
62
1610
573
318
293
100
%
To
tal
28
24
68
83
415
77
25
94
30
33
23
97
711
62
1610
57
33
182
93
100
%
Tab
le 2
3: F
irst
po
rt o
f ca
ll fo
r m
edic
al a
ssis
tanc
eQ
ues
tio
ns
rela
ted
to
so
cial
sec
uri
ty g
ran
ts w
ere
dir
ecte
d a
t al
l ho
use
ho
ld m
emb
ers.
Th
e re
spo
nse
rat
e to
th
ese
qu
esti
on
s av
erag
ed a
rou
nd
9
0%
, an
d t
her
efo
re g
ives
a g
oo
d in
dic
atio
n o
f b
enefi
ts r
ecei
ved
fro
m t
he
So
uth
Afr
ican
So
cial
Sec
uri
ty A
gen
cy (
SA
SS
A).
Tab
le 2
4 in
dic
ates
a
hig
h p
rop
ort
ion
of
resi
den
ts r
ecei
ve a
Ch
ild S
up
po
rt s
ub
sid
y fr
om
go
vern
men
t an
d 1
074
0 p
eop
le r
epo
rted
rec
eivi
ng
th
is m
on
thly
gra
nt.
M
ore
th
an a
qu
arte
r (2
7%)
of
the
tota
l set
tlem
ents
po
pu
lati
on
is u
nd
er t
he
age
of
13 y
ears
old
.
Cu
rren
tly
the
valu
e o
f th
e ch
ild s
up
po
rt g
ran
t is
R35
0 p
er m
on
th, t
he
fost
er c
hild
gra
nt
is R
89
0 p
er m
on
th, t
he
dis
abili
ty g
ran
t is
R15
00
per
m
on
th a
nd
th
e o
ld-a
ge
pen
sio
n g
ran
t is
R15
00
per
mo
nth
.
In T
RA
5 a
nd
5.1,
33
dis
abili
ty c
ases
wer
e re
cord
ed:
• 19
Hea
d o
f H
ou
seh
old
s w
ith
dis
abili
ties
• 2
Sp
ou
ses
wit
h d
isab
iliti
es•
12 D
epen
den
ts w
ith
dis
abili
ties
.
Th
e su
rvey
dat
a co
llect
ed b
y H
DA
ser
vice
pro
vid
er d
id n
ot
spec
ify
wh
eth
er p
eop
le w
ith
dis
abili
ties
wer
e re
ceiv
ing
th
e d
isab
ility
gra
nt.
4.3
.5 S
oci
al g
rant
s

Summary Report: Southern Corridor Enumeration, Cape Town
57
Enumeration data trends
04
4.3.6. SummaryThis section of socio-economic data confirmed that 55% of the population living in the informal settlements enumerated is unemployed. Furthermore, 96% earns less than R3500 per month. The close proximity to industry means that those in employment can take the train, taxi, bus or walk to work. There is also a high dependency on government social grants.
Grant type Frequency Percent
None 23254 66,51
Old age pension 627 1,79
Child support 10740 30,72
Disability grant 276 0,79
Foster care 49 0,14
War veteran 18 0,05
Total 34964 100Table 24: Summary of social grants received
Impression of Thabo Mbeki’s close proximity to industrial areas and wholesalers

Summary Report: Southern Corridor Enumeration, Cape Town
58
Enumeration data trends
044.4. ACCESS TO BASIC SERVICES
The South African Constitution, Act 106 of 1996, states that municipalities have the responsibility to make sure that all citizens are provided with services to satisfy their basic needs. The most important of these are:
• Water supply• Sewage collection and disposal• Refuse removal• Electricity and gas supply• Municipal health services• Municipal roads and storm water drainage• Street lighting• Municipal parks and recreation
The Western Cape Government and the City of Cape Town adopted minimal standards for the provision of sanitation and water: 5:1 households to sanitation facility and and 25:1 households to a water point. National legislation and policy guidelines also make recommendations for minimal standards.
The Strategic Framework for Water Services of the Department of Water Affairs and Forestry (DWA 2003) makes the following provision for access to water services:
• “The infrastructure necessary to supply 25 litres of potable water per person per day within 200 metres of a household and with a minimum flow of 10 litres per minute (in case of communal water points) or 6000 litres of potable water supplied per formal connection per month (in case of yard or house connections).”
• A basic water supply service is defined as “the provision of a basic water supply facility, the sustainable operation of the facility (available for at least 350 days per year and not interrupted for more than 48 consecutive hours per incident) and the communication of good water-use, hygiene and related practices.”
The same Strategic Framework for Water Services (DWA 2003) makes the following allocation for sanitation services:
• The infrastructure necessary to provide a sanitation service which is safe, reliable, private, protected from the weather, ventilated, keeps smells to the minimum, is easy to keep clean, minimises the risk of the spread of sanitation- related diseases by facilitating the appropriate control of disease carrying flies and pests, and enables safe and appropriate treatment and/or removal of human waste and wastewater in an environmentally sound manner.
Table 25 below is a summary of the service levels in informal settlements in the Airport Precinct and Kosovo. The individual reports contain GIS maps of the distribution of services across the settlement. On average, 17 households share a toilet. This is higher than the target service delivery ratio of 5:1. On average, 78 households share a water tap, which is also higher than the target service delivery ratio of 25 households to one tap.

Su
mm
ary
Rep
ort
: So
uth
ern
Co
rrid
or
En
um
erat
ion
, Cap
e To
wn 59
Kan
an
aB
arc
elo
na
Eu
rop
eV
uku
-
ze
nze
leL
usa
ka
Gxag
xa
Ko
sovo
Th
ab
o
Mb
eki
KT
CT
sun
am
i
IDA
/TR
A
Hla
zo
Vil
lag
e
Toile
ts8
2411
714
057
2229
188
728
162
93
1
Hh
/ to
ilet
rati
o3
,923
,311
,69
38
,58
31
67
183
2
Tap
s56
564
113
53
42
1419
1323
Hh
/tap
s ra
tio
57,1
48
,639
,439
169
,479
138
87
5813
016
Ele
ctri
city
pre
pai
d m
eter
s4
7%6
2%8
1%73
%8
2%12
%73
%6
4%
58%
0%
77%
Co
nn
ecti
on
to
nei
gh
bo
urs
’ met
ers
43
%3
1%15
%-
15%
45%
13%
24%
22%
0%
23%
No
ele
ctri
city
10%
7%4
%-
3%
43
%14
%12
%20
%10
0%
-
Tab
le 2
5: S
umm
ary
of
acce
ss t
o b
asic
ser
vice
s
Enu
mer
atio
n d
ata
tren
ds
04
CO
MM
UN
ITY
VO
ICE
S“W
e u
se w
ater
bu
cket
s an
d w
alk
a d
ista
nce
to
go
to
th
e ta
ps.
W
e fe
tch
wat
er 5
tim
es a
day
, or
mo
re. W
hen
th
e ch
ildre
n c
om
e b
ack
fro
m s
cho
ol w
e n
eed
to
was
h t
hei
r cl
oth
es a
nd
co
ok
for
ou
r fa
mili
es.”
- V
uku
zen
zele
res
iden
t

Summary Report: Southern Corridor Enumeration, Cape Town
60
4.5. CONCLUSION
Section 5 focused on analysing the enumeration of settlements in the Airport Precinct and Kosovo. Section 1 presented analysis of dwellings, and it was found that single households (who are predominantly single men) live in single-room structures smaller than 30 square meters. The majority of respondents also claim to have lived in the settlement for less than five years. There is a sense of ownership in residents, and 89% of all households claim to own the structures they live in.
Residential uses also outweigh other uses (including commercial, recreational and religious). Section 2 discussed the demographics of enumeration data, and it was found that the majority of residents are younger than 35 years old, and that 55 out of 100 residents are women. Men, however, make up the majority (70%) of single person households. In Section 3, socio-economic data was discussed and it was found that 96% of residents earn less than R3500 per month. The close proximity to industry means that those in employment can take the train, taxi, bus or walk to work. Finally, in section 4 services were discussed.
Data was ‘rolled-up’ to produce summary data tables, and readers are encouraged to consult the individual enumeration reports for more details on:
• Community services and local businesses; • Health and disaster; • Settlement priorities; • Why people move to and will move from the settlement; • Spatial distribution of services and non-residential uses; and• Further insights on single households.
Enumeration data trends
04
Bucket toilet in Kanana
Bucket toilet in Thabo Mbeki
Bucket toilet in Europe
Chemical toilets in Tsunami

Summary Report: Southern Corridor Enumeration, Cape Town
61
Enumeration data trends
04
Flooding around toilet block in Gxagxa Water tap and sanitation in Hlazo Village Fetching water in Kanana
Impression of water and drainage facilities in Europe
Inadequate drainage in Kosovo Flooding in Kanana
Waste and flooding in Vukuzenzele Waste situation in Vukuzenzele Extent of waste prevalence near Europe

Summary Report: Southern Corridor Enumeration, Cape Town
62
Enumeration data trends
04
Children playing in the waste in Kosovo
An overflowing waste container in Europe
Community hall in Kanana
Hlazo Village community hall Creche facility and community hall in Barcelona
Creche facility in Europe
Impression of energy and electricity in KTC
Impression of electricity in Thabo Mbeki
Electrical connections in GxaGxa

Summary Report: Southern Corridor Enumeration, Cape Town
63
5.1. WESTERN CAPE GOVERNMENT HOUSING SUBSIDY CRITERIA
The Western Cape Government follows the National Housing Code in prescribing criteria for beneficiaries of a government housing subsidy. The following criteria applies to those seeking a housing subsidy in the Western Cape Province (WCG 2017).
• Applicants must have been on the municipal housing demand database for a minimum period of 10 years (Proof of registration required)
• Priority will be given to applicants over the age of 40 years and / or with special needs
• Applicants are married or living with a long-term partner• Applicants are single or divorced with others who rely on their income• Applicants are a South African citizen or have a permanent resident’s permit• Applicants are over 18 years of age or if under 18, married or divorced with
others who rely on your income• Applicants’ monthly household income before deductions is less than R3 500• Applicant or partner has never received a subsidy from the government• Applicant or partner has never owned property• Applicant and family will live on the property bought with the subsidy.
5.2. METHODOLOGY
One of the ultimate objectives of the enumeration study was to gather data that could inform future planning of settlement upgrading and housing development in settlements. Respondents were asked a number of questions relating to the housing subsidy and other human settlement factors. This section will unpack some of the information collected in this regard. Furthermore, data collected has been tabled to give an overarching indication of the proportion of residents who might qualify for housing subsidy.
The following steps were followed in building the data table in line with potential beneficiary criteria outlined above:
• Step 1: Determine the total population of over 18 year olds. • Step 2: Non-RSA residents or those without permanent residency permits
were deemed as non-qualifiers. • Step 3: Those who previously owned property were deemed as non-qualifiers.
However, the service provider is concerned that the data collected might be an overstatement. This is further explained in section 5.4.
• Step 4: Those who previously received a housing subsidy were deemed as non-qualifiers.
• Step 5: Single person households without dependents were deemed as non-qualifiers.
• Step 6: All these who identified themselves as ‘partners’ or ‘spouse’ of the household head were excluded to avoid double counting when couples jointly submit a subsidy application.
• Step 7: Those who indicated their joint household income exceeded R3500 per month before deductions were deemed non-qualifiers.
5. PROFILE OF QUALIFIERS
FOR HOUSING SUBSIDY
Profile of qualifiers for houseing subsidy
05

Summary Report: Southern Corridor Enumeration, Cape Town
64
Profile of qualifiers for houseing subsidy
055.3. LIMITATIONS
The following data was not collected and might influence the indicative proportion of the population who might be eligible for a housing subsidy.
• Data on housing database registration was not collected in questionnaires;• Over 40 year old prioritisation was not taken into account; and• An indication whether residents will continue to live in the house was not taken
into account.
The data presented in Table 25 below should only be taken as an indicative estimate and any further beneficiary identification should consider analysis against the housing demand database, to which the service provider did not have access.
5.4. RESULTS
Table 25 below presents the summary of potential housing subsidy qualifiers. When the subsidy qualification criteria is applied to the enumeration data, it is estimated that 52% of the population, or 14002 residents, are potential qualifiers.
Previously it was mentioned that the service provider is concerned that residents did not understand the question about property ownership well, or that the question was poorly formulated. The total number of residents who are potentially excluded from a housing subsidy (based on alleged prior ownership of property) is 5881 residents. Property ownership is understood as property formally registered in a deeds office, and not any customary or perceived ownership of land or even the informal dwelling/shack. Two scenarios were tested against an assumption that this question was misunderstood. Firstly, it is assumed that only 30% of the 5881 residents own property. In this scenario, an additional 4117 beneficiaries are added to the total, and potentially 66% of the population qualifies for a housing subsidy. In the second scenario, it is assumed that 50% of 5881 residents own property and 2941 beneficiaries are added which increases the total potential qualifiers to 62%.
Based on these two scenarios, the service provider is of the view that a low and conservative estimate is that 53% qualify for a housing subsidy, while a more realistic estimate is that between 62% and 65% of residents qualify for a housing subsidy.
COMMUNITY VOICES“In 5 years to come I wish Tsunami to be where our leaders want it to be. I see a better Tsunami where we are going to live freely.I see a crime free community with electricity and good behaviour from the youth. We don’t want to relocate but we want development here in Tsunami.
I’d remove chemical toilets because they cause infections in many people, demolish the shacks and build beautiful formal houses with tiles on the roof. I’d put street lights and make this settlement beautiful with flushing toilets inside the structures.” - Tsunami resident

Su
mm
ary
Rep
ort
: So
uth
ern
Co
rrid
or
En
um
erat
ion
, Cap
e To
wn 65
Pro
file
of
qua
lifier
s fo
r ho
usei
ng
sub
sid
y
05
Cri
teri
a a
pp
lie
d t
o d
ete
rmin
e p
ote
nti
al
qu
ali
fie
rs o
f a h
ou
sin
g s
ub
sid
y
Gxag
xa /
Ne
w R
est
Vu
ku
-
ze
nze
leL
usa
ka
Eu
rop
eB
ar-
ce
lon
aK
an
an
aH
lazo
Vil
lag
eK
TC
Th
ab
o
Mb
eki
Tsu
nam
iK
oso
vo
To
tal
Pe
op
le
Excl.
Ch
ildre
n u
nd
er 1
8 e
xclu
ded
18
54
176
86
133
821
2019
264
733
1222
1437
470
614
774
18 y
ears
an
d o
lder
4
10
86
8
1 4
26
2 8
68
4
38
6
4 7
78
31
1 5
94
1
928
2
06
3
9 7
41
30
0
93
18 y
ears
an
d o
lder
AN
D R
SA
nat
ion
alit
y/
per
man
ent
resi
den
cy1
40
5 8
58
1 3
89
2
835
4
28
0
4 6
46
3
0
1 5
81
1 8
88
2
04
1 9
64
5 2
9
598
4
95
18 y
ears
an
d o
lder
AN
D R
SA
nat
ion
alit
y/
per
man
ent
resi
den
cy A
ND
nev
er o
wn
ed
pro
per
ty (
form
ally
reg
iste
red
by
a d
eed
s o
ffice
)
2 3
02
64
5 1
09
2 2
215
3
620
3
271
2
9
1 0
04
1
537
1
30
0
8 7
04
2
3
717
5 8
81
18 y
ears
an
d o
lder
AN
D R
SA
nat
ion
alit
y/
per
man
ent
resi
den
cy A
ND
nev
er o
wn
ed
pro
per
ty (
form
ally
reg
iste
red
by
a d
eed
s o
ffice
) A
ND
nev
er r
ecei
ved
a h
ou
sin
g
sub
sid
y
3 2
77
60
1 1
03
1 2
16
7 3
46
2 2
972
2
9
928
1
50
3
1 1
06
8
659
2
2 73
5 9
82
18 y
ears
an
d o
lder
AN
D R
SA
nat
ion
alit
y/
per
man
ent
resi
den
cy A
ND
nev
er o
wn
ed
pro
per
ty (
form
ally
reg
iste
red
by
a d
eed
s o
ffice
) A
ND
nev
er r
ecei
ved
a h
ou
sin
g
sub
sid
y A
ND
mar
ried
or
wit
h d
epen
den
ts
4 2
22
514
8
95
1 8
24
2 8
22
2 5
26
17
84
2 1
38
8
1 0
43
7
054
1
9
146
3
58
9
Notes
Tab
le 2
6: S
umm
ary
of
po
tent
ial h
ous
ing
sub
sid
y q
ualifi
ers
BN
G

Su
mm
ary
Rep
ort
: So
uth
ern
Co
rrid
or
En
um
erat
ion
, Cap
e To
wn
66
Pro
file
of
qua
lifier
s fo
r ho
usei
ng
sub
sid
y
05
Tab
le 2
6: S
umm
ary
of
po
tent
ial h
ous
ing
sub
sid
y q
ualifi
ers
BN
G
Cri
teri
a a
pp
lie
d t
o d
ete
rmin
e p
ote
nti
al
qu
ali
fie
rs o
f a h
ou
sin
g s
ub
sid
y
Gxag
xa/
Ne
w R
est
Vu
ku
-
ze
nze
leL
usa
ka
Eu
rop
eB
ar-
ce
lon
aK
an
an
aH
lazo
Vil
lag
eK
TC
Th
ab
o
Mb
eki
Tsu
nam
iK
oso
vo
To
tal
Pe
op
le
Exclu
de
d
18 y
ears
an
d o
lder
AN
D R
SA
nat
ion
alit
y/
per
man
ent
resi
den
cy A
ND
nev
er o
wn
ed
pro
per
ty (
form
ally
reg
iste
red
by
a d
eed
s o
ffice
) A
ND
nev
er r
ecei
ved
a h
ou
sin
g
sub
sid
y A
ND
mar
ried
or
wit
h d
epen
den
ts
AN
D s
po
use
/par
tner
of
the
ho
use
ho
ld
hea
d is
rem
ove
d
5 2
01
435
7
37
1 5
37
2 3
23
2 0
24
17
717
1
158
9
38
5
93
1 1
6 0
17
3 1
29
18 y
ears
an
d o
lder
AN
D R
SA
nat
ion
alit
y/
per
man
ent
resi
den
cy A
ND
nev
er o
wn
ed
pro
per
ty (
form
ally
reg
iste
red
by
a d
eed
s o
ffice
) A
ND
nev
er r
ecei
ved
a h
ou
sin
g
sub
sid
y A
ND
mar
ried
or
wit
h d
epen
den
ts
AN
D s
po
use
/par
tner
of
the
ho
use
ho
ld
hea
d is
rem
ove
d A
ND
ho
use
ho
ld e
arn
s le
ss t
han
R3
,50
0 p
er m
on
th
6 2
01
40
4
69
2 1
48
4
2 2
88
2
024
1
5 6
97
1 1
08
9
38
5
84
2 1
5 6
91
326
Po
ten
tial
ho
usi
ng
qu
alifi
ers
as %
of
tota
l o
ver
18 y
ear
old
s4
9%
47%
49
%52
%52
%4
2%4
7%4
4%
57%
45%
60
%52
%14
40
2
**To
tal
qu
alifi
ers
add
ed
if
on
ly
30
%
pre
vio
usl
y o
wn
ed p
rop
erty
66
%4
117
**To
tal
qu
alifi
ers
add
ed
if
50%
p
revi
ou
sly
ow
ned
pro
per
ty6
2%2
94
1
Notes

Summary Report: Southern Corridor Enumeration, Cape Town
67
NOTES 1. 495 non-RSA residents do not qualify for a subsidy2. 5881 people indicated that they owned property. The service provider is of the
view that this number is an overstatement. In terms of the housing who were 18 and older and South African citizen or permanent resident indicating that they had owned property, plus 315 indicating don’t know and 1253 with missing data.
3. 982 residents indicated to have previously received a housing subsidy by the state.
4. 3,589 residents indicates they have never been married and live alone (potentially without dependents). This figure suggests that a large part of the population in informal settlements enumerated were single households, and a large proportion were single men potentially without dependents. The remainder of the residents were either married, cohabiting partners, traditional customary marriage, divorced or widowed.
5. Potential double counts are excluded based on relationship to the household head. In theory, one subsidy application per household is permissible. This results in 3129 residents not qualifying due to their relationship status to the household head being ‘spouse’ (1,675 residents) and ‘partner’ (1,454).
6. It was established that 95% of the population in all settlements earn less than R3,500 per month. 326 people are disqualified of a housing subsidy because 303 earn between R3,501 to R7,500, 22 people earns R7,501 to R15,000 and 1 person earns more than R15,000 per month.
5.5. TRA 5 AND 5.1 BENEFICIARY PROFILES
Service providers to HDA calculated the potential number of beneficiaries by excluding those earning more than R3,500 per month, foreigners, previously registered for HSS, and single people without any dependents. In some cases, no valid ID number was presented, which also potentially excludes those residents.
Profile of qualifiers for houseing subsidy
05
TRA 5 TRA 5.1 Total
Count % Count % Count %
Potential Beneficiaries 1119 77% 125 47% 1244 72%
Income Exceeds R3,500 pm 99 7% 11 4% 110 6%
Invalid ID number 22 2% 3 1% 25 1%
Non South African 2 0% 0 0% 2 0%
Previously approved at HSS 85 6% 8 3% 93 5%
Single No Dependents 123 8% 121 45% 244 14%
Total 1450 100% 268 100% 1718 100%
Table 26A: Beneficiary profile – TRA 5 and 5.1

Summary Report: Southern Corridor Enumeration, Cape Town
68
6.1. INTRODUCTION
Data from individual enumeration and findings from enumeration reports has been summarised in this report to give the reader an overarching presentation of the major findings. In this section, the service provider provides recommendations based on the major findings.
6.2. MAINTAIN STRONG COMMUNITY NETWORKS
In the duration of the enumeration studies, community committees were established to oversee data collection, spatial mapping, and verification of enumeration and spatial data. Moreover, each individual report provides insight into the existing leadership committees at settlement level. It is the experience of the service provider that participatory data collection, a core methodology deployed in these studies, holds tremendous potential to successfully partner with communities to bring about developmental agendas.
6.3. LAND, PLANNING AND SERVICES
The City of Cape Town’s Built Environment Performance Plan (BEPP) 2016/17 states in the supporting document Metro South-East Integration Zone: Area-wide Strategic Framework, that “the Urgent Housing” clauses in the Municipal Planning By Law (MPBL 2015) should be unpacked and resourced to speed up the processing of human settlement applications. This need is further illustrated given the findings in some of the settlements.
6.4. OPTIONS FOR TENURE
Enumeration data confirms that dwellings in settlements can be described as small one and two room dwellings, densely organised along informal roads and limited open spaces. Residents have a sense of ownership; indeed 88% claim to own their dwellings. Tenure options need to take into account existing informal property transactions, especially in Barcelona and Kanana where more residents are subject to informal lease agreements.
6.5. HIGHER DENSITY HOUSING TYPOLOGIES
The City of Cape Town’s Built Environment Performance Plan (BEPP) 2016/17 states that at least 250 hectare of land is needed to accommodate residents if development densities of minimum of 100 dwelling units per hectare were to be maintained. However, it was found that the average densities are 191 dwelling units per hectare (156 du/ha if Gxagxa and Hlazo Village, two small settlements more dense than 300 du/ha, are excluded). Minimal disruption should be caused in settlement upgrading. Secondly, to achieve these densities, multi-storey housing is required, which comes at a cost higher than the current housing subsidy quantum allowance. Thirdly, bulk services and other associated infrastructure is required.
6.6. SOCIAL DEVELOPMENT
The summary report does not adequately address social development options, but individual enumeration reports show that many children are not attending school. Safety and public spaces should also be critical components of an upgrading strategy.
6. RECOMMENDATIONS AND
IMPLICATIONS FOR PLANNING AND DESIGN
Recommendations and implications for planning and design
06

Summary Report: Southern Corridor Enumeration, Cape Town
69
The Western Cape Government, in partnership with the City of Cape Town, appointed Community Organisation Resource Centre (CORC) through a competitive bidding process to enumerate 11 informal settlements in the ‘Southern Corridor’, which incorporates the Airport Precinct and Kosovo. These eleven (11) informal settlements are: Europe, Kanana, Barcelona, Lusaka, Gxagxa, Vukuzenzele, Thabo Mbeki, KTC, Hlazo Village, Tsunami IDA/TRA and Kosovo.
Apart from Kosovo, settlements in the Airport Precinct share a very similar history. Backyarders from Gugulethu and Nyanga occupied vacant land on the N2 servitude in the late 1980s / early 1990s. Other settlements not directly adjacent to the Airport (i.e. Thabo Mbeki, KTC, Hlazo Village and Tsunami) have unique settlement histories more thoroughly discussed in the individual reports. Portions of occupied land are a discontinued land fill site. Spatial analysis presented in the individual reports, and summarised in this report, shows that by the early 2000s the settlements were densely occupied, and that over the past decade and a half, this infill growth has intensified. If Gxagxa and Hlazo Village, two small settlements more dense than 300 du/ha, are excluded from the average population density, the population density decreases to 156 dwelling units per hectare.
The combined enumeration studies of settlements in the Southern Corridor yielded the following results:
• 13 enumerated settlements (all by CORC and community partners, FEDUP and ISN except TRA 5 and 5.1)
• 21 313 dwellings counted (of which 19 459 or 90% were enumerated)• 20 715 households recorded in 19 459 dwellings• A total population count of 48 794 people • An average household size of 2.3 people
On average, the service provider was able to count all the structures and enumerate close to 89% of all structures. No data was collected for 11% of structures due to absenteeism, refusal to participate, or other related reasons. The majority of respondents were household heads of those closely associated with the affairs of the household (e.g. spouse or partner).
The data presented indicates that the majority of the population (55%) is unemployed, and that only 4% is engaged in entrepreneurial activities (i.e. self-employed). The majority (96%) of residents earn less than R3500 per month. There is also a high proportion (28%) who earn no income at all. Analysis of transport for daily work commutes confirms that residents are employed in close vicinity to where they live. The Airport Industria is within walking distance from settlements in the Airport Precinct, and Kosovo residents might benefit from plans to intensify industrial development in Philippi.
In order to determine an estimate of housing subsidy qualifiers, enumeration data was run against criteria for housing subsidies. It was found that 52% qualify for a housing subsidy. However, the service provider has concerns that the question of property ownership was misunderstood resulting in 5881 residents being removed as non-qualifiers.
Conclusion
7. CONCLUSION
07

Summary Report: Southern Corridor Enumeration, Cape Town
70
Conclusion07Based on these two scenarios, the service provider is of the view that a low and conservative estimation is that 53% qualify for a housing subsidy, while a more realistic estimation is that between 62% and 66% of residents qualify for a housing subsidy. Property ownership is understood as property formally registered in a deeds office, and not any customary or perceived ownership of land or even the informal dwelling/shack. Two scenarios were tested against an assumption that this question was misunderstood. Firstly, it is assumed that only 30% of the 5881 residents own property. In this scenario, an additional 4117 beneficiaries are added to the total. A potential 66% of the population qualifies for a housing subsidy. In the second scenario, it is assumed that 50% of 5881 residents owns property and that 2941 beneficiaries are added which increases the total potential qualifiers to 62%. Based on the implementation of the study, strong community networks and organisations should be supported, land, planning and services should be prioritised, options for tenure should be considered, higher density housing typologies should be investigated, and social development programmes should be initiated.

Summary Report: Southern Corridor Enumeration, Cape Town
71
REFERENCES
References• Department of Cooperative Governance and Traditional Affairs (COGTA). 2005.
The Municipal Infrastructure Grant: Basic Levels of services and unit costs; a guide for municipalities. Online: http://www.cogta.gov.za/mig/docs/5.pdf
• Department of Water Affairs (DWA). 2003. Strategic Framework for Water Services. Online: http://www.dwaf.gov.za/Documents/Policies/Strategic%20Framework%20approved.pdf
• Todes, A.; Kok, P.; Wentzel, M.; van Zyl, J.; & Cross, C. 2010. Contemporary South African Urbanisation Dynamics. Urban Forum 21:331–348
• Housing Development Agency (HDA). 2013a. Western Cape: Informal Settlements Status. Research Report, HDA
• Housing Development Agency (HDA). 2013b. South Africa: Informal Settlements Status 2013. Research Report, HDA
• NDHS (National Department of Human Settlements). 2014. Presentation made by the National Upgrading Support Programme, Policy Consultative Workshop held on 5 September 2014 at the Townhouse Hotel, Cape Town.
• NUSP (National Upgrading Support Programme). 2014. Resource Kit: Part 3 – Building Partnerships. Online: < http://www.upgradingsupport.org/content/page/part-3-building-partnerships>
• Statistics South Africa, 2016. Labour Force Survey• Western Cape Department of Human Settlements. 2015. Minister’s Budget Vote
speech for the 2015/16 financial year. Cape Town.• Western Cape Government. 2017. All you need to know about housing
subsidies. Online: https://www.westerncape.gov.za/service/all-you-need-know-about-housing-subsidies

Summary Report: Southern Corridor Enumeration, Cape Town
72
List of core team members
Team Member Institution
Mr. Thando Mguli HOD: WC Department of Human Settlements
Ms. Tracy Jooste WC Department of Human Settlements
Ms. Pamela Masiko-Kambala WC Department of Human Settlements
Ms. Susan Nel City of Cape Town
Ms. Levona Powell City of Cape Town
Mr. Greg Exford City of Cape Town
Mr. Jeffrey Williams City of Cape Town
Mr. Michael Webster WC Department of Human Settlements
Mr. Mbongi Gubuza WC Department of Human Settlements
Mr. Kenneth Kirsten WC Department of Human Settlements
Mr. Bongani Ngcombolo City of Cape Town: Councillor Ward 40
Mr. Siphiwo Nqamnduku City of Cape Town: Councillor Ward 88
Mr. Sithembiso Mzobe City of Cape Town: Councillor Ward 33
Mr. Khaya Yozi City of Cape Town: Councillor Ward 39
Mr. Anthony Moses City of Cape Town: Councillor Ward 44
Mr. Mzwakhe Nqavashe Previous Ward Councillor Ward 40
Mr. Nico Mzalisi Previous Ward Councillor Ward 88
Ms. Noxolo Kabane WC Department of Human Settlements
Mr. Lindilizwi Mngxekeza Housing Development Agency
Federation of the Urban and Rural Poor
Informal Settlement Network
Community Organisation Resource Centre
LIST OF CORE TEAM MEMBERS

sasdialliance.org.za
South African SDI Alliance
@SASDIAlliance
vimeo.com/sasdialliance
w
e
A member of the SA SDI Alliance