Southern California Housing Outlook Kevin Gillen On Economic Trends
21
SOUTHERN CALIFORNIA HOUSING OUTLOOK Welcome To The Southern California Housing Outlook January 2015
-
Upload
meyers-research-llc -
Category
Real Estate
-
view
202 -
download
0
Transcript of Southern California Housing Outlook Kevin Gillen On Economic Trends

SOUTHERN CALIFORNIA HOUSING OUTLOOK
Welcome To The
Southern California Housing OutlookJanuary 2015
20Southern California Housing OutlookJanuary 2015
Economic SessionKevin Gillen, Ph.D, Chief Economist at Meyers Research

Southern California Housing OutlookJanuary 2015 21
Outline
• Review and discuss current housing market metrics
• Review and discuss underlying economic/demographic drivers of these metrics
• Link housing’s current inputs to its current outcomes
• Deliver the short- and long-term outlook for both U.S. and California housing market
Southern California Housing OutlookJanuary 2015 24
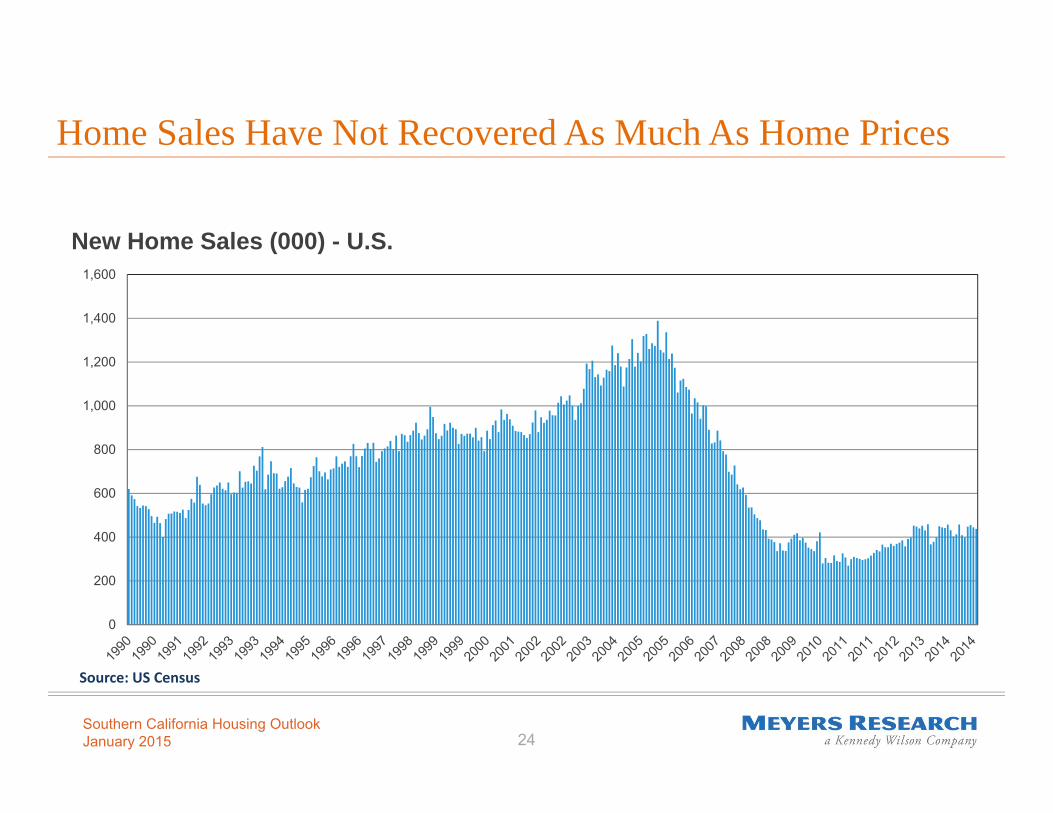
Home Sales Have Not Recovered As Much As Home Prices
0
200
400
600
800
1,000
1,200
1,400
1,600
New Home Sales (000) - U.S.
Source: US Census

Southern California Housing OutlookJanuary 2015 27
Those are the housing market’s current outcomes.
But: what are the underlying inputs that are determining those outcomes?
• Macroeconomic factors
• Demand-side factors
• Supply-side factors
Housing Outcomes v. Inputs
Southern California Housing OutlookJanuary 2015 28
-6.0%
-4.0%
-2.0%
0.0%
2.0%
4.0%
6.0%
8.0%
10.0%
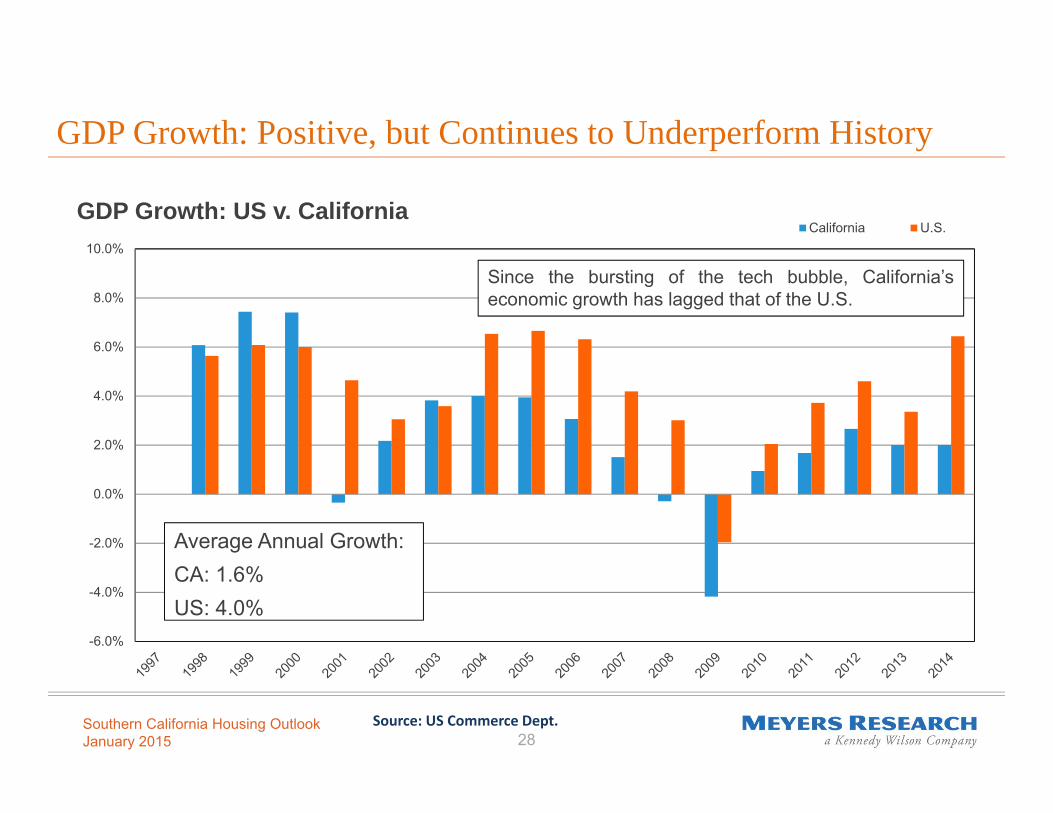
GDP Growth: US v. CaliforniaCalifornia U.S.
Since the bursting of the tech bubble, California’seconomic growth has lagged that of the U.S.
GDP Growth: Positive, but Continues to Underperform History
Average Annual Growth:CA: 1.6%US: 4.0%
Source: US Commerce Dept.

Southern California Housing OutlookJanuary 2015 29
Composition of California’s GDP
Real Estate is one of the largest components of California’s economy.
Makes it relatively exposed to real estate downturns.
Source: State of California

Southern California Housing OutlookJanuary 2015 30
Unemployment Declining, But Still Above Historic Average
0.0
2.0
4.0
6.0
8.0
10.0
12.0
14.0
Unemployment Rate: US v. CaliforniaCalifornia US
Source: US Bureau of Labor Statistics
Southern California Housing OutlookJanuary 2015 31
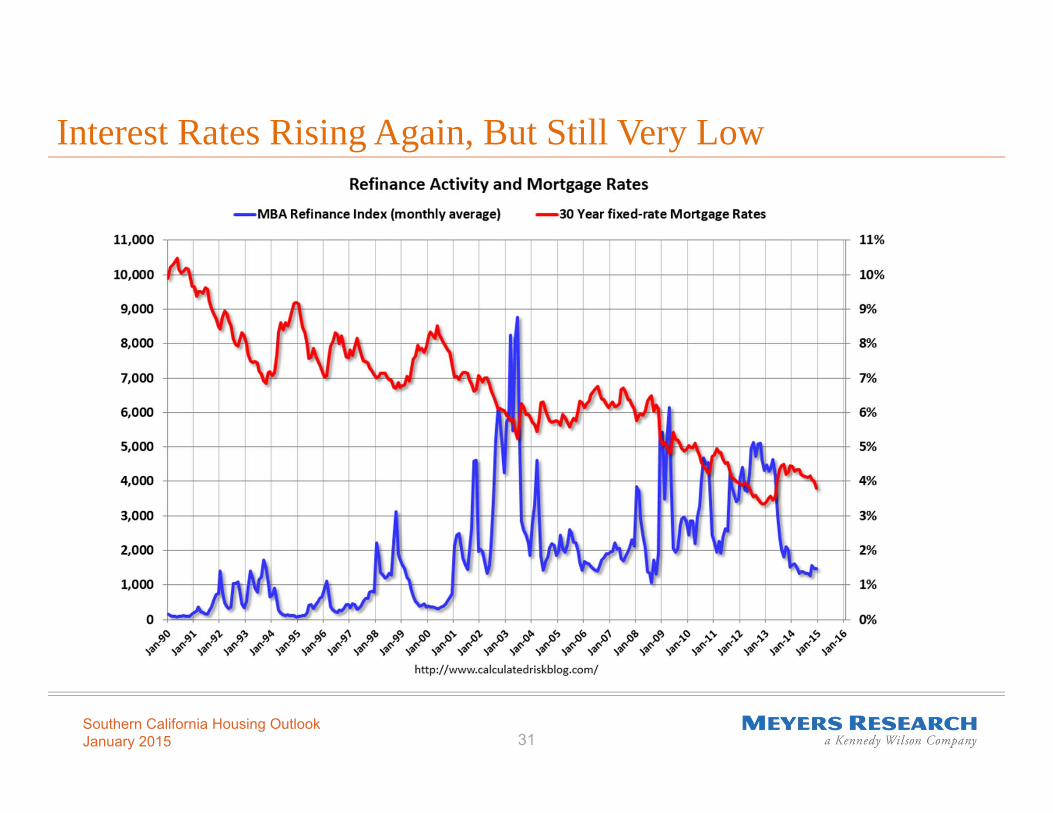
Interest Rates Rising Again, But Still Very Low

Southern California Housing OutlookJanuary 2015 32
Population Growth Positive, But Slowing
0.0%
0.2%
0.4%
0.6%
0.8%
1.0%
1.2%
1.4%
1.6%
1.8%
Population Growth: US v. CaliforniaUS California
Source: US Census
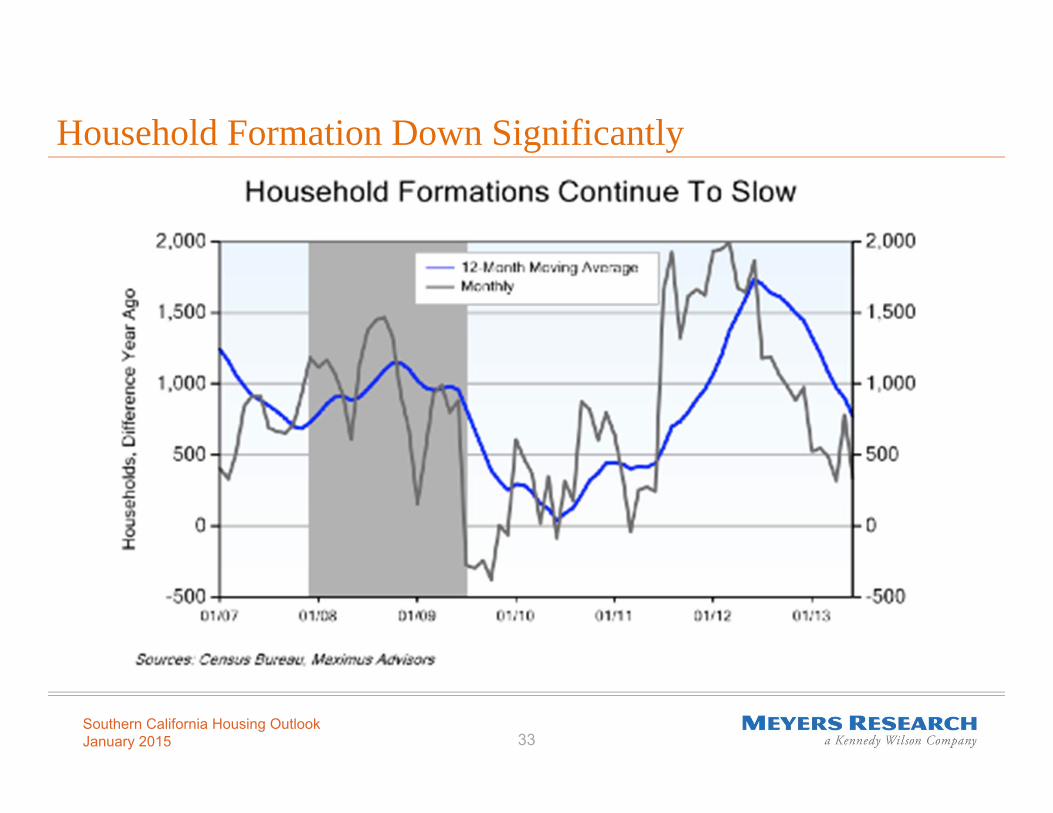
Southern California Housing OutlookJanuary 2015 33
Household Formation Down Significantly

Southern California Housing OutlookJanuary 2015 34
Post-Recession Household Income Growth Stagnant
$0
$10,000
$20,000
$30,000
$40,000
$50,000
$60,000
$70,000
Median Household Income: US v. California
US California
California consistently wealthier thannational average.
Source: US Census

Southern California Housing OutlookJanuary 2015 35
New Home Construction Still Struggling to Recover
0
20,000
40,000
60,000
80,000
100,000
120,000
140,000
160,000
180,000
0
200,000
400,000
600,000
800,000
1,000,000
1,200,000
1,400,000
1,600,000
1,800,000
New Housing Starts: US v. CaliforniaUS California
Source: US Census

Southern California Housing OutlookJanuary 2015 36
Housing Inventories Back to Historic Norms
U.S. Months’ Supply ofInventory
California Months’ Supply ofInventory
Source: Calculated Risk Blog, California Association of Realtors

Southern California Housing OutlookJanuary 2015 37
To recap:• House prices rising but sales still a bit below average• Rental market doing well, but due for a correction• Economy in recovery, but underperforming• Ditto for employment• Interest rates rising, but still low• Population growth and household formation slowing• Income growth sluggish• Inventories normal, but new construction still low• California housing generally doing better than US’s, even if economy
isn’t.
These are mixed signals. So, what does it all mean?!
So: What Does It All Mean??
Southern California Housing OutlookJanuary 2015 38
Signals are mixed because it’s really a “Tale of Two Housing Markets”• Affluent and older households v. poorer and younger households• Driven by economic differences between these two households
(nationally) and housing supply conditions (locally)
Young Households:• Debt (esp. student debt), low skills, college degrees with little market value, less experience
• They’ve been rentingLocally, affordability is the real issue, caused by supply constraints• Land supply
• Environmental Regulations
• Zoning and permitting process
• Political Environment
So: What Does It All Mean??

Southern California Housing OutlookJanuary 2015 39
Homeownership for Young Households Near Historic Low
Source: Trulia and WSJ.com

Southern California Housing OutlookJanuary 2015 42
Implications of Supply Elasticity for Housing
y = 0.5109x + 51.871R² = 0.623
y = 0.1675x + 76.19R² = 0.9188
0
50
100
150
200
250
300
1987
1987
1988
1989
1989
1990
1991
1991
1992
1993
1993
1994
1995
1995
1996
1997
1997
1998
1999
1999
2000
2001
2001
2002
2003
2003
2004
2005
2005
2006
2007
2007
2008
2009
2009
2010
2011
2011
2012
2013
2013
2014
A Tale of Two Cities' House Price Dynamics
Los Angeles
Dallas
Linear (Los Angeles)
Linear (Dallas)
Source: Case‐Shiller

Southern California Housing OutlookJanuary 2015 45
Affordability: US v. Southern California
Source: Economy.com

Southern California Housing OutlookJanuary 2015 46
New Construction is Generally Unaffordable to Most
Source: Meyers Research

Southern California Housing OutlookJanuary 2015 47
In the Short Run:• Housing recovery will continue, both nationally and in California
• But at uneven paces across different U.S. markets
In general, 2015 is looking like a “return to normalcy”…at least at the national level• House price appreciation returning to its historic average of 4-6% per annum
• In Southern California, Affordability will remain the key constraint to a more equitable and widespread recovery
In the Long Run:• California’s supply inelasticity will be the primary governing factor in determining housing
market outcomes:
• Unaffordability
• Volatility/Cyclicality
• Risk to Statewide Economy
Where Do We Go From Here?