Southeast Europe - cdn.seenews.com Banking Industry Report H1...In general, the banking system of...
12
Southeast Europe Flawless Performance by the Banking Sector January - June 2017
Transcript of Southeast Europe - cdn.seenews.com Banking Industry Report H1...In general, the banking system of...

Southeast EuropeFlawless Performance by the Banking Sector
January - June 2017

One-stop shop for business intelligence for Southeast Europe
For over 15 years, we have given 360-degree perspective on Southeast Europe, helping professionals across industries make informed business decisions.
13,000+proprietary stories annually
25,000+premium reports
800,000+company profiles
Get 1 month free premium access to SeeNews.comGo to seenews.com/promo and enter promo code BACEE2018
[email protected] www.seenews.com
Southeast EuropeFlawless Performance by the Banking Sector
Contents
Highlights 2
SEE Banking Sector Overview 2
Albania 4
Bosnia and Herzegovina 4
Bulgaria 5
Croatia 5
Macedonia 6
Moldova 6
Montenegro 7
Romania 7
Serbia 8
Southeast Europe – Flawless Performance by the Banking Sector2
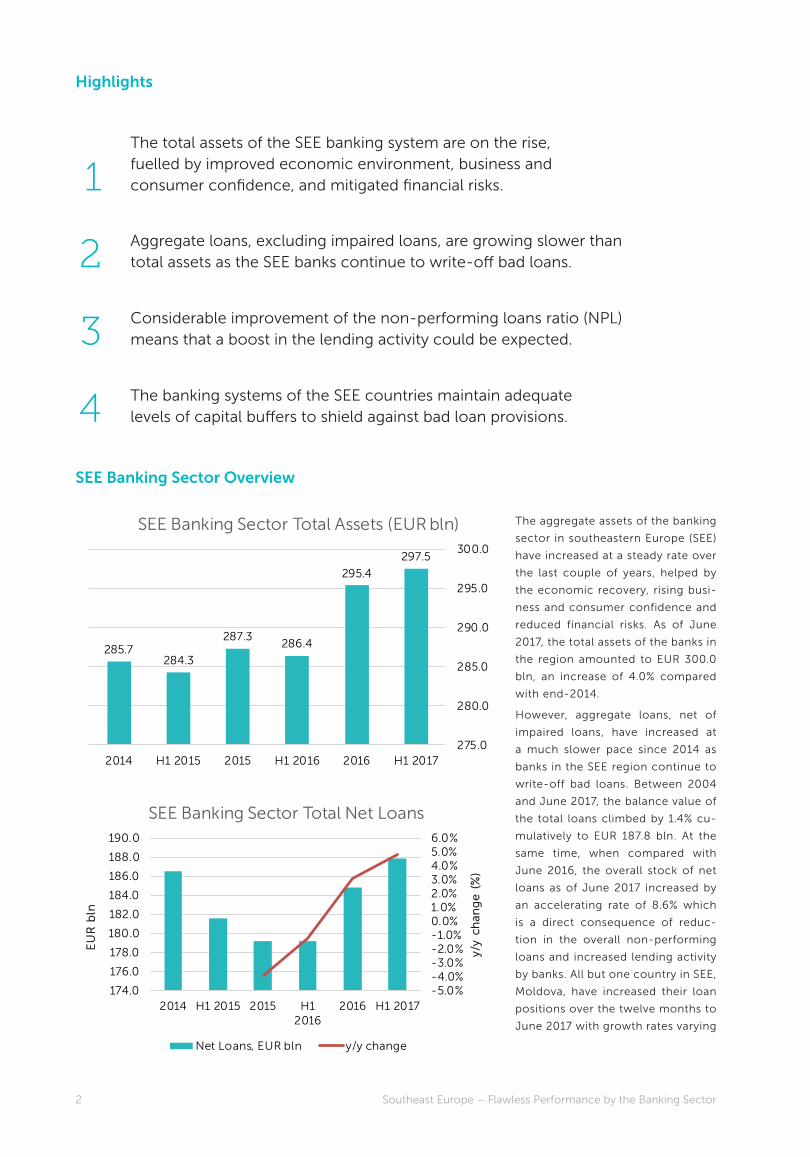
The aggregate assets of the banking
sector in southeastern Europe (SEE)
have increased at a steady rate over
the last couple of years, helped by
the economic recovery, rising busi-
ness and consumer confidence and
reduced financial risks. As of June
2017, the total assets of the banks in
the region amounted to EUR 300.0
bln, an increase of 4.0% compared
with end-2014.
However, aggregate loans, net of
impaired loans, have increased at
a much slower pace since 2014 as
banks in the SEE region continue to
write-off bad loans. Between 2004
and June 2017, the balance value of
the total loans climbed by 1.4% cu-
mulatively to EUR 187.8 bln. At the
same time, when compared with
June 2016, the overall stock of net
loans as of June 2017 increased by
an accelerating rate of 8.6% which
is a direct consequence of reduc-
tion in the overall non-performing
loans and increased lending activity
by banks. All but one country in SEE,
Moldova, have increased their loan
positions over the twelve months to
June 2017 with growth rates varying
Highlights
SEE Banking Sector Overview
The total assets of the SEE banking system are on the rise, fuelled by improved economic environment, business and consumer confidence, and mitigated financial risks.
Aggregate loans, excluding impaired loans, are growing slower than total assets as the SEE banks continue to write-off bad loans.
Considerable improvement of the non-performing loans ratio (NPL) means that a boost in the lending activity could be expected.
The banking systems of the SEE countries maintain adequate levels of capital buffers to shield against bad loan provisions.
1
2
3
4
297.5
295.4
286.4287.3
284.3285.7
275.0
280.0
285.0
290.0
295.0
300.0
H1 20172016H1 20162015H1 20152014
SEE Banking Sector Total Assets (EUR bln)
-5.0%-4.0%-3.0%-2.0%-1.0%0.0%1.0%2.0%3.0%4.0%5.0%6.0%
174.0
176.0
178.0
180.0
182.0
184.0
186.0
188.0
190.0
2014 H1 2015 2015 H12016
2016 H1 2017
y/y
chan
ge
(%
)
EU
R b
ln
SEE Banking Sector Total Net Loans
Net Loans, EUR bln y/y change
3SeeNews – Business Intelligence for Southeast Europe
AlbaniaBosnia and
Herzegovina
Bulgaria
Croatia
Macedonia
Moldova
Montenegro
RomaniaSerbiaSlovenia
0%
5%
10%
15%
20%
25%
30%
35%
0% 5% 10% 15% 20%
To
tal
Cap
ital
Ad
eq
uac
y, %
NPLs share (%) in total gross loans
NPLs to Capital Adequacy in SEE as of June 2017
20%20%20%19%18%18%
H1 20172016H1 20162015H1 20152014
Average Capital Adequacy in SEE
11.212.2
13.614.5
15.615.6
H1 20172016H1 20162015H1 20152014
Share (%) of NPLs in SEE Banking Sector Total Gross Loans
between 0.1% for Croatia and 10.0%
for Montenegro.
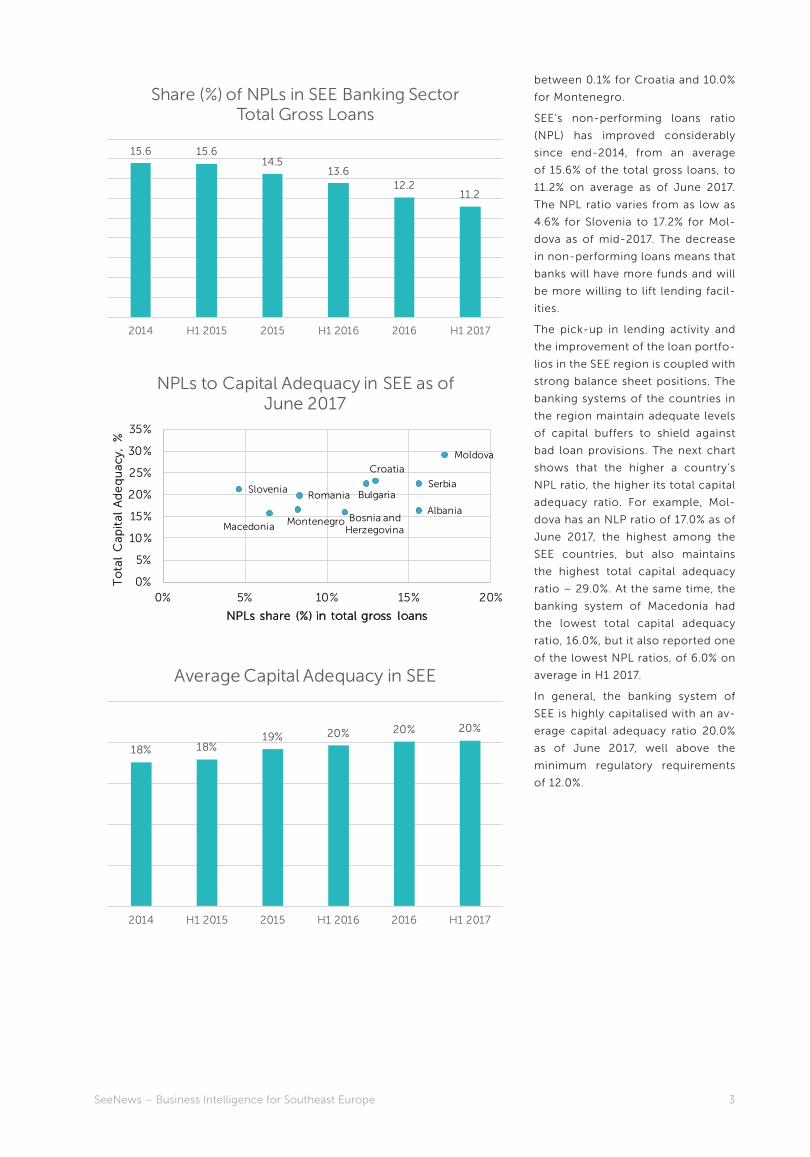
SEE’s non-performing loans ratio
(NPL) has improved considerably
since end-2014, from an average
of 15.6% of the total gross loans, to
11.2% on average as of June 2017.
The NPL ratio varies from as low as
4.6% for Slovenia to 17.2% for Mol-
dova as of mid-2017. The decrease
in non-performing loans means that
banks will have more funds and will
be more willing to lift lending facil-
ities.
The pick-up in lending activity and
the improvement of the loan portfo-
lios in the SEE region is coupled with
strong balance sheet positions. The
banking systems of the countries in
the region maintain adequate levels
of capital buffers to shield against
bad loan provisions. The next chart
shows that the higher a country’s
NPL ratio, the higher its total capital
adequacy ratio. For example, Mol-
dova has an NLP ratio of 17.0% as of
June 2017, the highest among the
SEE countries, but also maintains
the highest total capital adequacy
ratio – 29.0%. At the same time, the
banking system of Macedonia had
the lowest total capital adequacy
ratio, 16.0%, but it also reported one
of the lowest NPL ratios, of 6.0% on
average in H1 2017.
In general, the banking system of
SEE is highly capitalised with an av-
erage capital adequacy ratio 20.0%
as of June 2017, well above the
minimum regulatory requirements
of 12.0%.
Southeast Europe – Flawless Performance by the Banking Sector4
Albania Banking System Key Indicators
Indicator Unit H1 2017 2016 H1 2016 2015 2014
Assets ALL bln 1,393.80 1,407.30 1,329.50 1,317.80 1,293.70
Deposits ALL bln 1,152.00 1,173.60 1,112.40 1,112.20 1,084.10
Loans ALL bln 655.9 658.9 646.5 628.2 628.4
Total Equity ALL bln 137.8 136.9 127.3 125.5 111
Net Interest Income ALL bln 4.5 10.8 5.8 14.4 22.5
Net Profit ALL bln 11.5 9.3 5.1 15.7 11.2
ROA* percent 1.10% 0.70% 0.90% 1.20% 0.90%
ROE* percent 11.40% 6.80% 9.80% 12.50% 10.10%
Total Capital Adequacy percent 16.30% 15.70% 16.10% 16.00% 16.80%
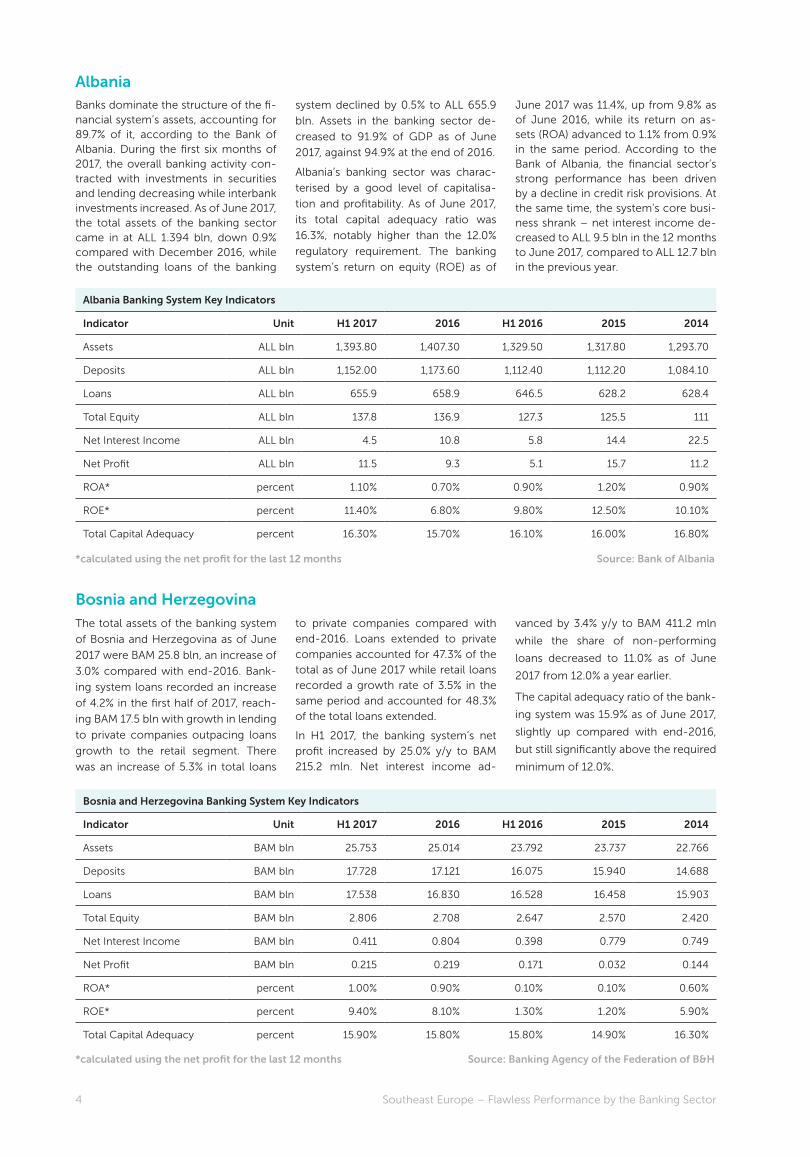
AlbaniaBanks dominate the structure of the fi-nancial system’s assets, accounting for 89.7% of it, according to the Bank of Albania. During the first six months of 2017, the overall banking activity con-tracted with investments in securities and lending decreasing while interbank investments increased. As of June 2017, the total assets of the banking sector came in at ALL 1.394 bln, down 0.9% compared with December 2016, while the outstanding loans of the banking
system declined by 0.5% to ALL 655.9
bln. Assets in the banking sector de-
creased to 91.9% of GDP as of June
2017, against 94.9% at the end of 2016.
Albania’s banking sector was charac-
terised by a good level of capitalisa-
tion and profitability. As of June 2017,
its total capital adequacy ratio was
16.3%, notably higher than the 12.0%
regulatory requirement. The banking
system’s return on equity (ROE) as of
June 2017 was 11.4%, up from 9.8% as of June 2016, while its return on as-sets (ROA) advanced to 1.1% from 0.9% in the same period. According to the Bank of Albania, the financial sector’s strong performance has been driven by a decline in credit risk provisions. At the same time, the system’s core busi-ness shrank – net interest income de-creased to ALL 9.5 bln in the 12 months to June 2017, compared to ALL 12.7 bln in the previous year.
*calculated using the net profit for the last 12 months
*calculated using the net profit for the last 12 months
Bosnia and Herzegovina
The total assets of the banking system
of Bosnia and Herzegovina as of June
2017 were BAM 25.8 bln, an increase of
3.0% compared with end-2016. Bank-
ing system loans recorded an increase
of 4.2% in the first half of 2017, reach-
ing BAM 17.5 bln with growth in lending
to private companies outpacing loans
growth to the retail segment. There
was an increase of 5.3% in total loans
to private companies compared with
end-2016. Loans extended to private
companies accounted for 47.3% of the
total as of June 2017 while retail loans
recorded a growth rate of 3.5% in the
same period and accounted for 48.3%
of the total loans extended.
In H1 2017, the banking system’s net
profit increased by 25.0% y/y to BAM
215.2 mln. Net interest income ad-
vanced by 3.4% y/y to BAM 411.2 mln
while the share of non-performing
loans decreased to 11.0% as of June
2017 from 12.0% a year earlier.
The capital adequacy ratio of the bank-
ing system was 15.9% as of June 2017,
slightly up compared with end-2016,
but still significantly above the required
minimum of 12.0%.
Bosnia and Herzegovina Banking System Key Indicators
Indicator Unit H1 2017 2016 H1 2016 2015 2014
Assets BAM bln 25.753 25.014 23.792 23.737 22.766
Deposits BAM bln 17.728 17.121 16.075 15.940 14.688
Loans BAM bln 17.538 16.830 16.528 16.458 15.903
Total Equity BAM bln 2.806 2.708 2.647 2.570 2.420
Net Interest Income BAM bln 0.411 0.804 0.398 0.779 0.749
Net Profit BAM bln 0.215 0.219 0.171 0.032 0.144
ROA* percent 1.00% 0.90% 0.10% 0.10% 0.60%
ROE* percent 9.40% 8.10% 1.30% 1.20% 5.90%
Total Capital Adequacy percent 15.90% 15.80% 15.80% 14.90% 16.30%
Source: Bank of Albania
Source: Banking Agency of the Federation of B&H
5SeeNews – Business Intelligence for Southeast Europe
Bulgaria Banking System Key Indicators
Indicator Unit H1 2017 2016 H1 2016 2015 2014
Assets BGN bln 93.016 92.095 88.650 87.524 85.135
Deposits BGN bln 79.739 79.076 75.711 75.209 73.529
Loans BGN bln 57.512 56.098 55.318 54.258 62.885
Total Equity BGN bln 11.977 12.134 7.076 11.523 10.839
Net Interest Income BGN bln 1.339 2.805 1.412 2.771 2.632
Net Profit BGN bln 0.660 1.262 0.774 0.898 0.746
ROA* percent 1.2% 1.4% 1.3% 1.0% 0.9%
ROE* percent 9.6% 10.4% 16.5% 7.8% 6.9%
Total Capital Adequacy percent 22.5% 22.2% 22.7% 22.2% 20.0%
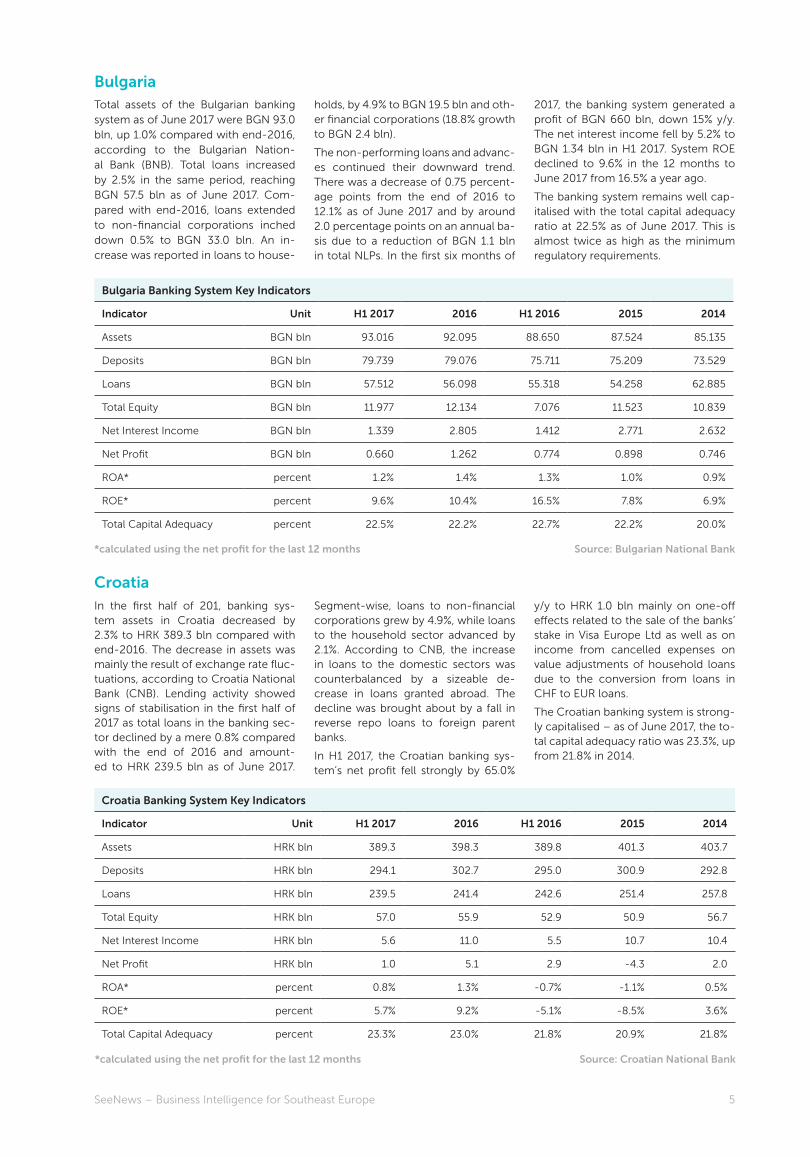
BulgariaTotal assets of the Bulgarian banking system as of June 2017 were BGN 93.0 bln, up 1.0% compared with end-2016, according to the Bulgarian Nation-al Bank (BNB). Total loans increased by 2.5% in the same period, reaching BGN 57.5 bln as of June 2017. Com-pared with end-2016, loans extended to non-financial corporations inched down 0.5% to BGN 33.0 bln. An in-crease was reported in loans to house-
holds, by 4.9% to BGN 19.5 bln and oth-er financial corporations (18.8% growth to BGN 2.4 bln).
The non-performing loans and advanc-es continued their downward trend. There was a decrease of 0.75 percent-age points from the end of 2016 to 12.1% as of June 2017 and by around 2.0 percentage points on an annual ba-sis due to a reduction of BGN 1.1 bln in total NLPs. In the first six months of
2017, the banking system generated a profit of BGN 660 bln, down 15% y/y. The net interest income fell by 5.2% to BGN 1.34 bln in H1 2017. System ROE declined to 9.6% in the 12 months to June 2017 from 16.5% a year ago.
The banking system remains well cap-italised with the total capital adequacy ratio at 22.5% as of June 2017. This is almost twice as high as the minimum regulatory requirements.
*calculated using the net profit for the last 12 months Source: Bulgarian National Bank
Croatia Banking System Key Indicators
Indicator Unit H1 2017 2016 H1 2016 2015 2014
Assets HRK bln 389.3 398.3 389.8 401.3 403.7
Deposits HRK bln 294.1 302.7 295.0 300.9 292.8
Loans HRK bln 239.5 241.4 242.6 251.4 257.8
Total Equity HRK bln 57.0 55.9 52.9 50.9 56.7
Net Interest Income HRK bln 5.6 11.0 5.5 10.7 10.4
Net Profit HRK bln 1.0 5.1 2.9 -4.3 2.0
ROA* percent 0.8% 1.3% -0.7% -1.1% 0.5%
ROE* percent 5.7% 9.2% -5.1% -8.5% 3.6%
Total Capital Adequacy percent 23.3% 23.0% 21.8% 20.9% 21.8%
CroatiaIn the first half of 201, banking sys-tem assets in Croatia decreased by 2.3% to HRK 389.3 bln compared with end-2016. The decrease in assets was mainly the result of exchange rate fluc-tuations, according to Croatia National Bank (CNB). Lending activity showed signs of stabilisation in the first half of 2017 as total loans in the banking sec-tor declined by a mere 0.8% compared with the end of 2016 and amount-ed to HRK 239.5 bln as of June 2017.
Segment-wise, loans to non-financial corporations grew by 4.9%, while loans to the household sector advanced by 2.1%. According to CNB, the increase in loans to the domestic sectors was counterbalanced by a sizeable de-crease in loans granted abroad. The decline was brought about by a fall in reverse repo loans to foreign parent banks.
In H1 2017, the Croatian banking sys-tem’s net profit fell strongly by 65.0%
y/y to HRK 1.0 bln mainly on one-off effects related to the sale of the banks’ stake in Visa Europe Ltd as well as on income from cancelled expenses on value adjustments of household loans due to the conversion from loans in CHF to EUR loans.
The Croatian banking system is strong-ly capitalised – as of June 2017, the to-tal capital adequacy ratio was 23.3%, up from 21.8% in 2014.
*calculated using the net profit for the last 12 months Source: Croatian National Bank
Southeast Europe – Flawless Performance by the Banking Sector6
Macedonia Banking System Key Indicators
Indicator Unit H1 2017 2016 H1 2016 2015 2014
Assets MKD bln 440.0 444.7 416.5 423.7 400.3
Deposits MKD bln 318.3 322.8 295.8 306.2 287.0
Loans MKD bln 284.6 281.0 272.9 277.5 253.0
Total Equity MKD bln 49.8 47.2 47.8 45.9 43.3
Net Interest Income MKD bln 7.7 15.4 7.6 14.4 13.1
Net Profit MKD bln 3.1 6.3 2.9 4.6 3.1
ROA* percent 1.5% 1.4% 1.3% 1.1% 0.8%
ROE* percent 13.2% 13.4% 11.4% 10.1% 7.3%
Total Capital Adequacy percent 15.8% 15.2% 15.6% 15.5% 15.7%
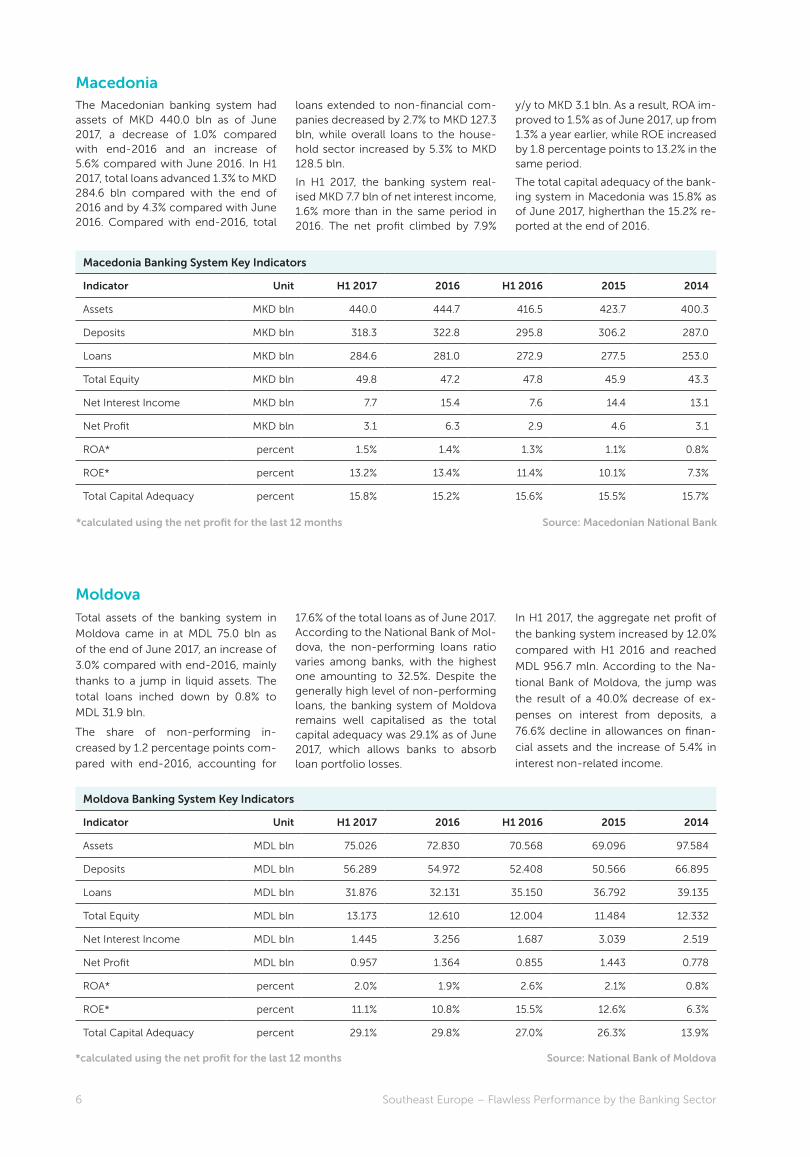
MacedoniaThe Macedonian banking system had assets of MKD 440.0 bln as of June 2017, a decrease of 1.0% compared with end-2016 and an increase of 5.6% compared with June 2016. In H1 2017, total loans advanced 1.3% to MKD 284.6 bln compared with the end of 2016 and by 4.3% compared with June 2016. Compared with end-2016, total
loans extended to non-financial com-panies decreased by 2.7% to MKD 127.3 bln, while overall loans to the house-hold sector increased by 5.3% to MKD 128.5 bln.
In H1 2017, the banking system real-ised MKD 7.7 bln of net interest income, 1.6% more than in the same period in 2016. The net profit climbed by 7.9%
y/y to MKD 3.1 bln. As a result, ROA im-proved to 1.5% as of June 2017, up from 1.3% a year earlier, while ROE increased by 1.8 percentage points to 13.2% in the same period.
The total capital adequacy of the bank-ing system in Macedonia was 15.8% as of June 2017, higherthan the 15.2% re-ported at the end of 2016.
*calculated using the net profit for the last 12 months Source: Macedonian National Bank
Moldova Banking System Key Indicators
Indicator Unit H1 2017 2016 H1 2016 2015 2014
Assets MDL bln 75.026 72.830 70.568 69.096 97.584
Deposits MDL bln 56.289 54.972 52.408 50.566 66.895
Loans MDL bln 31.876 32.131 35.150 36.792 39.135
Total Equity MDL bln 13.173 12.610 12.004 11.484 12.332
Net Interest Income MDL bln 1.445 3.256 1.687 3.039 2.519
Net Profit MDL bln 0.957 1.364 0.855 1.443 0.778
ROA* percent 2.0% 1.9% 2.6% 2.1% 0.8%
ROE* percent 11.1% 10.8% 15.5% 12.6% 6.3%
Total Capital Adequacy percent 29.1% 29.8% 27.0% 26.3% 13.9%
MoldovaTotal assets of the banking system in
Moldova came in at MDL 75.0 bln as
of the end of June 2017, an increase of
3.0% compared with end-2016, mainly
thanks to a jump in liquid assets. The
total loans inched down by 0.8% to
MDL 31.9 bln.
The share of non-performing in-
creased by 1.2 percentage points com-
pared with end-2016, accounting for
17.6% of the total loans as of June 2017. According to the National Bank of Mol-dova, the non-performing loans ratio varies among banks, with the highest one amounting to 32.5%. Despite the generally high level of non-performing loans, the banking system of Moldova remains well capitalised as the total capital adequacy was 29.1% as of June 2017, which allows banks to absorb loan portfolio losses.
In H1 2017, the aggregate net profit of
the banking system increased by 12.0%
compared with H1 2016 and reached
MDL 956.7 mln. According to the Na-
tional Bank of Moldova, the jump was
the result of a 40.0% decrease of ex-
penses on interest from deposits, a
76.6% decline in allowances on finan-
cial assets and the increase of 5.4% in
interest non-related income.
*calculated using the net profit for the last 12 months Source: National Bank of Moldova
7SeeNews – Business Intelligence for Southeast Europe
Montenegro Banking System Key Indicators
Indicator Unit H1 2017 2016 H1 2016 2015 2014
Assets EUR bln 3.890 3.790 3.512 3.472 3.136
Deposits EUR bln 2.912 2.872 2.626 2.625 2.308
Loans EUR bln 2.461 2.274 2.233 2.238 2.195
Total Equity EUR bln 0.502 0.487 0.489 0.462 0.444
Net Interest Income EUR bln 0.063 0.122 0.61 0.117 0.111
Net Profit EUR bln 0.016 0.007 0.014 -0.003 0.024
ROA* percent 0.2% 0.2% 0.1% -0.1% 0.8%
ROE* percent 1.8% 1.5% 0.6% -0.7% 5.4%
Total Capital Adequacy percent 16.6% 16.1% 16.7% 15.5% 16.2%
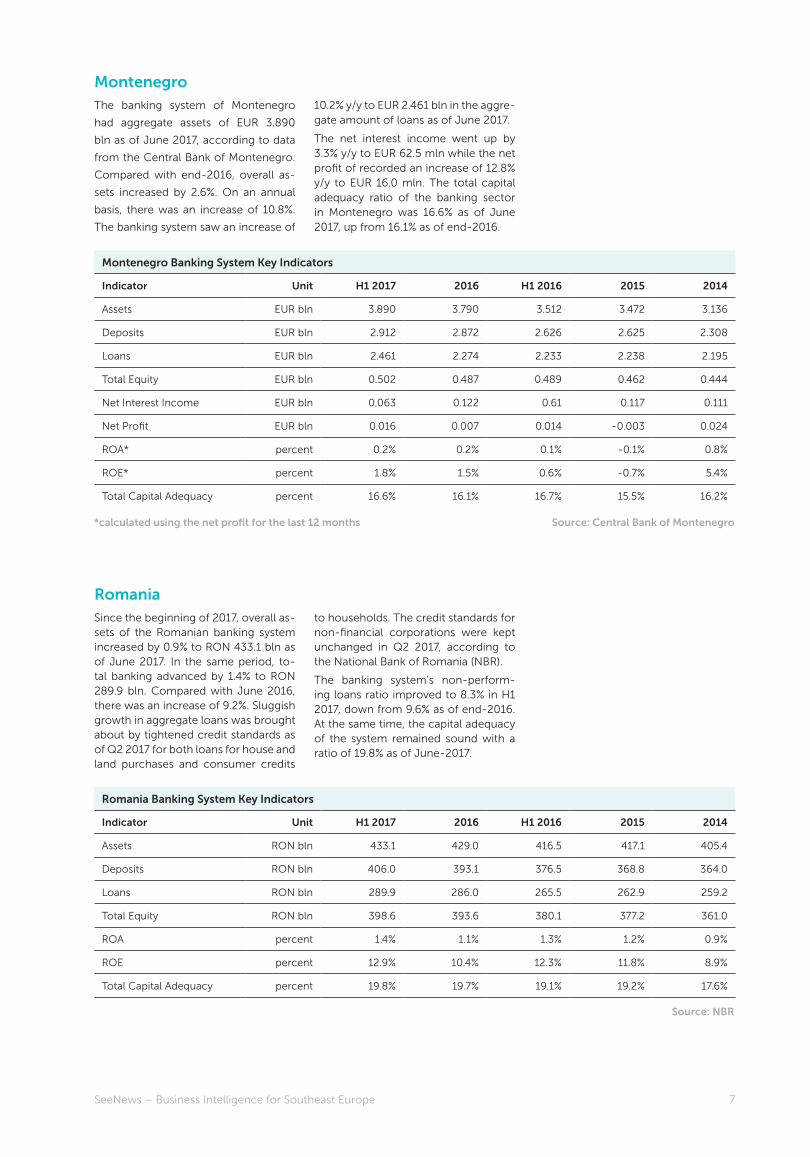
MontenegroThe banking system of Montenegro
had aggregate assets of EUR 3.890
bln as of June 2017, according to data
from the Central Bank of Montenegro.
Compared with end-2016, overall as-
sets increased by 2.6%. On an annual
basis, there was an increase of 10.8%.
The banking system saw an increase of
10.2% y/y to EUR 2.461 bln in the aggre-gate amount of loans as of June 2017.
The net interest income went up by 3.3% y/y to EUR 62.5 mln while the net profit of recorded an increase of 12.8% y/y to EUR 16.0 mln. The total capital adequacy ratio of the banking sector in Montenegro was 16.6% as of June 2017, up from 16.1% as of end-2016.
*calculated using the net profit for the last 12 months Source: Central Bank of Montenegro
RomaniaSince the beginning of 2017, overall as-sets of the Romanian banking system increased by 0.9% to RON 433.1 bln as of June 2017. In the same period, to-tal banking advanced by 1.4% to RON 289.9 bln. Compared with June 2016, there was an increase of 9.2%. Sluggish growth in aggregate loans was brought about by tightened credit standards as of Q2 2017 for both loans for house and land purchases and consumer credits
to households. The credit standards for non-financial corporations were kept unchanged in Q2 2017, according to the National Bank of Romania (NBR).
The banking system’s non-perform-ing loans ratio improved to 8.3% in H1 2017, down from 9.6% as of end-2016. At the same time, the capital adequacy of the system remained sound with a ratio of 19.8% as of June-2017.
Romania Banking System Key Indicators
Indicator Unit H1 2017 2016 H1 2016 2015 2014
Assets RON bln 433.1 429.0 416.5 417.1 405.4
Deposits RON bln 406.0 393.1 376.5 368.8 364.0
Loans RON bln 289.9 286.0 265.5 262.9 259.2
Total Equity RON bln 398.6 393.6 380.1 377.2 361.0
ROA percent 1.4% 1.1% 1.3% 1.2% 0.9%
ROE percent 12.9% 10.4% 12.3% 11.8% 8.9%
Total Capital Adequacy percent 19.8% 19.7% 19.1% 19.2% 17.6%
Source: NBR
Southeast Europe – Flawless Performance by the Banking Sector8
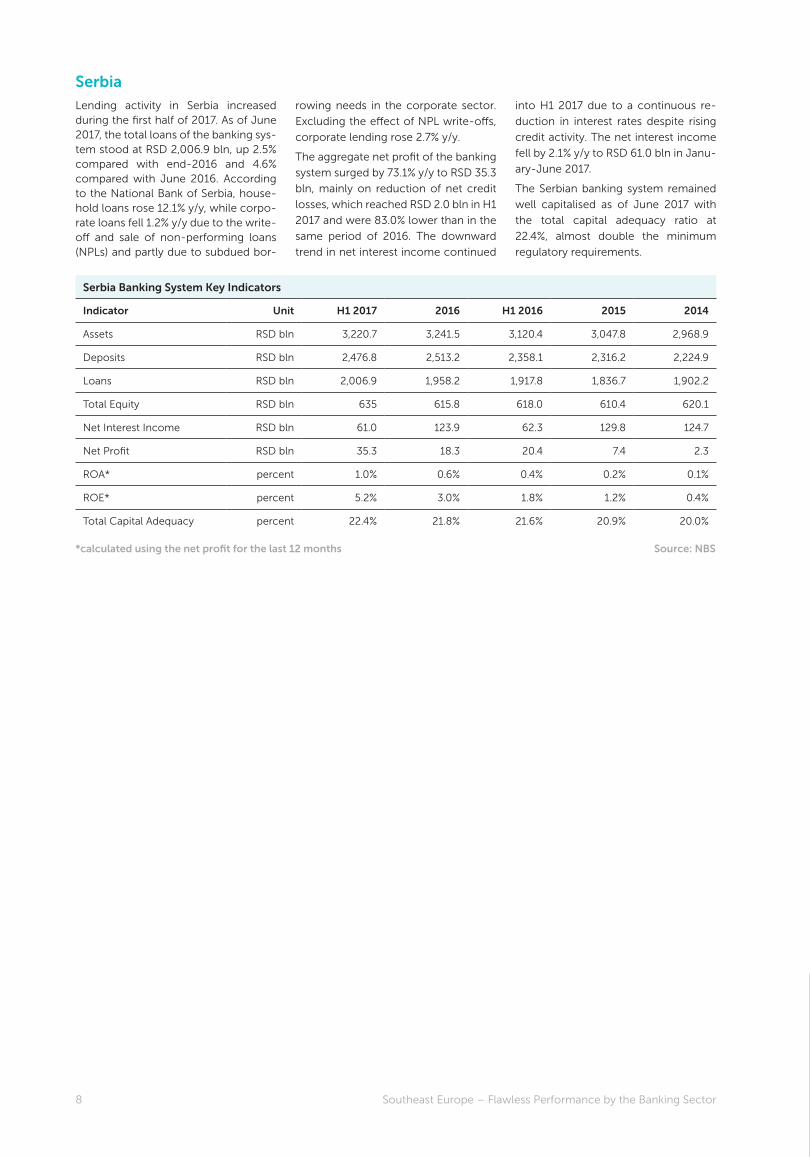
Serbia Banking System Key Indicators
Indicator Unit H1 2017 2016 H1 2016 2015 2014
Assets RSD bln 3,220.7 3,241.5 3,120.4 3,047.8 2,968.9
Deposits RSD bln 2,476.8 2,513.2 2,358.1 2,316.2 2,224.9
Loans RSD bln 2,006.9 1,958.2 1,917.8 1,836.7 1,902.2
Total Equity RSD bln 635 615.8 618.0 610.4 620.1
Net Interest Income RSD bln 61.0 123.9 62.3 129.8 124.7
Net Profit RSD bln 35.3 18.3 20.4 7.4 2.3
ROA* percent 1.0% 0.6% 0.4% 0.2% 0.1%
ROE* percent 5.2% 3.0% 1.8% 1.2% 0.4%
Total Capital Adequacy percent 22.4% 21.8% 21.6% 20.9% 20.0%
SerbiaLending activity in Serbia increased during the first half of 2017. As of June 2017, the total loans of the banking sys-tem stood at RSD 2,006.9 bln, up 2.5% compared with end-2016 and 4.6% compared with June 2016. According to the National Bank of Serbia, house-hold loans rose 12.1% y/y, while corpo-rate loans fell 1.2% y/y due to the write-off and sale of non-performing loans (NPLs) and partly due to subdued bor-
rowing needs in the corporate sector.
Excluding the effect of NPL write-offs,
corporate lending rose 2.7% y/y.
The aggregate net profit of the banking
system surged by 73.1% y/y to RSD 35.3
bln, mainly on reduction of net credit
losses, which reached RSD 2.0 bln in H1
2017 and were 83.0% lower than in the
same period of 2016. The downward
trend in net interest income continued
into H1 2017 due to a continuous re-
duction in interest rates despite rising
credit activity. The net interest income
fell by 2.1% y/y to RSD 61.0 bln in Janu-
ary-June 2017.
The Serbian banking system remained
well capitalised as of June 2017 with
the total capital adequacy ratio at
22.4%, almost double the minimum
regulatory requirements.
*calculated using the net profit for the last 12 months Source: NBS
Share valuable expertise and get premium exposure across Southeast Europe by joining the 11th edition of TOP 100 SEE
At the beginning of October 2018, SeeNews will release its SeeNews TOP 100 SEE ranking of the biggest companies in the region of Southeast Europe (SEE) for the 11th consecutive year. SeeNews TOP 100 SEE features three big rankings each year – SeeNews TOP 100 SEE Companies, SeeNews TOP 100 SEE Banks, and SeeNews TOP 100 SEE Insurers – along with additional rankings, profiles, interviews and features on major current events and trends in SEE.
Call for partners
Request your personalised partnership offer

www.seenews.com
In need of expert on-demand research
services?
Look no further. Our expert researchers with 40+ languages are ready to take up
any of your market research requirements, help you identify your research needs, and
deliver quality insights for informed and agile business decision-making.
Request your personalised quote at [email protected]