
Southeast Alaska Energy Update and Profile
114
Southeast Alaska Energy Update and Profile Prepared for: Alaska Energy Authority June 2016
Transcript of Southeast Alaska Energy Update and Profile

Southeast Alaska Energy Update and Profile
Prepared for:
Alaska Energy Authority
June 2016

Southeast Alaska Energy Update and Profile
Prepared for:
Alaska Energy Authority
Prepared by:
Juneau Anchorage
June 2016
McDowell Group Anchorage Office 1400 W. Benson Blvd., Suite 510 Anchorage, Alaska 99503
McDowell Group Juneau Office 9360 Glacier Highway, Suite 201 Juneau, Alaska 99801
Website: www.mcdowellgroup.net
Table of Contents
Introduction ............................................................................................................................ 1 Planning Area ......................................................................................................................... 1
Electricity ................................................................................................................................ 2 Alaska Electric Light & Power (AEL&P) ................................................................................................ 3 Southeast Alaska Power Agency (SEAPA) ............................................................................................. 3 Ketchikan Public Utilities (KPU) ........................................................................................................... 3 Petersburg Municipal Power & Light (PMP&L) .................................................................................... 4 Wrangell Municipal Light & Power (WML&P) ..................................................................................... 4 Alaska Power and Telephone (AP&T) .................................................................................................. 4 Inside Passage Electric Cooperative (IPEC) ........................................................................................... 5 Metlakatla Power & Light (MPL) ......................................................................................................... 5 City and Borough of Sitka ................................................................................................................... 5 Other Southeast Utilities ..................................................................................................................... 5
Electrical Rates and Power Cost Equalization ........................................................................... 6 Hydropower ........................................................................................................................... 7
Projects Under Development .............................................................................................................. 8 Diesel Power .......................................................................................................................... 9
Efficiency ............................................................................................................................................ 9 Fuel Prices ........................................................................................................................................ 10 Bulk Fuel Storage Issues .................................................................................................................... 11 Heat Recovery from Diesel Plants ...................................................................................................... 11
Other Renewable Energy Developments ............................................................................... 12 Current and Projected Demand ............................................................................................ 12
Population Trends and Projections .................................................................................................... 12 Trends in Average Customer Use ...................................................................................................... 13 Trends in Industrial Sales .................................................................................................................. 14 Load Forecasting .............................................................................................................................. 15
Energy Efficiency/Demand Side Management ..................................................................... 18 Residential ........................................................................................................................................ 18 Commercial and Public Buildings ...................................................................................................... 19 Community Wide Efforts ................................................................................................................... 19 Other DSM/EE Efforts ....................................................................................................................... 20
Space Heating ....................................................................................................................... 21 Fuel Oil ............................................................................................................................................. 21 Biomass ............................................................................................................................................ 23 Electric Heat ..................................................................................................................................... 26 Natural Gas ...................................................................................................................................... 28
Community Energy Profiles .................................................................................................. 29 Additional Resources ......................................................................................................................... 29

List of Tables
Table 1. Operating Hydro Projects in Southeast Alaska, 2016, Ranked by Capacity ......................................... 7 Table 2. Hydroelectric Projects under Development in Southeast Alaska ......................................................... 9 Table 3. Alaska Energy Authority Rural Power System Upgrades in Southeast Alaska ..................................... 10 Table 4. Alaska Energy Authority Bulk Fuel Upgrades in Southeast Alaska ..................................................... 11 Table 5. Heat Recovery from Diesel Generators in Southeast Alaska, 2015 .................................................... 11 Table 6. Population Estimates and Projections for Southeast Alaska, 2010-2045 ........................................... 12 Table 7. Average Monthly Residential Customer Electricity Sales in kWh, By Utility Grid, 2010-2014 ............ 13 Table 8. Average Monthly Commercial Customer Electricity Sales in kWh, by Utility Grid, 2010-2014 .......... 14 Table 9. Total Industrial Electricity Sales in GWh, by Utility, 2010-2014 ........................................................ 14 Table 10. Estimated Fuel Oil Consumption and Cost for Space Heating in Southeast Alaska, 2012 ............... 22 Table 11. Non-Residential Biomass Heating Projects in Southeast Alaska ...................................................... 24 Table 12. Prices, Suppliers, and Location of Use for Various Biomass Fuels, Southeast Alaska, 2016 .............. 24
List of Figures
Figure 1. Southeast Alaska Electric Sales, by Utility Grid, 2015 ........................................................................ 2 Figure 2. Percentage of Total Electrical Generation, by Energy Source, by Utility Grid, 2015 ........................... 2 Figure 3. Residential Electrical Rates and PCE subsidy rates in Southeast Alaska, by Utility Grid, FY2015 .......... 6 Figure 4. Total Hydropower Production in Southeast Alaska from Selected Plants, 2001-2014 ........................ 8 Figure 5. Diesel Efficiency in Southeast Alaska’s PCE-Eligible Communities, FY2015 ........................................ 9 Figure 6. Average Diesel Prices Paid by Southeast Alaska’s PCE-Eligible Utilities, FY2015 ............................... 10 Figure 7. SE IRP Load Forecasts and Actual Production Data, by Southeast Alaska Utility, 2011-2035 ............ 15 Figure 8. Percent of Total Southeast Alaska Residential Space Heating Energy, by Fuel Type, 2014 ............... 21 Figure 9. Retail Heating Fuel Prices in Selected Southeast Alaska Communities, 2005-2016 .......................... 23 Figure 10. Electricity Sales through Wrangell’s Special Heat Rate, Megawatt Hours, 2007-2015 ................... 26

Southeast Alaska Energy Update and Profile McDowell Group, Inc. Page 1
Introduction
This report is part of an ongoing effort led by the Alaska Energy Authority (AEA) to identify energy projects that
will reduce the long-term cost of energy in Alaska.
The work presented here can be considered a companion to the Southeast Alaska Integrated Resource Plan (SE
IRP), which was completed in 2012 by a team led by the engineering firm Black and Veatch.0F
1 The SE IRP
employed modeling and other efforts to assess the potential of various ways to lower the cost of energy in
Southeast Alaska, including transmission, generation, energy efficiency, space heating, and demand side
management projects. This document does not replicate or update these cost-benefit studies.
This report serves as a resource for ongoing energy planning in Southeast Alaska. It provides an overview of
the current energy situation through a set of community energy profiles, as well as a discussion of recent
developments and efforts in the region. Feedback was solicited from community and utility leaders, though
additional input is needed. This is a living document that can serve as a template for the region to revise and
keep current as projects, programs, and events change.
Planning Area
The planning area for this project encompasses over 20 communities stretched along the coast of southeast
Alaska from Yakutat to Metlakatla. The area represents AEA’s Southeast energy region.
A number of small and large energy users are not covered in this document. Industrial developments located
outside community electric grids, such as the Kensington Mine and the cannery in Excursion Inlet, are not
included in this report as relevant energy data is not readily available. In addition, a variety of small communities
in the region are excluded due to a limited population and the lack of a central electric utility. The community
of Hyder, Alaska is not covered as it is served by low cost Canadian hydropower from nearby Stewart, British
Columbia.
1 Available at http://www.akenergyauthority.org/Policy/RegionalPlanning

Southeast Alaska Energy Update and Profile McDowell Group, Inc. Page 2
Electricity
A mix of private and publically-owned utilities
provide electric service to over 41,000 residential,
commercial, and industrial customers in Southeast
Alaska. Most of these utilities serve a single
community, though interconnected grids exist on
Prince of Wales Island, connecting Skagway and
the Haines area, and connecting Petersburg,
Wrangell, Ketchikan, and Saxman. Juneau’s Alaska
Electric Light and Power (AEL&P) accounts for
nearly half (48.2 percent) of all electric sales in the
region, followed by utilities in Ketchikan (20.3
percent), Sitka (12.8 percent), and other
communities.
Southeast Alaska is blessed with abundant rainfall
and mountainous terrain; as a result, over ninety-
five percent of the electricity produced in the
region is derived from hydropower.
While the more populated communities in the
region are supplied by hydropower, many of the
villages and remote areas still rely on diesel for
electrical generation. In addition, newly
constructed hydro projects typically carry substantial debt, adding considerable cost to electric rates.
The region’s utilities are described in more detail below.
Figure 2. Percentage of Total Electrical Generation, by Energy Source, by Utility Grid, 2015
Source. EIA; Alaska Energy Authority, FY15 PCE Report; and Utilities. Note: Blank areas represent data gaps on generation source, though both Sitka and Petersburg are served primarily by hydropower.
AEL&P -Juneau48.2%
APT -Gustavus
0.2%
APT - POW3.3%
APT- Lynn Canal3.0%
City & Borough of
Sitka12.8%
Wrangell4.3%
IPEC1.2%
Ketchikan Public
Utilities20.3%
Petersburg Borough
5.9%Yakutat0.7%
0.0%20.0%40.0%60.0%80.0%
100.0%
Hydro Purchased Hydro Diesel
Figure 1. Southeast Alaska Electric Sales, by Utility Grid, 2015
Source: EIA and Alaska Energy Authority, FY15 PCE Report. Note: Electric sales in Elfin Cove, Tenakee Springs, and Pelican are not visible as they total less than 0.0%.

Southeast Alaska Energy Update and Profile McDowell Group, Inc. Page 3
Alaska Electric Light & Power (AEL&P)
AEL&P is an investor-owned electric utility serving the city of Juneau, Douglas, and Auke Bay. In addition to
serving retail customers, AEL&P has interruptible Power Sales Agreements with Princess Cruise Lines and the
Greens Creek Mine. Both of these customers own and maintain their own diesel generation for periods when
AEL&P cannot serve them with hydroelectric power.
AEL&P owns and operates hydroelectric resources at Gold Creek, Salmon Creek, Annex Creek, and Lake
Dorothy. The Snettisham hydroelectric project – which accounts for roughly three-quarters of Juneau area
hydro capacity – was built by the federal government but sold to the Alaska Industrial Development and Export
Authority (AIDEA) in 1998. AEL&P buys power from Snettisham through a lease agreement under which the
company is also responsible for maintenance of the project.
AEL&P maintains a number of fossil fuel-fired generators that are used as backup when Snettisham is offline.
These include five slow speed diesel engines at the Gold Creek plant, nine Electro Motive Division diesel engines
and two gas turbines at the Lemon Creek plant, and a Solar Centaur Gas Turbine that runs on either diesel or
natural gas in Auke Bay.
Southeast Alaska Power Agency (SEAPA)
The Southeast Alaska Power Agency (SEAPA) is a regional Joint Action Agency of the State of Alaska that owns
the Swan Lake and Tyee Lake hydroelectric facilities. SEAPA provides power via 14 miles of submarine and 175
miles of overhead transmission lines to the municipalities of Ketchikan, Wrangell, and Petersburg.
Approximately 62 percent of the total power consumed by these three communities is supplied by SEAPA.
Ketchikan Public Utilities (KPU)
KPU is owned by the City of Ketchikan and provides power to customers throughout the Ketchikan Gateway
Borough, including to the nearby community of Saxman.
KPU owns and operates the Ketchikan Lakes, Whitman Lake, and Beaver Falls hydro projects. KPU also operates
SEAPA’s Swan Lake Hydro Project. Ketchikan receives surplus energy (when available and as needed) via
SEAPA's Swan Tyee transmission line, which connects the community to Wrangell and Petersburg's electrical
grids.
Ketchikan's total hydro capacity is approximately 34 MW, including both KPU and SEAPA-owned projects. KPU
maintains four peaking/stand-by diesel generators at Bailey Powerhouse totaling 24 MW, and two other diesel
generators at the North Point Higgins Substation totaling 3.2 MW. The diesel generators provide power to the
community in times of low reservoir levels, hydro maintenance periods, and for emergency use during outages.
KPU's infrastructure includes seven distribution substations, 30-miles of 34.5 kV sub-transmission lines, nearly
100-miles of 12.47 kV distribution lines, and nearly 7,700 electric meters.

Southeast Alaska Energy Update and Profile McDowell Group, Inc. Page 4
Petersburg Municipal Power & Light (PMP&L)
PMP&L is a municipally-owned electric utility providing electric service to approximately 2,000 customers on
Mitkof Island. The utility’s primary source of electrical energy is SEAPA’s 20 MW Tyee Hydro project. PMP&L
also owns, operates, and maintains the 2 MW Blind Slough Hydro project. The utility also has a stand-by 10
MW diesel generation plant sufficient to meet the electrical demand in the event of an outage.
Wrangell Municipal Light & Power (WML&P)
WML&P is a municipally-owned utility providing electric service to approximately 1,800 customers in the
Wrangell area. WML&P obtains the majority of its power through SEAPA from the Tyee Hydro Project, but also
owns and operates an 8.5 MW diesel plant for backup power needs. Wrangell’s distribution system consists of
21.3 miles of overhead distribution and 1 mile of underground distribution at 7.2 kV.
Alaska Power and Telephone (AP&T)
AP&T is a diversified investor-owned utility serving several communities in Southeast Alaska through its wholly-
owned energy subsidiaries, Alaska Power Company, BBL Hydro, Inc., and Goat Lake Hydro, Inc. AP&T’s service
territory in Southeast Alaska is divided into four areas – Prince of Wales Island, Lynn Canal, Whale Pass, and
Gustavus.
AP&T owns and operates hydroelectric facilities at Dewey Lake, Falls Creek, Goat Lake, Kasidaya Creek, Lutak,
Black Bear, and South Fork. AP&T also owns and operates diesel units to supplement its hydroelectric
generation.
PRINCE OF WALES ISLAND (POW)
AP&T serves most communities on Prince of Wales Island in Southeast Alaska, including Coffman Cove, Craig,
Hollis, Hydaburg, Kasaan, Klawock, Naukati, Thorne Bay, and Whale Pass. All of the communities, except Whale
Pass, are interconnected and receive hydro power from Black Bear Lake and South Fork. In partnership with
Haida Corporation, AP&T is currently completing construction of the Hiilangaay Hydro project – formerly
known as Reynolds Creek Hydro – that will add additional hydro capacity to the POW grid. AP&T is working
with Whale Pass to develop a small hydro resource at Neck Lake.
HAINES-SKAGWAY
AP&T serves the Haines-Skagway area with hydro power from Goat Lake, Dewey Lakes, Kasidaya, and Lutak
projects. AP&T also sells excess hydropower to IPEC to serve loads in Chilkat Valley and Klukwan. The majority
of hydropower is produced in Skagway and delivered to Haines via an underwater transmission cable. The
utility and Haines have explored the development of resources in Haines to prevent diesel dependency in the
event of a failure of the undersea cable.
GUSTAVUS
In 2015, AP&T purchased the Gustavus Electric Company, which was formed in 1983 to provide electric service
to the community of Gustavus. AP&T operates the 800 kW Falls Creek run-of-river hydroelectric project, which
was completed in 2009. An underground transmission cable runs five miles from the Falls Creek powerhouse

Southeast Alaska Energy Update and Profile McDowell Group, Inc. Page 5
to the town’s diesel plant. The diesel units provide power during periods of low flows in Falls Creek. A
transmission line connection from Gustavus to Glacier Bay National Park headquarters in nearby Bartlett Cove
is currently in the planning stages.
Inside Passage Electric Cooperative (IPEC)
IPEC is a non-profit, member-owned electric cooperative. IPEC operates in five service areas – Angoon, Kake,
Hoonah, Klukwan, and Chilkat Valley. IPEC operates diesel generating units in all areas except Klukwan, owns
and operates the 10-Mile hydro project near Haines, and purchases additional hydroelectric power from AP&T
to serve the Klukwan/Chilkat Valley area. In 2015, IPEC completed construction of a run-of-river hydro project
on Gartina Creek near Hoonah, which supplies roughly a third of the town’s electrical needs when in operation.
IPEC has plans for a second hydro plant in Hoonah and is designing a small run-of-river hydro project at Gunnuk
Creek in Kake. Angoon’s Kootznoowoo Corporation is finalizing a feasibility study on a proposed hydro plant
at Thayer Creek that is envisioned to supply all of Angoon’s energy needs.
Metlakatla Power & Light (MPL)
MPL owns and operates the Purple Lake and Chester Lake hydroelectric plants. Purple Lake has three 1956-era
Francis type turbine-generators. Chester Lake has a single Pelton type turbine-generator. MPL also owns and
operates the Centennial Power Plant. The Centennial Power Plant consists of a 3.3 MW Caterpillar 3612 diesel
fired engine-generator and a 1 MW battery energy storage system.
A feasibility study is being finalized on the Triangle Lake watershed which could be the next increment of hydro
constructed in the MPL area. Construction funds are being sought for an intertie to the KPU and SEAPA grid
that would allow any surplus electricity to be sold into that grid, if needed, and would provide a source of
electricity for “dry years” in Metlakatla when hydro resources would otherwise be supplemented with diesel-
generated electricity.
City and Borough of Sitka
Sitka owns Blue Lake and Green Lake hydroelectric plants. Sitka generates nearly all of its electric requirements
from these hydroelectric plants. Sitka also owns and operates a diesel plant for backup power needs. The
diesel plant consists of a single Caterpillar diesel fired engine-generator (4.8 MW) and three Fairbanks Morse
generators (7.5 MW total). The City and Borough of Sitka recently completed a major expansion to the Blue
Lake Hydro project, raising the dam by 83 feet and constructing a new powerhouse with three new turbines.
Other Southeast Utilities
YAKUTAT POWER
Yakutat generates all of its electric requirements from diesel engines at the Yakutat Power Plant. The diesel
plant consists of four Caterpillar diesel fired engine-generators.
Southeast Alaska Energy Update and Profile McDowell Group, Inc. Page 6
ELFIN COVE
Electricity for Elfin Cove is provided by the Elfin Cove Utility Commission with diesel generation. The community
has a hydro project in design and is seeking construction funding.
PELICAN
Electricity for Pelican is provided by the Pelican Utility Company from a run-of-river hydro project that was
recently renovated after a major flood event in 2009. The hydro project became operational in 2013 and can
power the entire community when river flows are sufficient. The community also maintains five diesel units for
supplemental and backup power.
TENAKEE SPRINGS
Electricity for Tenakee Springs is provided by the City-owned utility with diesel generation. The city has
completed design and is currently pursuing construction funding for a proposed run-of-river hydro project on
nearby Indian River.
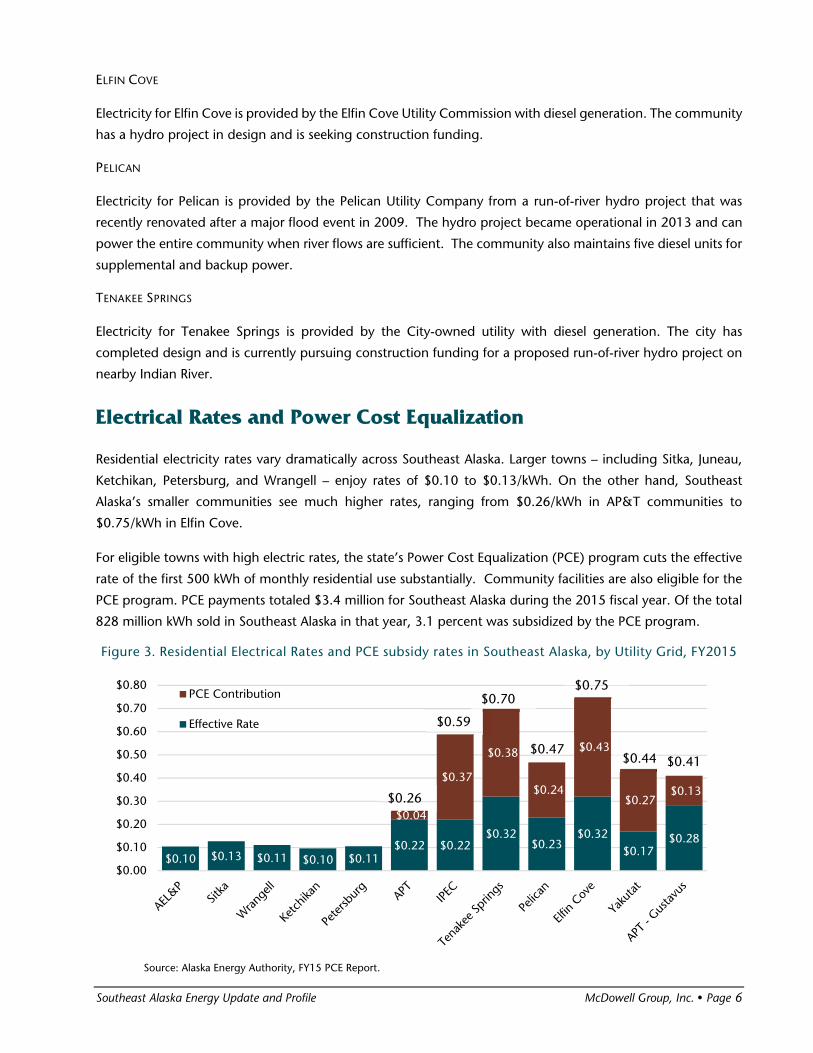
Electrical Rates and Power Cost Equalization
Residential electricity rates vary dramatically across Southeast Alaska. Larger towns – including Sitka, Juneau,
Ketchikan, Petersburg, and Wrangell – enjoy rates of $0.10 to $0.13/kWh. On the other hand, Southeast
Alaska’s smaller communities see much higher rates, ranging from $0.26/kWh in AP&T communities to
$0.75/kWh in Elfin Cove.
For eligible towns with high electric rates, the state’s Power Cost Equalization (PCE) program cuts the effective
rate of the first 500 kWh of monthly residential use substantially. Community facilities are also eligible for the
PCE program. PCE payments totaled $3.4 million for Southeast Alaska during the 2015 fiscal year. Of the total
828 million kWh sold in Southeast Alaska in that year, 3.1 percent was subsidized by the PCE program.
Figure 3. Residential Electrical Rates and PCE subsidy rates in Southeast Alaska, by Utility Grid, FY2015
Source: Alaska Energy Authority, FY15 PCE Report.
$0.10 $0.13 $0.11 $0.10 $0.11$0.22 $0.22
$0.32$0.23
$0.32$0.17
$0.28
$0.04
$0.37
$0.38
$0.24
$0.43
$0.27 $0.13
$0.00
$0.10
$0.20
$0.30
$0.40
$0.50
$0.60
$0.70
$0.80PCE Contribution
Effective Rate $0.59
$0.26
$0.70
$0.47
$0.75
$0.44 $0.41

Southeast Alaska Energy Update and Profile McDowell Group, Inc. Page 7
Hydropower
A total of 26 hydroelectric projects, with a combined capacity of 223.4 MW, provide power to Southeast
residents. These include 15 storage projects (those that include a substantial reservoir) and 11 run-of-river
projects (those without a substantial reservoir where production is dependent on river flows).
Table 1. Operating Hydro Projects in Southeast Alaska, 2016, Ranked by Capacity
Project Constr.
Date
Capacity
(MW)
Annual
MWh
% change
2001-05 to
2010-14
Type Location Owner
Snettisham 1973 78.2 285,600 0% Storage Juneau State of Alaska
Tyee Lake 1984 24 120,000 - Storage Wrangell SEAPA
Swan Lake 1983 22 66,187 +5% Storage Ketchikan SEAPA
Green Lake 1979 18.6 70,792 +26% Storage Sitka Sitka
Lake Dorothy 2009 14.3 83,600 - Storage Juneau AEL&P
Blue Lake 1961, 2014 15.9 62,500 +23% Storage Sitka Sitka
Beaver Falls 1947-54 5.4 45,508 +11% Storage Ketchikan KPU
Salmon Creek 1914 5.1 22,116 -2% Storage Juneau AEL&P
Whitman Lake 2014 4.6 16,000 - Storage Ketchikan KPU
Black Bear Lake 1997 4.5 22,300 -10% Storage POW AP&T
Ketchikan Lakes 1938-52 4.2 24,429 +9% Run-of-river Ketchikan KPU
Goat Lake 1997 4 15,140 -9% Storage Skagway AP&T
Annex Creek 1915 3.6 27,380 -3% Storage Juneau AEL&P
Purple Lake 1956 3.6 14,639 - Storage Metlakatla MPL
Kasidaya Creek 2008 3 8,640 - Run-of-river Skagway AP&T
Silvis Lake 1968 2.1 13,723 0% Storage Ketchikan KPU
Blind Slough 1924-54 2 13,108 - Run-of-river Petersburg Petersburg
South Fork 2005 2 6,000 - Run-of-river POW AP&T
Gold Creek 1893 1.6 5,634 -5% Run-of-river Juneau AEL&P
Chester Lake 1984 1 7,170 +57% Storage Metlakatla MPL
Dewey Lakes 0.94 2,945 - Run-of-river Skagway AP&T
Falls Creek 2009 0.8 2,160 - Run-of-river Gustavus AP&T
Pelican 1985 0.7 449 - Run-of-river Pelican City of Pelican
10 Mile 1999 0.55 1,050 - Run-of-river Haines IPEC
Gartina Creek 2015 0.45 - Run-of-river Hoonah IPEC
Lutak 0.25 780 - Run-of-river Haines AP&T
Source: SE IRP, 2012, Prepared by Black & Veatch for the Alaska Energy Authority; U.S. Energy Information Administration.

Southeast Alaska Energy Update and Profile McDowell Group, Inc. Page 8
Monthly production and other data are available from the U.S. Energy Information Administration for
hydroelectric plants with a capacity of 1MW or greater. Figure 4 shows the combined monthly production
from such Southeast hydro projects from 2001 through 2014. Overall, as shown by the dotted trend line, the
region has seen increased production during this time period – largely due to the construction of new hydro
projects such as Kasidaya, South Fork, and Lake Dorothy. Production in 2014 totaled 775 GWh, a 20 percent
increase over the 644 GWh produced in 2001.
Another trend visible in Figure 4 is an increase in seasonal variability of generation. The difference between
winter peak months and summer low months ranged from 17-20 GWh during the period 2001 through 2006.
From 2007 through 2014, this difference increased to an average of 40.5 GWh, with major implications for
hydropower supplied utilities. The variability decreased in 2014 to a total difference of 30GWh, and reports
from utility managers indicate that similarly lower levels of variability were seen in 2015.
Figure 4. Total Hydropower Production in Southeast Alaska from Selected Plants, 2001-2014
Source: U.S. Energy Information Administration. Notes: Includes all major Southeast Alaska hydropower plants with capacity greater than 1 MW except Tyee Lake Hydro (for which data was not available).
Projects Under Development
A variety of hydroelectric projects are currently under development in Southeast Alaska. Of the projects listed
in Table 2 below, the most advanced are the Hiilangaay Hydro project – formerly known as Reynolds Creek
Hydro – and the Swan Lake Expansion, both of which are currently under construction.
Gunnuk Creek Hydro is a top priority for the community of Kake and the project proponent, Inside Passage
Electric Cooperative (IPEC). IPEC is currently completing the final design and permitting stages of this project
and raising funds for construction. Similarly, the small communities of Elfin Cove and Tenakee Springs are both
pursuing final design and construction funds for the Crooked Creek/Jim’s Lake and Indian River hydro projects.
Juneau Hydropower Incorporated is championing the Sweetheart Creek Hydro project, aiming to sell power
into the Juneau electrical grid and possibly to the Kensington mine. The Southeast Alaska Power Agency is
currently studying hydro and other resources to determine the next increments of electrical generation to be
added to the SEAPA grid.
0102030405060708090
100
Tota
l Pro
duct
ion
(GW
H)

Southeast Alaska Energy Update and Profile McDowell Group, Inc. Page 9
Table 2. Hydroelectric Projects under Development in Southeast Alaska
Project Estimated
Capacity Type Location Proponent
Hiilangaay (Reynolds Creek) 5 MW Storage POW Haida Corp./AP&T
Gunnuk Creek 500 kW Storage Kake IPEC
Water Supply Creek 400 kW Run-of-river Hoonah IPEC
Swan Lake Expansion – expanded storage capacity only SEAPA
Crooked Creek/Jim’s Lake 140 kW Run-of-river
and storage Elfin Cove Elfin Cove
Indian River 180 kW Run-of-river Tenakee Springs Tenakee Springs
Thayer Creek 1.2 MW Run-of-river Angoon Kootznoowoo Inc.
Sweetheart Creek 20 MW Storage Juneau Juneau Hydropower
Diesel Power
Efficiency
More than 1.26 million gallons of diesel fuel are used annually to generate electricity in Southeast Alaska’s PCE-
eligible communities. Diesel plants in Southeast Alaska’s PCE-eligible communities vary in efficiency, as shown
in Figure 5. AEA has set a performance benchmark of 12.5 kWh per gallon for small utilities (those generating
under 2,000 MWh per year) and 14.5 kWh per gallon for larger utilities. All of Southeast Alaska’s PCE
communities meet this target except Kake, Elfin Cove, Whale Pass, and Naukati.
Figure 5. Diesel Efficiency in Southeast Alaska’s PCE-Eligible Communities, FY2015
Source: Alaska Energy Authority, FY15 PCE Report.
In recognition of the challenge of operating efficient small diesel generation and transmission systems in rural
Alaska, the Alaska Energy Authority created the Rural Power System Upgrade (RPSU) program. The RPSU
program provides resources to address the following:
02468
101214161820
kWh
pro
duce
d p
er G
allo
n of
D
iese
l Con
sum
ed

Southeast Alaska Energy Update and Profile McDowell Group, Inc. Page 10
Rebuilding or replacement of worn-out diesel generator units
Rebuilding or replacement of old and hazardous distribution systems
Construction of new power generation systems that meet State and Federal codes
Inclusion of heat recovery systems, where possible, in new powerhouses
Prepare for the integration of diesel power with electricity from renewable energy sources.
Seven communities in Southeast Alaska have received RPSU upgrades in recent years, with another project
currently in construction in Kake. Communities with projects remaining are predominantly communities served
partially by hydropower.
Table 3. Alaska Energy Authority Rural Power System Upgrades in Southeast Alaska
Projects Completed Projects In Progress Projects Remaining
Angoon Kake Point Baker
Elfin Cove Port Protection
Gustavus Whale Pass
Hoonah
Pelican
Tenakee Springs
Yakutat
Source: Alaska Energy Authority.
Fuel Prices
Based on PCE data for FY2015, diesel prices paid by Southeast Alaska’s PCE-eligible utilities ranged from $4.68
per gallon in Elfin Cove to $3.53 per gallon in Yakutat. The weighted average across these communities was
$3.65 per gallon during the year. Larger communities that primarily rely on hydropower are not included here,
and are generally able to purchase diesel at significantly lower rates.
Figure 6. Average Diesel Prices Paid by Southeast Alaska’s PCE-Eligible Utilities, FY2015
Source: Alaska Energy Authority, FY15 PCE Report. Note: Only PCE communities shown.
$3.54$3.68$3.76$3.65$3.64$3.66
$4.47$4.47$4.68
$3.64$3.77$3.82$3.53
$4.10

Southeast Alaska Energy Update and Profile McDowell Group, Inc. Page 11
Bulk Fuel Storage Issues
Storage of diesel and other fuels used in Southeast communities can be an issue as tanks age, pipes corrode,
and spills and leaks become more likely. The Alaska Energy Authority’s Bulk Fuel Upgrade (BFU) program, with
substantial contributions from the Denali Commission, funds assessments and construction of code-compliant
rural bulk fuel facilities. As shown in the table below, seven Southeast communities have received upgrades
through this program, with another two in progress and eight remaining.
Table 4. Alaska Energy Authority Bulk Fuel Upgrades in Southeast Alaska
Projects Completed Projects In Progress Projects Remaining
Angoon Edna Bay Craig
Elfin Cove Kake Hollis
Gustavus Hydaburg
Hoonah Hyder
Pelican Klawock
Port Protection Metlakatla
Tenakee Springs Port Alexander
Thorne Bay
Source: Alaska Energy Authority.
Heat Recovery from Diesel Plants
Roughly half of the communities that run diesel generators regularly have installed and use heat recovery
systems to take advantage of the waste heat created during the process of electricity generation. The
communities with heat recovery, and the buildings heated, are listed in Table 5 below. Heat recovery projects
in these communities have generally been funded and completed through the Alaska Energy Authority’s Rural
Power System Upgrade or Renewable Energy Fund programs. Communities not using heat recovery include
some, such as Kake, that lack a suitable space heating load in close proximity to the diesel plant.
Table 5. Heat Recovery from Diesel Generators in Southeast Alaska, 2015
Location Buildings Heated
Yakutat School, police station, housing
Hoonah School, senior center
Elfin Cove Powerhouse, community center
Angoon Schools, teacher housing
Naukati School, when diesels are in use
Whale Pass Operational but not in use
Edna Bay
Metlakatla
Source: Southeast Alaska Integrated Resource Plan, 2012, Prepared by Black & Veatch for the Alaska Energy Authority.

Southeast Alaska Energy Update and Profile McDowell Group, Inc. Page 12
Other Renewable Energy Developments
Currently, all electricity generated by utilities in Southeast Alaska is derived from diesel generators or
conventional hydropower. However, a variety of other energy sources have been considered in the region,
including wind, wave, solar, tidal, biomass, and geothermal. For more detail on this subject, see Chapter 11 of
the SE IRP (Volume II).
Current and Projected Demand
Population Trends and Projections
Southeast Alaska’s population grew at a rate of 3.8 percent from 2010 to 2015. A lower level of growth (2.29
percent) is expected from 2015 to 2035, according to projections published by the Alaska Department of Labor
and Workforce Development, Research and Analysis Section. The state agency’s projections are based on aging
forward current demographic groups, combined with estimates of projected births, death, and in/out
migration.
Subregions within Southeast Alaska are projected to grow at substantially different rates. From 2010 to 2015,
the fastest growing areas in the region were the City and Borough of Juneau (6.4 percent growth) and the
Municipality of Skagway Borough (7.4 percent). These areas are also expected to grow the fastest from 2015
to 2035. On the other side of the spectrum, the City and Borough of Yakutat and the Petersburg Borough are
expected to experience a population decline of over 10 percent from 2015 to 2035.
Table 6. Population Estimates and Projections for Southeast Alaska, 2010-2045
Region 2010
census 2015
estimate 2020 2025 2030 2035 2010-2015
actual change 2015-2035 projection
Southeast Region 71,664 74,395 75,600 76,272 76,411 76,099 +3.81% +2.29%
Haines Borough 2,508 2,493 2,525 2,541 2,533 2,499 -0.60% +0.24%
Hoonah-Angoon CA 2,149 2,178 2,164 2,133 2,086 2,025 +1.35% -7.02%
Juneau, City and B. 31,275 33,277 34,115 34,719 35,073 35,214 +6.40% +5.82%
Ketchikan Gateway B. 13,477 13,778 13,934 14,000 13,969 13,842 +2.23% +0.46%
Petersburg Borough 3,203 3,199 3,132 3,046 2,932 2,807 -0.12% -12.25%
POW-Hyder CA 6,172 6,446 6,596 6,699 6,769 6,823 +4.44% +5.85%
Sitka, City and Bor. 8,881 8,929 8,920 8,851 8,718 8,538 +0.54% -4.38%
Skagway Borough 968 1,040 1,111 1,165 1,222 1,263 +7.44% +21.44%
Wrangell, City and B. 2,369 2,442 2,508 2,550 2,570 2,583 +3.08% +5.77%
Yakutat, City and B. 662 613 595 568 539 505 -7.40% -17.62%
Source: Alaska Department of Labor and Workforce Development. Note: 2010 is a census count; 2015 is an estimate.

Southeast Alaska Energy Update and Profile McDowell Group, Inc. Page 13
Trends in Average Customer Use
Electric sales at Southeast’s utilities split into three categories, residential (38 percent of all sales), commercial
(36 percent) and industrial (26 percent). Residential sales include those to private households and apartment
buildings. Commercial sales include sales to nonmanufacturing businesses; health, social, and education
institutions; governmental entities; and street lighting. Industrial sales are described in more detail below.
Average monthly sales per residential and commercial customer are presented below for each utility grid in
Southeast Alaska for 2010 through 2014. Trends over this time period can be a result of energy efficiency
measures, variation in heating needs, and many other factors. It is important to note that differences between
communities in average monthly usage per customer is partly a factor of the number of seasonal residents in
each community, as well as other factors.
Table 7. Average Monthly Residential Customer Electricity Sales in kWh, By Utility Grid, 2010-2014
Utility Grid 2010 2011 2012 2013 2014 2010-2014
AEL&P 793 842 852 843 833 +5.1%
Sitka 1,045 1,093 1,088 1,030 1,024 -2.1%
Wrangell 991 1,126 1,088 1,019 978 -1.4%
KPU 902 951 986 944 923 +2.4%
Petersburg 1,152 1,243 1,280 1,244 1,197 +3.9%
IPEC - Angoon 403 397 381 366 351 -13.1%
APT - Gustavus 154 173 170 168 168 +8.6%
APT - POW 1,166 1,212 1,237 1,215 1,225 +5.0%
APT- Lynn Canal 647 663 665 666 653 +0.9%
IPEC – Chilkat Valley/Klukwan 376 378 350 338 337 -10.4%
Elfin Cove 158 141 156 190 185 +17.3%
IPEC - Hoonah 405 410 399 391 360 -11.1%
IPEC - Kake 322 386 383 368 371 +15.3%
Pelican 353 391 373 408 374 +5.9%
Tenakee Springs 156 160 155 155 149 -4.5%
Yakutat 425 419 410 403 395 -7.1%
Source: EIA; Alaska Energy Data Gateway; and Alaska Energy Authority, FY15 PCE Report. Note: For PCE-eligible communities, 2010-2014 reflect calendar year data and 2014 reflects FY15 data (July 2014 – June 2015).
Southeast Alaska Energy Update and Profile McDowell Group, Inc. Page 14
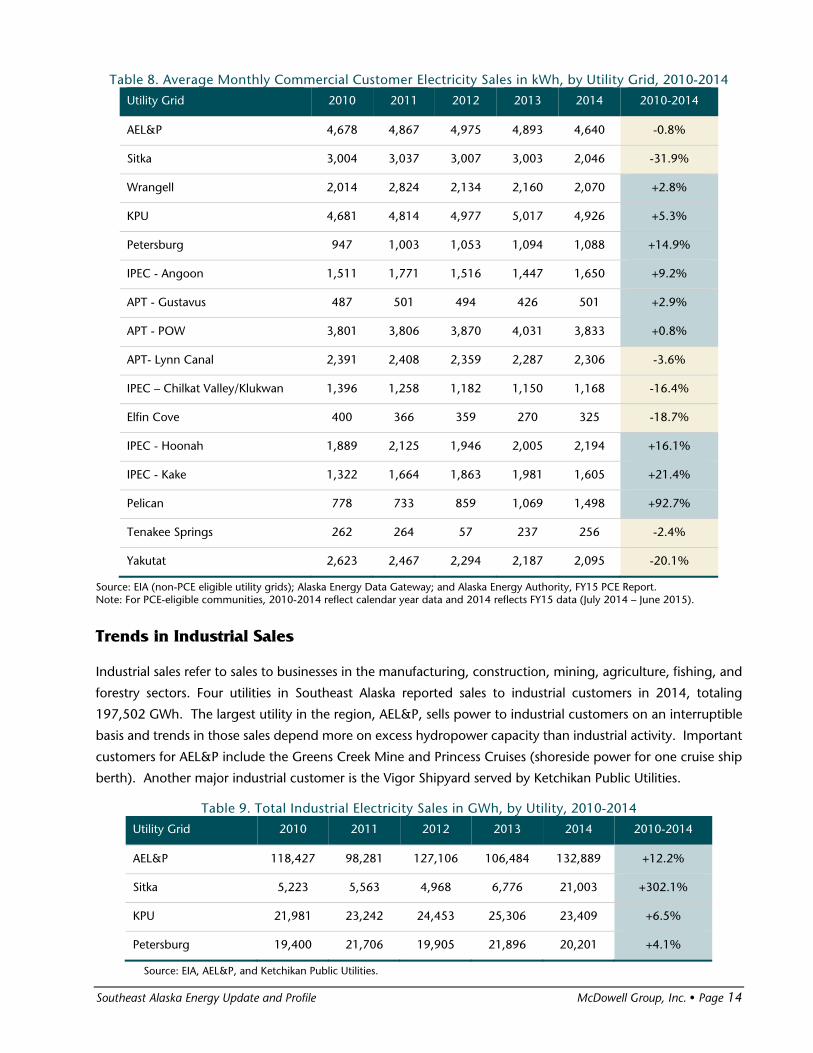
Table 8. Average Monthly Commercial Customer Electricity Sales in kWh, by Utility Grid, 2010-2014
Utility Grid 2010 2011 2012 2013 2014 2010-2014
AEL&P 4,678 4,867 4,975 4,893 4,640 -0.8%
Sitka 3,004 3,037 3,007 3,003 2,046 -31.9%
Wrangell 2,014 2,824 2,134 2,160 2,070 +2.8%
KPU 4,681 4,814 4,977 5,017 4,926 +5.3%
Petersburg 947 1,003 1,053 1,094 1,088 +14.9%
IPEC - Angoon 1,511 1,771 1,516 1,447 1,650 +9.2%
APT - Gustavus 487 501 494 426 501 +2.9%
APT - POW 3,801 3,806 3,870 4,031 3,833 +0.8%
APT- Lynn Canal 2,391 2,408 2,359 2,287 2,306 -3.6%
IPEC – Chilkat Valley/Klukwan 1,396 1,258 1,182 1,150 1,168 -16.4%
Elfin Cove 400 366 359 270 325 -18.7%
IPEC - Hoonah 1,889 2,125 1,946 2,005 2,194 +16.1%
IPEC - Kake 1,322 1,664 1,863 1,981 1,605 +21.4%
Pelican 778 733 859 1,069 1,498 +92.7%
Tenakee Springs 262 264 57 237 256 -2.4%
Yakutat 2,623 2,467 2,294 2,187 2,095 -20.1%
Source: EIA (non-PCE eligible utility grids); Alaska Energy Data Gateway; and Alaska Energy Authority, FY15 PCE Report. Note: For PCE-eligible communities, 2010-2014 reflect calendar year data and 2014 reflects FY15 data (July 2014 – June 2015).
Trends in Industrial Sales
Industrial sales refer to sales to businesses in the manufacturing, construction, mining, agriculture, fishing, and
forestry sectors. Four utilities in Southeast Alaska reported sales to industrial customers in 2014, totaling
197,502 GWh. The largest utility in the region, AEL&P, sells power to industrial customers on an interruptible
basis and trends in those sales depend more on excess hydropower capacity than industrial activity. Important
customers for AEL&P include the Greens Creek Mine and Princess Cruises (shoreside power for one cruise ship
berth). Another major industrial customer is the Vigor Shipyard served by Ketchikan Public Utilities.
Table 9. Total Industrial Electricity Sales in GWh, by Utility, 2010-2014
Utility Grid 2010 2011 2012 2013 2014 2010-2014
AEL&P 118,427 98,281 127,106 106,484 132,889 +12.2%
Sitka 5,223 5,563 4,968 6,776 21,003 +302.1%
KPU 21,981 23,242 24,453 25,306 23,409 +6.5%
Petersburg 19,400 21,706 19,905 21,896 20,201 +4.1%
Source: EIA, AEL&P, and Ketchikan Public Utilities.
Southeast Alaska Energy Update and Profile McDowell Group, Inc. Page 15
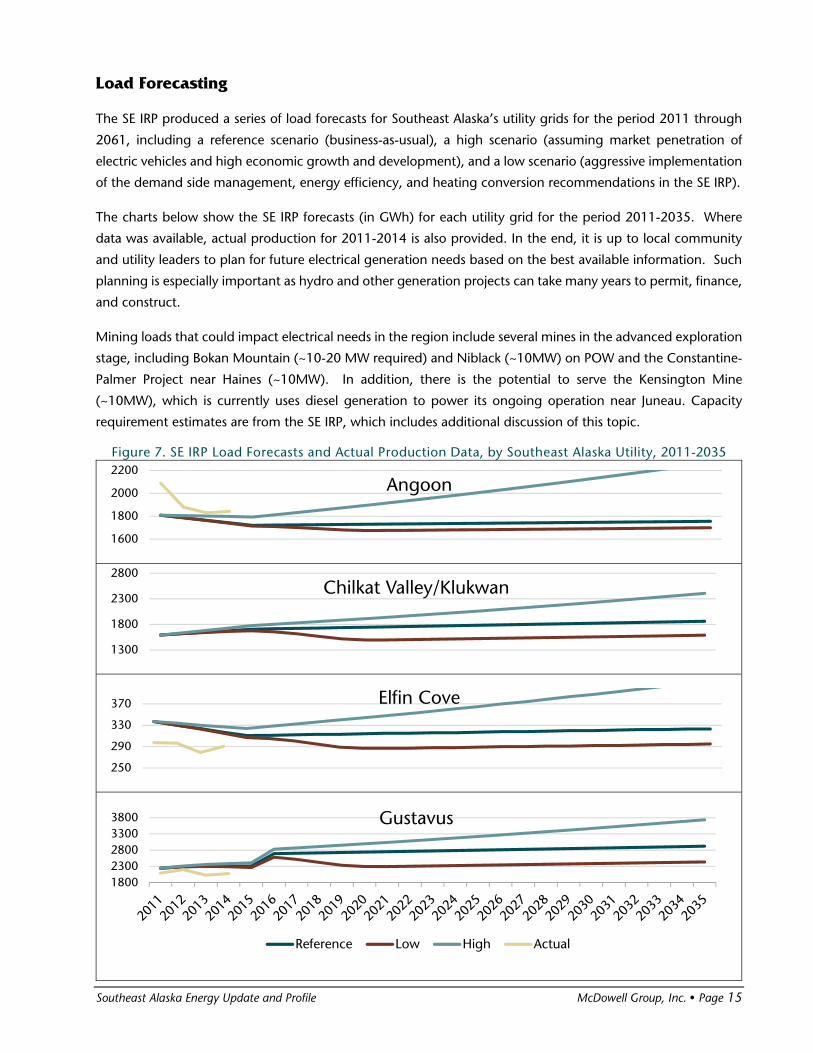
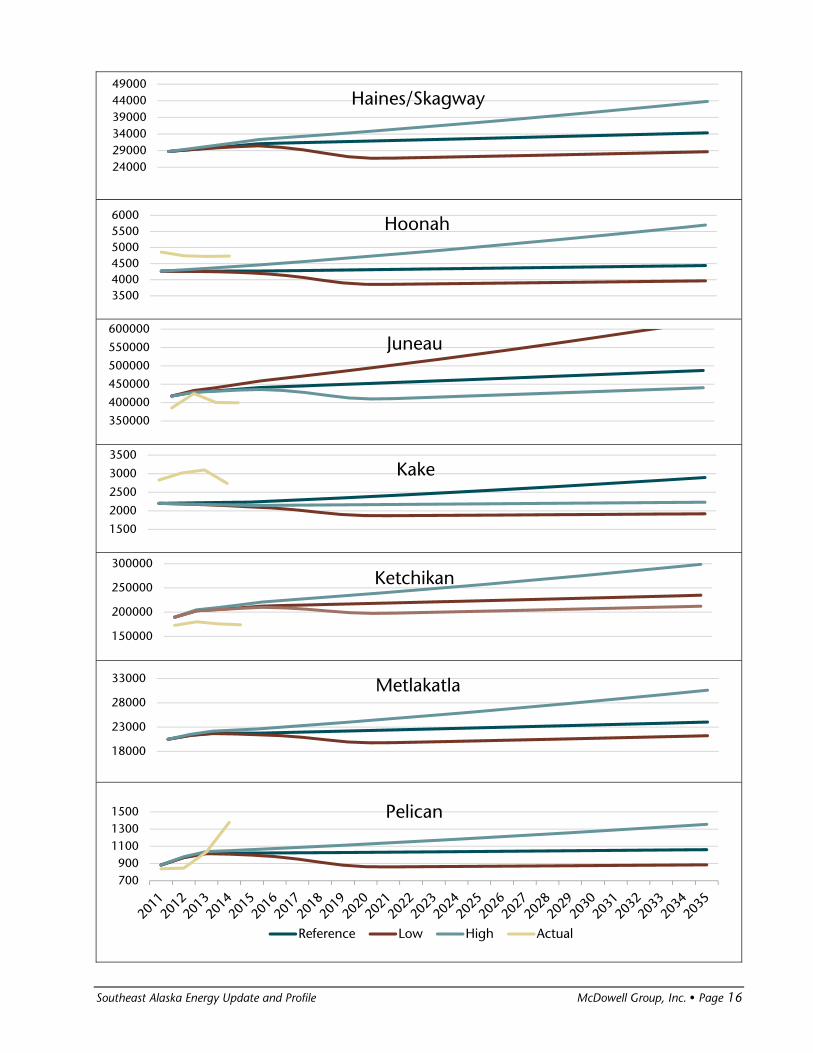
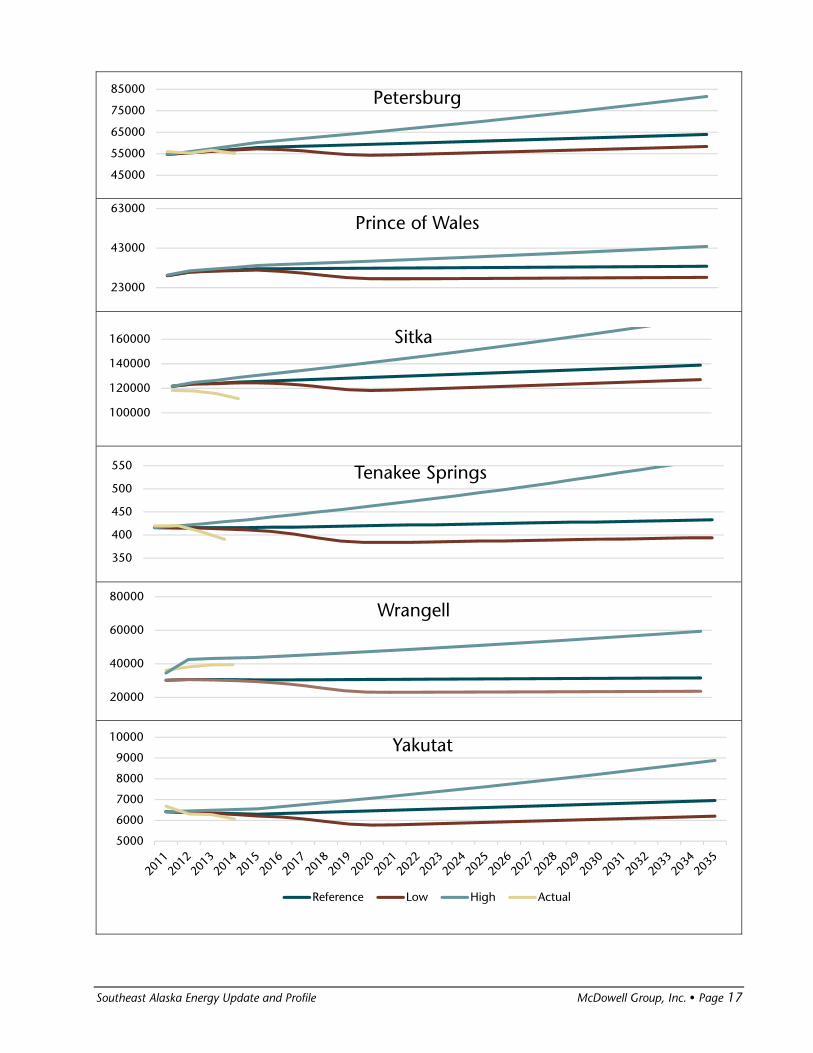
Load Forecasting
The SE IRP produced a series of load forecasts for Southeast Alaska’s utility grids for the period 2011 through
2061, including a reference scenario (business-as-usual), a high scenario (assuming market penetration of
electric vehicles and high economic growth and development), and a low scenario (aggressive implementation
of the demand side management, energy efficiency, and heating conversion recommendations in the SE IRP).
The charts below show the SE IRP forecasts (in GWh) for each utility grid for the period 2011-2035. Where
data was available, actual production for 2011-2014 is also provided. In the end, it is up to local community
and utility leaders to plan for future electrical generation needs based on the best available information. Such
planning is especially important as hydro and other generation projects can take many years to permit, finance,
and construct.
Mining loads that could impact electrical needs in the region include several mines in the advanced exploration
stage, including Bokan Mountain (~10-20 MW required) and Niblack (~10MW) on POW and the Constantine-
Palmer Project near Haines (~10MW). In addition, there is the potential to serve the Kensington Mine
(~10MW), which is currently uses diesel generation to power its ongoing operation near Juneau. Capacity
requirement estimates are from the SE IRP, which includes additional discussion of this topic.
Figure 7. SE IRP Load Forecasts and Actual Production Data, by Southeast Alaska Utility, 2011-2035
1300
1800
2300
2800Chilkat Valley/Klukwan
1600
1800
2000
2200Angoon
250
290
330
370 Elfin Cove
18002300280033003800 Gustavus
Reference Low High Actual
Southeast Alaska Energy Update and Profile McDowell Group, Inc. Page 16
350040004500500055006000 Hoonah
18000
23000
28000
33000 Metlakatla
240002900034000390004400049000
Haines/Skagway
1500
2000
2500
3000
3500Kake
150000
200000
250000
300000Ketchikan
350000
400000
450000
500000
550000
600000Juneau
700900
110013001500 Pelican
Reference Low High Actual
Southeast Alaska Energy Update and Profile McDowell Group, Inc. Page 17
5000
6000
7000
8000
9000
10000 Yakutat
Reference Low High Actual
45000
55000
65000
75000
85000 Petersburg
23000
43000
63000Prince of Wales
350
400
450
500
550 Tenakee Springs
100000
120000
140000
160000 Sitka
20000
40000
60000
80000Wrangell

Southeast Alaska Energy Update and Profile McDowell Group, Inc. Page 18
Energy Efficiency/Demand Side Management
The 2012 SE IRP evaluated a suite of demand side management and energy efficiency (DSM/EE) options with
the potential to provide energy cost savings and peak load reductions. These options were compared to
alternative supply-side options. The result was a recommendation to aggressively pursue DSM/EE programs,
including investments in weatherization, promotion of energy efficient appliances and technologies, conversion
of space heating equipment away from heating fuel, and other measures.
Below is an update on recent progress on DSM/EE and weatherization efforts in Southeast Alaska. Space heating
technologies and conversions are discussed in the following section of this report.
Residential
Overall, it is estimated that slightly more than a quarter (27 percent) of Southeast Alaska’s occupied housing
units have been retrofitted through weatherization, new construction, and retrofit programs. Community
specific estimates are also provided in the community energy profiles section of this report.
The majority of the retrofits described above were completed through Alaska Housing Finance Corporation
(AHFC) programs, including the home energy rebate, weatherization, and new home rebate programs. The
home energy rebate program, which has been paused due to lack of funding as of April 2016, provided rebates
of up to $10,000 for completion of energy improvements (weatherization, replacement of inefficient heating
appliances, etc.) in private residences.
The weatherization program provides energy improvements at no-cost for qualifying low-income residents,
using a network of weatherization service providers. Providers in Southeast Alaska include RurAL CAP (Juneau),
Alaska Community Development Corporation (outside Juneau), Baranof Island Housing Authority (Sitka),
Ketchikan Indian Community Housing Authority (Ketchikan), and Tlingit-Haida Regional Housing Authority
(majority of Southeast communities, including Juneau).
Southeast Alaska’s regional housing authorities (RHAs) create and upgrade affordable housing to provide home
ownership and rental opportunities. RHAs are the primary source of new and renovated housing options in
many of the region’s communities, and build all new housing to the Alaska Building Energy Efficiency Standard
(BEES). Funding for RHA programs comes from a variety of sources including the U.S. Housing and Urban
Development’s NAHASDA program and AHFC Supplemental Housing Development grants.
The largest RHA in Southeast Alaska is the Tlingit-Haida Regional Housing Authority (THRHA). THRHA recently
completed a major DOE-funded study of energy efficiency and alternative energy opportunities at THRHA-
owned multifamily residential buildings.1F
2 Many of THRHA’s properties are located in the region’s high energy
cost communities.
Recent energy efficiency improvements at THRHA buildings include a major retrofit and expansion of the Kake
Senior center, an effort that included weatherization, addition of new propane and wood pellet boilers, and
2 THRHA. (2016). DE-0005179 Energy Efficiency Audit, Assessment, and Alternative Energy Study. Available at: http://energy.gov/sites/prod/files/2016/04/f30/THRHA%20final%20Report%20EE0005179.pdf.
Southeast Alaska Energy Update and Profile McDowell Group, Inc. Page 19
energy monitoring, among other measures. Solar photovoltaic panels are also being installed at the Kake Senior
Center and will be studied to evaluate their potential at other sites in Southeast Alaska.
In Angoon, THRHA is planning a major upgrade to 9 multi-family residential units, including weatherization
and a district heating loop powered by a pellet fired boiler (replacing 22 oil-fired boilers). In 2017, the THRHA
is also planning to weatherize and upgrade their 12-unit low rent building in Haines, and is considering wood
heat, heat pumps, and other options. The housing authority has also evaluated solar hot water systems for its
senior centers and other buildings but did not find them to be cost-effective.
Commercial and Public Buildings
It is estimated that more than half of the building energy use in Alaska is consumed by nonresidential buildings.
Organized efforts to improve the energy efficiency of these buildings has received attention in recent years,
starting with a Commercial Building Energy Audit Program through the Alaska Energy Authority. This program
is not currently accepting applications, though similar efforts are being pursued through a partnership between
Southeast Conference, Renewable Energy Alaska Project, and the Sustainable Southeast Partnership, with
funding from all three organizations as well as AHFC and a USDA grant.
In 2015, the coalition described above completed Level I energy audits of 34 public and private buildings in
Southeast Alaska with a combined total of more than 230,000 square feet of space. Of these, 9 were located
in Haines, 11 in Hoonah, 6 in Klawock, and 8 in Craig. Efforts also included completing an inventory of
commercial and public buildings in each of these communities. Participation is being solicited for a Round II
effort in 2017 that will include up to 26 additional energy audits at commercial and public buildings in
Southeast Alaska.
Community Wide Efforts
The U.S. Department of Energy’s (DOE) Office of Indian Energy manages a competitive energy assistance
program called Strategic Technical Assistance Response Team (START). START assists in the development of
tribal renewable energy and energy efficiency projects in rural Alaska Native communities. Three Southeast
Alaska communities have been selected for START assistance in recent years – Kake, Yakutat, and Hoonah.
In Kake, START efforts included the completion of a community energy plan, as well as technical assistance to
move various community energy projects forward. In Yakutat, investment grade energy audits were completed
at public and commercial buildings including the community center, Kwan plaza and the Yakutat clinic, and
Yakutat Seafood Incorporated’s warehouse, fish processing facility, ice house, and bunkhouse. Retrofits were
completed at the community center and Kwan plaza/Yakutat clinic. Efforts in Hoonah are currently ongoing
and include strategic planning and a focus on assisting community efforts to build a biomass district heating
system.
The DOE is also currently implementing the Remote Alaska Communities Energy Efficiency (RACEE)
competition. The RACEE program invites eligible Alaskan communities and native villages (those a population
under 8,000) to sign a pledge to improve community energy efficiency by 15 percent or more by 2020.

Southeast Alaska Energy Update and Profile McDowell Group, Inc. Page 20
Those communities who sign this pledge are identified as Community Efficiency Champions and are eligible to
compete for funds to implement energy saving measures. Throughout Alaska 64 communities signed this
pledge, including Yakutat, Haines, Pelican, Angoon, Kake, Kasaan, Saxman, and Klawock in Southeast. In April
2016, 13 Alaska communities were selected to receive in-kind technical assistance through the Phase II of the
RACEE program, including the Village of Klawock. Phase II communities are eligible to apply for DOE grant
funding in Phase III of the RACEE program, with applications due in August 2016.
Other Demand Side Management/Energy Efficiency Efforts
The Alaska Energy Authority’s akenergyefficiency.org website, a project of the Alaska Energy Efficiency
Partnership, provides a wide variety of resources and energy savings tips covering residential, commercial, and
public buildings. A list of energy audit professionals, including ratings of their performance and contact
information, and a calendar of events, trainings, and workshops is also provided at the site. Other Alaska Energy
Authority education efforts include offering a tool kit for loan to Alaskans to assess energy efficiency
opportunities. The tool kit can include watt meters, light meters, ballast checkers, and occupancy and other
sensors and loggers.
Notable utility and community-led energy efficiency efforts in recent years include numerous projects to
upgrade street lighting to LED and improve the energy efficiency of water and wastewater systems. Some of
these efforts are reflected in the community energy profiles provided in this report. Unfortunately, responses
were limited and comprehensive information on street lighting and water/wastewater energy efficiency efforts
was not available at the time of publication of this report.

Southeast Alaska Energy Update and Profile McDowell Group, Inc. Page 21
Source: Alaska Housing Needs Assessment, 2014
Space Heating
Space heating costs represent a major portion of
residential, commercial, and industrial energy
expenditures in Southeast Alaska. However, limited data
is available to measure the amount and types of energy
consumed for space heating in the region.
The Alaska Housing Finance Corporation’s (AHFC) 2014
Housing Needs Assessment provides an estimate of
energy use for space heating, based on data from the
state’s weatherization and energy retrofit programs,
energy consumption at AHFC properties, and modeling.
The 2014 Housing Needs Assessment estimates that fuel
oil accounts for close to three quarters of total residential
space heating energy in Southeast Alaska, followed by
wood, electricity, and propane (Figure 7). It is important
to note, however, that a large portion of homes in
Southeast Alaska have the ability to use more than one
fuel type for space heating, and will adjust as prices
change.
Community buildings in Southeast Alaska follow roughly
the same pattern of space heating fuel use. The 2014
Housing Needs Assessment estimates that roughly 75
percent of space heating energy for the region’s
community buildings derives from fuel oil, followed by
14 percent from wood, 9 percent from electricity, and 2
percent from propane.
This section describes additional data sources available for specific communities and fuel types. Trends, such
as increased utilization of electric heat in hydro-supplied towns and addition of a variety of biomass projects in
public buildings thorough the region, are explored.
Fuel Oil
Oil has traditionally been the main fuel for space heating in the Southeast. Generally, two forms of oil space
heating are used, oil-fired boilers and Monitor or Toyo stoves. Relatively little data is available regarding the
amount of oil used for space heating in the region, as most fuel oil suppliers view such data as confidential.
Using a variety of assumptions, the 2012 SE IRP estimated that roughly 17.4 million gallons of fuel oil were
burned in 2012 for space heating in Southeast Alaska, at a total cost of $72 million dollars or over $1,000 per
person. Estimates by community are provided in the table below.
Wood17% Propane
2%
Electricity9%
Fuel Oil72%
Figure 8. Percent of Total Southeast Alaska Residential Space Heating Energy, by Fuel
Type, 2014
By Census Area

Southeast Alaska Energy Update and Profile McDowell Group, Inc. Page 22
Table 10. Estimated Fuel Oil Consumption and Cost for Space Heating in Southeast Alaska, 2012
Community/Region Gallons of Fuel Oil Cost
Juneau 7,700,523 $31,452,518
Ketchikan 2,903,831 $10,683,780
Sitka 1,844,742 $8,144,044
Prince of Wales 1,110,191 $4,926,292
Wrangell 784,572 $3,175,260
Haines 675,533 $2,982,297
Skagway 433,960 $1,880,302
Metlakatla 328,117 $1,327,930
Yakutat 295,094 $1,393,902
Kake 286,552 $1,271,506
Gustavus 254,931 $1,297,638
Hoonah 238,235 $1,093,805
Petersburg 225,961 $914,492
Chilkat Valley 129,671 $582,540
Angoon 125,356 $556,333
Klukwan 34,238 $151,922
Tenakee Springs 32,423 $168,654
Pelican 23,247 $124,597
Whale Pass 17,687 $80,503
Elfin Cove 2,754 $14,761
SE Alaska Total 17,447,619 $72,223,076
Source: 2012 Southeast Alaska IRP
Fuel oil expenditures also have the downside of being subject to wide swings in price based on global oil
markets. Figure 8 below shows the range of prices in ten Southeast Alaska communities from 2005 through
2016. Prices jumped in 2008 and again in 2011, only recently returning to 2005/2006 levels.
In general, prices can be as much as $1-$2 more per gallon in the region’s smaller, more isolated communities.
While fuel oil prices are set at the global level, the cost of barge transportation to smaller markets adds
substantially to the final price. Smaller communities generally do not purchase enough to qualify for bulk
purchase discounts and coordination between purchasers in a town (generally the fuel depot and the local
utility) can be challenged by cash flow alignment issues. Other factors affecting fuel price include the distance
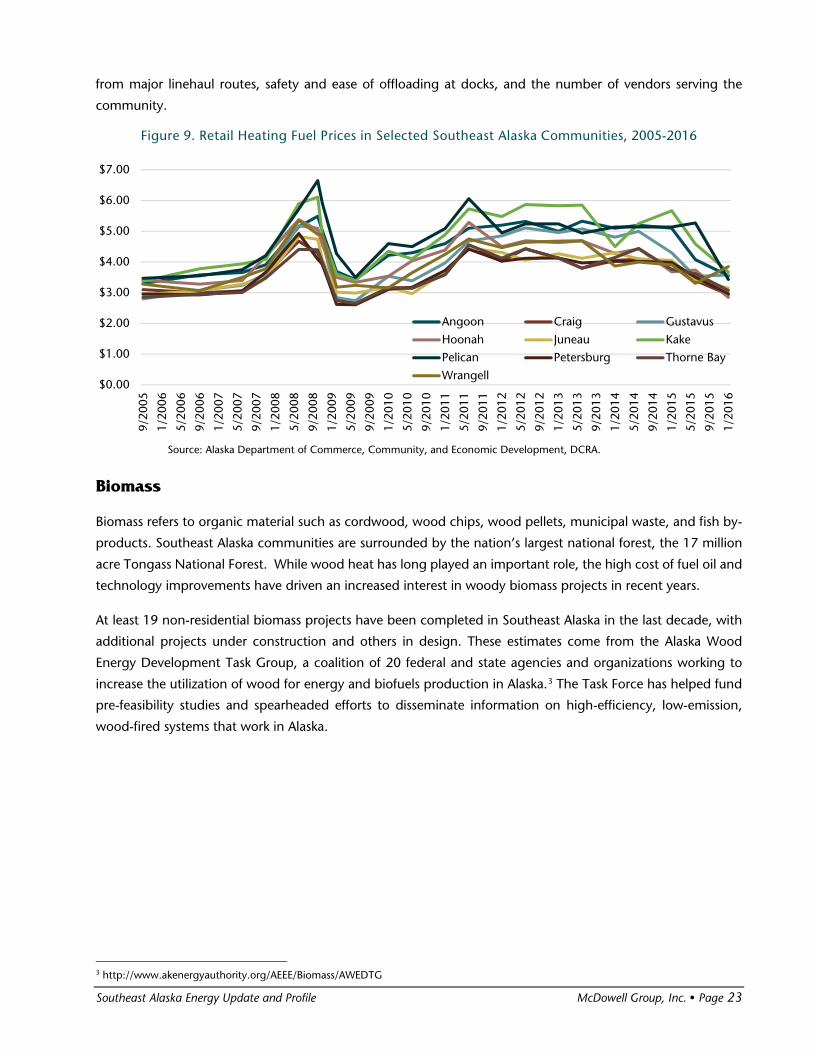
Southeast Alaska Energy Update and Profile McDowell Group, Inc. Page 23
from major linehaul routes, safety and ease of offloading at docks, and the number of vendors serving the
community.
Figure 9. Retail Heating Fuel Prices in Selected Southeast Alaska Communities, 2005-2016
Source: Alaska Department of Commerce, Community, and Economic Development, DCRA.
Biomass
Biomass refers to organic material such as cordwood, wood chips, wood pellets, municipal waste, and fish by-
products. Southeast Alaska communities are surrounded by the nation’s largest national forest, the 17 million
acre Tongass National Forest. While wood heat has long played an important role, the high cost of fuel oil and
technology improvements have driven an increased interest in woody biomass projects in recent years.
At least 19 non-residential biomass projects have been completed in Southeast Alaska in the last decade, with
additional projects under construction and others in design. These estimates come from the Alaska Wood
Energy Development Task Group, a coalition of 20 federal and state agencies and organizations working to
increase the utilization of wood for energy and biofuels production in Alaska.2F
3 The Task Force has helped fund
pre-feasibility studies and spearheaded efforts to disseminate information on high-efficiency, low-emission,
wood-fired systems that work in Alaska.
3 http://www.akenergyauthority.org/AEEE/Biomass/AWEDTG
$0.00
$1.00
$2.00
$3.00
$4.00
$5.00
$6.00
$7.00
9/20
05
1/20
06
5/20
06
9/20
06
1/20
07
5/20
07
9/20
07
1/20
08
5/20
08
9/20
08
1/20
09
5/20
09
9/20
09
1/20
10
5/20
10
9/20
10
1/20
11
5/20
11
9/20
11
1/20
12
5/20
12
9/20
12
1/20
13
5/20
13
9/20
13
1/20
14
5/20
14
9/20
14
1/20
15
5/20
15
9/20
15
1/20
16
Angoon Craig Gustavus
Hoonah Juneau Kake
Pelican Petersburg Thorne Bay
Wrangell
Southeast Alaska Energy Update and Profile McDowell Group, Inc. Page 24
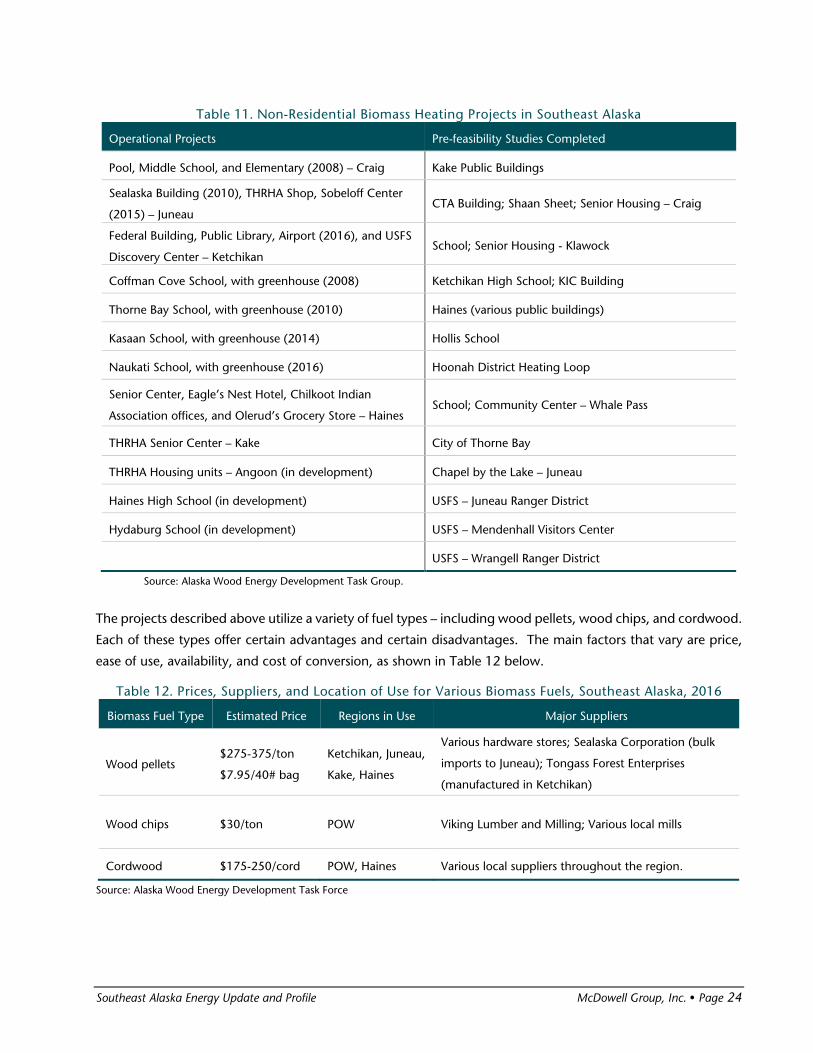
Table 11. Non-Residential Biomass Heating Projects in Southeast Alaska
Operational Projects Pre-feasibility Studies Completed
Pool, Middle School, and Elementary (2008) – Craig Kake Public Buildings
Sealaska Building (2010), THRHA Shop, Sobeloff Center
(2015) – Juneau CTA Building; Shaan Sheet; Senior Housing – Craig
Federal Building, Public Library, Airport (2016), and USFS
Discovery Center – Ketchikan School; Senior Housing - Klawock
Coffman Cove School, with greenhouse (2008) Ketchikan High School; KIC Building
Thorne Bay School, with greenhouse (2010) Haines (various public buildings)
Kasaan School, with greenhouse (2014) Hollis School
Naukati School, with greenhouse (2016) Hoonah District Heating Loop
Senior Center, Eagle’s Nest Hotel, Chilkoot Indian
Association offices, and Olerud’s Grocery Store – Haines School; Community Center – Whale Pass
THRHA Senior Center – Kake City of Thorne Bay
THRHA Housing units – Angoon (in development) Chapel by the Lake – Juneau
Haines High School (in development) USFS – Juneau Ranger District
Hydaburg School (in development) USFS – Mendenhall Visitors Center
USFS – Wrangell Ranger District
Source: Alaska Wood Energy Development Task Group.
The projects described above utilize a variety of fuel types – including wood pellets, wood chips, and cordwood.
Each of these types offer certain advantages and certain disadvantages. The main factors that vary are price,
ease of use, availability, and cost of conversion, as shown in Table 12 below.
Table 12. Prices, Suppliers, and Location of Use for Various Biomass Fuels, Southeast Alaska, 2016
Biomass Fuel Type Estimated Price Regions in Use Major Suppliers
Wood pellets $275-375/ton
$7.95/40# bag
Ketchikan, Juneau,
Kake, Haines
Various hardware stores; Sealaska Corporation (bulk
imports to Juneau); Tongass Forest Enterprises
(manufactured in Ketchikan)
Wood chips $30/ton POW Viking Lumber and Milling; Various local mills
Cordwood $175-250/cord POW, Haines Various local suppliers throughout the region.
Source: Alaska Wood Energy Development Task Force

Southeast Alaska Energy Update and Profile McDowell Group, Inc. Page 25
WOOD PELLETS
One of the key benefits driving the use of fuel oil and electricity for space heating is convenience. Of the
biomass fuel options available, wood pellets are considered the easiest to use, as they can be delivered by
trucks, filling hoppers that automatically feed pellet boilers with minimal maintenance required.
For residential applications, wood pellets are available for purchase in Southeast Alaska’s larger towns in 40
pound bags at various hardware stores. In addition, bulk deliveries can be supplied by road and ferry from
Juneau and Ketchikan. Sealaska Corporation owns a truck in Juneau and currently supplies pellets at a cost of
$375 per ton (not including delivery charges) to projects in Juneau and Haines. Tongass Forest Enterprises in
Ketchikan – currently the only wood pellet manufacturer in Southeast Alaska – sells its pellets for $275-350 per
ton and delivers them to projects in Ketchikan as well as by ferry to Kake.
The 2012 Southeast IRP estimated that for pellets at $300 per ton, the break-even price of oil is approximately
$2.70 per gallon. In 2014, a federal official estimated the cost of pellets used at the Ketchikan Federal Building
equated to a fuel oil price of roughly $2.15 per gallon.
WOOD CHIPS
Wood chips offer many of the benefits of wood pellets in that the fuel and can be loaded in bulk and the boiler
systems can operate autonomously like pellet and oil boilers. Typically, a chip boiler requires a more robust
fuel handling and feed system due to the fact that chips don’t ‘flow’ like pellets.
Currently, the only major wood chip-fueled biomass project in Southeast (a complex of two schools and a pool
in Craig) sources its chips from the Viking Lumber and Milling sawmill in Klawock on Prince of Wales Island.
The Haines school and pool project currently under development is planned for chips sourced from the nearby
Haines State Forest.
A key advantage of chips over pellets is that they can be produced in the local community with relatively simple
and inexpensive equipment. Chips can be expected in the $70 per ton range, which would equate to heating
oil at less than one dollar per gallon. The Forest Service is developing a ‘Local Chips’ production program that
will provide detailed guidance on how a community can establish its own chip production program.
CORDWOOD
Cordwood systems can be an excellent solution for remote, high-energy-cost communities, and are rapidly
being adopted throughout Alaska. In general, heating oil needs to be under $1.50 per gallon to compete with
cordwood systems on an energy cost basis. Numerous schools on Prince of Wales have converted to cordwood
systems, where the boilers heat the schools as well as adjacent school greenhouses. These systems provide
many additional benefits including, enhanced learning opportunities in science, horticultural math and
business, and community food security. The Alaska Energy Authority, with funding from the U.S. Forest Service,
is currently developing a biomass greenhouse handbook based on success stories in Southeast and Interior
Alaska.
Cordwood offers an important advantage over pellets or chips in that it can be produced with minimal tools
(chainsaw and a truck) and using skills already present in every forested Alaska community. Supply has not
been an issue in the communities where cordwood systems have been installed.
Southeast Alaska Energy Update and Profile McDowell Group, Inc. Page 26
In addition to often being lower in price compared to fuel oil, other benefits of all three types of biomass fuel
include increased price stability, as the market is not subject to the wild swings seen in the global oil market.
An increase in energy expenditures remaining in the Southeast economy, rather than being spent to purchase
imported fossil fuels, also creates local jobs and strengthens the Southeast Alaska’s economy.
On the other hand, biomass systems typically require an increased time commitment to handle fuel and oversee
boiler operations, as well as increased capital costs compared to other options. When considering a biomass
system, careful consideration needs to be made as to whether the disadvantages outweigh the benefits. Despite
these challenges, the cost savings and demonstrated community interest suggests that continued growth of
the biomass space heating sector can be expected in Southeast Alaska.
Electric Heat
When oil prices increased significantly in 2008 and again in 2010 and 2011, many customers in areas with low-
cost hydroelectric generation converted to electric resistance heat. These conversions significantly increased
electric loads, consuming excess hydro generation resources and, in some cases, resulted in the operation of
backup diesel generation during low water periods. The significant increase in electric loads also often strains
other parts of the utility system, including transformer capacity.
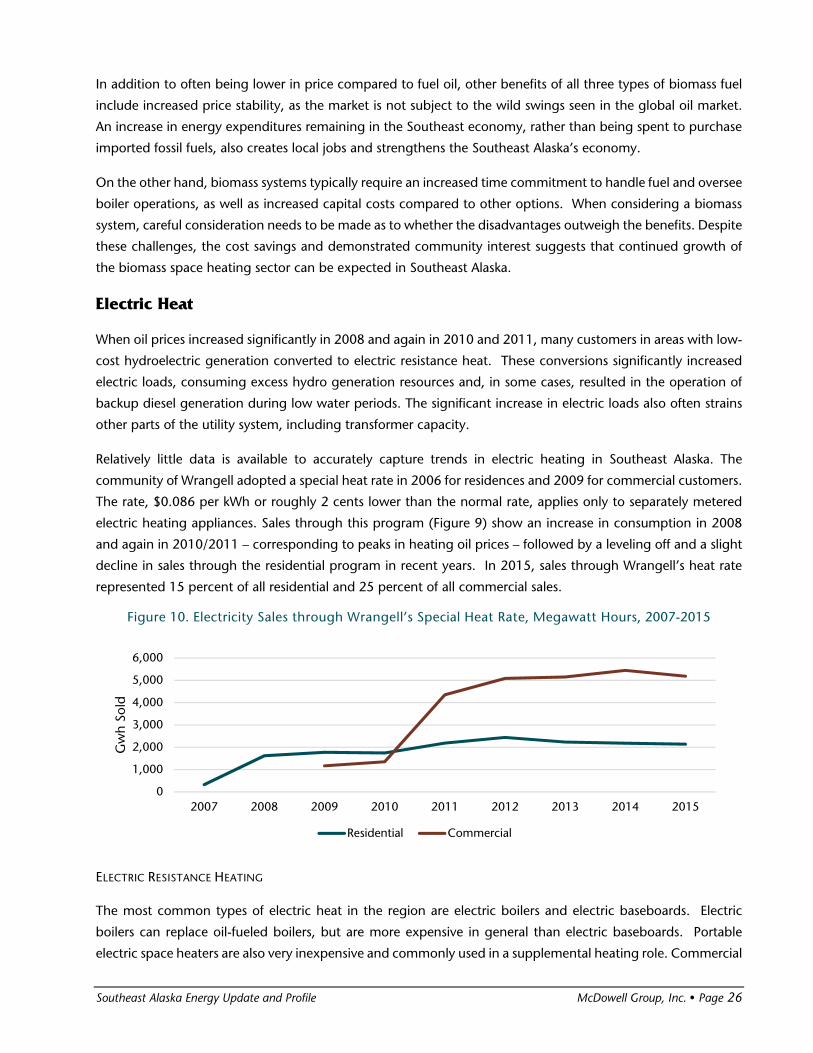
Relatively little data is available to accurately capture trends in electric heating in Southeast Alaska. The
community of Wrangell adopted a special heat rate in 2006 for residences and 2009 for commercial customers.
The rate, $0.086 per kWh or roughly 2 cents lower than the normal rate, applies only to separately metered
electric heating appliances. Sales through this program (Figure 9) show an increase in consumption in 2008
and again in 2010/2011 – corresponding to peaks in heating oil prices – followed by a leveling off and a slight
decline in sales through the residential program in recent years. In 2015, sales through Wrangell’s heat rate
represented 15 percent of all residential and 25 percent of all commercial sales.
Figure 10. Electricity Sales through Wrangell’s Special Heat Rate, Megawatt Hours, 2007-2015
ELECTRIC RESISTANCE HEATING
The most common types of electric heat in the region are electric boilers and electric baseboards. Electric
boilers can replace oil-fueled boilers, but are more expensive in general than electric baseboards. Portable
electric space heaters are also very inexpensive and commonly used in a supplemental heating role. Commercial
0
1,000
2,000
3,000
4,000
5,000
6,000
2007 2008 2009 2010 2011 2012 2013 2014 2015
Gw
h So
ld
Residential Commercial

Southeast Alaska Energy Update and Profile McDowell Group, Inc. Page 27
businesses are more likely use to an electric boiler, though the penetration of electric heat with commercial
customers is generally quite a bit lower than for residential customers, according to the 2012 Southeast IRP.
HEAT PUMPS
A third, and increasingly popular, electric heating option is a heat pump. The 2012 Southeast IRP described
these systems as follows: “Typical air source heat pump systems lose efficiency rapidly at temperatures below
30˚ F. Heat pump systems that operate in a heating only mode are now being developed that can operate
efficiently down to 0˚ F.”
Since the preparation of the SE IRP, air source heat pump (ASHP) technology has improved and received
widespread attention from heating and air conditioning service providers, consumers, and researchers. A 2013
report by the Cold Climate Housing Research Center (CCHRC) concluded that “ASHPs are appropriate for
consideration in Southeast Alaska because of recent improvements in technology, favorable climatic conditions,
and relatively inexpensive electricity.”3F
4
Relying on interviews with utility managers and others, the CCRC estimated that at least 135 residential and
25 commercial air source heat pump systems had been installed in Southeast Alaska (and 210 throughout the
state) by 2013. Recent research indicates at least 500 air source heat pumps have been installed in Alaska, and
finds that nearly all heat pumps users report satisfaction with their systems.4F
5
Starting in early 2012, the City and Borough of Sitka offered a $1,500 incentive for homeowners heating solely
with electricity to switch to an air source heat pump. A total of 40 rebates were provided over the one-year
life of the program.5F
6 In 2013, Sitka’s utility manager estimated 80 air source heat pumps had been installed in
the community, and that over 90 percent of these were heat pumps designed to heat single rooms, known as
mini-splits.6F
7
AEL&P in Juneau has offered a heat pump rate since the early 1980’s – currently set at $0.051 per kWh and
available to residences that do not use any resistance electric heat. Data provided by the utility indicates that
sales through this program grew 116 percent in the last seven years, from 165 MWh in 2008 to 359 MWh in
2015.
Roughly 20 Juneau households currently utilize AEL&P’s heat pump rate – a fraction of all heat pumps installed
in Juneau. According to a 2016 article in the Capital City Weekly, installers report at least 150 residential air
source heat pumps have been installed in Juneau over the last two years alone. 7F
8 In addition, recent commercial
installations in Juneau include ground source heat pumps at the Dimond Park Aquatic Center, Juneau’s airport
terminal, the Auke Bay School, the Johnson Youth Center, and the Forestry Sciences Laboratory – as well as air
source heat pumps at the IGA Foodland and a sea water heat pump at the Ted Stevens Marine Research
Institute, among others.
4 Cold Climate Housing Research Center. (2013). Air Source Heat Pumps in Southeast Alaska. 5 Cold Climate Housing Research Center. (2015). Air Source Heat Pump Potential in Alaska. 6 Agne, J. (2013). Energy Star Rebate Program. Sitka, AK: City and Borough of Sitka. 7 Cold Climate Housing Research Center. (2013). Air Source Heat Pumps in Southeast Alaska. 8 Juneau’s heating revolution, April 6, 2016, Capital City Weekly. http://juneauempire.com/art/2016-04-06-13.

Southeast Alaska Energy Update and Profile McDowell Group, Inc. Page 28
Natural Gas
In 2014, Avista Corporation purchased Juneau’s electric utility, AEL&P, and began discussing possible delivery
of natural gas within Southeast Alaska. Avista Corporation, based in Spokane, Washington, currently serves
roughly 369,000 electric customers and 329,000 natural gas customers in Washington, Oregon, and Idaho.
The corporation has proposed shipping liquefied natural gas (LNG) to Southeast Alaska, primarily to serve
heating loads in the Juneau area, but also to replace diesel fuel used to generate electricity at major industrial
customers, small communities throughout the region, and in Juneau. AEL&P is currently installing a backup
generator capable of running on diesel or natural gas; it is expected to come online in Fall 2016.
Natural gas is currently quite a bit cheaper per unit of thermal energy than diesel fuel on global markets, though
the price spread between these two commodities has declined in recent years. Delivered costs of natural gas
would also depend on LNG capacity, shipping costs, economies of scale, and permitting issues. LNG would be
regasified in Juneau and delivered via a system of pipelines built out over time to buildings throughout the
town’s major population centers. The potential rate of conversion to natural gas by Juneau’s residential and
commercial space heating consumers is a major factor in the economies of scale available to this effort.
Avista’s proposal has the potential to bring considerable savings and economic development to Juneau and
Southeast Alaska. Based on market conditions in the Fall of 2014, McDowell Group estimated economic impacts
in Juneau alone would include $5-15 million in annual savings for space heating consumers, creation of 60-180
new jobs as a result of these savings, and dozens of construction jobs (90 in year 1 of build out, followed by 20
jobs in years 2-10).8F
9
In September 2015, Avista officials indicated that natural gas shipments to Juneau would originate in British
Columbia.
Efforts to develop Alaska’s natural gas resources are a major focus for the State of Alaska. The Alaska Legislature
directed the Alaska Energy Authority to prepare a plan and recommendations on infrastructure needed to
deliver affordable energy to areas of the state that will not have direct access to the proposed North Slope
natural gas pipeline. This effort is known as the Alaska Affordable Energy Strategy (AkAES), and includes a study
of the viability of shipping LNG to the other parts of the state. Results and recommendations from the AkAES
are required to be delivered to the legislature no later than January 1, 2017.
9 These numbers are pulled from a presentation delivered to City and Borough of Juneau Assembly, retrieved online June, 2016: packet.cbjak.org/AttachmentViewer.ashx?AttachmentID=3639&ItemID=2009

Southeast Alaska Energy Update and Profile McDowell Group, Inc. Page 29
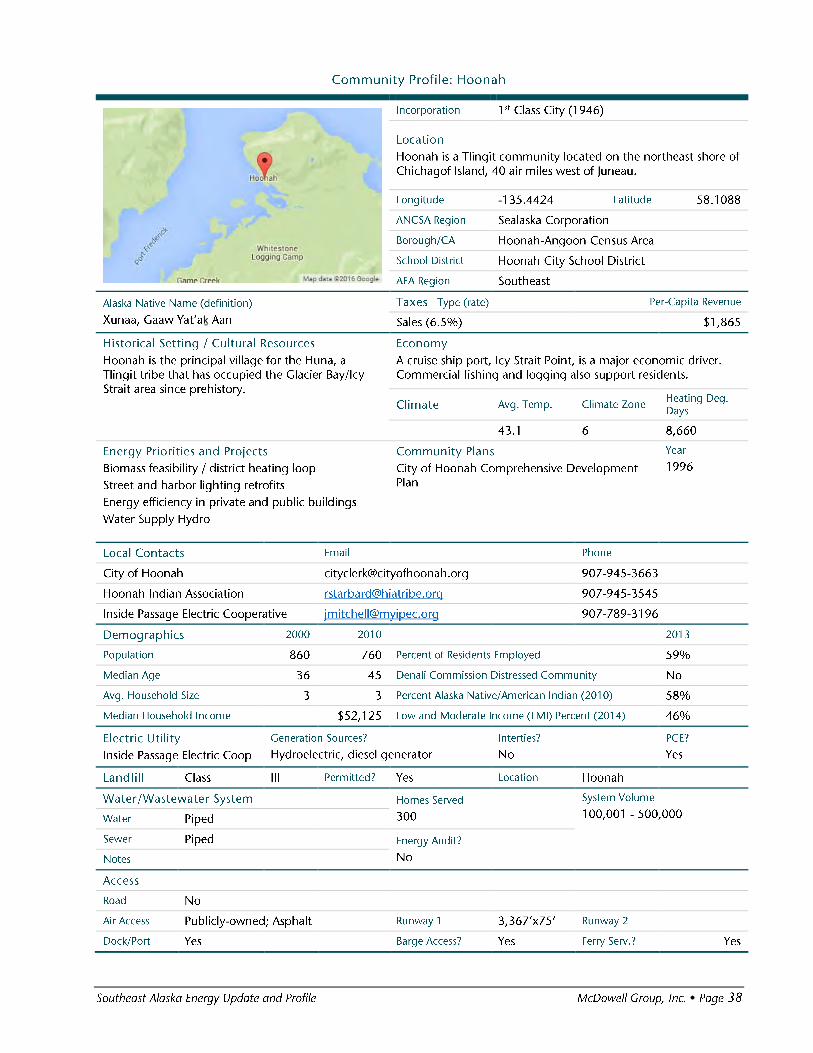
Community Energy Profiles
The following two-part profiles provide a snapshot of each community in Southeast Alaska (excluding the
smallest communities that lack a central electric utility).
A community profile provides a very brief overview of each town, including type of local government, date
incorporated, location, economy, historical and cultural resources, demographics, and key contacts. These
overview profiles are intended to provide context and not to provide a comprehensive description of each
community. This is a template offered to communities, and the region, to be kept current during ongoing
planning efforts.
Additionally, an energy profile provides available electricity production and sales data, along with information
on fuel prices, a partial inventory of non-residential buildings in the community, participation in state and
federal energy efficiency programs, and a mention of key energy projects going on or recently completed in
each community.
Though based on the latest available data from state and federal sources, not all information is accurate due to
sampling errors and data gaps. Draft versions of the community and energy profiles were emailed to the utility
manager, city clerk/borough manager, and local tribe in each community in May 2016. The profiles in this
report incorporate edits and additional information received. These profiles, and this report in general, should
be considered a work in progress, and would benefit from additional review and input.
Additional Resources
A variety of additional resources are available for energy planning and implementation in Alaska.
The Alaska Energy Authority’s Community Assistance program provides hands-on assistance in developing
energy projects and addressing local issues. In addition, a number of studies are currently ongoing as part of
the the Alaska Affordable Energy Strategy (AkAES). The AkAES is a state-directed effort to help provide
affordable energy to all areas of the state if a natural gas pipeline is built from Alaska’s North Slope. A set of
recommendations will be delivered to the Alaska Legislature in 2017.
In addition to providing valuable information, the AkAES could also provide a future funding mechanism for
energy infrastructure in areas of the state without direct access to a North Slope natural gas pipeline. More
information on the AkAES can be found at: http://www.akenergyauthority.org/Policy/AffordableEnergy.
Another important resource is the U.S. Department of Energy’s (DOE) Office of Indian Energy’s energy
planning handbook.9F
10 Rapid response technical assistance is also available for Alaska Native villages through
the DOE (http://www.nrel.gov/tech_deployment/tech_assistance_tribes.html).
The DOE, Office of Indian Energy recently released a document titled “Sustainable Energy Solutions for
Alaskans” that provides a number of energy recommendations for Alaska’s remote communities.10F
11
10 Available at http://energy.gov/indianenergy/downloads/alaska-strategic-energy-plan-and-planning-handbook. 11 Available at http://energy.gov/articles/energy-department-announces-technical-assistance-self-sufficiency-and-lower-energy-costs.

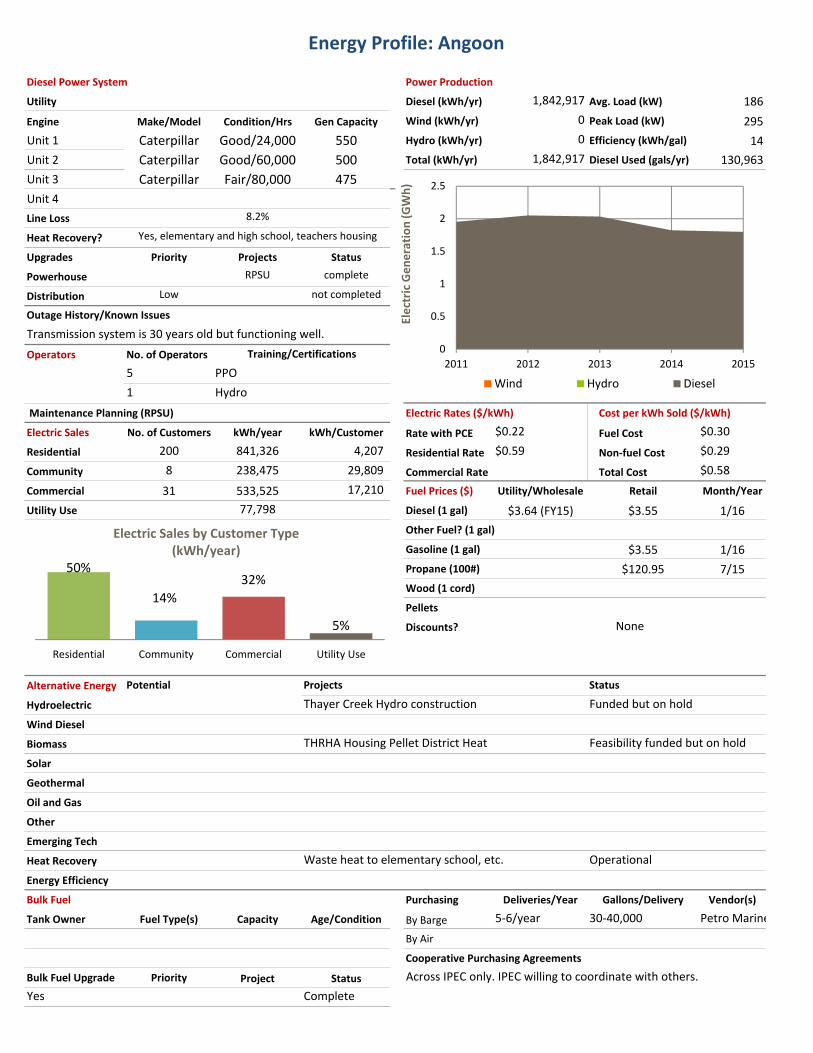
Energy Profile: Angoon
Diesel Power System Power Production
Utility Diesel (kWh/yr) 1,842,917 Avg. Load (kW) 186
Engine Make/Model Condition/Hrs Gen Capacity Wind (kWh/yr) 0 Peak Load (kW) 295
Unit 1 Caterpillar Good/24,000 550 Hydro (kWh/yr) 0 Efficiency (kWh/gal) 14
Unit 2 Caterpillar Good/60,000 500 Total (kWh/yr) 1,842,917 Diesel Used (gals/yr) 130,963
Unit 3 Caterpillar Fair/80,000 475
Unit 4
Line Loss
Heat Recovery?
Upgrades Priority Projects Status
Powerhouse RPSU complete
Distribution Low not completed
Operators No. of Operators
5
1
Maintenance Planning (RPSU) Electric Rates ($/kWh) Cost per kWh Sold ($/kWh)
Electric Sales No. of Customers kWh/year kWh/Customer Rate with PCE $0.22 Fuel Cost $0.30
Residential 200 841,326 4,207 Residential Rate $0.59 Non‐fuel Cost $0.29
Community 8 238,475 29,809 Commercial Rate Total Cost $0.58
Commercial 31 533,525 17,210 Fuel Prices ($) Utility/Wholesale Retail Month/Year
Utility Use 77,798 Diesel (1 gal) $3.64 (FY15) $3.55 1/16
Other Fuel? (1 gal)
Gasoline (1 gal) $3.55 1/16
Propane (100#) $120.95 7/15
Wood (1 cord)
Pellets
Discounts?
Alternative Energy
Hydroelectric
Wind Diesel
Biomass
Solar
Geothermal
Oil and Gas
Other
Emerging Tech
Heat Recovery
Energy Efficiency
Bulk Fuel Purchasing Deliveries/Year Gallons/Delivery Vendor(s)
Tank Owner Fuel Type(s) Capacity Age/Condition By Barge 5‐6/year 30‐40,000 Petro Marine
By Air
Cooperative Purchasing Agreements
Bulk Fuel Upgrade Priority Project Status
Yes Complete
Potential Projects Status
8.2%
Yes, elementary and high school, teachers housing
Outage History/Known Issues
Transmission system is 30 years old but functioning well.
Training/Certifications
PPO
Hydro
None
Thayer Creek Hydro construction Funded but on hold
THRHA Housing Pellet District Heat Feasibility funded but on hold
Across IPEC only. IPEC willing to coordinate with others.
Waste heat to elementary school, etc. Operational
50%
14%
32%
5%
Residential Community Commercial Utility Use
Electric Sales by Customer Type(kWh/year)
0
0.5
1
1.5
2
2.5
2011 2012 2013 2014 2015
Electric Generation (GWh)
Wind Hydro Diesel

Energy Profile: Angoon
Housing Units Occupied Vacant % Owner‐Occup. Regional Housing Authority Weatherization Service Provider
166 85 48%
Housing Need Overcrowded 1‐star Energy Use Average Home Average Avg. EUI
11.4% Energy Rating Square Feet (kBTU/sf)
Data Quality 3 star 1,127 115.1
Lighting Owner Number/Type Retrofitted? Year Notes
63/HPS
Non‐residential Building Inventory
Building Name or Location Year Built Square Feet Audited? Retrofits Done? In ARIS?
Angoon High School 17100*
Angoon Assembly of God 1020*
Angoon Senior Center 3500*
Angoon Medical Clinic 5500*
Angoon Post Office 1960*
Angoon Tribal Center 3000*
Old Health Clinic 1240*
Power Plant 1120*
Sewer Treatment 1100*
Teacher's Quarters 2810*
Angoon Elementary School 11400*
Church 1400*
Café 510*
AK. Native Brotherhood Hall 4400*
Police Department 1700*
Village Café 650*
The Salvation Army 2400*
Russian Orthodox Church 910*
IGA Cold Storage 600*
Angoon Trading Post 4100*
Chatham School Dist. Offices 3400*
Kootznoowoo, Inc./U.S.F.S 3200*
Raven Beaver Lodge 1360*
Old Tribal Center 1550*
Museum 1020*
City Shop 2790*
38
8 2 8
81 75
318
Earlier 1940s 1950s 1960s 1970s 1980s 1990s 2000‐11
Age of Housing Stock
55% 8%
36%
Retrofitted BEES Certified Untouched
Energy Efficient Housing Stock
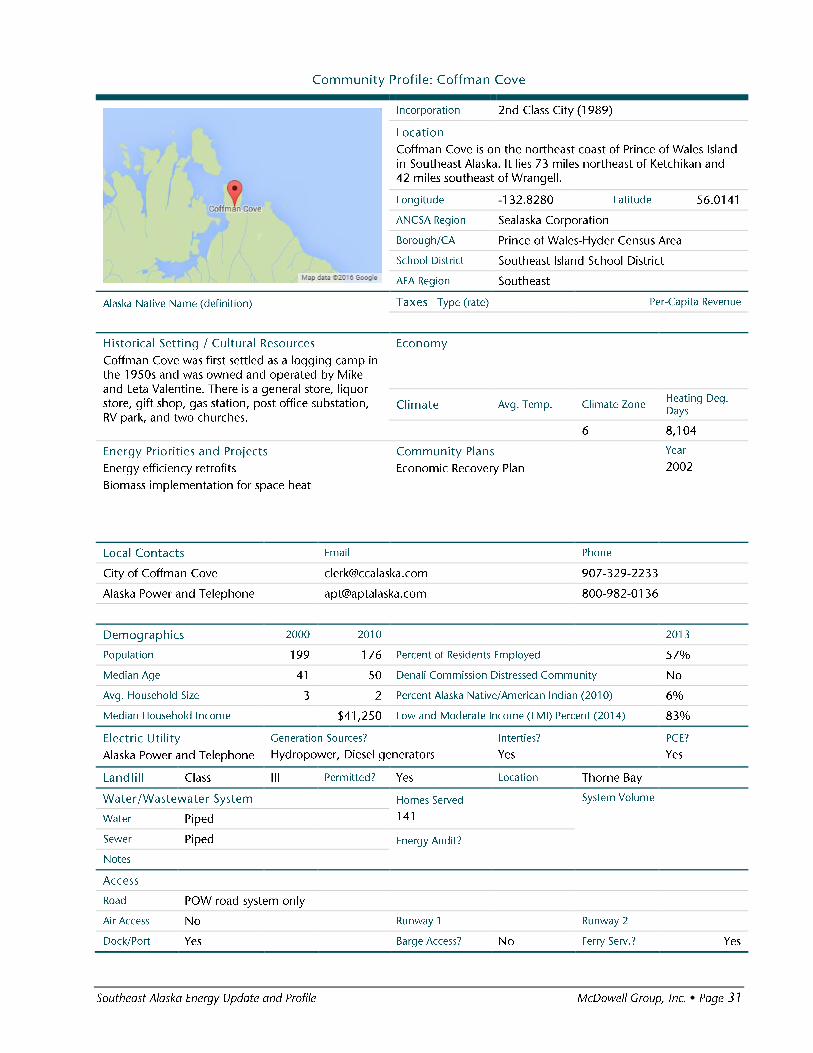

Energy Profile: Coffman Cove
Diesel Power System Power Production
Utility Diesel (kWh/yr) 16,788 Avg. Load (kW)
Engine Make/Model Condition/Hrs Gen Capacity Wind (kWh/yr) 0 Peak Load (kW)
Unit 1 Caterpillar Fair/47,771 330 Hydro (kWh/yr) 0 Efficiency (kWh/gal) 15
Unit 2 Caterpillar Fair/74,493 330 Total (kWh/yr) 16,788 Diesel Used (gals/yr) 1,119
Unit 3
Unit 4
Line Loss
Heat Recovery?
Upgrades Priority Projects Status
Powerhouse RPSU Pending
Distribution
Operators No. of Operators
Maintenance Planning (RPSU) Electric Rates ($/kWh) Cost per kWh Sold ($/kWh)
Electric Sales No. of Customers kWh/year kWh/Customer Rate with PCE $0.22 Fuel Cost
Residential 174 610,149 3,507 Residential Rate $0.26 Non‐fuel Cost
Community 15 92,098 6,140 Commercial Rate Total Cost
Commercial 41 238,822 5,825 Fuel Prices ($) Utility/Wholesale Retail Month/Year
Utility Use 43,176 Diesel (1 gal) $3.76 (FY15) $2.79 1/16
Other Fuel? (1 gal) 1/16
Gasoline (1 gal) $2.77
Propane (100#) $60.48 1/16
Wood (1 cord)
Pellets
Discounts?
Alternative Energy
Hydroelectric
Wind Diesel
Biomass
Solar
Geothermal
Oil and Gas
Other
Emerging Tech
Heat Recovery
Energy Efficiency
Bulk Fuel Purchasing Deliveries/Year Gallons/Delivery Vendor(s)
Tank Owner Fuel Type(s) Capacity Age/Condition By Barge
AP&T Diesel #2 6,000 >20 yrs. By Air
School Diesel #1 1,750 <10 yrs. Cooperative Purchasing Agreements
R&R Fuels Gasoline 5000 total >25 yrs.
Bulk Fuel Upgrade Priority Project Status
Yes Complete
Potential Projects Status
Alaska Power Company
No
Outage History/Known Issues
Training/Certifications
None
Coffman Cove School Biomass Operational
North POW Intertie construction Operating
62%
9%
24%
4%
Residential Community Commercial Utility Use
Electric Sales by Customer Type(kWh/year)
0
0.1
0.2
0.3
0.4
0.5
0.6
0.7
0.8
0.9
2011 2012 2013 2014 2015
Electric Generation (GWh)
Wind Hydro Diesel

Energy Profile: Coffman Cove
Housing Units Occupied Vacant % Owner‐Occup. Regional Housing Authority Weatherization Service Provider
51 54 82%
Housing Need Overcrowded 1‐star Energy Use Average Home Average Avg. EUI
0.0% Energy Rating Square Feet (kBTU/sf)
Data Quality 3 star 1,127 115.1
Lighting Owner Number/Type Retrofitted? Year Notes
25/HPS
24/LED Yes
Non‐residential Building Inventory
Building Name or Location Year Built Square Feet Audited? Retrofits Done? In ARIS?
City Hall 800
City Warehouse / Boiler Room 1,080
Library 1500*
City Storage? NA
School 7,200
Teacher Housing 1,800
Clinic 800
Post Office 312
Ferry Terminal 450*
Baptist Church NA
Gen Set 500*
Fire Hall 1000*
Riggin Shack 784
Rain Country Liquor Store and Doghouse Saloon 1500*
Bunkhouse 2500*
Bait Box Restaurant 500*
Water Treatment Plant 1,200
Laundry/Shower NA
DOT Maintenance Shop NA
Paradise Found Lodge NA
Snow Pass Seafoods 2,450
Weatherbees Lodging ‐ Multiple buildings NA
Harbor Building 625*
Alaskan Lodge and Retreat NA
New Covenant Alliance Church NA
0 08
4
14 17
37
25
Earlier 1940s 1950s 1960s 1970s 1980s 1990s 2000‐11
Age of Housing Stock
8% 2%
90%
Retrofitted BEES Certified Untouched
Energy Efficient Housing Stock

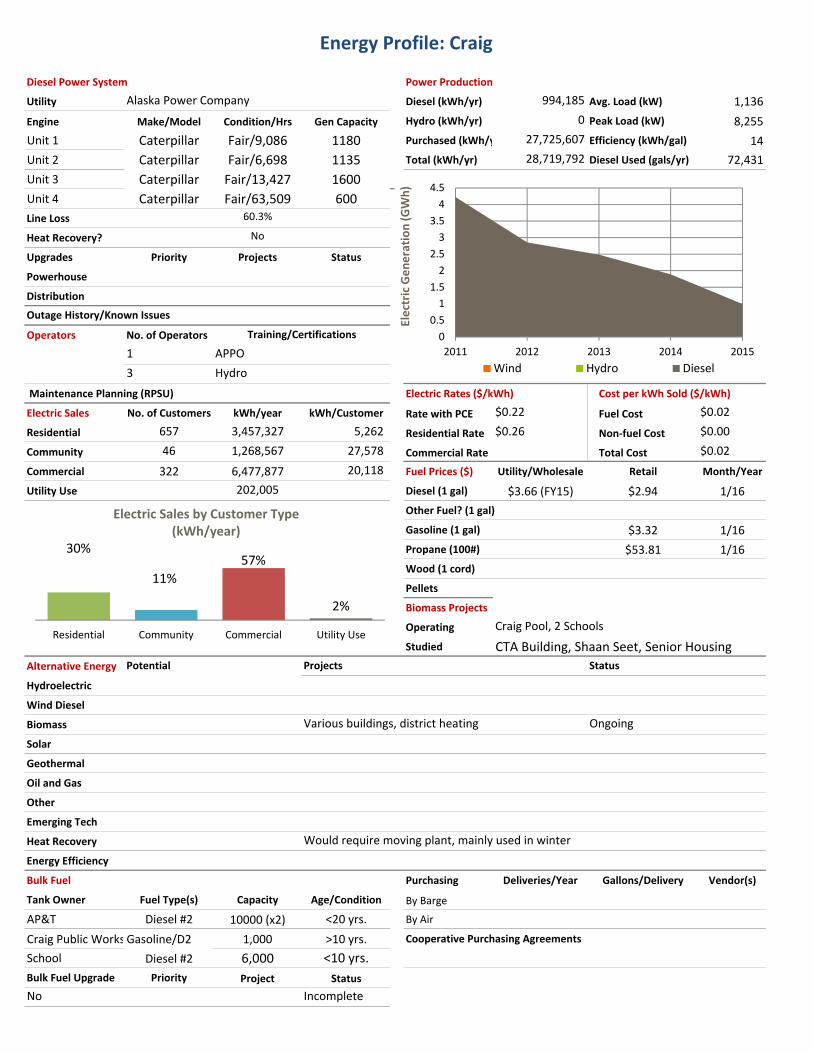
Energy Profile: Craig
Diesel Power System Power Production
Utility Diesel (kWh/yr) 994,185 Avg. Load (kW) 1,136
Engine Make/Model Condition/Hrs Gen Capacity Hydro (kWh/yr) 0 Peak Load (kW) 8,255
Unit 1 Caterpillar Fair/9,086 1180 Purchased (kWh/y 27,725,607 Efficiency (kWh/gal) 14
Unit 2 Caterpillar Fair/6,698 1135 Total (kWh/yr) 28,719,792 Diesel Used (gals/yr) 72,431
Unit 3 Caterpillar Fair/13,427 1600
Unit 4 Caterpillar Fair/63,509 600
Line Loss
Heat Recovery?
Upgrades Priority Projects Status
Powerhouse
Distribution
Operators No. of Operators
1
3
Maintenance Planning (RPSU) Electric Rates ($/kWh) Cost per kWh Sold ($/kWh)
Electric Sales No. of Customers kWh/year kWh/Customer Rate with PCE $0.22 Fuel Cost $0.02
Residential 657 3,457,327 5,262 Residential Rate $0.26 Non‐fuel Cost $0.00
Community 46 1,268,567 27,578 Commercial Rate Total Cost $0.02
Commercial 322 6,477,877 20,118 Fuel Prices ($) Utility/Wholesale Retail Month/Year
Utility Use 202,005 Diesel (1 gal) $3.66 (FY15) $2.94 1/16
Other Fuel? (1 gal)
Gasoline (1 gal) $3.32 1/16
Propane (100#) $53.81 1/16
Wood (1 cord)
Pellets
Biomass Projects
Operating Craig Pool, 2 Schools
Studied CTA Building, Shaan Seet, Senior Housing
Alternative Energy
Hydroelectric
Wind Diesel
Biomass
Solar
Geothermal
Oil and Gas
Other
Emerging Tech
Heat Recovery
Energy Efficiency
Bulk Fuel Purchasing Deliveries/Year Gallons/Delivery Vendor(s)
Tank Owner Fuel Type(s) Capacity Age/Condition By Barge
AP&T Diesel #2 10000 (x2) <20 yrs. By Air
Craig Public WorksGasoline/D2 1,000 >10 yrs. Cooperative Purchasing Agreements
School Diesel #2 6,000 <10 yrs.
Bulk Fuel Upgrade Priority Project Status
No Incomplete
Potential Projects Status
Alaska Power Company
60.3%
No
Outage History/Known Issues
Training/Certifications
APPO
Hydro
Various buildings, district heating Ongoing
Would require moving plant, mainly used in winter
30%
11%
57%
2%
Residential Community Commercial Utility Use
Electric Sales by Customer Type(kWh/year)
0
0.5
1
1.5
2
2.5
3
3.5
4
4.5
2011 2012 2013 2014 2015
Electric Generation (GWh)
Wind Hydro Diesel
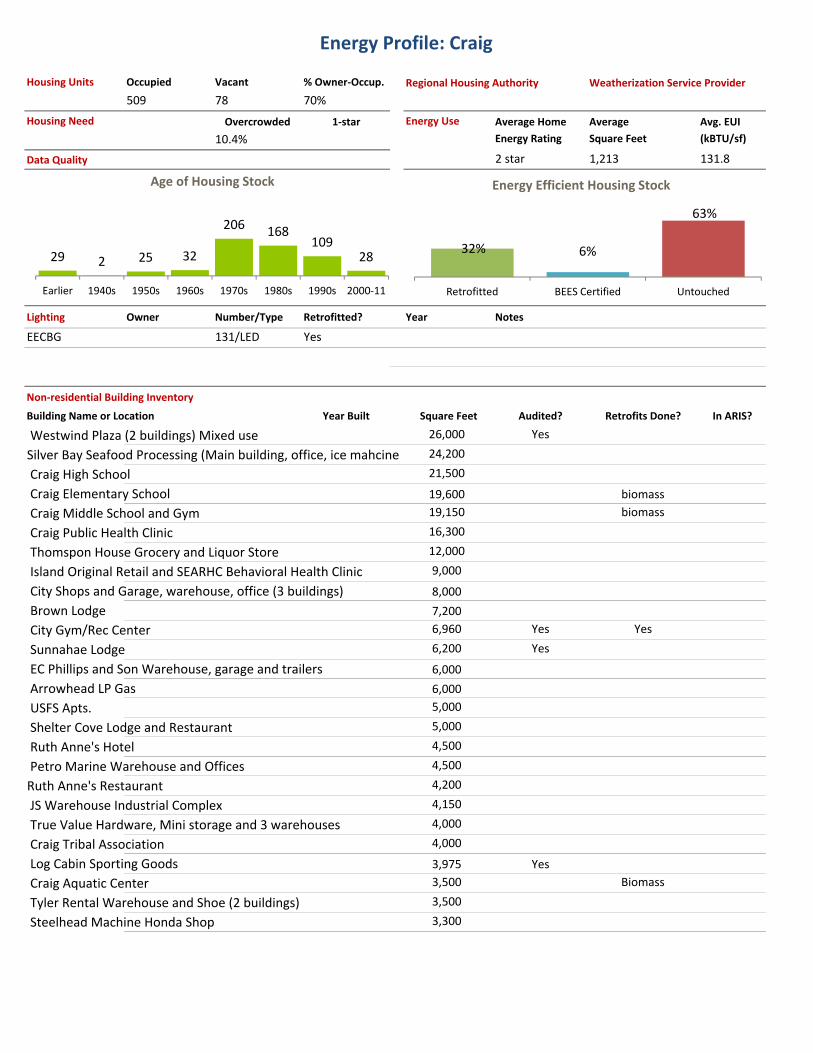
Energy Profile: Craig
Housing Units Occupied Vacant % Owner‐Occup. Regional Housing Authority Weatherization Service Provider
509 78 70%
Housing Need Overcrowded 1‐star Energy Use Average Home Average Avg. EUI
10.4% Energy Rating Square Feet (kBTU/sf)
Data Quality 2 star 1,213 131.8
Lighting Owner Number/Type Retrofitted? Year Notes
EECBG 131/LED Yes
Non‐residential Building Inventory
Building Name or Location Year Built Square Feet Audited? Retrofits Done? In ARIS?
Westwind Plaza (2 buildings) Mixed use 26,000 Yes
Silver Bay Seafood Processing (Main building, office, ice mahcine 24,200
Craig High School 21,500
Craig Elementary School 19,600 biomass
Craig Middle School and Gym 19,150 biomass
Craig Public Health Clinic 16,300
Thomspon House Grocery and Liquor Store 12,000
Island Original Retail and SEARHC Behavioral Health Clinic 9,000
City Shops and Garage, warehouse, office (3 buildings) 8,000
Brown Lodge 7,200
City Gym/Rec Center 6,960 Yes Yes
Sunnahae Lodge 6,200 Yes
EC Phillips and Son Warehouse, garage and trailers 6,000
Arrowhead LP Gas 6,000
USFS Apts. 5,000
Shelter Cove Lodge and Restaurant 5,000
Ruth Anne's Hotel 4,500
Petro Marine Warehouse and Offices 4,500
Ruth Anne's Restaurant 4,200
JS Warehouse Industrial Complex 4,150
True Value Hardware, Mini storage and 3 warehouses 4,000
Craig Tribal Association 4,000
Log Cabin Sporting Goods 3,975 Yes
Craig Aquatic Center 3,500 Biomass
Tyler Rental Warehouse and Shoe (2 buildings) 3,500
Steelhead Machine Honda Shop 3,300
29 2 25 32
206 168109
28
Earlier 1940s 1950s 1960s 1970s 1980s 1990s 2000‐11
Age of Housing Stock
32% 6%
63%
Retrofitted BEES Certified Untouched
Energy Efficient Housing Stock
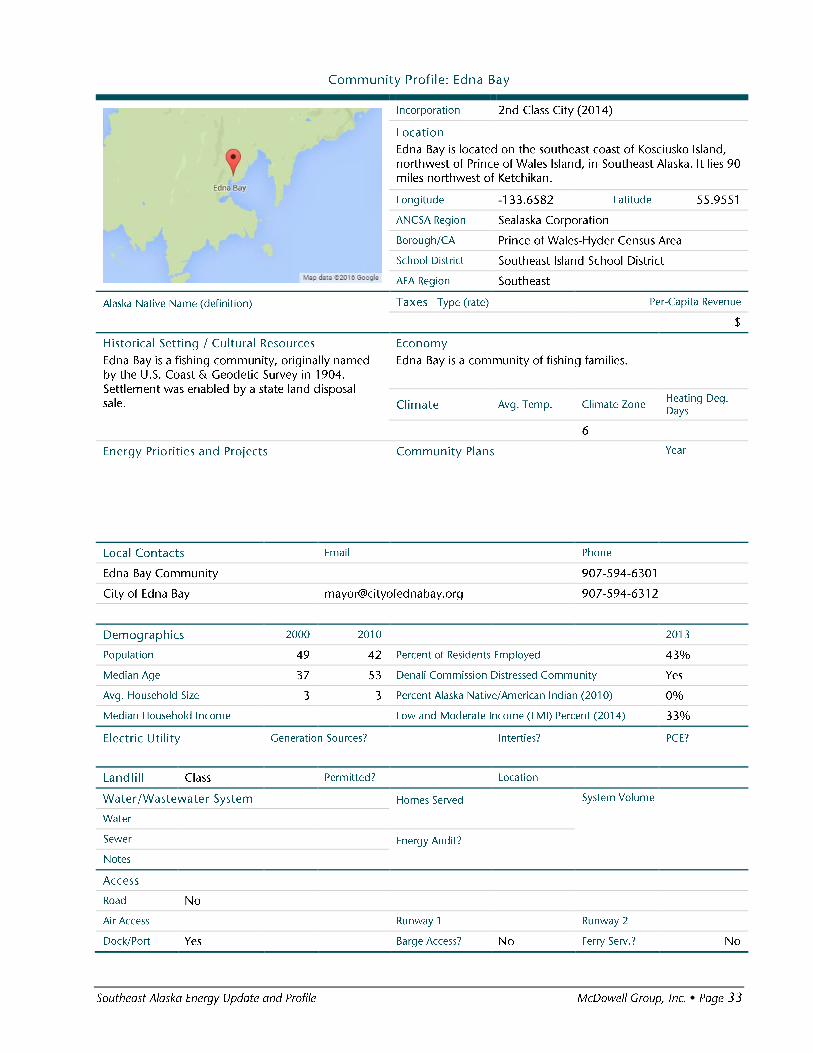

Energy Profile: Edna Bay
Diesel Power System Power Production
Utility Diesel (kWh/yr) Avg. Load (kW)
Engine Make/Model Condition/Hrs Gen Capacity Wind (kWh/yr) Peak Load (kW)
Unit 1 Hydro (kWh/yr) Efficiency (kWh/gal)
Unit 2 Total (kWh/yr) Diesel Used (gals/yr)
Unit 3
Unit 4
Line Loss
Heat Recovery?
Upgrades Projects Status
Powerhouse
Distribution
Operators No. of Operators
2
Maintenance Planning (RPSU) Electric Rates ($/kWh) Cost per kWh Sold ($/kWh)
Electric Sales No. of Customers kWh/year kWh/Customer Rate with PCE Fuel Cost
Residential Residential Rate Non‐fuel Cost
Community Commercial Rate Total Cost
Commercial Fuel Prices ($) Utility/Wholesale Retail Month/Year
Utility Use Diesel (1 gal)
Other Fuel? (1 gal)
Gasoline (1 gal)
Propane (100#)
Wood (1 cord)
Pellets
Discounts?
Alternative Energy
Hydroelectric
Wind Diesel
Biomass
Solar
Geothermal
Oil and Gas
Other
Emerging Tech
Heat Recovery
Energy Efficiency
Bulk Fuel Purchasing Deliveries/Year Gallons/Delivery Vendor(s)
Tank Owner Fuel Type(s) Capacity Age/Condition By Barge
By Air
Cooperative Purchasing Agreements
Bulk Fuel Upgrade Priority Project Status
Yes Phase III In Progress
Potential Projects Status
Yes
Outage History/Known Issues
Training/Certifications
BFO
None
0%
0%
0%
0%
Residential Community Commercial Utility Use
Electric Sales by Customer Type(kWh/year)
0
0.0002
0.0004
0.0006
0.0008
0.001
0.0012
2011 2012 2013 2014 2015
Electric Generation (GWh)
Diesel Hydro Wind

Energy Profile: Edna Bay
Housing Units Occupied Vacant % Owner‐Occup. Regional Housing Authority Weatherization Service Provider
9 12 0%
Housing Need Overcrowded 1‐star Energy Use Average Home Average Avg. EUI
0.0% Energy Rating Square Feet (kBTU/sf)
Data Quality
Lighting Owner Number/Type Retrofitted? Year Notes
Non‐residential Building Inventory
Building Name or Location Year Built Square Feet Audited? Retrofits Done? In ARIS?
Edna Bay Church
Edna Bay Community School 1,584
0 0 0 0 0
129
0
Earlier 1940s 1950s 1960s 1970s 1980s 1990s 2000‐11
Age of Housing Stock
11% 0%
89%
Retrofitted BEES Certified Untouched
Energy Efficient Housing Stock

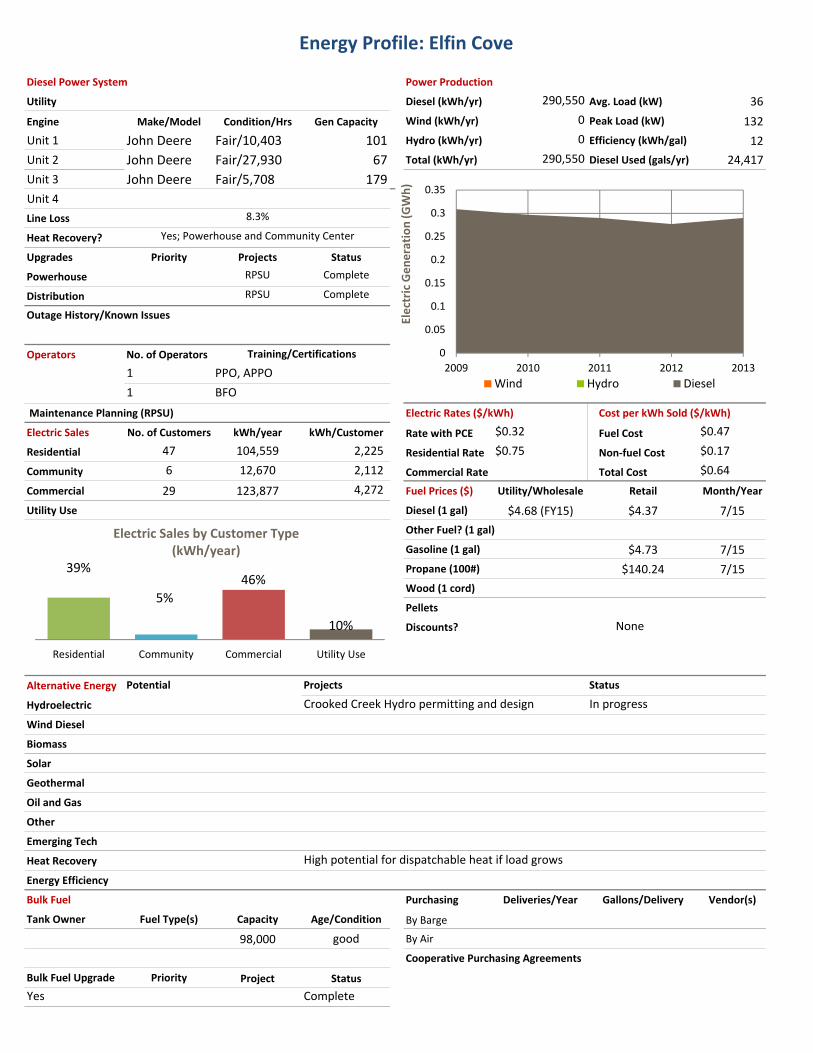
Energy Profile: Elfin Cove
Diesel Power System Power Production
Utility Diesel (kWh/yr) 290,550 Avg. Load (kW) 36
Engine Make/Model Condition/Hrs Gen Capacity Wind (kWh/yr) 0 Peak Load (kW) 132
Unit 1 John Deere Fair/10,403 101 Hydro (kWh/yr) 0 Efficiency (kWh/gal) 12
Unit 2 John Deere Fair/27,930 67 Total (kWh/yr) 290,550 Diesel Used (gals/yr) 24,417
Unit 3 John Deere Fair/5,708 179
Unit 4
Line Loss
Heat Recovery?
Upgrades Priority Projects Status
Powerhouse RPSU Complete
Distribution RPSU Complete
Operators No. of Operators
1
1
Maintenance Planning (RPSU) Electric Rates ($/kWh) Cost per kWh Sold ($/kWh)
Electric Sales No. of Customers kWh/year kWh/Customer Rate with PCE $0.32 Fuel Cost $0.47
Residential 47 104,559 2,225 Residential Rate $0.75 Non‐fuel Cost $0.17
Community 6 12,670 2,112 Commercial Rate Total Cost $0.64
Commercial 29 123,877 4,272 Fuel Prices ($) Utility/Wholesale Retail Month/Year
Utility Use Diesel (1 gal) $4.68 (FY15) $4.37 7/15
Other Fuel? (1 gal)
Gasoline (1 gal) $4.73 7/15
Propane (100#) $140.24 7/15
Wood (1 cord)
Pellets
Discounts?
Alternative Energy
Hydroelectric
Wind Diesel
Biomass
Solar
Geothermal
Oil and Gas
Other
Emerging Tech
Heat Recovery
Energy Efficiency
Bulk Fuel Purchasing Deliveries/Year Gallons/Delivery Vendor(s)
Tank Owner Fuel Type(s) Capacity Age/Condition By Barge
98,000 good By Air
Cooperative Purchasing Agreements
Bulk Fuel Upgrade Priority Project Status
Yes Complete
Potential Projects Status
8.3%
Yes; Powerhouse and Community Center
Outage History/Known Issues
Training/Certifications
PPO, APPO
BFO
None
Crooked Creek Hydro permitting and design In progress
High potential for dispatchable heat if load grows
39%
5%
46%
10%
Residential Community Commercial Utility Use
Electric Sales by Customer Type(kWh/year)
0
0.05
0.1
0.15
0.2
0.25
0.3
0.35
2009 2010 2011 2012 2013
Electric Generation (GWh)
Wind Hydro Diesel

Energy Profile: Elfin Cove
Housing Units Occupied Vacant % Owner‐Occup. Regional Housing Authority Weatherization Service Provider
16 16 38%
Housing Need Overcrowded 1‐star Energy Use Average Home Average Avg. EUI
0.0% Energy Rating Square Feet (kBTU/sf)
Data Quality
Lighting Owner Number/Type Retrofitted? Year Notes
Non‐residential Building Inventory
Building Name or Location Year Built Square Feet Audited? Retrofits Done? In ARIS?
1 3 7 4
27
44
2514
Earlier 1940s 1950s 1960s 1970s 1980s 1990s 2000‐11
Age of Housing Stock
0% 0%
100%
Retrofitted BEES Certified Untouched
Energy Efficient Housing Stock


Energy Profile: Gustavus
Diesel Power System Power Production
Utility Diesel (kWh/yr) 30,719 Avg. Load (kW) 171
Engine Make/Model Condition/Hrs Gen Capacity Wind (kWh/yr) 0 Peak Load (kW) 391
Unit 1 John Deere Good/957 100 Hydro (kWh/yr) 2,051,378 Efficiency (kWh/gal) 15
Unit 2 John Deere Good/8,384 371 Total (kWh/yr) 2,082,097 Diesel Used (gals/yr) 2,087
Unit 3 John Deere Good/7,321 371
Unit 4
Line Loss
Heat Recovery?
Upgrades Priority Projects Status
Powerhouse RPSU Complete
Distribution
Operators No. of Operators
2
Maintenance Planning (RPSU) Electric Rates ($/kWh) Cost per kWh Sold ($/kWh)
Electric Sales No. of Customers kWh/year kWh/Customer Rate with PCE $0.28 Fuel Cost $0.00
Residential 500 1,005,316 2,011 Residential Rate $0.41 Non‐fuel Cost $0.17
Community 5 32,178 6,436 Commercial Rate Total Cost $0.18
Commerc./Non‐PCE 113 677,684 5,997 Fuel Prices ($) Utility/Wholesale Retail Month/Year
Utility Use 48,427 Diesel (1 gal) $4.10 (FY15) $3.58 1/16
Other Fuel? (1 gal)
Gasoline (1 gal) $3.51
Propane (100#) $116.19 7/15
Wood (1 cord)
Pellets
Discounts?
Alternative Energy
Hydroelectric
Wind Diesel
Biomass
Solar
Transmission
Oil and Gas
Other
Emerging Tech
Heat Recovery
Energy Efficiency
Bulk Fuel Purchasing Deliveries/Year Gallons/Delivery Vendor(s)
Tank Owner Fuel Type(s) Capacity Age/Condition By Barge
D1, D2, Gas 159,000 total <5 yrs. By Air
Cooperative Purchasing Agreements
Bulk Fuel Upgrade Priority Project Status
Yes BFU Complete
Potential Projects Status
15.3%
No
Outage History/Known Issues
Training/Certifications
Hydro
None
Falls Creek Hydro construction Operating
Transmission line to Glacier Bay National Park
School nearby but backup power only
57%
2%
38%
3%
Residential Community Commercial Utility Use
Electric Sales by Customer Type(kWh/year)
0
0.5
1
1.5
2
2.5
2011 2012 2013 2014 2015
Electric Generation (GWh)
Wind Hydro Diesel

Energy Profile: Gustavus
Housing Units Occupied Vacant % Owner‐Occup. Regional Housing Authority Weatherization Service Provider
265 201 66%
Housing Need Overcrowded 1‐star Energy Use Average Home Average Avg. EUI
Energy Rating Square Feet (kBTU/sf)
Data Quality 2 star plus 1,427 114.3
Lighting Owner Number/Type Retrofitted? Year Notes
Non‐residential Building Inventory
Building Name or Location Year Built Square Feet Audited? Retrofits Done? In ARIS?
Fire Hall 1300*
City Hall 420*
Clinic 410*
Library 1400*
Gustavus School 5700*
State Shops 3410*
Historic Building 690*
Church
School Gym 4950*
NPS Water Treatment 800*
Preschool/ Post Office 380*
AKDOT Equipment Shed 1900*
Power Plant 2920*
Main Lodge 4700*
Guest Cabins
Staff Dormitories
Lodge Admin
Water Plant
Maintanence Building 13850*
Park HQ Building 1900*
Recycling Center
Community Chest (Reuse center)
8 029 24
99 106147
53
Earlier 1940s 1950s 1960s 1970s 1980s 1990s 2000‐11
Age of Housing Stock
9% 3%
91%
Retrofitted BEES Certified Untouched
Energy Efficient Housing Stock


Energy Profile: Haines
Diesel Power System Power Production
Utility Diesel (kWh/yr) 115,080 Avg. Load (kW) 1,156
Engine Make/Model Condition/Hrs Gen Capacity Hydro (kWh/yr) 0 Peak Load (kW) 2,733
Caterpillar Good/34,698 1,265kw Purchased (kWh/y 14,291,629 Efficiency (kWh/gal) 13
Caterpillar Good/14,457 1,600kw Total (kWh/yr) 14,406,709 Diesel Used (gals/yr) 8,650
Caterpillar Good/39,579 1,833kw
EMP 16‐710 Good/16,615 2,835kw
Line Loss
Heat Recovery?
Upgrades Priority Projects Status
Powerhouse RPSU Pending
Distribution
Operators No. of Operators
3
Maintenance Planning (RPSU) Electric Rates ($/kWh) Cost per kWh Sold ($/kWh)
Electric Sales No. of Customers kWh/year kWh/Customer Rate with PCE $0.22 Fuel Cost
Residential 1,101 5,452,529 4,952 Residential Rate $0.26 Non‐fuel Cost
Community 33 1,019,513 30,894 Commercial Rate Total Cost
Commercial 371 5,711,596 15,395 Fuel Prices ($) Utility/Wholesale Retail Month/Year
Utility Use 296,360 Diesel (1 gal) $3.77 (FY15) $3.03 1/16
Other Fuel? (1 gal)
Gasoline (1 gal) $3.59 1/16
Propane (100#) $113.10 1/16
Wood (1 cord)
Pellets
Discounts?
Alternative Energy
Hydroelectric
Wind Diesel
Biomass
Solar
Geothermal
Oil and Gas
Other
Emerging Tech
Heat Recovery
Energy Efficiency
Bulk Fuel Purchasing Deliveries/Year Gallons/Delivery Vendor(s)
Tank Owner Fuel Type(s) Capacity Age/Condition By Barge
By Air
Cooperative Purchasing Agreements
Bulk Fuel Upgrade Priority Project Status
Potential Projects Status
Alaska Power Company
13.4%
Outage History/Known Issues
Training/Certifications
Hydro
None
Connelly Lake Hydro Prefeasibility
Various wood heat studies and construction Complete and in progress
44%
8%
46%
2%
Residential Community Commercial Utility Use
Electric Sales by Customer Type(kWh/year)
0
0.2
0.4
0.6
0.8
1
1.2
1.4
2011 2012 2013 2014 2015
Electric Generation (GWh)
Wind Hydro Diesel

Energy Profile: Haines
Housing Units Occupied Vacant % Owner‐Occup. Regional Housing Authority Weatherization Service Provider
1176 492 68%
Housing Need Overcrowded 1‐star Energy Use Average Home Average Avg. EUI
Energy Rating Square Feet (kBTU/sf)
Data Quality 2 star 1,511 159
Lighting Owner Number/Type Retrofitted? Year Notes
EECBG 22/LED Yes
Non‐residential Building Inventory
Building Name or Location Year Built Square Feet Audited? Retrofits Done? In ARIS?
Young Rd. Water Tank
Admin Building 3,552
Library 4200*
Museum 6,900
Visitor Center 1,000
Water Treatment Plant 1,000
Public Works Shop
Pool 1,366
Public Safety Building 12,656
FAA Water Tank
Beach Road Pump Station
Sewer Treatment Plant 400
Barnett Pump Station 40
Haines Hwy Pump Station 40
Piedad Shack
Well Field House
Waste Water Treatment Plant 5,950
Senior Center (Yellow Building) 220‐
Fish and Game Office
DOT Maintenance Shop 3,800
Mosquito Lake School 2,800
DNR 415
CIA Office 5,248 Yes
Haines High School/ Elementary School ‐ Need photo 34,000
CIA Subdivision ‐ two duplexes
Voc Tech Building 2,050
626 45
102
290 305420 439
Earlier 1940s 1950s 1960s 1970s 1980s 1990s 2000‐11
Age of Housing Stock
27% 1%
72%
Retrofitted BEES Certified Untouched
Energy Efficient Housing Stock


Energy Profile: Hollis
Diesel Power System Power Production
Utility Diesel (kWh/yr) Avg. Load (kW) 81
Engine Make/Model Condition/Hrs Gen Capacity Wind (kWh/yr) Peak Load (kW)
Unit 1 Caterpillar Fair/510 450 Hydro (kWh/yr) Efficiency (kWh/gal)
Unit 2 Total (kWh/yr) Diesel Used (gals/yr)
Unit 3
Unit 4
Line Loss
Heat Recovery?
Upgrades Priority Projects Status
Powerhouse
Distribution
Operators No. of Operators
Maintenance Planning (RPSU) Electric Rates ($/kWh) Cost per kWh Sold ($/kWh)
Electric Sales No. of Customers kWh/year kWh/Customer Rate with PCE $0.22 Fuel Cost
Residential 126 552,132 4,382 Residential Rate $0.26 Non‐fuel Cost
Community 1 3,647 3,647 Commercial Rate Total Cost
Commer./Non‐PCE 23 302,499 13,152 Fuel Prices ($) Utility/Wholesale Retail Month/Year
Utility Use 6,152 Diesel (1 gal) $2.89 1/16
Other Fuel? (1 gal)
Gasoline (1 gal) $2.77 1/16
Propane (100#) $60.48 1/16
Wood (1 cord)
Pellets
Discounts?
Alternative Energy
Hydroelectric
Wind Diesel
Biomass
Solar
Geothermal
Oil and Gas
Other
Emerging Tech
Heat Recovery
Energy Efficiency
Bulk Fuel Purchasing Deliveries/Year Gallons/Delivery Vendor(s)
Tank Owner Fuel Type(s) Capacity Age/Condition By Barge
AP&T Diesel #2 3,000 ~20 yrs. By Air
Cooperative Purchasing Agreements
Bulk Fuel Upgrade Priority Project Status
No Incomplete
Potential Projects Status
Alaska Power Company
No
Outage History/Known Issues
Training/Certifications
None
Hollis School Biomass feasibility Completed
Backup power only, far from community
64%
0%
35%
1%
Residential Community Commercial Utility Use
Electric Sales by Customer Type(kWh/year)
0
0.0002
0.0004
0.0006
0.0008
0.001
0.0012
2011 2012 2013 2014 2015
Electric Generation (GWh)
Diesel Hydro Wind

Energy Profile: Hollis
Housing Units Occupied Vacant % Owner‐Occup. Regional Housing Authority Weatherization Service Provider
65 22 57%
Housing Need Overcrowded 1‐star Energy Use Average Home Average Avg. EUI
24.6% Energy Rating Square Feet (kBTU/sf)
Data Quality 2 star 1,133 141.8
Lighting Owner Number/Type Retrofitted? Year Notes
21/HPS
Non‐residential Building Inventory
Building Name or Location Year Built Square Feet Audited? Retrofits Done? In ARIS?
0 07
1 1
42 38
4
Earlier 1940s 1950s 1960s 1970s 1980s 1990s 2000‐11
Age of Housing Stock
18% 2%
80%
Retrofitted BEES Certified Untouched
Energy Efficient Housing Stock
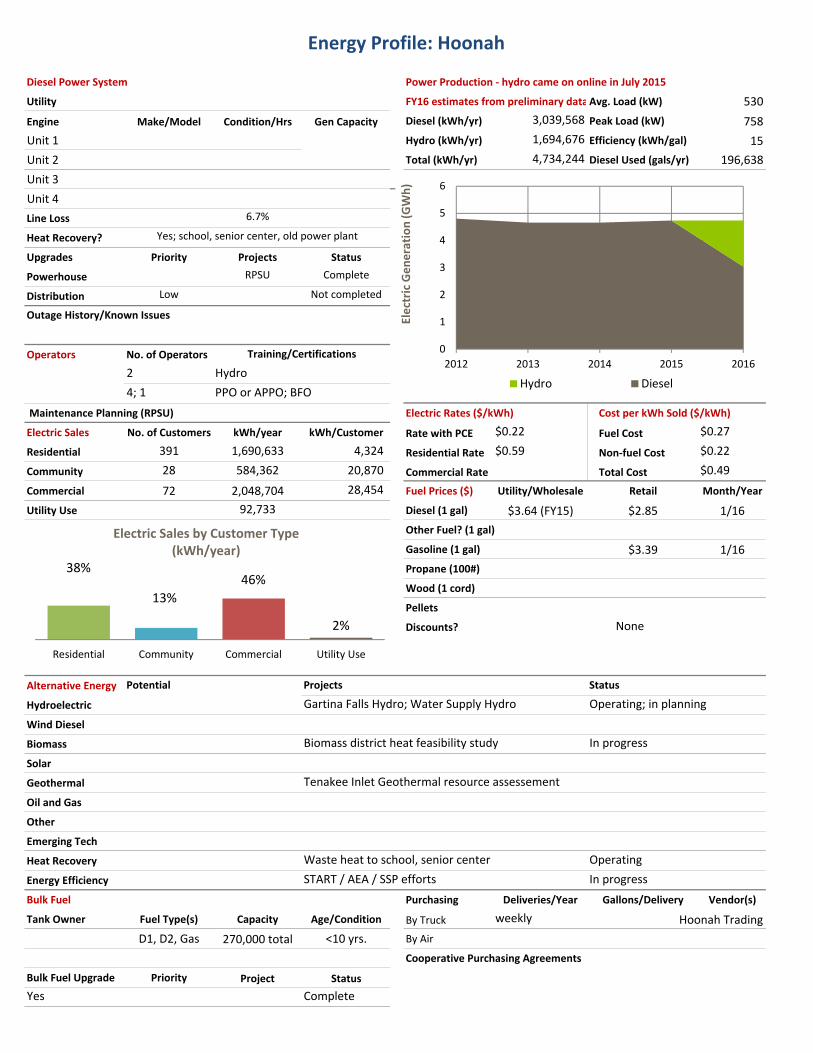
Energy Profile: Hoonah
Diesel Power System Power Production ‐ hydro came on online in July 2015
Utility FY16 estimates from preliminary dataAvg. Load (kW) 530
Engine Make/Model Condition/Hrs Gen Capacity Diesel (kWh/yr) 3,039,568 Peak Load (kW) 758
Unit 1 Hydro (kWh/yr) 1,694,676 Efficiency (kWh/gal) 15
Unit 2 Total (kWh/yr) 4,734,244 Diesel Used (gals/yr) 196,638
Unit 3
Unit 4
Line Loss
Heat Recovery?
Upgrades Priority Projects Status
Powerhouse RPSU Complete
Distribution Low Not completed
Operators No. of Operators
2
4; 1
Maintenance Planning (RPSU) Electric Rates ($/kWh) Cost per kWh Sold ($/kWh)
Electric Sales No. of Customers kWh/year kWh/Customer Rate with PCE $0.22 Fuel Cost $0.27
Residential 391 1,690,633 4,324 Residential Rate $0.59 Non‐fuel Cost $0.22
Community 28 584,362 20,870 Commercial Rate Total Cost $0.49
Commercial 72 2,048,704 28,454 Fuel Prices ($) Utility/Wholesale Retail Month/Year
Utility Use 92,733 Diesel (1 gal) $3.64 (FY15) $2.85 1/16
Other Fuel? (1 gal)
Gasoline (1 gal) $3.39 1/16
Propane (100#)
Wood (1 cord)
Pellets
Discounts?
Alternative Energy
Hydroelectric
Wind Diesel
Biomass
Solar
Geothermal
Oil and Gas
Other
Emerging Tech
Heat Recovery
Energy Efficiency
Bulk Fuel Purchasing Deliveries/Year Gallons/Delivery Vendor(s)
Tank Owner Fuel Type(s) Capacity Age/Condition By Truck weekly Hoonah Trading
D1, D2, Gas 270,000 total <10 yrs. By Air
Cooperative Purchasing Agreements
Bulk Fuel Upgrade Priority Project Status
Yes Complete
Potential Projects Status
6.7%
Yes; school, senior center, old power plant
Outage History/Known Issues
Training/Certifications
Hydro
PPO or APPO; BFO
None
Gartina Falls Hydro; Water Supply Hydro Operating; in planning
Biomass district heat feasibility study In progress
Tenakee Inlet Geothermal resource assessement
Waste heat to school, senior center Operating
START / AEA / SSP efforts In progress
38%
13%
46%
2%
Residential Community Commercial Utility Use
Electric Sales by Customer Type(kWh/year)
0
1
2
3
4
5
6
2012 2013 2014 2015 2016
Electric Generation (GWh)
Hydro Diesel
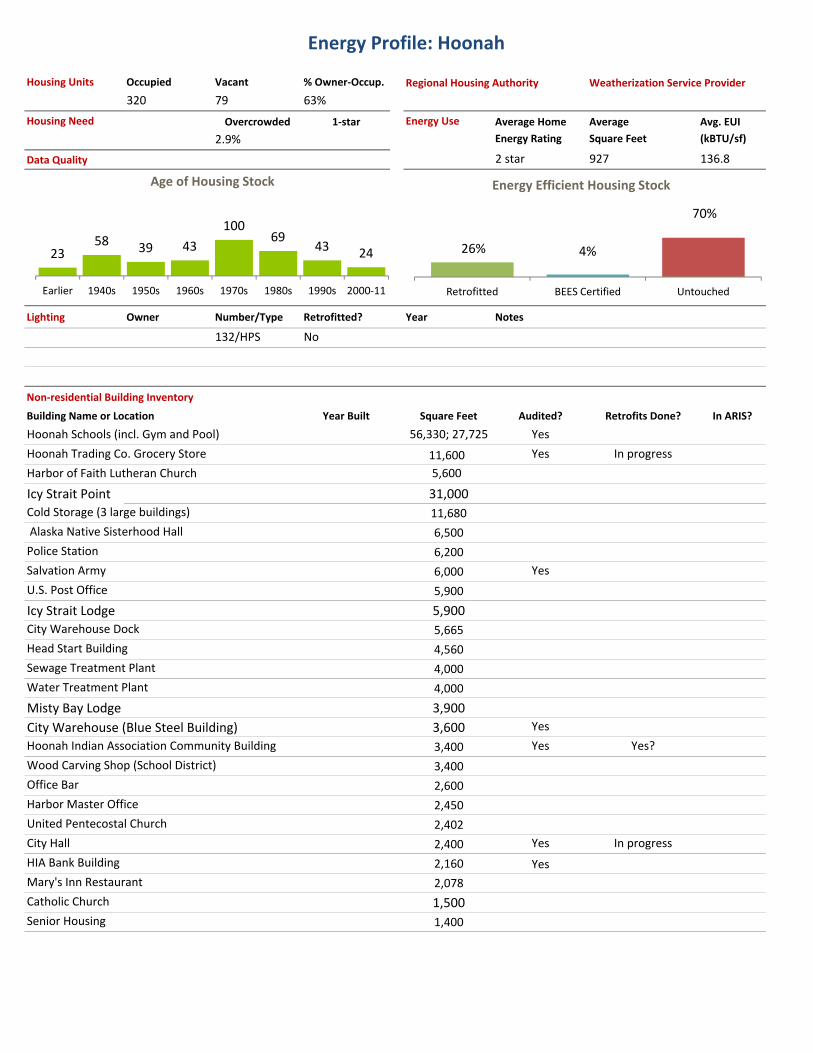
Energy Profile: Hoonah
Housing Units Occupied Vacant % Owner‐Occup. Regional Housing Authority Weatherization Service Provider
320 79 63%
Housing Need Overcrowded 1‐star Energy Use Average Home Average Avg. EUI
2.9% Energy Rating Square Feet (kBTU/sf)
Data Quality 2 star 927 136.8
Lighting Owner Number/Type Retrofitted? Year Notes
132/HPS No
Non‐residential Building Inventory
Building Name or Location Year Built Square Feet Audited? Retrofits Done? In ARIS?
Hoonah Schools (incl. Gym and Pool) 56,330; 27,725 Yes
Hoonah Trading Co. Grocery Store 11,600 Yes In progress
Harbor of Faith Lutheran Church 5,600
Icy Strait Point 31,000
Cold Storage (3 large buildings) 11,680
Alaska Native Sisterhood Hall 6,500
Police Station 6,200
Salvation Army 6,000 Yes
U.S. Post Office 5,900
Icy Strait Lodge 5,900
City Warehouse Dock 5,665
Head Start Building 4,560
Sewage Treatment Plant 4,000
Water Treatment Plant 4,000
Misty Bay Lodge 3,900
City Warehouse (Blue Steel Building) 3,600 Yes
Hoonah Indian Association Community Building 3,400 Yes Yes?
Wood Carving Shop (School District) 3,400
Office Bar 2,600
Harbor Master Office 2,450
United Pentecostal Church 2,402
City Hall 2,400 Yes In progress
HIA Bank Building 2,160 Yes
Mary's Inn Restaurant 2,078
Catholic Church 1,500
Senior Housing 1,400
2358 39 43
10069
43 24
Earlier 1940s 1950s 1960s 1970s 1980s 1990s 2000‐11
Age of Housing Stock
26% 4%
70%
Retrofitted BEES Certified Untouched
Energy Efficient Housing Stock
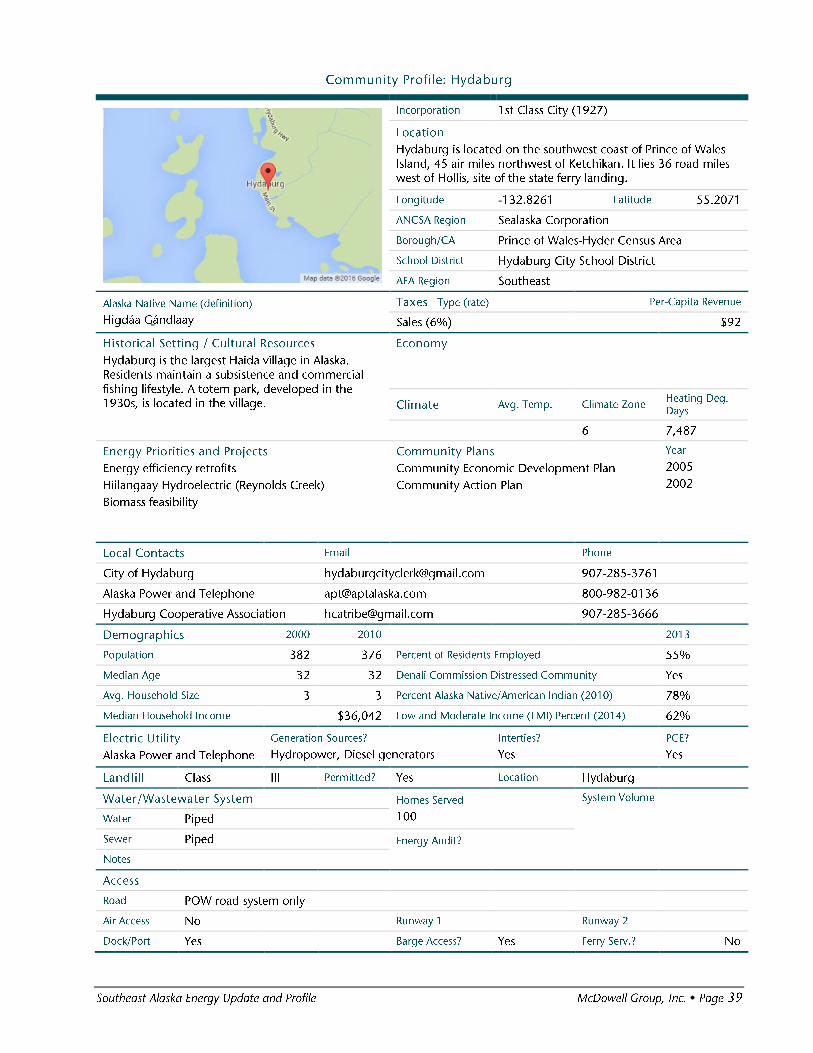

Energy Profile: Hydaburg
Diesel Power System Power Production
Utility Diesel (kWh/yr) 0 Avg. Load (kW)
Engine Make/Model Condition/Hrs Gen Capacity Wind (kWh/yr) 0 Peak Load (kW)
Unit 1 Caterpillar Fair/105,003 330 Hydro (kWh/yr) 0 Efficiency (kWh/gal)
Unit 2 Caterpillar Fair/112 315 Total (kWh/yr) 0 Diesel Used (gals/yr)
Unit 3 Caterpillar Fair/149,010 560
Unit 4
Line Loss
Heat Recovery?
Upgrades Priority Projects Status
Powerhouse
Distribution
Operators No. of Operators
Maintenance Planning (RPSU) Electric Rates ($/kWh) Cost per kWh Sold ($/kWh)
Electric Sales No. of Customers kWh/year kWh/Customer Rate with PCE $0.22 Fuel Cost
Residential 129 755,496 5,857 Residential Rate $0.26 Non‐fuel Cost
Community 11 75,520 6,865 Commercial Rate Total Cost
Commercial 43 493,548 11,478 Fuel Prices ($) Utility/Wholesale Retail Month/Year
Utility Use 19,139 Diesel (1 gal) $3.07 1/16
Other Fuel? (1 gal) $2.77 1/16
Gasoline (1 gal)
Propane (100#) $64.05
Wood (1 cord)
Pellets
Discounts?
Alternative Energy
Hydroelectric
Wind Diesel
Biomass
Solar
Heat Pumps
Oil and Gas
Other
Emerging Tech
Heat Recovery
Energy Efficiency
Bulk Fuel Purchasing Deliveries/Year Gallons/Delivery Vendor(s)
Tank Owner Fuel Type(s) Capacity Age/Condition By Barge
AP&T Diesel #2 10,000 ~20 yrs. By Air
Hyd Coop Assn D2, Gasoline 14000 total ~1 yr. Cooperative Purchasing Agreements
Bulk Fuel Upgrade Priority Project Status
No Incomplete
Potential Projects Status
Alaska Power Company
No
Outage History/Known Issues
Training/Certifications
None
Hiilangaay Hydroelectric (Reynolds Creek) constructionIn progress
Biomass feasibility ‐ school
56%
6%
37%
1%
Residential Community Commercial Utility Use
Electric Sales by Customer Type(kWh/year)
0
0.0002
0.0004
0.0006
0.0008
0.001
0.0012
2011 2012 2013 2014 2015
Electric Generation (GWh)
Diesel Hydro Wind
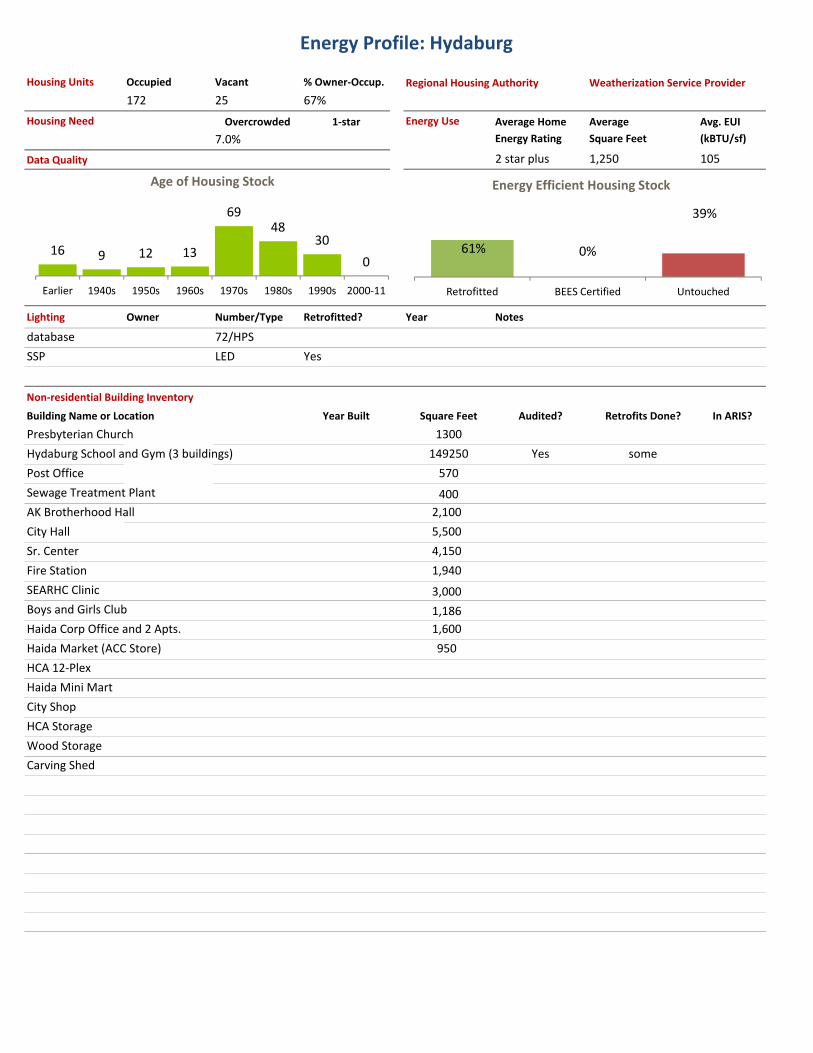
Energy Profile: Hydaburg
Housing Units Occupied Vacant % Owner‐Occup. Regional Housing Authority Weatherization Service Provider
172 25 67%
Housing Need Overcrowded 1‐star Energy Use Average Home Average Avg. EUI
7.0% Energy Rating Square Feet (kBTU/sf)
Data Quality 2 star plus 1,250 105
Lighting Owner Number/Type Retrofitted? Year Notes
database 72/HPS
SSP LED Yes
Non‐residential Building Inventory
Building Name or Location Year Built Square Feet Audited? Retrofits Done? In ARIS?
Presbyterian Church 1300
Hydaburg School and Gym (3 buildings) 149250 Yes some
Post Office 570
Sewage Treatment Plant 400
AK Brotherhood Hall 2,100
City Hall 5,500
Sr. Center 4,150
Fire Station 1,940
SEARHC Clinic 3,000
Boys and Girls Club 1,186
Haida Corp Office and 2 Apts. 1,600
Haida Market (ACC Store) 950
HCA 12‐Plex
Haida Mini Mart
City Shop
HCA Storage
Wood Storage
Carving Shed
16 9 12 13
6948
30
0
Earlier 1940s 1950s 1960s 1970s 1980s 1990s 2000‐11
Age of Housing Stock
61% 0%
39%
Retrofitted BEES Certified Untouched
Energy Efficient Housing Stock


Energy Profile: Juneau
Diesel Power System Power Production
Utility Diesel (kWh/yr) 480,000 Avg. Load (kW) 39,993
Engine Make/Model Condition/Hrs Gen Capacity Purchased Hydro 270,791,000 Peak Load (kW) 76,000
Electo Motive Division diesel (x9) Hydro (kWh/yr) 151,616,000 Efficiency (kWh/gal) 9
Gas Turbine (x2) Total (kWh/yr) 422,887,000 Diesel Used (gals/yr) 53,088
Solar Centaur Gas Turbine
Line Loss
Heat Recovery?
Upgrades Priority Projects Status
Powerhouse
Distribution
Operators No. of Operators
Electric Sales No. of Customers kWh/year kWh/Customer Electric Rates ($/kWh) Cost per kWh Sold ($/kWh)
Residential 14,115 139,150,358 9,858 Rate with PCE n/a Fuel Cost
Government 436 63,252,968 145,076 Residential Rate $0.12 Non‐fuel Cost
Commercial 1,834 112,237,900 61,198 Commercial Rate $0.10 Total Cost
Interruptible/Indus. 2 84,783,325 42,391,663 Fuel Prices ($) Utility/Wholesale Retail Month/Year
Utility Use 4,188,000 Diesel (1 gal) $3.15 1/16
Other Fuel? (1 gal)
Gasoline (1 gal) $3.20 1/16
Propane (100#) $99.05 1/16
Wood (1 cord)
Pellets
Biomass Projects
Operating Sealaska building, Sobeloff Center, THRHA shop
Studied USFS RD and Men. Center, Chapel by the Lake
Alternative Energy
Hydroelectric
Wind Diesel
Biomass
Solar
Other
Emerging Tech
Heat Recovery
Energy Efficiency
Bulk Fuel Purchasing Deliveries/Year Gallons/Delivery Vendor(s)
Tank Owner Fuel Type(s) Capacity Age/Condition By Barge
By Air
Cooperative Purchasing Agreements
Bulk Fuel Upgrade Priority Project Status
mand Side ManagemElectric vehicle, heat pump, off peak rates and hot
water load control program; LED rate scheduleOngoing; in development
Potential Projects Status
Sheep Creek Hydro; Sweetheart Creek Hydro Ongoing
Sealaska Building and various others Complete and ongoing
4.8%
No
Outage History/Known Issues
Training/Certifications
Transmission Line Avalanche Mitigation Complete
Juneau Airport and Aquatic Center Heat Pumps Operating
44%
20%
35%
1%
Residential Community Commercial Utility Use
Electric Sales by Customer Type(kWh/year)
0
50
100
150
200
250
300
350
400
450
2011 2012 2013 2014 2015
Electric Generation (GWh)
Hydro Diesel

Energy Profile: Juneau
Housing Units Occupied Vacant % Owner‐Occup. Regional Housing Authority Weatherization Service Provider
12379 670 64%
Housing Need Overcrowded 1‐star Energy Use Average Home Average Avg. EUI
4.0% 11.0% Energy Rating Square Feet (kBTU/sf)
Data Quality 2 star plus 1,585 117.7
Lighting Owner Number/Type Retrofitted? Year Notes
DOT 592/HPS No
Non‐residential Building Inventory
Building Name or Location Year Built Square Feet Audited? Retrofits Done? In ARIS?
Juneau‐Douglas High School 190,738
Thunder Mountain High School 168,879
Bartlett Hospital 138,908
Marie Drake & Harborview 137,654
Dzantik'i Heeni Middle School 105,000
Lemon Creek Correctional Center 85,088
Juneau Airport 81,334
JS108 ‐ Egan Library and Classroom Wing 80,944
Floyd Dryden Junior High School 75,765
Riverbend Elementary 67,512
Mendenhall River Elementary School 58,669
Bartlett Memorial Hospital 58,069
JS134 ‐ Student Recreation Center 55,415
Dimond Court House Building
State Office Building
Glacier Valley Grade School 52,500
Thane WWTP 50,231
Auke Bay Grade School 48,970
DOT&PF 7‐mile #2513000493 48,100
Gastineau Grade School 45,433
Juneau Pioneer Home 42,444
JS119 ‐ Technical Education Center 36,306
Juneau Police Department 34,822
JS141 ‐ Freshman Residence Hall 34,768
Juneau Airport Terminal 33,086
Treadwell Ice Arena 32,268
1069363
876 1131
37533317
1430 1110
Earlier 1940s 1950s 1960s 1970s 1980s 1990s 2000‐11
Age of Housing Stock
27% 5%
68%
Retrofitted BEES Certified Untouched
Energy Efficient Housing Stock

Ḵ ʼ

Energy Profile: Kake
Diesel Power System Power Production
Utility Diesel (kWh/yr) 2,739,418 Avg. Load (kW) 257
Engine Make/Model Condition/Hrs Gen Capacity Wind (kWh/yr) 0 Peak Load (kW) 776
Unit 1 Caterpillar Fair/100,000 855 Hydro (kWh/yr) 0 Efficiency (kWh/gal) 14
Unit 2 Caterpillar Fair/60,000 1016 Total (kWh/yr) 2,739,418 Diesel Used (gals/yr) 201,609
Unit 3 Caterpillar Fair/35,000 560
Unit 4
Line Loss
Heat Recovery?
Upgrades Priority Projects Status
Powerhouse RPSU In Progress
Distribution Low not completed
Operators No. of Operators
2
1
Maintenance Planning (RPSU) Electric Rates ($/kWh) Cost per kWh Sold ($/kWh)
Electric Sales No. of Customers kWh/year kWh/Customer Rate with PCE $0.22 Fuel Cost $0.31
Residential 223 992,359 4,450 Residential Rate $0.59 Non‐fuel Cost $0.25
Community 16 213,785 13,362 Commercial Rate Total Cost $0.56
Commercial 56 1,173,299 20,952 Fuel Prices ($) Utility/Wholesale Retail Month/Year
Utility Use 82,600 Diesel (1 gal) $3.65 (FY15) $0.68 1‐16
Other Fuel? (1 gal) $3.78 1/16
Gasoline (1 gal)
Propane (100#) $148.57 7/15
Wood (1 cord)
Pellets
Discounts?
Alternative Energy
Hydroelectric
Wind Diesel
Biomass
Solar
Bulk Fuel Upgrade
Oil and Gas
Other
Emerging Tech
Heat Recovery
Energy Efficiency
Bulk Fuel Purchasing Deliveries/Year Gallons/Delivery Vendor(s)
Tank Owner Fuel Type(s) Capacity Age/Condition By Barge 5‐6/year 30‐40,000 Petro Marine
IPEC D2 20,000 (x3) ~20 yrs./fair By Air
Kake Tribal Cooperative Purchasing Agreements
Bulk Fuel Upgrade Priority Project Status
Yes, for Kake Tribal tanks only Phase II In Progress
Potential Projects Status
7.2%
No
Outage History/Known Issues
transmission system is old but functioning well
Training/Certifications
PPO or APPO
BFO
None
Gunnuk Creek design In progress
wood‐fired heating district feasibility In progress
Upgrade of IPEC tanks
Kake‐Petersburg Intertie design and permitting In progress
Across IPEC only. IPEC willing to coordinate with others.
Waste heat to city shop, cold storage, smoker Feasibility study in progress
40%
9%
48%
3%
Residential Community Commercial Utility Use
Electric Sales by Customer Type(kWh/year)
0
0.5
1
1.5
2
2.5
3
3.5
2011 2012 2013 2014 2015
Electric Generation (GWh)
Wind Hydro Diesel

Energy Profile: Kake
Housing Units Occupied Vacant % Owner‐Occup. Regional Housing Authority Weatherization Service Provider
200 65 58%
Housing Need Overcrowded 1‐star Energy Use Average Home Average Avg. EUI
11.5% Energy Rating Square Feet (kBTU/sf)
Data Quality 2 star plus 1,199 119.9
Lighting Owner Number/Type Retrofitted? Year Notes
LED Yes
Non‐residential Building Inventory
Building Name or Location Year Built Square Feet Audited? Retrofits Done? In ARIS?
Kake High School Yes
Kake Elementary School Yes
School Library Yes
Kake School Vocational Building Yes
Senior Center In progress
Kake Community Center / City Hall Partially
Bingo Hall
Community Liquor Store
US Post Office
SEARHC Clinic
Police & Fire Department / VPSO building (all one?)
Boys and Girls Club (Same as Youth Center)?
Water Front Lodge
OVK Tribal Office 4,000 Yes
KTC Gas Station
SOS Value Mart Partially
Sagebrush Dry Goods
Lighthouse Baptist Church
Kake Tribal Corp Office
IPEC Building & Power Plant
Presbyterian Church
Cannery
Youth Center
City Shop
Keex Kwaan Lodge 4,700 Yes
Ferry Terminal
5 8 1445
103
40 4010
Earlier 1940s 1950s 1960s 1970s 1980s 1990s 2000‐11
Age of Housing Stock
49% 1%
51%
Retrofitted BEES Certified Untouched
Energy Efficient Housing Stock
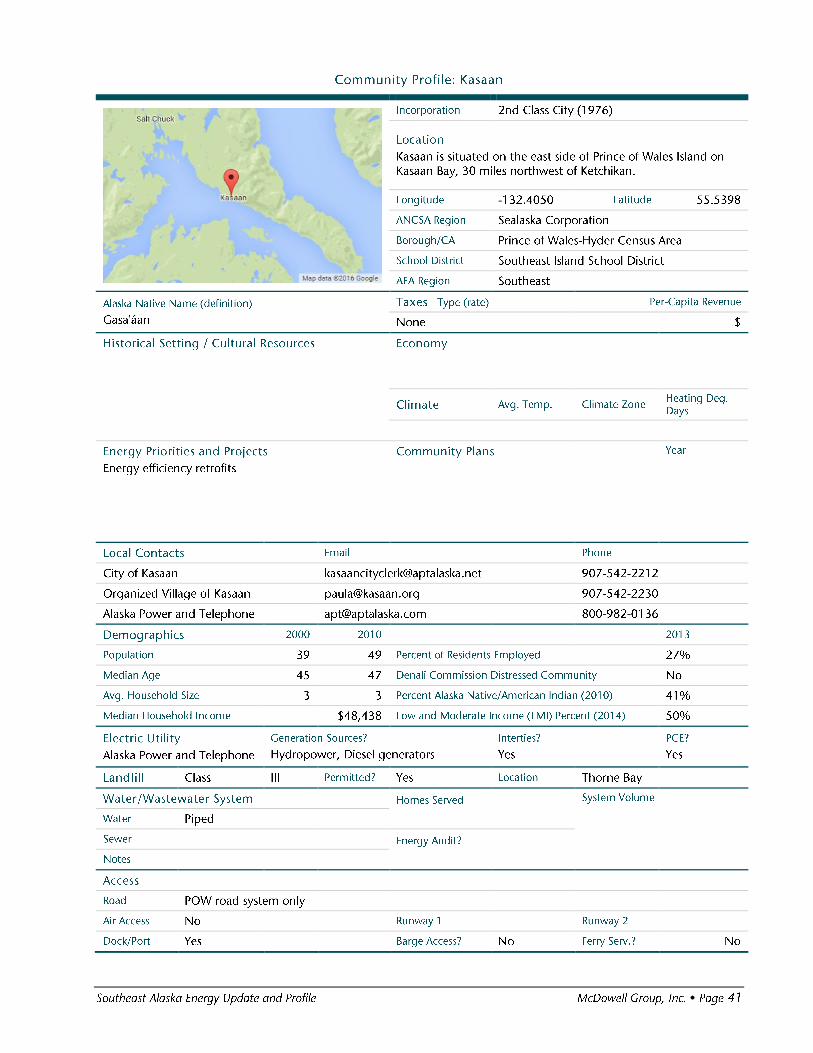
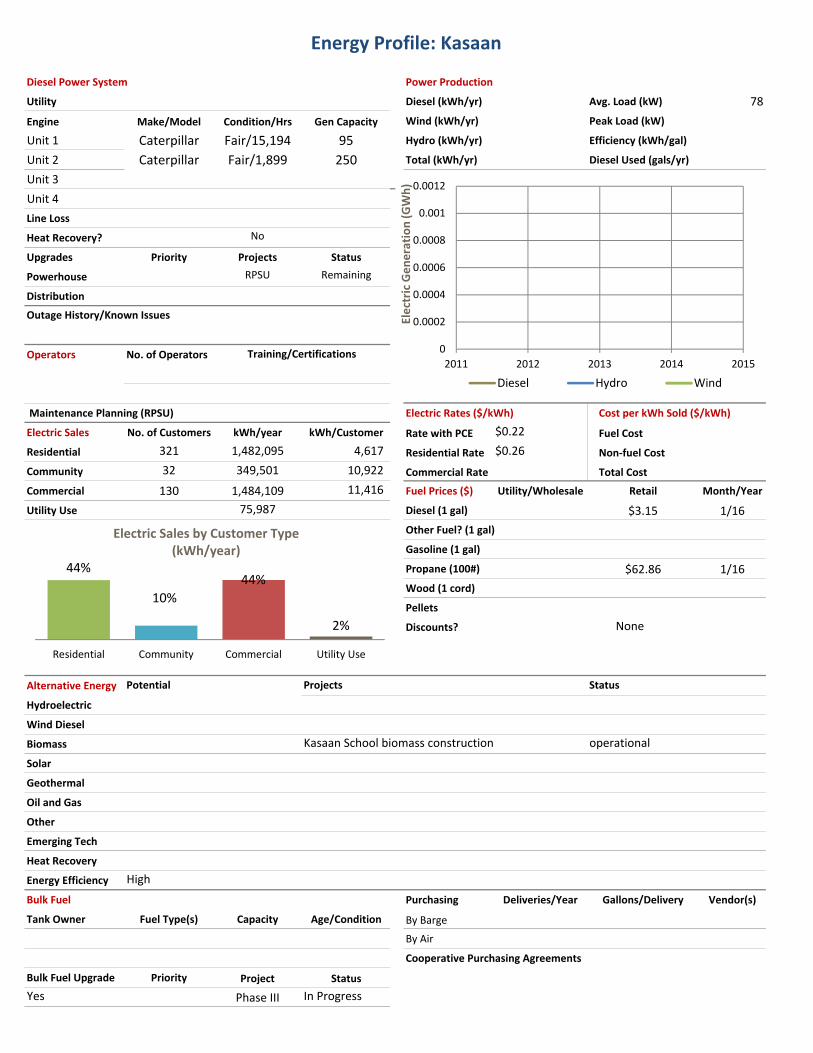
Energy Profile: Kasaan
Diesel Power System Power Production
Utility Diesel (kWh/yr) Avg. Load (kW) 78
Engine Make/Model Condition/Hrs Gen Capacity Wind (kWh/yr) Peak Load (kW)
Unit 1 Caterpillar Fair/15,194 95 Hydro (kWh/yr) Efficiency (kWh/gal)
Unit 2 Caterpillar Fair/1,899 250 Total (kWh/yr) Diesel Used (gals/yr)
Unit 3
Unit 4
Line Loss
Heat Recovery?
Upgrades Priority Projects Status
Powerhouse RPSU Remaining
Distribution
Operators No. of Operators
Maintenance Planning (RPSU) Electric Rates ($/kWh) Cost per kWh Sold ($/kWh)
Electric Sales No. of Customers kWh/year kWh/Customer Rate with PCE $0.22 Fuel Cost
Residential 321 1,482,095 4,617 Residential Rate $0.26 Non‐fuel Cost
Community 32 349,501 10,922 Commercial Rate Total Cost
Commercial 130 1,484,109 11,416 Fuel Prices ($) Utility/Wholesale Retail Month/Year
Utility Use 75,987 Diesel (1 gal) $3.15 1/16
Other Fuel? (1 gal)
Gasoline (1 gal)
Propane (100#) $62.86 1/16
Wood (1 cord)
Pellets
Discounts?
Alternative Energy
Hydroelectric
Wind Diesel
Biomass
Solar
Geothermal
Oil and Gas
Other
Emerging Tech
Heat Recovery
Energy Efficiency
Bulk Fuel Purchasing Deliveries/Year Gallons/Delivery Vendor(s)
Tank Owner Fuel Type(s) Capacity Age/Condition By Barge
By Air
Cooperative Purchasing Agreements
Bulk Fuel Upgrade Priority Project Status
Yes Phase III In Progress
Potential Projects Status
No
Outage History/Known Issues
Training/Certifications
None
Kasaan School biomass construction operational
High
44%
10%
44%
2%
Residential Community Commercial Utility Use
Electric Sales by Customer Type(kWh/year)
0
0.0002
0.0004
0.0006
0.0008
0.001
0.0012
2011 2012 2013 2014 2015
Electric Generation (GWh)
Diesel Hydro Wind

Energy Profile: Kasaan
Housing Units Occupied Vacant % Owner‐Occup. Regional Housing Authority Weatherization Service Provider
26 22 65%
Housing Need Overcrowded 1‐star Energy Use Average Home Average Avg. EUI
0.0% Energy Rating Square Feet (kBTU/sf)
Data Quality 2 star plus 1,200 87.5
Lighting Owner Number/Type Retrofitted? Year Notes
Non‐residential Building Inventory
Building Name or Location Year Built Square Feet Audited? Retrofits Done? In ARIS?
AP&T Power Plant
Kavilco Shop
Kavilco Administration Building
Kavilco Headquarters
Fire Department
Community Hall, VPSO & Clinic
Maintenance Shop
ACS Communication
Library
School
IRA Tribal Office
Café
60 0
8
22
84
0
Earlier 1940s 1950s 1960s 1970s 1980s 1990s 2000‐11
Age of Housing Stock
4% 0%
96%
Retrofitted BEES Certified Untouched
Energy Efficient Housing Stock
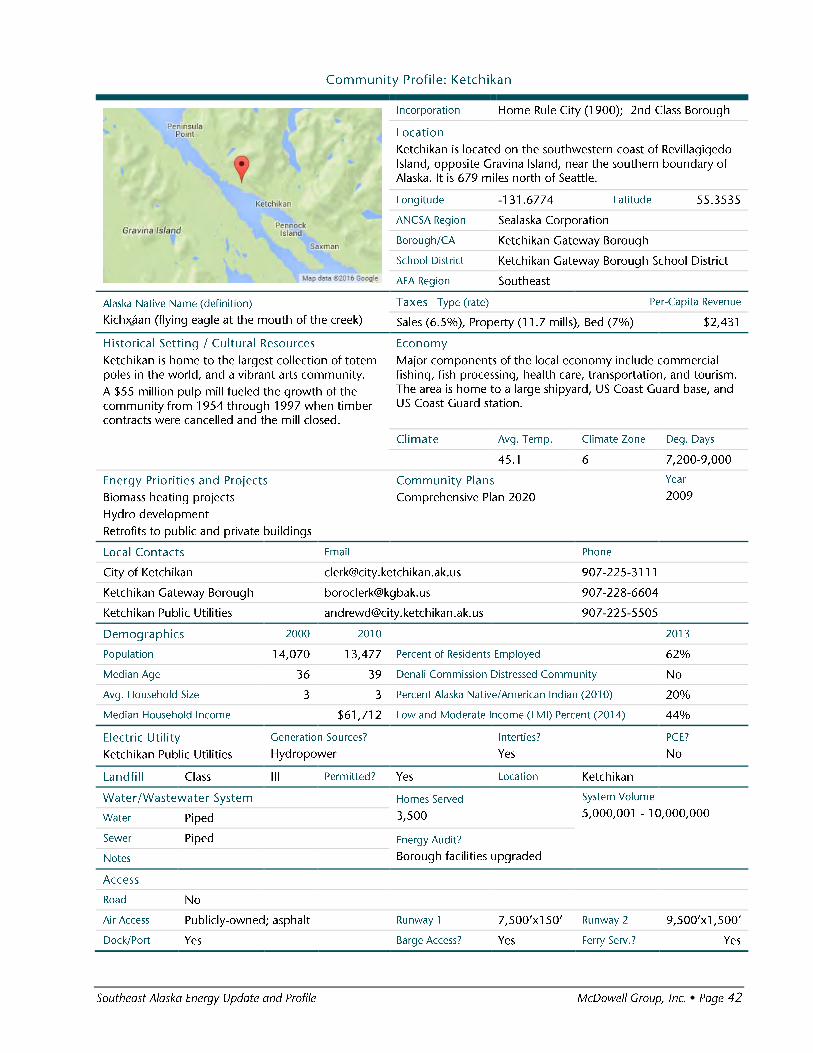

Energy Profile: Ketchikan
Diesel Power System Power Production
Utility Diesel (kWh/yr) 1,023,000 Avg. Load (kW) 17,796
Engine Make/Model Condition/Hrs Gen Capacity Purchased Hydro 82,272,000 Peak Load (kW) 34
Caterpillar (x2) 1750 each Hydro (kWh/yr) 91,893,000 Efficiency (kWh/gal) 15
Wartsila 1998 10500 Total (kWh/yr) 175,194,000 Diesel Used (gals/yr) 68,293
Worthington (x2) 1969 4500
Colt Pielstik 1976 6450
Line Loss
Heat Recovery?
Upgrades Priority Projects Status
Powerhouse
Distribution
Operators No. of Operators
shipyard 1
dock/harbor
Maintenance Planning (RPSU) Electric Rates (Average $/kWh) Cost per kWh Sold ($/kWh)
Electric Sales No. of Customers kWh/year kWh/Customer Residential Rate $0.10 Fuel Cost
Residential 5,866 66,410,470 11,321 Commercial Rate $0.09 Non‐fuel Cost
Commercial 1,795 74,550,134 41,532 Industrial Rate $0.08 Total Cost
Industrial 15 22,935,650 1,529,043 Fuel Prices ($) Utility/Wholesale Retail Month/Year
Utility Use Diesel (1 gal) $2.63 (2015) $2.72 1/16
Other Fuel? (1 gal)
Gasoline (1 gal) $2.70 1/16
Propane (100#) $78.10 1/16
Wood (1 cord)
Pellets
Biomass Projects
Operating Library, USFS Disc. Center, Airport, Fed Building
Studied Various schools, KIA building, Rec. Center
Alternative Energy
Hydroelectric
Wind Diesel
Biomass
Solar
Demand Side Man.
Oil and Gas
Other
Emerging Tech
Heat Recovery
Energy Efficiency
Bulk Fuel Purchasing Deliveries/Year Gallons/Delivery Vendor(s)
Tank Owner Fuel Type(s) Capacity Age/Condition By Barge
By Air
Cooperative Purchasing Agreements
Bulk Fuel Upgrade Priority Project Status
Potential Projects Status
No
Outage History/Known Issues
Training/Certifications
Whitman Lake Hydro Complete
Airport pellet boiler, other biomass projects Complete/ongoing
Hot water and appliance efficiency incentives On hold
Ketchikan Airport, High School, and other buidlings Complete/ongoing
41%
45%
14%
0%
Residential Community Commercial Utility Use
Electric Sales by Customer Type(kWh/year)
0
20
40
60
80
100
120
140
160
180
200
2011 2012 2013 2014 2015
Electric Generation (GWh)
Hydro Diesel

Energy Profile: Ketchikan
Housing Units Occupied Vacant % Owner‐Occup. Regional Housing Authority Weatherization Service Provider
#DIV/0!
Housing Need Overcrowded 1‐star Energy Use Average Home Average Avg. EUI
Energy Rating Square Feet (kBTU/sf)
Data Quality
Lighting Owner Number/Type Retrofitted? Notes
City
Borough LED Yes led to 27% reduction in electricity usage at borough parks
Non‐residential Building Inventory
Building Name or Location Year Built Square Feet Audited? Retrofits Done? In ARIS?
Ketchikan High School 190,290 Yes new roof, biomass planned
Houghtaling Elementary 180,614
Schoenbar Middle School 66,048 biomass planned
Houghtaling Elementary 62,500
Point Higgins Elementary 55,040
Ketchikan State Court and Office Building 42,024
Valley Park Elementary 40,686 biomass planned
Fawn Mountain Elementary 37,500
Ketchikan Court/Office #8 #MO00000893* 36,218
Ketchikan State Court and Office 36,218
Ketchikan Pioneer Home 31,787
KCC 18,092
Ketchikan Correctional Center 18,092
KE001 ‐ Ziegler Building 13,928
KE003 ‐ Robertson Building 13,390
KE002 ‐ Paul Building 12,488
Maintenance Shop 11,140 biomass planned
Revilla High School 10,000
Ketchikan Health Center 7,107
Ferry Terminal #2549000536* 6,800
47126 A Detachment HQ 6,700
Ketchikan Youth Facility 6,460
APOP Office 6,342
Maintenance Shop #MO00000526* 5,300
Cold Storage #2513000537 5,000
Gateway Rec Center biomass planned
1 3 7 4
27
44
2514
Earlier 1940s 1950s 1960s 1970s 1980s 1990s 2000‐11
Age of Housing Stock
0% 0%
0%
Retrofitted BEES Certified Untouched
Energy Efficient Housing Stock


Energy Profile: Klawock
Diesel Power System Power Production
Utility Diesel (kWh/yr) 0 Avg. Load (kW)
Engine Make/Model Condition/Hrs Gen Capacity Wind (kWh/yr) 0 Peak Load (kW)
Unit 1 Hydro (kWh/yr) 0 Efficiency (kWh/gal)
Unit 2 Total (kWh/yr) 0 Diesel Used (gals/yr)
Unit 3
Unit 4
Line Loss
Heat Recovery?
Upgrades Priority Projects Status
Powerhouse
Distribution
Operators No. of Operators
Maintenance Planning (RPSU) Electric Rates ($/kWh) Cost per kWh Sold ($/kWh)
Electric Sales No. of Customers kWh/year kWh/Customer Rate with PCE $0.22 Fuel Cost
Residential 401 2,341,423 5,839 Residential Rate $0.26 Non‐fuel Cost
Community 21 480,807 22,896 Commercial Rate Total Cost
Commercial 127 5,459,795 42,991 Fuel Prices ($) Utility/Wholesale Retail Month/Year
Utility Use 11,600 Diesel (1 gal) $2.94 1/16
Other Fuel? (1 gal)
Gasoline (1 gal)
Propane (100#) $56.90 1/16
Wood (1 cord)
Pellets
Discounts?
Alternative Energy
Hydroelectric
Wind Diesel
Biomass
Solar
Geothermal
Oil and Gas
Other
Emerging Tech
Heat Recovery
Energy Efficiency
Bulk Fuel Purchasing Deliveries/Year Gallons/Delivery Vendor(s)
Tank Owner Fuel Type(s) Capacity Age/Condition By Barge
AP&T Diesel #2 13,600 total >10 yrs. By Air
School Diesel #1 2,000 >10 yrs. Cooperative Purchasing Agreements
Bulk Fuel Upgrade Priority Project Status
No Incomplete
Potential Projects Status
Alaska Power Company
Outage History/Known Issues
Training/Certifications
None
Senior Housing, School biomass feasibility
28%
6%
66%
0%
Residential Community Commercial Utility Use
Electric Sales by Customer Type(kWh/year)
0
0.0002
0.0004
0.0006
0.0008
0.001
0.0012
2011 2012 2013 2014 2015
Electric Generation (GWh)
Diesel Hydro Wind

Energy Profile: Klawock
Housing Units Occupied Vacant % Owner‐Occup. Regional Housing Authority Weatherization Service Provider
321 43 57%
Housing Need Overcrowded 1‐star Energy Use Average Home Average Avg. EUI
1.9% Energy Rating Square Feet (kBTU/sf)
Data Quality 2 star plus 1,147 122.6
Lighting Owner Number/Type Retrofitted? Year Notes
73/HPS
Harbor 15/LED
Street Lights 77/LED Yes
Non‐residential Building Inventory
Building Name or Location Year Built Square Feet Audited? Retrofits Done? In ARIS?
Public Safety Building ‐ Klawock Police and Courthouse
City Hall
Water Treatment Plant 1,500
Wild Fish BBQ 400
Wild Fish Smokery 800
Petro Marine Gas Station/Black Bear Store 2,700
Skyaana Building 3,042 Yes
Alaska Native Brotherhood 1,200
Klawock Middle School 600
Anderson's Processing 1,000
Klawock Fire Station #1
Bingo Hall‐ Klawock Heenya Corp 4,000
Tribal Admin Office Yes
Klawock Heenya Corp Office Yes
Library 600
Public Works 750
POW Vocational Tec Center
City Hall 960
Kim's Corner Diner 750
Mult‐use Building 2,400
Bell Tower Mall (Post Office, grocery, Liquor and Chamber) 8,100 Yes
Klawock School 27,920
Harbor Master 1,200
Cannery
Prince of Peace Assembly of God 2,500
Sr. Center 6,000
8 16 21 23
11566
94
21
Earlier 1940s 1950s 1960s 1970s 1980s 1990s 2000‐11
Age of Housing Stock
30% 3%
67%
Retrofitted BEES Certified Untouched
Energy Efficient Housing Stock


Energy Profile: Klukwan
Diesel Power System Power Production
Utility Diesel (kWh/yr) 0 Avg. Load (kW) 46
Engine Make/Model Condition/Hrs Gen Capacity Purchased‐ Hydro 620,460 Peak Load (kW) 389
27 Mile 600 kw Hydro (kWh/yr) 1,060,000 Efficiency (kWh/gal) n/a
10 Mile 250kw Total (kWh/yr) 1,680,460 Diesel Used (gals/yr) 0
10 mile 150kw
Line Loss
Heat Recovery?
Upgrades Priority Projects Status
Powerhouse low
Distribution Klukwan upgrade completed in 2005
Operators No. of Operators
Electric Sales Klukwan; Chilkat Valley Electric Rates ($/kWh) Cost per kWh Sold ($/kWh)
No. of Cust. kWh/year kWh/Customer Rate with PCE $0.22 Fuel Cost $0.00
Residential 48; 204 191,527; 633,228 3,990; 3,104 Residential Rate $0.59 Non‐fuel Cost $0.37
Community 9; 1 74,602; 2,470 8,289; 2,470 Commercial Rate Total Cost $0.37
Non‐PCE/Commer. 8; 42 78,947; 446,500 9,868; 10,631 Fuel Prices ($) Utility/Wholesale Retail Month/Year
Utility Use 57,502 Diesel (1 gal) $3.03 1/16
Other Fuel? (1 gal)
Gasoline (1 gal) $3.99 7/15
Propane (100#)
Wood (1 cord)
Pellets
Discounts?
Alternative Energy
Hydroelectric
Wind Diesel
Biomass
Solar
Geothermal
Oil and Gas
Other
Emerging Tech
Heat Recovery
Energy Efficiency
Bulk Fuel Purchasing Deliveries/Year Gallons/Delivery Vendor(s)
Tank Owner Fuel Type(s) Capacity Age/Condition By Barge
By Air
Cooperative Purchasing Agreements
Bulk Fuel Upgrade Priority Project Status
Potential Projects Status
Inside Passage Electric Cooperative
10.1%
No
Outage History/Known Issues
Training/Certifications
None
56%
5%
35%
4%
Residential Community Commercial Utility Use
Electric Sales by Customer Type(kWh/year)
0
200
400
600
800
1000
1200
1400
1600
1800
2000
2011 2012 2013 2014 2015
Electric Generation (GWh)
Wind Hydro Diesel

Energy Profile: Klukwan
Housing Units Occupied Vacant % Owner‐Occup. Regional Housing Authority Weatherization Service Provider
53 38 87%
Housing Need Overcrowded 1‐star Energy Use Average Home Average Avg. EUI
0.0% Energy Rating Square Feet (kBTU/sf)
Data Quality
Lighting Owner Number/Type Retrofitted? Year Notes
21/LED Yes
Non‐residential Building Inventory
Building Name or Location Year Built Square Feet Audited? Retrofits Done? In ARIS?
Klukwan School Gym 6000
Klukwan Health Clinic 2400
15
08 10
20
31
16
Earlier 1940s 1950s 1960s 1970s 1980s 1990s 2000‐11
Age of Housing Stock
0% 0%
100%
Retrofitted BEES Certified Untouched
Energy Efficient Housing Stock
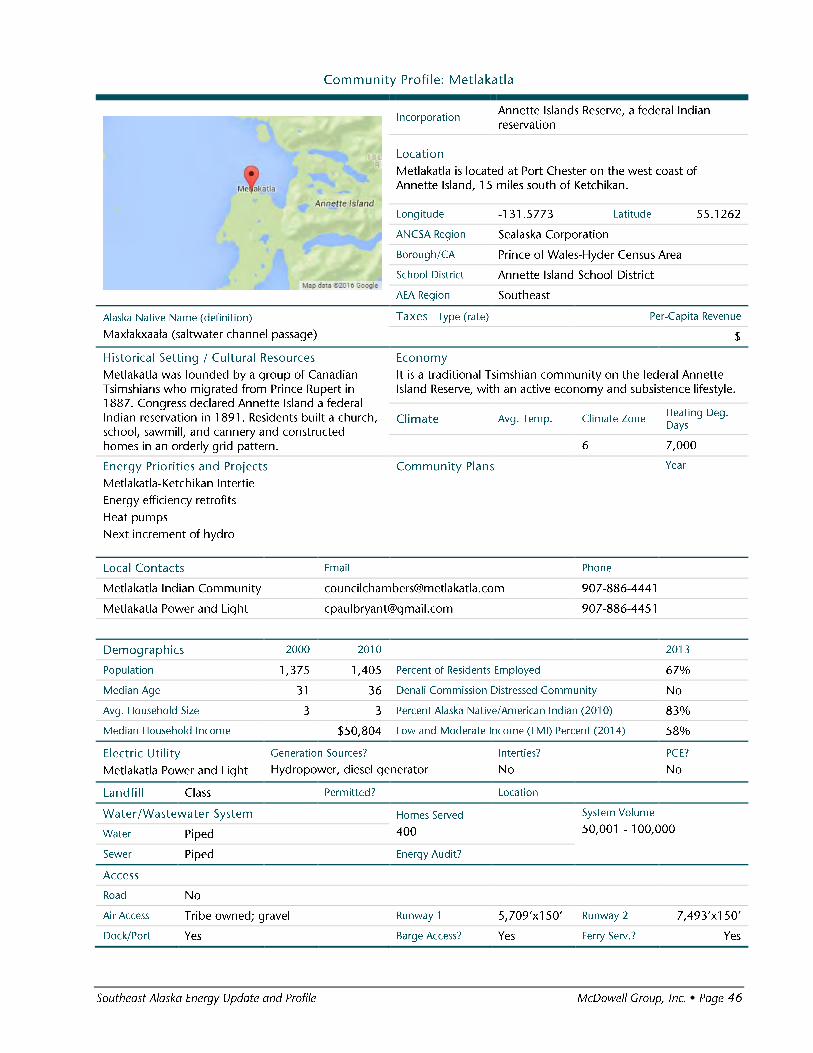

Energy Profile: Metlakatla
Diesel Power System Power Production
Utility Diesel (kWh/yr) Avg. Load (kW) 1,685
Engine Make/Model Condition/Hrs Gen Capacity Wind (kWh/yr) Peak Load (kW)
Unit 1 3.3mw Hydro (kWh/yr) Efficiency (kWh/gal)
Total (kWh/yr) Diesel Used (gals/yr)
Line Loss
Heat Recovery?
Upgrades Projects Status
Powerhouse RPSU Remaining
Distribution
Operators No. of Operators
2
Maintenance Planning (RPSU) Electric Rates ($/kWh) Cost per kWh Sold ($/kWh)
Electric Sales No. of Customers kWh/year kWh/Customer Rate with PCE Fuel Cost
Residential Residential Rate Non‐fuel Cost
Community Commercial Rate Total Cost
Commercial Fuel Prices ($) Utility/Wholesale Retail Month/Year
Utility Use Diesel (1 gal)
Other Fuel? (1 gal)
Gasoline (1 gal)
Propane (100#)
Wood (1 cord)
Pellets
Discounts?
Alternative Energy
Hydroelectric
Wind Diesel
Biomass
Solar
Geothermal
Oil and Gas
Other
Emerging Tech
Heat Recovery
Energy Efficiency
Bulk Fuel Purchasing Deliveries/Year Gallons/Delivery Vendor(s)
Tank Owner Fuel Type(s) Capacity Age/Condition By Barge
Annette Is. Gas D1, D2, Gas 75,000 total >20 yrs. By Air
Met. P and L Diesel #2 50,000 (x8) 60 yrs. Cooperative Purchasing Agreements
Bulk Fuel Upgrade Priority Project Status
No Incomplete
Potential Projects Status
Metlakatla Power & Light
Yes
Outage History/Known Issues
Training/Certifications
PPO
None
Triangle Lake Hydro
Matlakatla‐Ketchikan Intertie
0%
0%
0%
0%
Residential Community Commercial Utility Use
Electric Sales by Customer Type(kWh/year)
0
0.0002
0.0004
0.0006
0.0008
0.001
0.0012
2011 2012 2013 2014 2015
Electric Generation (GWh)
Diesel Hydro Wind

Energy Profile: Metlakatla
Housing Units Occupied Vacant % Owner‐Occup. Regional Housing Authority Weatherization Service Provider
538 68 63%
Housing Need Overcrowded 1‐star Energy Use Average Home Average Avg. EUI
11.7% Energy Rating Square Feet (kBTU/sf)
Data Quality 2 star 1,310 94.5
Lighting Owner Number/Type Retrofitted? Year Notes
200W copperheads
Non‐residential Building Inventory
Building Name or Location Year Built Square Feet Audited? Retrofits Done? In ARIS?
Annette Island Packing with Silver Bay Complex 39,050
Metlakatla High School & Gym 32,600
Richard Johnson Elementary School 20,000
Lepquinum Wellness Center (Pool/Activity) 13,400
AISU Health Center Complex 13,200
Senior Apartments 12,300
Leask Market 8,900
Town Hall 8,500
Charles Leask Middle School 7,800
Presbyterian Church 4,800
Leask Mini‐Mart 4800
MIC Artist Village 4800
Metlakatla Municipal Building 4680
MIC Gaming 3750
MIC Water Bottling 3600
MIC Long House 3400
Lakeside Church of God 3000
Post Office ‐ Federal 2700
Senior Center 2,600
Met‐Co Hardware 2,500
Fire Department 2400
MP&L Office 2,000
MP&L Warehouse 2,000
Police and Magistrate 1,780
Bible Baptist Church 1,500
Congregational Church 1,400
74
21 2363
154130
102
39
Earlier 1940s 1950s 1960s 1970s 1980s 1990s 2000‐11
Age of Housing Stock
28% 0%
72%
Retrofitted BEES Certified Untouched
Energy Efficient Housing Stock


Energy Profile: Naukati
Diesel Power System Power Production
Utility Diesel (kWh/yr) 238,219 Avg. Load (kW) 53
Engine Make/Model Condition/Hrs Gen Capacity Wind (kWh/yr) 0 Peak Load (kW) 173
Unit 1 John Deere Fair/51,336 138 Hydro (kWh/yr) 0 Efficiency (kWh/gal) 11
Unit 2 John Deere Fair/54,051 175 Total (kWh/yr) 238,219 Diesel Used (gals/yr) 21,019
Unit 3 John Deere Fair/55,402 175
Unit 4
Line Loss
Heat Recovery?
Upgrades Priority Projects Status
Powerhouse RPSU Pending
Distribution
Operators No. of Operators
Maintenance Planning (RPSU) Electric Rates ($/kWh) Cost per kWh Sold ($/kWh)
Electric Sales No. of Customers kWh/year kWh/Customer Rate with PCE $0.22 Fuel Cost $0.21
Residential 68 255,990 3,765 Residential Rate $0.37 Non‐fuel Cost $0.13
Community 0 0 ‐ Commercial Rate Total Cost $0.33
Commer./Non‐PCE 11 117,066 10,642 Fuel Prices ($) Utility/Wholesale Retail Month/Year
Utility Use 8,664 Diesel (1 gal) $3.68 (FY15) $3.50 7/15
Other Fuel? (1 gal)
Gasoline (1 gal)
Propane (100#)
Wood (1 cord)
Pellets
Discounts?
Alternative Energy
Hydroelectric
Wind Diesel
Biomass
Solar
Geothermal
Oil and Gas
Other
Emerging Tech
Heat Recovery
Energy Efficiency
Bulk Fuel Purchasing Deliveries/Year Gallons/Delivery Vendor(s)
Tank Owner Fuel Type(s) Capacity Age/Condition By Barge
By Air
Cooperative Purchasing Agreements
Bulk Fuel Upgrade Priority Project Status
Potential Projects Status
Alaska Power Company
Yes, but now on intertie; School
Outage History/Known Issues
Training/Certifications
None
North POW Intertie construction Operating
Waste heat to school Operating
67%
0%
31%
2%
Residential Community Commercial Utility Use
Electric Sales by Customer Type(kWh/year)
0
0.1
0.2
0.3
0.4
0.5
0.6
2011 2012 2013 2014 2015
Electric Generation (GWh)
Wind Hydro Diesel

Energy Profile: Naukati
Housing Units Occupied Vacant % Owner‐Occup. Regional Housing Authority Weatherization Service Provider
53 12 72%
Housing Need Overcrowded 1‐star Energy Use Average Home Average Avg. EUI
0.0% Energy Rating Square Feet (kBTU/sf)
Data Quality 2 star 1,124 149.3
Lighting Owner Number/Type Retrofitted? Year Notes
10/HPS
Non‐residential Building Inventory
Building Name or Location Year Built Square Feet Audited? Retrofits Done? In ARIS?
Naukati Bay School 9,800
Teacher Housing (1) 300
AP&T gen set 630
Fire Hall and EMT 684
Naukati Connect Shops 1,134
Tire/Commercial Shop 1,500
Naukati Community Church and Housing 650
Flupsy Oyster Hatchery 150
School Wood Shed 400*
0 0 0 0 0
38
27
3
Earlier 1940s 1950s 1960s 1970s 1980s 1990s 2000‐11
Age of Housing Stock
8% 0%
92%
Retrofitted BEES Certified Untouched
Energy Efficient Housing Stock

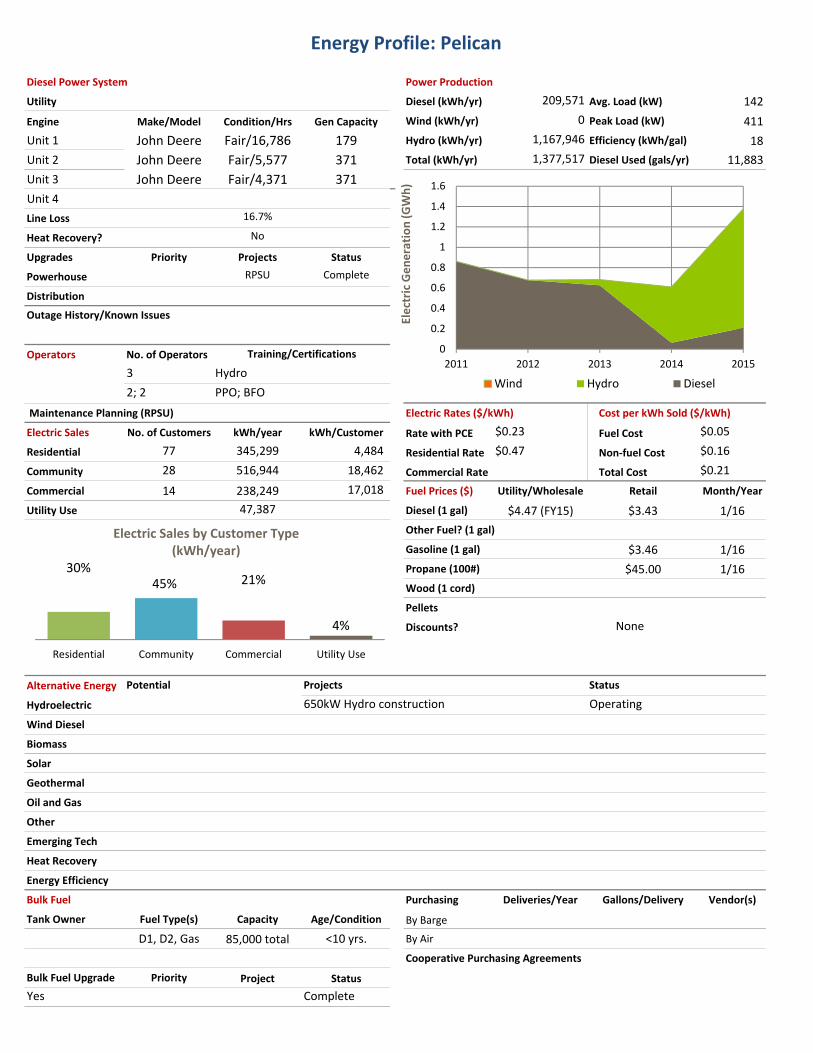
Energy Profile: Pelican
Diesel Power System Power Production
Utility Diesel (kWh/yr) 209,571 Avg. Load (kW) 142
Engine Make/Model Condition/Hrs Gen Capacity Wind (kWh/yr) 0 Peak Load (kW) 411
Unit 1 John Deere Fair/16,786 179 Hydro (kWh/yr) 1,167,946 Efficiency (kWh/gal) 18
Unit 2 John Deere Fair/5,577 371 Total (kWh/yr) 1,377,517 Diesel Used (gals/yr) 11,883
Unit 3 John Deere Fair/4,371 371
Unit 4
Line Loss
Heat Recovery?
Upgrades Priority Projects Status
Powerhouse RPSU Complete
Distribution
Operators No. of Operators
3
2; 2
Maintenance Planning (RPSU) Electric Rates ($/kWh) Cost per kWh Sold ($/kWh)
Electric Sales No. of Customers kWh/year kWh/Customer Rate with PCE $0.23 Fuel Cost $0.05
Residential 77 345,299 4,484 Residential Rate $0.47 Non‐fuel Cost $0.16
Community 28 516,944 18,462 Commercial Rate Total Cost $0.21
Commercial 14 238,249 17,018 Fuel Prices ($) Utility/Wholesale Retail Month/Year
Utility Use 47,387 Diesel (1 gal) $4.47 (FY15) $3.43 1/16
Other Fuel? (1 gal)
Gasoline (1 gal) $3.46 1/16
Propane (100#) $45.00 1/16
Wood (1 cord)
Pellets
Discounts?
Alternative Energy
Hydroelectric
Wind Diesel
Biomass
Solar
Geothermal
Oil and Gas
Other
Emerging Tech
Heat Recovery
Energy Efficiency
Bulk Fuel Purchasing Deliveries/Year Gallons/Delivery Vendor(s)
Tank Owner Fuel Type(s) Capacity Age/Condition By Barge
D1, D2, Gas 85,000 total <10 yrs. By Air
Cooperative Purchasing Agreements
Bulk Fuel Upgrade Priority Project Status
Yes Complete
Potential Projects Status
16.7%
No
Outage History/Known Issues
Training/Certifications
Hydro
PPO; BFO
None
650kW Hydro construction Operating
30%45% 21%
4%
Residential Community Commercial Utility Use
Electric Sales by Customer Type(kWh/year)
0
0.2
0.4
0.6
0.8
1
1.2
1.4
1.6
2011 2012 2013 2014 2015
Electric Generation (GWh)
Wind Hydro Diesel

Energy Profile: Pelican
Housing Units Occupied Vacant % Owner‐Occup. Regional Housing Authority Weatherization Service Provider
46 43 52%
Housing Need Overcrowded 1‐star Energy Use Average Home Average Avg. EUI
0.0% Energy Rating Square Feet (kBTU/sf)
Data Quality
Lighting Owner Number/Type Retrofitted? Year Notes
45/HPS
14/LED
Non‐residential Building Inventory
Building Name or Location Year Built Square Feet Audited? Retrofits Done? In ARIS?
Cannery 18,000
High School and Gym 7,750
Community Hall 3,000
Highliner Lodge 2,720
Grade School 2,100
City Storage Shed 1,610
Pelican City Hall 1,400
Health Clinic 1,220
J & S Lodging 900
Fuel Dock 840
City Library 820
Church 780
City Maintanance Shops 780
City Shops 670
School Storage Shed 610
Harbormaster 520
Fish Processing Plant
City Bunkhouse and Laundry
Café/Gift Shop
Marine Repair Shop and B&B
Store
Post Office
Airplane Float
Bar
Fire Station
Water Treatment Plant
6
17 1913
26
3 50
Earlier 1940s 1950s 1960s 1970s 1980s 1990s 2000‐11
Age of Housing Stock
2% 0%
98%
Retrofitted BEES Certified Untouched
Energy Efficient Housing Stock
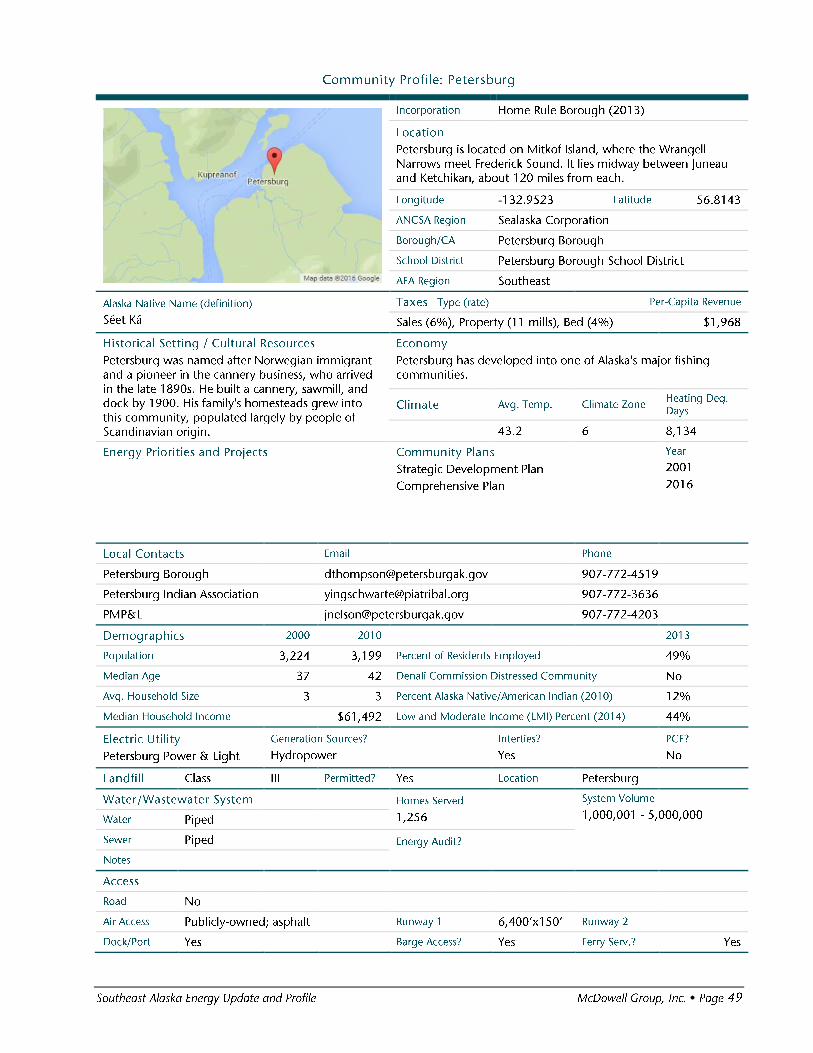

Energy Profile: Petersburg
Diesel Power System Power Production (kwh/year)
Utility Generated 13,928,000 Avg. Load (kW) 5,050
Engine Make/Model Condition/Hrs Gen Capacity Purchased Hydro 41,237,000 Peak Load (kW) 11,000
10MW Efficiency (kWh/gal)
Total (kWh/yr) 55,165,000 Diesel Used (gals/yr)
Line Loss
Heat Recovery?
Upgrades Priority Projects Status
Powerhouse
Distribution
Operators No. of Operators
Maintenance Planning (RPSU) Electric Rates ($/kWh) Cost per kWh Sold ($/kWh)
Electric Sales No. of Customers kWh/year kWh/Customer Rate with PCE Fuel Cost
Residential 1,372 19,703,000 14,361 Residential Rate Non‐fuel Cost
Commercial 708 9,246,000 13,059 Commercial Rate Total Cost
Industrial 31 20,201,000 651,645 Fuel Prices ($) Utility/Wholesale Retail Month/Year
Utility Use Diesel (1 gal)
Other Fuel? (1 gal)
Gasoline (1 gal)
Propane (100#)
Wood (1 cord)
Pellets
Discounts?
Alternative Energy
Hydroelectric
Wind Diesel
Biomass
Solar
Demand Side Man.
Oil and Gas
Other
Emerging Tech
Heat Recovery
Energy Efficiency
Bulk Fuel Purchasing Deliveries/Year Gallons/Delivery Vendor(s)
Tank Owner Fuel Type(s) Capacity Age/Condition By Barge
By Air
Cooperative Purchasing Agreements
Bulk Fuel Upgrade Priority Project Status
Potential Projects Status
Outage History/Known Issues
Training/Certifications
None
Heat Pump Rebate program (municipal) Ongoing
40%
19%
41%
0%
Residential Community Commercial Utility Use
Electric Sales by Customer Type(kWh/year)
0
0.0002
0.0004
0.0006
0.0008
0.001
0.0012
2011 2012 2013 2014 2015
Electric Generation (GWh)
Diesel Hydro Wind
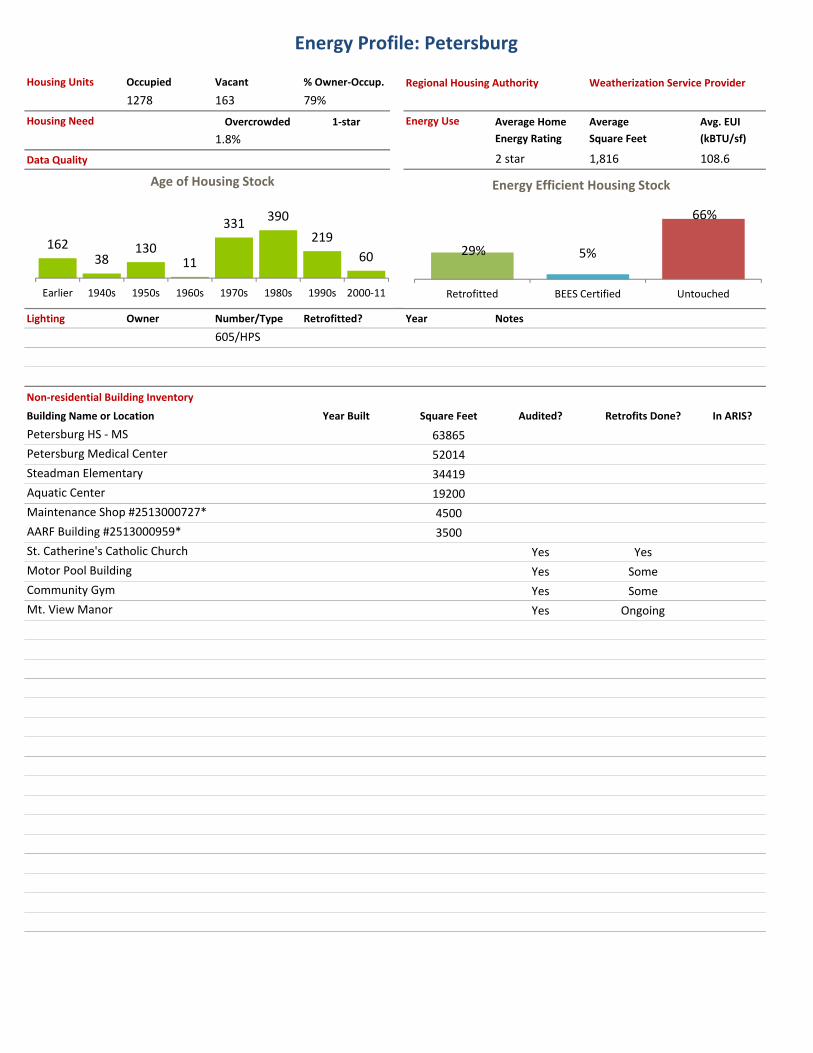
Energy Profile: Petersburg
Housing Units Occupied Vacant % Owner‐Occup. Regional Housing Authority Weatherization Service Provider
1278 163 79%
Housing Need Overcrowded 1‐star Energy Use Average Home Average Avg. EUI
1.8% Energy Rating Square Feet (kBTU/sf)
Data Quality 2 star 1,816 108.6
Lighting Owner Number/Type Retrofitted? Year Notes
605/HPS
Non‐residential Building Inventory
Building Name or Location Year Built Square Feet Audited? Retrofits Done? In ARIS?
Petersburg HS ‐ MS 63865
Petersburg Medical Center 52014
Steadman Elementary 34419
Aquatic Center 19200
Maintenance Shop #2513000727* 4500
AARF Building #2513000959* 3500
St. Catherine's Catholic Church Yes Yes
Motor Pool Building Yes Some
Community Gym Yes Some
Mt. View Manor Yes Ongoing
16238
13011
331390
219
60
Earlier 1940s 1950s 1960s 1970s 1980s 1990s 2000‐11
Age of Housing Stock
29% 5%
66%
Retrofitted BEES Certified Untouched
Energy Efficient Housing Stock
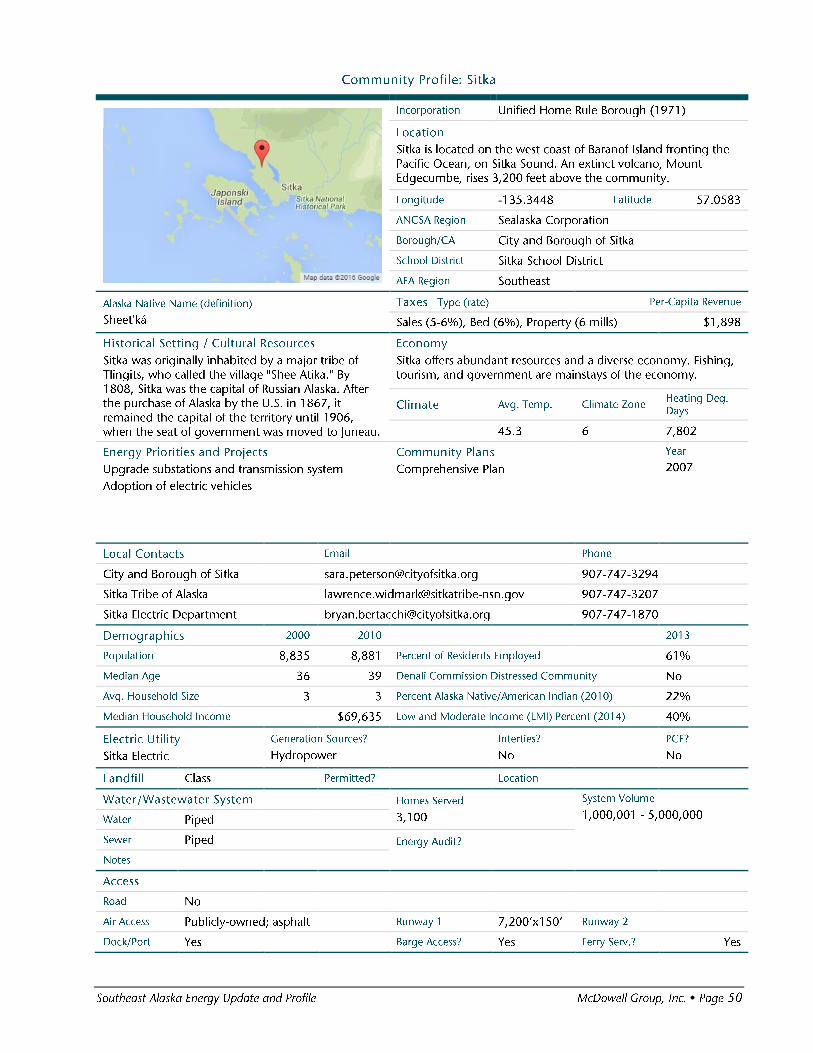

Energy Profile: Sitka
Diesel Power System Power Production
Utility Diesel (kWh/yr) Avg. Load (kW) 9,157
Engine Make/Model Condition/Hrs Gen Capacity Wind (kWh/yr) Peak Load (kW) 24,000
Caterpillar 4.8mw Hydro (kWh/yr) Efficiency (kWh/gal)
Fairbanks Morse (x3) 30 yrs 7.5mw total Total (kWh/yr) 111,641,000 Diesel Used (gals/yr)
Titan 75 hrs 15mw total
Line Loss
Heat Recovery?
Upgrades Priority Projects Status
Powerhouse
Distribution
Operators No. of Operators
Maintenance Planning (RPSU) Electric Rates ($/kWh) Cost per kWh Sold ($/kWh)
Electric Sales No. of Customers kWh/year kWh/Customer Rate with PCE Fuel Cost
Residential 3,697 43,287,665 11,709 Residential Rate $0.11 Non‐fuel Cost
Community 215 28,747,993 133,712 Commercial Rate $0.12 Total Cost
Commercial 665 37,826,945 56,883 Fuel Prices ($) Utility/Wholesale Retail Month/Year
Utility Use 3,165,669 Diesel (1 gal)
Other Fuel? (1 gal)
Gasoline (1 gal)
Propane (100#)
Wood (1 cord)
Pellets
Discounts?
Alternative Energy
Hydroelectric
Wind Diesel
Biomass
Solar
Geothermal
Demand Side Man
Other
Emerging Tech
Heat Recovery
Energy Efficiency
Bulk Fuel Purchasing Deliveries/Year Gallons/Delivery Vendor(s)
Tank Owner Fuel Type(s) Capacity Age/Condition By Barge
By Air
Cooperative Purchasing Agreements
Bulk Fuel Upgrade Priority Project Status
Potential Projects Status
Outage History/Known Issues
Training/Certifications
None
Blue Lake expansion; Takatz Hydro feasibility Operating; Complete
Energy Star Rebate Program; Signage
Heat pump projects in community buildings Operating
38%
25%
33%
3%
Residential Community Commercial Utility Use
Electric Sales by Customer Type(kWh/year)
0
0.0002
0.0004
0.0006
0.0008
0.001
0.0012
2011 2012 2013 2014 2015
Electric Generation (GWh)
Diesel Hydro Wind
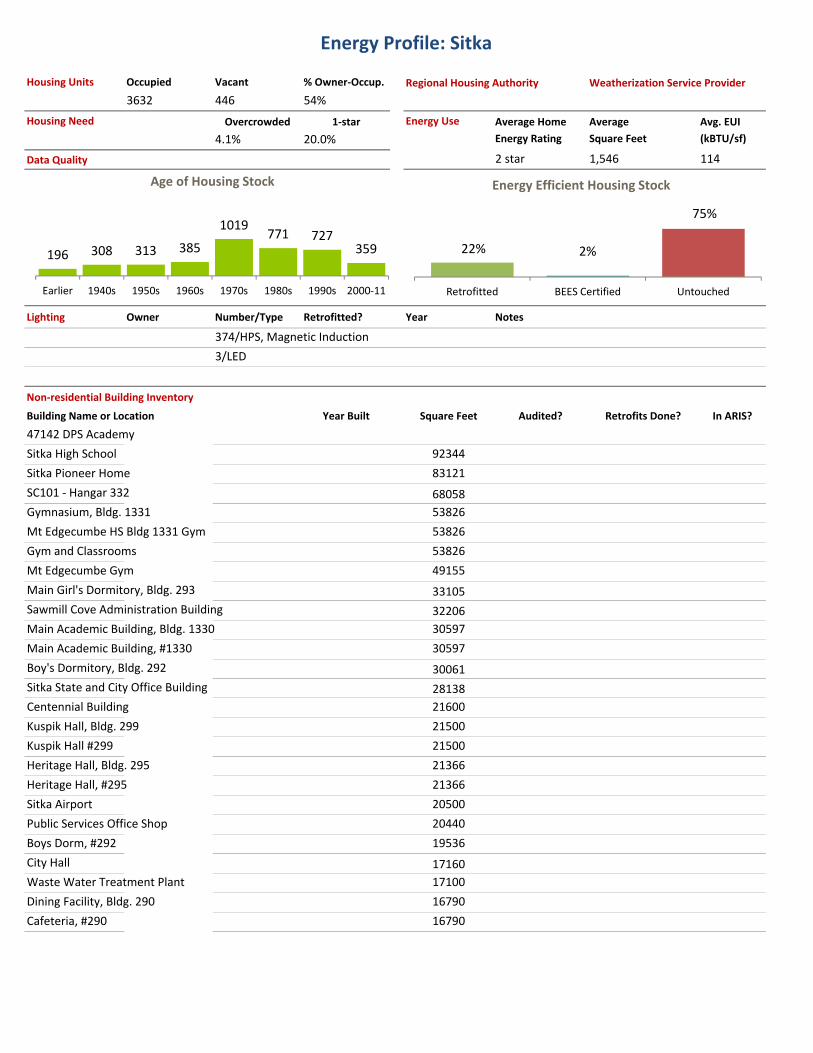
Energy Profile: Sitka
Housing Units Occupied Vacant % Owner‐Occup. Regional Housing Authority Weatherization Service Provider
3632 446 54%
Housing Need Overcrowded 1‐star Energy Use Average Home Average Avg. EUI
4.1% 20.0% Energy Rating Square Feet (kBTU/sf)
Data Quality 2 star 1,546 114
Lighting Owner Number/Type Retrofitted? Year Notes
374/HPS, Magnetic Induction
3/LED
Non‐residential Building Inventory
Building Name or Location Year Built Square Feet Audited? Retrofits Done? In ARIS?
47142 DPS Academy
Sitka High School 92344
Sitka Pioneer Home 83121
SC101 ‐ Hangar 332 68058
Gymnasium, Bldg. 1331 53826
Mt Edgecumbe HS Bldg 1331 Gym 53826
Gym and Classrooms 53826
Mt Edgecumbe Gym 49155
Main Girl's Dormitory, Bldg. 293 33105
Sawmill Cove Administration Building 32206
Main Academic Building, Bldg. 1330 30597
Main Academic Building, #1330 30597
Boy's Dormitory, Bldg. 292 30061
Sitka State and City Office Building 28138
Centennial Building 21600
Kuspik Hall, Bldg. 299 21500
Kuspik Hall #299 21500
Heritage Hall, Bldg. 295 21366
Heritage Hall, #295 21366
Sitka Airport 20500
Public Services Office Shop 20440
Boys Dorm, #292 19536
City Hall 17160
Waste Water Treatment Plant 17100
Dining Facility, Bldg. 290 16790
Cafeteria, #290 16790
196 308 313 385
1019771 727
359
Earlier 1940s 1950s 1960s 1970s 1980s 1990s 2000‐11
Age of Housing Stock
22% 2%
75%
Retrofitted BEES Certified Untouched
Energy Efficient Housing Stock
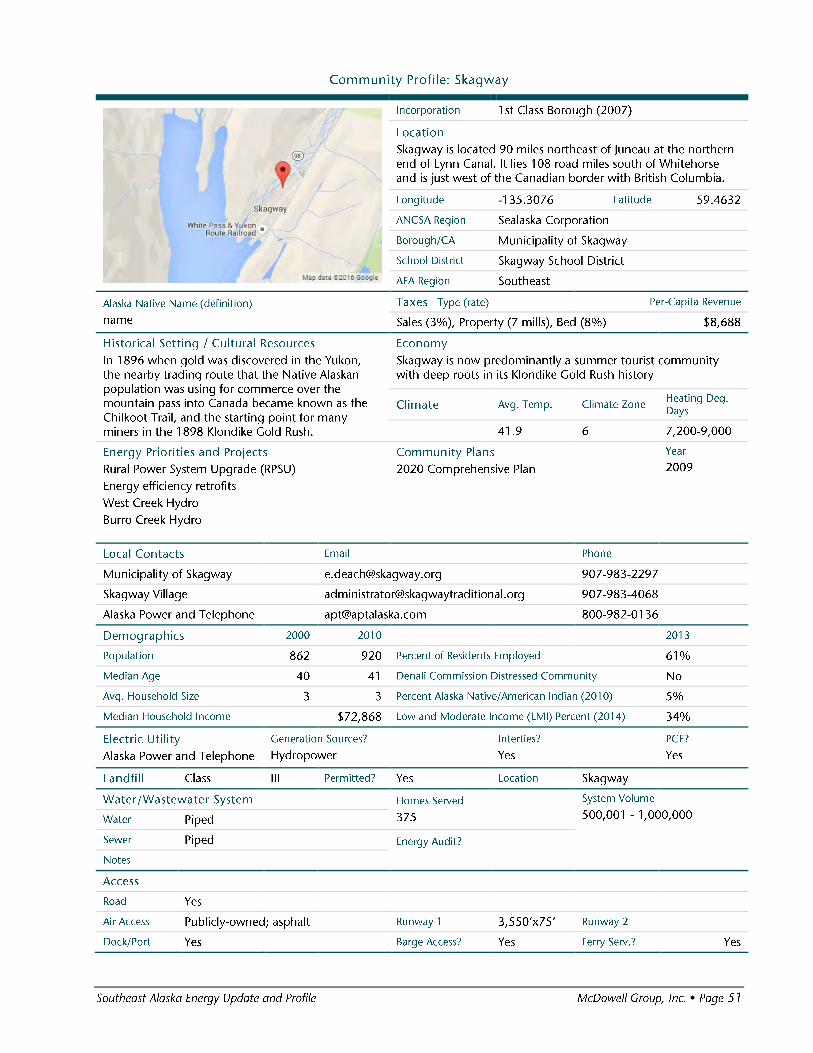
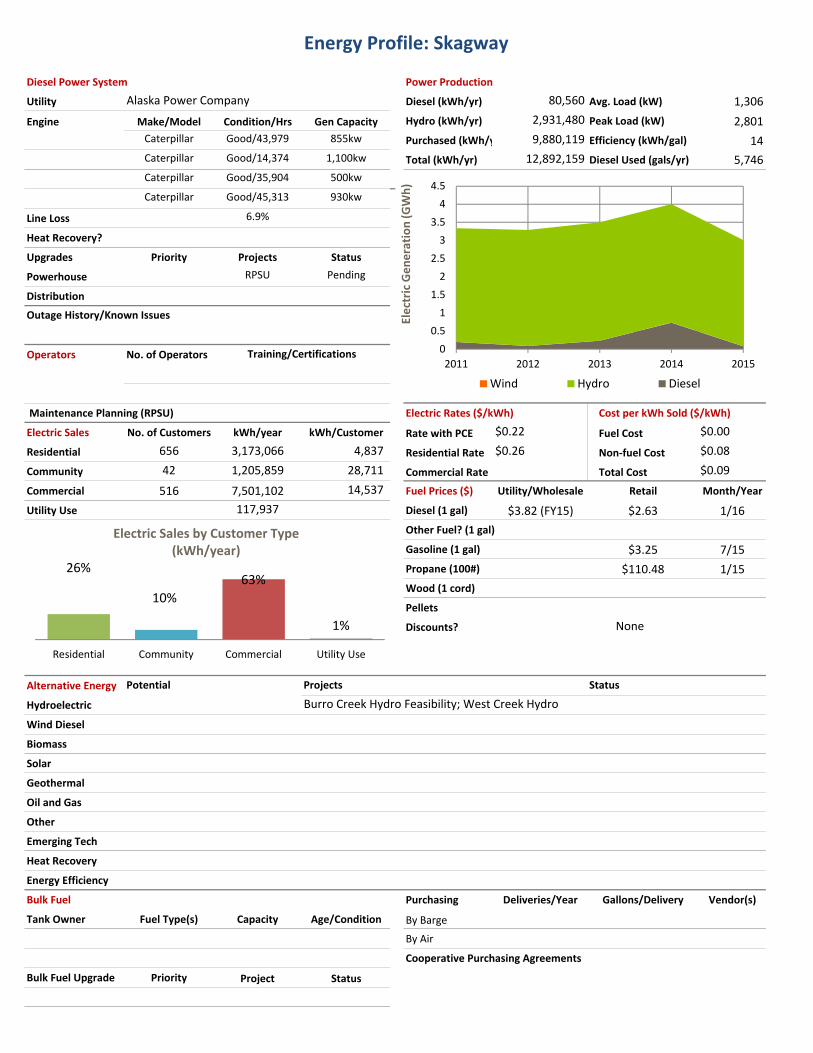
Energy Profile: Skagway
Diesel Power System Power Production
Utility Diesel (kWh/yr) 80,560 Avg. Load (kW) 1,306
Engine Make/Model Condition/Hrs Gen Capacity Hydro (kWh/yr) 2,931,480 Peak Load (kW) 2,801
Caterpillar Good/43,979 855kw Purchased (kWh/y 9,880,119 Efficiency (kWh/gal) 14
Caterpillar Good/14,374 1,100kw Total (kWh/yr) 12,892,159 Diesel Used (gals/yr) 5,746
Caterpillar Good/35,904 500kw
Caterpillar Good/45,313 930kw
Line Loss
Heat Recovery?
Upgrades Priority Projects Status
Powerhouse RPSU Pending
Distribution
Operators No. of Operators
Maintenance Planning (RPSU) Electric Rates ($/kWh) Cost per kWh Sold ($/kWh)
Electric Sales No. of Customers kWh/year kWh/Customer Rate with PCE $0.22 Fuel Cost $0.00
Residential 656 3,173,066 4,837 Residential Rate $0.26 Non‐fuel Cost $0.08
Community 42 1,205,859 28,711 Commercial Rate Total Cost $0.09
Commercial 516 7,501,102 14,537 Fuel Prices ($) Utility/Wholesale Retail Month/Year
Utility Use 117,937 Diesel (1 gal) $3.82 (FY15) $2.63 1/16
Other Fuel? (1 gal)
Gasoline (1 gal) $3.25 7/15
Propane (100#) $110.48 1/15
Wood (1 cord)
Pellets
Discounts?
Alternative Energy
Hydroelectric
Wind Diesel
Biomass
Solar
Geothermal
Oil and Gas
Other
Emerging Tech
Heat Recovery
Energy Efficiency
Bulk Fuel Purchasing Deliveries/Year Gallons/Delivery Vendor(s)
Tank Owner Fuel Type(s) Capacity Age/Condition By Barge
By Air
Cooperative Purchasing Agreements
Bulk Fuel Upgrade Priority Project Status
Potential Projects Status
Alaska Power Company
6.9%
Outage History/Known Issues
Training/Certifications
None
Burro Creek Hydro Feasibility; West Creek Hydro
26%
10%
63%
1%
Residential Community Commercial Utility Use
Electric Sales by Customer Type(kWh/year)
0
0.5
1
1.5
2
2.5
3
3.5
4
4.5
2011 2012 2013 2014 2015
Electric Generation (GWh)
Wind Hydro Diesel

Energy Profile: Skagway
Housing Units Occupied Vacant % Owner‐Occup. Regional Housing Authority Weatherization Service Provider
430 208 61% Tlingit‐Haida Regional HA
Housing Need Overcrowded 1‐star Energy Use Average Home Average Avg. EUI
1.0% 31.0% Energy Rating Square Feet (kBTU/sf)
Data Quality 2 star + 1,580 128
Lighting Owner Number/Type Retrofitted? Year Notes
115/LED Yes
Non‐residential Building Inventory
Building Name or Location Year Built Square Feet Audited? Retrofits Done? In ARIS?
Ferry Terminal 4000*
Petro Marine 2350*
Airport Terminal 1900*
Water Treatment Plant 4100*
Skwagway Police Dept. 1,910
KLGO NPS HQ 2450*
Arctic and Brotherhood Hall (AB Hall) 3,850
AP&T 3120*
Moore Homestead
Skagway City Hall and Museum 14,656
Recreation Center/Convention Center 12,118
Fire Hall 6,780
Health Clinic 14,461
Library 2,990
Public Works Shop 6,108
Public Bathroom (6) 4,364
Incinerator Building 6,000
Sewer Plant 5,000
Harbor Office / Restrooms 1,000
Harbor Boat Maintenance Building 4,800
Tribal Center 5,000
Apartment
Skagway City School
9147 32 14
106146 162
40
Earlier 1940s 1950s 1960s 1970s 1980s 1990s 2000‐11
Age of Housing Stock
9% 0%
90%
Retrofitted BEES Certified Untouched
Energy Efficient Housing Stock
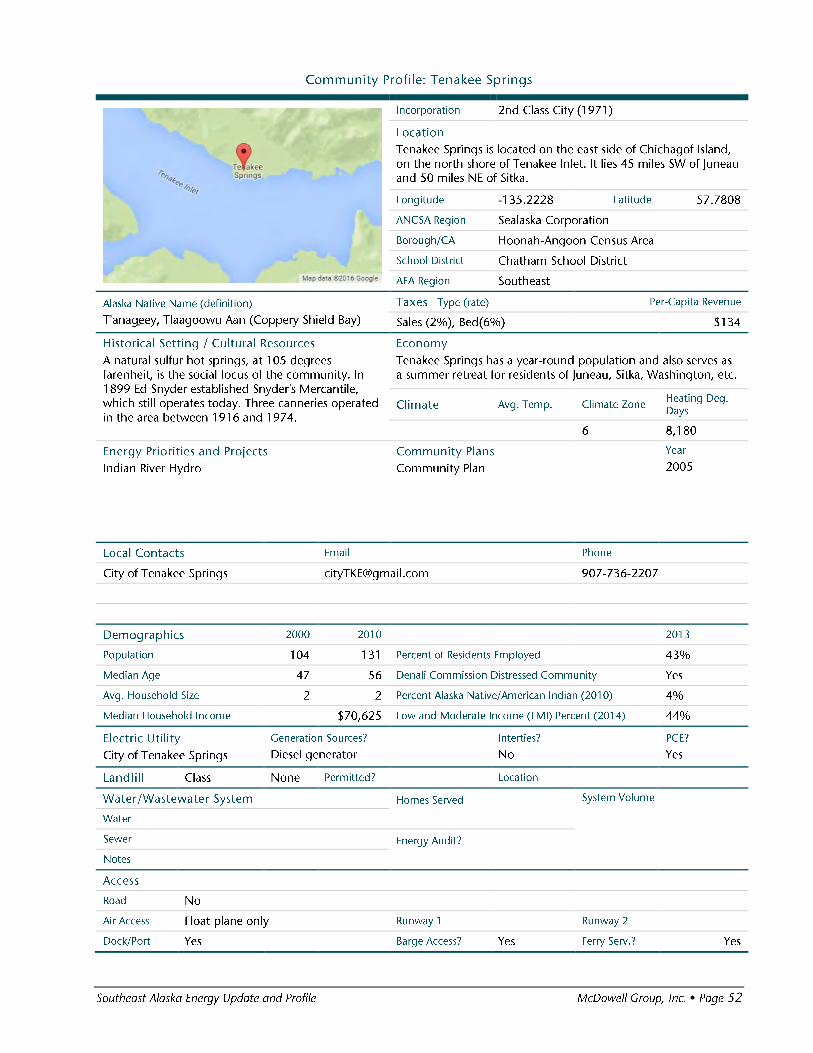
ʼ

Energy Profile: Tenakee Springs
Diesel Power System Power Production
Utility Diesel (kWh/yr) 390,901 Avg. Load (kW) 42
Engine Make/Model Condition/Hrs Gen Capacity Purchased (kWh/y 0 Peak Load (kW) 136
Unit 1 John Deere Fair/2,374 64 Hydro (kWh/yr) 0 Efficiency (kWh/gal) 13
Unit 2 John Deere Fair/20,229 88 Total (kWh/yr) 390,901 Diesel Used (gals/yr) 28,985
Unit 3 John Deere Fair/24,840 88
Unit 4
Line Loss
Heat Recovery?
Upgrades Priority Projects Status
Powerhouse RPSU Complete
Distribution
Operators No. of Operators
1
Maintenance Planning (RPSU) Electric Rates ($/kWh) Cost per kWh Sold ($/kWh)
Electric Sales No. of Customers kWh/year kWh/Customer Rate with PCE $0.32 Fuel Cost $0.39
Residential 126 224,949 1,785 Residential Rate $0.70 Non‐fuel Cost $0.26
Community 13 24,394 1,876 Commercial Rate Total Cost $0.65
Commercial 21 80,032 3,811 Fuel Prices ($) Utility/Wholesale Retail Month/Year
Utility Use 12,683 Diesel (1 gal) $4.47 (FY15) $4.26 7/15
Other Fuel? (1 gal)
Gasoline (1 gal) $4.07 7/15
Propane (100#) $89.76 7/15
Wood (1 cord)
Pellets
Discounts?
Alternative Energy
Hydroelectric
Wind Diesel
Biomass
Solar
Geothermal
Oil and Gas
Other
Emerging Tech
Heat Recovery
Energy Efficiency
Bulk Fuel Purchasing Deliveries/Year Gallons/Delivery Vendor(s)
Tank Owner Fuel Type(s) Capacity Age/Condition By Barge
D1, D2, Gas 27,000 <10yrs. By Air
Cooperative Purchasing Agreements
Bulk Fuel Upgrade Priority Project Status
Yes Complete
Potential Projects Status
12.5%
No
Outage History/Known Issues
Training/Certifications
Utility Clerk
None
Indian River Hydro construction In progress
Tenakee Inlet Geothermal Resource Assessment Complete
Nearby merchant shops, school may be too far
66%
7%
23%
4%
Residential Community Commercial Utility Use
Electric Sales by Customer Type(kWh/year)
0
0.05
0.1
0.15
0.2
0.25
0.3
0.35
0.4
0.45
0.5
2011 2012 2013 2014 2015
Electric Generation (GWh)
Wind Hydro Diesel

Energy Profile: Tenakee Springs
Housing Units Occupied Vacant % Owner‐Occup. Regional Housing Authority Weatherization Service Provider
46 101 74%
Housing Need Overcrowded 1‐star Energy Use Average Home Average Avg. EUI
0.0% Energy Rating Square Feet (kBTU/sf)
Data Quality 1 star 1,147 203
Lighting Owner Number/Type Retrofitted? Year Notes
22/LED Yes
Non‐residential Building Inventory
Building Name or Location Year Built Square Feet Audited? Retrofits Done? In ARIS?
City Shop
Community Hall 3,136
ACS Telecom Building
Tenakee School
Masaage studio
Cold Spring
Health Center
Fire Hall 3,000
Store Warehouses
Ferry Baggage Shed
Tenakee Springs Market (Formerly Snyder Mercantile)
Hot Spring Bath House
Rosie's Bar & Café / Blue Moon Café
Power House
Book Exchange
Party Time Bakery
US Post Office
Seaplane Office
Chapel
Tenakee Hot Springs Lodge
Recreation Facility
The Bakery, Shamrock Building
65
4 4 0 425
38
11
Earlier 1940s 1950s 1960s 1970s 1980s 1990s 2000‐11
Age of Housing Stock
30% 0%
70%
Retrofitted BEES Certified Untouched
Energy Efficient Housing Stock
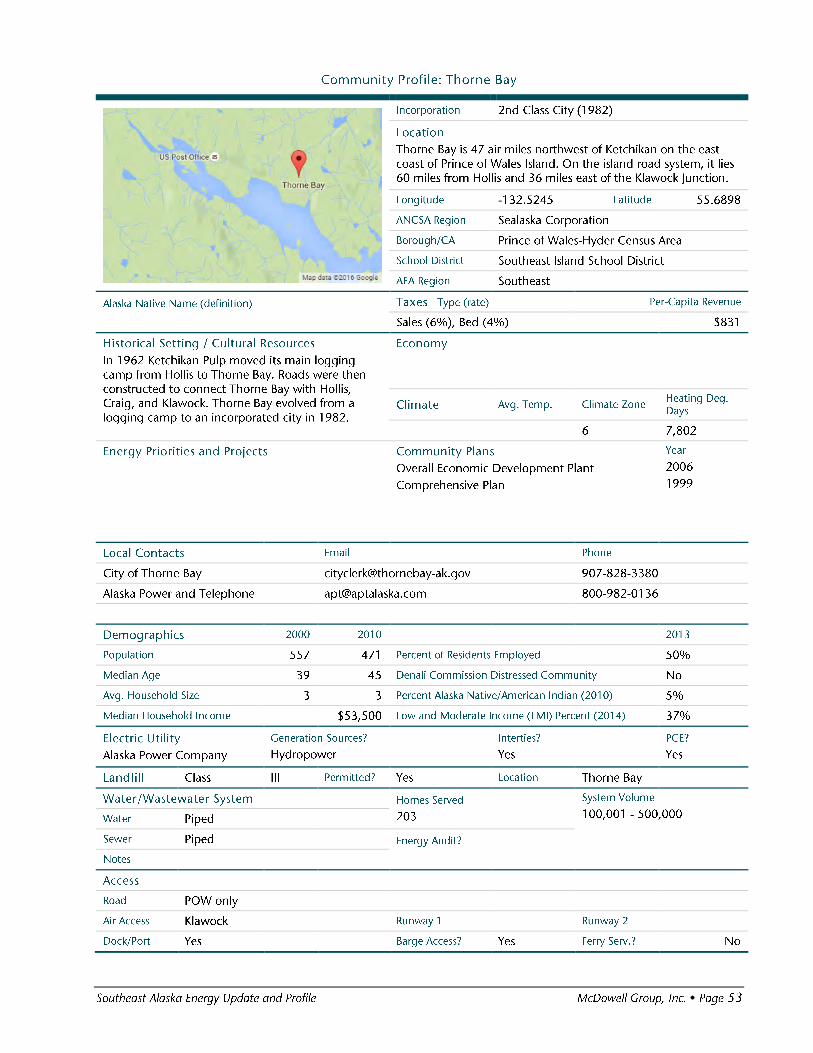

Energy Profile: Thorne Bay
Diesel Power System Power Production
Utility Diesel (kWh/yr) Avg. Load (kW) 365
Engine Make/Model Condition/Hrs Gen Capacity Wind (kWh/yr) Peak Load (kW)
Unit 1 Caterpillar Fair/30,690 650 Hydro (kWh/yr) Efficiency (kWh/gal)
Unit 2 Caterpillar Fair/15,017 425 Total (kWh/yr) purchased Diesel Used (gals/yr)
Unit 3
Unit 4
Line Loss
Heat Recovery?
Upgrades Priority Projects Status
Powerhouse
Distribution
Operators No. of Operators
Maintenance Planning (RPSU) Electric Rates ($/kWh) Cost per kWh Sold ($/kWh)
Electric Sales No. of Customers kWh/year kWh/Customer Rate with PCE $0.22 Fuel Cost
Residential 321 1,482,095 4,617 Residential Rate $0.26 Non‐fuel Cost
Community 32 349,501 10,922 Commercial Rate Total Cost
Commercial 130 1,484,109 11,416 Fuel Prices ($) Utility/Wholesale Retail Month/Year
Utility Use 75,987 Diesel (1 gal) $3.00 1/16
Other Fuel? (1 gal)
Gasoline (1 gal) $2.77 1/16
Propane (100#) $54.29 1/16
Wood (1 cord)
Pellets
Discounts?
Alternative Energy
Hydroelectric
Wind Diesel
Biomass
Solar
Geothermal
Oil and Gas
Other
Emerging Tech
Heat Recovery
Energy Efficiency
Bulk Fuel Purchasing Deliveries/Year Gallons/Delivery Vendor(s)
Tank Owner Fuel Type(s) Capacity Age/Condition By Barge
The Port D2, Gasoline 9000 total 20 yrs. By Air
The Tackle Shop Gasoline 3,000 >20 yrs. Cooperative Purchasing Agreements
AP&T Diesel #2 20,000 <20 yrs.
Bulk Fuel Upgrade Priority Project Status
No Incomplete
Potential Projects Status
Alaska Power Company
No
Outage History/Known Issues
Training/Certifications
None
school wood fired boiler construction operational
44%
10%
44%
2%
Residential Community Commercial Utility Use
Electric Sales by Customer Type(kWh/year)
0
0.0002
0.0004
0.0006
0.0008
0.001
0.0012
2011 2012 2013 2014 2015
Electric Generation (GWh)
Diesel Hydro Wind

Energy Profile: Thorne Bay
Housing Units Occupied Vacant % Owner‐Occup. Regional Housing Authority Weatherization Service Provider
231 92 89%
Housing Need Overcrowded 1‐star Energy Use Average Home Average Avg. EUI
0.0% Energy Rating Square Feet (kBTU/sf)
Data Quality 1 star plus 1,303 169.3
Lighting Owner Number/Type Retrofitted? Year Notes
78/HPS
Non‐residential Building Inventory
Building Name or Location Year Built Square Feet Audited? Retrofits Done? In ARIS?
School and Gym 29,000 Yes
USFS Shop and Maintenance (Gray) 7,000
Four Plex_Jason Clowers 4,000
Church of Thorne Bay 4,000
AdventureAK Lodging 3,450
Tackle Shack Shop, fishing guides and motel 2,700
Baptist Church 2,500
USFS Admin Building 2,450
City Hall 2,250
Daycare, Tongass Federal Credit Union, AK Laser Maid 2,000
Rushingone Fire Hall 2,000
Multi Use 2,000
School Shop w 8x10 shed attached 1,600
Silverthorne Charters 1,500
The Port +Pacific Airways + Post Office 1,500
Sewer Treatment 1,300
Alaska and Proud Market 1,200
POWGAS 1,000
Library 900
Bay Chalet 800
Fire Hall 650
Thorne Bay Café 560
Catholic Church 460
School Warehouse (Brown) 360
Teacher Housing 300
Samson GE Office 250
8 015
28
8876
92
16
Earlier 1940s 1950s 1960s 1970s 1980s 1990s 2000‐11
Age of Housing Stock
6% 3%
92%
Retrofitted BEES Certified Untouched
Energy Efficient Housing Stock


Energy Profile: Whale Pass
Diesel Power System Power Production
Utility Diesel (kWh/yr) 324,233 Avg. Load (kW) 31
Engine Make/Model Condition/Hrs Gen Capacity Wind (kWh/yr) 0 Peak Load (kW) 219
Unit 1 John Deere Fair/25,479 70 Hydro (kWh/yr) 0 Efficiency (kWh/gal) 12
Unit 2 John Deere Fair/50,164 70 Total (kWh/yr) 324,233 Diesel Used (gals/yr) 27,747
Unit 3 John Deere Fair/30,947 110
Unit 4
Line Loss
Heat Recovery?
Upgrades Priority Projects Status
Powerhouse RPSU Pending
Distribution
Operators No. of Operators
Maintenance Planning (RPSU) Electric Rates ($/kWh) Cost per kWh Sold ($/kWh)
Electric Sales No. of Customers kWh/year kWh/Customer Rate with PCE $0.23 Fuel Cost $0.35
Residential 73 199,528 2,733 Residential Rate $0.58 Non‐fuel Cost
Community 2 5,020 2,510 Commercial Rate Total Cost $0.35
Commercial 13 77,947 5,996 Fuel Prices ($) Utility/Wholesale Retail Month/Year
Utility Use 14,920 Diesel (1 gal) $3.54 (FY15) $3.15 1/16
Other Fuel? (1 gal)
Gasoline (1 gal) $2.87 1/16
Propane (100#) $62.86 1/16
Wood (1 cord)
Pellets
Discounts?
Alternative Energy
Hydroelectric
Wind Diesel
Biomass
Solar
Geothermal
Oil and Gas
Other
Emerging Tech
Heat Recovery
Energy Efficiency
Bulk Fuel Purchasing Deliveries/Year Gallons/Delivery Vendor(s)
Tank Owner Fuel Type(s) Capacity Age/Condition By Barge
By Air
Cooperative Purchasing Agreements
Bulk Fuel Upgrade Priority Project Status
Potential Projects Status
8.3%
Operational but not being used
Outage History/Known Issues
Training/Certifications
None
Neck Lake Hydro
School and WPCA Biomass feasibility In progress
Facility would need to moved closer to school
67%
2%
26%
5%
Residential Community Commercial Utility Use
Electric Sales by Customer Type(kWh/year)
0.24
0.25
0.26
0.27
0.28
0.29
0.3
0.31
0.32
0.33
2011 2012 2013 2014 2015
Electric Generation (GWh)
Wind Hydro Diesel

Energy Profile: Whale Pass
Housing Units Occupied Vacant % Owner‐Occup. Regional Housing Authority Weatherization Service Provider
32 20 100%
Housing Need Overcrowded 1‐star Energy Use Average Home Average Avg. EUI
0.0% Energy Rating Square Feet (kBTU/sf)
Data Quality 1 star 1,334 126
Lighting Owner Number/Type Retrofitted? Year Notes
1/HPS
1/LED
Non‐residential Building Inventory
Building Name or Location Year Built Square Feet Audited? Retrofits Done? In ARIS?
Sharon Hillis Clinic / Fire Hall 1,536
Post Office 160
Library 800
School 3,124
Bear Trail Store
Church
AP&T Gen Set
Teacher Housing (2) 300
SSRAA Hatchery
0 0 0 0 0
42
100
Earlier 1940s 1950s 1960s 1970s 1980s 1990s 2000‐11
Age of Housing Stock
6% 0%
94%
Retrofitted BEES Certified Untouched
Energy Efficient Housing Stock

Southeast Alaska Energy Update and Profile McDowell Group, Inc. Page 55
Community Profile: Wrangell
Incorporation Unified Home Rule Borough (2008)
Location Wrangell is located on the northwest tip of Wrangell Island, between Juneau and Ketchikan. It is near the mouth of the Stikine River, a historic trade route to the Canadian Interior.
Longitude -132.3804 Latitude 56.4717
ANCSA Region Sealaska Corporation
Borough/CA City and Borough of Wrangell
School District Wrangell Public School District
AEA Region Southeast
Alaska Native Name (definition)
Shtax’héen Taxes Type (rate) Per-Capita Revenue
Sales (7%), Property (12.75 mills), Bed (6%) $1,774
Historical Setting / Cultural Resources Wrangell is one of the oldest non-Native settlements in Alaska, established to support fur trading and later mining up the nearby Stikine River. By 1916, fishing and forest products had become the primary industries. The Alaska Pulp sawmill, Wrangell's largest employer, closed in late 1994.
Economy Tourism and growth in the seafood processing and marine services industries have become the economic backbone.
Climate Avg. Temp. Climate Zone Heating Deg. Days
44.6 6 7,200-9,000
Energy Priorities and Projects
Community Plans Downtown Revitalization Final Report
Year
2006
Local Contacts Email Phone
City and Borough of Wrangell [email protected] 907-874-2381
Wrangell Cooperative Association [email protected] 907-874-4304
Wrangell Municipal Power and Light [email protected] 907-874-3602
Demographics 2000 2010 2013
Population 2,369 Percent of Residents Employed 51%
Median Age 47 Denali Commission Distressed Community No
Avg. Household Size 3 Percent Alaska Native/American Indian (2010) 22%
Median Household Income $48,324 Low and Moderate Income (LMI) Percent (2014) 46%
Electric Utility Wrangell Light & Power
Generation Sources?
Hydropower Interties?
Yes PCE?
No
Landfill None Shipped South
Water/Wastewater System Homes Served
1,150
System Volume
1,000,001 - 5,000,000 Water Piped
Sewer Piped Energy Audit?
Notes
Access
Road No
Air Access Publicly owned; asphalt Runway 1 6,000’x150’ Runway 2
Dock/Port Yes Barge Access? Yes Ferry Serv.? Yes

Energy Profile: Wrangell
Diesel Power System Power Production
Utility Diesel (kWh/yr) 613,959 Avg. Load (kW) 4,500
Engine Make/Model Condition/Hrs Gen Capacity Wind (kWh/yr) 0 Peak Load (kW) 9,000
Unit 1 2 MW Hydro (kWh/yr) 37,355,250 Efficiency (kWh/gal)
Unit 2 2 MW Total (kWh/yr) 37,969,209 Diesel Used (gals/yr) 476,072
Unit 3 2 MW
Unit 4 2.5 MW
Line Loss
Heat Recovery?
Upgrades Priority Projects Status
Powerhouse
Distribution
Operators No. of Operators
Maintenance Planning (RPSU) Electric Rates ($/kWh) Cost per kWh Sold ($/kWh)
Electric Sales No. of Customers kWh/year kWh/Customer Residential Rate $0.11 Fuel Cost
Residential 1,102 13,930,587 12,641 Commercial Rate $0.12 Non‐fuel Cost
Government 162 16,148,145 99,680 Heat Rate $0.09 Total Cost
Commercial 645 4,087,515 6,337 Fuel Prices ($) Utility/Wholesale Retail Month/Year
Utility Use 742,874 Diesel (1 gal) $2.61 (FY15) $3.85 1/16
Other Fuel? (1 gal)
Gasoline (1 gal) $3.66 1/16
Propane (100#)
Wood (1 cord)
Pellets
Discounts?
Alternative Energy
Hydroelectric
Wind
Biomass
Solar
Demand Side Manag
Oil and Gas
Other
Emerging Tech
Heat Recovery
Energy Efficiency
Bulk Fuel Purchasing Deliveries/Year Gallons/Delivery Vendor(s)
Tank Owner Fuel Type(s) Capacity Age/Condition By Barge
By Air
Cooperative Purchasing Agreements
Bulk Fuel Upgrade Priority Project Status
Potential Projects Status
Wrangell Municipal Light and Power
8.0%
no
Outage History/Known Issues
Training/Certifications
None
Sunrise Lake (water supply) hydro Completed
Wind resource assessement Ongoing
USFS Wrangell RD Biomass feasibility
Rebates for electric heat Ongoing
Electric Vehicle feasibility study Complete
40%
46%
12%
2%
Residential Community Commercial Utility Use
Electric Sales by Customer Type(kWh/year)
‐
5,000
10,000
15,000
20,000
25,000
30,000
35,000
40,000
45,000
2011 2012 2013 2014 2015
Electric Generation (GWh)
Wind Hydro Diesel
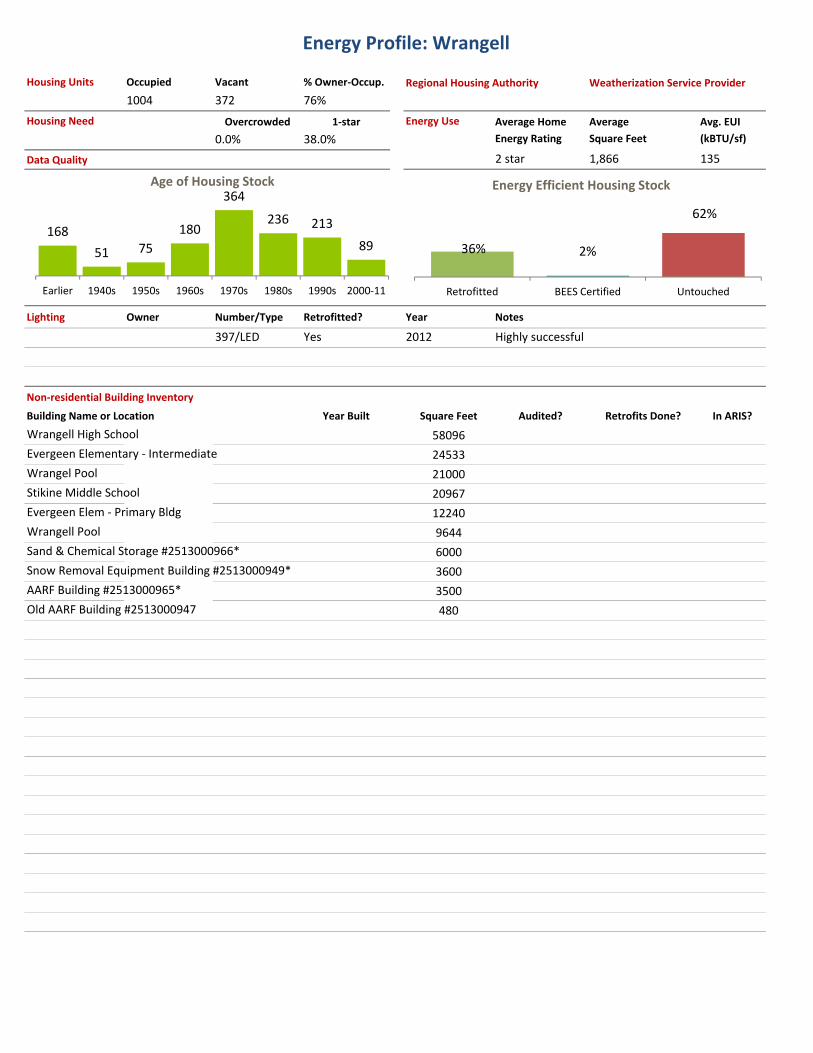
Energy Profile: Wrangell
Housing Units Occupied Vacant % Owner‐Occup. Regional Housing Authority Weatherization Service Provider
1004 372 76%
Housing Need Overcrowded 1‐star Energy Use Average Home Average Avg. EUI
0.0% 38.0% Energy Rating Square Feet (kBTU/sf)
Data Quality 2 star 1,866 135
Lighting Owner Number/Type Retrofitted? Year Notes
397/LED Yes 2012 Highly successful
Non‐residential Building Inventory
Building Name or Location Year Built Square Feet Audited? Retrofits Done? In ARIS?
Wrangell High School 58096
Evergeen Elementary ‐ Intermediate 24533
Wrangel Pool 21000
Stikine Middle School 20967
Evergeen Elem ‐ Primary Bldg 12240
Wrangell Pool 9644
Sand & Chemical Storage #2513000966* 6000
Snow Removal Equipment Building #2513000949* 3600
AARF Building #2513000965* 3500
Old AARF Building #2513000947 480
168
51 75
180
364
236 213
89
Earlier 1940s 1950s 1960s 1970s 1980s 1990s 2000‐11
Age of Housing Stock
36% 2%
62%
Retrofitted BEES Certified Untouched
Energy Efficient Housing Stock

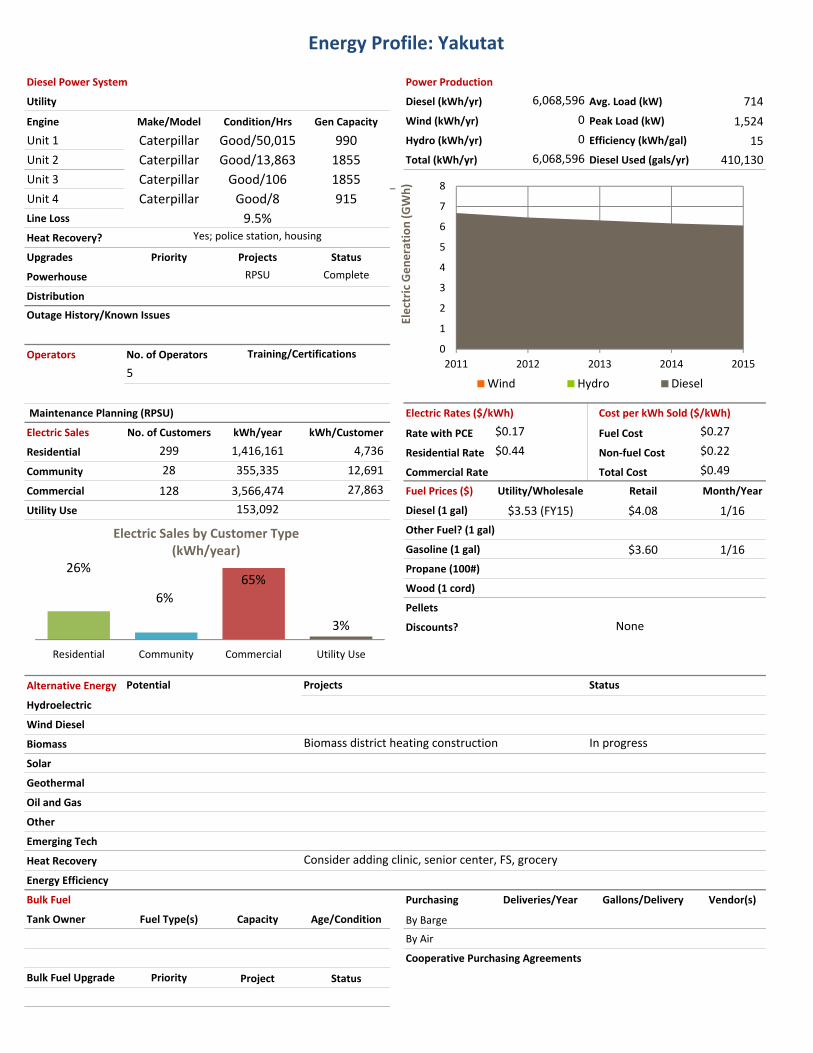
Energy Profile: Yakutat
Diesel Power System Power Production
Utility Diesel (kWh/yr) 6,068,596 Avg. Load (kW) 714
Engine Make/Model Condition/Hrs Gen Capacity Wind (kWh/yr) 0 Peak Load (kW) 1,524
Unit 1 Caterpillar Good/50,015 990 Hydro (kWh/yr) 0 Efficiency (kWh/gal) 15
Unit 2 Caterpillar Good/13,863 1855 Total (kWh/yr) 6,068,596 Diesel Used (gals/yr) 410,130
Unit 3 Caterpillar Good/106 1855
Unit 4 Caterpillar Good/8 915
Line Loss 9.5%
Heat Recovery?
Upgrades Priority Projects Status
Powerhouse RPSU Complete
Distribution
Operators No. of Operators
5
Maintenance Planning (RPSU) Electric Rates ($/kWh) Cost per kWh Sold ($/kWh)
Electric Sales No. of Customers kWh/year kWh/Customer Rate with PCE $0.17 Fuel Cost $0.27
Residential 299 1,416,161 4,736 Residential Rate $0.44 Non‐fuel Cost $0.22
Community 28 355,335 12,691 Commercial Rate Total Cost $0.49
Commercial 128 3,566,474 27,863 Fuel Prices ($) Utility/Wholesale Retail Month/Year
Utility Use 153,092 Diesel (1 gal) $3.53 (FY15) $4.08 1/16
Other Fuel? (1 gal)
Gasoline (1 gal) $3.60 1/16
Propane (100#)
Wood (1 cord)
Pellets
Discounts?
Alternative Energy
Hydroelectric
Wind Diesel
Biomass
Solar
Geothermal
Oil and Gas
Other
Emerging Tech
Heat Recovery
Energy Efficiency
Bulk Fuel Purchasing Deliveries/Year Gallons/Delivery Vendor(s)
Tank Owner Fuel Type(s) Capacity Age/Condition By Barge
By Air
Cooperative Purchasing Agreements
Bulk Fuel Upgrade Priority Project Status
Potential Projects Status
Yes; police station, housing
Outage History/Known Issues
Training/Certifications
None
Biomass district heating construction In progress
Consider adding clinic, senior center, FS, grocery
26%
6%
65%
3%
Residential Community Commercial Utility Use
Electric Sales by Customer Type(kWh/year)
0
1
2
3
4
5
6
7
8
2011 2012 2013 2014 2015
Electric Generation (GWh)
Wind Hydro Diesel

Energy Profile: Yakutat
Housing Units Occupied Vacant % Owner‐Occup. Regional Housing Authority Weatherization Service Provider
259 190 51%
Housing Need Overcrowded 1‐star Energy Use Average Home Average Avg. EUI
12.0% Energy Rating Square Feet (kBTU/sf)
Data Quality 3 star plus 1,263 101
Lighting Owner Number/Type Retrofitted? Year Notes
Non‐residential Building Inventory
Building Name or Location Year Built Square Feet Audited? Retrofits Done? In ARIS?
Yakutat Airport CFR*
Yakutat Junior & High School 29853
Yakutat Elementary School 23051
Vocational Education Building wood shop 20381
Maintenance Shop #2513000955 14960
Maintenance Shop #2513000955* 14960
Yakutat Courthouse & Apartment 5508
Courthouse and Apartment 5508
A/P ARFF Building #2513000970 3500
Yakutat City Offices 1610
City Hall Offices 1610
Yakutat School Modulars 1540
442
21 19
101140
86
36
Earlier 1940s 1950s 1960s 1970s 1980s 1990s 2000‐11
Age of Housing Stock
14% 0%
86%
Retrofitted BEES Certified Untouched
Energy Efficient Housing Stock