South_Blakey_Evolution of GIS Based Analysis ECIM Haugesund 2010
29
The Evolution of GIS Based Analysis in Petroleum Exploration Bernie South & Grahame Blakey, ExxonMobil International Ltd ECIM User Conference, Haugesund, Norway 14 th September 2010
-
Upload
bernie-south -
Category
Documents
-
view
45 -
download
1
Transcript of South_Blakey_Evolution of GIS Based Analysis ECIM Haugesund 2010

The Evolution of GIS Based Analysis in Petroleum ExplorationBernie South & Grahame Blakey, ExxonMobil International Ltd
ECIM User Conference, Haugesund, Norway
14th September 2010

2
2 Contradictory “Truths”Things are always better, faster, neater now than they used to be
It ain’t necessarily so...............
In the good old days, things were much better than they are now
Again, not necessarily so.........
* Image Source : http://www.copyrightfreephotos.com/gallery/technology/81744816/
*

3
So what about GIS?
• Is GIS based analysis in petroleum exploration better now, than then?
• Things have definitely evolved – that’s for sure
• Evolution of GIS analysis in exploration• Integration, visualisation, analysis, standards, assessment
• Then vs Now – are we better now?
• Geoscientist vs IT Support
• Conclusions
recycle

4
GIS Integration
• Geoscience applications• Petrel, OW/ SW, GeoFrame/ IESX, Kingdom, Finder, Recall etc. etc.
• CAD, GPS, Google Earth, SAP
• ArcGIS Server, ArcSDE, Silverlight, SharePoint, OpenSpirit
• Database integration/ data models• Oracle, PetroBank, PPDM, SEGY, PODS, APDM, IHS, Tellus
• Workflow integration• Regional geology, play assessment, data management, QA/ QC, asset
management dashboards

5
From the Geoscience Perspective
• Nature of modern petroleum geoscience
• Use of Arc technology as a multi-disciplinary collaboration and synthesis tool
• Examples of useful techniques
• Observations on the use of GIS technology in organizations

6
Some Basic Concepts
Exploration for oil and gas is a 4 dimensional problemX,Y,Z, and time
At its core exploration geoscience is trying to understand the basic equation of:
Known hydrocarbon occurrence = f(geologic variables)
Petroleum geologists try to draw correlations between mapped geology and known hydrocarbon occurrences in order to extrapolate that understanding into finding new fields
In industry terms, a temporal grouping of these variables is often referred to as a “PLAY” (e.g. Cretaceous Reef Talus Play)
Individual mapped layers in a “PLAY” are referred to as “PLAY ELEMENTS”reservoirstructurehydrocarbon charge (source, maturation, migration)
Successful exploration in geoscience requires and understanding of these play elements in both their spatial and temporal dimensions

7
Simple Timing Diagram of Play Elements
400 300 200 100 Geologic TimeScale
PetroleumSystem Events
Rock Units
Source Rock
Reservoir Rock
Seal Rock
Trap Formation
Overburden Rock
Gen/Migration/Accum
Preservation
Paleozoic Mesozoic Cenozoic
D M P P TR
J K P N
Elem
ents
Proc
esse
s
Simple Basic Concepts
Critical Moment

8
Simple Basic ConceptsSingle layer mapping of the subsurface play elements:
• Source rocks• Reservoir rocks• Multiple structural horizons
Timing relationships between play elements:
• Reservoir deposition• Structuring of subsurface• Source rock maturation• Hydrocarbon migration

9
• Structural Geology• Stratigraphy - Sedimentology• Geomorphology• Reservoir Quality• Geochemistry• Basin History Modeling• Hydrocarbon Migration • Gravity - Magnetics - Remote Sensing• Geophysics
ReflectionRefractionTomography
• Paleogeography• Plate Tectonics and Plate
Reconstructions• Assessment• Operations Geology• Petrophysics and Well Log Analysis
Greatest Challenge of all:
Integration and Synthesis
Regional Geology:The Broadest of Geoscience Areas of Study

10
GIS technology adopted into work process by geoscience
professionalswith a variety of backgrounds
Integration- “live” on screen mapping- focused discussions
Final Product - Fully integrated geological story
Exploration/Production“Gravity-Magnetics-Seismic ”
12 years
Pontification Session
Bernie SouthExploration/Production
“Regional Geology-Assessment”19 years
“Geochemistry-Basin Modeler”3 years
Exploration/Production“Stratigraphy”
20 years
Exploration“Regional Geology ”
2 years
Exploration/Production“Stratigraphy”
18 years
Sheet 10 Exxon Tectonic Map of the World 1985
Common Collaboration & Synthesis Environment

11
Houston
London
Melbourne
Stavanger
Anchorage
LagosJakarta
Rio De Janeiro Geoscientists in various countries can expect data organized in a consistent and predictable manner
Exploration is a Global Business
Coverages
Grids
Images
Text
Area specific
Company-wide -standard table structure
13 standard INFO table structures used for ALL company ARC-based geoscience data sets
Standardization
after Mazzo &Burroughs,2000

12
Standardization
• The great thing about standards is there are so many to choose from..........
OGCISO
APDMPODS
FGDC
GIGS
EPSG
SDTSWITSML
GML1911519106
The Enterprise Geodatabase
*
• File based “proprietary” standards > XML > Enterprise Geodatabase
Includes data supplied by IHS its affiliated and subsidiary companies and its data partners; Copyright (2010), all rights reserved.

13
Geological Map Compilation
- Company reports- Primary data - Published literature
All data integratedwithin GIS
environment
Geo-registered images from reports & literature
Plate Reconstruction
map iteration using pre-rift
reconstruction model
Oldies but Goodies:Georectification
14
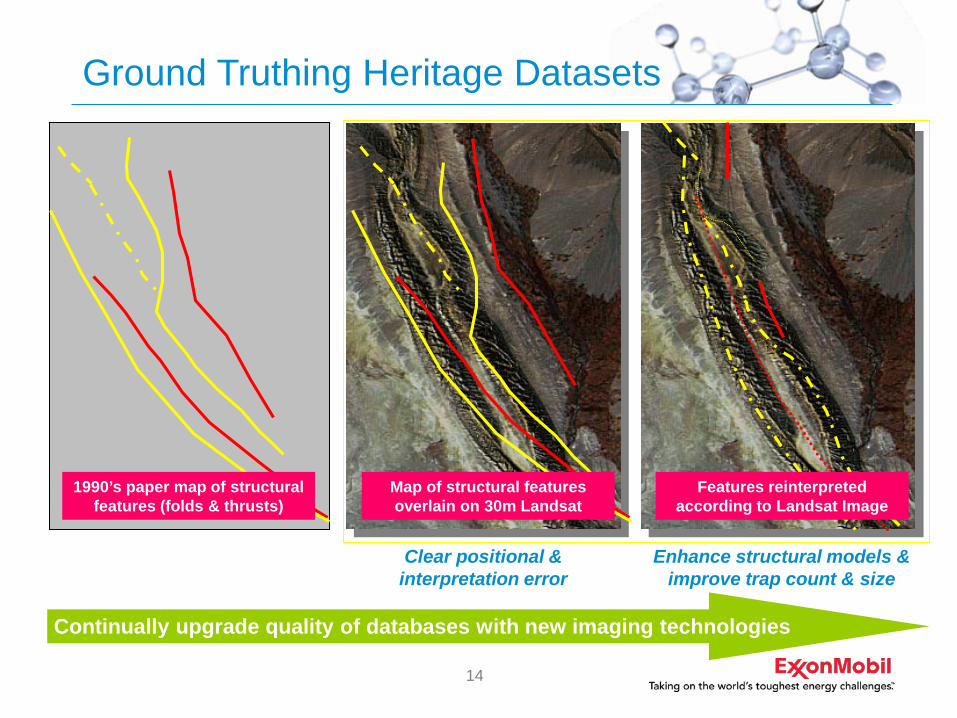
Ground Truthing Heritage Datasets
Enhance structural models & improve trap count & size
Clear positional & interpretation error
1990’s paper map of structural features (folds & thrusts)
Map of structural features overlain on 30m Landsat
Features reinterpreted according to Landsat Image
Continually upgrade quality of databases with new imaging technologies

15
•All non-digital seismic data (.TIFF) collected from published literature, geo-referenced and input into “virtual database”
•Query using ArcView “hot-link” or Geodesk (EMEC proprietarysoftware)
•Used to constrain structural style & trap definition/risking
•Provided supplement to wells database - variable positional accuracy
“Virtual” Seismic Database

16
---------------- 100 Mi.
BU_ID AGE MEAS_DPTH_ VDEPTH VDEPTHSS1000256 OLIGOCENE 1506 1506 -6361000256 EOCENE EARLY STAGE 3866 3866 -29961000256 MAASTRICHTIAN 7758 7758 -68881000256 PRE-CRETACEOUS 8066 8066 -71961000256 TOTAL VERT DEPTH (DRIL) 8165 8165 -72951000256 CAMBRO-ORDOVICIAN 8066 8066 -71961000256 CRETACEOUS 7758 7758 -68881000256 EOCENE MIDDLE STAGE 2440 2440 -15701000257 TOTAL VERT DEPTH (DRIL) 15077 15077 -147461000257 CRETACEOUS 13601 13601 -132701000257 CAMPANIAN 14608 14608 -142771000257 EOCENE MIDDLE STAGE 4954 4954 -46231000257 MAASTRICHTIAN 13601 13601 -132701000257 EOCENE LATE STAGE 4639 4639 -43081000257 PALEOCENE 10676 10676 -103451000257 OLIGOCENE 2103 2103 -17721000258 EOCENE MIDDLE STAGE 2221 2221 -16171000258 TOTAL VERT DEPTH (DRIL) 7918 7918 -73141000258 MAASTRICHTIAN 7660 7660 -70561000258 EOCENE LATE STAGE 1980 1980 -13761000258 PALEOCENE 5753 5753 -51491000259 OLIGOCENE 2703 2703 -26291000259 EOCENE EARLY STAGE 7700 7700 -76261000259 EOCENE MIDDLE STAGE 6050 6050 -59761000259 EOCENE LATE STAGE 5565 5565 -54911000259 PALEOCENE 9625 9625 -95511000259 TOTAL VERT DEPTH (DRIL) 12230 12230 -121561000260 CRETACEOUS 7662 7662 -71381000260 MAASTRICHTIAN 7662 7662 -71381000260 EOCENE EARLY STAGE 3915 3915 -33911000260 TOTAL VERT DEPTH (DRIL) 7903 7903 -73791000260 EOCENE MIDDLE STAGE 2358 2358 -18341000260 CAMBRO-ORDOVICIAN 7772 7772 -72481000260 OLIGOCENE 1455 1455 -9311000260 EOCENE LATE STAGE 2080 2080 -15561000260 PRE-CRETACEOUS 7772 7772 -72481000260 PALEOCENE 5802 5802 -52781000261 TOTAL VERT DEPTH (DRIL) 7856 7856 -73231000261 PALEOCENE 5814 5814 -52811000261 MAASTRICHTIAN 7653 7653 -7120
Historic Tops File
Filtered, Sorted, and Joined to coverage
Making vendor and legacy data work for you
Map Constructed from Reclassified Control Points
Data Source : Lynx Information Systems
Data manually reclassified
117 CRETACEOUS LOWER
26 CRETACEOUS UPPER
239 DEVONIAN
123 DEVONIAN LOWER
1 DEVONIAN MIDDLE
75 DEVONIAN UPPER
2 EOCENE
2458 EOCENE EARLY STAGE
1791 EOCENE LATE STAGE
1609 EOCENE MIDDLE STAGE
154 JURASSIC
7 JURASSIC LOWER
7 JURASSIC MIDDLE
50 JURASSIC UPPER
1 KIMMERIDGIAN
4 L CARBONIFEROUS
7 L CRETACEOUS
5 L DEVONIAN
1 L OLIGOCENE
1 L SILURIAN
107 LWR. OLIGOCENE
1 M SILURIAN
1 M TRIASSIC
1542 MAASTRICHTIAN
3 MESOZOIC UNDIFF
37 MIDDLE PERMIAN
24 MIOCENE
114 MISSISSIPPIAN
1316 OLIGOCENE
CRETACEOUS LOWER CRETCRETACEOUS UPPER CRET
DEVONIAN DEVODEVONIAN LOWER DEVODEVONIAN MIDDLE DEVODEVONIAN UPPER DEVO
EOCENE EOCENEEOCENE EARLY STAGE EOCENEEOCENE LATE STAGE EOCENE
EOCENE MIDDLE STAGE EOCENEJURASSIC JURAS
JURASSIC LOWER JURASJURASSIC MIDDLE JURASJURASSIC UPPER JURAS
KIMMERIDGIAN JURASL CARBONIFEROUS CARBO
L CRETACEOUS CRETL DEVONIAN DEVO
L OLIGOCENE OLIGOL SILURIAN SILUR
LWR. OLIGOCENE OLIGOM SILURIAN SILURM TRIASSIC TRIASS
MAASTRICHTIAN CRETMESOZOIC UNDIFF MSZMIDDLE PERMIAN PERM
MIOCENE MIOCENEMISSISSIPPIAN CARBO
OLIGOCENE OLIGO
Data Reclassification
Reclassified Tops
Unique List of Tops

17
Structure Grid
Grid of Well Penetration Depth
Well Depth (Points) to Grid
Grid conditional & focal mean functions to extrapolate to 5 KM
Area of Well Penetrations Within 5 KM
Grid conditional function- create categorical grid
Convert cat. grid to polygons
Wells with TD Information
Screening of Exploration Maturity
Includes data supplied by IHS its affiliated and subsidiary companies and its data partners; Copyright (2003), all rights reserved.
18
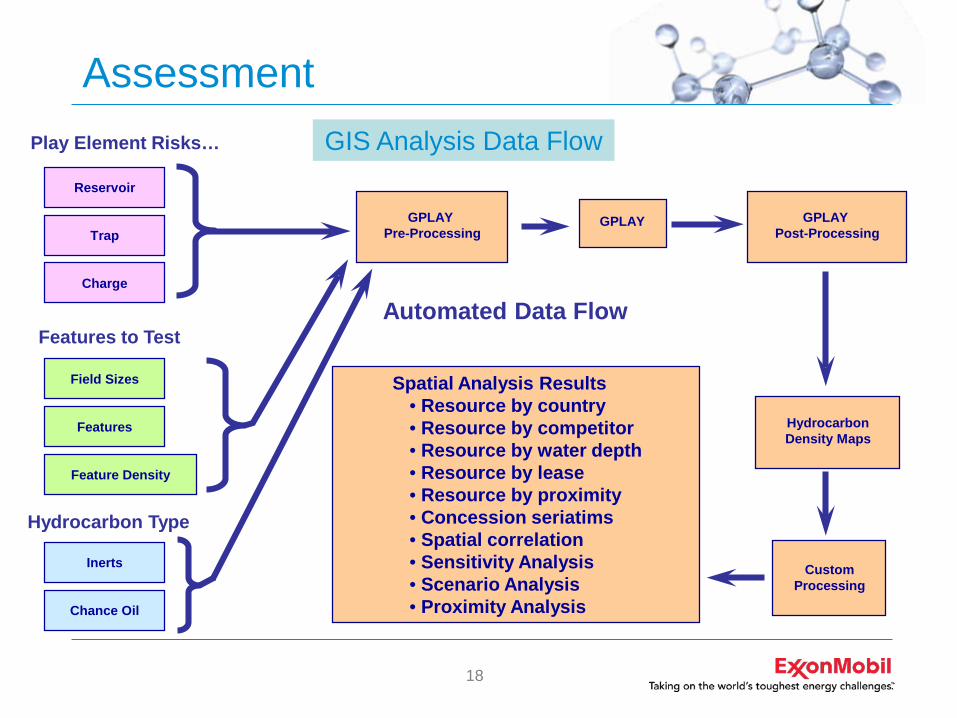
GIS Analysis Data FlowReservoir
Trap
Charge
Field Sizes
Feature Density
Features
Chance Oil
Inerts
Play Element Risks…
Features to Test
Hydrocarbon Type
GPLAYPre-Processing
GPLAYPost-Processing
GPLAY
HydrocarbonDensity Maps
CustomProcessing
Spatial Analysis Results• Resource by country• Resource by competitor• Resource by water depth• Resource by lease• Resource by proximity• Concession seriatims• Spatial correlation• Sensitivity Analysis• Scenario Analysis• Proximity Analysis
Automated Data Flow
Assessment
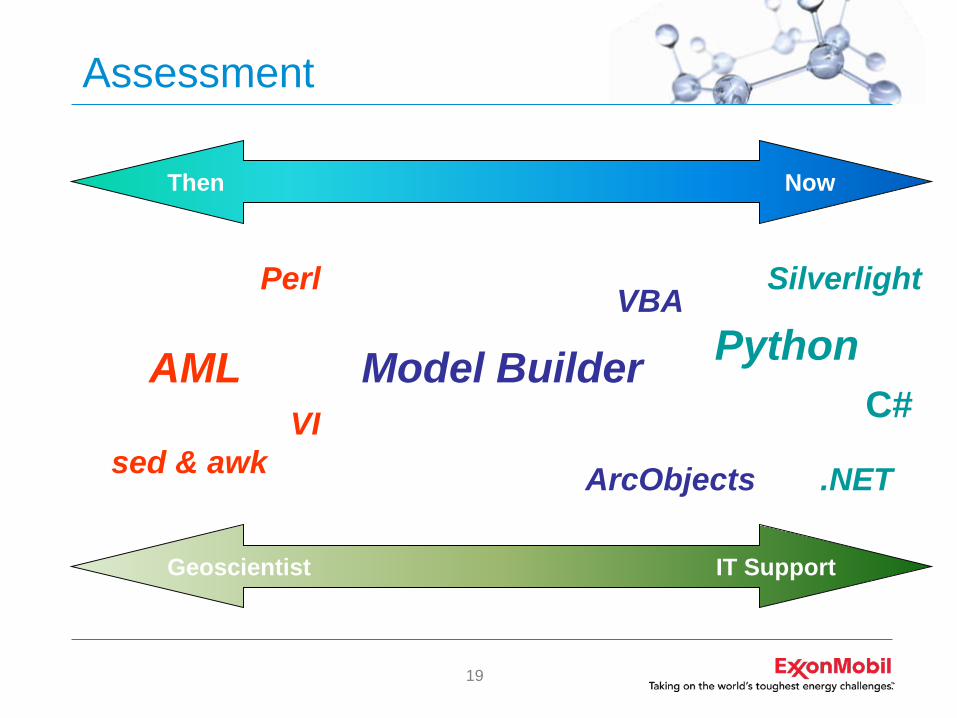
19
Assessment
Then Now
Geoscientist IT Support
AML Model Builder PythonPerl
sed & awk
VBA
ArcObjects
Silverlight
.NET
VI C#

20
Visualisation
Discoveries to Date
Discoveries in 1977Discoveries in 1945
Includes data supplied by IHS its affiliated and subsidiary companies and its data partners; Copyright (2010), all rights reserved.

21
Analysis
Scatter Plot Matrix:Dynamic exploration of spatial and analytical relationships
Includes data supplied by IHS its affiliated and subsidiary companies and its data partners; Copyright (2010), all rights reserved.

22
Input Data Sets Risk (derived from geologic maps)
Expected Field Size Distributionof Remaining Resource
LegendOil FieldGas FieldProspectDry Structure
Features
After:Hood et. A, 2000
Remaining Resource Mean = Net Risk * Number of Prospects * Avg. Field Size
Assessment

23
Composite Hydrocarbon Resource Density Map
• Assessment input data sets processed spatially and analyzed with proprietary statistical software•Output of statistical software joined to input polygons•Hydrocarbon resource summed from stacked multiple exploration target horizons•Composite volume normalized by polygonal area to create hydrocarbon resource density map
Seriatim of Concessions by Hydrocarbon Resource
Concession Oil Gas CondensateA1051 375.0 3480 2.3A953 120.5 983 1.9 A250 90.2 520 .8A1620 61.1 101 .3
~ ~ ~ ~
Overlay of Concession
Polygons
Relating Economics to Geology

24
Then vs Now

25
Things We Have Learned• Grow some “hybrid” people
People who can bridge the gap between GIS and geology
• Position GIS technology as part of important core work processes
• Engage (and enable) well respected technical leaders
• Demonstrate performance (easier, faster, better)
• Engage management in the process of collaborationAllow them to see the process and understand it
• Be sensitive to those trying to learn GIS Need to "save face" for these people to learn without feeling technologically “out of touch”
• Be realistic in your expectations for rate of change

26
Things We Have Learned
• Don’t oversell and under-produce - Enthusiasm is good, BUT- Uncontrolled exuberance often gets out of hand and works against you
in the long run; marginalizing your views as those of a zealot or technocrat
• Don’t underestimate the inertia of the organizational culture People are comfortable in their protected expertise niche and in many
cases resist change• Don’t be a computing snob
Computing literacy remains a secondary skill in most organizations• Be aware that there will always be people who refuse to engage
- Don’t spend an inordinate amount of effort here...- Ultimately competitive pressure is much more effective than intellectual
or philosophical arguments

27
In Conclusion
• Like others, the geoscience community were practising spatial analytical techniques long before the emergence of GIS technology
• Colouring pencils, Mylar traces, light tables etc...
• GIS was almost immediately attractive to the more enlightened geoscientists
• ExxonMobil was client No. 26 on ESRI’s books
• GIS – the tools, the datasets, the user community, have come a long way since
• Definite advancements have been made – but we may have also lost (compromised) some abilities along the way

28
In Conclusion
• Geospatial analytical techniques now more accessible to a far wider audience
• Underlying spatial analysis theory, techniques and tools have not really changed that much over the last 30 years or more
• Delivery mechanism has improved – analysis tools are certainly more accessible – but they tend to be more “black box” – more difficult for the average user to get in and “get down and dirty” with
• To deliver an effective GIS based analysis strategy requires the collaboration of a “broad church”
• The geoscientist, the GIS practitioner, the developer/ programmer, the data management professional, the IT infrastructure expert, the web developer.....
• Impossible to imagine practising petroleum exploration without GIS
• Challenge has moved from selling the value of the technology (that battle is largely won) to maintaining and growing the depth of understanding in the ever evolving tools & processes

29
Thank You
Any Questions ???
1. Authors/employers may make an oral presentation of the same material provided proper acknowledgement of SPE copyright ownership is made.2. Authors/employers may incorporate all or part of the paper in future writings or presentations. If the entire paper or a portion thereof is used in substantially unchanged form, proper acknowledgement of SPE copyright must be made. If the paper is substantially changed or altered in substance so that it is a new work of authorship, reference should be made to the SPE publication.