South Lyon Community Schools€¦ · Note to Pension Required Supplemental Information Schedules...
112
South Lyon Community Schools South Lyon, Michigan Comprehensive Annual Financial Report with Supplemental Information Year Ended June 30, 2015
Transcript of South Lyon Community Schools€¦ · Note to Pension Required Supplemental Information Schedules...

South Lyon Community Schools
South Lyon, Michigan
Comprehensive AnnualFinancial Reportwith Supplemental Information
Year Ended June 30, 2015

Comprehensive
Annual Financial Report
of
South Lyon Community Schools
345 South Warren
South Lyon, Michigan 48178
For the Fiscal Year Ended
June 30, 2015
Melissa Baker
Superintendent of Schools
Board of Education
Steve Brummer
President
Amy McCusker
Vice President
Carrie Hanshaw
Secretary
Randall Clark
Treasurer
Anthony Abbate
Trustee
Michele Lurz
Trustee
Justin Gusick
Trustee
Prepared by
James R. Graham, Assistant Superintendent for Business and Finance
Amy Dagenhardt, Controller
Aimee Turowski, Finance Bookkeeper

South Lyon Community Schools
Contents
Introductory Section
Letter of Transmittal i-ix
Administrative Organization Chart x
ASBO Certificate of Excellence in Financial Reporting xi
Financial Section
Independent Auditor's Report 1-3
Management's Discussion and Analysis (as Part of RequiredSupplemental Information) 4-13
Basic Financial Statements
Government-wide Financial Statements:Statement of Net Position 14Statement of Activities 15-16
Fund Financial Statements:Governmental Funds:
Balance Sheet 17Reconciliation of the Balance Sheet of Governmental Funds to the
Statement of Net Position 18Statement of Revenue, Expenditures, and Changes in Fund Balances 19Reconciliation of the Statement of Revenue, Expenditures,
and Changes in Fund Balances of Governmental Fundsto the Statement of Activities 20
Proprietary Fund:Statement of Net Position 21Statement of Revenue, Expenses, and Changes in Net Position 22Statement of Cash Flows 23
Fiduciary Funds - Statement of Fiduciary Assets and Liabilities 24
Notes to Financial Statements 25-46

South Lyon Community Schools
Contents (Continued)
Required Supplemental Information 47
Budgetary Comparison Schedule - General Fund 48
Schedule of South Lyon Community Schools’ Proportionate Share of the NetPension Liability 49
Schedule of South Lyon Community Schools' Pension Plan Contributions 50
Note to Pension Required Supplemental Information Schedules
Note to Required Supplemental Information
51
52
Other Supplemental Information 53
Nonmajor Governmental Funds:Combining Balance Sheet 54-55Combining Statement of Revenue, Expenditures, and
Changes in Fund Balances (Deficit) 56-57
Schedule of Bonded Indebtedness 58
Special Revenue Fund - Combining Statement of Revenue, Expenditures, andChanges in Fund Balance - Budget and Actual 59
Debt Service Funds - Combining Statement of Revenue, Expenditures, andChanges in Fund Balances (Deficit) - Budget and Actual 60-61
Capital Projects Funds - Combining Statement of Revenue, Expenditures, andChanges in Fund Balances (Deficit) - Budget and Actual 62-63
Schedule of Cash and Cash Equivalents 64
Long-term Debt 65
Schedule of Long-term Debt 66-67
Schedule of Changes in Long-term Debt 68-69

South Lyon Community Schools
Contents (Continued)
Statistical and Other Information (Unaudited) 70
Financial Trend Information: 71Net Position by Component 72Changes in Governmental Net Position 73Changes in Business-type Net Position 74Changes in Net Position - Total Primary GovernmentFund Balances - Governmental FundsChanges in Fund Balances - Governmental Funds
7576-7778-79
Revenue Capacity Information:Taxable Value and Actual Value of Taxable Property 80Direct and Overlapping Property Tax Rates 81-82Principal Property Taxpayers 83Property Tax Levies and Collections 84
Debt Capacity Information:Ratios of Bonded Debt Outstanding 85-86General Obligation Bonds Outstanding 87Direct and Overlapping Governmental Activities Debt 88Legal Debt Margin 89-90
Demographic and Economic Information:Demographic and Economic Statistics 91Principal Employers 92
Operating Information:Full-time Equivalent School District Employees 93Operating IndicatorsCapital Asset Information
9495-96
Federal Awards Supplemental Information Issued UnderSeparateCover

i
October 22, 2015
To Citizens and Board Members:
The Comprehensive Annual Financial Report of South Lyon Community Schools (the “School District”) as of and for
the fiscal year ended June 30, 2015 is submitted herewith. This report was prepared by the business department
and contains all activities under the control of the Board of Education. Responsibility for both the accuracy of the
presented data and the completeness and fairness of the presentation, including all disclosures, rests with the School
District. We believe that the data as presented is accurate in all material respects and is presented in a manner
designed to fairly set forth the financial position and results of operations of the School District as measured by the
financial activity of its various funds with all disclosures necessary to enable the reader to gain the maximum
understanding of the School District’s financial affairs.
Reporting Entity and Services
The South Lyon Community School District is an independent reporting entity fully meeting the criteria established
by the Governmental Accounting Standards Board. All funds of the School District are included in this report. The
School District does not have component units.
The financial section reports separately the governmental fund types, proprietary fund type, and the fiduciary fund
type administered by the board.
Report Organization
This Comprehensive Annual Financial Report was prepared to provide important information, both financial and
nonfinancial in nature, to be used not only by the Board of Education and other administrative officers of the School
District, but also by many other groups including taxpayers and patrons of the School District, investors and
creditors, grantor agencies, the State of Michigan and other oversight entities, consumer groups, and School District
employees.
This report is divided into the following major sections:
Introductory Section
This section introduces the reader to the South Lyon Community School District and to this report. Included are
facts about the School District, this transmittal letter, the School District’s organization chart, and the Association of
School Business Officials Certificate of Excellence in Financial Reporting for the year ended June 30, 2014.
Financial Section
The financial section includes the independent auditor’s report on the financial statements and schedules,
management’s discussion and analysis, government-wide financial statements, the fund financial statements, notes to
the financial statements, and required and other supplemental information.
Management is responsible for the financial information and representations contained in the financial statements
and other sections of the annual report. In preparing the financial statements, it is necessary that management
make informed estimates and judgments based on currently available information of the effects of certain events and
transactions.

ii
The management’s discussion and analysis, which includes an analysis of the School District’s financial position and
results of operations, government-wide financial statements, fund financial statements, and supplemental statements
and schedules presented in the financial section of this report, presents fairly and with full disclosure the financial
position and results of the financial operation at the fund and government-wide levels in conformity with accounting
principles generally accepted in the United States of America and demonstrate compliance with finance-related legal
and contractual provisions.
The basis of accounting for each fund is consistent with the activities and objectives of the fund as a fiscal and
accounting entity.
The supplemental statements and schedules contain a more detailed analysis of revenue and expenditures that are
compared to the 2014-2015 budget for the General Fund and information related to the School District’s
proportionate share of the net pension liability and schedule of the School District’s contributions to the pension
fund. Other supplemental information includes the balance sheet and statement of revenue, expenditures, and
changes in fund balances as well as statements and schedules containing a more detailed analysis of revenue and
expenditures that are compared to the 2014-2015 budget for nonmajor governmental funds as well as the schedule
of bonded indebtedness detailing interest rates and annual maturities, schedules of capital assets by building and by
source, schedules of long-term debt, and schedules of cash, cash equivalents, and investments.
Statistical Section
Although this section contains substantial financial information, these tables differ from financial statements in that
they present some nonaccounting data, compare 10 years of data, and are intended to reflect economic data,
financial trends, and the fiscal capabilities of the School District.
About South Lyon Community School District
The Community
The South Lyon Community School District is located in a suburban/rural area of the southeastern section of
Michigan, with close proximity to Detroit, Lansing, Ann Arbor, and Flint. The School District encompasses nearly
83 square miles and includes portions of Oakland, Washtenaw, and Livingston counties. Included in Oakland
County are all of the City of South Lyon and a portion of Lyon Township, Milford Township, the City of Novi, and
the City of Wixom. In Washtenaw County, included is a portion of Salem Township and Northfield Township. In
Livingston County, the School District includes a portion of Green Oak Township.
The School District continues to be a desirable area, and is one of the fastest growing in Michigan. Of the total
taxable value of the School District, over 76 percent is considered the primary residence or agricultural property of
the taxpayer. Although there is not a number for the School District, the median household income for the City of
South Lyon and Lyon Township was $51,297 and $79,375, respectively, according to the 2010 U.S. Census Bureau
estimates.
With the proximity to major cities in Michigan, residents of the School District have various job opportunities. The
unemployment rate has declined since the last fiscal year, with a statewide average now at 5.5 percent for June
2015. Regarding the three counties within the school district, the June 2015 rates for Oakland, Livingston, and
Washtenaw counties were 5.4 percent, 5.3 percent, and 4.3 percent, respectively.
The School Program
The South Lyon Community School District is a leader in curriculum, instruction, assessments, and technology.
Student scores on the state assessment test (MEAP) exceed the state averages and all schools are accredited by the
North Central Association of Colleges and Schools (NCA).
The School District has a comprehensive and model core curriculum in the areas of language arts, mathematics,
social studies, science, music, physical education, visual and performing arts, technology, and health. All curriculums
are aligned with the state standards and benchmarks. A five-year plan guides the School District through a five-
phase cycle of curriculum renewal: review/revise, installation, implementation, institutionalization, and evaluation.
This process involves teachers from all levels and schools in a constant upgrading of curriculum, instruction,
assessments, and technology. Technology is viewed as a tool to facilitate learning in any subject area and is
integrated into the K-12 curriculum. All students and staff have use of the wide area network for teaching and
learning purposes.

iii
The School District also offers programs for students with special interest and learning needs. These include
advanced placement opportunities, school to work programs, a variety of languages in the middle and high schools
(German, Spanish, Chinese, and Japanese), reading recovery/title I support, essential skills support for at-risk
students, tutorial services, and programs for special education and academically talented students.
The School District participates in the State School Code Section 105 Schools of Choice option (within Oakland
County) as well as the Section 105c Schools of Choice option (contiguous counties). The School District also offers
internal choice options where families may choose to attend any elementary school. In addition, to increase
continuity of learning experiences, kindergarten students attend school all day. The School District also offers a
senior citizen program, Kids Club for latch key students, and both state and tuition-based preschool programs.
The South Lyon Community School District is proud of the rich and varied educational opportunities we provide.
While the School District population continues to grow each year, it continues to enjoy strong parent and
community support for its students and programs.
The School District has a preschool program, seven kindergarten through grade 5 elementary schools, two grade 6
through 8 middle schools, and two grade 9 through 12 high schools. In addition, there are two support facilities.
The actual 2014-2015 full-time equivalent (FTE) fall student count was 7,658.64; however, the official state count
was 7,662.70. The official count is calculated by taking 90 percent of the current year fall count and adding it to 10
percent of the current school year winter count, and adjusting by partial FTEs received through State Aid section
23a (students moving in and out of district between count dates).
Service Efforts and Accomplishments
SCHOOL DISTRICT GOALS
In November of 2013, four goals were presented to the Board of Education to meet the challenges
and opportunities facing the school system over the next five years.
I. Instruction
In order to ensure high quality, standards-based instruction, continue to write and implement
units of study and assessments which align with state-adopted standards, such as the
Common Core State Standards.
Status
The district is continuing to write and adopt units of study which align to the state-adopted
standards, such as the Common Core State Standards. In the 2013-14 school year, new units of
study were implemented in grades 5-7 mathematics. All math courses, beginning with Algebra 1,
which are required for graduation have already been implemented and local assessments have
been created.
In the 2013-14 school year, new units of study were adopted in the following areas:
Mathematics, grades 2-4
English Language Arts- Writing, grades K-5
English Language Arts, grades 6-8
Subject Area Curriculum committees are in the process of writing new units of study for
kindergarten and first grade mathematics, reading in grades K-5, and high school English
Language Arts.

iv
II. Evaluation
In order to promote increased student achievement, continue in the development of the
teacher and administrator evaluation system that aligns with the current and changing
legislation.
Status
While the State of Michigan has not finalized all components of the legislated evaluation systems,
the District believes the systems that are in place for teachers (Marzano’s iObservation) and
administrators (Michigan ASCD’s School ADvance) align with the current legislation.
III. Financial
In order to ensure financial stability and efficient allocation of resources, update and monitor
the District’s five-year financial forecast, including the updating and/or drafting of supporting
policies and procedures.
Status
In support of this goal, the Budget Development and Administration Policy was updated in
February of 2014. This policy requires the annual General Fund operating expenditures not to
exceed operating revenues. The Five Year forecast has been updated and meets the policy
requirements, and will continue to be monitored throughout the year
IV. Capital Needs
In order to meet facility, technology and site needs, formulate a capital improvement plan
with anticipated funding through a bond ballot initiative.
Status
A bond issue was presented to the electorate and approved on May 5, 2015. The dollar amount
of the issue was $64,400,000. The projects are categorized in the following five bundles:
Bundle #1 ($19.95 million): New elementary school, Early Childhood Center additions.
Bundle #2 ($18.80 million): Elementary air quality improvements and remodelings, special
education remodeling.
Bundle #3 ($6.00 million): Technology and security improvements.
Bundle #4 ($14.00 million): Infrastructure improvements, roofing improvements, site
remodeling/replacements.
Bundle #5 ($1.55 million): Performing arts improvements, furniture and equipment.
$4.1 million additional for bond issuance costs and capitalized interest.
Accreditation
All of the School District’s high schools, middle schools, and elementary schools are accredited by AdvancED. Our
eleven schools have demonstrated quality assurance and are engaged yearly in either internal or external reviews.
South Lyon High School, Centennial Middle School, Millennium Middle School, Bartlett Elementary School, Hardy
Elementary School and Sayre Elementary School hosted external reviews in 2014-15 and were all recommended for
continuing accreditation. Our remaining five schools are scheduled to host external reviews during the 2015-16
school year.

v
Accountability Scorecards
Beginning with the 2012-13 school year, Michigan has created a color-coded scorecard system for schools to meet
the waiver requirements for the Elementary and Secondary Education Act, otherwise known as the “No Child Left
Behind” legislation. Under this program, most Michigan public schools are scored annually on factors such as
proficiency, growth in student scores over time, the existence of achievement gaps for subgroups, assessment
participation, educator evaluation, compliance with state mandates, and attendance/graduation rates. For 2014-15,
nine of our schools received a “yellow” scorecard and two schools received a “lime” scorecard.
Due to changes in the state assessment system, no color-coded scorecards will be publicly released for 2015-16.
Student Test Scores
The South Lyon Community Schools’ MEAP results have been consistently strong. In terms of either an increase in
the exceeding of test standards or a combined increase in meeting or exceeding these same standards, in 2013-14
there were improved scores for 9 out of the 18 elementary and middle school grade level tests for science, math,
social studies, writing, and reading. All test scores at the elementary and middle school grades exceeded the state
averages.
The Michigan High School Merit Exam scores for our high school students showed increases in math, reading, social
studies and science. As with our elementary and middle school scores, all scores were greater than the state
average in all subject areas in terms of meeting or exceeding the test standards.
Due to changes in the state assessment system, no district averages have yet been publicly released for 2014-15.
2014-2015 School Improvement Goals
In 1990, the State of Michigan Legislature passed Public Act 25. This act addressed a number of issues, one being
school improvement. The act requires that each school building submit an annual school improvement plan. This
plan must identify goals, procedures, assessment, cost, resources required, and staff development needs. All of our
building plans met the state requirements and the results of each building’s plan were presented in June 2015.
Employee Contracts
The teacher’s union, the SLEA, has a contract that expires on August 15, 2016. The custodial, maintenance, food
service, and transportation union (Teamsters) contract runs through the 2017-2018 fiscal year. The secretary’s
union (MESPA) contract runs through the 2018-2019 fiscal year.
New Facilities and Expansions
In 2002, voters approved a $98,850,000 bond issue, for the primary purpose of building a second high school for
the School District (South Lyon East High School opened in August 2007). In addition, the report recommended
dollars for a special education wing for Hardy Elementary (completed in August 2004), projects at Bartlett and
Salem Elementary, Millennium Middle School, and South Lyon High School, construction of a new
transportation/maintenance/technology facility (Griswold Operations Center) which opened in fall 2007, land
purchases, and other various capital projects.
In 2015, voters approved a $64,400,000 bond issue that includes a new elementary school, the expansion of the
Early Childhood Center, infrastructure improvements such as elementary air quality, HVAC upgrades, roof
replacements, and parking lots, security improvements, technology, and other various capital projects.
Since 1992, 7 of our 14 buildings were constructed and the other seven school buildings were renovated and/or
expanded. The table below indicates the construction/renovation schedule for all District facilities:

vi
Building
Construction
Date
Remodel/
Additions
Bartlett Elementary 1955 1992
Brummer Elementary 1999
Dolsen Elementary 1948 1992
Hardy Elementary 2004
Kent Lake Elementary 2001
Salem Elementary 1957 1998
Sayre Elementary 1961 1998
Centennial Middle School 1974 1999
Millennium Middle School 1966 1994
South Lyon East High School 2007
South Lyon High School 1988 1999
Griswold Operations Center 2007
Administration Building 1998
Early Childhood Center 2004
Five-year Financial Forecast
To assist the School District in providing for financial stability, the School District utilizes a five-year rolling financial
forecast. This forecast takes into account such areas as projected student enrollment, employee compensation, and
future facility operating costs to ensure that the School District has a sound long-term financial plan. This forecast
includes the operating costs associated with all bond projects. The forecast also includes projected student
enrollment increases of 1.50 - 1.75 percent annually for the next four years.
The current financial forecast meets Board Policy that requires an overall fund balance of 10% (+/- 1%), as well as
forecasted annual operating surpluses.
Financial Stability
The School District’s General Fund has finished the year with a surplus of revenue over expenditures for 17 of the
last 22 fiscal years, as well as an overall positive fund balance since 1993-1994.
Bus Fleet Rated Excellent
For the 2014-2015 fiscal year, the School District received an “excellent” rating from the Michigan state police in its
required annual inspection of buses.
Budget Award
The South Lyon Community School District continues to be one of only three school districts in Michigan to be
awarded the Meritorious Budget Award from the Association of School Business Officials International (ASBO).
The School District has submitted budgets for the 1995-1996 through the 2014-2015 fiscal years and received the
award for all 20 years.
The Meritorious Budget Awards Program is a voluntary program sponsored by ASBO International. It was designed
by school business management professionals to enable school business administrators to achieve a standard of
excellence in budget presentation. The program helps school systems build a solid foundation in the skills of
developing, analyzing, and presenting a budget.
The Meritorious Budget Award is only conferred to school systems that have met or exceeded the Meritorious
Budget Award Program criteria. No other organization or award program is specifically designed to enhance school
budgeting and honor a school system for achieving excellence in budget presentation.

vii
Economic Outlook
With the passage of Proposal A in early 1994, the funding of school districts in Michigan was drastically changed.
The previous reliance on property taxes as the main revenue source for school districts was changed to a system
that added heavy reliance on sales and income taxes. With this shift in funding, school districts are more likely to be
impacted by changes in the state’s economy.
In addition, the control of revenue has shifted to the state level. The state legislature sets the dollar amount increase
each school district will receive annually. Since the State uses its General Fund dollars to supplement the cost of
K-12 education, the legislature has no legal responsibility to increase funding to school districts. Therefore, local
school districts are dependent on the state legislature for not only the majority of revenue, but also the funding
level.
For 2010-2011, the budget included an anticipated decrease of 3.68 percent in the foundation and no increase in
anticipated enrollment. Based on this, the budget incorporates significant budget adjustments, totaling over
$4 million in expenditures reductions and revenue enhancements. The actual change in the net foundation was $0,
translating into a budget surplus for 2010-2011.
For 2011-2012, the state aid budget adopted a cut of 4.38 percent in the foundation allowance, representing the
largest reduction since the inception of Proposal A. Due to the budget adjustments that were put into place in
2010-2011, only an additional reduction of $573,000 was included in the 2011-2012 budget.
For 2012-2013, the state aid budget included an additional $66 (0.95 percent) in the foundation allowance. There
were also some one-time dollars available from the State for best practices and student performance. Also, the
teaching staff was increased by 12 positions in order to offer an all-day kindergarten program, which was required
to receive full funding for kindergarten students.
For 2013-2014, the state aid budget included an additional $60 in the foundation allowance. There were also some
one-time dollars available from the State for best practices, an equity payment for low funded districts, and student
performance, resulting in an overall increase on a per pupil basis of $170 (2.41%).
For 2014-2015, the state aid budget included an additional $50 in the foundation allowance. There were also some
one-time dollars available from the State for best practices, and student performance, resulting in an overall increase
on a per pupil basis of $143 (1.98%).
For 2015-2016, the state aid budget includes an additional $140 in the foundation allowance, however, with the
elimination of $120 per pupil from the State for best practices and student performance, the net increase on a per
pupil basis for the School District is only $20 (0.27%).
The future forecast will continue to be closely monitored and adjustments up or down may need to be made based
on the ever-changing financial environment.
Also, we continue to safeguard against future state funding issues, since employee wages are tied to the state
increase in funding each year. In addition, the School District continues to spend a portion of General Fund dollars
each year to maintain and improve our facilities through the usage of capital improvement programs. Since these
dollars are spent on one-time projects, in a lean year, these projects could be reduced to help balance the budget.
Accounting System, Budgetary, and Internal Controls
The School District maintains a system of budgetary and accounting controls designed to provide reasonable
assurance that assets are safeguarded and transactions are recorded and executed with management’s
authorization. Also, internal controls have been established to supervise the compliance with resource spending
and allocation. Management believes that these controls provide reasonable assurance that errors or irregularities
that could be material to the financial statements are prevented or would be detected within a timely period. The
budget is prepared in accordance with guidelines set forth in the State Financial Reporting Manual and state law.
viii
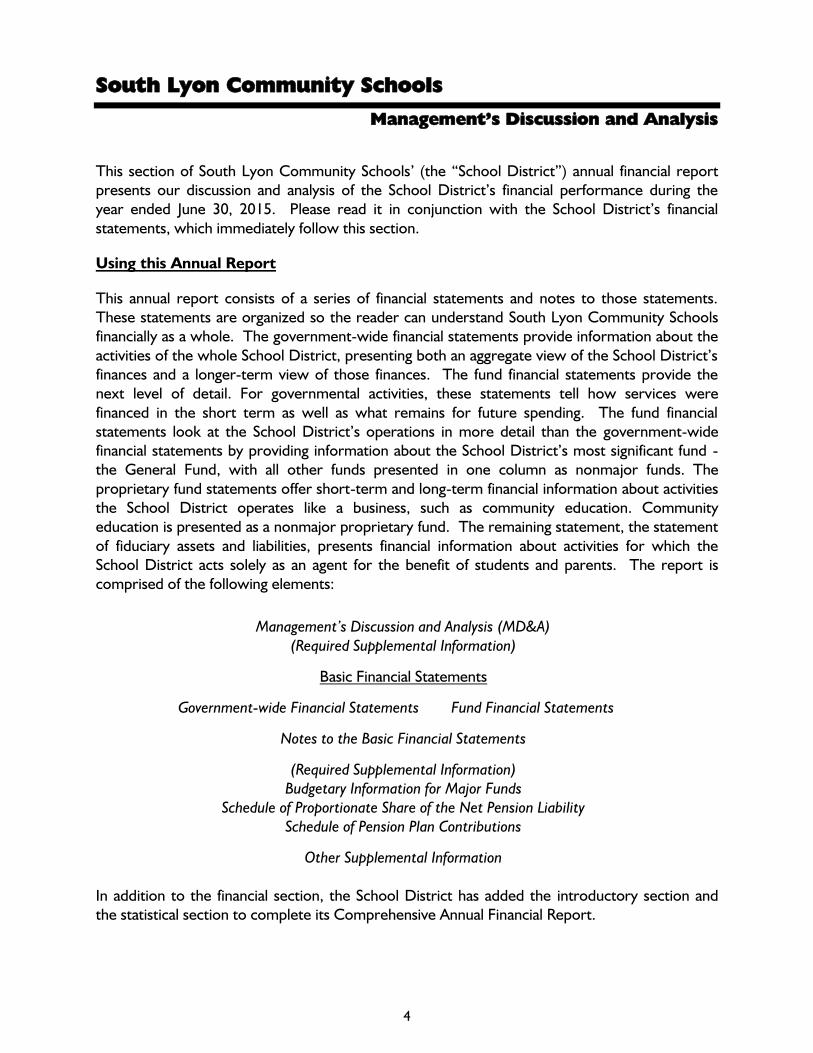
During the fiscal year, financial reports are available online to each budget administrator that identifies the budget,
current year-to-date revenue, expenditures and encumbrances, and available balances. The Board of Education
receives a financial report on a monthly basis.
The report of the School District’s independent certified public accountants, Plante & Moran, PLLC, appears on
pages 1-3 of this report. Their audit of the basic financial statements was performed in accordance with generally
accepted auditing standards and Government Auditing Standards.
Financial Policies
The following financial policies and practices of the School District had a significant impact on the School District’s
fiscal year 2014-2015 financial statements:
Fund Balance Policy – Financial stability is important to maintain a strong education program for all students. In
order to maintain financial stability, the Board of Education stipulates that the School District maintain an
unreserved fund balance in the General Fund of between 9% and 11%, with a target of 10%. Maintaining this level
of fund balance helps the School District weather sudden reductions in funding, provide adequate cash flow to meet
financial obligations, and contributes to positive bond ratings on the District’s outstanding debt.
Preventative Maintenance Schedule and Plan – Maintaining the School District facilities is important to provide
a safe and healthy learning environment. The School District maintains a preventative maintenance program as well
as a five-year capital project schedule in order to keep its buildings in good working order as well as to timely
identify replacement of significant components within a building or grounds.
Pension and Other Postemployment Benefits – The School District is required by State statute to participate in
the Michigan Public Schools Employees’ Retirement System (MPSERS), which is a state-administered cost-sharing
multiple-employer public employee retirement system. The retirement system consists of three plans: a defined
benefit plan, a hybrid plan consisting of a defined benefit plan and a defined contribution plan, and a defined
contribution plan. As part of the MPSERS reform approved by the Michigan Legislature and signed by the governor
on September 2, 2012, all employees hired prior to July 1, 2010 were required to make an election from four
options. Effective February 1, 2013, and depending on the plan selected, plan member contributions range from 0
percent up to 7.0 percent of reportable wages. Employees could elect into a defined contribution plan (DC),
whereby they are not required to make additional contributions, and could also elect out of the healthcare premium
subsidy and into the Personal Healthcare Fund (PHF), depending upon their date of hire and retirement plan
election.
Under the MPSERS act, all the retirees participating in the MPSERS pension plan have the option of continuing
health, dental, and vision coverage through MPSERS. Retirees electing this coverage contribute an amount
equivalent to the monthly cost for Part B Medicare and 10 percent of the monthly premium amount for the health,
dental, and vision coverage at the time of receiving the benefits. The MPSERS board of trustees annually sets the
employer contribution rate to fund the benefits on a pay-as-you-go basis. Participating employers are required to
contribute at that rate. Effective February 1, 2013, members can choose to contribute 3 percent of their covered
payroll to the Retiree Healthcare Fund and keep this premium subsidy benefit, or they can elect not to pay the 3
percent contribution and instead choose the Personal Healthcare Fund, which can be used to pay healthcare
expenses in retirement. Members electing the Personal Healthcare Fund will be automatically enrolled in a 2
percent employee contribution into their 457 account as of their transition date and create a 2 percent employer
match into the employee’s 401(k) account.
Employer contribution rates are established annually by the Office of Retirement Services based on actuarial data
and estimates of future retirements in the system. A factor affecting the retirement rate computation is the number
of active members for which contributions are made into the retirement system.

ix
Independent Audit
As required by Michigan State law, an annual audit of the financial records of South Lyon Community School District
has been made by an independent auditor. The School District’s financial statements were audited by Plante &
Moran, PLLC as of June 30, 2015. Their audit was made in accordance with auditing standards generally accepted
in the United States of America and Government Auditing Standards. The financial statements present fairly the
financial position of South Lyon Community Schools at June 30, 2015. Their audit also included the single audit on
federal financial assistance programs.
Excellence in Financial Reporting
The School District is committed to providing its citizens and other users with comprehensive financial reporting.
For school districts meeting the requirements of a comprehensive annual report, the Association of School Business
Officials International (ASBO) awards a Certificate of Excellence in Financial Reporting. This is the School District’s
19th submission to obtain this certificate. The School District was awarded the Certificate of Excellence in Financial
Reporting on its previous 18 submissions for the fiscal years ended June 30, 1997 through 2014.
In order to be awarded a Certificate of Excellence, a governmental unit must publish an easily readable and
efficiently organized Comprehensive Annual Financial Report whose contents conform to program standards. Such
reports must satisfy both accounting principles generally accepted in the United States of America and applicable
legal requirements.
A Certificate of Excellence is valid for a period of one year only. The School District believes our current report
conforms to program standards and we are submitting our report to ASBO for consideration for the certificate.
Acknowledgements
The preparation of this report on a timely basis could not have been performed without the efficient and dedicated
employees of the business office. We would also like to express our appreciation to other departments and
individuals who assisted in the preparation of this report. In addition, we would like to thank the members of the
Board of Education for their interest and support in conducting the financial affairs of this School District.
Respectfully submitted,
Melissa Baker
Superintendent of Schools
James R. Graham
Assistant Superintendent for Business and Finance
Amy Dagenhardt
Controller

Community and Students
Asst. Supt. For Business and Finance
Controller
South Lyon Community Schools Administrative Organization Chart
Superintendent
Asst. Supt. For CITA
Deputy Superintendent
Mgr. of Facility and Grounds
Mgr. of Custodial Operations
Mgr. of Food Services
Mgr. of Payroll and Benefits
Mgr. of Transportation
Director of Special Education
Principals
Curriculum Coordinators
Mgr. of Pupil Services and Data Processing
Technology Director
Community Ed. Supervisors
Board of Education
x
kim.partlo
Typewritten Text
ix
kim.partlo
Typewritten Text
amanda.omalley
Rectangle

Association of School Business Officials International
The Certificate of Excellence in Financial Reporting Award
is presented to
South Lyon Community Schools
For Its Comprehensive Annual Financial Report (CAFR)
For the Fiscal Year Ended June 30, 2014
The CAFR has been reviewed and met or exceeded
ASBO International’s Certificate of Excellence standards
Mark C. Pepera, MBA, RSBO, SFO John D. Musso, CAE, RSBA
President Executive Director
xi

Independent Auditor's Report
To the Board of EducationSouth Lyon Community Schools
Report on the Financial Statements
We have audited the accompanying financial statements of the governmental activities, the business-typeactivities, each major fund, and the aggregate remaining fund information of South Lyon CommunitySchools (the "School District"), as of and for the year ended June 30, 2015, and the related notes to thefinancial statements, which collectively comprise South Lyon Community Schools' basic financialstatements as listed in the table of contents.
Management’s Responsibility for the Financial Statements
Management is responsible for the preparation and fair presentation of these financial statements inaccordance with accounting principles generally accepted in the United States of America; this includesthe design, implementation, and maintenance of internal control relevant to the preparation and fairpresentation of financial statements that are free from material misstatement, whether due to fraud orerror.
Auditor’s Responsibility
Our responsibility is to express an opinion on these financial statements based on our audit. Weconducted our audit in accordance with auditing standards generally accepted in the United States ofAmerica and the standards applicable to financial audits contained in Government Auditing Standards,issued by the Comptroller General of the United States. Those standards require that we plan andperform the audit to obtain reasonable assurance about whether the financial statements are free frommaterial misstatement.
An audit involves performing procedures to obtain audit evidence about the amounts and disclosures inthe financial statements. The procedures selected depend on the auditor’s judgment, including theassessment of the risks of material misstatement of the financial statements, whether due to fraud orerror. In making those risk assessments, the auditor considers internal control relevant to the entity’spreparation and fair presentation of the financial statements in order to design audit procedures that areappropriate in the circumstances, but not for the purpose of expressing an opinion on the effectivenessof the entity’s internal control. Accordingly, we express no such opinion. An audit also includes evaluatingthe appropriateness of accounting policies used and the reasonableness of significant accountingestimates made by management, as well as evaluating the overall presentation of the financial statements.
We believe that the audit evidence we have obtained is sufficient and appropriate to provide a basis forour audit opinion.
1
Amanda.OMalley
Ann A
Amanda.OMalley
Praxity

To the Board of EducationSouth Lyon Community Schools
Opinion
In our opinion, the financial statements referred to above present fairly, in all material respects, therespective financial position of the governmental activities, the business-type activities, each major fund,and the aggregate remaining fund information of South Lyon Community Schools as of June 30, 2015 andthe respective changes in its financial position and, where applicable, cash flows, for the year then ended,in accordance with accounting principles generally accepted in the United States of America.
Emphasis of Matter
As discussed in Note 1 to the basic financial statements, effective July 1, 2014, the School Districtadopted the provisions of Governmental Accounting Standards Board Statement No. 68, Accounting and
Financial Reporting for Pensions, and GASB No. 71, Pension Transition for Contributions Made Subsequent tothe Measurement Date. The School District's unrestricted net position has been restated as of July 1,2014 as a result of this change in accounting principle. Our opinion is not modified with respect to thismatter.
Required Supplemental Information
Accounting principles generally accepted in the United States of America require that the management'sdiscussion and analysis, the major fund budgetary comparison schedule, the schedule of the SchoolDistrict's proportionate share of the net pension liability, and the schedule of the School District'spension plan contributions, as identified in the table of contents, be presented to supplement the basicfinancial statements. Such information, although not a part of the basic financial statements, is requiredby the Governmental Accounting Standards Board, which considers it to be an essential part of financialreporting for placing the basic financial statements in an appropriate operational, economic, or historicalcontext. We have applied certain limited procedures to the required supplemental information inaccordance with auditing standards generally accepted in the United States of America, which consistedof inquiries of management about the methods of preparing the information and comparing theinformation for consistency with management's responses to our inquiries, the basic financial statements,and other knowledge we obtained during our audit of the basic financial statements. We do not expressan opinion or provide any assurance on the information because the limited procedures do not provideus with sufficient evidence to express an opinion or provide any assurance.
Other Information
Our audit was conducted for the purpose of forming an opinion on the financial statements thatcollectively comprise South Lyon Community Schools' basic financial statements. The accompanyingother supplemental information, as identified in the table of contents, and introductory section andstatistical section are presented for purposes of additional analysis and are not a required part of thebasic financial statements.
The other supplemental information, as identified in the table of contents, is the responsibility ofmanagement and was derived from and relates directly to the underlying accounting and other recordsused to prepare the basic financial statements. Such information has been subjected to the auditingprocedures applied in the audit of the basic financial statements and certain additional procedures,including comparing and reconciling such information directly to the underlying accounting and otherrecords used to prepare the basic financial statements or to the basic financial statements themselves,and other additional procedures in accordance with auditing standards generally accepted in the UnitedStates of America. In our opinion, the other supplemental information, as identified in the table ofcontents, is fairly stated in all material respects in relation to the basic financial statements as a whole.
2

To the Board of EducationSouth Lyon Community Schools
The introductory section and statistical section have not been subjected to the auditing proceduresapplied in the audit of the basic financial statements, and accordingly, we do not express an opinion orprovide any assurance on them.
Other Reporting Required by Government Auditing Standards
In accordance with Government Auditing Standards, we have also issued our report dated October 22,2015 on our consideration of South Lyon Community Schools' internal control over financial reportingand on our tests of its compliance with certain provisions of laws, regulations, contracts, grantagreements, and other matters. The purpose of that report is to describe the scope of our testing ofinternal control over financial reporting and compliance and the results of that testing, and not to providean opinion on the internal control over financial reporting or on compliance. That report is an integralpart of an audit performed in accordance with Government Auditing Standards in considering South LyonCommunity Schools' internal control over financial reporting and compliance.
October 22, 2015
3
South Lyon Community Schools
Management’s Discussion and Analysis
4
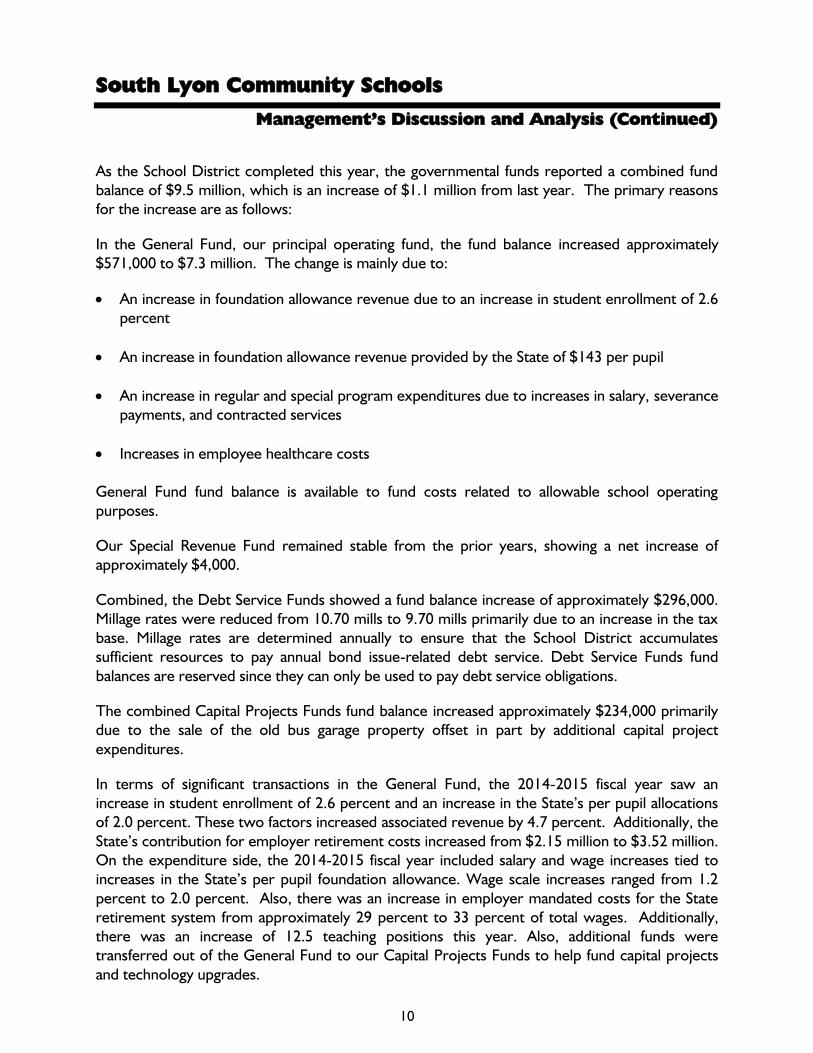
This section of South Lyon Community Schools’ (the “School District”) annual financial report
presents our discussion and analysis of the School District’s financial performance during the
year ended June 30, 2015. Please read it in conjunction with the School District’s financial
statements, which immediately follow this section.
Using this Annual Report
This annual report consists of a series of financial statements and notes to those statements.
These statements are organized so the reader can understand South Lyon Community Schools
financially as a whole. The government-wide financial statements provide information about the
activities of the whole School District, presenting both an aggregate view of the School District’s
finances and a longer-term view of those finances. The fund financial statements provide the
next level of detail. For governmental activities, these statements tell how services were
financed in the short term as well as what remains for future spending. The fund financial
statements look at the School District’s operations in more detail than the government-wide
financial statements by providing information about the School District’s most significant fund -
the General Fund, with all other funds presented in one column as nonmajor funds. The
proprietary fund statements offer short-term and long-term financial information about activities
the School District operates like a business, such as community education. Community
education is presented as a nonmajor proprietary fund. The remaining statement, the statement
of fiduciary assets and liabilities, presents financial information about activities for which the
School District acts solely as an agent for the benefit of students and parents. The report is
comprised of the following elements:
In addition to the financial section, the School District has added the introductory section and
the statistical section to complete its Comprehensive Annual Financial Report.
Management’s Discussion and Analysis (MD&A)
(Required Supplemental Information)
Basic Financial Statements
Government-wide Financial Statements Fund Financial Statements
Notes to the Basic Financial Statements
(Required Supplemental Information)
Budgetary Information for Major Funds
Schedule of Proportionate Share of the Net Pension Liability
Schedule of Pension Plan Contributions
Other Supplemental Information

South Lyon Community Schools
Management’s Discussion and Analysis (Continued)
5
Reporting the School District as a Whole - Government-wide Financial Statements
One of the most important questions asked about the School District is, “As a whole, what is the
School District’s financial condition as a result of the year’s activities?” The statement of net
position and the statement of activities, which appear first in the School District’s financial
statements, report information on the School District as a whole and its activities in a way that
helps you answer this question. We prepare these statements to include all assets and liabilities,
using the accrual basis of accounting, which is similar to the accounting used by most private
sector companies. All of the current year’s revenue and expenses are taken into account
regardless of when cash is received or paid. These two statements report the School District’s
net position - the difference between assets and deferred outflows of resources versus liabilities
and deferred inflows of resources, as reported in the statement of net position - as one way to
measure the School District’s financial health or financial position. Over time, increases or
decreases in the School District’s net position - as reported in the statement of activities - are
indicators of whether its financial health is improving or deteriorating. The relationship between
revenue and expenses is the School District’s operating results. However, the School District’s
goal is to provide services to our students, not to generate profits as commercial entities do.
One must consider many other nonfinancial factors, such as the quality of the education
provided and the safety of the schools, to assess the overall health of the School District.
The statement of net position and the statement of activities report the governmental activities
and business-type activities for the School District. Governmental activities encompass most of
the School District’s services, including instruction, support services, community services,
athletics, and food services. Property taxes, unrestricted State aid (foundation allowance
revenue), and State and federal grants finance most of these activities. Business-type activities
include community education which is financed through charges for services and user fees.
Reporting the School District’s Most Significant Funds - Fund Financial Statements
The School District’s fund financial statements provide detailed information about the most
significant funds - not the School District as a whole. Some funds are required to be established
by State law and by bond covenants. However, the School District establishes many other funds
to help it control and manage money for particular purposes (the Food Service is an example) or
to show that it is meeting legal responsibilities for using certain taxes, grants, and other money
(such as bond-funded construction funds used for voter-approved capital projects). The
governmental funds of the School District use the following accounting approach:

South Lyon Community Schools
Management’s Discussion and Analysis (Continued)
6
Governmental Funds - Most of the School District’s services are reported in
governmental funds. Governmental fund reporting focuses on showing how money
flows into and out of funds and the balances left at year end that are available for
spending. They are reported using an accounting method called modified accrual
accounting, which measures cash and all other financial assets that can readily be
converted to cash. The governmental fund statements provide a detailed short-term
view of the operations of the School District and the services it provides.
Governmental fund information helps you determine whether there are more or fewer
financial resources that can be spent in the near future to finance the School District’s
programs. We describe the relationship (or differences) between governmental
activities (reported in the statement of net position and the statement of activities) and
governmental funds in a reconciliation.
Proprietary Funds - Services for which the School District charges a fee intended to
cover the entire cost of those services are generally reported in proprietary funds.
Proprietary funds are reported in the same way as the government-wide statements.
The School District as Trustee - Reporting the School District’s Fiduciary Responsibilities
The School District is the trustee, or fiduciary, for its student activity funds. All of the School
District’s fiduciary activities are reported in a separate statement of fiduciary assets and liabilities.
We exclude these activities from the School District’s other financial statements because the
School District cannot use these assets to finance its operations. The School District is
responsible for ensuring that the assets reported in these funds are used for their intended
purposes.
The School District as a Whole
Recall that the statement of net position provides the perspective of the School District as a
whole. Table 1 provides a summary of the School District’s net position as of June 20, 2015 and
2014:

South Lyon Community Schools
Management’s Discussion and Analysis (Continued)
7
Table 1 - Condensed Statement of Net Position
2015 2014 2015 2014
Assets
Current and other assets 18.8$ 17.5$ 1.1$ 0.9$
Capital assets 175.9 181.6 - -
Total assets 194.7 199.1 1.1 0.9
Deferred Outflows of Resources
Deferred charges on bond refunding 5.9 6.5 - -
Deferred outflows related to pensions 6.1 4.4 0.1 0.1
Total deferred outflows 12.0 10.9 0.1 0.1
Total assets and deferred outflows 206.7 210.0 1.2 1.0
Liabilities
Current liabilities 22.6 19.6 0.1 0.1
Long-term liabilities 219.0 239.0 1.8 1.9
Total liabilities 241.6 258.6 1.9 2.0
Deferred Inflows of Resources -
Deferred inflows related to pensions 6.5 - 0.1 -
Total liabilities and deferred inflows 248.1 258.6 2.0 2.0
Net Position
Net investment in capital assets 39.8 34.5 - -
Restricted 0.8 0.6 - -
Unrestricted (82.0) (83.7) (0.8) (1.0)
Total net position (41.4)$ (48.6)$ (0.8)$ (1.0)$
Governmental Activities
(in millions)
Business-type Activities
(in millions)
June 30
The above analysis focuses on the net position (see Table 1). The change in net position (see
Table 2) of the School District’s governmental and business-type activities is discussed below.
The School District’s net position is ($41.4) million at June 30, 2015, while business-type net
position is ($0.8) million. Capital assets, net of related debt totaling $39.8 million, compares the
original cost, less depreciation of the School District’s capital assets, to long-term debt used to
finance the acquisition of those assets. Most of the debt will be repaid from voter-approved
property taxes collected as the debt service comes due. Restricted net position is reported
separately to show legal constraints from debt covenants and enabling legislation that limit the
School District’s ability to use those net assets for day-to-day operations. The remaining amount
of net position is unrestricted.

South Lyon Community Schools
Management’s Discussion and Analysis (Continued)
8
As required by the Government Accounting Standards Board (GASB), the School District
adopted GASB No. 68 and No. 71. These standards required the inclusion of the School
District’s proportionate share of the Michigan Public School Employees’ Retirement Plan within
the School District’s financial statements, effective July 1, 2014. The effect of the adoption was
to decrease July 1, 2014 beginning net position by $88.9 million and the inclusion of the
obligation, and related deferred inflows and outflows, in the June 30, 2015 financial statements.
All governments participating in the retirement plan were required to adopt these new
standards.
The unrestricted net position of governmental activities and business-type activities represents
the accumulated results of all past years’ operations. The unrestricted net position balance
generally enables the School District to meet working capital and cash flow requirements as well
as to provide for future uncertainties. The operating results of the General Fund will have a
significant impact on the change in unrestricted net position from year to year.
The results of this year’s operations for the School District as a whole are reported in the
statement of activities (Table 2), which shows the changes in net position for fiscal years 2014
and 2013.
TABLE 2 - Condensed Statement of Activities
2015 2014 2015 2014
Revenue
Program revenue:
Charges for services 1.0$ 1.0$ 1.6$ 1.3$
Operating grants and contributions 11.4 9.4 - -
General revenue:
Property taxes 25.4 25.9 - -
State foundation allowance 49.3 46.9 - -
Other 0.2 0.6 - -
Total revenue 87.3 83.8 1.6 1.3
Year Ended June 30
(in millions)(in millions)
Governmental Activities Business-type Activities

South Lyon Community Schools
Management’s Discussion and Analysis (Continued)
9
TABLE 2 (Continued)
2015 2014 2015 2014
Functions/Program Expenses
Instruction 45.7$ 44.1$ - $ - $
Support services 26.1 25.7 - -
Athletics 1.5 1.4 - -
Food services 1.4 1.4 - -
Community services 0.1 0.1 1.4 1.3
Interest on long-term debt 5.3 5.5 - -
Total functions/program expenses 80.1 78.2 1.4 1.3
Increase in Net Position 7.2 5.6 0.2 -
Net Position - Beginning of year (48.6) 34.7 (1.0) 0.8
Impact of GASB Statement No. 68 and 71 - (88.9) - (1.8)
Net Position - End of year (41.4)$ (48.6)$ (0.8)$ (1.0)$
Governmental Activities Business-type Activities
Year Ended June 30
(in millions) (in millions)
As reported in the statement of activities, the cost of all of our governmental activities this year
was $80.1 million. Certain activities were partially funded from those who benefited from the
programs ($1.0 million) or by other governments and organizations that subsidized certain
programs with grants and contributions ($11.4 million). We paid for the remaining “public
benefit” portion of our governmental activities with $25.4 million in taxes, $49.3 million in State
foundation allowance, and with our other revenues (i.e., interest and general entitlements).
During 2014-2015, the School District experienced an increase in net position of $7.2 million.
The key reason for the change was the reduction in outstanding debt as compared to the net
value of School District property and equipment.
As discussed above, the net cost shows the financial burden that was placed on the State and the
School District’s taxpayers by each of these functions. Since property taxes for operations and
unrestricted State aid constitute the vast majority of district operating revenue sources, the
Board of Education and administration must annually evaluate the needs of the School District
and balance those needs with State-prescribed available unrestricted resources.
The School District’s Funds
As we noted earlier, the School District uses funds to help it control and manage money for
particular purposes. Looking at funds helps the reader consider whether the School District is
being accountable for the resources taxpayers and others provide to it and may provide more
insight into the School District’s overall financial health.
South Lyon Community Schools
Management’s Discussion and Analysis (Continued)
10
As the School District completed this year, the governmental funds reported a combined fund
balance of $9.5 million, which is an increase of $1.1 million from last year. The primary reasons
for the increase are as follows:
In the General Fund, our principal operating fund, the fund balance increased approximately
$571,000 to $7.3 million. The change is mainly due to:
An increase in foundation allowance revenue due to an increase in student enrollment of 2.6
percent
An increase in foundation allowance revenue provided by the State of $143 per pupil
An increase in regular and special program expenditures due to increases in salary, severance
payments, and contracted services
Increases in employee healthcare costs
General Fund fund balance is available to fund costs related to allowable school operating
purposes.
Our Special Revenue Fund remained stable from the prior years, showing a net increase of
approximately $4,000.
Combined, the Debt Service Funds showed a fund balance increase of approximately $296,000.
Millage rates were reduced from 10.70 mills to 9.70 mills primarily due to an increase in the tax
base. Millage rates are determined annually to ensure that the School District accumulates
sufficient resources to pay annual bond issue-related debt service. Debt Service Funds fund
balances are reserved since they can only be used to pay debt service obligations.
The combined Capital Projects Funds fund balance increased approximately $234,000 primarily
due to the sale of the old bus garage property offset in part by additional capital project
expenditures.
In terms of significant transactions in the General Fund, the 2014-2015 fiscal year saw an
increase in student enrollment of 2.6 percent and an increase in the State’s per pupil allocations
of 2.0 percent. These two factors increased associated revenue by 4.7 percent. Additionally, the
State’s contribution for employer retirement costs increased from $2.15 million to $3.52 million.
On the expenditure side, the 2014-2015 fiscal year included salary and wage increases tied to
increases in the State’s per pupil foundation allowance. Wage scale increases ranged from 1.2
percent to 2.0 percent. Also, there was an increase in employer mandated costs for the State
retirement system from approximately 29 percent to 33 percent of total wages. Additionally,
there was an increase of 12.5 teaching positions this year. Also, additional funds were
transferred out of the General Fund to our Capital Projects Funds to help fund capital projects
and technology upgrades.

South Lyon Community Schools
Management’s Discussion and Analysis (Continued)
11
With the overall fund balance increasing, we believe our overall financial position will continue to
stabilize. This is due to the fact that the School District’s tax base has rebounded, which will
continue to stabilize the debt funds and allow for a modest buildup of the fund balance, while
still allowing for further decreases in the millage levy, based on the anticipated increases in the
tax base. Also, the sale of the old bus garage has provided additional funding in the Capital
Project Funds, which will continue to stabilize in the next few years. In terms of the General
Fund, we anticipate continued revenue growth, primarily due to student enrollment growth.
We also anticipate modest expenditure increases, due to caps on employee benefits and wage
increases being tied to increases in state funding.
The $64,400,000 Bond issue that was approved by the voters on May 5, 2015 will help address
capital needs that have grown since the last bond issue in 2002. Also, due to tax base growth
that has occurred and is expected to continue, the debt millage rate will remain at 9.70 mills and
then begin to decrease within a few years.
General Fund Budgetary Highlights
Over the course of the year, the School District revises its budget as it attempts to deal with
unexpected changes in revenue and expenditures. State law requires that the budget be
amended to ensure that expenditures do not exceed appropriations. The final amendment to
the budget was actually adopted just before year end. A schedule showing the School District’s
original and final budget amounts compared with amounts actually paid and received is provided
in required supplemental information of these financial statements.
Revenue - The first budget amendment increased revenue by $3.82 million. The primary reason
for the increase was due to higher student enrollment and state revenue totaling $1.10 million,
and additional state retirement system funding of $1.36 million, the proceeds from the sale of
the old bus garage of $850,000, and approximately $560,000 in additional grant revenue. For
the second amendment, revenue increased approximately $277,000, primarily due to a higher
prior period adjustment number from the State of Michigan than expected as well as additional
dollars anticipated from the Oakland County PA 18 special education revenue. The final audited
revenue in total was very close to the amended budget in total.
Expenditures - The original budget was increased due to higher costs for the state retirement
system ($1.47 million), transfers to other funds ($1.05 million), higher grants allocations
($279,000), and additional employee hiring and compensation costs ($529,000), The impact of
these items increased the budget by $3.47 million in budget amendment #1 as compared to the
original budget. For the second amendment, budgeted expenditures increased approximately
$226,000. While there were multiple adjustments higher and lower, the primary driver of the
increase was due to utility and operational costs related to the harsh winter. The final audited
expenditures in total were $320,000 under the amended budget. Of this amount, curriculum,
building allocations, grant operations, and utility/maintenance costs were $74,000, $54,000,
$75,000, and $272,000 under budget, respectively. Additionally, employee compensation was
$225,000 over budget.

South Lyon Community Schools
Management’s Discussion and Analysis (Continued)
12
There were no significant variances between the final budget and actual amounts.
Capital Assets and Debt Administration
Capital Assets
As of June 30, 2015, the School District had $175.9 million invested in a broad range of capital
assets, including land, buildings, vehicles, furniture, and equipment. This amount represents a
net decrease (including additions, disposals, and depreciation) of approximately $5.7 million, or
3.1 percent, from last year.
2015 2014
Land 9,703,246$ 10,141,706$
Land improvements 14,488,845 14,531,448
Buildings and building improvements 221,869,200 222,678,503
Buses and other vehicles 4,351,801 4,214,879
Furniture and equipment 3,128,453 3,128,453
Total capital assets 253,541,545 254,694,989
Less accumulated depreciation 77,620,145 73,083,554
Net capital assets 175,921,400$ 181,611,435$
This year’s decrease is primarily attributable to annual depreciation and the sale of the old bus
garage.
Several capital projects are planned for the 2015-2016 fiscal year, related to the $64,400,000
voter approved bond issue. We anticipate capital additions of between $1.0 and $2.0 million,
depending on construction timing comparable to the 2014-15 fiscal year. We present more
detailed information about our capital assets in Note 1 on pages 28 and 29 and Note 5 on page
35 of the financial statements
Debt
At the end of this year, the School District had $140,490,000 in bonds outstanding versus
$152,390,000 in the previous year - a change of 7.8 percent. Those bonds consisted of the
following:
2015 2014
General obligation bonds 140,490,000$ 152,390,000$

South Lyon Community Schools
Management’s Discussion and Analysis (Continued)
13
The School District’s general obligation bond rating continues to be AAA by Standard & Poor’s
and Aaa by Moody’s, with an underlying rating of A and A1, respectively. The State limits the
amount of general obligation debt that schools can issue to 15 percent of the assessed value of
all taxable property within the School District’s boundaries. If the School District issues “qualified
debt,” i.e., debt backed by the State of Michigan, such obligations are not subject to this debt
limit. The School District’s outstanding unqualified general obligation debt of $83,425,000 is
below this statutorily imposed limit.
Other obligations include accrued vacation pay and sick leave. We present more detailed
information about our long-term liabilities in the Note 7 on pages 36 to 38 of the financial
statements.
Economic Factors and Next Year’s Budgets and Rates
Our elected officials and administration consider many factors when setting the School District’s
2016 fiscal year budget. One of the most important factors affecting the budget is our student
count. The State foundation revenue is determined by multiplying the blended student count by
the foundation allowance per pupil. The blended count for the 2015 fiscal year is
90 percent and 10 percent of the October 2015 and February 2015 student counts, respectively.
The 2016 budget was adopted in June 2015, based on an estimate of students that will be
enrolled in September 2015. Approximately 81 percent of total General Fund revenue is from
the foundation allowance. Under State law, the School District cannot assess additional property
tax revenue for general operations. As a result, district funding is heavily dependent on the
State’s ability to fund local school operations. Based on early enrollment data at the start of the
2015 school year, we anticipate that the fall student count will be above the estimates used in
creating the 2015 budget. Once the final student count and related per pupil funding are
validated, State law requires the School District to amend the budget if actual district resources
are not sufficient to fund original appropriations.
Contacting the School District’s Management
This financial report is intended to provide our taxpayers, parents, and investors with a general
overview of the School District’s finances and to show the School District’s accountability for the
money it receives. If you have any questions about this report or need additional information, we
welcome you to contact the Business Office.

South Lyon Community Schools
Statement of Net PositionJune 30, 2015
Primary Government
Governmental
Activities
Business-type
Activities Total
AssetsCash and investments (Note 3) $ 7,556,100 $ 6,721 $ 7,562,821Receivables:
Accounts 152,017 - 152,017Due from other governmental units 10,950,969 - 10,950,969Due from fiduciary fund 1,022,098 - 1,022,098
Internal balances (Note 6) (1,089,554) 1,089,554 -Inventories 21,702 - 21,702Prepaid costs 100,879 - 100,879Other current assets 116,879 - 116,879Capital assets not being depreciated (Note 5) 9,703,246 - 9,703,246Capital assets being depreciated - Less accumulated
depreciation of $77,620,145 (Note 5) 166,218,154 - 166,218,154
Total assets 194,752,490 1,096,275 195,848,765
Deferred Outflows of ResourcesDeferred charges on bond refunding 5,845,002 - 5,845,002
Deferred outflows related to pensions (Note 9) 6,099,790 125,628 6,225,418
Total deferred outflows of resources 11,944,792 125,628 12,070,420
Total assets and deferred outflows ofresources 206,697,282 1,221,903 207,919,185
LiabilitiesAccounts payable 794,533 11,632 806,165Accrued payroll-related liabilities 8,298,573 32,883 8,331,456Accrued interest 589,687 - 589,687Unearned revenue (Note 4) 102,495 75,204 177,699Noncurrent liabilities:
Due within one year 12,804,027 - 12,804,027Due in more than one year 131,299,976 - 131,299,976
Net pension liability (Note 9) 87,720,416 1,806,640 89,527,056
Total liabilities 241,609,707 1,926,359 243,536,066
Deferred Inflows of Resources -
Deferred inflows related to pensions (Note 9) 6,461,007 133,067 6,594,074
Total liabilities and deferred Inflows ofResources 248,070,714 2,059,426 250,130,140
Net PositionNet investment in capital assets 39,847,038 - 39,847,038Restricted:
Debt service 662,750 - 662,750Food Service 156,826 - 156,826
Unrestricted (82,040,046) (837,523) (82,877,569)
Total net position $ (41,373,432) $ (837,523) $ (42,210,955)
The Notes to Financial Statements are anIntegral Part of this Statement. 14
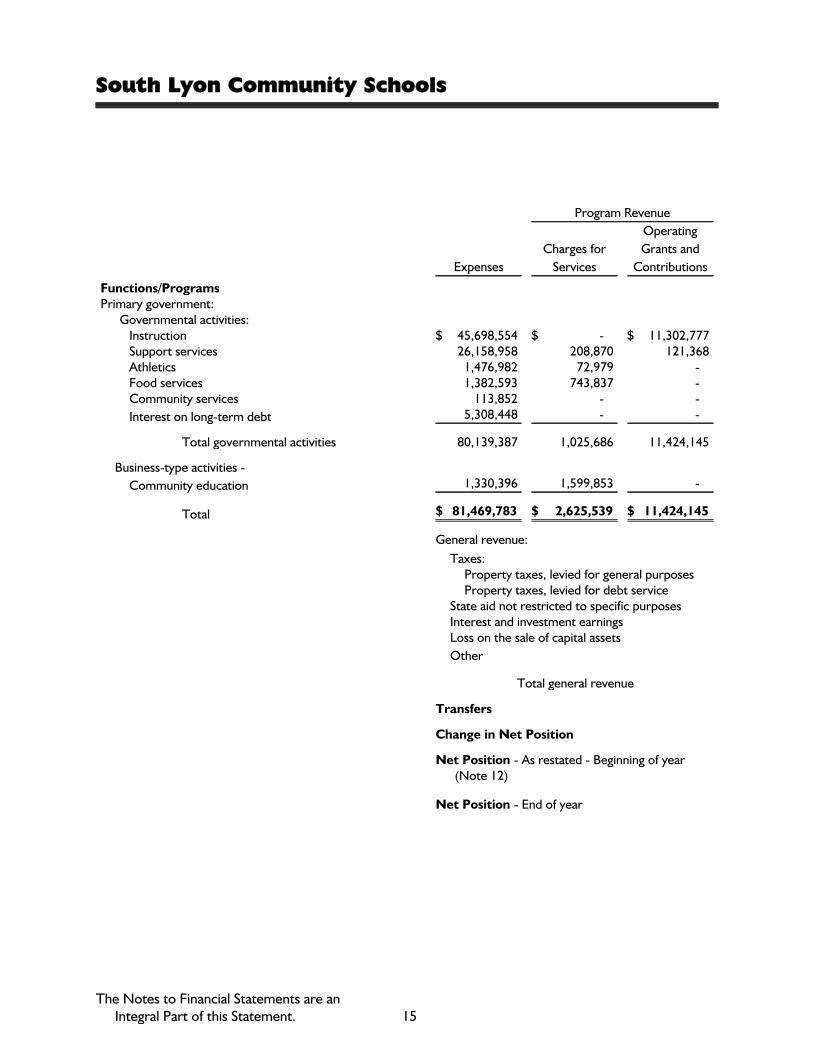
South Lyon Community Schools
Program Revenue
Expenses
Charges for
Services
Operating
Grants and
Contributions
Functions/ProgramsPrimary government:
Governmental activities:Instruction $ 45,698,554 $ - $ 11,302,777Support services 26,158,958 208,870 121,368Athletics 1,476,982 72,979 -Food services 1,382,593 743,837 -Community services 113,852 - -
Interest on long-term debt 5,308,448 - -
Total governmental activities 80,139,387 1,025,686 11,424,145
Business-type activities -
Community education 1,330,396 1,599,853 -
Total $ 81,469,783 $ 2,625,539 $ 11,424,145
General revenue:
Taxes:Property taxes, levied for general purposesProperty taxes, levied for debt service
State aid not restricted to specific purposesInterest and investment earningsLoss on the sale of capital assets
Other
Total general revenue
Transfers
Change in Net Position
Net Position - As restated - Beginning of year(Note 12)
Net Position - End of year
The Notes to Financial Statements are anIntegral Part of this Statement. 15

Statement of ActivitiesYear Ended June 30, 2015
Net (Expense) Revenue and Changes in Net
Position
Governmental
Activities
Business-type
Activities Total
$ (34,395,777) $ - $ (34,395,777)(25,828,720) - (25,828,720)
(1,404,003) - (1,404,003)(638,756) - (638,756)(113,852) - (113,852)
(5,308,448) - (5,308,448)
(67,689,556) - (67,689,556)
- 269,457 269,457
(67,689,556) 269,457 (67,420,099)
7,851,954 - 7,851,95417,553,080 - 17,553,08049,307,905 - 49,307,905
24,260 - 24,260(73,982) - (73,982)126,226 - 126,226
74,789,443 - 74,789,443
94,617 (94,617) -
7,194,504 174,840 7,369,344
(48,567,936) (1,012,363) (49,580,299)
$ (41,373,432) $ (837,523) $ (42,210,955)
16

South Lyon Community Schools
Governmental FundsBalance SheetJune 30, 2015
General Fund
Other
Nonmajor
Governmental
Funds
Total
Governmental
Funds
AssetsCash and investments (Note 3) $ 7,160,079 $ 396,021 $ 7,556,100Receivables:
Accounts 152,017 - 152,017Due from other governmental units 10,938,547 12,422 10,950,969Due from fiduciary fund 1,022,098 - 1,022,098
Due from other funds (Note 6) - 2,025,072 2,025,072Inventories - 21,702 21,702Prepaid costs 100,879 - 100,879
Other current assets - 116,879 116,879
Total assets $ 19,373,620 $ 2,572,096 $ 21,945,716
Liabilities, Deferred Inflows of Resources,and Fund Balances
LiabilitiesAccounts payable $ 763,645 $ 30,888 $ 794,533Accrued payroll-related liabilities 8,297,464 1,109 8,298,573Due to other funds (Note 6) 2,860,021 254,605 3,114,626
Unearned revenue (Note 4) 83,640 18,855 102,495
Total liabilities 12,004,770 305,457 12,310,227
Deferred Inflows of Resources - Unavailable revenue(Note 4) 94,398 - 94,398
Total liabilities and deferred inflows of resources 12,099,168 305,457 12,404,625
Fund BalancesNonspendable:
Inventory - 21,702 21,702Prepaid assets 100,879 - 100,879
Restricted:Debt service - 1,252,436 1,252,436Food services - 135,124 135,124
Committed:Capital projects - 857,377 857,377Compensated absences 2,184,639 - 2,184,639Subsequent years' building allocations 320,433 - 320,433
Unassigned 4,668,501 - 4,668,501
Total fund balances 7,274,452 2,266,639 9,541,091
Total liabilities, deferred inflows of resources,and fund balances $ 19,373,620 $ 2,572,096 $ 21,945,716
The Notes to Financial Statements are anIntegral Part of this Statement. 17
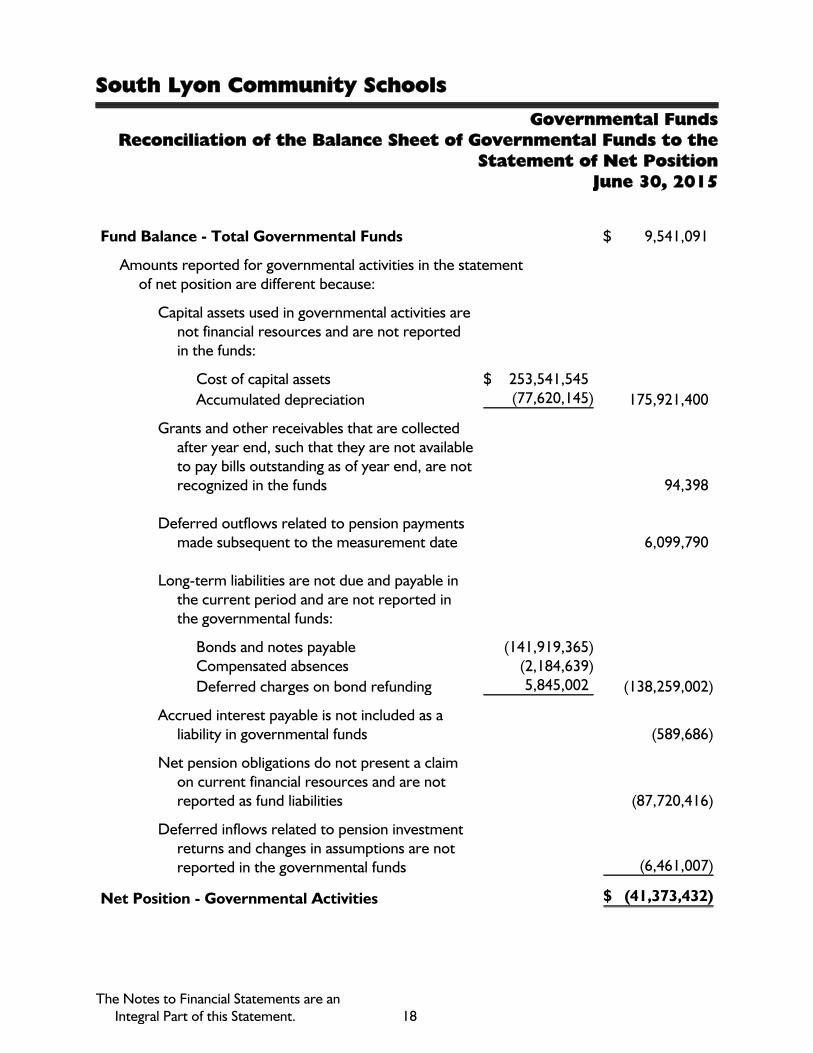
South Lyon Community Schools
Governmental FundsReconciliation of the Balance Sheet of Governmental Funds to the
Statement of Net PositionJune 30, 2015
Fund Balance - Total Governmental Funds $ 9,541,091
Amounts reported for governmental activities in the statementof net position are different because:
Capital assets used in governmental activities arenot financial resources and are not reportedin the funds:
Cost of capital assets $ 253,541,545
Accumulated depreciation (77,620,145) 175,921,400
Grants and other receivables that are collectedafter year end, such that they are not availableto pay bills outstanding as of year end, are notrecognized in the funds 94,398
Deferred outflows related to pension paymentsmade subsequent to the measurement date 6,099,790
Long-term liabilities are not due and payable inthe current period and are not reported inthe governmental funds:
Bonds and notes payable (141,919,365)Compensated absences (2,184,639)
Deferred charges on bond refunding 5,845,002 (138,259,002)
Accrued interest payable is not included as aliability in governmental funds (589,686)
Net pension obligations do not present a claimon current financial resources and are notreported as fund liabilities (87,720,416)
Deferred inflows related to pension investmentreturns and changes in assumptions are notreported in the governmental funds (6,461,007)
Net Position - Governmental Activities $ (41,373,432)
The Notes to Financial Statements are anIntegral Part of this Statement. 18
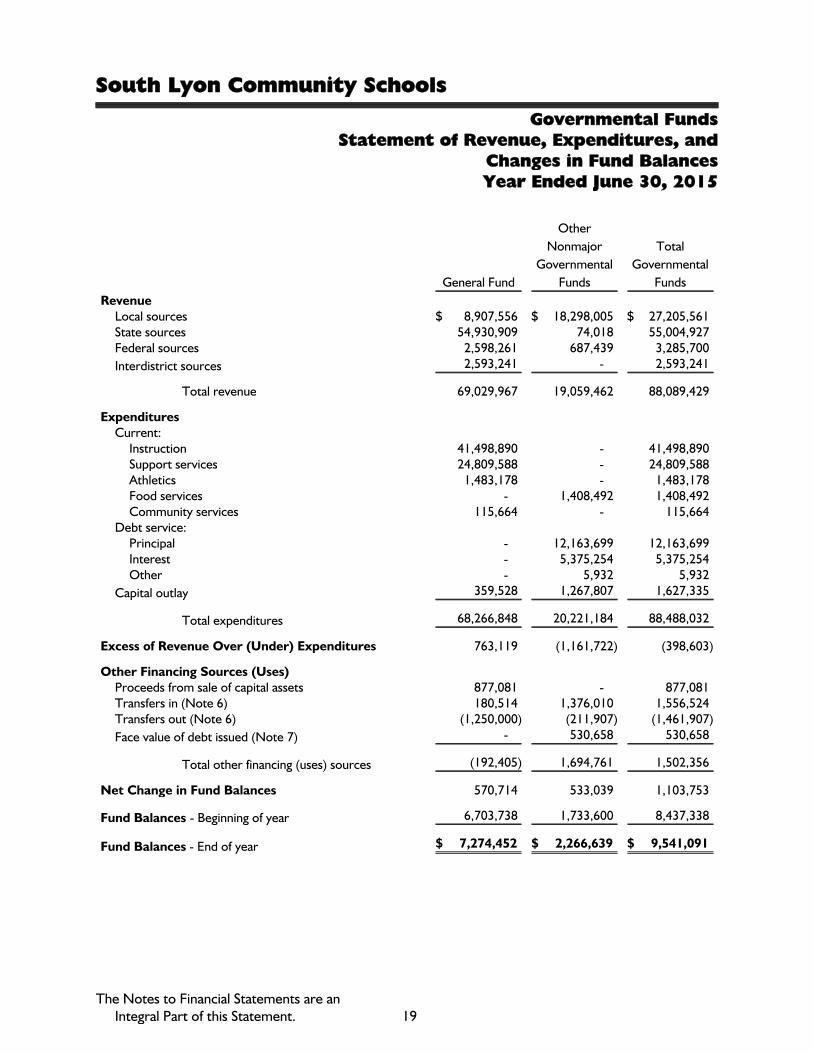
South Lyon Community Schools
Governmental FundsStatement of Revenue, Expenditures, and
Changes in Fund BalancesYear Ended June 30, 2015
General Fund
Other
Nonmajor
Governmental
Funds
Total
Governmental
Funds
RevenueLocal sources $ 8,907,556 $ 18,298,005 $ 27,205,561State sources 54,930,909 74,018 55,004,927Federal sources 2,598,261 687,439 3,285,700
Interdistrict sources 2,593,241 - 2,593,241
Total revenue 69,029,967 19,059,462 88,089,429
ExpendituresCurrent:
Instruction 41,498,890 - 41,498,890Support services 24,809,588 - 24,809,588Athletics 1,483,178 - 1,483,178Food services - 1,408,492 1,408,492Community services 115,664 - 115,664
Debt service:Principal - 12,163,699 12,163,699Interest - 5,375,254 5,375,254Other - 5,932 5,932
Capital outlay 359,528 1,267,807 1,627,335
Total expenditures 68,266,848 20,221,184 88,488,032
Excess of Revenue Over (Under) Expenditures 763,119 (1,161,722) (398,603)
Other Financing Sources (Uses)Proceeds from sale of capital assets 877,081 - 877,081Transfers in (Note 6) 180,514 1,376,010 1,556,524Transfers out (Note 6) (1,250,000) (211,907) (1,461,907)
Face value of debt issued (Note 7) - 530,658 530,658
Total other financing (uses) sources (192,405) 1,694,761 1,502,356
Net Change in Fund Balances 570,714 533,039 1,103,753
Fund Balances - Beginning of year 6,703,738 1,733,600 8,437,338
Fund Balances - End of year $ 7,274,452 $ 2,266,639 $ 9,541,091
The Notes to Financial Statements are anIntegral Part of this Statement. 19

South Lyon Community Schools
Governmental FundsReconciliation of the Statement of Revenue, Expenditures,
and Changes in Fund Balances of Governmental Fundsto the Statement of Activities
Year Ended June 30, 2015
Net Change in Fund Balances - Total Governmental Funds $ 1,103,753
Amounts reported for governmental activities in the statementof activities are different because:
Governmental funds report capital outlays asexpenditures; however, in the statement of activities,these costs are allocated over their estimated usefullives as depreciation:
Depreciation expense $ (5,297,475)
Capitalized capital outlay 558,503 (4,738,972)
Governmental funds report proceeds from sale of assetsas revenue; in the statement of activities, these arerecorded net of carrying value of the disposed assets (951,063)
Revenue is reported in the statement of activities whenearned; it is not reported in the funds until collectedor collectible within 60 days of year end (151,818)
Bond and note proceeds provide financial resources togovernmental funds, but issuing debt increases long-term liabilities in the statement of activities (530,658)
Underwriter's premiums and deferred charges arereported as revenue and expenditures in the fundsand amortized in the statement of activities (624,355)
Repayment of bond and note principal is an expenditurein the governmental funds, but not in the statement ofactivities (where it reduces long-term debt) 12,163,699
Interest expense is recorded in the statement ofactivities when incurred; it is not reported ingovernmental funds until paid 72,738
Change in pension expense related to deferred items 780,659
Compensated absences are recorded when earned inthe statement of activities. In the current year, morewas paid out than was earned 70,521
Change in Net Position of Governmental Activities $ 7,194,504
The Notes to Financial Statements are anIntegral Part of this Statement. 20

South Lyon Community Schools
Proprietary FundStatement of Net Position
June 30, 2015
Community
Education Fund
AssetsCash and investments (Note 3) $ 6,721
Due from other funds (Note 6) 1,089,554
Total assets 1,096,275
Deferred Outflows of Resources -
Deferred outflows related to pensions 125,628
Total assets and deferred outflows of resources 1,221,903
LiabilitiesAccounts payable 11,632Accrued salaries and other liabilities 32,883Unearned revenue (Note 4) 75,204
Net pension liability 1,806,640
Total current liabilities 1,926,359
Deferred Inflows of Resources -
Deferred inflows related to pensions 133,067
Total liabilities and deferred inflows of resources 2,059,426
Net Position - Unrestricted $ (837,523)
The Notes to Financial Statements are anIntegral Part of this Statement. 21

South Lyon Community Schools
Proprietary FundStatement of Revenue, Expenses, and Changes in Net Position
Year Ended June 30, 2015
Community
Education Fund
Operating Revenue - Charges for services $ 1,599,853
Operating Expenses - Community services 1,330,396
Operating Income 269,457
Transfer to Other Funds (94,617)
Change in Net Position 174,840
Net Position - As restated - Beginning of year (Note 12) (1,012,363)
Net Position - End of year $ (837,523)
The Notes to Financial Statements are anIntegral Part of this Statement. 22
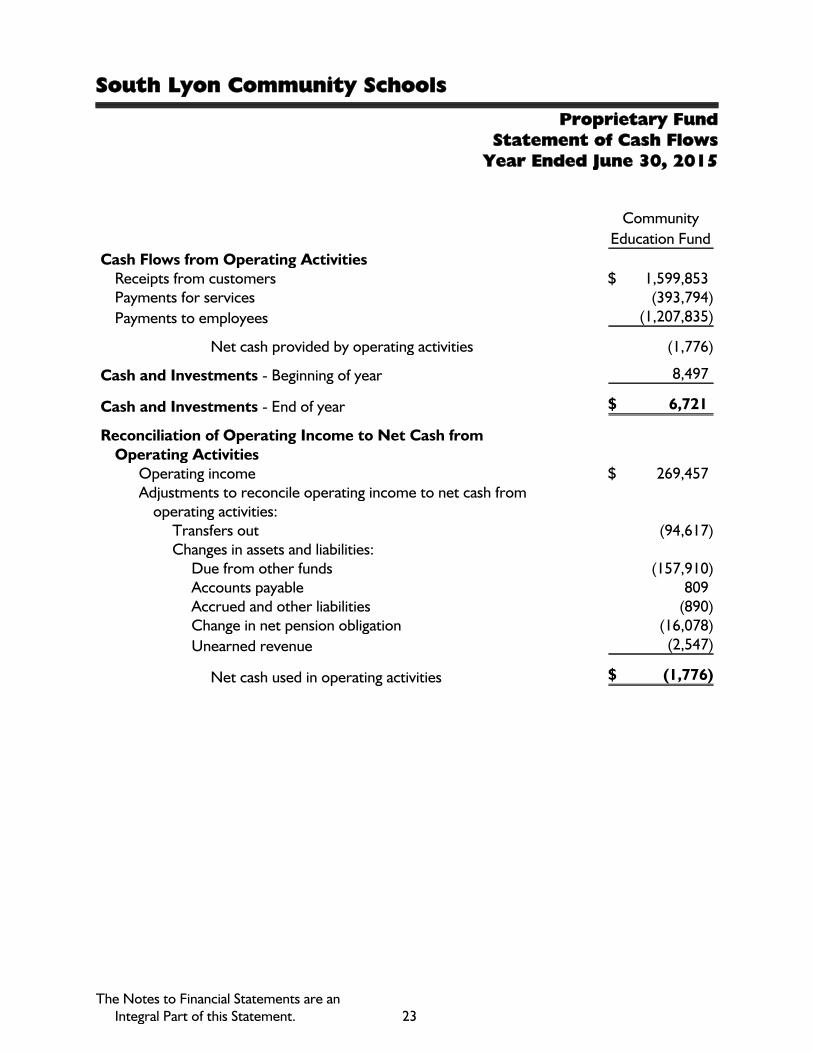
South Lyon Community Schools
Proprietary FundStatement of Cash Flows
Year Ended June 30, 2015
Community
Education Fund
Cash Flows from Operating ActivitiesReceipts from customers $ 1,599,853Payments for services (393,794)
Payments to employees (1,207,835)
Net cash provided by operating activities (1,776)
Cash and Investments - Beginning of year 8,497
Cash and Investments - End of year $ 6,721
Reconciliation of Operating Income to Net Cash fromOperating Activities
Operating income $ 269,457Adjustments to reconcile operating income to net cash from
operating activities:Transfers out (94,617)Changes in assets and liabilities:
Due from other funds (157,910)Accounts payable 809Accrued and other liabilities (890)Change in net pension obligation (16,078)
Unearned revenue (2,547)
Net cash used in operating activities $ (1,776)
The Notes to Financial Statements are anIntegral Part of this Statement. 23
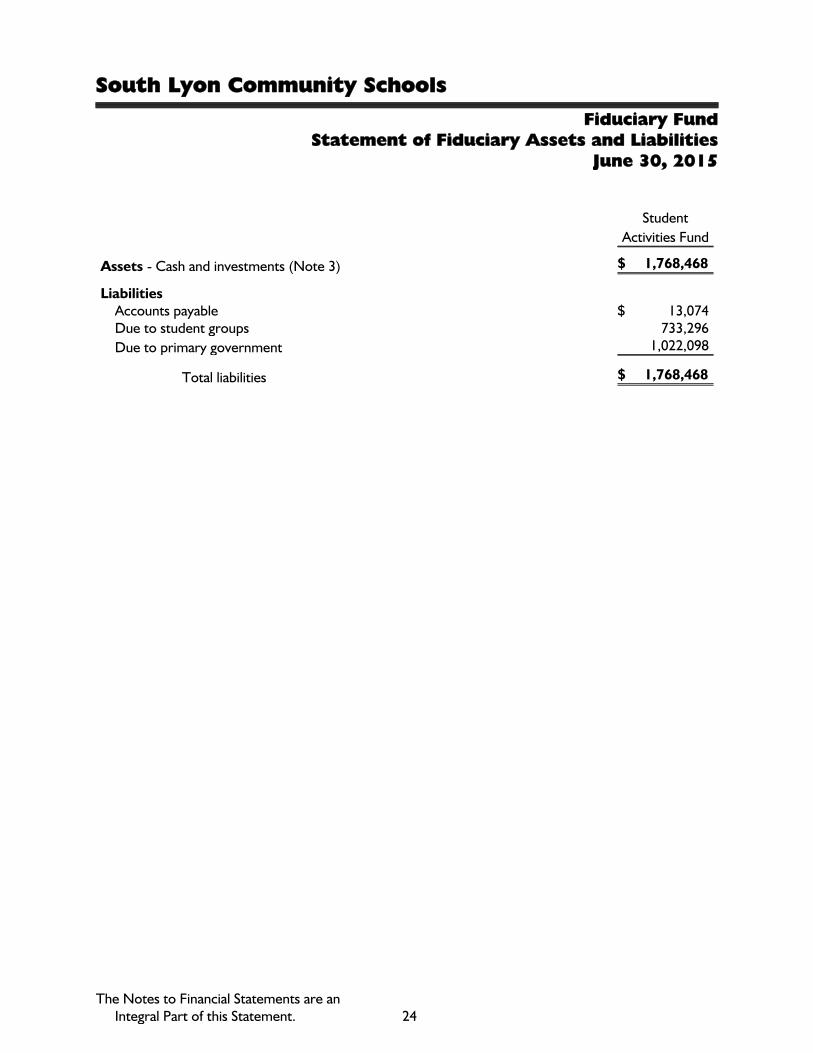
South Lyon Community Schools
Fiduciary FundStatement of Fiduciary Assets and Liabilities
June 30, 2015
Student
Activities Fund
Assets - Cash and investments (Note 3) $ 1,768,468
LiabilitiesAccounts payable $ 13,074Due to student groups 733,296
Due to primary government 1,022,098
Total liabilities $ 1,768,468
The Notes to Financial Statements are anIntegral Part of this Statement. 24
South Lyon Community Schools
Notes to Financial StatementsJune 30, 2015
Note 1 - Nature of Business and Significant Accounting Policies
The accounting policies of South Lyon Community Schools (the “School District”)conform to accounting principles generally accepted in the United States of America(GAAP) as applicable to governmental units. The following is a summary of thesignificant accounting policies used by the School District:
Reporting Entity
The School District is governed by an elected seven-member Board of Education. Theaccompanying financial statements have been prepared in accordance with criteriaestablished by the Governmental Accounting Standards Board for determining thevarious governmental organizations to be included in the reporting entity. These criteriainclude significant operational financial relationships that determine which of thegovernmental organizations are a part of the School District’s reporting entity, andwhich organizations are legally separate component units of the School District. Basedon the application of the criteria, the School District does not contain any componentunits.
Government-wide and Fund Financial Statements
The government-wide financial statements (i.e., the statement of net position and thestatement of activities) report information on all of the nonfiduciary activities of theprimary government. For the most part, the effect of interfund activity has beenremoved from these statements. Governmental activities, which normally aresupported by taxes and intergovernmental revenue, are reported separately frombusiness-type activities, which rely to a significant extent on fees and charges forsupport.
The statement of activities demonstrates the degree to which the direct expenses of agiven function or segment are offset by program revenue. Direct expenses are thosethat are clearly identifiable with a specific function. Program revenue includes (1)charges to customers or applicants who purchase, use, or directly benefit from goods,services, or privileges provided by a given function and (2) grants and contributions thatare restricted to meeting the operational or capital requirements of a particularfunction. Taxes, intergovernmental payments, and other items not properly includedamong program revenue are reported instead as general revenue.
Separate financial statements are provided for governmental funds, proprietary funds,and fiduciary funds, even though the latter are excluded from the government-widefinancial statements. Major individual governmental funds are reported as separatecolumns in the fund financial statements.
25

South Lyon Community Schools
Notes to Financial StatementsJune 30, 2015
Note 1 - Nature of Business and Significant Accounting Policies(Continued)
Measurement Focus, Basis of Accounting, and Financial StatementPresentation
Government-wide Financial Statements - The government-wide financialstatements are reported using the economic resources measurement focus and theaccrual basis of accounting. Revenue is recorded when earned and expenses arerecorded when a liability is incurred, regardless of the timing of related cash flows.Property taxes are recognized as revenue in the year for which they are levied. Grants,categorical aid, and similar items are recognized as revenue as soon as all eligibilityrequirements imposed by the provider have been met.
As a general rule, the effect of interfund activity has been eliminated from thegovernment-wide financial statements. Exceptions to this general rule are chargesbetween business-type and governmental activities where eliminations of these chargeswould distort the direct costs and program revenue reported for the various functionsconcerned.
When an expense is incurred for purposes for which both restricted and unrestrictednet position or fund balance are available, the School District's policy is to first applyrestricted resources. When an expense is incurred for purposes which amounts in anyof the unrestricted fund balance classifications could be used, it is the School District'spolicy to spend funds in this order: committed, assigned, and unassigned.
Amounts reported as program revenue include (1) charges to customers or applicantsfor goods, services, or privileges provided; (2) operating grants and contributions; and(3) capital grants and contributions. Internally dedicated resources are reported asgeneral revenue rather than as program revenue. Likewise, general revenue includes alltaxes and unrestricted state aid.
Fund Financial Statements - Governmental fund financial statements are reportedusing the current financial resources measurement focus and the modified accrual basisof accounting. Revenue is recognized as soon as it is both measurable and available.Revenue is considered to be available if it is collected within the current period or soonenough thereafter to pay liabilities of the current period. Revenue not meeting thisdefinition is classified as a deferred inflow of resources. For this purpose, the SchoolDistrict considers revenue to be available if it is collected within 60 days of the end ofthe current fiscal period. Expenditures generally are recorded when a liability isincurred, as under accrual accounting. However, debt service expenditures, as well asexpenditures related to compensated absences and claims and judgments, are recordedonly when payment is due.
26

South Lyon Community Schools
Notes to Financial StatementsJune 30, 2015
Note 1 - Nature of Business and Significant Accounting Policies(Continued)
Property taxes, unrestricted state aid, intergovernmental grants, and interest associatedwith the current fiscal period are all considered to be susceptible to accrual and so havebeen recognized as revenue of the current fiscal period. All other revenue items areconsidered to be available only when cash is received by the School District.
Proprietary fund and fiduciary fund statements are also reported using the economicresources measurement focus and the accrual basis of accounting. Proprietary fundsdistinguish operating revenue and expenses from nonoperating items. Operatingrevenue and expenses generally result from providing services and producing anddelivering goods in connection with a proprietary fund's principal ongoing operations.The principal revenue of our proprietary fund relates to charges to customers forservices. Operating expenses for proprietary funds include the cost of sales and servicesand administrative expenses. All revenue and expenses not meeting this definition arereported as nonoperating revenue and expenses.
The School District reports the following major governmental fund:
General Fund - The General Fund is the School District’s primary operating fund. Itaccounts for all financial resources of the School District, except those required to beaccounted for in another fund.
Additionally, the School District reports the following nonmajor funds:
Food Services Fund - The Food Services Fund is a special revenue fund and is used torecord all transactions of food sales to pupils at all School District school buildings. TheFood Services Fund is funded primarily by charges for services and federal grantprograms that are restricted to expenditure for specified purposes. Any operating deficitgenerated by this activity is the responsibility of the General Fund.
2003 Series I, 2003 Series II, 2005 Refunding, Series I, 2005 Refunding, Series II,2006 Refunding, 2007 Refunding, 2011 Refunding, and 2013 Refunding DebtService Funds - Debt service funds are used to record tax, interest, and other revenuefor payment of interest, principal, and other expenditures on bonded debt issues.
Bus Purchases, Technology, and Capital Improvements Capital Projects Funds -The Bus Purchases, Technology, and Capital Improvements Capital Projects Funds arefinanced by support of the General Fund and are used for acquiring new school sites,equipment, and major repairs. The fund operates until the purpose for which it wascreated is accomplished.
Proprietary Fund - The School District's proprietary fund is comprised of theCommunity Education Fund. The Community Education Fund is supported by user feesand provides community recreation programs.
27

South Lyon Community Schools
Notes to Financial StatementsJune 30, 2015
Note 1 - Nature of Business and Significant Accounting Policies(Continued)
Student Activities Agency Fund - The School District presently maintains an agencyfund to record the transactions of student groups for school and school-relatedpurposes. The funds are segregated and held in trust for the students.
Assets, Liabilities, and Net Position or Equity
Cash and Investments - Cash and investments include cash on hand, demand deposits,and short-term investments with a maturity of three months or less when acquired.Investments are stated at fair value. Pooled investment income from the debt service isgenerally allocated to each fund using a weighted average of balance for the principal.
Receivables and Payables - In general, outstanding balances between funds arereported as “due to/from other funds.” Activities between funds that are representativeof lending/borrowing arrangements outstanding at the end of the fiscal year are referredto as “advances to/from other funds.” Any residual balances outstanding between thegovernmental activities and the business-type activities are reported in the government-wide financial statements as “internal balances.”
All trade and property tax receivables are shown net of an allowance for uncollectibleamounts. The School District considers all receivables to be fully collectible; accordingly,no allowance for uncollectible amounts is recorded. Property taxes are assessed as ofDecember 31 and the related property taxes become a lien on December 1 of thefollowing year. These taxes are billed on July 1. Taxes are considered delinquent onMarch 1 of the following year. At this time, penalties and interest are assessed and thetotal obligation is added to the county tax rolls.
Inventories and Prepaid Costs - Inventories are valued at cost, on a first-in, first-outbasis. Inventories of governmental funds are recorded as expenditures when consumedrather than when purchased. Certain payments to vendors reflect costs applicable tofuture fiscal years and are recorded as prepaid costs in both government-wide and fundfinancial statements.
Capital Assets - Capital assets, which include land, buildings, equipment, and vehicles,are reported in the applicable governmental or business-type activities column in thegovernment-wide financial statements. Capital assets are defined by the School Districtas assets with an initial individual cost of more than $23,126 and an estimated useful lifein excess of one year. Such assets are recorded at historical cost or estimated historicalcost if purchased or constructed. Donated capital assets are recorded at estimated fairmarket value at the date of donation. Costs of normal repair and maintenance that donot add to the value or materially extend asset life are not capitalized. The SchoolDistrict does not have infrastructure-type assets.
28

South Lyon Community Schools
Notes to Financial StatementsJune 30, 2015
Note 1 - Nature of Business and Significant Accounting Policies(Continued)
Buildings, land improvements, equipment, and vehicles are depreciated using thestraight-line method over the following useful lives:
Buildings, building improvements, and land improvements 20 to 50 yearsBuses and other vehicles 5 to 10 yearsFurniture and other equipment 5 to 10 years
Compensated Absences - The liability for compensated absences reported in thegovernment-wide statements consists of earned but unused accumulated vacation andsick leave benefits. A liability for these amounts is reported in governmental funds as itcomes due for payment. The liability has been calculated using the vesting method, inwhich leave amounts for both employees who are currently eligible to receivetermination payments at normal retirement age and other employees who are expectedto become eligible in the future to receive such payments upon normal retirement areincluded.
Long-term Obligations - In the government-wide financial statements and proprietaryfund financial statements, long-term debt and other long-term obligations are reportedas liabilities in the statement of net position. Bond premiums and discounts are deferredand amortized over the life of the bonds using the effective interest method. Bondspayable are reported net of the applicable bond premium or discount. Bond issuancecosts are reported as debt service expenditures.
In the fund financial statements, governmental fund types recognize bond premiums anddiscounts, as well as bond issuance costs, during the current period.
The face amount of debt issued is reported as other financing sources. Premiumsreceived on debt issuances are reported as other financing sources while discounts arereported as other financing uses. Issuance costs are reported as debt serviceexpenditures.
Deferred Outflows/Inflows of Resources - In addition to assets, the statement of netposition will sometimes report a separate section for deferred outflows of resources.This separate financial statement element represents a consumption of net position thatapplies to a future period and so will not be recognized as an outflow of resources(expenditure) until then. The School District only has two types of items that qualify forreporting in this category. The first is the deferred charge on refunding reported in thegovernment-wide statement of net position. A deferred charge on refunding resultsfrom the difference in the carrying value of refunded debt and its reacquisition price.This amount is deferred and amortized over the shorter of the life of the refunded orrefunding debt. The other is the deferred outflow related to the pension plan.
29

South Lyon Community Schools
Notes to Financial StatementsJune 30, 2015
Note 1 - Nature of Business and Significant Accounting Policies(Continued)
In addition to liabilities, the statement of net position will sometimes report a separatesection for deferred inflows of resources. This separate financial statement elementrepresents an acquisition of net position that applies to a future period and so will not berecognized as an inflow of resources (revenue) until that time. The School District onlyhas one item that qualifies for reporting in this category; it is the deferred inflow relatedto the pension plan.
Fund Balance - In the fund financial statements, governmental funds report thefollowing components of fund balance:
Nonspendable: Amounts that are not in spendable form or are legally orcontractually required to be maintained intact
Restricted: Amounts that are legally restricted by outside parties, constitutionalprovisions, or enabling legislation for use for a specific purpose
Committed: Amounts that have been formally set aside by the Board of Educationfor use for specific purposes. Commitments are made and can be rescinded only viaresolution of the Board of Education.
Assigned: Intent to spend resources on specific purposes expressed by the Board ofEducation
Unassigned: Amounts that do not fall into any other category above. This is theresidual classification for amounts in the General Fund and represents fund balancethat has not been assigned to other funds and has not been restricted, committed,or assigned to specific purposes in the General Fund. In other governmental funds,only negative unassigned amounts are reported, if any, and represent expendituresincurred for specific purposes exceeding the amounts previously restricted,committed, or assigned to those purposes.
The Board of Education has adopted a fund balance policy. The fund balance policyprescribes the minimum fund balance as 10 percent of expenditures in the General Fundand special revenue funds. This is deemed to be the prudent amount to maintain theSchool District’s ability to meet obligations as they come due throughout the year. Foreach budget cycle, the preliminary and recommended General Fund budgets shall have arevenue over expenditure figure of no less than .5 percent of revenue. In addition tothe unassigned fund balance, the School District will maintain a committed fund balanceto earmark funds for significant future liabilities. Furthermore, the School District willmaintain a fund balance in each of its debt funds in accordance with state and federalregulations, targeting a range of 5 percent to 8 percent of expenditures.
30

South Lyon Community Schools
Notes to Financial StatementsJune 30, 2015
Note 1 - Nature of Business and Significant Accounting Policies(Continued)
Pensions - For purposes of measuring the net pension liability, deferred outflows ofresources and deferred inflows of resources related to pensions and pension expense,information about the fiduciary net position of the Michigan Public School Employees’Retirement System (MPSERS), and additions to/deductions from MPSERS fiduciary netposition have been determined on the same basis as they are reported by MPSERS.MPSERS uses the economic resources measurement focus and the full accrual basis ofaccounting. Contribution revenue is recorded as contributions are due, pursuant to legalrequirements. Benefit payments (including refunds of employee contributions) arerecognized as expense when due and payable in accordance with the benefit terms.Related plan investments are reported at fair value.
Note 2 - Stewardship, Compliance, and Accountability
Budgetary Information - Annual budgets are adopted on a basis consistent withgenerally accepted accounting principles and state law for the General Fund, specialrevenue, debt service, and capital projects funds. The annual budget for the debtservice funds is adopted in the aggregate, not for each fund individually. All annualappropriations lapse at fiscal year end.
The budget document presents information by fund and function. The legal level ofbudgetary control adopted by the governing body (i.e., the level at which expendituresmay not legally exceed appropriations) is the function level. State law requires theSchool District to have its budget in place by July 1. Expenditures in excess of amountsbudgeted for the General Fund and special revenue funds are a violation of Michiganlaw. State law permits districts to amend their budgets during the year. During the year,the budget was amended in a legally permissible manner. There were no significantamendments during the year.
Amounts encumbered for purchase orders, contracts, etc. are not tracked during theyear. Budget appropriations are considered to be spent once the goods are deliveredor the services rendered.
Excess of Expenditures Over Appropriations in Budgeted Funds - The SchoolDistrict did not have significant expenditure budget variances.
Fund Deficits - Under Michigan law, school districts are required to maintain positivefund balance in each fund. The School District has an accumulated net position deficit inthe Community Education Fund. This deficit is due to the inclusion of the CommunityEducation Fund's proportionate share of the net pension liability and will be curedthrough future required contributions to the Michigan Public School Employees'Retirement Plan.
31

South Lyon Community Schools
Notes to Financial StatementsJune 30, 2015
Note 3 - Deposits and Investments
State statutes and the School District’s investment policy authorize the School District tomake deposits in the accounts of federally insured banks, credit unions, and savings andloan associations that have offices in Michigan. The School District is allowed to invest inU.S. Treasury or agency obligations, U.S. government repurchase agreements, bankers’acceptances, commercial paper rated prime at the time of purchase that matures notmore than 270 days after the date of purchase, mutual funds, and investment pools thatare composed of authorized investment vehicles. The School District’s deposits are inaccordance with statutory authority.
The School District has designated 17 bank accounts for the deposit of its funds.
The School District’s cash and investments are subject to several types of risk, which areexamined in more detail below:
Custodial Credit Risk of Bank Deposits - Custodial credit risk is the risk that in theevent of a bank failure, the School District’s deposits may not be returned to it. TheSchool District’s investment policy requires that financial institutions be evaluated andonly those with an acceptable risk level be used for the School District’s deposits forcustodial credit risk. At year end, the School District's deposit balance of $5,290,666(not including deposits-in-transit and cancelled checks) had $2,288,110 of bank deposits(certificates of deposit and checking and savings accounts) that were uninsured anduncollateralized. The School District believes that due to the dollar amounts of cashdeposits and the limits of FDIC insurance, it is impractical to insure all deposits. As aresult, the School District evaluates each financial institution with which it deposits fundsand assesses the level of risk of each institution; only those institutions with anacceptable estimated risk level are used as depositories.
Custodial Credit Risk of Investments - Custodial credit risk is the risk that, in theevent of the failure of the counterparty, the School District will not be able to recoverthe value of its investments or collateral securities that are in the possession of anoutside party. The School District’s policy for custodial credit risk states that custodialcredit risk will be minimized by limiting investments to the types of securities allowedby state law, and by board pre-approval, the financial institutions, broker/dealers,intermediaries, and advisors with which the School District will do business using thecriteria established in the investment policy. The School District does not haveinvestments with custodial credit risk.
32

South Lyon Community Schools
Notes to Financial StatementsJune 30, 2015
Note 3 - Deposits and Investments (Continued)
Interest Rate Risk - Interest rate risk is the risk that the value of investments willdecrease as a result of a rise in interest rates. The School District’s investment policydoes not restrict investment maturities, other than commercial paper which can only bepurchased with a 270-day maturity. The School District’s policy minimizes interest raterisk by requiring structuring the investment portfolio so that securities mature to meetcash requirements for ongoing operations, thereby avoiding the need to sell securities inthe open market, investing operating funds primarily in shorter-term securities, liquidasset funds, money market mutual funds, or similar investment pools and limiting theaverage maturity in accordance with the School District’s cash requirements.
Credit Risk - State law limits investments in commercial paper to the top two ratingsissued by nationally recognized statistical rating organizations. The School District’sinvestment policy does not further limit its investment choices.
At year end, the maturities of investments and the credit quality ratings of debtsecurities (other than the U.S. government) are as follows:
Investment Fair Value Maturities Rating Rating Organization
Comerica Governmental Cash Investment Fund $ 713,616 Varies A1/P1/F1 N/AMichigan Liquid Asset Fund 3,378,164 Varies AAAm Standard & Poor'sMBIA 9,434 Varies AAAm Standard & Poor's
Total investments $ 4,101,214
Concentration of Credit Risk - The School District places no limit on the amount theSchool District may invest in any one issuer. The School District’s policy minimizesconcentration of credit risk by requiring diversification of the investment portfolio sothat the impact of potential losses from any one type of security or issuer will beminimized.
Foreign Currency Risk - Foreign currency risk is the risk that an investmentdenominated in the currency of a foreign country could reduce its U.S. dollar value as aresult of changes in foreign currency exchange rates. State law and the School District’spolicy prohibit investment in foreign currency.
33

South Lyon Community Schools
Notes to Financial StatementsJune 30, 2015
Note 4 - Unavailable/Unearned Revenue
Governmental funds report unavailable revenue in connection with receivables forrevenue that is not considered to be available to liquidate liabilities of the currentperiod. Governmental funds also report unearned revenue in connection with resourcesthat have been received but not yet earned. Proprietary funds report unearned revenuein connection with resources that have been received but not yet earned. At the end ofthe current fiscal year, the various components of unearned and unavailable revenue areas follows:
Governmental FundsProprietary
Fund
Deferred
Inflow -
Unavailable
Liability -
Unearned
Liability -
Unearned
Revenue not received within 60 daysof year end $ 94,398 $ - $ -
Grant and categorical aid paymentreceived prior to meeting alleligibility requirements - 83,640 -
Payments received but not yet earned - 18,855 75,204
Total$ 94,398 $ 102,495 $ 75,204
34
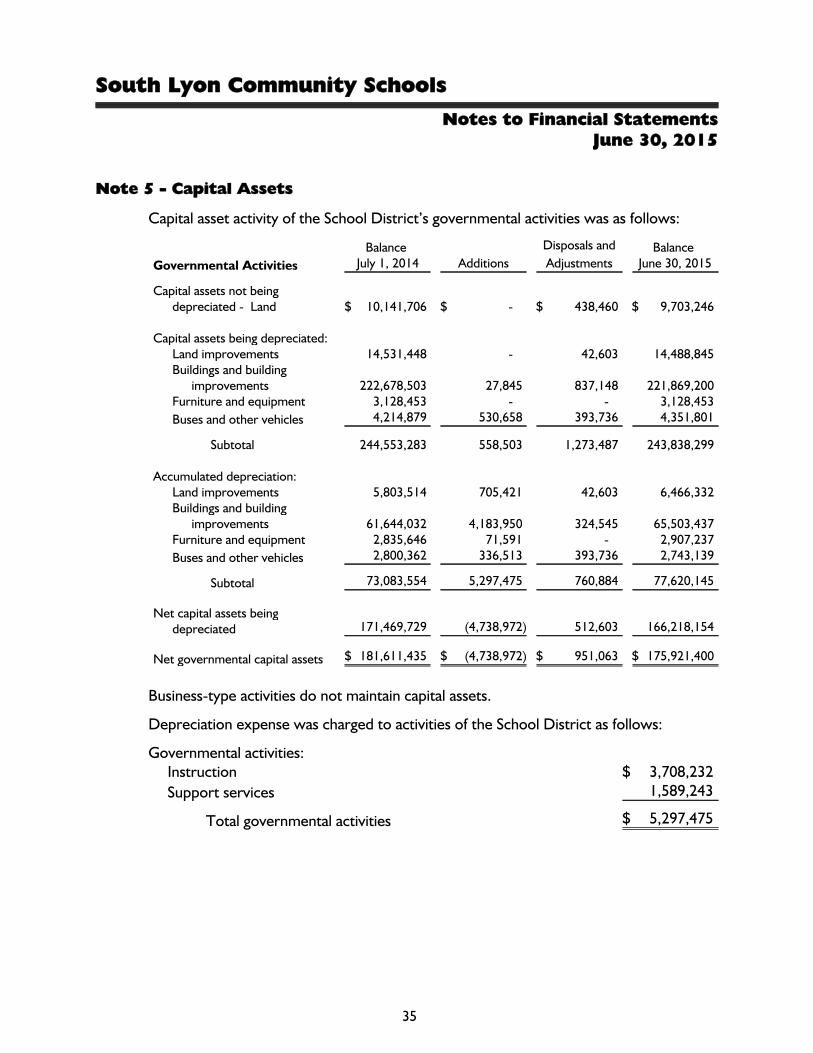
South Lyon Community Schools
Notes to Financial StatementsJune 30, 2015
Note 5 - Capital Assets
Capital asset activity of the School District’s governmental activities was as follows:
Governmental Activities
Balance July 1, 2014 Additions
Disposals and
AdjustmentsBalance
June 30, 2015
Capital assets not beingdepreciated - Land $ 10,141,706 $ - $ 438,460 $ 9,703,246
Capital assets being depreciated:Land improvements 14,531,448 - 42,603 14,488,845Buildings and building
improvements 222,678,503 27,845 837,148 221,869,200Furniture and equipment 3,128,453 - - 3,128,453
Buses and other vehicles 4,214,879 530,658 393,736 4,351,801
Subtotal 244,553,283 558,503 1,273,487 243,838,299
Accumulated depreciation:Land improvements 5,803,514 705,421 42,603 6,466,332Buildings and building
improvements 61,644,032 4,183,950 324,545 65,503,437Furniture and equipment 2,835,646 71,591 - 2,907,237
Buses and other vehicles 2,800,362 336,513 393,736 2,743,139
Subtotal 73,083,554 5,297,475 760,884 77,620,145
Net capital assets beingdepreciated 171,469,729 (4,738,972) 512,603 166,218,154
Net governmental capital assets $ 181,611,435 $ (4,738,972) $ 951,063 $ 175,921,400
Business-type activities do not maintain capital assets.
Depreciation expense was charged to activities of the School District as follows:
Governmental activities:Instruction $ 3,708,232
Support services 1,589,243
Total governmental activities $ 5,297,475
35
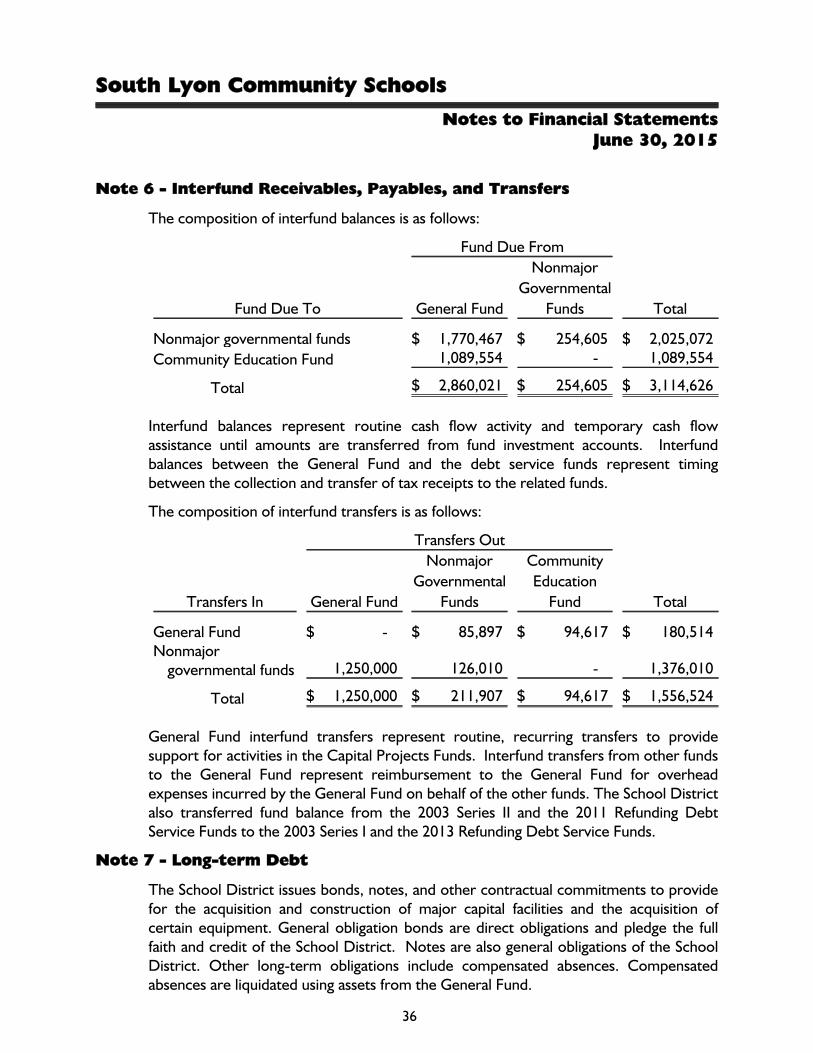
South Lyon Community Schools
Notes to Financial StatementsJune 30, 2015
Note 6 - Interfund Receivables, Payables, and Transfers
The composition of interfund balances is as follows:
Fund Due From
Fund Due To General Fund
Nonmajor
Governmental
Funds Total
Nonmajor governmental funds $ 1,770,467 $ 254,605 $ 2,025,072
Community Education Fund 1,089,554 - 1,089,554
Total $ 2,860,021 $ 254,605 $ 3,114,626
Interfund balances represent routine cash flow activity and temporary cash flowassistance until amounts are transferred from fund investment accounts. Interfundbalances between the General Fund and the debt service funds represent timingbetween the collection and transfer of tax receipts to the related funds.
The composition of interfund transfers is as follows:
Transfers Out
Transfers In General Fund
Nonmajor
Governmental
Funds
Community
Education
Fund Total
General Fund $ - $ 85,897 $ 94,617 $ 180,514Nonmajor
governmental funds 1,250,000 126,010 - 1,376,010
Total $ 1,250,000 $ 211,907 $ 94,617 $ 1,556,524
General Fund interfund transfers represent routine, recurring transfers to providesupport for activities in the Capital Projects Funds. Interfund transfers from other fundsto the General Fund represent reimbursement to the General Fund for overheadexpenses incurred by the General Fund on behalf of the other funds. The School Districtalso transferred fund balance from the 2003 Series II and the 2011 Refunding DebtService Funds to the 2003 Series I and the 2013 Refunding Debt Service Funds.
Note 7 - Long-term Debt
The School District issues bonds, notes, and other contractual commitments to providefor the acquisition and construction of major capital facilities and the acquisition ofcertain equipment. General obligation bonds are direct obligations and pledge the fullfaith and credit of the School District. Notes are also general obligations of the SchoolDistrict. Other long-term obligations include compensated absences. Compensatedabsences are liquidated using assets from the General Fund.
36

South Lyon Community Schools
Notes to Financial StatementsJune 30, 2015
Note 7 - Long-term Debt (Continued)
Long-term obligation activity can be summarized as follows:
Beginning Balance Additions Reductions Ending BalanceDue WithinOne Year
Governmental Activities
Bonds $ 152,390,000 $ - $ 11,900,000 $ 140,490,000 $ 12,465,000Less deferred amounts:
Issuance premiums 387,560 - 37,087 350,473 37,087
Issuance discounts (188,955) - (23,620) (165,335) (23,619)
Total 152,588,605 - 11,913,467 140,675,138 12,478,468
Bus notes 977,268 530,658 263,699 1,244,227 275,559Employee compensated absences 2,255,160 221,206 291,727 2,184,639 50,000
Total governmentalactivities $ 155,821,033 $ 751,864 $ 12,468,893 $ 144,104,004 $ 12,804,027
The Enterprise Fund has no long-term debt as of June 30, 2015.
Annual debt service requirements to maturity for the above governmental bond andnote obligations are as follows:
Governmental Activities
Years Ending
June 30 Principal Interest Total
2016 $ 12,740,559 $ 4,825,434 $ 17,565,9932017 13,665,855 4,478,362 18,144,2172018 13,846,254 4,141,503 17,987,7572019 13,476,756 3,767,961 17,244,7172020 13,344,803 3,379,460 16,724,263
2021-2025 53,805,000 10,181,641 63,986,641
2026-2028 20,855,000 1,769,490 22,624,490
Total $ 141,734,227 $ 32,543,851 $ 174,278,078
37

South Lyon Community Schools
Notes to Financial StatementsJune 30, 2015
Note 7 - Long-term Debt (Continued)
Governmental Activities
General obligation bonds consist of the following:
$92,485,000 serial and term bonds due in annual installments of$4,890,000 to $7,035,000 through May 1, 2028; interest at 4.0 to 5.0percent $ 83,425,000
$7,180,000 serial and term bonds due in annual installments of$100,000 to $625,000 through May 1, 2020; interest at 4.0 percent to5.0 percent 2,040,000
$55,575,000 serial and term bonds due in annual installments of$6,365,000 to $7,450,000 through May 1, 2023; interest at .63 percentto 2.89 percent 55,025,000
Total bonded debt $ 140,490,000
Notes consist of the following:
Remaining to Maturity
Date Original Amount Due Date Interest Rate Interest Principal
8/8/2012 $ 515,575 8/8/2018 1.98 $ 17,515 $ 350,4106/11/2013 448,466 7/15/2018 2.09 19,171 363,159
7/2/2014 530,658 7/2/2019 1.73 27,856 530,658
Total $ 1,494,699 $ 64,542 $ 1,244,227
Note 8 - Risk Management
The School District is exposed to various risks of loss related to property loss, torts,errors and omissions, and employee injuries (workers’ compensation), as well asmedical benefits provided to employees. The School District has purchased commercialinsurance for medical benefit claims and for claims subsequent to August 30, 1992relating to workers' compensation and participates in the SET-SEG risk pool for claimsrelating to property and casualty. Settled claims relating to the commercial insurancehave not exceeded the amount of insurance coverage in any of the past three fiscalyears. There have been no significant changes in insurance coverage in the current year.
The shared-risk pool program in which the School District participates operates as acommon risk-sharing management program for school districts in Michigan; memberpremiums are used to purchase commercial excess insurance coverage and to paymember claims in excess of deductible amounts.
38

South Lyon Community Schools
Notes to Financial StatementsJune 30, 2015
Note 9 - Michigan Public School Employees’ Retirement System
Plan Description - The School District participates in the Michigan Public SchoolEmployees’ Retirement System (MPSERS or the "System"), a statewide, cost-sharing,multiple-employer defined benefit public employee retirement system governed by theState of Michigan that covers substantially all employees of the School District. TheSystem provides retirement, survivor, and disability benefits to plan members and theirbeneficiaries. The System also provides postemployment healthcare benefits to retireesand beneficiaries who elect to receive those benefits.
The Michigan Public School Employees’ Retirement System issues a publicly availablefinancial report that includes financial statements and required supplemental informationfor the pension and postemployment healthcare plans. That report is available on theweb at http://www.michigan.gov/orsschools, or by writing to the Office of RetirementSystem (ORS) at 7150 Harris Drive, P.O. Box 30171, Lansing, MI 48909.
Contributions - Public Act 300 of 1980, as amended, required the School District tocontribute amounts necessary to finance the coverage of pension benefits of active andretired members. Contribution provisions are specified by state statute and may beamended only by action of the state legislature. Under these provisions, each schooldistrict's contribution is expected to finance the costs of benefits earned by employeesduring the year, with an additional amount to finance a portion of the unfunded accruedliability.
School districts' contributions are determined based on employee elections. There areseven different benefit options included in the plan available to employees based on dateof hire. Contribution rates are adjusted annually by the ORS.
The range of rates is as follows:
School District
July 1, 2013 - September 30, 2013 12.78% - 16.25%October 1, 2013 - September 30, 2014 15.44% - 18.34%October 1, 2014 - June 30, 2015 18.76% - 23.07%
Depending on the plan selected, plan member contributions range from 0 percent up to7.0 percent of gross wages. Plan members electing into the defined contribution planare not required to make additional contributions.
The School District’s required and actual contributions to the plan for the years endedJune 30, 2015 and 2014 were $7,809,157 and $5,945,226, respectively. Contributionsinclude $3,040,103 and $1,693,018 of revenue received from the State of Michigan, andremitted to the system, to fund the MPSERS Unfunded Actuarial Accrued Liability(UAAL) Stabilization Rate for the years ended June 30, 2015 and 2014, respectively.
39

South Lyon Community Schools
Notes to Financial StatementsJune 30, 2015
Note 9 - Michigan Public School Employees’ Retirement System(Continued)
Benefits Provided - Benefit provisions of the defined benefit pension plan areestablished by State statute, which may be amended. Public Act 300 of 1980, asamended, establishes eligibility and benefit provisions for the defined benefit (DB)pension plan.
Depending on the plan option selected, member retirement benefits are calculated asfinal average compensation times years of service times a pension factor ranging from1.25 percent to 1.50 percent. The requirements to retire range from attaining the ageof 46 to 60 with years of service ranging from 5 to 30 years, depending on when theemployee became a member. Early retirement is computed in the same manner as aregular pension, but is permanently reduced 0.50 percent for each full and partial monthbetween the pension effective date and the date the member will attain age 60. Thereis no mandatory retirement age.
Members are eligible for non-duty disability benefits after 10 years of service and forduty-related disability benefits upon hire. Disability retirement benefits are determinedin the same manner as retirement benefits but are payable immediately without anactuarial reduction. The disability benefits plus authorized outside earnings are limitedto 100 percent of the participant’s final average compensation with an increase of 2percent each year thereafter.
Benefits may transfer to a beneficiary upon death and are determined in the samemanner as retirement benefits, but with an actuarial reduction.
Benefit terms provide for annual cost-of-living adjustments to each employee’sretirement allowance subsequent to the employee’s retirement date. The annualadjustment, if applicable, is 3 percent. For some members who do not receive anannual increase, they are eligible to receive a supplemental payment in those years wheninvestment earnings exceed actuarial assumptions.
Net Pension Liability, Deferrals, and Pension Expense - At June 30, 2015, theSchool District reported a liability of $89,527,056 for its proportionate share of the netpension liability. The net pension liability was measured as of September 30, 2014 andthe total pension liability used to calculate the net pension liability was determined by anactuarial valuation as of September 30, 2013, which used update procedures to rollforward the estimated liability to September 30, 2014. The School District’s proportionof the net pension liability was based on a projection of its long-term share ofcontributions to the pension plan relative to the projected contributions of allparticipating reporting units, actuarially determined. At September 30, 2014, the SchoolDistrict’s proportion was 0.40645 percent.
40

South Lyon Community Schools
Notes to Financial StatementsJune 30, 2015
Note 9 - Michigan Public School Employees’ Retirement System(Continued)
For the year ended June 30, 2015, the School District recognized pension expense of$7,251,959, exclusive of payments to the System to fund the MPSERS UAAL stabilizationrate. At June 30, 2015, the School District reported deferred outflows of resources anddeferred inflows of resources related to pensions from the following sources:
DeferredOutflows ofResources
Subsequent tothe
MeasurementDate
Net DeferredInflows
(Outflows) ofResources as
of theMeasurement
Date
Difference between expected and actual experience $ - $ -Changes of assumptions - (3,303,364)Net difference between projected and actual earnings
on pension plan assets - 9,897,275Changes in proportion and differences between the
School District's contributions and proportionateshare of contributions - 163
The School District's contributions subsequent to themeasurement date 6,225,418 -
Total $ 6,225,418 $ 6,594,074
Amounts reported as deferred outflows of resources and deferred inflows of resourcesrelated to pensions will be recognized in pension expense as follows:
Years EndingJune 30 Amount
2016 $ 1,615,3862017 1,615,3862018 1,615,3862019 1,747,916
Thereafter -
Total $ 6,594,074
In addition, the contributions subsequent to the measurement date will be included as areduction of the net pension liability in the next year.
41

South Lyon Community Schools
Notes to Financial StatementsJune 30, 2015
Note 9 - Michigan Public School Employees’ Retirement System(Continued)
Actuarial Assumptions - The total pension liability as of September 30, 2014 is basedon the results of an actuarial valuation date of September 30, 2013 and rolled forward:
Actuarial cost method Entry age normal cost actuarial cost method
Assumed rate of return 7.00 to 8.00 percent, net of investment and administrativeexpenses based on the groups
Rate of pay increases 3.50 percent
Mortality basis RP-2000 Combined Healthy Mortality Table, adjusted formortality improvements to 2025 using projection scale BB
The actuarial assumptions used for the September 30, 2013 valuation were based on theresults of an actuarial experience study for the period from October 1, 2007 toSeptember 30, 2012. As a result of this study, the actuarial assumptions were adjustedto more closely reflect actual experience.
Discount Rate - The discount rate used to measure the total pension liability was 7.00to 8.00 percent depending on the plan option. The projection of cash flows used todetermine the discount rate assumed that employee contributions will be made at thecurrent contribution rate and that employer contributions will be made at contractuallyrequired rates. Based on those assumptions, the pension plan’s fiduciary net positionwas projected to be available to make all projected future benefit payments for currentactive and inactive employees. Therefore, the long-term expected rate of return onpension plan investments was applied to all periods of projected benefit payments todetermine the total pension liability.
42

South Lyon Community Schools
Notes to Financial StatementsJune 30, 2015
Note 9 - Michigan Public School Employees’ Retirement System(Continued)
The long-term expected rate of return on pension plan investments was determinedusing a building-block method in which best-estimate ranges of expected future realrates of return (expected returns, net of pension plan investment expense, and inflation)are developed for each major asset class. These ranges are combined to produce thelong-term expected rate of return by weighting the expected future real rates of returnby the target asset allocation percentage and by adding expected inflation. The targetallocation and best estimates of arithmetic real rates of return for each major asset classare summarized in the following table:
Investment CategoryTarget
Allocation
Long-termExpected RealRate of Return
Domestic equity pools %28 %4.8Private equity pools %18 %8.5International equity pools %16 %6.1Fixed-income pools %10 %1.5Real estate and infrastructure pools %10 %5.3Real return, opportunistic, and absolute pool %16 %6.3
Short-term investment pools %2 %(0.2)
Total %100
Sensitivity of the Net Pension Liability to Changes in the Discount Rate - Thefollowing presents the net pension liability of the School District calculated using thediscount rate of 7.00 to 8.00 percent, depending on the plan option. The following alsoreflects what the School District’s net pension liability would be if it were calculatedusing a discount rate that is 1.00 percentage point lower or 1.00 percentage point higherthan the current rate:
1.00 Percent Decrease (7.00/6.00 Percent)
Current Discount Rate(8.00/7.00 Percent)
1.00 Percent Increase (9.00/8.00 Percent)
$ 118,033,899 $ 89,527,056 $ 65,509,999
Pension Plan Fiduciary Net Position - Detailed information about the pension plan’sfiduciary net position is available in the separately issued MPSERS financial report.
Payable to the Pension Plan - At June 30, 2015, the School District reported apayable of $808,464 for the outstanding amount of contributions to the pension planrequired for the year ended June 30, 2015.
43

South Lyon Community Schools
Notes to Financial StatementsJune 30, 2015
Note 9 - Michigan Public School Employees’ Retirement System(Continued)
Postemployment Benefits Other Than Pensions (OPEB) - Under the MPSERS act,all retirees participating in the MPSERS pension plan have the option of continuinghealth, dental, and vision coverage through MPSERS. Retirees electing this coveragecontribute an amount equivalent to the monthly cost for Part B Medicare and 10percent, or 20 percent for those not Medicare eligible, of the monthly premium amountfor the health, dental, and vision coverage at the time of receiving the benefits. TheMPSERS board of trustees annually sets the employer contribution rate to fund thebenefits on a pay-as-you-go basis. Participating employers are required to contribute atthat rate. The employer contribution rate ranged from 5.52 percent to 6.45 percent ofcovered payroll for the period from July 1, 2014 to September 30, 2014 and from 2.20percent to 2.71 percent of covered payroll for the period from October 1, 2014through June 30, 2015 dependent upon the employee’s date of hire and plan election asnoted above. Members can choose to contribute 3 percent of their covered payroll tothe Retiree Healthcare Fund and keep this premium subsidy benefit or they can electnot to pay the 3 percent contribution and instead choose the Personal Healthcare Fund,which can be used to pay healthcare expenses in retirement. Members electing thePersonal Healthcare Fund will be automatically enrolled in a 2 percent employeecontribution into their 457 account as of their transition date and create a 2 percentemployer match into the employee’s 403(b) account.
The School District’s required and actual contributions to the plan for retiree healthcarebenefits for the years ended June 30, 2015, 2014, and 2013 were $1,253,764,$2,353,705, and $2,957,740, respectively.
Note 10 - Upcoming Accounting Pronouncements
In February 2015, the Governmental Accounting Standards Board issued GASBStatement No. 72, Fair Value Measurement and Application. The requirements of thisStatement will enhance comparability of financial statements among governments byrequiring measurement of certain assets and liabilities at fair value using a consistent andmore detailed definition of fair value and acceptable valuation techniques. ThisStatement also will enhance fair value application guidance and related disclosures inorder to provide information to financial statement users about the impact of fair valuemeasurements on a government’s financial position. GASB Statement No. 72 is requiredto be adopted for years beginning after June 15, 2015. The School District is currentlyevaluating the impact this standard will have on the financial statements when adopted,during the School District's 2016 fiscal year.
44

South Lyon Community Schools
Notes to Financial StatementsJune 30, 2015
Note 10 - Upcoming Accounting Pronouncements (Continued)
In June 2015, the GASB issued Statement No. 75, Accounting and Financial Reporting forPostemployment Benefits Other Than Pensions, which addresses reporting bygovernments that provide postemployment benefits other than pensions (OPEB) totheir employees and for governments that finance OPEB for employees of othergovernments. This OPEB standard will require the School District to recognize on theface of the financial statements its proportionate share of the net OPEB liability relatedto its participation in the MPSERS plan. The Statement also enhances accountability andtransparency through revised note disclosures and required supplementary information(RSI). The School District is currently evaluating the impact this standard will have on thefinancial statements when adopted. The provisions of this statement are effective for theSchool District’s financial statements for the year ending June 30, 2018.
Note 11 - Subsequent Events
On July 7, 2015 the School District issued 2015 School Building and Site Bonds withgross proceeds of $64,400,000. Interest is payable semiannually on November 1 andMay 1 at 3.75 percent to 4 percent, commencing November 1, 2015. Bonds matureserially on May 1, beginning in 2019. The final maturity occurs May 1, 2040.
45

South Lyon Community Schools
Notes to Financial StatementsJune 30, 2015
Note 12 - Adoption of New Standard
The GASB issued GASB Statement No. 68, Accounting and Financial Reporting forPensions, and GASB Statement No. 71, Pension Transition for Contributions MadeSubsequent to the Measurement Date. Statement No. 68 requires governments providingdefined benefit pensions to recognize their unfunded pension benefit obligation as aliability for the first time, and to more comprehensively and comparably measure theannual costs of pension benefits. Statement No. 71 is a clarification to GASB No. 68requiring a government to recognize a beginning deferred outflow of resources for itspension contributions, if any, made subsequent to the measurement date of thebeginning net pension liability. The Statements also enhance accountability andtransparency through revised note disclosures and required supplementary information(RSI). In accordance with the statement, the School District has reported a net pensionliability of approximately $95,182,000 and a beginning deferred outflow for pensioncontributions of approximately $4,500,000 made subsequent to the September 30, 2013measurement date, as a change in accounting principle adjustment to unrestricted netposition as of July 1, 2014.
Governmental
Activities
Business-type
Activities/
Proprietary
Fund TotalNet position - June 30, 2014 - As
previously reported $ 40,294,356 $ 817,794 $ 41,112,150Net pension liability (93,260,914) (1,920,749) (95,181,663)Deferred outflow for pension
contributions 4,398,622 90,592 4,489,214
Net position - June 30, 2014 - Asrestated $ (48,567,936) $ (1,012,363) $ (49,580,299)
46

Required Supplemental Information
47

South Lyon Community Schools
Required Supplemental InformationBudgetary Comparison Schedule - General Fund
Year Ended June 30, 2015
Original Budget Final Budget Actual
Over (Under)
Final Budget
RevenueLocal sources $ 8,941,624 $ 8,967,330 $ 8,907,556 $ (59,774)State sources 52,281,430 54,840,730 54,930,909 90,179Federal sources 2,299,481 2,720,920 2,598,261 (122,659)
Interdistrict sources 2,339,116 2,553,575 2,593,241 39,666
Total revenue 65,861,651 69,082,555 69,029,967 (52,588)
ExpendituresCurrent:
Instruction:Basic program 33,680,387 35,084,103 35,359,107 275,004Added needs 6,331,673 6,415,681 6,139,783 (275,898)
Support services:Pupil 3,962,645 4,086,850 4,147,902 61,052Instructional staff 3,536,862 3,746,623 3,662,838 (83,785)General administration 1,030,155 1,012,250 1,179,421 167,171School administration 4,132,443 4,327,433 4,450,385 122,952Business services 758,531 804,408 827,628 23,220Transportation and maintenance 9,832,358 10,043,103 9,643,166 (399,937)Central services and other support
services 919,395 910,625 898,248 (12,377)Athletics 1,432,293 1,499,860 1,483,178 (16,682)Community services 114,421 119,891 115,664 (4,227)
Capital outlay 239,038 535,705 359,528 (176,177)
Total expenditures 65,970,201 68,586,532 68,266,848 (319,684)
Net (Loss) Income (108,550) 496,023 763,119 267,096
Other Financing Sources (Uses)Proceeds from sale of capital assets - 877,081 877,081 -Transfers in 163,155 163,155 180,514 17,359
Transfers out - (1,250,000) (1,250,000) -
Total other financingsources (uses) 163,155 (209,764) (192,405) 17,359
Net Change in Fund Balance 54,605 286,259 570,714 284,455
Fund Balance - Beginning of year 6,703,738 6,703,738 6,703,738 -
Fund Balance - End of year $ 6,758,343 $ 6,989,997 $ 7,274,452 $ 284,455
48

South Lyon Community Schools
Required Supplemental InformationSchedule of South Lyon Community Schools’ Proportionate Share
of the Net Pension LiabilityMichigan Public School Employees' Retirement System
Determined as of the Plan Year Ended September 30, 2014
School District’s proportion of the net pension liability (asset) %0.40645
School District’s proportionate share of the net pension liability (asset) $ 89,527,056
School District’s covered employee payroll 34,914,698
School District’s proportionate share of the net pension liability (asset) as apercentage of its covered employee payroll %256.42
Plan fiduciary net position as a % of the total pension liability %66.20
49
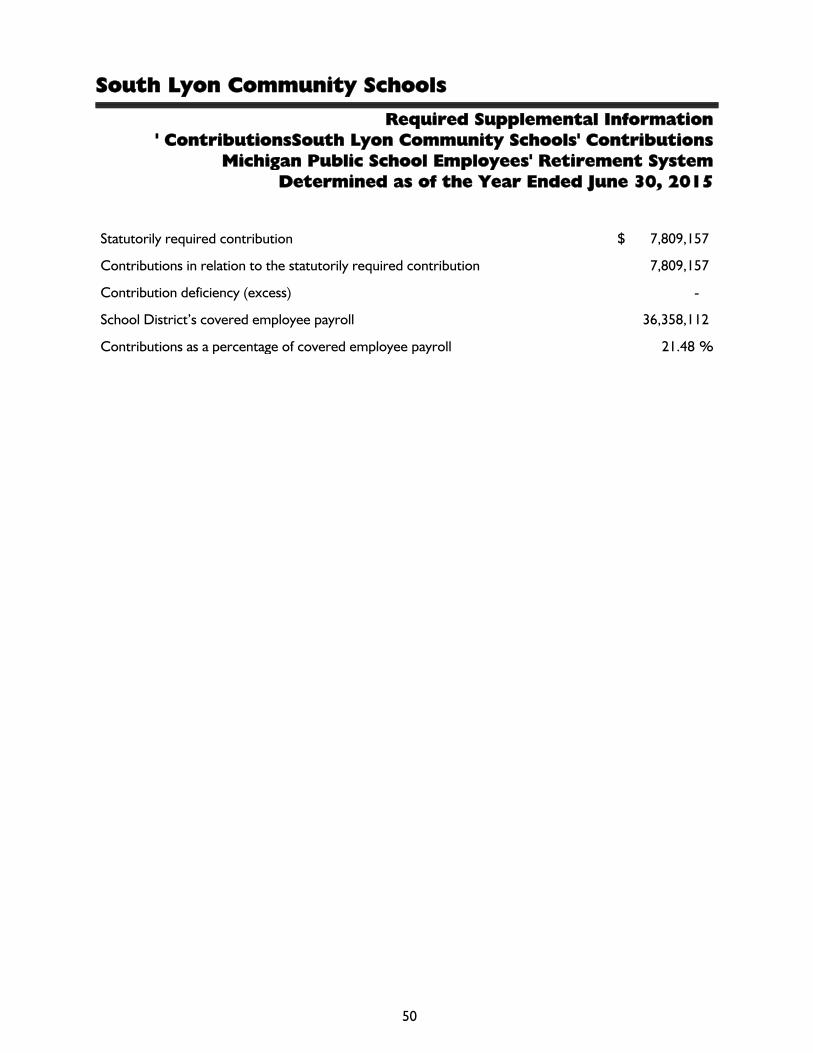
South Lyon Community Schools
Required Supplemental Information' ContributionsSouth Lyon Community Schools' Contributions
Michigan Public School Employees' Retirement SystemDetermined as of the Year Ended June 30, 2015
Statutorily required contribution $ 7,809,157
Contributions in relation to the statutorily required contribution 7,809,157
Contribution deficiency (excess) -
School District’s covered employee payroll 36,358,112
Contributions as a percentage of covered employee payroll %21.48
50

South Lyon Community Schools
Note to Pension Required Supplemental Information SchedulesYear Ended June 30, 2015
Benefit Changes - There were no changes of benefit terms in 2015.
Changes in Assumptions - There were no changes of benefit assumptions in 2015.
51

South Lyon Community Schools
52
Note to Required Supplemental Information
June 30, 2015
Note - Budgetary Information
The basis of budgeting used in the budgetary comparison schedule is consistent with
accounting principles generally accepted in the United States of America and state law.
All annual appropriations lapse at fiscal year end. Annual budgets are adopted on a
basis consistent with generally accepted accounting principles and state law for the
General Fund, special revenue, debt service, and capital projects funds. The annual
budget for the debt service funds is adopted in the aggregate, not for each fund
individually. All annual appropriations lapse at fiscal year end. The budget document
presents information by fund and function. The legal level of budgetary control
adopted by the governing body (i.e., the level at which expenditures may not legally
exceed appropriations) is the function level. State law requires the School District to
have its budget in place by July 1. Expenditures in excess of amounts budgeted for the
General Fund and special revenue funds are a violation of Michigan law. State law
permits districts to amend their budgets during the year. During the year, the budget
was amended in a legally permissible manner. There were no significant amendments
during the year.
The School District did not have significant expenditure budget variances.

Other Supplemental Information
53
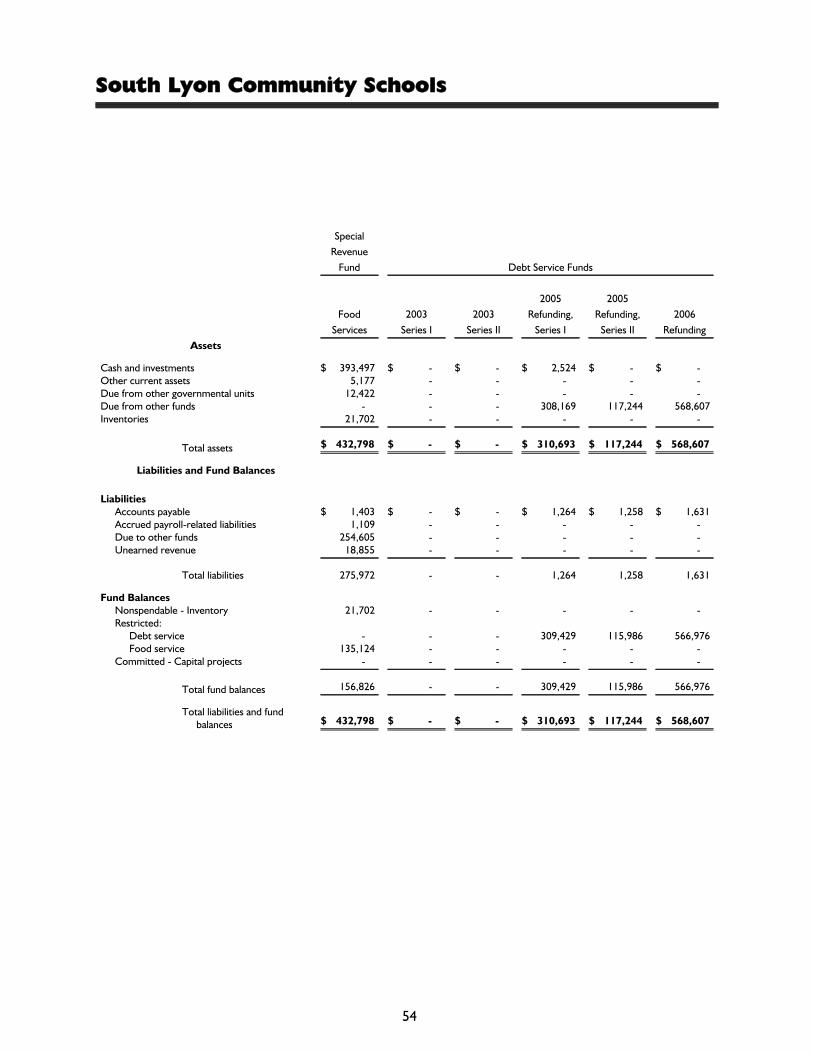
South Lyon Community Schools
Special
Revenue
Fund Debt Service Funds
Food
Services
2003
Series I
2003
Series II
2005
Refunding,
Series I
2005
Refunding,
Series II
2006
Refunding
Assets
Cash and investments $ 393,497 $ - $ - $ 2,524 $ - $ -Other current assets 5,177 - - - - -Due from other governmental units 12,422 - - - - -Due from other funds - - - 308,169 117,244 568,607Inventories 21,702 - - - - -
Total assets $ 432,798 $ - $ - $ 310,693 $ 117,244 $ 568,607
Liabilities and Fund Balances
LiabilitiesAccounts payable $ 1,403 $ - $ - $ 1,264 $ 1,258 $ 1,631Accrued payroll-related liabilities 1,109 - - - - -Due to other funds 254,605 - - - - -Unearned revenue 18,855 - - - - -
Total liabilities 275,972 - - 1,264 1,258 1,631
Fund BalancesNonspendable - Inventory 21,702 - - - - -Restricted:
Debt service - - - 309,429 115,986 566,976Food service 135,124 - - - - -
Committed - Capital projects - - - - - -
Total fund balances 156,826 - - 309,429 115,986 566,976
Total liabilities and fundbalances $ 432,798 $ - $ - $ 310,693 $ 117,244 $ 568,607
54

Other Supplemental InformationCombining Balance Sheet
Nonmajor Governmental FundsJune 30, 2015
Debt Service Funds Capital Projects Funds
2007
Refunding
2011
Refunding
2013
Refunding
Bus
Purchases Technology
Capital
Improvements
Total
Nonmajor
Governmental
Funds
$ - $ - $ - $ - $ - $ - $ 396,021- - - 111,702 - - 116,879- - - - - - 12,422
65,527 - 196,727 2,760 323,605 442,433 2,025,072- - - - - - 21,702
$ 65,527 $ - $ 196,727 $ 114,462 $ 323,605 $ 442,433 $ 2,572,096
$ 420 $ - $ 1,789 $ - $ 2,733 $ 20,390 $ 30,888- - - - - - 1,109- - - - - - 254,605- - - - - - 18,855
420 - 1,789 - 2,733 20,390 305,457
- - - - - - 21,702
65,107 - 194,938 - - - 1,252,436- - - - - - 135,124- - - 114,462 320,872 422,043 857,377
65,107 - 194,938 114,462 320,872 422,043 2,266,639
$ 65,527 $ - $ 196,727 $ 114,462 $ 323,605 $ 442,433 $ 2,572,096
55

South Lyon Community Schools
Special
Revenue
Fund Debt Service Funds
Food
Services 2003 Series I
2003
Series II
2005
Refunding,
Series I
2005
Refunding,
Series II
2006
Refunding
RevenueLocal sources $ 743,837 $ 42 $ - $ 4,615,441 $ 2,080,311 $ 8,416,008State sources 74,018 - - - - -
Federal sources 687,439 - - - - -
Total revenue 1,505,294 42 - 4,615,441 2,080,311 8,416,008Expenditures
Current:Instruction:Food services 1,408,492 - - - - -
Debt service:Principal - - - 4,330,000 2,010,000 4,375,000Interest - - - 216,500 80,400 3,843,736Other - - 5,086 - - 471
Capital outlay 7,248 - - - - -
Total expenditures 1,415,740 - 5,086 4,546,500 2,090,400 8,219,207
Excess of Revenue Over (Under)Expenditures 89,554 42 (5,086) 68,941 (10,089) 196,801
Other Financing Sources (Uses)Transfers in - 14,027 - - - -Transfers out (85,897) - (74,263) - - -
Face value of debt issued - - - - - -
Total other financing(uses) sources (85,897) 14,027 (74,263) - - -
Net Change in Fund Balances 3,657 14,069 (79,349) 68,941 (10,089) 196,801
Fund Balances (Deficit) - Beginning ofyear 153,169 (14,069) 79,349 240,488 126,075 370,175
Fund Balances - End of year $ 156,826 $ - $ - $ 309,429 $ 115,986 $ 566,976
56

Other Supplemental InformationCombining Statement of Revenue, Expenditures, and
Changes in Fund Balances (Deficit)Nonmajor Governmental Funds
Year Ended June 30, 2015
Debt Service Funds Capital Projects Funds
2007
Refunding
2011
Refunding
2013
Refunding
Bus
Purchases Technology
Capital
Improvements
Total
Nonmajor
Governmental
Funds
$ 783,709 $ 5,276 $ 1,653,381 $ - $ - $ - $ 18,298,005- - - - - - 74,018- - - - - - 687,439
783,709 5,276 1,653,381 - - - 19,059,462
- - - - - - 1,408,492
635,000 - 550,000 263,699 - - 12,163,699125,750 - 1,086,202 22,666 - - 5,375,254
375 - - - - - 5,932- - - 530,658 182,000 547,901 1,267,807
761,125 - 1,636,202 817,023 182,000 547,901 20,221,184
22,584 5,276 17,179 (817,023) (182,000) (547,901) (1,161,722)
- - 111,983 - 50,000 1,200,000 1,376,010- (51,747) - - - - (211,907)- - - 530,658 - - 530,658
- (51,747) 111,983 530,658 50,000 1,200,000 1,694,761
22,584 (46,471) 129,162 (286,365) (132,000) 652,099 533,039
42,523 46,471 65,776 400,827 452,872 (230,056) 1,733,600
$ 65,107 $ - $ 194,938 $ 114,462 $ 320,872 $ 422,043 $ 2,266,639
57

South Lyon Community Schools
Other Supplemental InformationSchedule of Bonded Indebtedness
Year Ended June 30, 2015
2006 Refunding 2007 Refunding 2013 Refunding
June 30 Principal Principal Principal
2016 $ 4,890,000 $ 625,000 $ 6,950,0002017 5,320,000 615,000 7,450,0002018 5,755,000 600,000 7,205,0002019 6,070,000 100,000 7,015,0002020 6,290,000 100,000 6,845,0002021 6,500,000 - 6,675,0002022 6,765,000 - 6,520,0002023 6,935,000 - 6,365,0002024 7,035,000 - -2025 7,010,000 - -2026 6,985,000 - -2027 6,960,000 - -
2028 6,910,000 - -
Total $ 83,425,000 $ 2,040,000 $ 55,025,000
Principal payments due May 1 May 1 May 1
Interest payments dueMay 1 and
November 1May 1 and
November 1May 1 and
November 1
Interest rate4.00% to
5.00%4.00% to
5.00%.63%
to 2.89%
Original issue $ 92,485,000 $ 7,180,000 $ 55,575,000
58

South Lyon Community Schools
59
Other Supplemental Information
Special Revenue Fund
Combining Statement of Revenue, Expenditures, and
Changes in Fund Balance - Budget and Actual
Year Ended June 30, 2015
2014
Budget Actual
Over (Under)
Budget Actual
Revenue
Local sources 671,000$ 743,837$ 72,837$ 671,669$
State sources 60,000 74,018 14,018 68,224
Federal sources 675,000 687,439 12,439 653,565
Total revenue 1,406,000 1,505,294 99,294 1,393,458
Expenditures
Food services 1,319,498 1,408,492 88,994 1,445,221
Capital outlay - 7,248 7,248 834
Total expenditures 1,319,498 1,415,740 96,242 1,446,055
Excess of Revenue Over (Under) Expenditures 86,502 89,554 3,052 (52,597)
Other Financing Uses - Transfers out (84,960) (85,897) (937) (86,763)
Net Change in Fund Balance 1,542 3,657 2,115 (139,360)
Fund Balance - Beginning of year 153,169 153,169 - 292,529
Fund Balance - End of year 154,711$ 156,826$ 2,115$ 153,169$
2015
Year Ended June 30
Food Services
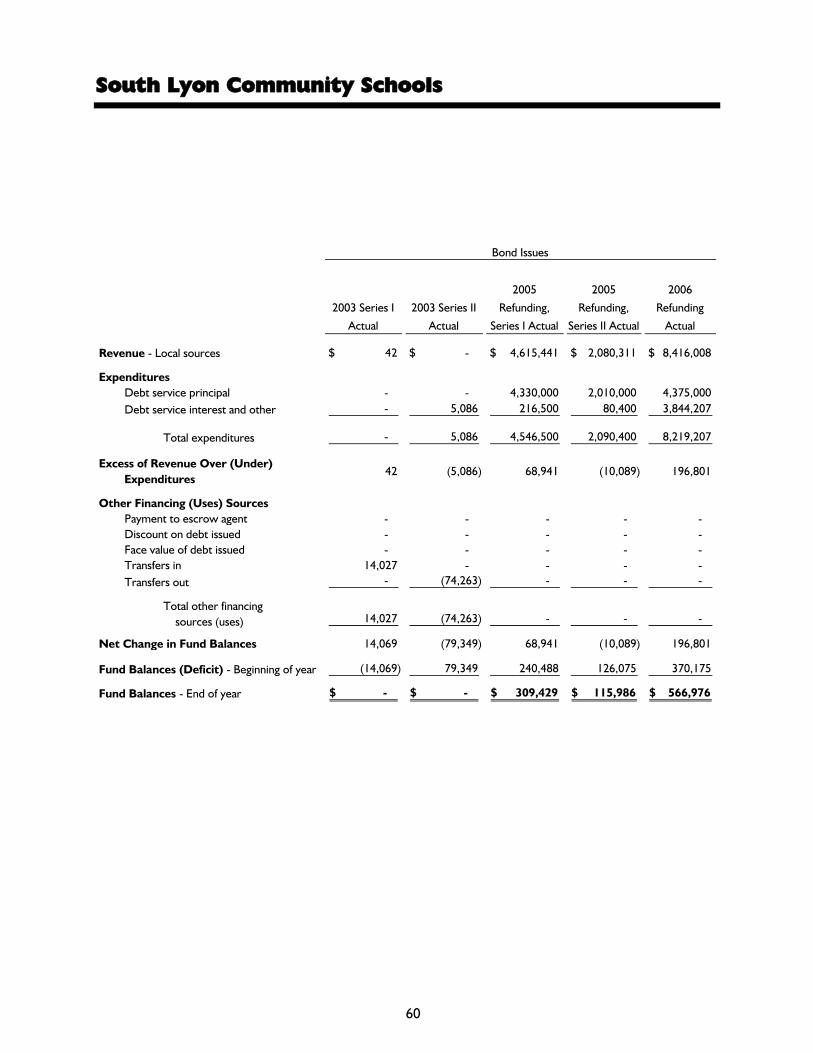
South Lyon Community Schools
60
2003 Series I
Actual
2003 Series II
Actual
2005
Refunding,
Series I Actual
2005
Refunding,
Series II Actual
2006
Refunding
Actual
Revenue - Local sources 42$ - $ 4,615,441$ 2,080,311$ 8,416,008$
Expenditures
Debt service principal - - 4,330,000 2,010,000 4,375,000
Debt service interest and other - 5,086 216,500 80,400 3,844,207
Total expenditures - 5,086 4,546,500 2,090,400 8,219,207
Excess of Revenue Over (Under)
Expenditures
42 (5,086) 68,941 (10,089) 196,801
Other Financing (Uses) Sources
Payment to escrow agent - - - - -
Discount on debt issued - - - - -
Face value of debt issued - - - - -
Transfers in 14,027 - - - -
Transfers out - (74,263) - - -
Total other financing
sources (uses) 14,027 (74,263) - - -
Net Change in Fund Balances 14,069 (79,349) 68,941 (10,089) 196,801
Fund Balances (Deficit) - Beginning of year (14,069) 79,349 240,488 126,075 370,175
Fund Balances - End of year - $ - $ 309,429$ 115,986$ 566,976$
Bond Issues

61
Other Supplemental Information
Debt Service Funds
Combining Statement of Revenue, Expenditures, and
Changes in Fund Balances (Deficit) - Budget and Actual
Year Ended June 30, 2015
Total 2014
2007
Refunding
Actual
2011 Refunding
Actual
2013 Refunding
Actual
Total Debt
Service Funds
Actual
Total Debt
Service Funds
Budget
Over (Under)
Budget
Total Debt
Service Funds
Actual
783,709$ 5,276$ 1,653,381$ 17,554,168$ 17,345,967$ 208,201$ 18,211,682$
635,000 - 550,000 11,900,000 11,900,000 - 11,465,000
126,125 - 1,086,202 5,358,520 5,336,590 21,930 5,816,002
761,125 - 1,636,202 17,258,520 17,236,590 21,930 17,281,002
22,584 5,276 17,179 295,648 109,377 186,271 930,680
- - - - - - -
- - - - - - -
- - - - - - -
- 111,983 126,010 - 126,010 380,578
- (51,747) - (126,010) - (126,010) (380,578)
- (51,747) 111,983 - - - -
22,584 (46,471) 129,162 295,648 109,377 186,271 930,680
42,523 46,471 65,776 956,788 956,788 - 26,108
65,107$ - $ 194,938$ 1,252,436$ 1,066,165$ 186,271$ 956,788$
Total 2015Bond Issues

South Lyon Community Schools
62
Budget Actual
Over (Under)
Budget Budget Actual
Over (Under)
Budget
Revenue - Local - $ - $ - $ - $ - $ - $
Expenditures
Debt service:
Note redemption 268,085 263,699 (4,386) - - -
Note interest 21,358 22,666 1,308 - - -
Other - - - - - -
Capital outlay 430,678 530,658 99,980 233,600 182,000 (51,600)
Total expenditures 720,121 817,023 96,902 233,600 182,000 (51,600)
Excess of Expenditures Over Revenue (720,121) (817,023) (96,902) (233,600) (182,000) 51,600
Other Financing Sources
Transfers in - - 50,000 50,000 -
Face value of debt issued 530,658 530,658 - - - -
Total other financing
sources 530,658 530,658 - 50,000 50,000 -
Net Change in Fund Balances (189,463) (286,365) (96,902) (183,600) (132,000) 51,600
Fund Balances (Deficit) - Beginning of year 400,827 400,827 - 452,872 452,872 -
Fund Balances - End of year 211,364$ 114,462$ (96,902)$ 269,272$ 320,872$ 51,600$
Bus Purchases Technology

63
Other Supplemental Information
Capital Projects Funds
Combining Statement of Revenue, Expenditures, and
Changes in Fund Balances (Deficit) - Budget and Actual
Year Ended June 30, 2015
Total 2014
Total Capital Projects Funds
Total Capital
Projects Funds
Budget Actual
Over (Under)
Budget Budget Actual
Over
(Under)
Budget Actual
- $ - $ - $ - $ - $ - $ - $
- - - 268,085 263,699 (4,386) 176,773
- - - 21,358 22,666 1,308 16,859
50,000 - (50,000) 50,000 - (50,000) -
509,850 547,901 38,051 1,174,128 1,260,559 86,431 1,803,331
559,850 547,901 (11,949) 1,513,571 1,546,924 33,353 1,996,963
(559,850) (547,901) 11,949 (1,513,571) (1,546,924) (33,353) (1,996,963)
1,200,000 1,200,000 - 1,250,000 1,250,000 - 650,000
- - - 530,658 530,658 - 448,466
1,200,000 1,200,000 - 1,780,658 1,780,658 - 1,098,466
640,150 652,099 11,949 267,087 233,734 (33,353) (898,497)
(230,056) (230,056) - 623,643 623,643 - 1,522,140
410,094$ 422,043$ 11,949$ 890,730$ 857,377$ (33,353)$ 623,643$
Capital Improvements
Total 2015

South Lyon Community Schools
64
Other Supplemental Information
Schedule of Cash and Cash Equivalents
June 30, 2015
Fund Type of Investment
Interest
Rate
(Percent)
Date of
Maturity Carrying Value
General Savings/Checking accounts Variable - 3,773,074$
MBIA Variable - 9,434
Sweep investment account - Michigan School
District Liquid Asset Fund Variable - 392,295
Petty cash - 284
Cash management fund - Michigan School District
Liquid Asset Fund Variable - 2,984,992
Total General Fund 7,160,079
Special Revenue Checking account - - 393,495
Cash management fund - Michigan School District
Liquid Asset Fund Variable - 2
Total special revenue funds 393,497
Debt Service Savings/Checking accounts Variable - 1,649
Cash management fund - Michigan School District
Liquid Asset Fund Variable - 875
Total debt service funds 2,524
Proprietary Savings/Checking accounts Variable - 6,426
Petty cash - 295
Total proprietary fund 6,721
Agency Checking account - - 1,054,352
Petty cash - - 500
Comerica Governmental Cash Investment Fund Variable - 713,616
Total agency fund 1,768,468
Total cash, cash equivalents,
and investments 9,331,289$

65
Long-term Debt
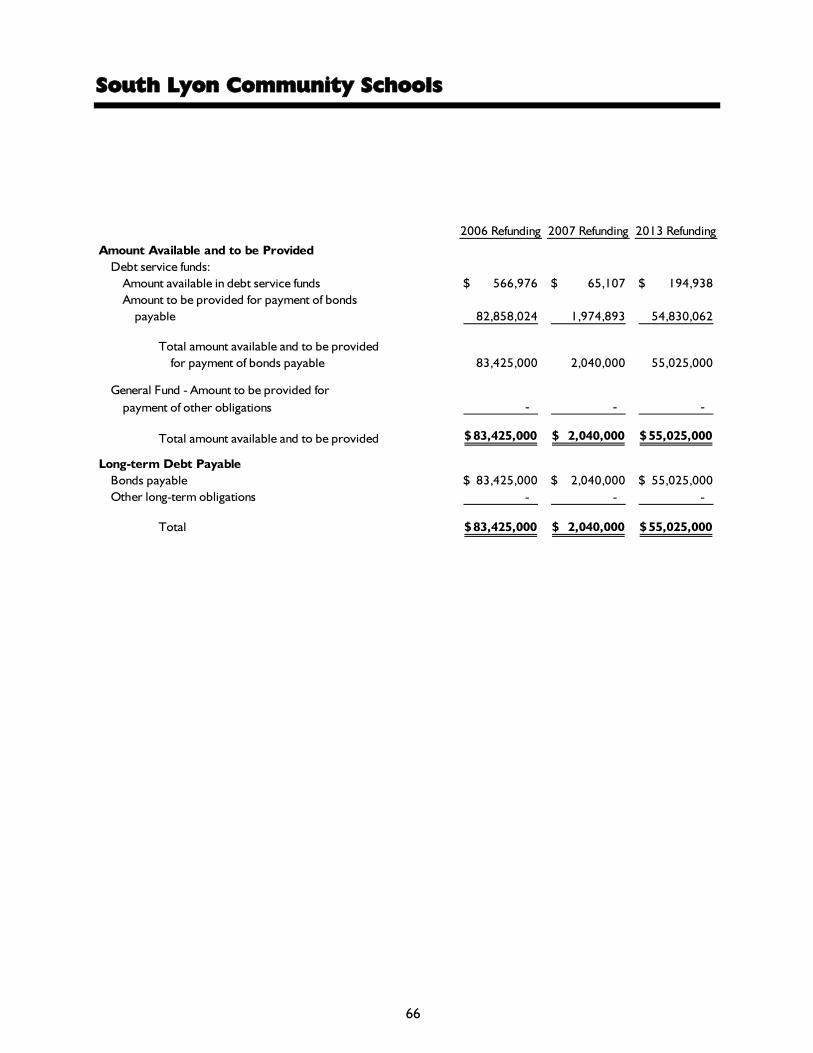
South Lyon Community Schools
66
2006 Refunding 2007 Refunding 2013 Refunding
Amount Available and to be Provided
Debt service funds:
Amount available in debt service funds 566,976$ 65,107$ 194,938$
Amount to be provided for payment of bonds
payable 82,858,024 1,974,893 54,830,062
Total amount available and to be provided
for payment of bonds payable 83,425,000 2,040,000 55,025,000
General Fund - Amount to be provided for
payment of other obligations - - -
Total amount available and to be provided 83,425,000$ 2,040,000$ 55,025,000$
Long-term Debt Payable
Bonds payable 83,425,000$ 2,040,000$ 55,025,000$
Other long-term obligations - - -
Total 83,425,000$ 2,040,000$ 55,025,000$

67
Long-term Debt
Schedule of Long-term Debt
June 30, 2015
Other Obligations
Total
Obligations
- $ 827,021$
- 139,662,979
- 140,490,000
3,428,866 3,428,866
3,428,866$ 143,918,866$
- $ 140,490,000$
3,428,866 3,428,866
3,428,866$ 143,918,866$

South Lyon Community Schools
68
2005 Refunding,
Series I
2005 Refunding,
Series II 2006 Refunding
Long-term Debt Outstanding - July 1, 2014 4,330,000$ 2,010,000$ 87,800,000$
Additions - Issuance of bonds and other obligations - - -
Reductions
Decrease in other obligations - - -
Retirements and payments (4,330,000) (2,010,000) (4,375,000)
Long-term Debt Outstanding - June 30, 2015 - $ - $ 83,425,000$
Bond Issues

69
Long-term Debt
Schedule of Changes in Long-term Debt
Year Ended June 30, 2015
2007 Refunding 2013 Refunding
Other
Obligations
Total
Obligations
2,675,000$ 55,575,000$ 3,232,428$ 155,622,428$
- - 751,864 751,864
- - (555,426) (555,426)
(635,000) (550,000) - (11,900,000)
2,040,000$ 55,025,000$ 3,428,866$ 143,918,866$
Bond Issues

70
Statistical and Other Information
(Unaudited)

71
Statistical and Other Information
(Unaudited)
This part of South Lyon Community Schools’ Comprehensive Annual Financial Report presents
detailed information as a context for understanding what the information in the financial
statements, note disclosures, and required supplemental information say about the
government’s overall financial health.
Contents
Financial Trends
These schedules contain trend information to help the reader understand how the School
District’s financial performance and well-being have changed over time.
Revenue Capacity
These schedules contain information to help the reader assess the School District’s most
significant local revenue source, the property tax.
Debt Capacity
These schedules present information to help the reader assess the affordability of the School
District’s current levels of outstanding debt and the School District’s ability to issue additional
debt in the future.
Demographic and Economic Information
These schedules offer demographic and economic indicators to help the reader understand the
environment within which the School District’s financial activities take place.
Operating Information
These schedules contain service and infrastructure data to help the reader understand how
the information in the School District’s financial report relates to the services the School
District provides and the activities it performs.

South Lyon Community Schools
72
Net Position by Component
Fiscal Year Ended June 30
(Unaudited)
2006 2007 2008 2009 2010 2011 2012 2013 2014 2015
Governmental Activities
Net investment in capital assets (788,026)$ 3,268,835$ 6,652,459$ 8,553,932$ 12,200,638$ 16,444,706$ 23,127,706$ 28,224,217$ 34,528,387$ 39,847,038$
Restricted 4,813,041 4,248,016 2,892,516 2,886,810 1,666,940 2,035,945 282,291 292,529 534,295 819,576
Unrestricted 4,906,240 6,138,505 6,054,933 6,666,920 6,719,300 8,932,632 7,505,514 6,215,651 5,231,674 (82,040,046)
Total net position 8,931,255 13,655,356 15,599,908 18,107,662 20,586,878 27,413,283 30,915,511 34,732,397 40,294,356 (41,373,432)
Business-type Activities -
Unrestricted 304,424 307,584 300,312 371,742 419,098 553,785 682,594 761,007 817,794 (837,523)
Primary Government in Total
Net investment in capital assets (788,026) 3,268,835 6,652,459 8,553,932 12,200,638 16,444,706 23,127,706 28,224,217 34,528,387 39,847,038
Restricted 4,813,041 4,248,016 2,892,516 2,886,810 1,666,940 2,035,945 282,291 292,529 534,295 819,576
Unrestricted 5,210,664 6,446,089 6,355,245 7,038,662 7,138,398 9,486,417 8,188,108 6,976,658 6,049,468 (82,877,569)
Total net position 9,235,679$ 13,962,940$ 15,900,220$ 18,479,404$ 21,005,976$ 27,967,068$ 31,598,105$ 35,493,404$ 41,112,150$ (42,210,955)$
Source: South Lyon Community Schools audited financial statements
June 30

South Lyon Community Schools
73
Changes in Governmental Net Position
Fiscal Year Ended June 30
(Unaudited)
2006 2007 2008 2009 2010 2011 2012 2013 2014 2015
Expenses - Governmental
activities
Instruction 34,309,523$ 36,986,181$ 36,198,516$ 35,964,591$ 36,946,119$ 37,158,906$ 38,906,569$ 39,855,782$ 44,163,796$ 45,698,554$
Support services 24,404,209 25,633,887 26,748,233 26,258,234 25,240,332 23,034,291 23,134,788 25,814,100 25,674,195 26,158,958
Food services 1,414,557 1,415,829 1,569,095 1,502,289 1,434,071 1,358,081 1,396,600 1,324,779 1,446,055 1,476,982
Athletics 229,045 256,696 454,632 1,381,313 1,344,703 1,291,617 1,306,959 1,337,381 1,393,359 1,382,593
Community services 165,735 159,140 188,684 192,692 180,079 107,013 96,450 110,871 110,470 113,852
Interest on long-term debt 10,139,352 6,600,907 9,705,405 9,436,891 8,957,865 8,384,672 8,333,759 6,977,387 5,451,572 5,308,448
Other - - - 115,556 - - - 256,593 - -
Depreciation (unallocated) - - - - - - - - - -
Total expenses 70,662,421 71,052,640 74,864,565 74,851,566 74,103,169 71,334,580 73,175,125 75,676,893 78,239,447 80,139,387
Program Revenue
Charges for services:
Support services - - - - - 24,222 261,591 138,360 227,797 208,870
Food services 977,434 989,871 1,024,750 913,803 823,068 738,173 677,293 654,731 671,669 743,837
Athletics 303,971 315,033 341,998 178,866 145,292 168,112 139,817 90,121 93,612 72,979
Community services 20,793 - - 118,113 39,100 178,982 - - - -
Other - - - - - - 9,877 - - -
Operating grants and
contributions 5,640,185 5,881,314 5,328,299 9,502,737 7,909,202 7,208,708 7,146,404 8,290,760 9,406,433 11,424,145
Total program
revenue 6,942,383 7,186,218 6,695,047 10,713,519 8,916,662 8,318,197 8,234,982 9,173,972 10,399,511 12,449,831
Net Expense (63,720,038) (63,866,422) (68,169,518) (64,138,047) (65,186,507) (63,016,383) (64,940,143) (66,502,921) (67,839,936) (67,689,556)
General Revenue
Property taxes 23,269,685 25,367,626 26,897,913 26,214,874 25,986,993 26,039,754 24,895,362 25,218,610 25,798,492 25,405,034
State aid not restricted to
specific purposes 38,585,528 40,028,828 41,810,281 39,750,816 39,077,384 41,305,092 42,157,496 45,000,386 46,938,015 49,307,905
Federal sources - Unrestricted - - - - - 1,688,841 804,878 - - -
Investment earnings 2,690,581 2,617,194 916,774 223,565 32,169 52,654 14,064 3,358 11,116 24,260
Other 458,243 576,875 489,102 456,546 2,569,177 756,447 570,571 97,453 654,272 146,861
Total general
revenue 65,004,037 68,590,523 70,114,070 66,645,801 67,665,723 69,842,788 68,442,371 70,319,807 73,401,895 74,884,060
Change in Net Position 1,283,999$ 4,724,101$ 1,944,552$ 2,507,754$ 2,479,216$ 6,826,405$ 3,502,228$ 3,816,886$ 5,561,959$ 7,194,504$
Source: South Lyon Community Schools audited financial statements
June 30

South Lyon Community Schools
74
Changes in Business-type Net Position
Fiscal Year Ended June 30
(Unaudited)
2006 2007 2008 2009 2010 2011 2012 2013 2014 2015
Operating Revenue 1,368,287$ 1,425,748$ 1,435,655$ 1,299,872$ 1,173,668$ 1,271,084$ 1,218,862$ 1,356,334$ 1,329,581$ 1,599,853$
Operating Expenses -
Community education 1,384,606 1,422,588 1,442,927 1,228,442 1,126,312 1,136,397 1,090,053 1,277,921 1,272,794 1,425,013
Change in Net Position (16,319)$ 3,160$ (7,272)$ 71,430$ 47,356$ 134,687$ 128,809$ 78,413$ 56,787$ 174,840$
Source: South Lyon Community Schools audited financial statements
June 30

South Lyon Community Schools
75
Changes in Net Position - Total Primary Government
Fiscal Year Ended June 30
(Unaudited)
2006 2007 2008 2009 2010 2011 2012 2013 2014 2015
Expenses
Governmental activities:
Instruction 34,309,523$ 36,986,181$ 36,198,516$ 35,964,591$ 36,946,119$ 37,158,906$ 38,906,569$ 39,855,782$ 44,163,796$ 45,698,554$
Support services 24,404,209 25,633,887 26,748,233 26,258,234 25,240,332 23,034,291 23,134,788 25,814,100 25,674,195 26,158,958
Food services 1,414,557 1,415,829 1,569,095 1,502,289 1,434,071 1,358,081 1,396,600 1,324,779 1,446,055 1,476,982
Athletics 229,045 256,696 454,632 1,381,313 1,344,703 1,291,617 1,306,959 1,337,381 1,393,359 1,382,593
Community services 165,735 159,140 188,684 192,692 180,079 107,013 96,450 110,871 110,470 113,852
Interest on long-term debt 10,139,352 6,600,907 9,705,405 9,436,891 8,957,865 8,384,672 8,333,759 6,977,387 5,451,572 5,308,448
Other - - - 115,556 - - - 256,593 - -
Depreciation (unallocated) - - - - - - - - - -
Total governmental activities 70,662,421 71,052,640 74,864,565 74,851,566 74,103,169 71,334,580 73,175,125 75,676,893 78,239,447 80,139,387
Business-type activities - Community
education 1,384,606 1,422,588 1,442,927 1,228,442 1,126,312 1,136,397 1,090,053 1,277,921 1,272,794 1,330,396
Total expenses 72,047,027 72,475,228 76,307,492 76,080,008 75,229,481 72,470,977 74,265,178 76,954,814 79,512,241 81,469,783
Program Revenue
Charges for services:
Support services - - - - - 24,222 261,591 138,360 227,797 208,870
Food services 977,434 989,871 1,024,750 913,803 823,068 738,173 677,293 654,731 671,669 743,837
Athletics 303,971 315,033 341,998 178,866 145,292 168,112 139,817 90,121 93,612 72,979
Community services 20,793 - - 118,113 39,100 178,982 - - - -
Other - - - - - - 9,877 - - -
Operating grants and contributions 5,640,185 5,881,314 5,328,299 9,502,737 7,909,202 7,208,708 7,146,404 8,290,760 9,406,433 11,424,145
Total program revenue 6,942,383 7,186,218 6,695,047 10,713,519 8,916,662 8,318,197 8,234,982 9,173,972 10,399,511 12,449,831
Operating Revenue 1,368,287 1,425,748 1,435,655 1,299,872 1,173,668 1,271,084 1,218,862 1,356,334 1,329,581 1,599,853
Total 8,310,670 8,611,966 8,130,702 12,013,391 10,090,330 9,589,281 9,453,844 10,530,306 11,729,092 14,049,684
Net Expense (63,736,357) (63,863,262) (68,176,790) (64,066,617) (65,139,151) (62,881,696) (64,811,334) (66,424,508) (67,783,149) (67,420,099)
General Revenue
Property taxes 23,269,685 25,367,626 26,897,913 26,214,874 25,986,993 26,039,754 24,895,362 25,218,610 25,798,492 25,405,034
State aid not restricted to
specific purposes 38,585,528 40,028,828 41,810,281 39,750,816 39,077,384 41,305,092 42,157,496 45,000,386 46,938,015 49,307,905
Federal sources - Unrestricted - - - - - 1,688,841 804,878 - - -
Investment earnings 2,690,581 2,617,194 916,774 223,565 32,169 52,654 14,064 3,358 11,116 24,260
Other 458,243 576,875 489,102 456,546 2,569,177 756,447 570,571 97,453 654,272 52,244
Total general revenue 65,004,037 68,590,523 70,114,070 66,645,801 67,665,723 69,842,788 68,442,371 70,319,807 73,401,895 74,789,443
Change in Net Position 1,267,680$ 4,727,261$ 1,937,280$ 2,579,184$ 2,526,572$ 6,961,092$ 3,631,037$ 3,895,299$ 5,618,746$ 7,369,344$
Source: South Lyon Community Schools audited financial statements
June 30

South Lyon Community Schools
76
2006 2007 2008 2009
General Fund
Reserved 168,477$ 116,305$ 130,750$ 142,880$
Unreserved 3,456,462 5,419,524 5,578,584 5,449,582
Nonspendable - - - -
Restricted - - - -
Committed - - - -
Unassigned - - - -
Total General Fund 3,624,939$ 5,535,829$ 5,709,334$ 5,592,462$
All Other Governmental Funds
Reserved:
Capital project funds 2,183,660$ 1,854,215$ 1,792,205$ 2,422,964$
Debt service funds 2,952,032 2,421,070 2,531,792 2,665,718
Other 39,616,687 10,425,272 1,042,851 6,134
Unreserved - Special revenue funds 434,300 545,017 400,459 394,919
Nonspendable, reported in: - - - -
Debt Service Funds - - - -
Special Revenue Funds - - - -
Capital Project Funds - - - -
Restricted, reported in: - - - -
Debt Service Funds - - - -
Special Revenue Funds - - - -
Capital Project Funds - - - -
Assigned, reported in: - - - -
Debt Service Funds - - - -
Special Revenue Funds - - - -
Capital Project Funds - - - -
Unassigned, reported in: - - - -
Debt Service Funds - - - -
Special Revenue Funds - - - -
Capital Project Funds - - - -
Total all other governmental funds 45,186,679$ 15,245,574$ 5,767,307$ 5,489,735$
June 30

77
Fund Balances - Governmental Funds
Last Ten Fiscal Years
(Unaudited)
2010 2011 2012 2013 2014 2015
148,097$ - $ - $ - $ - $ - $
4,777,938 - - - - -
- 867,331 729,288 730,500 89,532 100,879
- - - - - -
- 2,377,726 2,301,775 2,371,690 2,544,648 2,505,072
- 4,627,981 4,605,837 4,404,367 4,069,558 4,668,501
4,926,035$ 7,873,038$ 7,636,900$ 7,506,557$ 6,703,738$ 7,274,452$
2,268,343$ - $ - $ - $ - $ - $
1,666,940 - - - - -
10,215 - - - - -
503,395 - - - - -
- - - - - -
- - - - - -
- 14,791 14,141 11,854 11,856 21,702
- - - - - -
- - - - -
- 1,674,789 963,987 379,474 970,857 1,252,436
- 361,156 282,291 280,675 141,313 135,124
- 221,226 - - - -
- - - - - -
- - - - - -
- - - - - -
- 2,621,816 2,230,261 1,522,140 853,699 857,377
- - - - - -
- - - - - -
- - - - - -
- - (42,402) (353,366) (244,125) -
4,448,893$ 4,893,778$ 3,448,278$ 1,840,777$ 1,733,600$ 2,266,639$
June 30

South Lyon Community Schools
78
2006 2007 2008 2009
Revenue
Local revenue 27,720,707$ 29,866,599$ 29,670,537$ 28,251,377$
State revenue 39,913,326 41,459,730 42,369,964 41,404,512
Federal revenue 1,913,743 1,986,491 2,196,989 5,114,014
Interdistrict revenue 2,398,644 2,463,921 2,571,627 2,469,856
Total revenue 71,946,420 75,776,741 76,809,117 77,239,759
Expenditures
Current:
Instruction 29,963,954 30,393,826 31,853,141 32,397,210
Support services 21,796,906 21,671,466 24,367,897 23,757,286
Food services 1,414,557 1,415,829 1,569,095 1,500,461
Athletics 229,045 256,696 454,632 1,381,313
Community services 165,735 159,140 188,684 192,692
Other - 987,867 346,656 115,556
Debt service:
Principal 5,729,212 6,315,660 7,319,755 7,977,863
Interest 10,279,213 9,938,501 9,624,976 9,232,465
Other 262,278 796,222 90,797 261,631
Capital outlay 29,908,408 33,272,043 10,327,688 1,052,551
Total expenditures 99,749,308 105,207,250 86,143,321 77,869,028
Excess of Revenue (Under) Over
Expenditures (27,802,888) (29,430,509) (9,334,204) (629,269)
Other Financing Sources (Uses)
Debt issuance 30,025,000 100,543,436 - 234,825
Debt premium or discount 905,357 684,256 - -
Proceeds from sale of capital assets - - - -
Transfers in 1,777,584 1,424,892 4,400,859 1,183,914
Transfers out (1,753,254) (1,392,834) (4,371,417) (1,183,914)
Debt defeasance (31,484,529) (99,859,456) - -
Total other financing
sources (uses) (529,842) 1,400,294 29,442 234,825
Net Change in Fund Balances (28,332,730) (28,030,215) (9,304,762) (394,444)
Fund Balances - Beginning of year 77,144,348 48,811,618 20,781,403 11,476,641
Fund Balances - End of year 48,811,618$ 20,781,403$ 11,476,641$ 11,082,197$
Debt Service as a Percentage of
Noncapital Expenditures 29.88% 29.62% 28.83% 29.00%
Source: South Lyon Community Schools audited financial statements
Year Ended June 30

79
Changes in Fund Balances - Governmental Funds
Last Ten Fiscal Years
(Unaudited)
2010 2011 2012 2013 2014 2015
27,693,598$ 27,928,751$ 26,683,847$ 26,889,667$ 27,616,463$ 27,205,561$
40,543,769 42,692,583 44,480,322 48,371,708 51,262,724 55,004,927
5,142,918 5,889,290 3,584,571 2,983,650 2,733,838 3,285,700
2,511,962 2,386,202 2,064,602 2,112,756 2,197,095 2,593,241
75,892,247 78,896,826 76,813,342 80,357,781 83,810,120 88,089,429
32,861,632 33,174,340 35,369,791 36,726,688 38,356,159 41,498,890
23,687,219 20,672,668 20,290,964 22,149,130 24,000,745 24,809,588
1,434,071 1,356,233 1,362,101 1,324,779 1,445,221 1,483,178
1,344,703 1,221,130 1,306,959 1,321,767 1,390,644 1,408,492
191,642 107,013 96,450 110,871 110,470 115,664
- - - - - -
8,628,621 9,714,527 10,573,523 11,145,466 11,641,773 12,163,699
8,935,977 8,525,861 8,097,110 7,668,978 5,830,300 5,375,254
69,752 20,532 2,015 186,599 2,561 5,932
1,042,495 786,579 1,468,072 2,261,925 2,430,835 1,627,335
78,196,112 75,578,883 78,566,985 82,896,203 85,208,708 88,488,032
(2,303,865) 3,317,943 (1,753,643) (2,538,422) (1,398,588) (398,603)
530,000 3,875,000 - 56,090,577 448,466 530,658
- - (236,194) - -
- - - 21,330 6,328 877,081
788,158 2,431,438 1,174,151 1,027,123 1,151,139 1,556,524
(721,562) (2,358,551) (1,102,146) (951,000) (1,117,341) (1,461,907)
- (3,873,942) - (55,151,258) - -
596,596 73,945 72,005 800,578 488,592 1,502,356
(1,707,269) 3,391,888 (1,681,638) (1,737,844) (909,996) 1,103,753
11,082,197 9,374,928 12,766,816 11,085,178 9,347,334 8,437,338
9,374,928$ 12,766,816$ 11,085,178$ 9,347,334$ 8,437,338$ 9,541,091$
29.51% 32.27% 31.96% 30.53% 26.76% 25.30%
Year Ended June 30
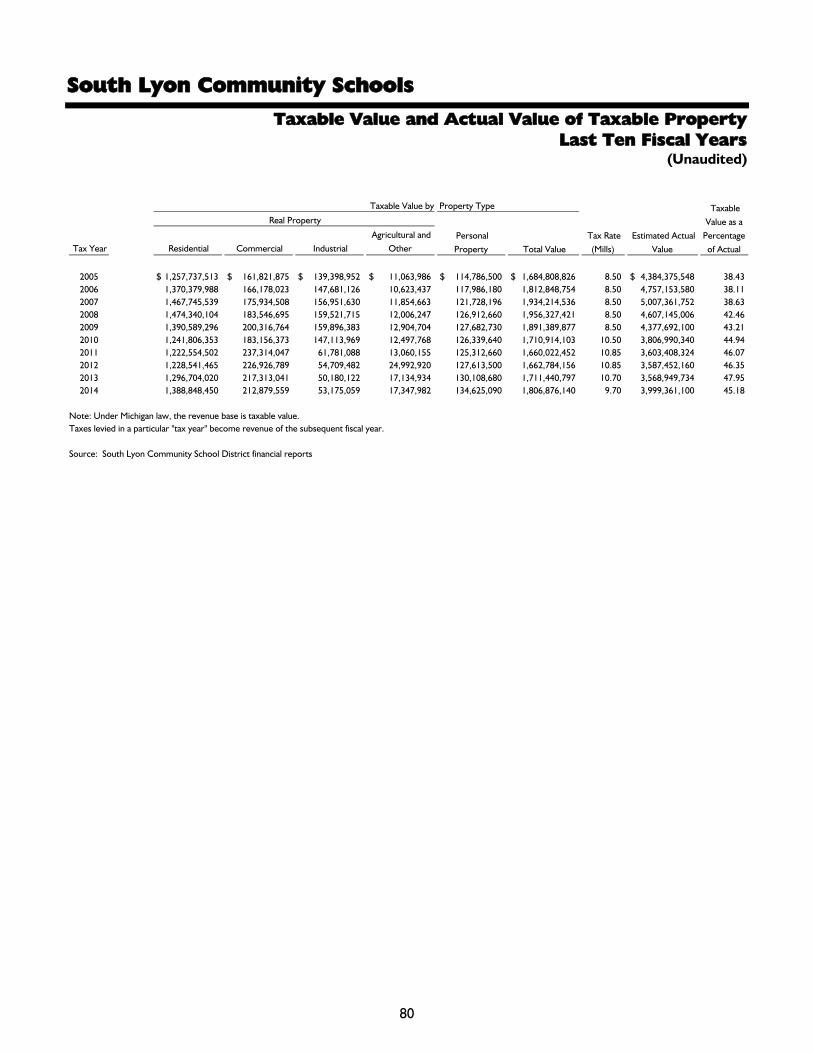
South Lyon Community Schools
80
Taxable Value and Actual Value of Taxable Property
Last Ten Fiscal Years
(Unaudited)
Tax Year Residential Commercial Industrial
Agricultural and
Other
2005 1,257,737,513$ 161,821,875$ 139,398,952$ 11,063,986$ 114,786,500$ 1,684,808,826$ 8.50 4,384,375,548$ 38.43
2006 1,370,379,988 166,178,023 147,681,126 10,623,437 117,986,180 1,812,848,754 8.50 4,757,153,580 38.11
2007 1,467,745,539 175,934,508 156,951,630 11,854,663 121,728,196 1,934,214,536 8.50 5,007,361,752 38.63
2008 1,474,340,104 183,546,695 159,521,715 12,006,247 126,912,660 1,956,327,421 8.50 4,607,145,006 42.46
2009 1,390,589,296 200,316,764 159,896,383 12,904,704 127,682,730 1,891,389,877 8.50 4,377,692,100 43.21
2010 1,241,806,353 183,156,373 147,113,969 12,497,768 126,339,640 1,710,914,103 10.50 3,806,990,340 44.94
2011 1,222,554,502 237,314,047 61,781,088 13,060,155 125,312,660 1,660,022,452 10.85 3,603,408,324 46.07
2012 1,228,541,465 226,926,789 54,709,482 24,992,920 127,613,500 1,662,784,156 10.85 3,587,452,160 46.35
2013 1,296,704,020 217,313,041 50,180,122 17,134,934 130,108,680 1,711,440,797 10.70 3,568,949,734 47.95
2014 1,388,848,450 212,879,559 53,175,059 17,347,982 134,625,090 1,806,876,140 9.70 3,999,361,100 45.18
Note: Under Michigan law, the revenue base is taxable value.
Taxes levied in a particular "tax year" become revenue of the subsequent fiscal year.
Source: South Lyon Community School District financial reports
Taxable Value by Taxable
Value as a
Percentage
of Actual
Personal
Property Total Value
Estimated Actual
Value
Tax Rate
(Mills)
Real Property
Property Type

South Lyon Community Schools
81
Millage Rates - Direct School District Taxes
Tax
Year
Year
Ended
June 30 Homestead
Non-
homestead Debt* Homestead
Non-
homestead
Oakland
County
Washtenaw
County
Livingston
County
Oakland
Community
College
Washtenaw
Community
College
2003 2004 - 18.00 8.00 8.00 26.00 4.19 5.58 4.15 1.61 3.83
2004 2005 - 18.00 8.50 8.50 26.50 4.19 5.55 3.92 1.59 3.77
2005 2006 - 18.00 8.50 8.50 26.50 4.19 5.50 3.90 1.59 3.72
2006 2007 - 18.00 8.50 8.50 26.50 4.19 5.68 3.39 1.59 3.71
2007 2008 - 18.00 8.50 8.50 26.50 4.19 5.68 3.88 1.58 3.70
2008 2009 - 18.00 8.50 8.50 26.50 4.19 5.70 3.88 1.58 3.69
2009 2010 - 18.00 8.50 8.50 26.50 4.19 5.74 3.88 1.58 3.69
2010 2011 - 18.00 10.50 10.50 28.50 4.19 5.74 3.95 1.58 3.69
2011 2012 - 18.00 10.85 10.85 28.85 4.19 5.75 3.95 1.58 3.72
2012 2013 - 18.00 10.85 10.85 28.85 4.19 5.77 3.95 1.58 3.64
2013 2014 - 18.00 10.70 10.70 28.70 4.19 5.78 3.95 1.58 3.46
2014 2015 - 18.00 9.70 9.70 27.70 4.19 6.07 3.95 1.58 3.46
* Debt and sinking fund millages apply to homestead and non-homestead property
Source: Assessment and tax roll certificates and warrants
Operating Total Direct Taxes Overlapping Taxes

82
Direct and Overlapping Property Tax Rates
Year Ended June 30, 2014
(Unaudited)
Oakland
Intermediate
School
District
Washtenaw
Intermediate
School
District
Livingston
Intermediate
School
District
State
Education
City of
South
Lyon
City of
Novi
City of
Wixom
Township
of Lyon
Township
of Milford
Township
of Salem
Township of
Northfield
Township
of Green
Oak
3.40 3.06 2.41 5.00 14.72 10.54 11.14 4.30 7.05 - 9.68 3.97
3.38 4.04 2.38 6.00 14.75 10.54 11.74 4.20 7.19 - 9.70 3.95
3.37 4.00 2.35 6.00 15.11 10.54 11.64 4.20 7.14 - 9.68 3.89
3.37 3.97 2.34 6.00 15.11 10.54 11.52 4.12 7.08 - 9.42 3.88
3.37 3.97 2.34 6.00 15.06 10.54 11.74 4.65 7.06 - 9.35 3.76
3.37 3.97 2.34 6.00 15.06 10.54 11.63 4.65 7.07 - 9.45 3.76
3.37 3.97 2.34 6.00 15.06 10.54 11.93 4.65 7.33 - 7.03 3.76
3.37 3.97 2.34 6.00 15.21 10.54 12.74 4.75 8.19 - 7.92 3.76
3.37 3.97 2.34 6.00 15.25 10.54 12.74 4.75 8.34 - 8.00 5.01
3.37 3.97 2.34 6.00 15.19 10.20 13.33 4.75 8.38 - 7.98 6.67
3.37 3.97 2.34 6.00 15.22 10.20 16.79 4.75 8.43 - 7.93 6.67
3.37 3.97 2.34 6.00 15.68 10.20 15.92 7.13 8.35 - 7.90 6.67
Overlapping Taxes

South Lyon Community Schools
83
Principal Property Taxpayers
Year Ended June 30, 2014
(Unaudited)
Taxpayer
2014 Taxable
Value
Percentage
of Total Taxpayer
2005 Taxable
Value
Percentage
of Total
Detroit Edison 30,092,940$ 1.67 Colonial Acres 31,331,590$ 1.86
Consumers Energy 19,285,570 1.07 Detroit Edison 18,913,921 1.12
Rushton-Green Oak Land Co. 12,652,295 0.70 Consumers Energy 14,089,478 0.84
Henrob Corporation 8,964,680 0.50 Rushton-Green Oak Land Co. 11,437,623 0.68
Northville Crossing Venture 6,948,290 0.38 Walmart 8,922,080 0.53
Abbey Park at Mill River 6,841,130 0.38 Legacy Park - Singh LLC 8,693,080 0.52
Meijer 6,015,600 0.33 PM First Management 8,378,240 0.50
International Transmission 5,645,690 0.31 Cummins Bridgeway 7,306,760 0.43
Walmart 5,577,750 0.31 Alliant Food Service 6,395,670 0.38
USF Propco I, LLC 5,555,940 0.31 Northville Crossing Venture 5,663,582 0.34
Total 107,579,885$ 5.95 121,132,024$ 7.19
Total School District
taxable value 1,806,876,140$ 1,684,808,826$
Source: Cities of Novi, Wixom, and South Lyon and Townships of Green Oak, Lyon, Milford, Northfield, and Salem

South Lyon Community Schools
84
Property Tax Levies and Collections
Last Ten Fiscal Years
(Unaudited)
Tax Year
Year Ended
June 30 Total Levy
Current
Collections
Percent
Collected
Delinquent
Collections
Total Tax
Collections
Percent of
Levy
Collected
2005 2006 23,295,376$ 22,297,891$ 95.72 934,868$ 23,232,759$ 99.73
2006 2007 25,060,930 23,569,922 94.05 1,339,080 24,909,002 99.39
2007 2008 26,833,505 24,837,642 92.56 1,981,494 26,819,136 99.95
2008 2009 26,261,431 24,393,653 92.89 1,813,711 26,207,364 99.79
2009 2010 25,991,357 23,312,256 89.69 2,401,917 25,714,173 98.93
2010 2011 27,010,428 24,537,792 90.85 2,400,592 26,938,384 99.73
2011 2012 26,165,477 24,593,557 93.99 1,419,380 26,012,937 99.42
2012 2013 25,785,386 24,635,953 95.54 1,080,120 25,716,073 99.73
2013 2014 25,867,262 24,901,658 96.27 840,105 25,741,763 99.51
2014 2015 25,553,594 24,750,980 96.86 706,598 25,457,578 99.62
Source: South Lyon Community School District financial reports

South Lyon Community Schools
85
2006 2007 2008 2009
Governmental Activities
General obligation bonds 217,841,735$ 208,906,770$ 202,062,380$ 194,747,990$
Less pledged debt service funds 2,952,032 2,421,070 2,531,792 2,665,718
Net general bonded debt 214,889,703 206,485,700 199,530,588 192,082,272
Installment purchase agreements 599,996 1,252,774 923,019 770,594
Capital leases 650,160 534,060 412,155 281,542
Total debt of the School District 216,139,859$ 208,272,534$ 200,865,762$ 193,134,408$
Taxable Value 1,684,808,826$ 1,812,848,754$ 1,934,214,536$ 1,956,327,421$
Net General Bonded Obligation Debt as a
Percentage of Taxable Value 13% 12% 10% 10%
Total Population 37,137 37,188 37,019 40,520
Total Debt per Capita 5,820$ 5,601$ 5,426$ 4,766$
Source: South Lyon Community Schools audited financial statements, municipalities and SEMCOG.
Note: If personal income is unavailable, it is acceptable to use taxable value

86
Ratios of Bonded Debt Outstanding
Last Ten Fiscal Years
(Unaudited)
2010 2011 2012 2013 2014 2015
186,738,600$ 177,631,154$ 167,568,431$ 164,067,072$ 152,588,605$ 140,675,138$
1,666,940 1,674,789 921,586 64,633 1,008,097 1,252,436
185,071,660 175,956,365 166,646,845 164,002,439 151,580,508 139,422,702
963,388 653,987 330,464 705,577 977,269 1,244,228
145,125 - - - - -
186,180,173$ 176,610,352$ 166,977,309$ 164,708,016$ 152,557,777$ 140,666,930$
1,891,389,877$ 1,710,914,103$ 1,660,022,452$ 1,662,784,156$ 1,711,440,797$ 1,806,876,140$
10% 10% 10% 10% 9% 8%
41,912 42,280 43,051 45,328 46,386 47,036
4,442$ 4,177$ 3,879$ 3,634$ 3,289$ 2,991$

South Lyon Community Schools
87
General Obligation Bonds Outstanding
Last Ten Fiscal Years
(Unaudited)
Fiscal
Year
General
Obligation
Bonds
Less Pledged
Debt Service
Funds
Net General
Bonded Debt
Other
General
Obligation
Debt
Total
General
Obligation
Debt
Taxable
Value
Net General
Bonded Debt
as a
Percentage
of Taxable
Value
Total Debt
as a
Percentage
of Taxable
Value Population
Net
General
Bonded
Debt per
Capita
Total
Debt per
Capita
2006 217,841,735$ 2,952,032$ 214,889,703$ 1,250,156$ 216,139,859$ 1,684,808,826$ 12.75 12.83 40,423 5,316$ 5,347$
2007 208,906,770 2,421,070 206,485,700 1,786,834 208,272,534 1,812,848,754 11.39 11.49 40,769 5,065 5,109
2008 202,062,380 2,531,792 199,530,588 1,335,074 200,865,662 1,934,214,536 10.32 10.38 40,615 4,913 4,946
2009 194,747,990 2,665,718 192,082,272 1,052,136 193,134,408 1,956,327,421 9.82 9.87 40,520 4,740 4,766
2010 186,738,600 1,666,940 185,071,660 1,108,513 186,180,173 1,891,389,877 9.78 9.84 41,912 4,416 4,442
2011 177,631,154 1,674,789 175,956,365 653,987 176,610,352 1,710,914,103 10.28 10.32 42,280 4,162 4,177
2012 167,568,431 921,586 166,646,845 330,464 166,977,309 1,660,022,452 10.04 10.06 43,051 3,871 3,879
2013 164,067,072 64,633 164,002,439 705,577 164,708,016 1,662,784,156 9.86 9.91 45,328 3,618 3,634
2014 152,588,605 1,008,097 151,580,508 977,269 152,557,777 1,711,440,797 8.86 8.91 46,386 3,268 3,289
2015 140,675,138 1,252,436 139,422,702 1,244,228 140,666,930 1,806,876,140 7.72 7.79 47,036 2,964 2,991
* Taxable value has been used as an estimate of personal income.
Source: South Lyon Community School District financial reports and municipalities

South Lyon Community Schools
88
Direct and Overlapping Governmental Activities Debt
June 30, 2014
(Unaudited)
Governmental Unit
Debt
Outstanding
Estimated
Percent
Applicable*
Estimated
Share of
Overlapping
Debt
Novi, City of 23,845,000$ 1.67% 398,212$
South Lyon, City of 3,175,000 100.00% 3,175,000
Wixom, City of 11,388,000 5.80% 660,504
Green Oak Township 42,875,000 34.58% 14,826,175
Lyon Township 40,620,000 96.44% 39,173,928
Milford Township 12,570,000 3.70% 465,090
Northfield Township 4,900,000 20.77% 1,017,730
Salem Township 560,000 59.28% 331,968
Livingston County 26,234,500 3.81% 999,534
Oakland County 426,371,226 2.47% 10,531,369
Washtenaw County 41,732,608 1.87% 780,400
Oakland ISD 54,540,000 3.61% 1,968,894
Oakland Community College 2,355,000 3.63% 85,487
Salem-South Lyon District Library 200,000 80.71% 161,420
Total overlapping debt 74,575,711
Direct School District debt 140,666,930
Total direct and
overlapping debt 215,242,641$
Source: Municipal Advisory Council of Michigan
* Based on portion of taxable value within the School District boundaries

South Lyon Community Schools
89
2006 2007 2008 2009
Calculation of Debt Limit
Taxable value 1,684,808,826$ 1,812,848,754$ 1,934,214,536$ 1,956,327,421$
15% of taxable value 252,721,324 271,927,313 290,132,180 293,449,113
Calculation of Debt Subject to Limit
Total debt 214,290,000 211,795,000 204,805,000 197,345,000
Less debt not subject to limit -
State qualified debt issuance 177,020,000 110,220,000 103,085,000 96,825,000
Net Debt Subject to Limit 37,270,000 101,575,000 101,720,000 100,520,000
Legal Debt Margin 215,451,324$ 170,352,313$ 188,412,180$ 192,929,113$
Net Debt Subject to Limit as a
Percentage of Debt Limit 14.75% 37.35% 35.06% 34.25%
Source: South Lyon Community Schools audited financial statements

90
Legal Debt Margin
Last Ten Fiscal Years
(Unaudited)
2010 2011 2012 2013 2014 2015
1,891,389,877$ 1,710,914,103$ 1,660,022,452$ 1,662,784,156$ 1,711,440,797$ 1,806,876,140$
283,708,482 256,637,115 249,003,368 249,417,623 256,716,120 271,031,421
189,190,000 180,055,000 169,805,000 164,067,072 152,588,605 140,675,138
90,220,000 79,160,000 78,075,000 74,187,072 64,788,605 57,250,138
98,970,000 100,895,000 91,730,000 89,880,000 87,800,000 83,425,000
184,738,482$ 155,742,115$ 157,273,368$ 159,537,623$ 168,916,120$ 187,606,421$
34.88% 39.31% 36.84% 36.04% 34.20% 30.78%

South Lyon Community Schools
91
Demographic and Economic Statistics
Last Ten Fiscal Years
(Unaudited)
Fiscal
Year Population
Total
Personal
Income*
Per Capita
Personal
Income
County of
Oakland
Unemployment
Rate
State of
Michigan
Unemployment
Rate
2006 40,423 1,684,808,826$ 41,679$ 5.60 6.50
2007 40,769 1,812,848,754 44,466 6.70 7.40
2008 40,615 1,934,214,536 47,623 8.00 8.50
2009 40,520 1,956,327,421 48,281 15.50 15.20
2010 41,912 1,891,389,877 45,128 12.40 13.20
2011 42,280 1,710,914,103 40,466 10.90 10.50
2012 43,051 1,660,022,452 38,559 8.80 8.60
2013 45,328 1,662,784,156 36,684 9.00 9.40
2014 46,386 1,711,440,797 36,896 8.10 7.50
2015 47,036 1,806,876,140 38,415 5.40 5.80
* Taxable value has been used as an estimate of personal income.
Source: Southeast Michigan Council of Governments (SEMCOG)

South Lyon Community Schools
92
Principal Employers
(Unaudited)
Taxpayer
2014
Employees
Percentage
of Total
Employment Taxpayer
2005
Employees
Percentage
of Total
Employment
1 South Lyon Community Schools 669 0.65 South Lyon Community Schools 655 0.44
2 Meijer 350 0.34 Quanex Corp. 400 0.27
3 Walmart 291 0.28 Diversitec 285 0.19
4 Lowes 168 0.16 Michigan Seamless Tube 160 0.11
5 Michigan Seamless Tube 138 0.13 Salem Engelhard 140 0.09
6 Elopak-Americas, Inc 127 0.12 American Aggregate Corp. 120 0.08
7 Kawasaki Robotics USA 118 0.11 Walmart 110 0.07
8 Datapak Services Corporation 91 0.09 Kroger 110 0.07
9 Hines Park Ford 88 0.09 Farmer Jack 100 0.07
10 Sun Steel Treating Inc. 79 0.08 Tepco, Inc. 55 0.04
Total principal employers 2,119 2.06 2,135 1.42
Total employment* 102,896 149,915
Source: Oakland County Department of Planning and Economic Development
* Based on top 20 employers of Oakland and Washtenaw Counties

South Lyon Community Schools
93
Full-time Equivalent School District Employees
Last Ten Fiscal Years
(Unaudited)
Function/Program 2006 2007 2008 2009 2010 2011 2012 2013 2014 2015
General government:
Instruction 380 380 377 374 368 365 362 385 401 413
Support services 250 253 253 255 234 208 209 211 205 207
Community service 44 44 44 42 39 37 37 37 39 42
Athletics 2 2 3 3 4 3 3 3 3 3
Food service 25 27 26 25 24 22 22 22 22 22
Total 701 706 703 699 669 635 633 658 670 687
Source: South Lyon Community School District Personnel Department

South Lyon Community Schools
94
Operating Indicators
Last Ten Fiscal Years
(Unaudited)
Year Enrollment
Operating
Expenditures
Cost
per Pupil
Operating
Revenue
Revenue
per Pupil
Total
Teaching
Staff
Percentage
of Students
Qualifying
for Free/
Reduced
Meals
Average
Teacher
Salary
2006 6,901 52,318,894$ 7,581$ 53,445,655$ 7,745$ 380 11.3 53,053$
2007 6,973 53,476,068 7,669 56,336,958 8,079 380 13.0 54,406
2008 7,063 56,936,448 8,061 57,898,313 8,197 382 15.0 56,267
2009 7,068 57,783,843 8,175 58,467,530 8,272 380 18.0 57,481
2010 7,058 57,925,581 8,207 57,820,996 8,192 368 20.0 59,898
2011 7,065 55,539,630 7,862 59,642,929 8,442 365 21.0 60,474
2012 7,076 57,409,390 8,113 57,916,349 8,185 362 17.6 61,425
2013 7,342 60,650,121 8,261 61,171,357 8,332 385 18.9 61,813
2014 7,440 64,484,688 8,668 64,204,980 8,630 401 17.0 60,320
2015 7,663 65,266,848 8,517 69,029,967 9,009 413 17.1 60,209
Source: South Lyon Community School District financial records, State of Michigan financial records

South Lyon Community Schools
95
Function/Program 2006 2007 2008 2009
Instructional buildings:
Elementary:
Number of buildings 7 7 7 7
Square footage 475,128 475,128 475,128 475,128
Capacity 3,825 3,825 3,825 3,825
Enrollment 3,241 3,251 3,301 3,180
Middle:
Number of buildings 2 2 2 2
Square footage 342,146 342,146 342,146 342,146
Capacity 2,150 2,150 2,150 2,150
Enrollment 1,563 1,624 1,664 1,709
High:
Number of buildings 1 1 2 2
Square footage 401,734 401,734 716,734 716,734
Capacity 2,100 2,100 3,300 3,300
Enrollment 2,116 2,131 2,133 2,180
Administrative:
Number of buildings 2 2 2 2
Square footage 26,749 26,749 47,625 47,625
Vacant building - - 1 1
Square footage - - 14,480 14,480
Transportation:
Number of garages 1 1 1 1
Buses 67 67 65 64
Athletics:
Football fields 2 2 2 2
Soccer fields 8 8 8 8
Running tracks 2 2 2 2
Baseball/Softball 10 10 10 10
Swimming pools 1 1 1 1
Playgrounds 7 7 7 7
Source: South Lyon Community Schools construction records and audited student count information

96
Capital Asset Information
Last Ten Fiscal Years
(Unaudited)
2010 2011 2012 2013 2014 2015
7 7 7 7 7 7
475,128 475,128 475,128 475,128 475,128 475,128
3,825 3,825 3,825 3,825 3,825 3,825
3,281 3,242 3,235 3,397 3,524 3,712
2 2 2 2 2 2
342,146 342,146 342,146 342,146 342,146 342,146
2,150 2,150 2,150 2,150 2,150 2,150
1,685 1,691 1,677 1,733 1,749 1,782
2 2 2 2 2 2
716,734 716,734 716,734 716,734 716,734 716,734
3,300 3,300 3,300 3,300 3,300 3,300
2,091 2,132 2,164 2,212 2,167 2,169
2 2 2 2 2 2
47,625 47,625 47,625 47,625 47,625 47,625
1 1 1 1 1 -
14,480 14,480 14,480 14,480 14,480 -
1 1 1 1 1 1
64 64 58 55 57 -
2 2 2 2 2 2
8 8 8 8 8 8
2 2 2 2 2 2
10 10 10 10 10 10
1 1 1 1 1 1
7 7 7 7 7 7