South Deep Gold Mine. Overview Newshelf 899 (Proprietary) Limited (Newshelf), a 90% subsidiary of...
21
South Deep Gold Mine Technical Short Form Report 31 December 2012
Transcript of South Deep Gold Mine. Overview Newshelf 899 (Proprietary) Limited (Newshelf), a 90% subsidiary of...

South Deep Gold MineTechnical Short Form Report31 December 2012

1. OverviewNewshelf 899 (Proprietary) Limited (Newshelf), a 90% subsidiary
of Gold Fields Limited, holds a 100% interest in the South Deep
Gold Mine. The remaining 10% is held by external shareholders
as part of the broad-based black economic empowerment
(BBBEE) transaction, completed in December 2010.
The mine, situated 45 kilometres southwest of Johannesburg,
is an intermediate to deep-level gold mine comprising two shaft
systems – the older South Shaft complex with its main shaft and
two sub-vertical shafts, and the newer complex known as Twin
Shafts. Ore is processed at a central metallurgical plant. The
mining right area comprises 4,268 hectares.
Capital infrastructure programmes (Twins and Vent Shaft) remain
on track and continue to support the planned production
build-up. The deepening project, under way at the Ventilation
Shaft, hoisted the first rock in mid-October and the shaft, the new
headgear and surface conveyors were commissioned as planned
by the end of Q4 2012.
The mine’s underground infrastructure of truck tips and ore
passes, crushers, conveyors and shaft silos will be constructed
and commissioned in phases during the production build-up
period. The gold plant expansion was commissioned a month
ahead of schedule in November and three years ahead of the full
production processing requirement.
The geometry of the Upper Elsburg Reef package, which is the
primary economic target, lends it to a fully mechanised mining
method. The Ventersdorp Contact Reef to the west of the Upper
Elsburg subcrop is the secondary economic target. Plans are in
place for South Deep to mine 300 to 330 kt ore per month by the
end of 2015. Current estimates indicate that the mine will be able
to maintain this profile until 2047, with the end of life expected to
be in 2092.
This Technical Short Form Report reflects the latest LoM plan
input parameters, coupled with an updated Mineral Resource
and Mineral Reserve statement, as at 31 December 2012.
All Mineral Resource and Mineral Reserve figures reported are
managed, unless otherwise stated, and Mineral Resources
are inclusive of Mineral Reserves.
SSaSaSalilililil eenenee t tt fefefeatatatururreseses
���� Managed MiMMM neeraral l ReResososoururrceecees s ss atatatat 77 7 99.9.3 3 33 MoMoMoMoMooooz.z.z.z.zz
��� Managed ddd Miineneneneraar l l Reeseseeeervrvrveseseses aaaaatt t 393939939999.11.1.11.1 MM MMMMM Moozozozozozozoo ..
��� Capital infrasastrtrucuctut ree p ppprorororojejeectctcttttts ss ss oononononoononon ttrararaaaackckkckckckcckc ttttt tt o oo ooooo
support prrododucctionn b buiuildddd-u-uu-up.ppp.p.
���� Ventilattioion Shafffaft t has beeenenenenee d d ddddddeeeeeeeeeeeeeeeepepepeppepeepep neneneeneneeneed,d,,d,d,dd,d
equiippppppppped aandndnddddnd comommisssssssioioioi neneneeneneeneedd d dddd ahahahahaahahheaeeaeaeae d ddd d dd ofofofofofofofoff
scsccchehehhedudd lee.
������ FoFocucccus s reemains s ononon d dddevevvveveveleleeeee opopopppoppopoopinininininninng gg g g thtthtthththhtthe ee e SoSSSooutututh h DeDeDeDeepepepp
GoGoGG ldd MMinne e too aachchchchieieieieeveveveveevv s sssssssttetetetetetettet aadadadadaaa y-y-yy-y-y-yyy-y-y ststsstsssts atatatttate eee e susus ststaiaiainananaablblble ee
pprproducctititititit oooonoo bbbbyy y y y y y enenenennddd d ddd 20202202020202 1515555555....
����� ThThThThThe eee cucucucc rrrrrrrrrrreenent t LLLiLiLLLifefefefeeeee o oof f MiMiMiMiMiMiMiMiM nenenenenenen ( (LoLoLoLoM)M)M)M)M i iiis s ss esesesttittititttimamamamaamammm teted dd tototototo
exexexexexxexteteteteteteeeendndndndndndndnddnndd t t tt t tto oo oooo 2020202020202200999292929292292 ((( 808080808080080 yyyy y yeaeaeeaeaee rsss).).).
Geographic locationSouth Deep locality plan with mining right magnified
1Gold Fields – South Deep Gold Mine – Technical Short Form Report 2012 �
Page head
Geographic location IFC
1. Overview IFC
2. Asset fundamentals Page 2
3. Operating statistics Page 3
4. Geological setting and mineralisation Page 4
5. Mining Page 7
6. Projects Page 8
7. Mineral processing Page 9
8. Sustainable development Page 9
9. Mineral Resources and Mineral
Reserves Page 10
10. Competent Persons Page 13
11. Key technical staff Page 14
12. Brief history Page 17
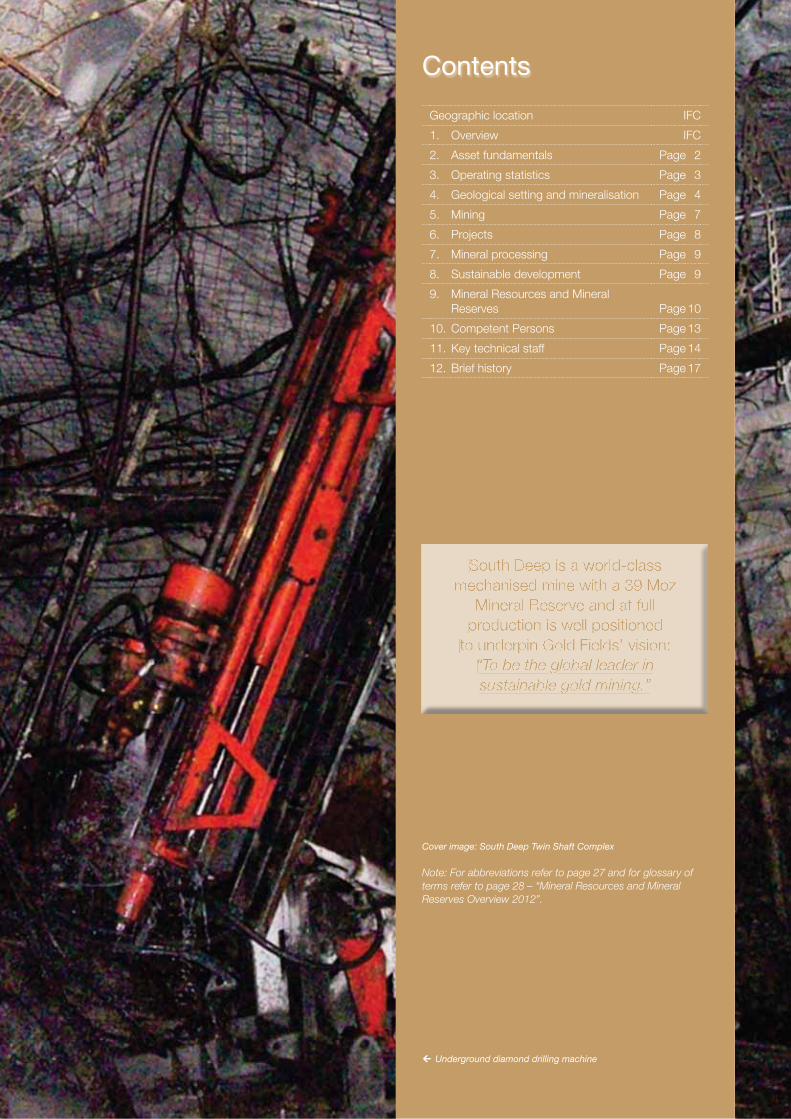
Cover image: South Deep Twin Shaft Complex
Note: For abbreviations refer to page 27 and for glossary of
terms refer to page 28 – “Mineral Resources and Mineral
Reserves Overview 2012”.
��Underground diamond drilling machine
Contents
mechanised mine with a 39 Moz
South Deep is a world-classSouth Deep is a world-class
mmechanised mine with a 39 Moz mechanised mine with a 39 Moz
Mineral Reserve and at full Mineral Reserve and at full
production is well positionedproduction is well positionedproduction is well positioned
to underpin Gold Fields’ vision: to underpin Gold Fields’ vision:
“To be the lobal leader in“To be the global leader in“To be the global leader in
sustainable gold mining.”sustainable gold mining.”

2 � Gold Fields – South Deep Gold Mine – Technical Short Form Report 2012
2. Asset fundamentals
Prepared by Gold Fields Limited in compliance with the South African Code for the Reporting of Exploration Results, Mineral Resources and Mineral Reserves (2007 SAMREC Code)
Effective date 31 December 2012
Source of information This Technical Statement is a summary of the December 2012 South Deep Competent Persons Report (CPR)
Personal inspection Personal inspection is conducted by the Competent Persons as listed, who are full-time
employees of Gold Fields Limited
Independent review Information reported in this declaration is as reviewed by internal consultants as at 31 December 2012. South Deep has been informed that the review identified no material shortcomings in any process by which the Mineral Resources and Mineral Reserves were evaluated
General location South Deep Gold Mine is situated in the magisterial districts of Westonaria and Vanderbijlpark (Gauteng province), some 45 kilometres south-west of Johannesburg at latitude 26º 25’ south and longitude 27º 40’ east. It is accessed via the N12 provincial road between Johannesburg and Potchefstroom
Climate No extreme climate conditions are experienced that may affect mining operations
Licence status and holdings
The conversion of the old order mining right to a new order mining right, as required in terms of the Minerals and Petroleum Resources Development Act, No 28, 2002 (the MPRD Act), was approved in July 2010. The aerial extent of the South Deep lease area is 4,268 hectares. All required authorisation has been obtained and is in good standing
Operational infrastructure South Deep Gold Mine operates one gold plant and is accessed from the surface through two shaft systems – the Twin Shaft Complex, of which the main shaft comprises a single-drop to a depth of 2,995 metres, and the South Shaft Complex. The mine has been subdivided into four main areas. “Old Mine” comprises the area above 90 Level, and is serviced primarily from the South Shaft Complex. “Current Mine”, which is serviced primarily from Twin Shaft, extends from 90 Level to 95 Level. Phase 1 extends below 95 Level to 110 Level at a depth of 3,075 metres below surface. Phase 2 below 110 Level, and will extend to a depth of 3,500 metres
Deposit type Intermediate to deep-level gold mine (>2,000 m below surface) exploiting auriferous palaeoplacers (reefs), namely the conglomerates that comprise the Upper Elsburg Reefs of the Mondeor Formation and the Ventersdorp Contact Reef (VCR) of the Venterspost Formation
Life of Mine (LoM) It is estimated that the current Mineral Reserves will be depleted in 2092 (80 years)
Environmental/Health and Safety
South Deep obtained its ISO 14001:2004 certification in September 2008 and has maintained this certification since that time. In 2011 this certification was renewed as part of a South African regional ISO 14001 certification. In 2012 a surveillance audit was conducted and the certification was retained. Policies, systems and procedures implemented by the mine conform to this international standard. Reporting on environmental issues and sustainable development is done according to the Global Reporting Initiative (GRI) requirements. The mine obtained full compliance with the International Cyanide Management Code (ICMC) in December 2008 and this certificate was renewed in December 2011. In December 2011 the mine also obtained its water use licence
Reporting codes Gold Fields reports its Mineral Resources and Mineral Reserves in accordance with the 2007 SAMREC Code, the South African Codes for the Reporting of Mineral Asset Valuation (2009 SAMVAL Code) and other relevant international codes such as the United States Securities and Exchange Commission (SEC) Industry Guide 7, the Joint Ore Reserves Committee (JORC 2012) Code and the National Instrument (NI) 43-101. The Mineral Resources and Mineral Reserves are underpinned by an appropriate Mineral Resource management process and protocol to ensure adequate corporate governance in respect of the Sarbanes-Oxley Act
Underground operations – dump track and transport vehicle Mechanised roof – bolting and wire meshing
3Gold Fields – South Deep Gold Mine – Technical Short Form Report 2012 �
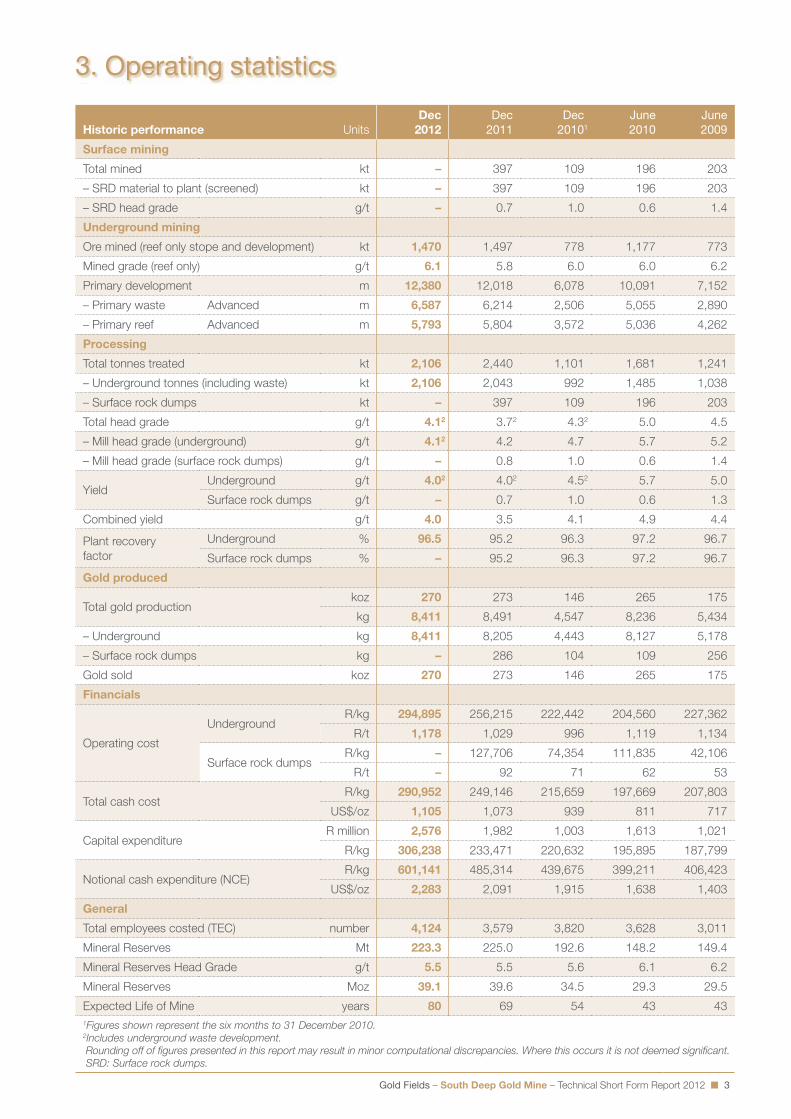
3. Operating statistics
Historic performance Units
Dec
2012
Dec2011
Dec20101
June2010
June2009
Surface mining
Total mined kt – 397 109 196 203
– SRD material to plant (screened) kt – 397 109 196 203
– SRD head grade g/t – 0.7 1.0 0.6 1.4
Underground mining
Ore mined (reef only stope and development) kt 1,470 1,497 778 1,177 773
Mined grade (reef only) g/t 6.1 5.8 6.0 6.0 6.2
Primary development m 12,380 12,018 6,078 10,091 7,152
– Primary waste Advanced m 6,587 6,214 2,506 5,055 2,890
– Primary reef Advanced m 5,793 5,804 3,572 5,036 4,262
Processing
Total tonnes treated kt 2,106 2,440 1,101 1,681 1,241
– Underground tonnes (including waste) kt 2,106 2,043 992 1,485 1,038
– Surface rock dumps kt – 397 109 196 203
Total head grade g/t 4.12 3.72 4.32 5.0 4.5
– Mill head grade (underground) g/t 4.12 4.2 4.7 5.7 5.2
– Mill head grade (surface rock dumps) g/t – 0.8 1.0 0.6 1.4
YieldUnderground g/t 4.02 4.02 4.52 5.7 5.0
Surface rock dumps g/t – 0.7 1.0 0.6 1.3
Combined yield g/t 4.0 3.5 4.1 4.9 4.4
Plant recovery
factor
Underground % 96.5 95.2 96.3 97.2 96.7
Surface rock dumps % – 95.2 96.3 97.2 96.7
Gold produced
Total gold productionkoz 270 273 146 265 175
kg 8,411 8,491 4,547 8,236 5,434
– Underground kg 8,411 8,205 4,443 8,127 5,178
– Surface rock dumps kg – 286 104 109 256
Gold sold koz 270 273 146 265 175
Financials
Operating cost
UndergroundR/kg 294,895 256,215 222,442 204,560 227,362
R/t 1,178 1,029 996 1,119 1,134
Surface rock dumpsR/kg – 127,706 74,354 111,835 42,106
R/t – 92 71 62 53
Total cash costR/kg 290,952 249,146 215,659 197,669 207,803
US$/oz 1,105 1,073 939 811 717
Capital expenditureR million 2,576 1,982 1,003 1,613 1,021
R/kg 306,238 233,471 220,632 195,895 187,799
Notional cash expenditure (NCE)R/kg 601,141 485,314 439,675 399,211 406,423
US$/oz 2,283 2,091 1,915 1,638 1,403
General
Total employees costed (TEC) number 4,124 3,579 3,820 3,628 3,011
Mineral Reserves Mt 223.3 225.0 192.6 148.2 149.4
Mineral Reserves Head Grade g/t 5.5 5.5 5.6 6.1 6.2
Mineral Reserves Moz 39.1 39.6 34.5 29.3 29.5
Expected Life of Mine years 80 69 54 43 43
1 Figures shown represent the six months to 31 December 2010.2 Includes underground waste development.
Rounding off of figures presented in this report may result in minor computational discrepancies. Where this occurs it is not deemed significant.
SRD: Surface rock dumps.

4 � Gold Fields – South Deep Gold Mine – Technical Short Form Report 2012
4. Geological setting and mineralisation
South Deep is located in the Far West Rand Goldfields,
situated on the north-western rim of the Witwatersrand
Basin. The Witwatersrand Basin comprises a 6,000 metre-
thick sequence called the Witwatersrand Supergroup, which
consists of predominantly detrital sedimentary rocks
interspersed sporadically with auriferous and uraniferous
quartz-pebble conglomerates (reefs), particularly evident in
the upper parts of the succession known as the Central
Group. All the major reef units are developed above
unconformity surfaces and the extent of the unconformities
are typically greatest near the basin margin and decreases
toward more distal areas. Complex patterns of syn-
depositional faulting have caused strong variations in
sediment thickness within the basin.
The reefs are widely considered to represent extensive fluvial
deposits into a yoked basin, some 350 kilometres long in an
east-northeasterly direction, and 200 kilometres wide in a
north-northwesterly direction. The gold is mainly of detrital
origin, deposited syngenetically with the conglomerates and
interrelated with sedimentary features such as unconformities
and fluvial channels. Deposition took place along the interface
between a fluvial system that brought the sediments and
heavy minerals from an elevated source area, and a lacustrine
littoral system that reworked the material and redistributed
the finer sediments along the shoreline of an intracratonic
lake or shallow water inland sea. Although the gold generally
occurs in native form and is usually associated with pyrite
and carbon, most of it has been subsequently modified and
locally remobilised during secondary hydrothermalism. This
has informed the use of the Modified Palaeoplacer Model,
which is the favoured depositional model currently in use.
The most fundamental control to the gold distribution remains
the association with quartz-pebble conglomerates on
intra-basinal unconformities. The reefs are continuous, as a
consequence of the regional nature of the erosional surfaces.
Bedrock (footwall) controls have been established, governing
the distribution of many of the reefs. Preferential reef
South Deep is situated in the geologically unique and renowned Witwatersrand Basin, which is the world’s premier gold region. The Upper Elsburgs, which subcrop with the VCR in a north-northeast trend, comprise multiple stacked conglomerates that form part of an easterly-divergent clastic wedge.
Schematic Witwatersrand Basin depositional model
Schematic section through the ore body showing zones targeted for mining
development within channel systems and sedimentary
features such as facies variations and channel frequency
assist in mapping out local gold distributions.
Local geologyThe South Deep mining right area is underlaid by outliers of
Karoo Supergroup shales and sandstones, followed by the
Pretoria Group sediments and the Chuniespoort Group
dolomites. The Chuniespoort Group overlies the
Klipriviersberg Group volcanic rocks, which in turn are
underlaid by the Central Rand Group that hosts the gold-
bearing conglomerates (reefs) exploited by South Deep. The
reef horizons that are currently exploited at South Deep
include the Ventersdorp Contact Reef (VCR) and the reef
horizons that comprise the Upper Elsburgs of the Mondeor
Formation. In the western half of the mining lease area the
VCR occurs as a single reef horizon that overlies footwall
lithologies of the Turffontein Subgroup. The Upper Elsburgs,
which subcrop with the VCR in a north-northeast trend,
comprise multiple stacked reef horizons that
form part of an easterly-divergent clastic
wedge as illustrated in the schematic section.
This wedge attains a thickness of
approximately 120 to 130 metres in the
vicinity of the eastern boundary of the mining
right area. The Upper Elsburg Reefs constitute
99% of the South Deep Mineral Reserve
ounces, while the VCR makes up the
remaining 1%.
The structure at South Deep is dominated by
the north-south trending primary fault
systems, which include the West Rand,
Panvlakte and Waterpan Faults. The West
Rand Fault is an activated thrust fault, which
is now represented as a normal fault with a
maximum throw of 2,200 metres down to the

5Gold Fields – South Deep Gold Mine – Technical Short Form Report 2012 �
The reefs themselves exhibit widely varying lateral facies
changes. The names of the reefs occurring within the
EC unit are, from bottom up:
�� the EC Basal Band (ECBA);
�� the EC Bottom Band (ECB);
�� the EC Middle Band (ECM); and
�� the EC Top Band (ECT).
The EC unit is separated from the overlying Upper Elsburg
Massives (Modderfontein Member) by a well-defined quartz
wacke known as the ED unit.
The Upper Elsburg Massive reefs (trackless mining target)
also consist of four conglomeratic packages with widely
varying lateral facies definitions. The reefs making up the
Upper Elsburg Massives, from bottom up, are:
�� the Modderfontein A Conglomerate (MAC);
�� the Modderfontein Intermediate Bottom Band (MIB);
�� the Modderfontein Intermediate Top Band (MIT); and
�� the Modderfontein B Bottom Band (MBB).
The Upper Elsburgs have an average dip of some 12° toward
the south-southeast, but this is affected by a low-amplitude,
high wavelength regional syncline that trends approximately
north-south through the centre of the mine. This feature is
more pronounced towards the south of the property.
SouthShaft
TwinShafts
mining rightboundary
Upper ElsburgClastic wedge
Central Rand Group
Pretoria Group
Malmani Dolomite
Booysens ShaleVentersdorp Lava Sub
Shafts
VentersdorpContact Reef (VCR)
Base of Upper Elsburgs
S/O
Malmani Dolomite
3D schematic illustration of the South Deep Gold mine
west at the northern extreme of the property. The West Rand
– Panvlakte horst block is situated between the Kloof Gold
Mine to the west and the South Deep Gold Mine to the east.
Different populations of dykes also network across the mine
lease. Some are orientated roughly north-south, are near
vertical and can attain a thickness of up to 30 metres. The
younger Pilansberg age dykes (Gemsbokfontein number
1 and 2) separate the overlying dolomites into different water
compartments.
VCRA facies model was introduced for the VCR in December
2007, aimed at more accurately evaluating this target and
thereby better supporting short-term planning. This model
identifies five distinct facies types, which tie in well with the
younger peneplain facies identified in the distal areas of Kloof,
namely the Sandy 1 (conglomerate dominated) and Sandy 2
(quartzite dominated) VCR facies.
For the purposes of South Deep, these facies were further
subdivided into single and multi-band types. These younger
Sandy 1 and 2 facies were introduced from a northwestern
source, with sediment transported along a northwest to
south-east palaeocurrent direction. Only the Sandy 1 facies
types are considered economically viable mining targets. At
this stage no VCR mining is being conducted at South Deep,
but it is planned at a later stage in the LoM, utilising low-
profile mechanised mining equipment.
Upper ElsburgsThe Upper Elsburg Reefs are made up of the
Upper Elsburg Individuals (Waterpan Member) and
the Upper Elsburg Massives (Modderfontein Member) as
indicated in the schematic section. The Upper Elsburg
Individuals – or EC/ED unit – consists of four well-defined
conglomeratic units, separated vertically from each other by
more poorly-developed conglomeratic zones and immature
quartz wackes.

6 � Gold Fields – South Deep Gold Mine – Technical Short Form Report 2012
Geological modellingGeological models are based on all available structural, grade
and sedimentological data. The structural data is used to
generate 3D models whilst the sedimentological, gold value
and channel width (CW) data is used to delineate the
geologically homogeneous local facies zones. The facies
zones are used to constrain the statistical and geostatistical
analyses that form the basis of the resource estimation
process. The geological models are updated on an on-going
basis as new data becomes available.
Datamine© is used to evaluate the geological models and
generate resource envelopes, taking cognisance of the
geological models and geozones. Cross-referencing of
the relevant plans and detailed checks ensure integrity
of the defined envelopes.
The resource blocks are zones of geological homogeneity
and take cognisance of geological structure; reef types or
facies; value trends; data quantity and distribution; kriging
results; infrastructure; mining and method; ventilation; and
rock engineering.
On-lease exploration and resource definition drillingSouth Deep maintains rigorous quality assurance and quality
control (QA/QC) protocols on all exploration programmes.
Data acquisition adheres to industry best practice, reputable
laboratories are employed and sign-off is carried out by
Competent Persons under the 2007 SAMREC Code.
An extensive exploration programme was initiated in 2007.
This programme, comprising seismic survey analysis and
a surface and underground exploration drilling programme,
is now providing the basis for the resource definition of the
VCR, and the evaluation of the Upper Elsburg Reefs in
the areas comprising Phase 1 and Phase 2 below 95 Level.
Underground drillingNine long-inclined boreholes (LIBs) have been drilled on a
300 metre spacing from 95 Level in Phase 1 North of Wrench
(NoW). The project was temporarily halted due to
deteriorating ground conditions at the drill site. Further infill
exploration drilling will continue from 100 Level in the near
future.
Conventional underground grid, prospect and infill grade
control drilling will continue in 2013 and will take place
mainly from 95 Level to evaluate the Upper Elsburg Reefs.
The mine has embarked on an aggressive underground
drilling programme since August 2009, to address the
historically low borehole data density in the Current Mine
area, which supports the geological and resource models.
A 30 metre x 30 metre grid is being targeted, comprising:
�� in-stope drilling using two track-mounted rigs;
�� drilling from footwall infrastructure ahead of current mining
operations.
Surface drillingThe surface drilling programme that targets the Upper
Elsburgs and VCR in the Phase 2 ground below 110 Level
started in July 2007. The programme is planned for
14 boreholes at an estimated cost of ~R210 million and is
scheduled for completion by December 2014. As borehole
results become available they are incorporated into the latest
geological modelling.
The South Deep 3D seismic survey provided high-quality
data and gives an excellent image of the VCR reflector and
disrupting structure (known structure incorporated into
seismic interpretation). The VCR surface derived from the
seismic data serves as a reference surface for the geological
modelling.
Surface exploration drilling rig
Exploration drilling and expenditure:
31 December 2012 31 December 2011
OperationMetresdrilled
ZAR(million)
US$(million)
Metres
drilled
ZAR
(million)
US$
(million)
South Deep 9,088 12.337 1.506 16,476 41.475 5.590
Average 2012 exchange rate: ZAR8.19:US$.
Rounding off of figures presented in this report may result in minor computational discrepancies. Where this occurs it is not deemed significant.

7Gold Fields – South Deep Gold Mine – Technical Short Form Report 2012 �
Capital expenditure for 2013 is estimated at R1.88 billion and
will focus on establishing infrastructure to underpin future
production and gold output. The infrastructure projects are
being undertaken to increase production to ~330 kt per
month by end 2015.
Mining methodsA variety of mining methods are applied to safely maximise
the extraction of the ore body. West of the sub-crop, only the
VCR will be mined. In the past the VCR was mined by
conventional mining methods, but in future mechanised
low-profile mining methods will be applied.
East of the sub-crop, the ore body gradually increases in
thickness, from about two metres at the sub-crop to
approximately 120 metres in thickness, 900 metres east of the
subcrop. Three different mining methods are applied in this
area. Initially, low-profile equipment is used to destress the
targeted area with 2.2 metre cuts that are mined horizontally
at 17 metre vertical intervals. The destress cut is mined to
reduce the in situ stress from approximately 80 Mpa to
between 30 and 40 Mpa. This allows for the mining of large
excavations in close proximity to each other, without the high
rock stress interaction that could lead to possible face bursts.
Once a targeted area is destressed it is extracted through
either drifting and benching (for targets up to 15 metres in
height), or long-hole stoping (for targets > 15 metre in height).
Rock engineering principles are applied to the design of
excavation dimensions, pillars, backfill and support. The rock
engineering design considerations which require specific
attention are listed with each mining method.
Model showing horizontal destress and longhole stoping viewed from below
Not to scale
Mine planning and schedulingMine design and scheduling at South Deep is done in Mine
2-4D© and Earthworks Project Scheduler (EPS) software, on
a Datamine© platform. All designs are based on three-
dimensional resource models.
The depth of the ore body dictates that mining of destress
horizons has to be scheduled such that sufficient Mineral
Reserves are made available for massive mining extraction.
Large mechanised targets are then sequentially scheduled for
extraction within the destress envelopes. Backfill scheduling
is also incorporated in the extraction sequence, both for the
destress and the massive mining.
All designs and schedules are completed in consultation with
production and technical personnel to ensure safe and
efficient layouts and plans. Production efficiencies are based
on past experience and production models that describe
activities for the different fleet combinations.
Due to the inability to split ore and waste mined, all waste
inclusive of in section waste and capital waste will be sent to
the processing plant. Although the impact on the head grade
is larger in the initial years, the impact on the LoM grade
is ~3%, taking the head grade from 5.45 g/t to 5.28 g/t.
Mineral Reserve development and destress stoping will
continue to be key performance indicators in 2013 and will
be accelerated further in the appropriate areas. The following
table details the development advanced and destress
production for the last 12 months to December 2012.
Development and destress mining results
Category Unit Upper Elsburg
Advanced m 12,380
On-reef m 5,793
Destress m2 43,356
Value of destressed
Mineral Reserves g/t 6.2
Production and hoisting capacities
ShaftHoisting capacity
(ktpm)Future capacity
(ktpm)
South 60 120
Twin – Main 160 175
Twin – Vent – 195
5. Mining
South Deep is a fully mechanised operation. The focus in the short term will be on expediting
development, accessing the ore body, completing the Twin Shaft infrastructure and
increasing the rate of mechanised destress mining.
Shaft zones

8 � Gold Fields – South Deep Gold Mine – Technical Short Form Report 2012
6. Projects
Several ongoing capital intensive projects at Twins and Vent Shaft remain on track to support
a steady state run rate of approximately 4.0 million tonnes per annum.
The following projects are critical to the build-up to full
production:
Ventilation shaft deepening: The first skip was hoisted out
of the shaft bottom in mid-October, an important milestone in
the history of South Deep. The headgear steelwork
installation has been completed and outstanding priority
items are being addressed and will be completed by the end
of Q1 2013. Construction is complete on the surface
conveyor system that takes the hoisted ore from the
Ventilation Shaft headgear discharge bin to the surface
storage silo. The final leg of the conveyor system, which
by-passes the surface storage silo and transports rock onto
the extended plant stockpile, was lifted and placed into
position in December 2012 as planned.
Metallurgical: The new ball mill was put into use and the
recycle crusher circuit is fully commissioned and operational.
The new linear screen and thickener area are operational and
all other areas of the plant expansion are complete. This
includes the elution column, reagent, eluate, smelthouse and
leach areas.
Ore conveying ramp installed from Twin Vent Shaft
More than half the plant has been successfully converted to
the new Planexion process control system. Upgrades to the
carbon regeneration and electro-winning circuits will only
commence in 2013, while the substantial civil work for the
plant stockpile is planned for completion by February 2013.
New mine development: This project will develop the mine
on 100, 105 and 110 Levels to ensure access and the
provision of ore transport and ventilation services to the
working areas north and south of the Wrench Fault. Good
progress was made on this project which saw a 14%
improvement year-on-year.
Ventilation and refrigeration: This project will comprise
five refrigeration plants on 94 Level, with a total capacity of
42.5 MW, to provide cool air to the current workings and the
new mine development. The new 9 MW Bulk Air Cooling
(BAC) facility on surface at South Shaft was commissioned
and is now operational. Construction of a surface ice plant at
Twin Shafts, which will enhance the mine’s cooling facilities,
will begin during 2015. Additional surface fans were started
up during the year and all return airways will be completed by
the end of 2013.
The second condenser spray chamber was completed in
Q4 2012, and installation of the fourth refrigeration unit is
scheduled for 2013 and will be operational by Q4 2013.
New bulk air cooling facility
Shaft bottom infrastructure: A two-vertical silo facility will
be established between each production level (6 metres
diameter) for surge capacity. These will be completed in two
phases. Silos 3 and 5 which feed the new Ventilation Shaft will
be completed by September 2013 as part of Phase 1, while
Phase 2 will see the completion of Silos 1, 2 and 4. In addition
two settler dams with pumping facilities will be required.
Backfill: The mine will continue to make use of the
existing cyclone classified tailings (CCT) backfill specifically for
destress stopes, with current volumes at 35,000 dry m³
which is approximately 85% of the installed plant capacity.
The CCT infrastructure is currently being refurbished to
ensure capacity is maintained for the backfill requirements of
mining activities at South Shaft above 90 Level, and to allow
for CCT to be placed in the destress mining project. The
second phase of the integrated system has been completed.
It comprises:
�� the surface full plant tailings (FPT) plant mainly for backfill
of general mining voids; and
�� commissioning of the second four shaft pipes, an
additional four pipes on 90 Level and four in-stope pipes into
the 95-1-West project towards the long hole stope 13C.
Initial commissioning testing (scale only) of the 50 Level
pressure break system was completed without any major
complications. The FPT shaft and underground piping system
will be expanded throughout the 95-1W, 2W and 3W projects
over the next two years.
South Shaft: The hoisting capacity at this shaft has been
reduced to 60 ktpm. This allows for the refurbishment of the
pump columns and backfill pipes for the planned production.
Good progress has been made on the shaft repair work and
installation of the shaft pump column. The installation of the
second pump column is expected to be complete in 2103.
9Gold Fields – South Deep Gold Mine – Technical Short Form Report 2012 �
7. Mineral processing
The milling circuit includes a semi-autogenous grinding (SAG) mill for primary and secondary milling, which is conducted in two overflow ball mills. Classification is done using a cluster of cyclones. Four Knelson concentrators facilitate the recovery of free gold and the concentrate is tabled in the smelthouse using a Gemini Table. The cyclone overflow is thickened before the slurry reports to the leach circuit, which has 10 mechanically agitated tanks, each with a 3,000 cubic metres volume.
Cyanide is used for gold dissolution and lime is added to ensure protective alkalinity. An eight-stage, carousel-type carbon-in-pulp (CIP) circuit is used for gold adsorption. Each
tank in the train is 200 cubic metres. Carbon stripping is achieved using the AARL elution system, while carbon regeneration is carried out in a rotary kiln at a rate of 500 kg/hr.
Gold is recovered from the solution by using electro-winning Sludge Reactors, and then dried. This is followed by smelting in an induction furnace to produce gold bullion. Concentrates from the Gemini Table are calcined and smelted in the induction furnace. The gold bars are marked and dispatched to the Rand Refinery.
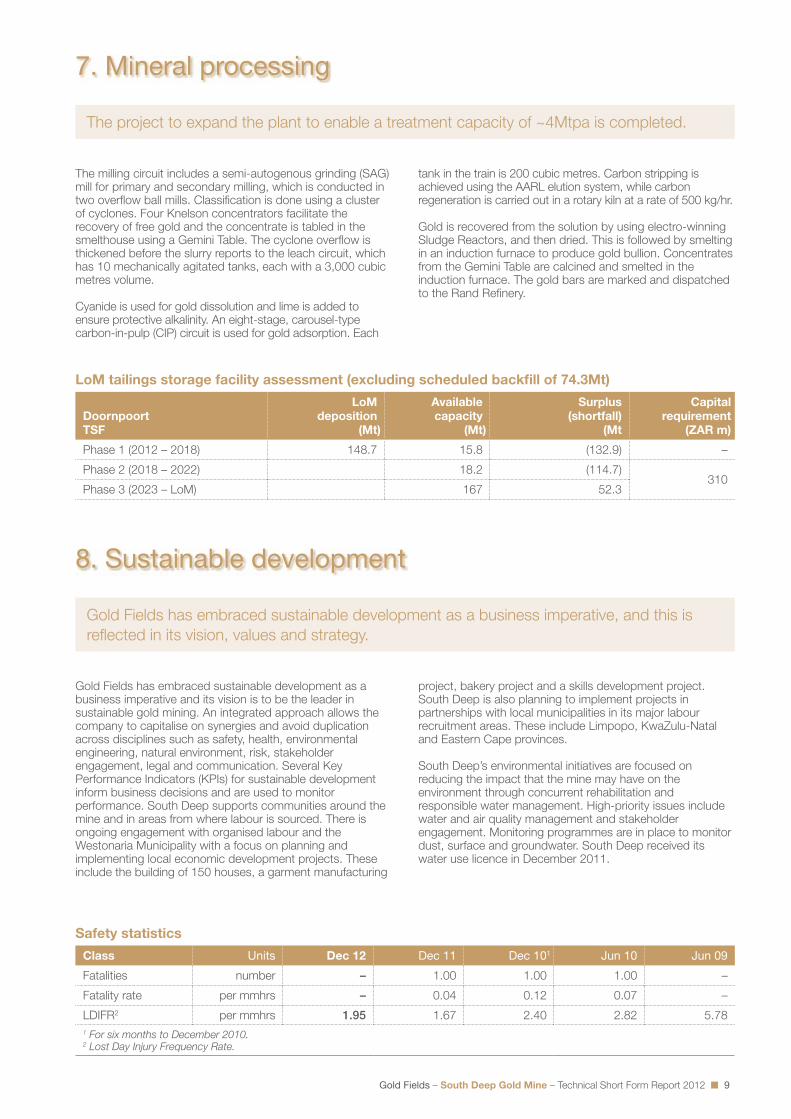
The project to expand the plant to enable a treatment capacity of ~4Mtpa is completed.
8. Sustainable development
Gold Fields has embraced sustainable development as a business imperative and its vision is to be the leader in sustainable gold mining. An integrated approach allows the company to capitalise on synergies and avoid duplication across disciplines such as safety, health, environmental engineering, natural environment, risk, stakeholder engagement, legal and communication. Several Key Performance Indicators (KPIs) for sustainable development inform business decisions and are used to monitor performance. South Deep supports communities around the mine and in areas from where labour is sourced. There is ongoing engagement with organised labour and the Westonaria Municipality with a focus on planning and implementing local economic development projects. These include the building of 150 houses, a garment manufacturing
project, bakery project and a skills development project. South Deep is also planning to implement projects in partnerships with local municipalities in its major labour recruitment areas. These include Limpopo, KwaZulu-Natal and Eastern Cape provinces.
South Deep’s environmental initiatives are focused on reducing the impact that the mine may have on the environment through concurrent rehabilitation and responsible water management. High-priority issues include water and air quality management and stakeholder engagement. Monitoring programmes are in place to monitor dust, surface and groundwater. South Deep received its water use licence in December 2011.
Safety statistics
Class Units Dec 12 Dec 11 Dec 101 Jun 10 Jun 09
Fatalities number – 1.00 1.00 1.00 –
Fatality rate per mmhrs – 0.04 0.12 0.07 –
LDIFR2 per mmhrs 1.95 1.67 2.40 2.82 5.78
1 For six months to December 2010.2 Lost Day Injury Frequency Rate.
LoM tailings storage facility assessment (excluding scheduled backfill of 74.3Mt)
Doornpoort
TSF
LoM
deposition
(Mt)
Available
capacity
(Mt)
Surplus
(shortfall)
(Mt
Capital
requirement
(ZAR m)
Phase 1 (2012 – 2018) 148.7 15.8 (132.9) –
Phase 2 (2018 – 2022) 18.2 (114.7)310
Phase 3 (2023 – LoM) 167 52.3
Gold Fields has embraced sustainable development as a business imperative, and this is
reflected in its vision, values and strategy.

10 � Gold Fields – South Deep Gold Mine – Technical Short Form Report 2012
9. Mineral Resources and Mineral Reserves
The Mineral Resources are classified according to the South African Code for Reporting of Exploration Results, Mineral
Resources and Mineral Reserves (SAMREC Code 2007), as well as the Australasian Code for Reporting of Identified Mineral
Resources and Ore Reserves (JORC Code 2012). The classification is a function of the confidence in the full process from
drilling, sampling and geological understanding to geostatistical relationships. The final classification also takes into account the
QA/QC for drilling and sampling.
All Mineral Resources and Mineral Reserves are classified as being above infrastructure, in line with international practice where
reserves are accessed via ongoing ramps, for which the planned expenditure has been provided in the LoM.
The BBBEE transaction, concluded in December 2010, grants an empowerment consortium 10% of South Deep. Based on the
relevant sliding scale of the vesting of the economic benefit attached to the 10% and the current LoM profile, the Mineral
Resource and Mineral Reserve portion attributable to Gold Fields is 92.1%.
Mineral ResourcesMineral Resources are reported as in situ, on an inclusive basis, of which 100% are reported as Managed Resources. As at
31 December 2012, the total Mineral Resource estimate at the South Deep Gold Mine, using a gold price of R420 000/kg,
was as follows:
Mineral Resource classification
Gold
Classification
Tonnes (Mt) Grade (g/t) Gold (koz)
Dec
2012
Dec 2011
Dec 2010
Dec
2012
Dec 2011
Dec 2010
Dec
2012
Dec 2011
Dec 2010
Underground
Measured 57.6 51.4 41.5 7.01 7.27 7.74 12,983 12,015 10,331
Indicated 267.6 276.9 292.7 6.90 7.01 6.70 59,328 62,390 63,091
Inferred 27.5 27.5 39.0 7.43 7.43 6.41 6,569 6,569 8,032
Total underground 352.7 355.8 373.3 6.96 7.08 6.79 78,880 80,974 81,454
Surface material
Surface rock dumps – – – – – – –
Measured tailings 59.3 58.9 57.5 0.22 0.23 0.23 417 429 421
Total surface material 59.3 58.9 57.5 0.22 0.23 0.23 417 429 421
Grand total 412.0 414.7 430.8 5.99 6.11 5.91 79,297 81,403 81,875
As at 31 December 2012, the total estimated Inventory at South Deep for uranium underground and in TSF, using a uranium
price of US$55/lb was as follows:
Uranium Inventory
Uranium1
Classification
Tonnes (Mt) Grade (kg/t) Uranium (Mlb)
Dec
2012
Dec 2011
Dec 2010
Dec
2012
Dec 2011
Dec 2010
Dec
2012
Dec 2011
Dec 2010
Underground
Inventory 189.5 191.1 192.6 0.067 0.067 0.067 27.988 28.226 28.474
Surface tailings
Measured surface tailings 59.3 59.0 57.5 0.073 0.073 0.073 9.542 9.483 9.289
Grand total 248.8 250.1 250.1 0.068 0.068 0.068 37.530 37.720 37.763
1Underground uranium Inventory is scheduled at mill width and an MCF of 82 percent has been applied to the content.
Geological and evaluation models have been updated to reflect the latest available data sets.
These models are coupled to an integrated mine design and schedule plan that is based on
current performance levels and takes cognisance of the inherent risks associated with mining
operations at South Deep.

11Gold Fields – South Deep Gold Mine – Technical Short Form Report 2012 �
Mineral Resource classification per mining area
Area
Measured Indicated Inferred Total Mineral Resource
Tonnes(Mt)
Grade(g/t)
Gold(koz)
Tonnes(Mt)
Grade(g/t)
Gold(koz)
Tonnes(Mt)
Grade(g/t)
Gold(koz)
Tonnes(Mt)
Grade(g/t)
Gold(koz)
Underground
Current mine 50.2 6.99 11,267 10.2 6.71 2,197 – – – 60.4 6.94 13,464
Phase 1 NoW 7.4 7.22 1,716 80.1 7.38 19,006 10.2 8.99 2,938 97.6 7.54 23,660
Phase 1 SoW – – – 99.5 6.36 20,341 0.5 4.90 74 99.9 6.35 20,415
Phase 2 – – – 77.9 7.10 17,784 16.9 6.55 3,557 94.8 7.00 21,341
Total underground 57.6 7.01 12,983 267.6 6.89 59,328 27.5 7.43 6,569 352.7 6.96 78,880
Modifying factors
�� The Measured and Indicated Mineral Resources are
inclusive of Mineral Reserves.
�� Unless otherwise stated, all Mineral Resources and Mineral
Reserves are quoted as 100% and are not attributable
with respect to ownership.
�� All Mineral Reserves are quoted in terms of RoM grades
and tonnage as delivered to the metallurgical processing
facilities and are therefore fully diluted.
�� Mineral Reserve statements include only Measured and
Indicated Mineral Resources, modified to produce Mineral
Reserves and contained in the LoM plan.
�� Mineral Resources and Mineral Reserves undergo regular
internal and/or external audits, and any issues identified
are rectified at the earliest opportunity.
Grade tonnage curvesThe grade tonnage curve represents undiluted grade and
tonnes within the total Mineral Resource. Underground
Mineral Resources make provision for minor faulting and
minor geological losses.
Mineral Resource
parameters UnitsDec
2012
Dec2011
Gold price US$/oz 1,650 1,450
Exchange rate ZAR:US$ 7.92 7.42
Mineral Resource gold price ZAR/kg 420,000 340,000
Mineral Resource cut off g/t 3.0 3.0
Mineral Reserve
parameters UnitsDec
2012
Dec2011
Gold price US$/oz 1,500 1,300
Exchange rate ZAR:US$ 7.88 7.42
Mineral Reserve gold price ZAR/kg 380,000 310,000
Mineral Reserve cut off g/t 3.5 3.5
Dilution % 8 6 – 8
Mining recovery factor % 97 97
Mine Call Factor % 100 104 – 108
Plant recovery factor % 96.5 97.3
Processing capacity Mtpa 4.0 2.6
All reefs
To
nnes (m
illio
n)
Avera
ge g
rad
e a
bove c
ut-
off (g/t
)
0 321 4 5 6 7
Cut off grade (g/t)
2 000
1 500
1 000
500
0
12
10
8
6
4
2
0
Mineral ReservesMineral Reserve estimation at South Deep is based on development of an appropriately detailed and engineered LoM plan,
which accounts for all necessary access development and stope designs. All design and scheduling work is undertaken within
mine planning software. As at 31 December 2012, the total Managed Mineral Reserve (92.1% attributable to Gold Fields)
estimate at the South Deep Gold Mine, using a gold price of R380,000/kg was as follows:
Mineral Reserve classification
GoldClassification
Tonnes (Mt) Grade (g/t) Gold (koz)
Dec 2012
Dec 2011
Dec 2010
Dec 2012
Dec 2011
Dec 2010
Dec 2012
Dec 2011
Dec 2010
Underground
Proved 15.6 15.2 14.9 5.75 5.99 6.50 2,888 2,929 3,113
Probable 207.7 209.8 177.7 5.43 5.43 5.50 36,224 36,655 31,420
Total underground 223.3 225.0 192.6 5.45 5.47 5.58 39,112 39,584 34,533
Grand total 223.3 225.0 192.6 5.45 5.47 5.58 39,112 39,584 34,533
12 � Gold Fields – South Deep Gold Mine – Technical Short Form Report 2012
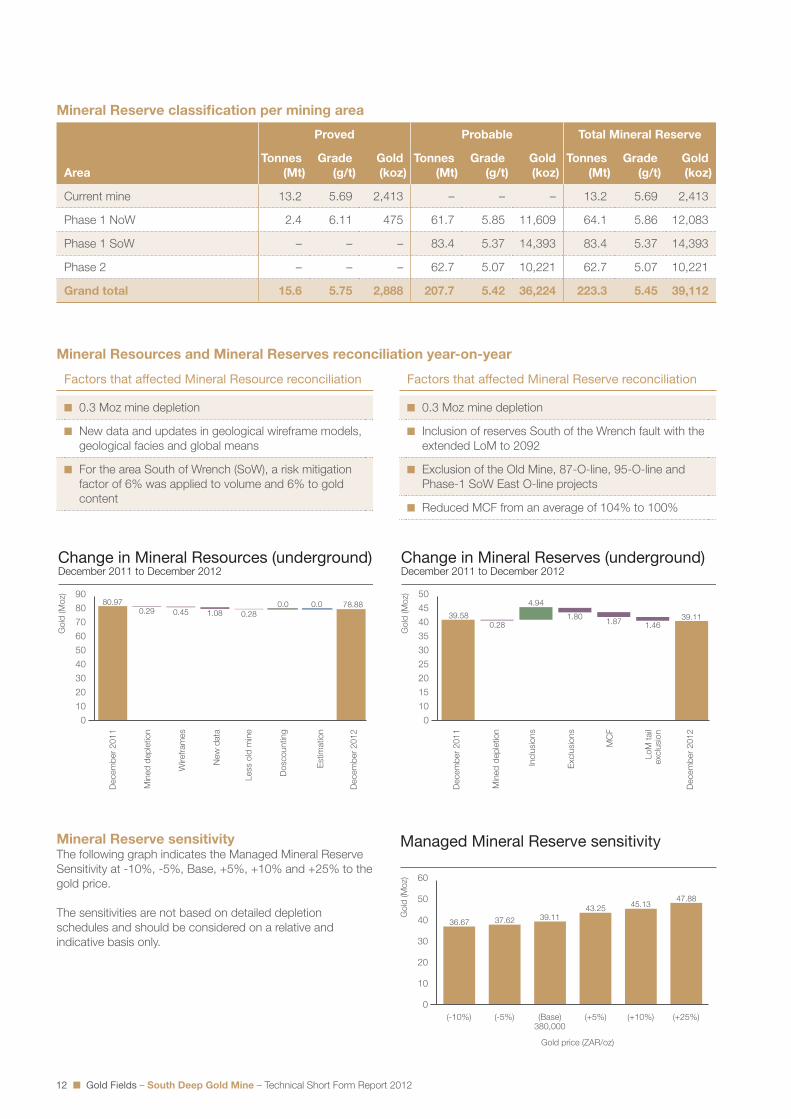
Factors that affected Mineral Resource reconciliation
�� 0.3 Moz mine depletion
�� New data and updates in geological wireframe models,
geological facies and global means
�� For the area South of Wrench (SoW), a risk mitigation
factor of 6% was applied to volume and 6% to gold
content
Go
ld (M
oz)
0.0 0.0 78.88
0.281.080.29 0.45
80.97
Change in Mineral Resources (underground)December 2011 to December 2012
New
data
Wirefr
am
es
Decem
ber
20
11
Min
ed
dep
letio
n
Less o
ld m
ine
Do
sco
unting
Estim
atio
n
Decem
ber
20
12
90
80
70
60
50
40
30
20
10
0
Factors that affected Mineral Reserve reconciliation
�� 0.3 Moz mine depletion
�� Inclusion of reserves South of the Wrench fault with the
extended LoM to 2092
�� Exclusion of the Old Mine, 87-O-line, 95-O-line and
Phase-1 SoW East O-line projects
�� Reduced MCF from an average of 104% to 100%
Go
ld (M
oz)
1.871.46
39.111.80
4.94
0.28
39.58
Change in Mineral Reserves (underground)December 2011 to December 2012
Inclu
sio
ns
Decem
ber
20
11
Min
ed
dep
letio
n
Exclu
sio
ns
MC
F
Lo
M t
ail
exclu
sio
n
Decem
ber
20
12
50
45
40
35
30
25
20
15
10
0
Mineral Reserve sensitivityThe following graph indicates the Managed Mineral Reserve
Sensitivity at -10%, -5%, Base, +5%, +10% and +25% to the
gold price.
The sensitivities are not based on detailed depletion
schedules and should be considered on a relative and
indicative basis only.
Managed Mineral Reserve sensitivity
Go
ld (M
oz)
47.8845.13
43.2539.1137.6236.67
(-10%) (-5%) (Base)380,000
(+5%) (+10%) (+25%)
60
50
40
30
20
10
0
Gold price (ZAR/oz)
Mineral Reserve classification per mining area
Area
Proved Probable Total Mineral Reserve
Tonnes
(Mt)
Grade
(g/t)
Gold
(koz)
Tonnes
(Mt)
Grade
(g/t)
Gold
(koz)
Tonnes
(Mt)
Grade
(g/t)
Gold
(koz)
Current mine 13.2 5.69 2,413 – – – 13.2 5.69 2,413
Phase 1 NoW 2.4 6.11 475 61.7 5.85 11,609 64.1 5.86 12,083
Phase 1 SoW – – – 83.4 5.37 14,393 83.4 5.37 14,393
Phase 2 – – – 62.7 5.07 10,221 62.7 5.07 10,221
Grand total 15.6 5.75 2,888 207.7 5.42 36,224 223.3 5.45 39,112
Mineral Resources and Mineral Reserves reconciliation year-on-year
13Gold Fields – South Deep Gold Mine – Technical Short Form Report 2012 �
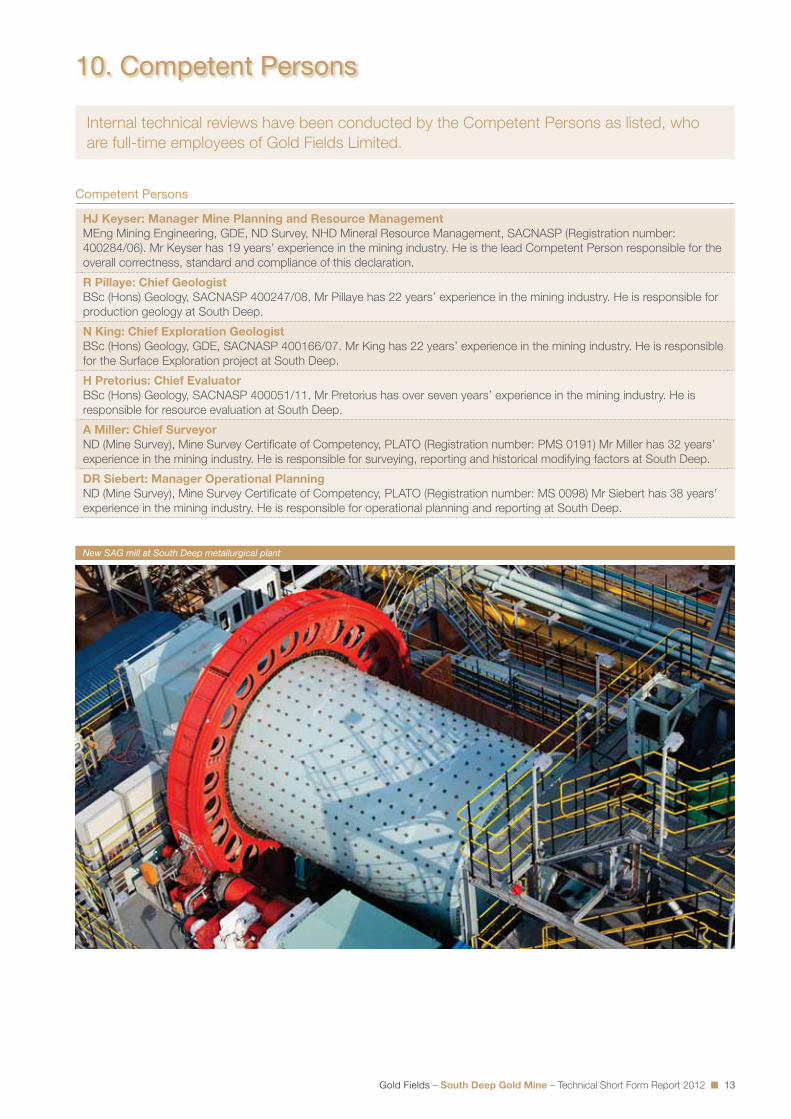
New SAG mill at South Deep metallurgical plant
10. Competent Persons
Competent Persons
HJ Keyser: Manager Mine Planning and Resource Management
MEng Mining Engineering, GDE, ND Survey, NHD Mineral Resource Management, SACNASP (Registration number:
400284/06). Mr Keyser has 19 years’ experience in the mining industry. He is the lead Competent Person responsible for the
overall correctness, standard and compliance of this declaration.
R Pillaye: Chief Geologist
BSc (Hons) Geology, SACNASP 400247/08. Mr Pillaye has 22 years’ experience in the mining industry. He is responsible for
production geology at South Deep.
N King: Chief Exploration Geologist
BSc (Hons) Geology, GDE, SACNASP 400166/07. Mr King has 22 years’ experience in the mining industry. He is responsible
for the Surface Exploration project at South Deep.
H Pretorius: Chief Evaluator
BSc (Hons) Geology, SACNASP 400051/11. Mr Pretorius has over seven years’ experience in the mining industry. He is
responsible for resource evaluation at South Deep.
A Miller: Chief Surveyor
ND (Mine Survey), Mine Survey Certificate of Competency, PLATO (Registration number: PMS 0191) Mr Miller has 32 years’
experience in the mining industry. He is responsible for surveying, reporting and historical modifying factors at South Deep.
DR Siebert: Manager Operational Planning
ND (Mine Survey), Mine Survey Certificate of Competency, PLATO (Registration number: MS 0098) Mr Siebert has 38 years’
experience in the mining industry. He is responsible for operational planning and reporting at South Deep.
Internal technical reviews have been conducted by the Competent Persons as listed, who
are full-time employees of Gold Fields Limited.

14 � Gold Fields – South Deep Gold Mine – Technical Short Form Report 2012
11. Key technical staff
Post Incumbent Qualifications Years Key responsibilities
Vice-President and
Head of
Operations
Ken Matthysen BSc (Mining Geology), GDE (Mining
Engineering), BSc (Hons) Mining
Engineering, MMC
31 Overall strategic direction,
leadership and management
Senior Manager
Operations: South
Sarel Ferreira NHD (Met Mining) MMC, MBA, M
Dip Business management, Pr Cert
Engineer
31 Full operational management
Senior Manager
Operations: Twins
Gerard Pienaar ND (Met Mining) MMC, BSc Mining
Engineering, Pr Cert Engineer and
Pre Eng
15 Full operational management
Senior Financial
Manager
Giel
Bezuidenhout
BCom Accounting, CIS, MBA 27 Financial reporting, compliance
Human Resource
Manager
Bonny Sebola BSc, MSc Environmental
Management
13 Human resources management
Senior Consultant
Mining
Dave Wright BSc Engineering (Mining), MDP,
MBL, SAIMM associate, AMMSA
associate
20 Business improvement,
implementation of ramp up
strategy, optimisation of
infrastructural requirements
Metallurgy
Manager
Stephen
Joseph
NHD Extraction Metallurgy 22 Metallurgical management
Mineral Resources
Manager
Manie Keyser
(HJ)
ND Survey, NHD MRM, GDE, MEng
Mining Engineering, Pri SciNat
19 Mine planning, Mineral Resources
and Mineral Reserves and
compilation of Competent Persons
Report (CPR)
Safety Manager Edwin
Matlapeng
NDip Safety Management 29 Safety
Engineering
Manager
Clive Moses NHD Electrical Engineering,
Government Certificate of
Competency Electrical Engineering
26 Engineering, logistics, infrastructure
and management
Office of Strategy
Management
Casper van Zyl NHD (Met Mining), MMC, MDP 32 Continuous improvement
Upgraded plant to treat 330 ktpm with Twin Shafts in background

Gold Fields LimitedSouth Deep Gold MinePlan showing underground workings as at 31 December 2012
Area 4,268 hectares
1 0 500 1 000 1 500 2 000 2 500
Metres
Gauss Conform Projection. Central Meridian Lo. 27° East
Development and stoping on Ventersdorp Contact Reef . . . . . . . . . . . . . . . . . . .Development and stoping on Elsburg Individual Reefs . . . . . . . . . . . . . . . . . . . . .Development and stoping on Elsburg Massive Reefs . . . . . . . . . . . . . . . . . . . . . .Development off Reef. . . . . . . . . . . . . . . . . . . . . . . . . . . . . . . . . . . . . . . . . . . . . . .Dykes . . . . . . . . . . . . . . . . . . . . . . . . . . . . . . . . . . . . . . . . . . . . . . . . . . . . . . . . . . .Faults . . . . . . . . . . . . . . . . . . . . . . . . . . . . . . . . . . . . . . . . . . . . . . . . . . . . . . . . . . .Shafts . . . . . . . . . . . . . . . . . . . . . . . . . . . . . . . . . . . . . . . . . . . . . . . . . . . . . . . . . . .Borehole No. and Surface Position of Old Boreholes . . . . . . . . . . . . . . . . . . . . . .Borehole No. and Surface Position of Completed Boreholes . . . . . . . . . . . . . . . .Borehole No. and Surface Position of Boreholes in Progress . . . . . . . . . . . . . . . .Borehole No. and Surface Position of Boreholes Temporarily Stopped . . . . . . . .
Reference
Page w
idth 208 mm
Page w
idth 205 mm

12. Brief history
The history of South Deep
1950: Commercial production of the Western Areas Gold Mine commenced in September 1951.
1959: A formal application for a mining lease was made, which resulted in the Western Areas Gold Mining
Company Limited being incorporated as a public company on 8 September 1959.
1961: Johannesburg Consolidated Investment Company Limited formed a prospecting consortium that acquired
the prospecting rights over the farms Waterpan, Modderfontein and Jachtfontein in the Westonaria
District.
1974: The Elsburg Gold Mining Company merged with Western Areas Gold Mining Company Limited on 1 July
1974 to become part of a larger Western Areas Gold Mining Company.
1990: Western Areas Gold Mining Company Limited shareholders approved the transfer, cession and
assignment of certain land and mineral rights to South Deep Exploration Company Limited in exchange for
its shares.
1995: Western Areas Gold Mining Company Limited and South Deep Exploration Company Limited merged on
1 January. Development of 95 Level across to planned collar position of Twins commenced.
1998: Western Areas Gold Mining Company Limited changed its name to Western Areas Limited.
1999: On 1 April 1999, the PDWA joint venture was formed.
2000: The name of the mine was changed to South Deep Gold Mine in February 2000.
2001: Sinking of the ventilation shaft was completed.
2002: Sinking of the main shaft was completed and a 7,200 tpd capacity mill commissioned.
2004: The Mineral and Petroleum Resources Development Act was promulgated into law on 1 May 2004 and
the Twin Shaft Complex was commissioned in November 2004.
2005: The Twin Shaft Complex was officially opened on 4 February 2005.
2006: Barrick Gold Corporation acquired a majority interest in Placer Dome Inc. on 20 January 2006.
Gold Fields Limited acquired Barricks’ 50% JV interest in the PDWA JV on 1 December 2006.
2007: Gold Fields acquired all remaining WAL shares on 10 April 2007 and consequently own 100% of South
Deep Gold Mine. WAL listing terminated on 30 March 2007.
2007: Gold Fields closed the South Deep hedge book in January 2007.
2010: New-order mining right granted to South Deep, including the area known as Uncle Harry’s.
2011: Establishment of Newshelf 899 (Proprietary) Limited (Newshelf), which holds a 100% interest in South
Deep Gold Mine. Newshelf is a 90% subsidiary of Gold Fields Limited and the remaining 10% is held by
outside shareholders as part of the BBBEE transaction.
2012: During 2012 South Deep signed a new collective agreement with Organised Labour to implement a New
Operating Model.
Run of mine stockpiles
17 � Gold Fields – South Deep Gold Mine – Technical Short Form Report 2012
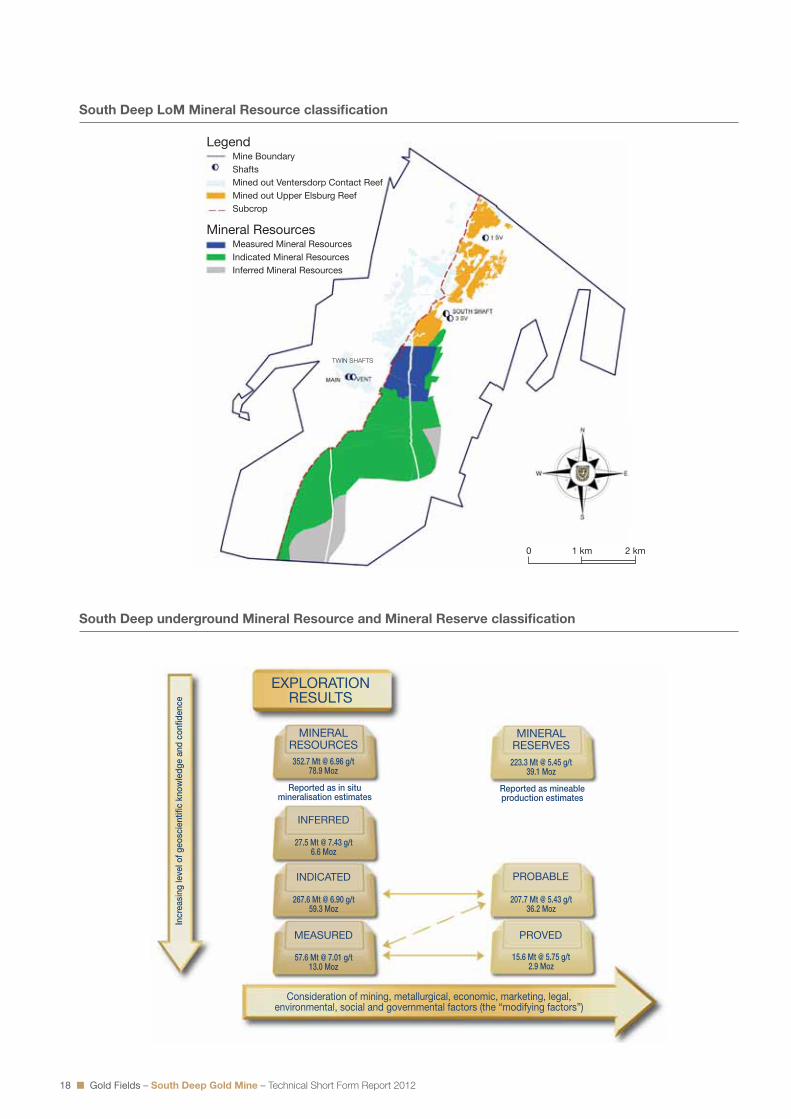
South Deep underground Mineral Resource and Mineral Reserve classification
EXPLORATIONRESULTS
MINERALRESERVES
MINERALRESOURCES
Reported as in situmineralisation estimates
Consideration of mining, metallurgical, economic, marketing, legal,environmental, social and governmental factors (the “modifying factors”)
352.7 Mt @ 6.96 g/t78.9 Moz
223.3 Mt @ 5.45 g/t39.1 Moz
207.7 Mt @ 5.43 g/t36.2 Moz
15.6 Mt @ 5.75 g/t2.9 Moz
27.5 Mt @ 7.43 g/t6.6 Moz
267.6 Mt @ 6.90 g/t59.3 Moz
57.6 Mt @ 7.01 g/t13.0 Moz
Reported as mineableproduction estimates
Incr
easi
ng le
vel o
f geo
scie
ntifi
c kn
owle
dge
and
confi
denc
e
MEASURED PROVED
PROBABLEINDICATED
INFERRED
South Deep LoM Mineral Resource classification
LegendMine BoundaryShaftsMined out Ventersdorp Contact ReefMined out Upper Elsburg ReefSubcrop
Mineral ResourcesMeasured Mineral ResourcesIndicated Mineral ResourcesInferred Mineral Resources
TWIN SHAFTS
0 1 km 2 km
18 � Gold Fields – South Deep Gold Mine – Technical Short Form Report 2012

This Technical Short Form Report (the Report) contains information as at 31 December 2012 (the Effective Date of this
Report). The statements and information set out in this Report speak only as of the Effective Date of this Report. Shareholders
and other interested and affected parties are therefore urged to review all public disclosures made by Gold Fields after the
Effective Date of this Report, as some of the information contained in the Report may have changed or been updated. Gold
Fields does not undertake any obligation to update publicly or release any revisions to statements and information set out in this
Report to reflect events or circumstances after the Effective Date of this Report, or to reflect the occurrence of unanticipated
events, unless obliged to do so pursuant to law or regulation. In such event, Gold Fields does not undertake to refer back to
any information contained in this Report.
Notes
BASTION GRAPHICS
South Deep metallurgical plant upgraded to process 330 ktpm

Registered Office South Africa:
150 Helen RoadSandownSandton, 2196JohannesburgGauteng
Private Bag X30500Houghton, 2041South Africa
Website: http://www.goldfields.co.zaTelephone: +27 (0) 11 562 9700Facsimile: +27 (0) 11 562 9838
“If we cannot mine safely, we will not mine”
Gold Fields Safety Value