South Dakota Agricultural Land Market Trends, 1991 …igrow.org/up/resources/07-3007-2017.pdfSouth...
23
Page 1 iGrow.org | A Service of SDSU Extension | © 2017, South Dakota Board of Regents South Dakota Farmland Market Trends, 1991 - 2017 Introduction The 2017 SDSU Extension Farm Real Estate Market Survey is the 27th annual survey of agricultural land values and cash rental rates by land use and quality in different regions of South Dakota 1 . Reported are results of the survey and a discussion of factors influencing buyer/seller decisions and positive/negative factors impacting farmland markets. The publication of the survey findings is in response to numerous requests by farmland owners, renters, appraisers, lenders, buyers, and others for detailed information on South Dakota farmland markets. The 2017 estimates are based on reports from 167 responses 2 to the 2017 SDSU survey. Responses are from agricultural lenders, Farm Service Agency officials, rural appraisers, assessors, realtors, professional farm managers, and Extension Field Specialists. All are familiar with farm real estate market trends in their localities. The number of responses for 2017 was the lowest total responses during the past 26 years. At the request of the respondents several modifications were made to the 2017 land value survey. • The first change was that the survey was conducted electronically. • The cropland variable was modified to include alfalfa hay rather than having a separate variable for hay. • The range and pasture variables were combined to pasture/rangeland (this includes all grass). The survey was also modified to be more concise and better reflect the current agriculture land use throughout the state. Updates to the definitions for what qualifies as high low, and average was also included (See Appendix I). Readers should use this report as a general reference and rely on local sources for more specific details. This report contains an overview and may or may not reflect actual land values or cash rental rates unique to specific localities or properties. South Dakota Agricultural Land Values, 2017 Land Values Respondents to the 2017 South Dakota Farm Real Estate Market Survey estimated the per-acre value of non-irrigated cropland and pastureland in their county. Responses for non-irrigated land uses are grouped into eight agricultural regions. The six regions in Eastern and Central South Dakota correspond with USDA Agricultural Statistics Districts. In Western South Dakota, farmland values and cash rental rates are reported for the Northwest and Southwest regions. Land values and cash rental rates are reported only for privately owned land and should not be considered as estimated values for tribal lands or federal lands. The average value per-acre and percent change in value were obtained for each agricultural land use, in each region. South Dakota Agricultural Land Market Trends, 1991 – 2017: Results from the 2017 SDSU South Dakota Farm Real Estate Survey Jack Davis | SDSU Extension Crops Business Management Field Specialist Shannon Sand | SDSU Extension Livestock Business Management Field Specialist agronomy SDSU DEPARTMENT OF ECONOMICS JULY 2017 iGrow.org 1 Thank you to Dr. Matthew Diersen, Heather Gessner, Dr. Larry Janssen were invaluable in their help with editing and/or reviewing this document. 2 Responses are the number of survey schedules completed for one or two counties. A growing number of respondents completed separate survey schedules for different counties. Each completed survey schedule was treated as a survey response. More details are provided in Appendix 1.
Transcript of South Dakota Agricultural Land Market Trends, 1991 …igrow.org/up/resources/07-3007-2017.pdfSouth...

Page 1 iGrow.org | A Service of SDSU Extension | © 2017, South Dakota Board of Regents
South Dakota Farmland Market Trends, 1991 - 2017 Introduction The 2017 SDSU Extension Farm Real Estate Market Survey is the 27th annual survey of agricultural land values and cash rental rates by land use and quality in different regions of South Dakota1. Reported are results of the survey and a discussion of factors influencing buyer/seller decisions and positive/negative factors impacting farmland markets. The publication of the survey findings is in response to numerous requests by farmland owners, renters, appraisers, lenders, buyers, and others for detailed information on South Dakota farmland markets.
The 2017 estimates are based on reports from 167 responses2 to the 2017 SDSU survey. Responses are from agricultural lenders, Farm Service Agency officials, rural appraisers, assessors, realtors, professional farm managers, and Extension Field Specialists. All are familiar with farm real estate market trends in their localities. The number of responses for 2017 was the lowest total responses during the past 26 years.
At the request of the respondents several modifications were made to the 2017 land value survey. • The first change was that the survey was
conducted electronically. • The cropland variable was modified to include
alfalfa hay rather than having a separate variable for hay.
• The range and pasture variables were combined to pasture/rangeland (this includes all grass).
The survey was also modified to be more concise and better reflect the current agriculture land use throughout the state. Updates to the definitions for what qualifies as high low, and average was also included (See Appendix I).
Readers should use this report as a general reference and rely on local sources for more specific details. This report contains an overview and may or may not reflect actual land values or cash rental rates unique to specific localities or properties.
South Dakota Agricultural Land Values, 2017 Land Values Respondents to the 2017 South Dakota Farm Real Estate Market Survey estimated the per-acre value of non-irrigated cropland and pastureland in their county. Responses for non-irrigated land uses are grouped into eight agricultural regions. The six regions in Eastern and Central South Dakota correspond with USDA Agricultural Statistics Districts. In Western South Dakota, farmland values and cash rental rates are reported for the Northwest and Southwest regions. Land values and cash rental rates are reported only for privately owned land and should not be considered as estimated values for tribal lands or federal lands.
The average value per-acre and percent change in value were obtained for each agricultural land use, in each region.
South Dakota Agricultural Land Market Trends, 1991 – 2017:Results from the 2017 SDSU South Dakota Farm Real Estate Survey
Jack Davis | SDSU Extension Crops Business Management Field Specialist Shannon Sand | SDSU Extension Livestock Business Management Field Specialist
agronomySDSU DEPARTMENT OF
ECONOMICSJULY 2017
iGrow.org
1 Thank you to Dr. Matthew Diersen, Heather Gessner, Dr. Larry Janssen were invaluable in their help with editing and/or reviewing this document.
2 Responses are the number of survey schedules completed for one or two counties. A growing number of respondents completed separate survey schedules for
different counties. Each completed survey schedule was treated as a survey response. More details are provided in Appendix 1.
Page 2 iGrow.org | A Service of SDSU Extension | © 2017, South Dakota Board of Regents
| agronomy
Regional differences in agricultural land values are primarily related to major differences in: 1) agricultural land productivity among regions, 2) per-acre values of cropland and pasture/rangeland in each region, and 3) the proportion of cropland and pasture in each region.
Statewide, an estimated 47% of privately owned farmland acres are classified cropland or hayland and 53% is rangeland or tame pasture. Statewide cropland values are greatly influenced by values reported in the North Central and the three eastern regions, while statewide pasture/rangeland values are heavily influenced by values reported in the Western regions3.
Cash Rental Rates of South Dakota’s Agricultural LandNearly two-fifths of South Dakota’s agricultural land acres are in cash, share, or other lease arrangements (SD Census of Agriculture, 2012). Three fourths of SD farmland renters are involved in one or more cash leases and most are annual renewable agreements. Cash rental market provides key information on returns to farmland.
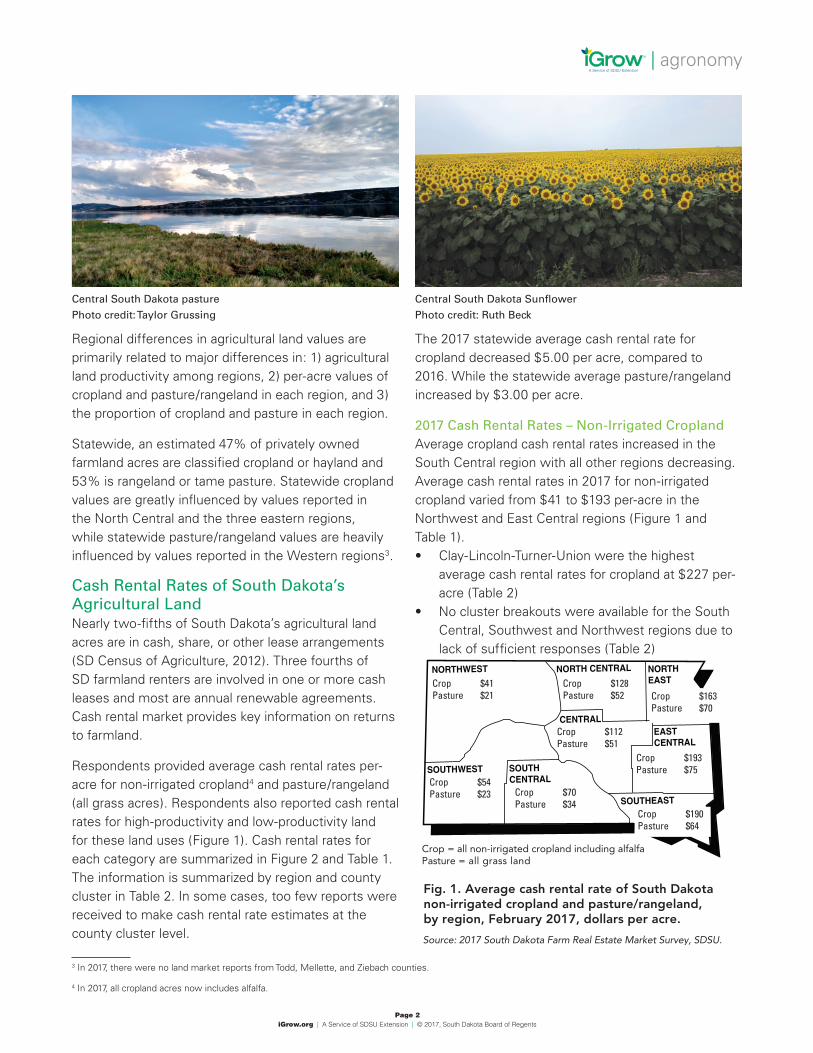
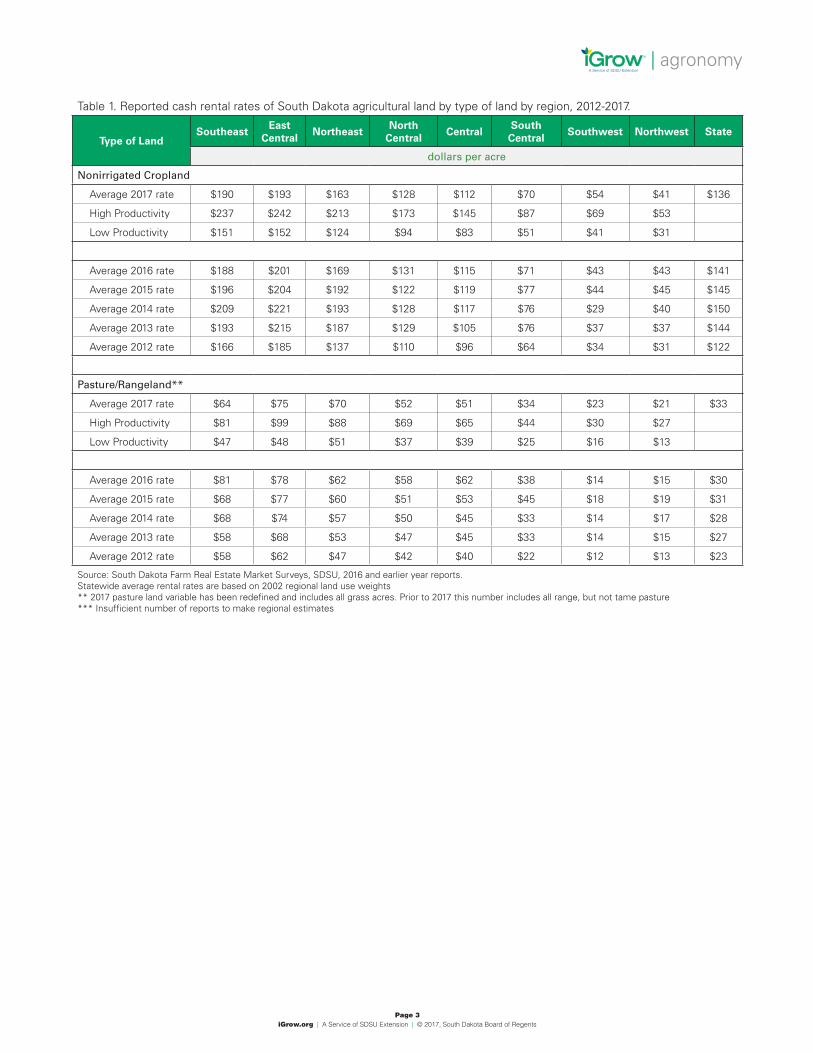
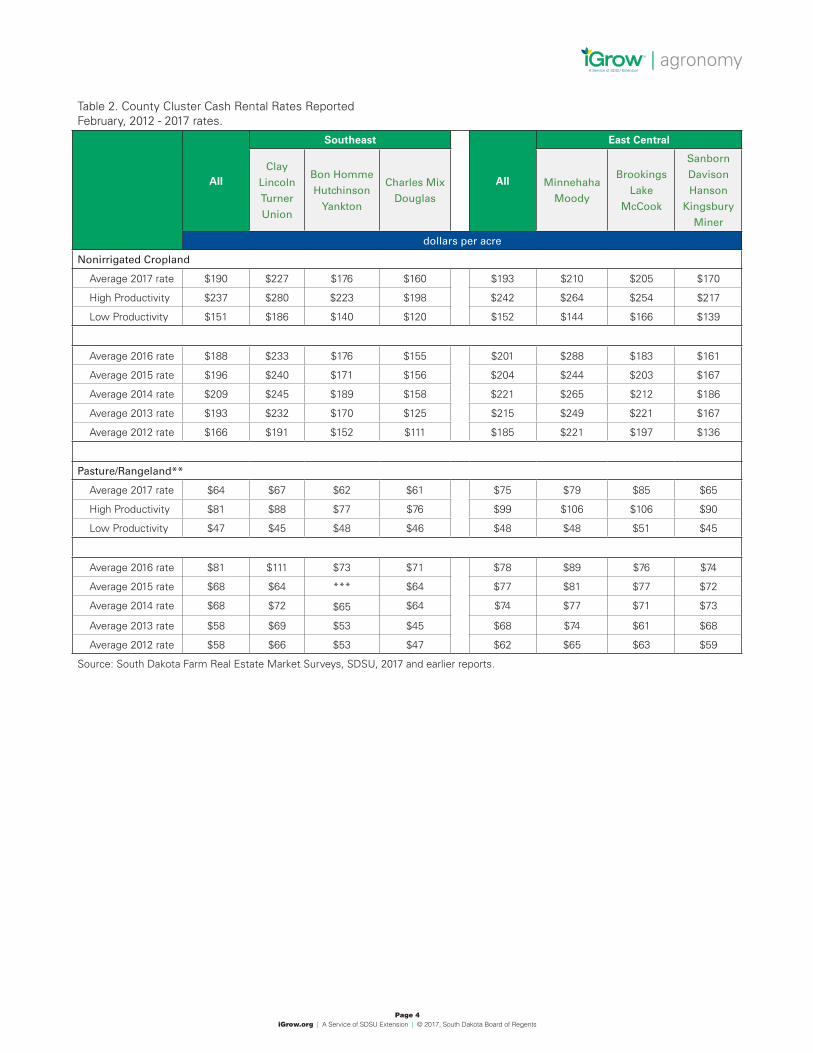
Respondents provided average cash rental rates per-acre for non-irrigated cropland4 and pasture/rangeland (all grass acres). Respondents also reported cash rental rates for high-productivity and low-productivity land for these land uses (Figure 1). Cash rental rates for each category are summarized in Figure 2 and Table 1. The information is summarized by region and county cluster in Table 2. In some cases, too few reports were received to make cash rental rate estimates at the county cluster level.
The 2017 statewide average cash rental rate for cropland decreased $5.00 per acre, compared to 2016. While the statewide average pasture/rangeland increased by $3.00 per acre.
2017 Cash Rental Rates – Non-Irrigated CroplandAverage cropland cash rental rates increased in the South Central region with all other regions decreasing. Average cash rental rates in 2017 for non-irrigated cropland varied from $41 to $193 per-acre in the Northwest and East Central regions (Figure 1 and Table 1).• Clay-Lincoln-Turner-Union were the highest
average cash rental rates for cropland at $227 per-acre (Table 2)
• No cluster breakouts were available for the South Central, Southwest and Northwest regions due to lack of sufficient responses (Table 2)
3 In 2017, there were no land market reports from Todd, Mellette, and Ziebach counties.
4 In 2017, all cropland acres now includes alfalfa.
Central South Dakota pasture
Photo credit: Taylor Grussing
Central South Dakota Sunflower
Photo credit: Ruth Beck
Fig. 1. Average cash rental rate of South Dakota non-irrigated cropland and pasture/rangeland, by region, February 2017, dollars per acre.Source: 2017 South Dakota Farm Real Estate Market Survey, SDSU.
Crop = all non-irrigated cropland including alfalfaPasture = all grass land
Crop $41Pasture $21
Crop $128Pasture $52
Crop $112Pasture $51
Crop $163Pasture $70
Crop $193Pasture $75
Crop $190Pasture $64
Crop $54Pasture $23 Crop $70
Pasture $34
Page 3 iGrow.org | A Service of SDSU Extension | © 2017, South Dakota Board of Regents
| agronomy
Table 1. Reported cash rental rates of South Dakota agricultural land by type of land by region, 2012-2017.
Type of LandSoutheast
EastCentral
NortheastNorth
CentralCentral
South Central
Southwest Northwest State
dollars per acre
Nonirrigated Cropland
Average 2017 rate $190 $193 $163 $128 $112 $70 $54 $41 $136
High Productivity $237 $242 $213 $173 $145 $87 $69 $53
Low Productivity $151 $152 $124 $94 $83 $51 $41 $31
Average 2016 rate $188 $201 $169 $131 $115 $71 $43 $43 $141
Average 2015 rate $196 $204 $192 $122 $119 $77 $44 $45 $145
Average 2014 rate $209 $221 $193 $128 $117 $76 $29 $40 $150
Average 2013 rate $193 $215 $187 $129 $105 $76 $37 $37 $144
Average 2012 rate $166 $185 $137 $110 $96 $64 $34 $31 $122
Pasture/Rangeland**
Average 2017 rate $64 $75 $70 $52 $51 $34 $23 $21 $33
High Productivity $81 $99 $88 $69 $65 $44 $30 $27
Low Productivity $47 $48 $51 $37 $39 $25 $16 $13
Average 2016 rate $81 $78 $62 $58 $62 $38 $14 $15 $30
Average 2015 rate $68 $77 $60 $51 $53 $45 $18 $19 $31
Average 2014 rate $68 $74 $57 $50 $45 $33 $14 $17 $28
Average 2013 rate $58 $68 $53 $47 $45 $33 $14 $15 $27
Average 2012 rate $58 $62 $47 $42 $40 $22 $12 $13 $23
Source: South Dakota Farm Real Estate Market Surveys, SDSU, 2016 and earlier year reports.Statewide average rental rates are based on 2002 regional land use weights** 2017 pasture land variable has been redefined and includes all grass acres. Prior to 2017 this number includes all range, but not tame pasture*** Insufficient number of reports to make regional estimates
Page 4 iGrow.org | A Service of SDSU Extension | © 2017, South Dakota Board of Regents
| agronomy
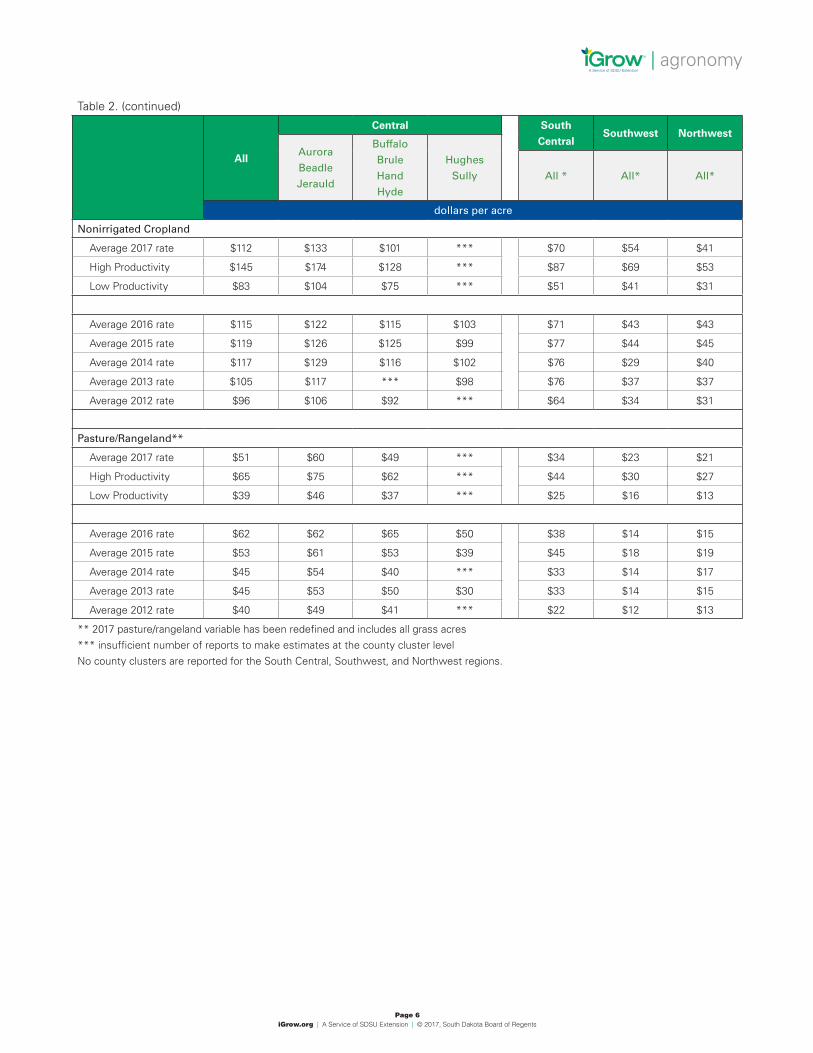
Table 2. County Cluster Cash Rental Rates ReportedFebruary, 2012 - 2017 rates.
All
Southeast
All
East Central
Clay
Lincoln
Turner
Union
Bon Homme
Hutchinson
Yankton
Charles Mix
Douglas
Minnehaha
Moody
Brookings
Lake
McCook
Sanborn
Davison
Hanson
Kingsbury
Miner
dollars per acre
Nonirrigated Cropland
Average 2017 rate $190 $227 $176 $160 $193 $210 $205 $170
High Productivity $237 $280 $223 $198 $242 $264 $254 $217
Low Productivity $151 $186 $140 $120 $152 $144 $166 $139
Average 2016 rate $188 $233 $176 $155 $201 $288 $183 $161
Average 2015 rate $196 $240 $171 $156 $204 $244 $203 $167
Average 2014 rate $209 $245 $189 $158 $221 $265 $212 $186
Average 2013 rate $193 $232 $170 $125 $215 $249 $221 $167
Average 2012 rate $166 $191 $152 $111 $185 $221 $197 $136
Pasture/Rangeland**
Average 2017 rate $64 $67 $62 $61 $75 $79 $85 $65
High Productivity $81 $88 $77 $76 $99 $106 $106 $90
Low Productivity $47 $45 $48 $46 $48 $48 $51 $45
Average 2016 rate $81 $111 $73 $71 $78 $89 $76 $74
Average 2015 rate $68 $64 *** $64 $77 $81 $77 $72
Average 2014 rate $68 $72 $65 $64 $74 $77 $71 $73
Average 2013 rate $58 $69 $53 $45 $68 $74 $61 $68
Average 2012 rate $58 $66 $53 $47 $62 $65 $63 $59
Source: South Dakota Farm Real Estate Market Surveys, SDSU, 2017 and earlier reports.

Page 5 iGrow.org | A Service of SDSU Extension | © 2017, South Dakota Board of Regents
| agronomy
Table 2. (continued)
All
Northeast
All
North Central
Codington
Deuel
Hamlin
Grant
Roberts
Clark
Day
Marshall
Brown
Spink
Edmund
Faulk
McPherson
Campbell
Potter
Walworth
dollars per acre
Nonirrigated Cropland
Average 2017 rate $163 $176 $157 $153 $128 $151 $109 $95
High Productivity $213 $235 $193 $204 $173 $205 $144 $132
Low Productivity $124 $134 $118 $117 $94 $114 $79 $62
Average 2016 rate $170 $172 $175 $158 $131 $149 $114 $119
Average 2015 rate $192 $193 *** *** $122 $151 $106 $89
Average 2014 rate $193 $199 $203 $174 $128 $151 $104 $96
Average 2013 rate $187 $202 $190 $165 $129 $151 $109 ***
Average 2012 rate $137 $162 $142 $114 $110 $123 $92 ***
Pasture/Rangeland**
Average 2017 rate $70 $72 $69 $68 $52 $65 $43 $40
High Productivity $88 $93 $81 $86 $69 $83 $61 $50
Low Productivity $51 $52 $54 $47 $37 $48 $26 $32
Average 2016 rate $62 $64 $63 $57 $58 $65 $57 $50
Average 2015 rate $60 $64 *** *** $51 $57 $52 $39
Average 2014 rate $57 $57 $58 $55 $50 $55 $47 $38
Average 2013 rate $53 $56 $46 $51 $47 $52 $44 ***
Average 2012 rate $47 $52 $42 $45 $42 $45 $42 ***
Page 6 iGrow.org | A Service of SDSU Extension | © 2017, South Dakota Board of Regents
| agronomy
Table 2. (continued)
All
Central South
CentralSouthwest Northwest
Aurora
Beadle
Jerauld
Buffalo
Brule
Hand
Hyde
Hughes
Sully All * All* All*
dollars per acre
Nonirrigated Cropland
Average 2017 rate $112 $133 $101 *** $70 $54 $41
High Productivity $145 $174 $128 *** $87 $69 $53
Low Productivity $83 $104 $75 *** $51 $41 $31
Average 2016 rate $115 $122 $115 $103 $71 $43 $43
Average 2015 rate $119 $126 $125 $99 $77 $44 $45
Average 2014 rate $117 $129 $116 $102 $76 $29 $40
Average 2013 rate $105 $117 *** $98 $76 $37 $37
Average 2012 rate $96 $106 $92 *** $64 $34 $31
Pasture/Rangeland**
Average 2017 rate $51 $60 $49 *** $34 $23 $21
High Productivity $65 $75 $62 *** $44 $30 $27
Low Productivity $39 $46 $37 *** $25 $16 $13
Average 2016 rate $62 $62 $65 $50 $38 $14 $15
Average 2015 rate $53 $61 $53 $39 $45 $18 $19
Average 2014 rate $45 $54 $40 *** $33 $14 $17
Average 2013 rate $45 $53 $50 $30 $33 $14 $15
Average 2012 rate $40 $49 $41 *** $22 $12 $13
** 2017 pasture/rangeland variable has been redefined and includes all grass acres*** insufficient number of reports to make estimates at the county cluster levelNo county clusters are reported for the South Central, Southwest, and Northwest regions.
Page 7 iGrow.org | A Service of SDSU Extension | © 2017, South Dakota Board of Regents
| agronomy
2017 Cash Rental Rates - Rangeland and Pasture Average cash rental rates per-acre reflect regional differences in productivity and carrying capacity of pasture and rangeland tracts5. Pasture/rangeland rental rates increased in four regions (Northeast, South Central, Southwest, and Northwest), while seeing a decrease in the other four regions (Southeast, East Central, North Central, and Central). Average cash rental rates varied from $21 per-acre in the Northwest region to $75 per-acre in the Southeast region (Figure 1 and Table 2). • Brookings-Lake-McCook had the highest average
pasture/range cash rental rate of $85 per-acre (Table 2)
• No cluster breakouts were available for the South Central, Southwest and Northwest regions (Table 2)
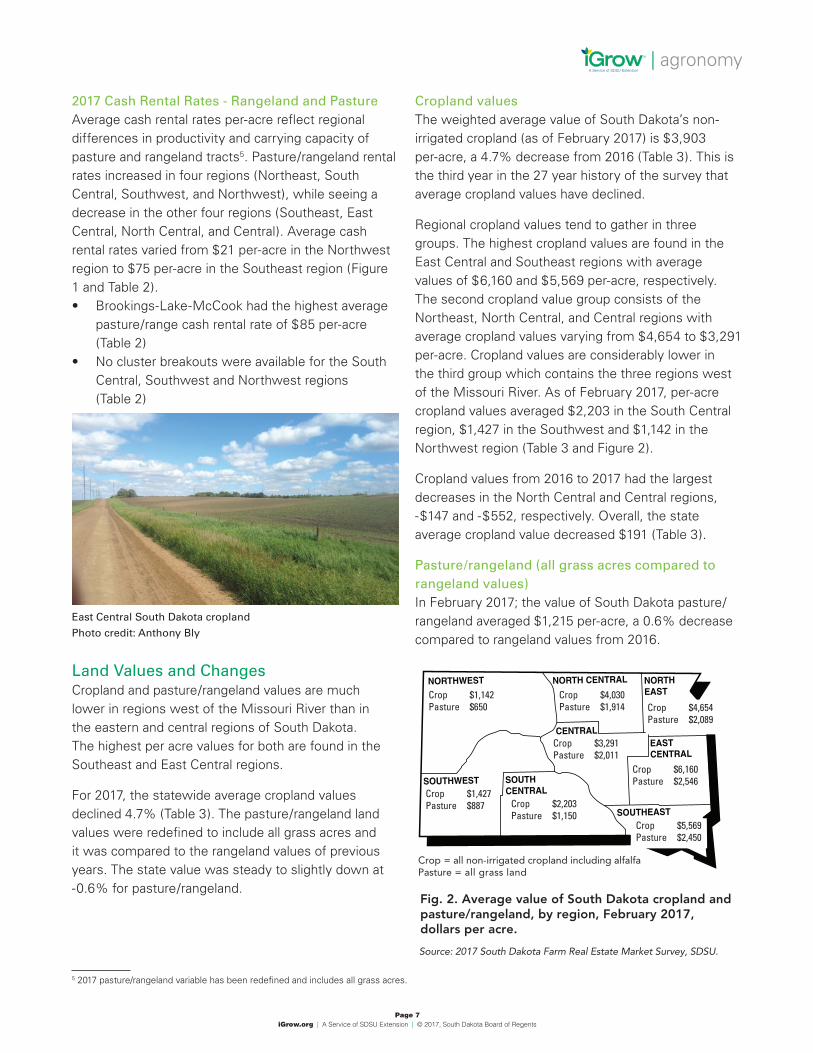
Land Values and ChangesCropland and pasture/rangeland values are much lower in regions west of the Missouri River than in the eastern and central regions of South Dakota. The highest per acre values for both are found in the Southeast and East Central regions.
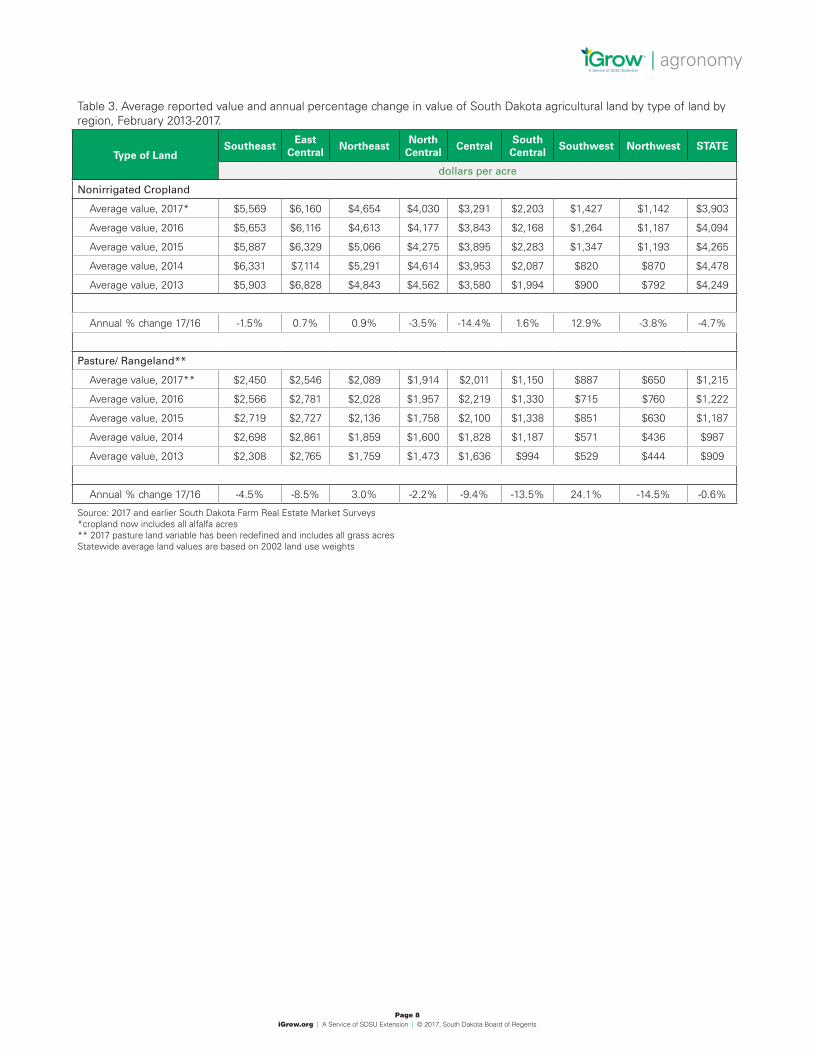
For 2017, the statewide average cropland values declined 4.7% (Table 3). The pasture/rangeland land values were redefined to include all grass acres and it was compared to the rangeland values of previous years. The state value was steady to slightly down at -0.6% for pasture/rangeland.
Cropland values The weighted average value of South Dakota’s non-irrigated cropland (as of February 2017) is $3,903 per-acre, a 4.7% decrease from 2016 (Table 3). This is the third year in the 27 year history of the survey that average cropland values have declined.
Regional cropland values tend to gather in three groups. The highest cropland values are found in the East Central and Southeast regions with average values of $6,160 and $5,569 per-acre, respectively. The second cropland value group consists of the Northeast, North Central, and Central regions with average cropland values varying from $4,654 to $3,291 per-acre. Cropland values are considerably lower in the third group which contains the three regions west of the Missouri River. As of February 2017, per-acre cropland values averaged $2,203 in the South Central region, $1,427 in the Southwest and $1,142 in the Northwest region (Table 3 and Figure 2).
Cropland values from 2016 to 2017 had the largest decreases in the North Central and Central regions, -$147 and -$552, respectively. Overall, the state average cropland value decreased $191 (Table 3).
Pasture/rangeland (all grass acres compared to rangeland values)In February 2017; the value of South Dakota pasture/rangeland averaged $1,215 per-acre, a 0.6% decrease compared to rangeland values from 2016.
5 2017 pasture/rangeland variable has been redefined and includes all grass acres.
East Central South Dakota cropland
Photo credit: Anthony Bly
Source: 2017 South Dakota Farm Real Estate Market Survey, SDSU.
Crop = all non-irrigated cropland including alfalfaPasture = all grass land
Crop $1,142Pasture $650
Crop $4,030Pasture $1,914
Crop $3,291Pasture $2,011
Crop $4,654Pasture $2,089
Crop $6,160Pasture $2,546
Crop $5,569Pasture $2,450
Crop $1,427Pasture $887 Crop $2,203
Pasture $1,150
Fig. 2. Average value of South Dakota cropland and pasture/rangeland, by region, February 2017, dollars per acre.
Page 8 iGrow.org | A Service of SDSU Extension | © 2017, South Dakota Board of Regents
| agronomy
Table 3. Average reported value and annual percentage change in value of South Dakota agricultural land by type of land by region, February 2013-2017.
Type of LandSoutheast
East Central
NortheastNorth
CentralCentral
South Central
Southwest Northwest STATE
dollars per acre
Nonirrigated Cropland
Average value, 2017* $5,569 $6,160 $4,654 $4,030 $3,291 $2,203 $1,427 $1,142 $3,903
Average value, 2016 $5,653 $6,116 $4,613 $4,177 $3,843 $2,168 $1,264 $1,187 $4,094
Average value, 2015 $5,887 $6,329 $5,066 $4,275 $3,895 $2,283 $1,347 $1,193 $4,265
Average value, 2014 $6,331 $7,114 $5,291 $4,614 $3,953 $2,087 $820 $870 $4,478
Average value, 2013 $5,903 $6,828 $4,843 $4,562 $3,580 $1,994 $900 $792 $4,249
Annual % change 17/16 -1.5% 0.7% 0.9% -3.5% -14.4% 1.6% 12.9% -3.8% -4.7%
Pasture/ Rangeland**
Average value, 2017** $2,450 $2,546 $2,089 $1,914 $2,011 $1,150 $887 $650 $1,215
Average value, 2016 $2,566 $2,781 $2,028 $1,957 $2,219 $1,330 $715 $760 $1,222
Average value, 2015 $2,719 $2,727 $2,136 $1,758 $2,100 $1,338 $851 $630 $1,187
Average value, 2014 $2,698 $2,861 $1,859 $1,600 $1,828 $1,187 $571 $436 $987
Average value, 2013 $2,308 $2,765 $1,759 $1,473 $1,636 $994 $529 $444 $909
Annual % change 17/16 -4.5% -8.5% 3.0% -2.2% -9.4% -13.5% 24.1% -14.5% -0.6%
Source: 2017 and earlier South Dakota Farm Real Estate Market Surveys*cropland now includes all alfalfa acres** 2017 pasture land variable has been redefined and includes all grass acresStatewide average land values are based on 2002 land use weights
Page 9 iGrow.org | A Service of SDSU Extension | © 2017, South Dakota Board of Regents
| agronomy
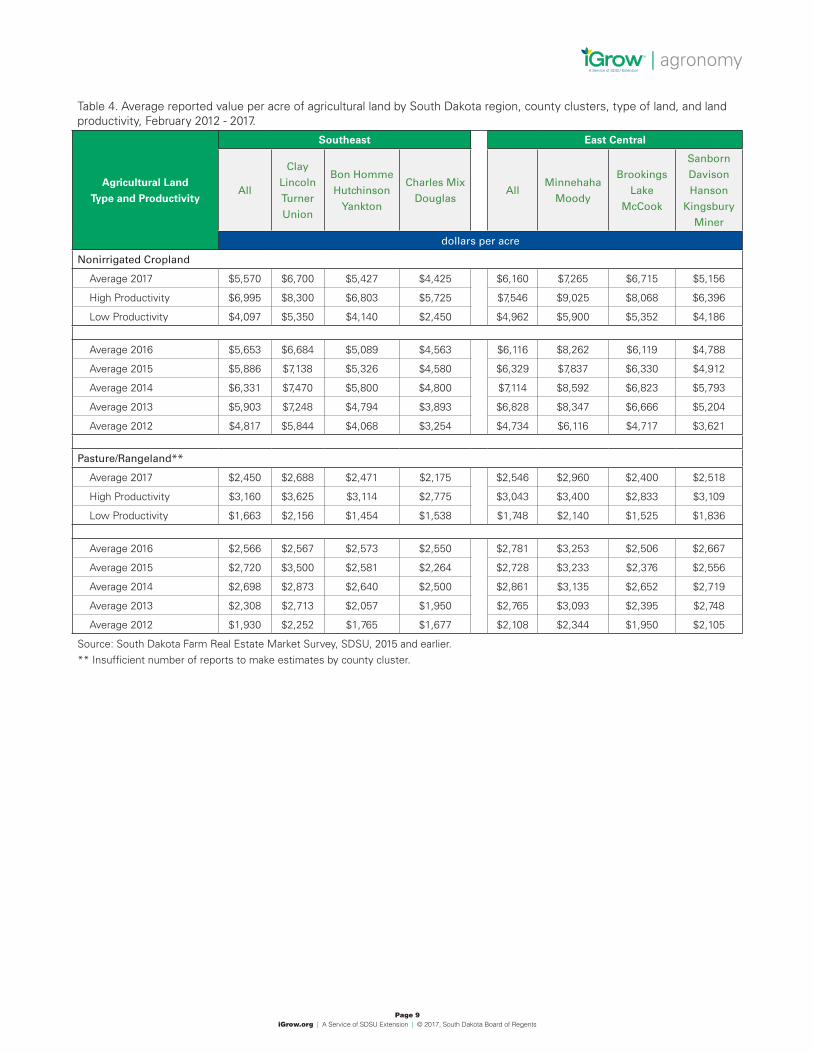
Table 4. Average reported value per acre of agricultural land by South Dakota region, county clusters, type of land, and land productivity, February 2012 - 2017.
Agricultural Land
Type and Productivity
Southeast East Central
All
Clay
Lincoln
Turner
Union
Bon Homme
Hutchinson
Yankton
Charles Mix
DouglasAll
Minnehaha
Moody
Brookings
Lake
McCook
Sanborn
Davison
Hanson
Kingsbury
Miner
dollars per acre
Nonirrigated Cropland
Average 2017 $5,570 $6,700 $5,427 $4,425 $6,160 $7,265 $6,715 $5,156
High Productivity $6,995 $8,300 $6,803 $5,725 $7,546 $9,025 $8,068 $6,396
Low Productivity $4,097 $5,350 $4,140 $2,450 $4,962 $5,900 $5,352 $4,186
Average 2016 $5,653 $6,684 $5,089 $4,563 $6,116 $8,262 $6,119 $4,788
Average 2015 $5,886 $7,138 $5,326 $4,580 $6,329 $7,837 $6,330 $4,912
Average 2014 $6,331 $7,470 $5,800 $4,800 $7,114 $8,592 $6,823 $5,793
Average 2013 $5,903 $7,248 $4,794 $3,893 $6,828 $8,347 $6,666 $5,204
Average 2012 $4,817 $5,844 $4,068 $3,254 $4,734 $6,116 $4,717 $3,621
Pasture/Rangeland**
Average 2017 $2,450 $2,688 $2,471 $2,175 $2,546 $2,960 $2,400 $2,518
High Productivity $3,160 $3,625 $3,114 $2,775 $3,043 $3,400 $2,833 $3,109
Low Productivity $1,663 $2,156 $1,454 $1,538 $1,748 $2,140 $1,525 $1,836
Average 2016 $2,566 $2,567 $2,573 $2,550 $2,781 $3,253 $2,506 $2,667
Average 2015 $2,720 $3,500 $2,581 $2,264 $2,728 $3,233 $2,376 $2,556
Average 2014 $2,698 $2,873 $2,640 $2,500 $2,861 $3,135 $2,652 $2,719
Average 2013 $2,308 $2,713 $2,057 $1,950 $2,765 $3,093 $2,395 $2,748
Average 2012 $1,930 $2,252 $1,765 $1,677 $2,108 $2,344 $1,950 $2,105
Source: South Dakota Farm Real Estate Market Survey, SDSU, 2015 and earlier.** Insufficient number of reports to make estimates by county cluster.
Page 10 iGrow.org | A Service of SDSU Extension | © 2017, South Dakota Board of Regents
| agronomy
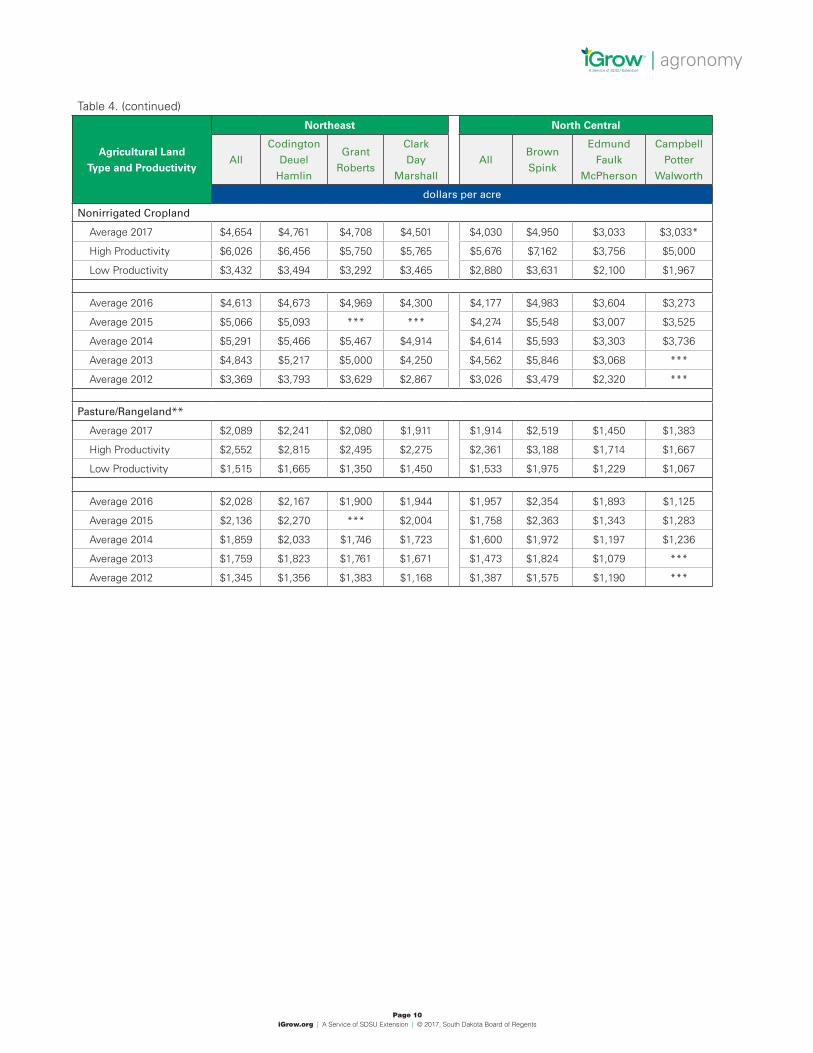
Table 4. (continued)
Agricultural Land
Type and Productivity
Northeast North Central
All
Codington
Deuel
Hamlin
Grant
Roberts
Clark
Day
Marshall
AllBrown
Spink
Edmund
Faulk
McPherson
Campbell
Potter
Walworth
dollars per acre
Nonirrigated Cropland
Average 2017 $4,654 $4,761 $4,708 $4,501 $4,030 $4,950 $3,033 $3,033*
High Productivity $6,026 $6,456 $5,750 $5,765 $5,676 $7,162 $3,756 $5,000
Low Productivity $3,432 $3,494 $3,292 $3,465 $2,880 $3,631 $2,100 $1,967
Average 2016 $4,613 $4,673 $4,969 $4,300 $4,177 $4,983 $3,604 $3,273
Average 2015 $5,066 $5,093 *** *** $4,274 $5,548 $3,007 $3,525
Average 2014 $5,291 $5,466 $5,467 $4,914 $4,614 $5,593 $3,303 $3,736
Average 2013 $4,843 $5,217 $5,000 $4,250 $4,562 $5,846 $3,068 ***
Average 2012 $3,369 $3,793 $3,629 $2,867 $3,026 $3,479 $2,320 ***
Pasture/Rangeland**
Average 2017 $2,089 $2,241 $2,080 $1,911 $1,914 $2,519 $1,450 $1,383
High Productivity $2,552 $2,815 $2,495 $2,275 $2,361 $3,188 $1,714 $1,667
Low Productivity $1,515 $1,665 $1,350 $1,450 $1,533 $1,975 $1,229 $1,067
Average 2016 $2,028 $2,167 $1,900 $1,944 $1,957 $2,354 $1,893 $1,125
Average 2015 $2,136 $2,270 *** $2,004 $1,758 $2,363 $1,343 $1,283
Average 2014 $1,859 $2,033 $1,746 $1,723 $1,600 $1,972 $1,197 $1,236
Average 2013 $1,759 $1,823 $1,761 $1,671 $1,473 $1,824 $1,079 ***
Average 2012 $1,345 $1,356 $1,383 $1,168 $1,387 $1,575 $1,190 ***
Page 11 iGrow.org | A Service of SDSU Extension | © 2017, South Dakota Board of Regents
| agronomy
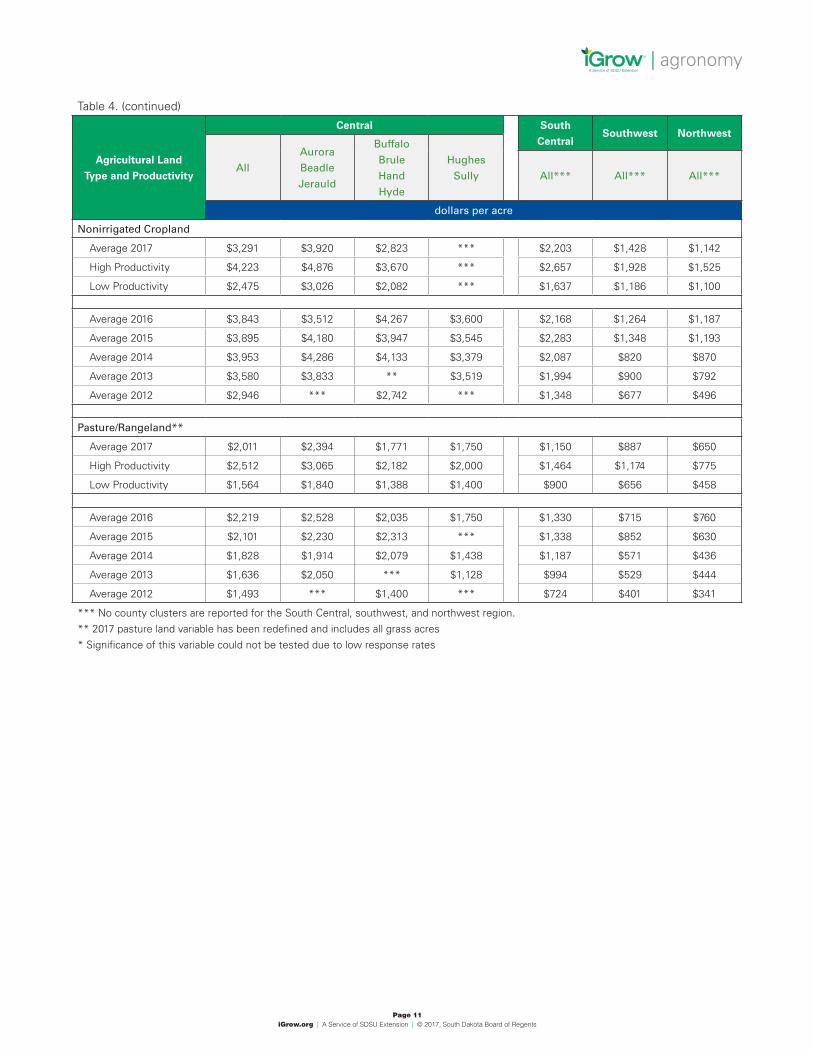
Table 4. (continued)
Agricultural Land
Type and Productivity
Central South
CentralSouthwest Northwest
All
Aurora
Beadle
Jerauld
Buffalo
Brule
Hand
Hyde
Hughes
Sully All*** All*** All***
dollars per acre
Nonirrigated Cropland
Average 2017 $3,291 $3,920 $2,823 *** $2,203 $1,428 $1,142
High Productivity $4,223 $4,876 $3,670 *** $2,657 $1,928 $1,525
Low Productivity $2,475 $3,026 $2,082 *** $1,637 $1,186 $1,100
Average 2016 $3,843 $3,512 $4,267 $3,600 $2,168 $1,264 $1,187
Average 2015 $3,895 $4,180 $3,947 $3,545 $2,283 $1,348 $1,193
Average 2014 $3,953 $4,286 $4,133 $3,379 $2,087 $820 $870
Average 2013 $3,580 $3,833 ** $3,519 $1,994 $900 $792
Average 2012 $2,946 *** $2,742 *** $1,348 $677 $496
Pasture/Rangeland**
Average 2017 $2,011 $2,394 $1,771 $1,750 $1,150 $887 $650
High Productivity $2,512 $3,065 $2,182 $2,000 $1,464 $1,174 $775
Low Productivity $1,564 $1,840 $1,388 $1,400 $900 $656 $458
Average 2016 $2,219 $2,528 $2,035 $1,750 $1,330 $715 $760
Average 2015 $2,101 $2,230 $2,313 *** $1,338 $852 $630
Average 2014 $1,828 $1,914 $2,079 $1,438 $1,187 $571 $436
Average 2013 $1,636 $2,050 *** $1,128 $994 $529 $444
Average 2012 $1,493 *** $1,400 *** $724 $401 $341
*** No county clusters are reported for the South Central, southwest, and northwest region.** 2017 pasture land variable has been redefined and includes all grass acres* Significance of this variable could not be tested due to low response rates

Page 12 iGrow.org | A Service of SDSU Extension | © 2017, South Dakota Board of Regents
| agronomy
Average pasture/rangeland values are highest in the East Central and Southeast regions ($2,546 and $2,450 per-acre, respectively). Pasture values in the next group (Northeast, North Central and Central regions) varied from $1,914 in the North Central region to $2,089 per-acre in the Northeast region. The lowest pasture values per-acre occured in the western side of the state varying from $650 in the Northwest, to $887 in the Southwest, and $1,150 in the South Central region. (Figure 2 and Table 3).
Variation in Land Values By Land Productivity and County ClustersWithin each region and for each non-irrigated agricultural land use, there is considerable variation in land values. In this section, we report the February 2017 per-acre values of average productivity, high-productivity, and low-productivity cropland, and pasture by region and by county clusters within several regions (Table 4). • Minnehaha-Moody cluster has the highest average
cropland value at $7,265 per acre (Table 4)• The Northwest region has the lowest average
cropland value at $1,142 per acre for cropland• No cluster breakouts were available for the South
Central, Southwest and Northwest regions (Table 4)
Substantial variation in per-acre land values occur due to the difference in land productivity in each region as well as other economic factors, such as ease of farming, soil type, etc. (Table 4)• Minnehaha Moody has the highest average
productivity pasture was $2,960 per acre.• In the Northwest region the average value of was
$650 per-acre for pasture/rangeland (Table 4).• No cluster breakouts were available for the South
Central, Southwest and Northwest regions (Table 4).
Pasture/rangeland values varied greatly throughout the state. The values varied based on productivity access to roads, water, facilities, etc.
Rates of Return to South Dakota Agricultural LandThe gross rate of return (gross cash rent as a percent of land value) is used to estimate current rates of return to land. It is calculated from respondent’s reported average cash rental rates and their estimated values of leased land. This is a measure of the gross rate of return obtained by landlords, before deduction of property taxes and other landlord expenses. The 1991 to 2017 trend in the gross cash rent-to-value ratio is depicted in Graph 1.
1.0
2.0
3.0
4.0
5.0
6.0
7.0
8.0
1991
1992
1993
1994
1995
1996
1997
1998
1999
2000
2001
2002
2003
2004
2005
2006
2007
2008
2009
2010
2011
2012
2013
2014
2015
2016
2017
Graph 1. Gross Rent-to-Value Ratio 1991-2017
All agricultural land Non-irrigated cropland Rangeland & pasture
Perc
ent
Page 13 iGrow.org | A Service of SDSU Extension | © 2017, South Dakota Board of Regents
| agronomy
In 2017, the statewide average gross rates of return (rent-to-value ratio) differed somewhat across land use categories:• 2.24% for pasture/rangeland.• 2.70% for non-irrigated cropland.
The annual average gross cash rates of return for pasture/rangeland are the lowest calculated over the past 27 years.
This is the eighth consecutive year that the gross rates of return for cropland has been 4.0% or lower, compared to an average of 5.5% from 2000–2009 and 7.4% during the 1990’s (Graph 1).
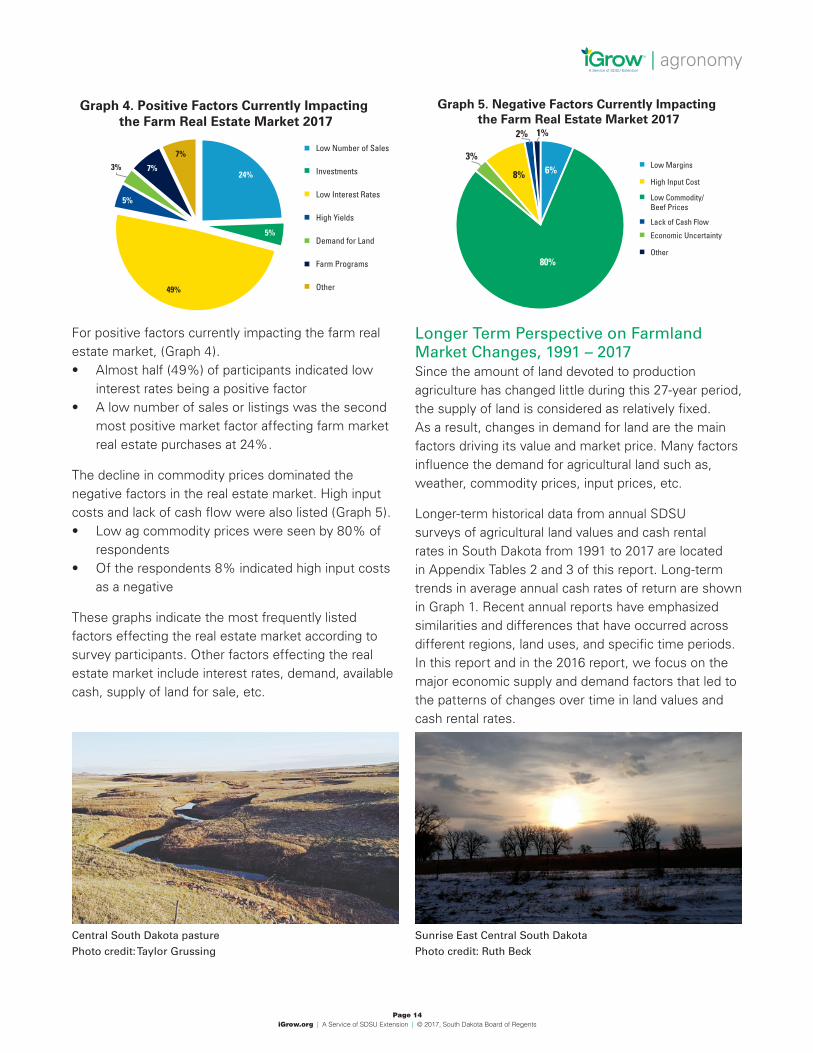
Major Reasons for Purchase and Sale of FarmlandSurvey respondents were asked to provide a list of major reasons for buying and selling agricultural real estate in their localities. Most (over 85%) of the 2017 respondents provided one or more reasons for the purchase or sale of real estate.
From Graph 2, farm location and expansion were the top reasons for purchasing farmland. • Of the total responses, 33% indicated farm
expansion as a key reason for purchasing land,• Purchasing land based on its location accounted for
35% of responses • Buying land as a form of investment accounted for
26% of responses• Other reasons accounted for 6% of responses.
There were several different reasons for sellers offering land for sale. In 2017 estate settlement of farmers and ranchers emerged as the top reason for selling land (Graph 3).• 44% of the total respondents indicated estate
settlement as the most important reason for selling (Graph 3)
• Increasing liquidity and reduced financial stress came in at 32% as the second highest reason
• Retirement accounts for 12% of the reasons for selling land.
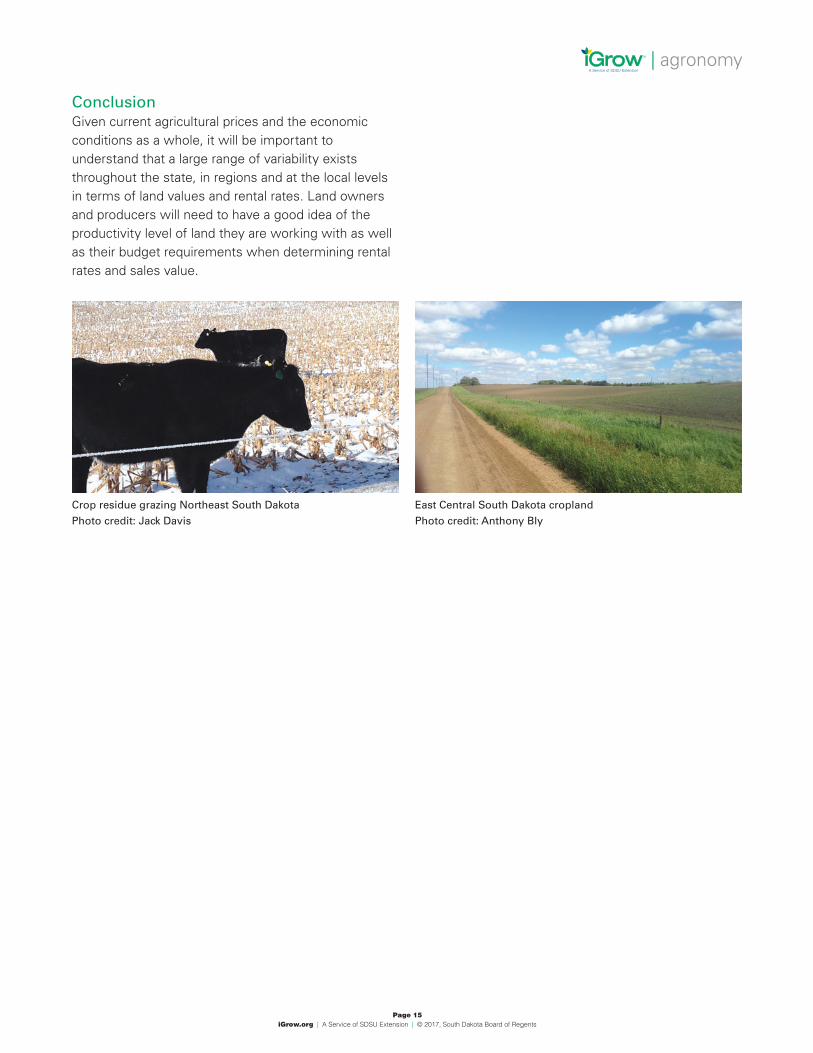
Factors Influencing Farmland Markets in South DakotaRespondents to the 2017 annual survey were asked to list major positive and negative factors affecting the farm real estate market in their localities. These factors play important roles in explaining changes that occurred in the amount of farmland sold in the past year. Also it explained the direction of changes in rental rates and sale prices of farmland. Eighty percent of the survey respondents listed one to three positive or negative reasons (Graph 4).
Southwest South Dakota pasture
Photo credit: Kari O’Neill
Graph 2. The Most Important Reasons Among Buyers for Purchashing Land in the Area 2017
33%
35%
26%
6%
Expansion
Location
Investment
Other
Graph 3. The Most Important Reasons for Sellers Offering Land for Sale in the Area 2017
12%
44%
8%
32%
4%
Retirement
Estate Sales
High Land Values
Increased Liquidity/Reduce Financial Stress
Other
Page 14 iGrow.org | A Service of SDSU Extension | © 2017, South Dakota Board of Regents
| agronomy
For positive factors currently impacting the farm real estate market, (Graph 4).• Almost half (49%) of participants indicated low
interest rates being a positive factor• A low number of sales or listings was the second
most positive market factor affecting farm market real estate purchases at 24%.
The decline in commodity prices dominated the negative factors in the real estate market. High input costs and lack of cash flow were also listed (Graph 5).• Low ag commodity prices were seen by 80% of
respondents• Of the respondents 8% indicated high input costs
as a negative
These graphs indicate the most frequently listed factors effecting the real estate market according to survey participants. Other factors effecting the real estate market include interest rates, demand, available cash, supply of land for sale, etc.
Longer Term Perspective on Farmland Market Changes, 1991 – 2017Since the amount of land devoted to production agriculture has changed little during this 27-year period, the supply of land is considered as relatively fixed. As a result, changes in demand for land are the main factors driving its value and market price. Many factors influence the demand for agricultural land such as, weather, commodity prices, input prices, etc.
Longer-term historical data from annual SDSU surveys of agricultural land values and cash rental rates in South Dakota from 1991 to 2017 are located in Appendix Tables 2 and 3 of this report. Long-term trends in average annual cash rates of return are shown in Graph 1. Recent annual reports have emphasized similarities and differences that have occurred across different regions, land uses, and specific time periods. In this report and in the 2016 report, we focus on the major economic supply and demand factors that led to the patterns of changes over time in land values and cash rental rates.
24%
5%
49%
5%
3% 7%
7%
Graph 4. Positive Factors Currently Impacting the Farm Real Estate Market 2017
Low Number of Sales
Investments
Low Interest Rates
High Yields
Demand for Land
Farm Programs
Other
6%
80%
3%
8%
2% 1%
Graph 5. Negative Factors Currently Impacting the Farm Real Estate Market 2017
Low Margins
Low Commodity/Beef Prices
Economic Uncertainty
High Input Cost
Lack of Cash Flow
Other
Central South Dakota pasture
Photo credit: Taylor Grussing
Sunrise East Central South Dakota
Photo credit: Ruth Beck
Page 15 iGrow.org | A Service of SDSU Extension | © 2017, South Dakota Board of Regents
| agronomy
ConclusionGiven current agricultural prices and the economic conditions as a whole, it will be important to understand that a large range of variability exists throughout the state, in regions and at the local levels in terms of land values and rental rates. Land owners and producers will need to have a good idea of the productivity level of land they are working with as well as their budget requirements when determining rental rates and sales value.
Crop residue grazing Northeast South Dakota
Photo credit: Jack Davis
East Central South Dakota cropland
Photo credit: Anthony Bly
Page 16 iGrow.org | A Service of SDSU Extension | © 2017, South Dakota Board of Regents
| agronomy
List of References **Davis, Jack and Shannon Sand. 2016. South Dakota
agricultural Land Market trends 1991-2016. http://igrow.org/up/resources/07-3004-2016.pdf
Janssen, Larry, Jack Davis, Sarah Adams Inkoom. 2015. South Dakota agricultural land market trends, 1991 – 2015. SDSU Ag Expt. Station Circular 03-7000-2015. https://igrow.org/up/resources/03-7008-2015.pdf
Janssen, Larry; Kim Dillivan, and Bronc McMurtry. 2014. South Dakota agricultural land market trends, 1991 – 2014. SDSU Ag Expt. Station Circular 03-7000-2014. Brookings, http://igrow.org/up/resources/03-7000-2014.pdf
Janssen, Larry; Burton Pflueger, and Bronc McMurtry. 2013. South Dakota agricultural land market trends, 1991 – 2013. SDSU Ag Expt. Station Circular 03-7007-2013. Brookings, http://igrow.org/up/resources/03-7007-2013.pdf
Janssen, Larry and Burton Pflueger. 2012. South Dakota agricultural land market trends, 1991 – 2012. SDSU Ag Expt. Station Circular 03-3007-2012. Brookings, SD. http://igrow.org/up/resources/03-3007-2012.pdf.
U.S. Dept. of Agriculture. 2012 Census of Agriculture, South Dakota. v. 41.
U.S. Dept. of Agriculture. Economic Research Service. Agricultural Productivity in the U.S. http://www.ers.usda.gov/data-products/agricultural-productivity
U.S. Dept. of Agriculture. 2014. National Agricultural Statistics Service. “Land Values: 2014 Summary”, August.
** Reference citations for annual SDSU farm real estate survey reports from 2001 through 2011 are not listed above but were published in print and electronic format. These reports were published as SDSU Agricultural Experiment Station (AES) Circulars 266, 267, 268 269, 270, 271, 272, 273, 275, 276, and 278. Annual reports from 1991 through 2000 were only published in print format. Dr. Janssen and Dr. Pflueger, often in collaboration with an SDSU Economics student, were the co-authors of each annual report from 1991 through 2015.
Page 17 iGrow.org | A Service of SDSU Extension | © 2017, South Dakota Board of Regents
| agronomy
Appendix I: Survey Methods and Response CharacteristicsThe primary purpose of the 2017 South Dakota Farm Real Estate Market Survey was to obtain regional and statewide information on 2017 per-acre agricultural land values and cash rental rates by land use and land productivity. In addition, we obtained respondents’ assessments of positive and negative factors influencing their local farm real estate market and motivations for buyer/seller decisions.
This year marked a year of changes for the SDSU land value survey. The survey was condensed down to incorporate alfalfa hay into crop land and pasture/rangeland now incorporates all grass acres including tame pasture. These changes were made to better reflect the current land use in the state. A post card detailing the changes and a QR code and written link was sent to 600 potential respondents at the end of February 2017, with a follow-up email two weeks after and an additional email the end of March. The survey links were also posted in the South Dakota Banker’s Association Newsletters and the American Society for Farm Management and Rural Appraisal (ASFMRA).
Potential respondents were persons employed in one of the following occupations: 1) agricultural lenders (senior agricultural loan officers of commercial banks or Farm Credit Service), 2) loan officers or county directors of the USDA Farm Service Agency (FSA), 3) Extension Service agricultural field specialists, and 4) licensed appraisers and assessors. Some appraisers were also realtors or professional farm managers, while some lenders were also appraisers.
Respondents were asked to report land values and cash rental rate information for non-irrigated cropland, rangeland/pastureland. Nearly one-third of respondents reported land market information for at least two counties. The number of responses exceeded the number of respondents as some persons (primarily appraisers and lenders) completed multiple survey schedules providing different land value and cash rental data for different counties in their trade territory. Overall, a total of 167 respondents provided 282 useable responses.
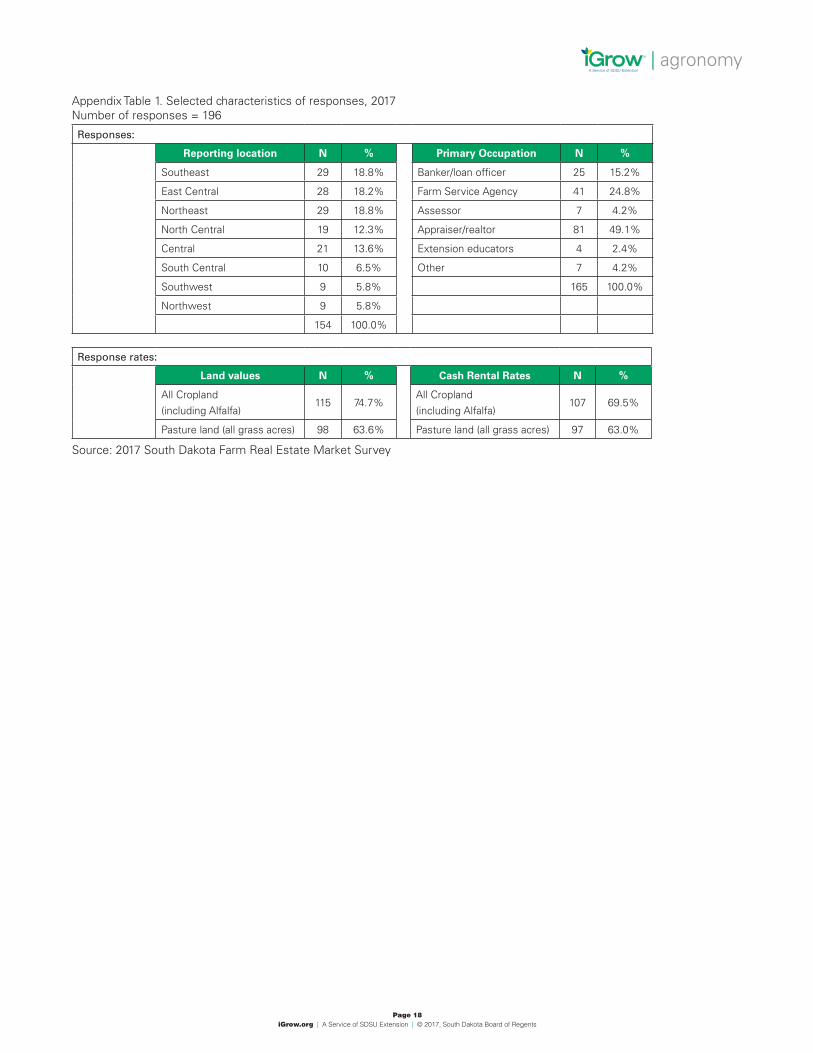
While 167 surveys were received and used there was only location data available for 154. The distribution of 154 survey respondents is summarized by location. Of the 167 respondents received 165 indicated their occupation (appendix table 1).
Regional average land values by land use are simple average (mean) values of usable responses. Statewide average land values by land use are weighted by the relative number of acres in each region in the same land use. All-agricultural land values, regional and statewide, are weighted by the proportion of acres in each agricultural land use. Thus all-agricultural land values in this report are weighted average values by region and land use. This weighted average approach is analogous to the cost (inventory) approach of estimating farmland values in rural land appraisal.
This approach has important implications in the derivation of statewide average land values and regional all-land values. For example, the two western regions of South Dakota with the lowest average land values have nearly 61% of the state’s rangeland acres, 39% of all-agricultural land acres, and only 16% of cropland acres. Our approach increases the relative importance of western South Dakota land values in the final computations and results in lower statewide average land values.
The weighting factors used to develop statewide average land values are based on estimates of non-irrigated agricultural land use for privately owned farmland in South Dakota. It excludes agricultural land (mostly rangeland) leased from tribal or federal agencies, which is mostly located in the western and Central regions of the state. Irrigated land is also excluded from regional and statewide all-land values. The land-use weighting factors were developed from county-level data in the 2002 South Dakota Census of Agriculture and other sources.
Regional average rental rates by land use are simple average (mean) values of useable responses. Statewide average cash rental rates for each land use are weighted by 1) the relative number of acres in each land use and 2) the proportion of farmland acres leased in each region based on 2002 Census of Agriculture data.
Page 18 iGrow.org | A Service of SDSU Extension | © 2017, South Dakota Board of Regents
| agronomy
Appendix Table 1. Selected characteristics of responses, 2017Number of responses = 196
Responses:
Reporting location N % Primary Occupation N %
Southeast 29 18.8% Banker/loan officer 25 15.2%
East Central 28 18.2% Farm Service Agency 41 24.8%
Northeast 29 18.8% Assessor 7 4.2%
North Central 19 12.3% Appraiser/realtor 81 49.1%
Central 21 13.6% Extension educators 4 2.4%
South Central 10 6.5% Other 7 4.2%
Southwest 9 5.8% 165 100.0%
Northwest 9 5.8%
154 100.0%
Response rates:
Land values N % Cash Rental Rates N %
All Cropland (including Alfalfa)
115 74.7%All Cropland (including Alfalfa)
107 69.5%
Pasture land (all grass acres) 98 63.6% Pasture land (all grass acres) 97 63.0%
Source: 2017 South Dakota Farm Real Estate Market Survey
Page 19 iGrow.org | A Service of SDSU Extension | © 2017, South Dakota Board of Regents
| agronomy
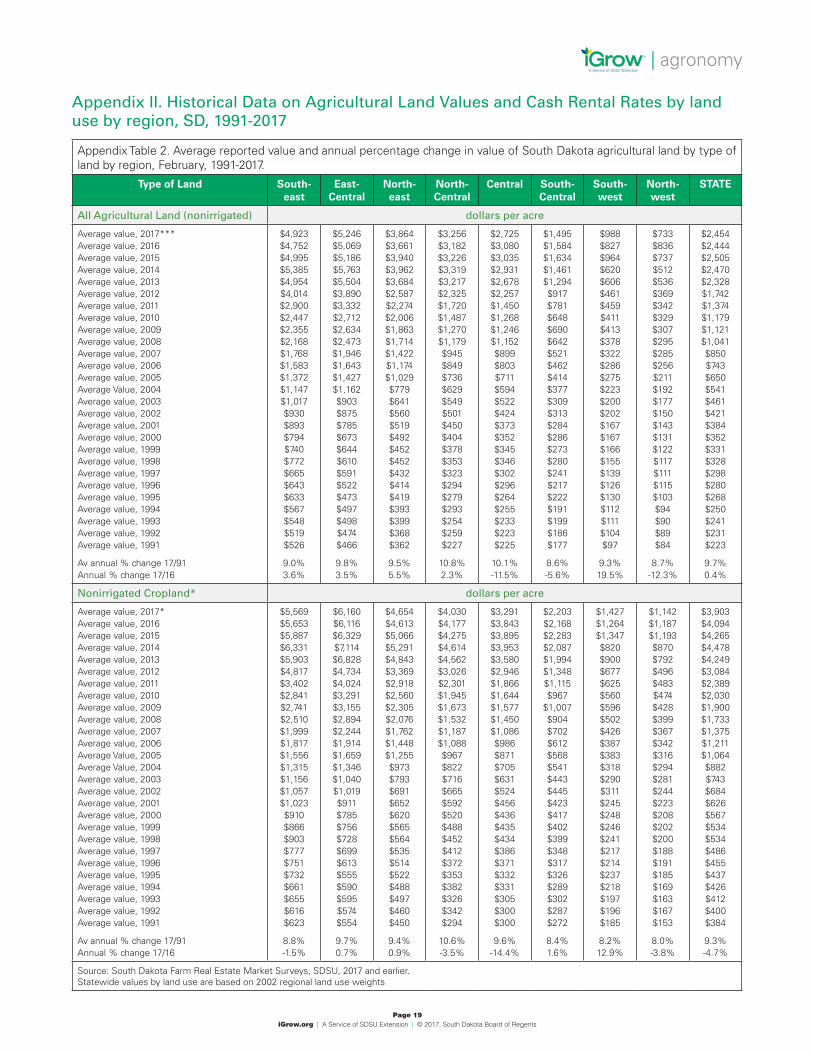
Appendix II. Historical Data on Agricultural Land Values and Cash Rental Rates by land use by region, SD, 1991-2017
Appendix Table 2. Average reported value and annual percentage change in value of South Dakota agricultural land by type of land by region, February, 1991-2017.
Type of Land South-east
East-Central
North-east
North-Central
Central South-Central
South-west
North-west
STATE
All Agricultural Land (nonirrigated) dollars per acre
Average value, 2017***Average value, 2016Average value, 2015Average value, 2014Average value, 2013Average value, 2012Average value, 2011Average value, 2010Average value, 2009Average value, 2008Average value, 2007Average value, 2006Average value, 2005Average Value, 2004Average value, 2003Average value, 2002Average value, 2001Average value, 2000Average value, 1999Average value, 1998Average value, 1997Average value, 1996Average value, 1995Average value, 1994Average value, 1993Average value, 1992Average value, 1991
Av annual % change 17/91Annual % change 17/16
$4,923$4,752$4,995$5,385$4,954$4,014$2,900$2,447$2,355$2,168$1,768$1,583$1,372$1,147$1,017$930$893$794$740$772$665$643$633$567$548$519$526
9.0%3.6%
$5,246$5,069$5,186$5,763$5,504$3,890$3,332$2,712$2,634$2,473$1,946$1,643$1,427$1,162$903$875$785$673$644$610$591$522$473$497$498$474$466
9.8%3.5%
$3,864$3,661$3,940$3,962$3,684$2,587$2,274$2,006$1,863$1,714$1,422$1,174$1,029$779$641$560$519$492$452$452$432$414$419$393$399$368$362
9.5%5.5%
$3,256$3,182$3,226$3,319$3,217$2,325$1,720$1,487$1,270$1,179$945$849$736$629$549$501$450$404$378$353$323$294$279$293$254$259$227
10.8%2.3%
$2,725$3,080$3,035$2,931$2,678$2,257$1,450$1,268$1,246$1,152$899$803$711$594$522$424$373$352$345$346$302$296$264$255$233$223$225
10.1%-11.5%
$1,495$1,584$1,634$1,461$1,294$917$781$648$690$642$521$462$414$377$309$313$284$286$273$280$241$217$222$191$199$186$177
8.6%-5.6%
$988$827$964$620$606$461$459$411$413$378$322$286$275$223$200$202$167$167$166$155$139$126$130$112$111$104$97
9.3%19.5%
$733$836$737$512$536$369$342$329$307$295$285$256$211$192$177$150$143$131$122$117$111$115$103$94$90$89$84
8.7%-12.3%
$2,454$2,444$2,505$2,470$2,328$1,742$1,374$1,179$1,121$1,041$850$743$650$541$461$421$384$352$331$328$298$280$268$250$241$231$223
9.7%0.4%
Nonirrigated Cropland* dollars per acre
Average value, 2017*Average value, 2016Average value, 2015Average value, 2014Average value, 2013Average value, 2012Average value, 2011Average value, 2010Average value, 2009Average value, 2008Average value, 2007Average value, 2006Average Value, 2005Average Value, 2004Average value, 2003Average value, 2002Average value, 2001Average value, 2000Average value, 1999Average value, 1998Average value, 1997Average value, 1996Average value, 1995Average value, 1994Average value, 1993Average value, 1992Average value, 1991
Av annual % change 17/91Annual % change 17/16
$5,569$5,653$5,887$6,331$5,903$4,817$3,402$2,841$2,741$2,510$1,999$1,817$1,556$1,315$1,156$1,057$1,023$910$866$903$777$751$732$661$655$616$623
8.8%-1.5%
$6,160$6,116$6,329$7,114$6,828$4,734$4,024$3,291$3,155$2,894$2,244$1,914$1,659$1,346$1,040$1,019$911$785$756$728$699$613$555$590$595$574$554
9.7%0.7%
$4,654$4,613$5,066$5,291$4,843$3,369$2,918$2,560$2,305$2,076$1,762$1,448$1,255$973$793$691$652$620$565$564$535$514$522$488$497$460$450
9.4%0.9%
$4,030$4,177$4,275$4,614$4,562$3,026$2,301$1,945$1,673$1,532$1,187$1,088$967$822$716$665$592$520$488$452$412$372$353$382$326$342$294
10.6%-3.5%
$3,291$3,843$3,895$3,953$3,580$2,946$1,866$1,644$1,577$1,450$1,086$986$871$705$631$524$456$436$435$434$386$371$332$331$305$300$300
9.6%-14.4%
$2,203$2,168$2,283$2,087$1,994$1,348$1,115$967
$1,007$904$702$612$568$541$443$445$423$417$402$399$348$317$326$289$302$287$272
8.4%1.6%
$1,427$1,264$1,347$820$900$677$625$560$596$502$426$387$383$318$290$311$245$248$246$241$217$214$237$218$197$196$185
8.2%12.9%
$1,142$1,187$1,193$870$792$496$483$474$428$399$367$342$316$294$281$244$223$208$202$200$188$191$185$169$163$167$153
8.0%-3.8%
$3,903$4,094$4,265$4,478$4,249$3,084$2,389$2,030$1,900$1,733$1,375$1,211$1,064$882$743$684$626$567$534$534$486$455$437$426$412$400$384
9.3%-4.7%
Source: South Dakota Farm Real Estate Market Surveys, SDSU, 2017 and earlier. Statewide values by land use are based on 2002 regional land use weights

Page 20 iGrow.org | A Service of SDSU Extension | © 2017, South Dakota Board of Regents
| agronomy
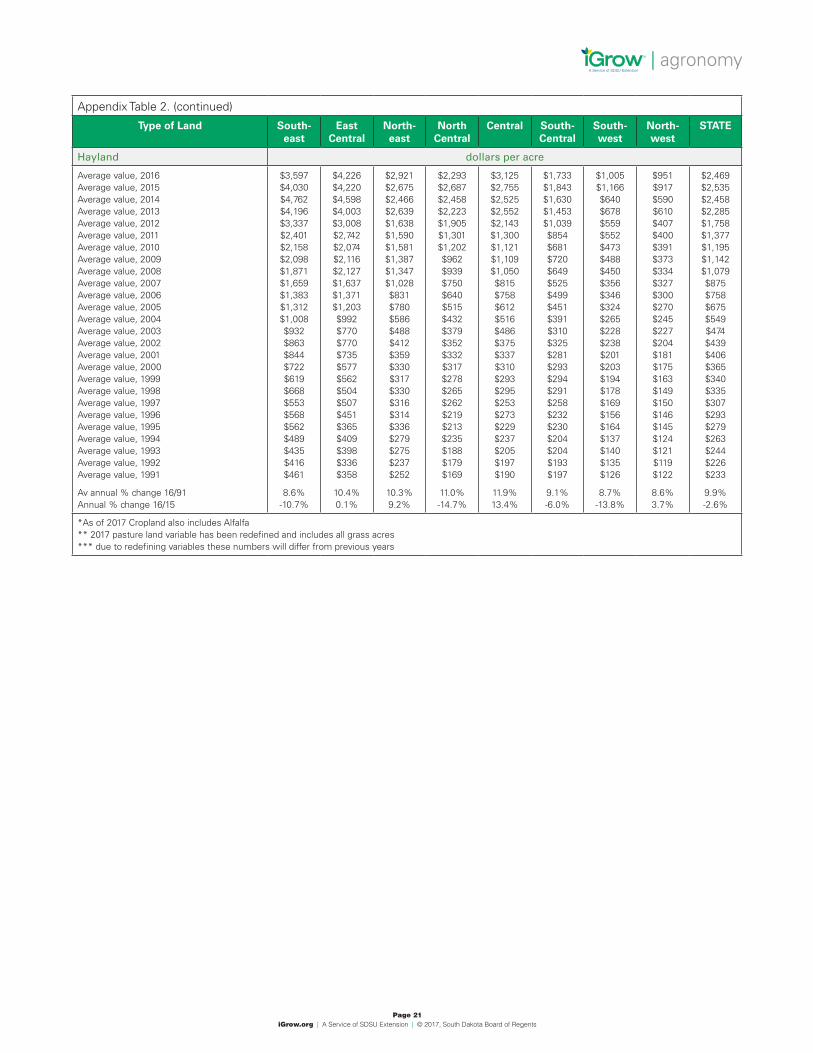
Appendix Table 2. (continued)
Type of Land South-east
East-Central
North-east
North-Central
Central South-Central
South-west
North-west
STATE
Pasture (all grass)** dollars per acre
Average value, 2017Average value, 2016Average value, 2015Average value, 2014Average value, 2013Average value, 2012Average value, 2011Average value, 2010Average value, 2009Average value, 2008Average value, 2007Average value, 2006Average value, 2005Average value, 2004Average value, 2003Average value, 2002Average value, 2001Average value, 2000Average value, 1999Average value, 1998Average value, 1997Average value, 1996Average value, 1995Average value, 1994Average value, 1993Average value, 1992Average value, 1991
Av annual % change 17/91Annual % change 17/16
$2,450$2,566$2,719$2,698$2,308$1,930$1,589$1,339$1,258$1,239$1,073$925$781$684$609$538$488$456$405$408$364$336$354$319$283$271$268
8.9%-4.5%
$2,531$2,781$2,727$2,861$2,765$2,108$1,779$1,536$1,458$1,539$1,293$1,055$844$764$580$543$478$417$386$346$354$311$303$283$276$267$271
9.0%-9.0%
$2,089$2,028$2,136$1,859$1,759$1,345$1,217$1,070$1,125$1,100$889$751$667$465$389$353$315$297$276$274$268$250$247$228$232$209$205
9.3%3.0%
$1,914$1,957$1,758$1,600$1,473$1,387$950$875$755$714$634$548$458$396$345$297$270$253$241$226$204$194$184$184$169$163$147
10.4%-2.2%
$2,011$2,219$2,100$1,828$1,636$1,493$1,011$865$898$836$708$599$552$456$397$325$284$265$255$256$214$214$197$190$175$159$163
10.1%-9.4%
$1,350$1,330$1,338$1,187$994$724$634$514$570$544$448$397$346$312$257$260$232$235$220$231$197$177$180$149$157$145$137
9.2%1.5%
$887$715$851$571$529$401$409$365$358$339$295$255$241$196$176$172$143$143$143$130$116$100$101$85$89$80$74
10.0%24.1%
$650$760$630$436$444$341$309$296$277$271$265$234$185$167$153$127$124$111$102$98$92$97$83$80$76$74$69
9.0%-14.5%
$1,237$1,222$1,187$987$909$737$611$540$530$508$448$386$332$283$246$221$198$187$177$172$155$147$140$128$125$117$112
9.7%1.2%
Pasture (tame, improved) dollars per acre
Average value, 2016Average value, 2015Average value, 2014Average value, 2013Average value, 2012Average value, 2011Average value, 2010Average value, 2009Average value, 2008Average value, 2007Average value, 2006Average Value, 2005Average Value, 2004Average value, 2003Average value, 2002Average value, 2001Average value, 2000Average value, 1999Average value, 1998Average value, 1997Average value, 1996Average value, 1995Average value, 1994Average value, 1993Average value, 1992Average value, 1991
Av annual % change 16/91Annual % change 16/15
$2,811$2,945$2,968$2,721$2,275$1,726$1,480$1,378$1,365$1,167$1,085$937$754$683$639$564$516$453$461$416$379$385$371$326$328$315
9.1%-4.6%
$2,988$2,908$3,098$3,176$2,371$2,082$1,629$1,802$1,675$1,461$1,166$1,018$818$710$607$522$481$437$406$373$358$346$335$333$306$325
9.3%2.8%
$2,309$2,545$2,244$2,074$1,678$1,494$1,178$1,373$1,304$987$843$730$517$448$391$342$334$314$297$299$279$262$251$249$257$252
9.3%-9.3%
$2,067$2,224$1,958$1,778$1,550$1,161$991$827$795$698$598$465$424$389$327$301$289$266$264$236$231$218$200$194$194$170
10.5%-7.1%
$2,320$2,557$2,220$2,222$1,772$1,179$1,061$1,042$943$760$711$610$518$493$345$332$303$290$302$265$258$214$224$194$190$199
10.3%-9.3%
$1,431$1,500$1,309$1,129$844$762$650$571$571$524$425$397$337$294$287$258$268$240$272$222$188$214$194$193$176$163
9.1%-4.6%
$712$943$596$571$431$465$429$429$384$303$283$291$217$191$193$176$167$161$161$138$127$117$109$104$100$92
8.5%-24.5%
$802$769$483$523$373$344$320$314$307$297$282$227$198$163$156$153$144$125$120$114$115$102$93$98$88$94
9.0%4.3%
$1,704$1,820$1,603$1,542$1,218$1,011$854$857$809$684$596$519$420$372$327$297$279$256$254$230$217$206$196$188$182$179
9.4%-6.4%
Page 21 iGrow.org | A Service of SDSU Extension | © 2017, South Dakota Board of Regents
| agronomy
Appendix Table 2. (continued)
Type of Land South-east
EastCentral
North-east
NorthCentral
Central South-Central
South-west
North-west
STATE
Hayland dollars per acre
Average value, 2016Average value, 2015Average value, 2014Average value, 2013Average value, 2012Average value, 2011Average value, 2010Average value, 2009Average value, 2008Average value, 2007Average value, 2006Average value, 2005Average value, 2004Average value, 2003Average value, 2002Average value, 2001Average value, 2000Average value, 1999Average value, 1998Average value, 1997Average value, 1996Average value, 1995Average value, 1994Average value, 1993Average value, 1992Average value, 1991
Av annual % change 16/91Annual % change 16/15
$3,597$4,030$4,762$4,196$3,337$2,401$2,158$2,098$1,871$1,659$1,383$1,312$1,008$932$863$844$722$619$668$553$568$562$489$435$416$461
8.6%-10.7%
$4,226$4,220$4,598$4,003$3,008$2,742$2,074$2,116$2,127$1,637$1,371$1,203$992$770$770$735$577$562$504$507$451$365$409$398$336$358
10.4%0.1%
$2,921$2,675$2,466$2,639$1,638$1,590$1,581$1,387$1,347$1,028$831$780$586$488$412$359$330$317$330$316$314$336$279$275$237$252
10.3%9.2%
$2,293$2,687$2,458$2,223$1,905$1,301$1,202$962$939$750$640$515$432$379$352$332$317$278$265$262$219$213$235$188$179$169
11.0%-14.7%
$3,125$2,755$2,525$2,552$2,143$1,300$1,121$1,109$1,050$815$758$612$516$486$375$337$310$293$295$253$273$229$237$205$197$190
11.9%13.4%
$1,733$1,843$1,630$1,453$1,039$854$681$720$649$525$499$451$391$310$325$281$293$294$291$258$232$230$204$204$193$197
9.1%-6.0%
$1,005$1,166$640$678$559$552$473$488$450$356$346$324$265$228$238$201$203$194$178$169$156$164$137$140$135$126
8.7%-13.8%
$951$917$590$610$407$400$391$373$334$327$300$270$245$227$204$181$175$163$149$150$146$145$124$121$119$122
8.6%3.7%
$2,469$2,535$2,458$2,285$1,758$1,377$1,195$1,142$1,079$875$758$675$549$474$439$406$365$340$335$307$293$279$263$244$226$233
9.9%-2.6%
*As of 2017 Cropland also includes Alfalfa** 2017 pasture land variable has been redefined and includes all grass acres*** due to redefining variables these numbers will differ from previous years
Page 22 iGrow.org | A Service of SDSU Extension | © 2017, South Dakota Board of Regents
| agronomy
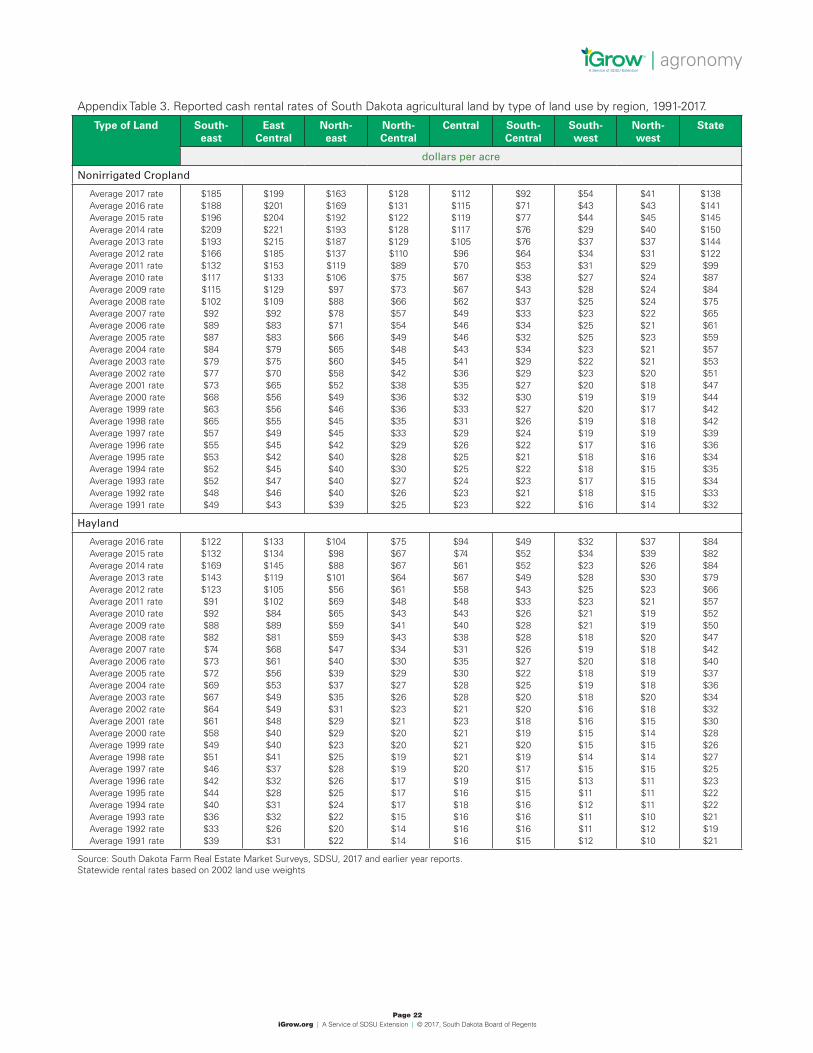
Appendix Table 3. Reported cash rental rates of South Dakota agricultural land by type of land use by region, 1991-2017.
Type of Land South-east
EastCentral
North-east
North-Central
Central South-Central
South-west
North-west
State
dollars per acre
Nonirrigated Cropland
Average 2017 rateAverage 2016 rateAverage 2015 rateAverage 2014 rateAverage 2013 rateAverage 2012 rateAverage 2011 rateAverage 2010 rateAverage 2009 rateAverage 2008 rateAverage 2007 rateAverage 2006 rateAverage 2005 rateAverage 2004 rateAverage 2003 rateAverage 2002 rateAverage 2001 rateAverage 2000 rateAverage 1999 rateAverage 1998 rateAverage 1997 rateAverage 1996 rateAverage 1995 rateAverage 1994 rateAverage 1993 rateAverage 1992 rateAverage 1991 rate
$185 $188 $196 $209 $193 $166 $132 $117 $115 $102 $92 $89 $87 $84 $79 $77 $73 $68 $63 $65 $57 $55 $53 $52 $52 $48 $49
$199 $201 $204 $221 $215 $185 $153 $133 $129 $109 $92 $83 $83 $79 $75 $70 $65 $56 $56 $55 $49 $45 $42 $45 $47 $46 $43
$163 $169 $192 $193 $187 $137 $119 $106 $97 $88 $78 $71 $66 $65 $60 $58 $52 $49 $46 $45 $45 $42 $40 $40 $40 $40 $39
$128 $131 $122 $128 $129 $110 $89 $75 $73 $66 $57 $54 $49 $48 $45 $42 $38 $36 $36 $35 $33 $29 $28 $30 $27 $26 $25
$112 $115 $119 $117 $105 $96 $70 $67 $67 $62 $49 $46 $46 $43 $41 $36 $35 $32 $33 $31 $29 $26 $25 $25 $24 $23 $23
$92 $71 $77 $76 $76 $64 $53 $38 $43 $37 $33 $34 $32 $34 $29 $29 $27 $30 $27 $26 $24 $22 $21 $22 $23 $21 $22
$54 $43 $44 $29 $37 $34 $31 $27 $28 $25 $23 $25 $25 $23 $22 $23 $20 $19 $20 $19 $19 $17 $18 $18 $17 $18 $16
$41 $43 $45 $40 $37 $31 $29 $24 $24 $24 $22 $21 $23 $21 $21 $20 $18 $19 $17 $18 $19 $16 $16 $15 $15 $15 $14
$138 $141 $145 $150 $144 $122 $99 $87 $84 $75 $65 $61 $59 $57 $53 $51 $47 $44 $42 $42 $39 $36 $34 $35 $34 $33 $32
Hayland
Average 2016 rateAverage 2015 rateAverage 2014 rateAverage 2013 rateAverage 2012 rateAverage 2011 rateAverage 2010 rateAverage 2009 rateAverage 2008 rateAverage 2007 rateAverage 2006 rateAverage 2005 rateAverage 2004 rateAverage 2003 rateAverage 2002 rateAverage 2001 rateAverage 2000 rateAverage 1999 rateAverage 1998 rateAverage 1997 rateAverage 1996 rateAverage 1995 rateAverage 1994 rateAverage 1993 rateAverage 1992 rateAverage 1991 rate
$122 $132 $169 $143 $123 $91 $92 $88 $82 $74 $73 $72 $69 $67 $64 $61 $58 $49 $51 $46 $42 $44 $40 $36 $33 $39
$133 $134 $145 $119 $105 $102 $84 $89 $81 $68 $61 $56 $53 $49 $49 $48 $40 $40 $41 $37 $32 $28 $31 $32 $26 $31
$104 $98 $88 $101 $56 $69 $65 $59 $59 $47 $40 $39 $37 $35 $31 $29 $29 $23 $25 $28 $26 $25 $24 $22 $20 $22
$75 $67 $67 $64 $61 $48 $43 $41 $43 $34 $30 $29 $27 $26 $23 $21 $20 $20 $19 $19 $17 $17 $17 $15 $14 $14
$94 $74 $61 $67 $58 $48 $43 $40 $38 $31 $35 $30 $28 $28 $21 $23 $21 $21 $21 $20 $19 $16 $18 $16 $16 $16
$49 $52 $52 $49 $43 $33 $26 $28 $28 $26 $27 $22 $25 $20 $20 $18 $19 $20 $19 $17 $15 $15 $16 $16 $16 $15
$32 $34 $23 $28 $25 $23 $21 $21 $18 $19 $20 $18 $19 $18 $16 $16 $15 $15 $14 $15 $13 $11 $12 $11 $11 $12
$37 $39 $26 $30 $23 $21 $19 $19 $20 $18 $18 $19 $18 $20 $18 $15 $14 $15 $14 $15 $11 $11 $11 $10 $12 $10
$84 $82 $84 $79 $66 $57 $52 $50 $47 $42 $40 $37 $36 $34 $32 $30 $28 $26 $27 $25 $23 $22 $22 $21 $19 $21
Source: South Dakota Farm Real Estate Market Surveys, SDSU, 2017 and earlier year reports.Statewide rental rates based on 2002 land use weights
Page 23 iGrow.org | A Service of SDSU Extension | © 2017, South Dakota Board of Regents
| agronomy
Publication: 07-3007-2017
South Dakota State University, South Dakota counties, and USDA cooperating. South Dakota State University adheres to AA/EEO guidelines in offering educational programs and services.
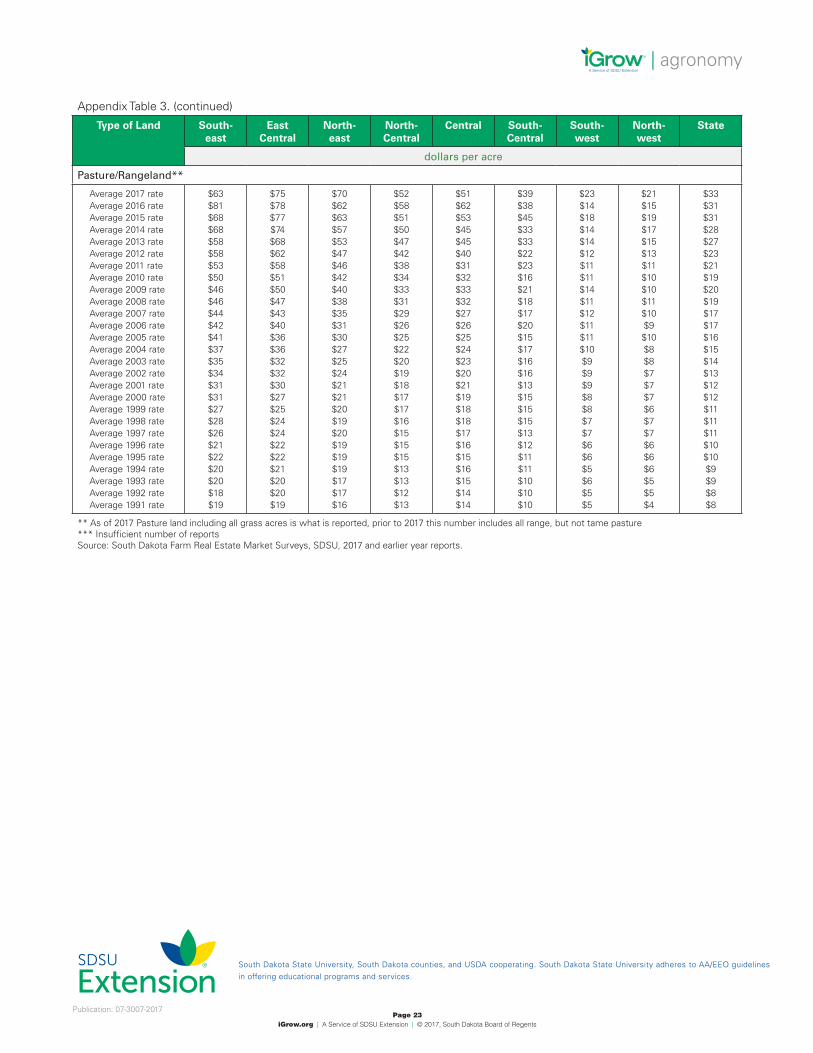
Appendix Table 3. (continued)
Type of Land South-east
EastCentral
North-east
North-Central
Central South-Central
South-west
North-west
State
dollars per acre
Pasture/Rangeland**
Average 2017 rateAverage 2016 rateAverage 2015 rateAverage 2014 rateAverage 2013 rateAverage 2012 rateAverage 2011 rateAverage 2010 rateAverage 2009 rateAverage 2008 rateAverage 2007 rateAverage 2006 rateAverage 2005 rateAverage 2004 rateAverage 2003 rateAverage 2002 rateAverage 2001 rateAverage 2000 rateAverage 1999 rateAverage 1998 rateAverage 1997 rateAverage 1996 rateAverage 1995 rateAverage 1994 rateAverage 1993 rateAverage 1992 rateAverage 1991 rate
$63$81$68$68$58$58$53$50$46$46$44$42$41$37$35$34$31$31$27$28$26$21$22$20$20$18$19
$75$78$77$74$68$62$58$51$50$47$43$40$36$36$32$32$30$27$25$24$24$22$22$21$20$20$19
$70$62$63$57$53$47$46$42$40$38$35$31$30$27$25$24$21$21$20$19$20$19$19$19$17$17$16
$52$58$51$50$47$42$38$34$33$31$29$26$25$22$20$19$18$17$17$16$15$15$15$13$13$12$13
$51$62$53$45$45$40$31$32$33$32$27$26$25$24$23$20$21$19$18$18$17$16$15$16$15$14$14
$39$38$45$33$33$22$23$16$21$18$17$20$15$17$16$16$13$15$15$15$13$12$11$11$10$10$10
$23$14$18$14$14$12$11$11$14$11$12$11$11$10$9$9$9$8$8$7$7$6$6$5$6$5$5
$21$15$19$17$15$13$11$10$10$11$10$9$10$8$8$7$7$7$6$7$7$6$6$6$5$5$4
$33$31$31$28$27$23$21$19$20$19$17$17$16$15$14$13$12$12$11$11$11$10$10$9$9$8$8
** As of 2017 Pasture land including all grass acres is what is reported, prior to 2017 this number includes all range, but not tame pasture*** Insufficient number of reportsSource: South Dakota Farm Real Estate Market Surveys, SDSU, 2017 and earlier year reports.