South Carolina High Temperature Record Evaluation:...
64
Prepared by: August 2012 South Carolina State Climatology Office Leonard Vaughan Meteorologist Climate Service Program Manager National Weather Service, Columbia, SC Wes Tyler Assistant State Climatologist for Service SC State Climatology Office SC Department of Natural Resources, Columbia, SC Columbia, SC South Carolina High Temperature Record Evaluation: NWS Cooperative sites reporting 113 °F, June 29, 2012
-
Upload
hoangkhanh -
Category
Documents
-
view
217 -
download
0
Transcript of South Carolina High Temperature Record Evaluation:...

Prepared by:
August 2012
South Carolina
State Climatology Office
Leonard Vaughan
Meteorologist Climate Service Program Manager National Weather Service, Columbia, SC
Wes Tyler
Assistant State Climatologist for Service SC State Climatology Office SC Department of Natural Resources, Columbia, SC
Columbia, SC
South Carolina High Temperature
Record Evaluation: NWS Cooperative
sites reporting 113 °F, June 29, 2012
Contents
Introduction .................................................................................................................................................. 1
Johnston history and site visit, July 3, 2012 ................................................................................................. 2
Local NWS COOP and AP temperatures, June 29, 2012 ............................................................................... 5
Aiken, SC AP observations, July 3, 2012 ........................................................................................................ 8
July 26, 2012:
Johnston visit to determine observation method and compare thermometers ................................... 10
Aiken, SC AP observations ...................................................................................................................... 13
Johnston/West Central Division 1983 and 2007 high temperatures.......................................................... 18
July 10-11, 2012 Johnston questionable maximum temperature .............................................................. 19
Columbia USC history and site visit, July 7, 2012 ....................................................................................... 21
Columbia Hamilton-Owens AP observations, June 29, 2012 ...................................................................... 24
July 12, 2012:
USC visit to determine observation method .......................................................................................... 27
Explanation of USC on-site monitors ...................................................................................................... 28
USC Department of Geography and DHEC temperature observations, June 29, 2012 .............................. 29
July 24, 2012: USC visit to compare State Climatology Office and DHEC thermometers ............................................. 31
USC Department of Geography temperature trace ............................................................................... 36
Columbia Hamilton-Owens AP observations ......................................................................................... 37
Columbia NWS synoptic presentation ........................................................................................................ 39
NCDC State Climate Extremes Committee.................................................................................................. 47
NWS Service Manual for Cooperative Station Observations ...................................................................... 52
Summary Findings ....................................................................................................................................... 55
Acknowledgements ..................................................................................................................................... 57
1
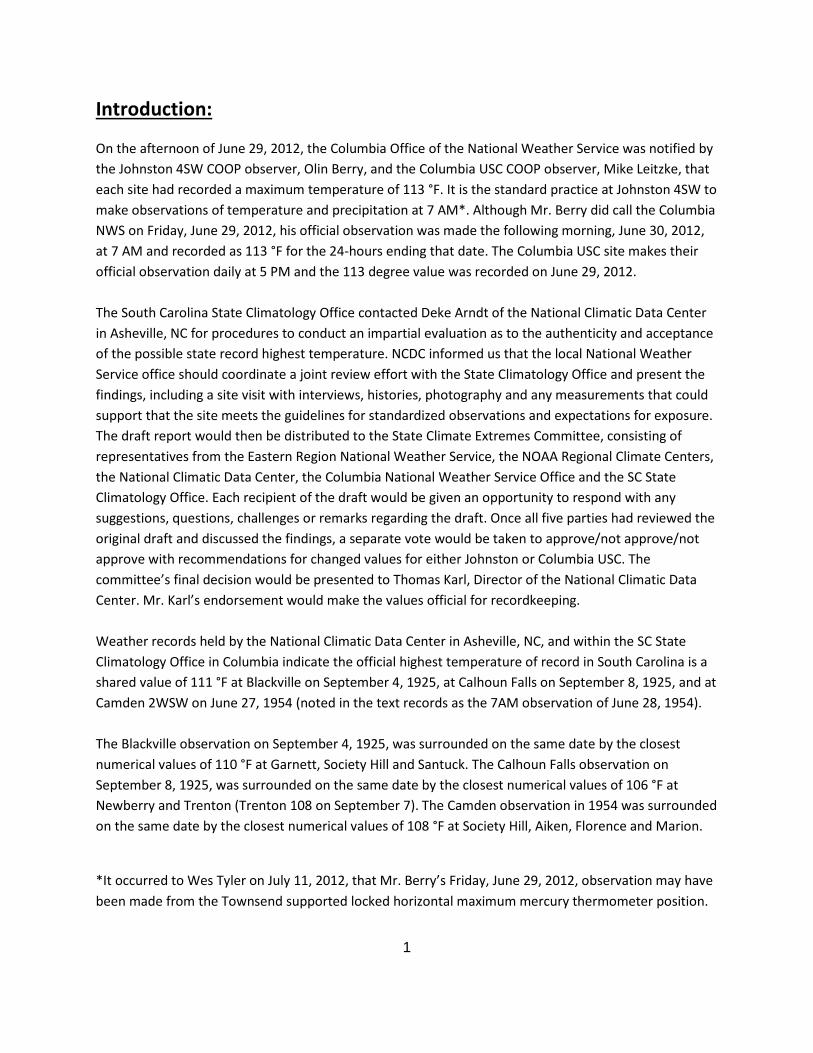
Introduction:
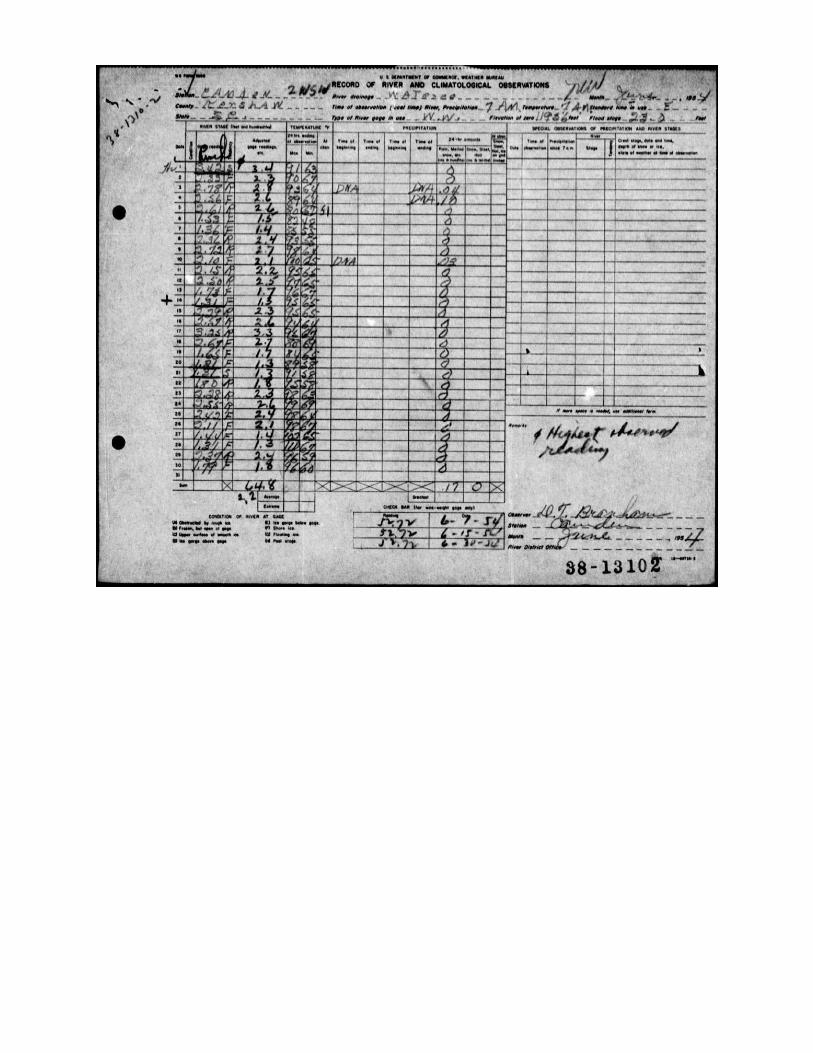
On the afternoon of June 29, 2012, the Columbia Office of the National Weather Service was notified by the Johnston 4SW COOP observer, Olin Berry, and the Columbia USC COOP observer, Mike Leitzke, that each site had recorded a maximum temperature of 113 °F. It is the standard practice at Johnston 4SW to make observations of temperature and precipitation at 7 AM*. Although Mr. Berry did call the Columbia NWS on Friday, June 29, 2012, his official observation was made the following morning, June 30, 2012, at 7 AM and recorded as 113 °F for the 24-hours ending that date. The Columbia USC site makes their official observation daily at 5 PM and the 113 degree value was recorded on June 29, 2012. The South Carolina State Climatology Office contacted Deke Arndt of the National Climatic Data Center in Asheville, NC for procedures to conduct an impartial evaluation as to the authenticity and acceptance of the possible state record highest temperature. NCDC informed us that the local National Weather Service office should coordinate a joint review effort with the State Climatology Office and present the findings, including a site visit with interviews, histories, photography and any measurements that could support that the site meets the guidelines for standardized observations and expectations for exposure. The draft report would then be distributed to the State Climate Extremes Committee, consisting of representatives from the Eastern Region National Weather Service, the NOAA Regional Climate Centers, the National Climatic Data Center, the Columbia National Weather Service Office and the SC State Climatology Office. Each recipient of the draft would be given an opportunity to respond with any suggestions, questions, challenges or remarks regarding the draft. Once all five parties had reviewed the original draft and discussed the findings, a separate vote would be taken to approve/not approve/not approve with recommendations for changed values for either Johnston or Columbia USC. The committee’s final decision would be presented to Thomas Karl, Director of the National Climatic Data Center. Mr. Karl’s endorsement would make the values official for recordkeeping. Weather records held by the National Climatic Data Center in Asheville, NC, and within the SC State Climatology Office in Columbia indicate the official highest temperature of record in South Carolina is a shared value of 111 °F at Blackville on September 4, 1925, at Calhoun Falls on September 8, 1925, and at Camden 2WSW on June 27, 1954 (noted in the text records as the 7AM observation of June 28, 1954). The Blackville observation on September 4, 1925, was surrounded on the same date by the closest numerical values of 110 °F at Garnett, Society Hill and Santuck. The Calhoun Falls observation on September 8, 1925, was surrounded on the same date by the closest numerical values of 106 °F at Newberry and Trenton (Trenton 108 on September 7). The Camden observation in 1954 was surrounded on the same date by the closest numerical values of 108 °F at Society Hill, Aiken, Florence and Marion.
*It occurred to Wes Tyler on July 11, 2012, that Mr. Berry’s Friday, June 29, 2012, observation may have been made from the Townsend supported locked horizontal maximum mercury thermometer position.
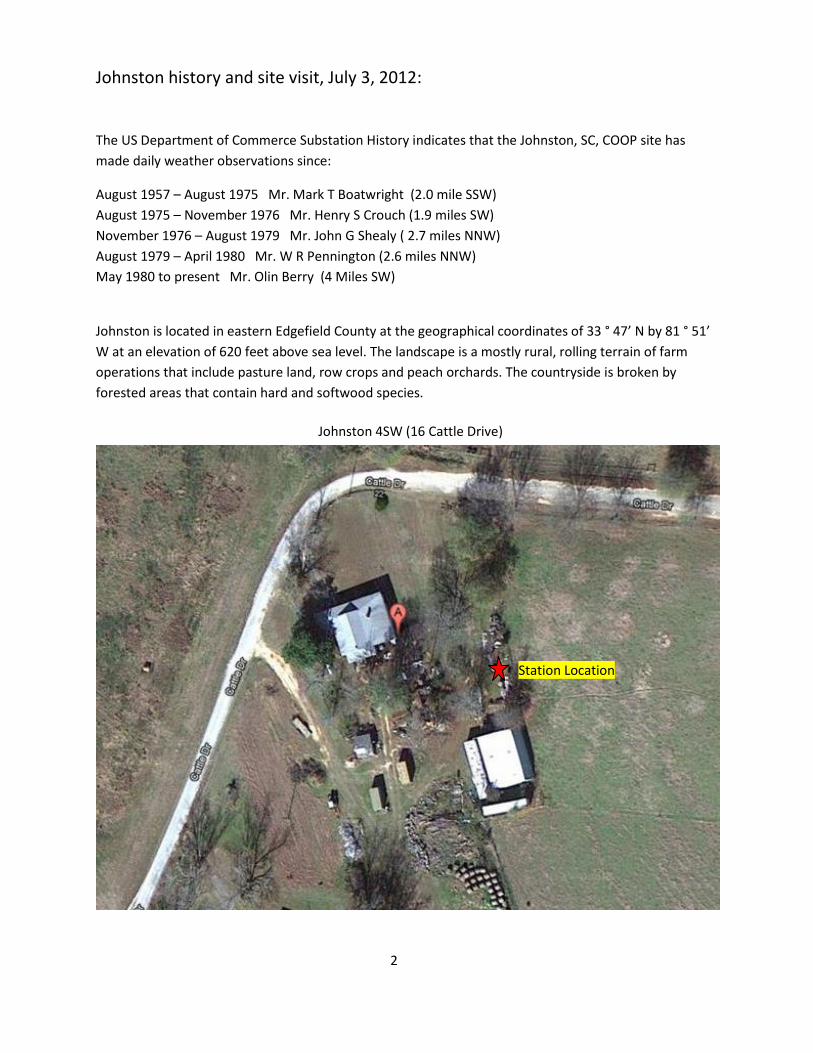
Johnston history and site visit, July 3, 2012:
The US Department of Commerce Substation History indicates that the Johnston, SC, COOP site has
made daily weather observations since:
August 1957 – August 1975 Mr. Mark T Boatwright (2.0 mile SSW)
August 1975 – November 1976 Mr. Henry S Crouch (1.9 miles SW)
November 1976 – August 1979 Mr. John G Shealy ( 2.7 miles NNW)
August 1979 – April 1980 Mr. W R Pennington (2.6 miles NNW)
May 1980 to present Mr. Olin Berry (4 Miles SW)
Johnston is located in eastern Edgefield County at the geographical coordinates of 33 ° 47’ N by 81 ° 51’
W at an elevation of 620 feet above sea level. The landscape is a mostly rural, rolling terrain of farm
operations that include pasture land, row crops and peach orchards. The countryside is broken by
forested areas that contain hard and softwood species.
2
Station Location
Johnston 4SW (16 Cattle Drive)
On July 3, 2012, Wes Tyler and Leonard Vaughan arrived at the residence of Olin Berry, 16 Cattle Drive,
Johnston, SC, at 9:30 AM EDT to evaluate the site to satisfy the NWS recommended guidelines for taking
daily weather observations and to interview Olin Berry.
On July 3, 2012, the ground appeared dry and there was visible stress to non-irrigated corn and grasses
within the county. Although Johnston’s most recent rain (prior to the recorded 113 °F) was 0.03 inches
for the 24-hours ending 7 AM on June 25, the next previous rainfalls were noted on June 11 (1.17”),
June 12 (0.28”) and June 13 (1.05”) yielding that three-day total of 2.50”.
In addition to the NWS Cotton Region Shelter at the Johnston site, there is a Davis Weather Station
(placed in use about 25 years ago) on a tripod provided by the Clemson University Extension Service
(approximately 12 feet to the northwest of the NWS COOP shelter) with a data feed to a computer
monitor in the residence and a NWS Nimbus MMT sensor approximately 90 feet west-northwest of the
NWS Cotton Region Shelter with a digital temperature display in the residence.
Our first task was to inspect the Cotton Region Shelter and to compare the present temperature values
by placing a separate and identical standard NWS maximum mercury thermometer on the inside shaded
wooden frame “bridge” about one inch above the Townsend support apparatus that secures both the
site’s maximum mercury thermometer and alcohol-filled minimum thermometer. This secondary NWS
maximum mercury thermometer was reset and placed in the shelter at 9:35 AM and left in the shelter
for approximately one hour before the values were compared.
The shelter appeared in good condition with no structural weaknesses, wood decay or restrictions to
ventilation. A handheld compass was used to determine the orientation. The placement of the shelter
was very close to true north (350°) for the front door opening and (170°) south for the rear. The official
high temperature observation at Johnston 4SW is made from the NWS maximum mercury thermometer.
An electric wire fence runs along the eastern side (about 8 feet from the shelter) to contain a small herd
of cattle in a grass field used for grazing with no obstructions to the eastern horizon. On the south, west
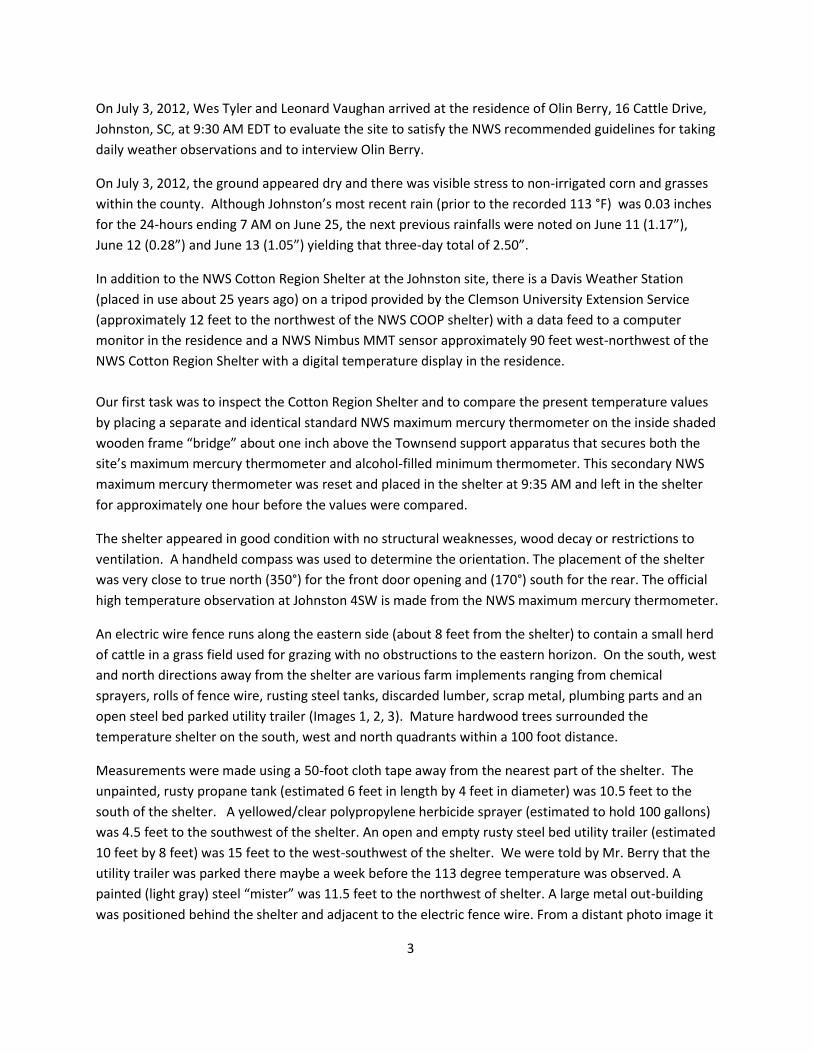
and north directions away from the shelter are various farm implements ranging from chemical
sprayers, rolls of fence wire, rusting steel tanks, discarded lumber, scrap metal, plumbing parts and an
open steel bed parked utility trailer (Images 1, 2, 3). Mature hardwood trees surrounded the
temperature shelter on the south, west and north quadrants within a 100 foot distance.
Measurements were made using a 50-foot cloth tape away from the nearest part of the shelter. The
unpainted, rusty propane tank (estimated 6 feet in length by 4 feet in diameter) was 10.5 feet to the
south of the shelter. A yellowed/clear polypropylene herbicide sprayer (estimated to hold 100 gallons)
was 4.5 feet to the southwest of the shelter. An open and empty rusty steel bed utility trailer (estimated
10 feet by 8 feet) was 15 feet to the west-southwest of the shelter. We were told by Mr. Berry that the
utility trailer was parked there maybe a week before the 113 degree temperature was observed. A
painted (light gray) steel “mister” was 11.5 feet to the northwest of shelter. A large metal out-building
was positioned behind the shelter and adjacent to the electric fence wire. From a distant photo image it
3
was estimated to be 50 feet south of the shelter. The structure is unique in that the exposed southeast
facing walls are painted metal (light in color) that begin at ground level and are angled perhaps 20
degrees at the top leaning northwest to an estimated height of 15 feet. The metal covered building
(placed in the 1970’s) measured 40’X 48’ with a 13 foot door.
The MMT sensor is located in an open space (date of placement unknown at this time), quite near a
waste/wood burning furnace (placed in 2003) that provides heat and hot water to the home and
measured 16.5 feet to the south of that sensor. This furnace was in operation during our visit and
operates year round. The unit is estimated to be the size of a large home kitchen refrigerator with an
exhaust/smoke stack rising 3 feet above the unit. We were told it produces internal temperatures of up
to 1200 °F. Nearly surrounding the MMT
sensor was a knee-high woodpile used to feed
the furnace.
4
Image 1 (right):
Steel bed utility trailer (lower left)
Polypropylene sprayer (center)
Steel propane tank (right middle)
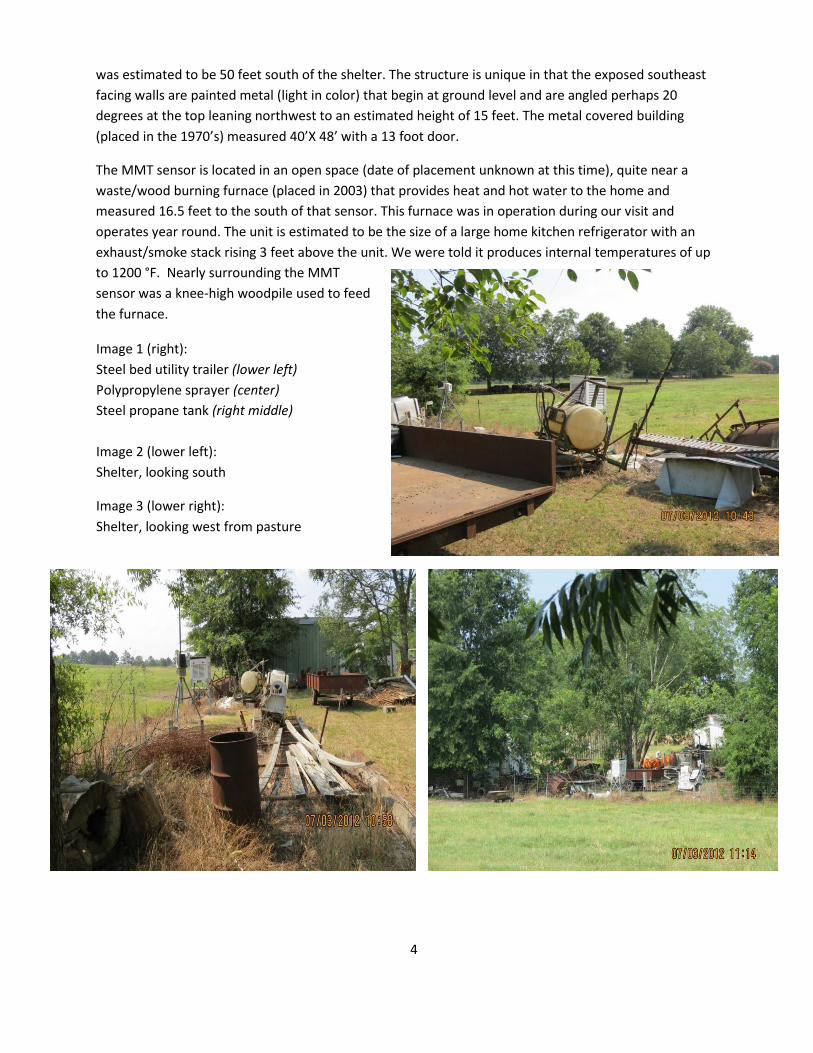
Image 2 (lower left):
Shelter, looking south
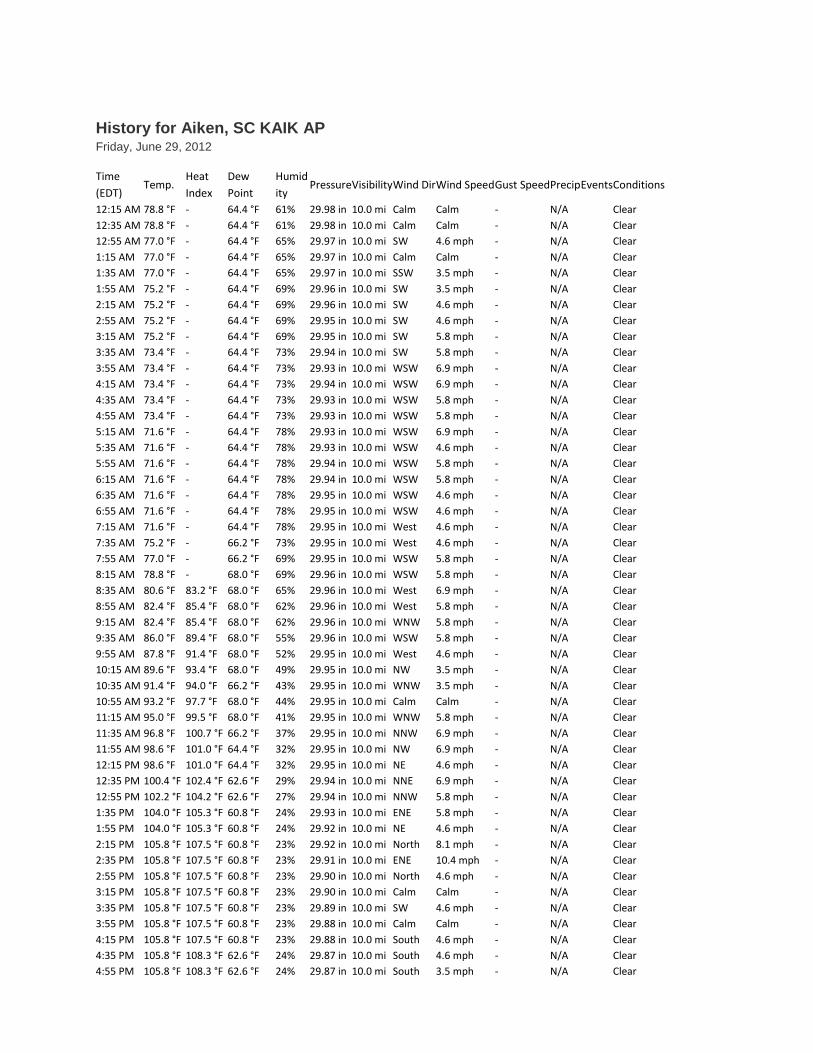
Image 3 (lower right):
Shelter, looking west from pasture

Our interview with Olin Berry was conducted in his home where the temperature values for the MMT
and Davis are displayed.
Below are the 24-hour maximum temperature values Mr. Berry recorded by visually reading the NWS
maximum mercury thermometers at his “nearest to” 7:00 AM observation:
Friday, June 29, 2012 - 103 °F and reset
Saturday, June 30, 2012 - 113 °F and reset
Sunday, July 1, 2012 - 111 °F and reset
It should be noted that the maximum temperature value entered on Saturday morning is for the
previous 24-hours and is most likely (unless proven otherwise) to have occurred the day before. The
observer’s handwritten daily observation form displays the date of when the value was read.
The Davis Weather Station computer stores the temperature observations and will allow the user to
review each date’s highest temperature value and time (EDT). Shown below:
Friday, June 29, 2012 - 106.6 °F at 4:00 PM
Saturday, June 30, 2012 - 106.0 °F at 2:30 PM
Sunday, July 1, 2012 - 102.6 °F at 2:00 PM
The MMT option to review past values at Johnston 4SW for the past 30 days was not engaged.
At 10:30 AM on July 3, 2012, the Johnston 4SW MMT digital display indicated 88.8 °F while at the same
time the Davis instrument displayed 89.1 °F. Within five minutes, both of the NWS mercury-filled
maximum thermometers in the Cotton Region Shelter were read in their resting horizontal position by
three observers and each thermometer indicated an agreed temperature of 94.8 °F (higher than 94.5°F,
but not 95°F).
The nearest NWS COOP sites reporting high temperatures for Friday, June 29, 2012, with
approximate distance in miles and direction from Johnston 4SW in parenthesis (from 7AM
reports June 30):
Saluda Filter Plant 109°F (13 miles N)
McCormick 108°F (34 miles W)
Batesburg 106°F (17 miles ENE)
Clarks Hill 105°F (31 miles WSW)
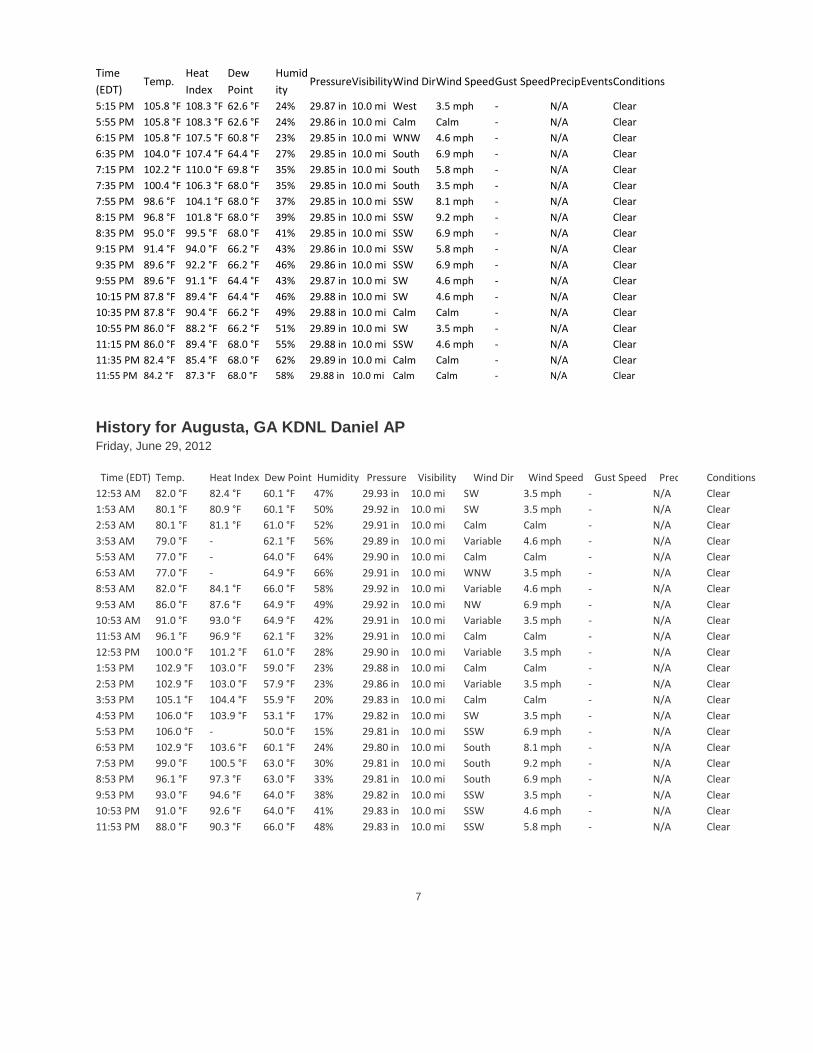
Nearby airport high temperature observations for Friday, June 29, 2012:
KAIK Aiken, SC AP 105.8 °F (21 miles S) AWOS III
KDNL Augusta, GA “Daniel” AP 107°F (32 miles SW) ASOS
KGRD Greenwood, SC AP 105.1°F (35 miles NW) ASOS
History for Aiken, SC KAIK AP Friday, June 29, 2012
Time
(EDT) Temp.
Heat
Index
Dew
Point
Humid
ity Pressure Visibility Wind Dir Wind Speed Gust Speed Precip Events Conditions
12:15 AM 78.8 °F - 64.4 °F 61% 29.98 in 10.0 mi Calm Calm - N/A
Clear
12:35 AM 78.8 °F - 64.4 °F 61% 29.98 in 10.0 mi Calm Calm - N/A
Clear
12:55 AM 77.0 °F - 64.4 °F 65% 29.97 in 10.0 mi SW 4.6 mph - N/A
Clear
1:15 AM 77.0 °F - 64.4 °F 65% 29.97 in 10.0 mi Calm Calm - N/A
Clear
1:35 AM 77.0 °F - 64.4 °F 65% 29.97 in 10.0 mi SSW 3.5 mph - N/A
Clear
1:55 AM 75.2 °F - 64.4 °F 69% 29.96 in 10.0 mi SW 3.5 mph - N/A
Clear
2:15 AM 75.2 °F - 64.4 °F 69% 29.96 in 10.0 mi SW 4.6 mph - N/A
Clear
2:55 AM 75.2 °F - 64.4 °F 69% 29.95 in 10.0 mi SW 4.6 mph - N/A
Clear
3:15 AM 75.2 °F - 64.4 °F 69% 29.95 in 10.0 mi SW 5.8 mph - N/A
Clear
3:35 AM 73.4 °F - 64.4 °F 73% 29.94 in 10.0 mi SW 5.8 mph - N/A
Clear
3:55 AM 73.4 °F - 64.4 °F 73% 29.93 in 10.0 mi WSW 6.9 mph - N/A
Clear
4:15 AM 73.4 °F - 64.4 °F 73% 29.94 in 10.0 mi WSW 6.9 mph - N/A
Clear
4:35 AM 73.4 °F - 64.4 °F 73% 29.93 in 10.0 mi WSW 5.8 mph - N/A
Clear
4:55 AM 73.4 °F - 64.4 °F 73% 29.93 in 10.0 mi WSW 5.8 mph - N/A
Clear
5:15 AM 71.6 °F - 64.4 °F 78% 29.93 in 10.0 mi WSW 6.9 mph - N/A
Clear
5:35 AM 71.6 °F - 64.4 °F 78% 29.93 in 10.0 mi WSW 4.6 mph - N/A
Clear
5:55 AM 71.6 °F - 64.4 °F 78% 29.94 in 10.0 mi WSW 5.8 mph - N/A
Clear
6:15 AM 71.6 °F - 64.4 °F 78% 29.94 in 10.0 mi WSW 5.8 mph - N/A
Clear
6:35 AM 71.6 °F - 64.4 °F 78% 29.95 in 10.0 mi WSW 4.6 mph - N/A
Clear
6:55 AM 71.6 °F - 64.4 °F 78% 29.95 in 10.0 mi WSW 4.6 mph - N/A
Clear
7:15 AM 71.6 °F - 64.4 °F 78% 29.95 in 10.0 mi West 4.6 mph - N/A
Clear
7:35 AM 75.2 °F - 66.2 °F 73% 29.95 in 10.0 mi West 4.6 mph - N/A
Clear
7:55 AM 77.0 °F - 66.2 °F 69% 29.95 in 10.0 mi WSW 5.8 mph - N/A
Clear
8:15 AM 78.8 °F - 68.0 °F 69% 29.96 in 10.0 mi WSW 5.8 mph - N/A
Clear
8:35 AM 80.6 °F 83.2 °F 68.0 °F 65% 29.96 in 10.0 mi West 6.9 mph - N/A
Clear
8:55 AM 82.4 °F 85.4 °F 68.0 °F 62% 29.96 in 10.0 mi West 5.8 mph - N/A
Clear
9:15 AM 82.4 °F 85.4 °F 68.0 °F 62% 29.96 in 10.0 mi WNW 5.8 mph - N/A
Clear
9:35 AM 86.0 °F 89.4 °F 68.0 °F 55% 29.96 in 10.0 mi WSW 5.8 mph - N/A
Clear
9:55 AM 87.8 °F 91.4 °F 68.0 °F 52% 29.95 in 10.0 mi West 4.6 mph - N/A
Clear
10:15 AM 89.6 °F 93.4 °F 68.0 °F 49% 29.95 in 10.0 mi NW 3.5 mph - N/A
Clear
10:35 AM 91.4 °F 94.0 °F 66.2 °F 43% 29.95 in 10.0 mi WNW 3.5 mph - N/A
Clear
10:55 AM 93.2 °F 97.7 °F 68.0 °F 44% 29.95 in 10.0 mi Calm Calm - N/A
Clear
11:15 AM 95.0 °F 99.5 °F 68.0 °F 41% 29.95 in 10.0 mi WNW 5.8 mph - N/A
Clear
11:35 AM 96.8 °F 100.7 °F 66.2 °F 37% 29.95 in 10.0 mi NNW 6.9 mph - N/A
Clear
11:55 AM 98.6 °F 101.0 °F 64.4 °F 32% 29.95 in 10.0 mi NW 6.9 mph - N/A
Clear
12:15 PM 98.6 °F 101.0 °F 64.4 °F 32% 29.95 in 10.0 mi NE 4.6 mph - N/A
Clear
12:35 PM 100.4 °F 102.4 °F 62.6 °F 29% 29.94 in 10.0 mi NNE 6.9 mph - N/A
Clear
12:55 PM 102.2 °F 104.2 °F 62.6 °F 27% 29.94 in 10.0 mi NNW 5.8 mph - N/A
Clear
1:35 PM 104.0 °F 105.3 °F 60.8 °F 24% 29.93 in 10.0 mi ENE 5.8 mph - N/A
Clear
1:55 PM 104.0 °F 105.3 °F 60.8 °F 24% 29.92 in 10.0 mi NE 4.6 mph - N/A
Clear
2:15 PM 105.8 °F 107.5 °F 60.8 °F 23% 29.92 in 10.0 mi North 8.1 mph - N/A
Clear
2:35 PM 105.8 °F 107.5 °F 60.8 °F 23% 29.91 in 10.0 mi ENE 10.4 mph - N/A
Clear
2:55 PM 105.8 °F 107.5 °F 60.8 °F 23% 29.90 in 10.0 mi North 4.6 mph - N/A
Clear
3:15 PM 105.8 °F 107.5 °F 60.8 °F 23% 29.90 in 10.0 mi Calm Calm - N/A
Clear
3:35 PM 105.8 °F 107.5 °F 60.8 °F 23% 29.89 in 10.0 mi SW 4.6 mph - N/A
Clear
3:55 PM 105.8 °F 107.5 °F 60.8 °F 23% 29.88 in 10.0 mi Calm Calm - N/A
Clear
4:15 PM 105.8 °F 107.5 °F 60.8 °F 23% 29.88 in 10.0 mi South 4.6 mph - N/A
Clear
4:35 PM 105.8 °F 108.3 °F 62.6 °F 24% 29.87 in 10.0 mi South 4.6 mph - N/A
Clear
4:55 PM 105.8 °F 108.3 °F 62.6 °F 24% 29.87 in 10.0 mi South 3.5 mph - N/A
Clear
Time
(EDT) Temp.
Heat
Index
Dew
Point
Humid
ity Pressure Visibility Wind Dir Wind Speed Gust Speed Precip Events Conditions
5:15 PM 105.8 °F 108.3 °F 62.6 °F 24% 29.87 in 10.0 mi West 3.5 mph - N/A
Clear
5:55 PM 105.8 °F 108.3 °F 62.6 °F 24% 29.86 in 10.0 mi Calm Calm - N/A
Clear
6:15 PM 105.8 °F 107.5 °F 60.8 °F 23% 29.85 in 10.0 mi WNW 4.6 mph - N/A
Clear
6:35 PM 104.0 °F 107.4 °F 64.4 °F 27% 29.85 in 10.0 mi South 6.9 mph - N/A
Clear
7:15 PM 102.2 °F 110.0 °F 69.8 °F 35% 29.85 in 10.0 mi South 5.8 mph - N/A
Clear
7:35 PM 100.4 °F 106.3 °F 68.0 °F 35% 29.85 in 10.0 mi South 3.5 mph - N/A
Clear
7:55 PM 98.6 °F 104.1 °F 68.0 °F 37% 29.85 in 10.0 mi SSW 8.1 mph - N/A
Clear
8:15 PM 96.8 °F 101.8 °F 68.0 °F 39% 29.85 in 10.0 mi SSW 9.2 mph - N/A
Clear
8:35 PM 95.0 °F 99.5 °F 68.0 °F 41% 29.85 in 10.0 mi SSW 6.9 mph - N/A
Clear
9:15 PM 91.4 °F 94.0 °F 66.2 °F 43% 29.86 in 10.0 mi SSW 5.8 mph - N/A
Clear
9:35 PM 89.6 °F 92.2 °F 66.2 °F 46% 29.86 in 10.0 mi SSW 6.9 mph - N/A
Clear
9:55 PM 89.6 °F 91.1 °F 64.4 °F 43% 29.87 in 10.0 mi SW 4.6 mph - N/A
Clear
10:15 PM 87.8 °F 89.4 °F 64.4 °F 46% 29.88 in 10.0 mi SW 4.6 mph - N/A
Clear
10:35 PM 87.8 °F 90.4 °F 66.2 °F 49% 29.88 in 10.0 mi Calm Calm - N/A
Clear
10:55 PM 86.0 °F 88.2 °F 66.2 °F 51% 29.89 in 10.0 mi SW 3.5 mph - N/A
Clear
11:15 PM 86.0 °F 89.4 °F 68.0 °F 55% 29.88 in 10.0 mi SSW 4.6 mph - N/A
Clear
11:35 PM 82.4 °F 85.4 °F 68.0 °F 62% 29.89 in 10.0 mi Calm Calm - N/A
Clear
11:55 PM 84.2 °F 87.3 °F 68.0 °F 58% 29.88 in 10.0 mi Calm Calm - N/A
Clear
History for Augusta, GA KDNL Daniel AP Friday, June 29, 2012
Time (EDT) Temp. Heat Index Dew Point Humidity Pressure Visibility Wind Dir Wind Speed Gust Speed Precip
Conditions
12:53 AM 82.0 °F 82.4 °F 60.1 °F 47% 29.93 in 10.0 mi SW 3.5 mph - N/A
Clear
1:53 AM 80.1 °F 80.9 °F 60.1 °F 50% 29.92 in 10.0 mi SW 3.5 mph - N/A
Clear
2:53 AM 80.1 °F 81.1 °F 61.0 °F 52% 29.91 in 10.0 mi Calm Calm - N/A
Clear
3:53 AM 79.0 °F - 62.1 °F 56% 29.89 in 10.0 mi Variable 4.6 mph - N/A
Clear
5:53 AM 77.0 °F - 64.0 °F 64% 29.90 in 10.0 mi Calm Calm - N/A
Clear
6:53 AM 77.0 °F - 64.9 °F 66% 29.91 in 10.0 mi WNW 3.5 mph - N/A
Clear
8:53 AM 82.0 °F 84.1 °F 66.0 °F 58% 29.92 in 10.0 mi Variable 4.6 mph - N/A
Clear
9:53 AM 86.0 °F 87.6 °F 64.9 °F 49% 29.92 in 10.0 mi NW 6.9 mph - N/A
Clear
10:53 AM 91.0 °F 93.0 °F 64.9 °F 42% 29.91 in 10.0 mi Variable 3.5 mph - N/A
Clear
11:53 AM 96.1 °F 96.9 °F 62.1 °F 32% 29.91 in 10.0 mi Calm Calm - N/A
Clear
12:53 PM 100.0 °F 101.2 °F 61.0 °F 28% 29.90 in 10.0 mi Variable 3.5 mph - N/A
Clear
1:53 PM 102.9 °F 103.0 °F 59.0 °F 23% 29.88 in 10.0 mi Calm Calm - N/A
Clear
2:53 PM 102.9 °F 103.0 °F 57.9 °F 23% 29.86 in 10.0 mi Variable 3.5 mph - N/A
Clear
3:53 PM 105.1 °F 104.4 °F 55.9 °F 20% 29.83 in 10.0 mi Calm Calm - N/A
Clear
4:53 PM 106.0 °F 103.9 °F 53.1 °F 17% 29.82 in 10.0 mi SW 3.5 mph - N/A
Clear
5:53 PM 106.0 °F - 50.0 °F 15% 29.81 in 10.0 mi SSW 6.9 mph - N/A
Clear
6:53 PM 102.9 °F 103.6 °F 60.1 °F 24% 29.80 in 10.0 mi South 8.1 mph - N/A
Clear
7:53 PM 99.0 °F 100.5 °F 63.0 °F 30% 29.81 in 10.0 mi South 9.2 mph - N/A
Clear
8:53 PM 96.1 °F 97.3 °F 63.0 °F 33% 29.81 in 10.0 mi South 6.9 mph - N/A
Clear
9:53 PM 93.0 °F 94.6 °F 64.0 °F 38% 29.82 in 10.0 mi SSW 3.5 mph - N/A
Clear
10:53 PM 91.0 °F 92.6 °F 64.0 °F 41% 29.83 in 10.0 mi SSW 4.6 mph - N/A
Clear
11:53 PM 88.0 °F 90.3 °F 66.0 °F 48% 29.83 in 10.0 mi SSW 5.8 mph - N/A
Clear
7
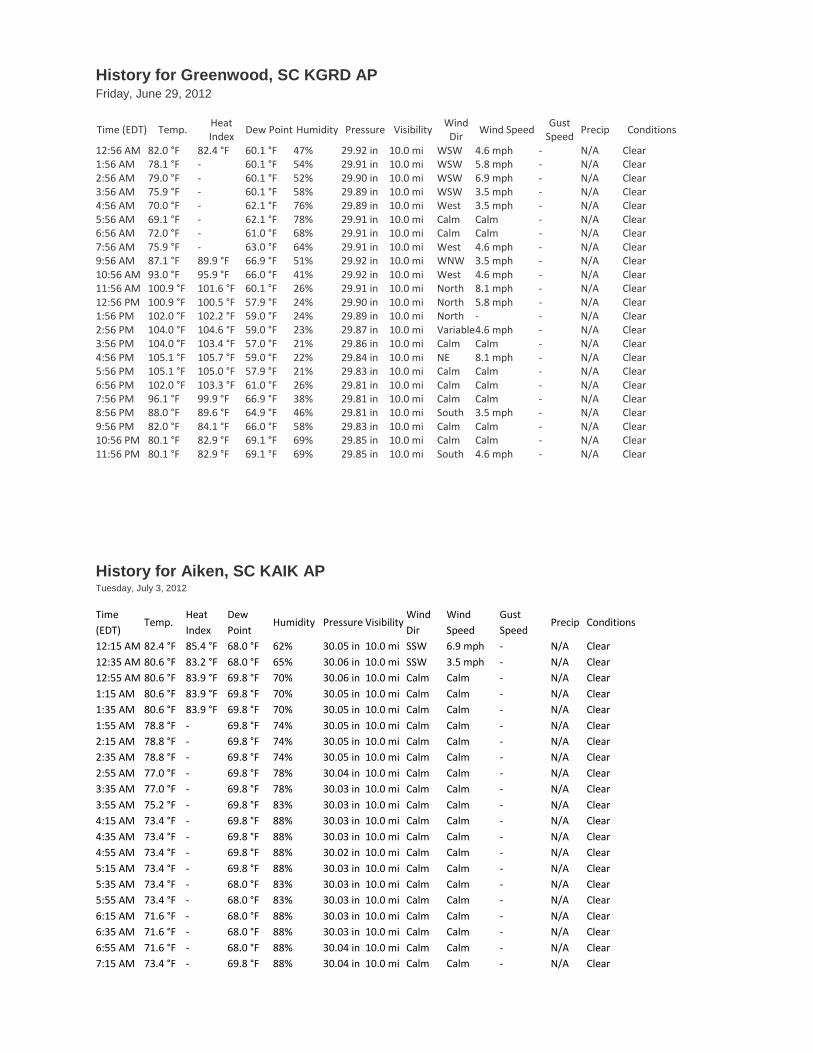
History for Greenwood, SC KGRD AP Friday, June 29, 2012
Time (EDT) Temp. Heat Index
Dew Point Humidity Pressure Visibility Wind
Dir Wind Speed
Gust Speed
Precip Conditions
12:56 AM 82.0 °F 82.4 °F 60.1 °F 47% 29.92 in 10.0 mi WSW 4.6 mph - N/A Clear 1:56 AM 78.1 °F - 60.1 °F 54% 29.91 in 10.0 mi WSW 5.8 mph - N/A Clear 2:56 AM 79.0 °F - 60.1 °F 52% 29.90 in 10.0 mi WSW 6.9 mph - N/A Clear 3:56 AM 75.9 °F - 60.1 °F 58% 29.89 in 10.0 mi WSW 3.5 mph - N/A Clear 4:56 AM 70.0 °F - 62.1 °F 76% 29.89 in 10.0 mi West 3.5 mph - N/A Clear 5:56 AM 69.1 °F - 62.1 °F 78% 29.91 in 10.0 mi Calm Calm - N/A Clear 6:56 AM 72.0 °F - 61.0 °F 68% 29.91 in 10.0 mi Calm Calm - N/A Clear 7:56 AM 75.9 °F - 63.0 °F 64% 29.91 in 10.0 mi West 4.6 mph - N/A Clear 9:56 AM 87.1 °F 89.9 °F 66.9 °F 51% 29.92 in 10.0 mi WNW 3.5 mph - N/A Clear 10:56 AM 93.0 °F 95.9 °F 66.0 °F 41% 29.92 in 10.0 mi West 4.6 mph - N/A Clear 11:56 AM 100.9 °F 101.6 °F 60.1 °F 26% 29.91 in 10.0 mi North 8.1 mph - N/A Clear 12:56 PM 100.9 °F 100.5 °F 57.9 °F 24% 29.90 in 10.0 mi North 5.8 mph - N/A Clear 1:56 PM 102.0 °F 102.2 °F 59.0 °F 24% 29.89 in 10.0 mi North - - N/A Clear 2:56 PM 104.0 °F 104.6 °F 59.0 °F 23% 29.87 in 10.0 mi Variable 4.6 mph - N/A Clear 3:56 PM 104.0 °F 103.4 °F 57.0 °F 21% 29.86 in 10.0 mi Calm Calm - N/A Clear 4:56 PM 105.1 °F 105.7 °F 59.0 °F 22% 29.84 in 10.0 mi NE 8.1 mph - N/A Clear 5:56 PM 105.1 °F 105.0 °F 57.9 °F 21% 29.83 in 10.0 mi Calm Calm - N/A Clear 6:56 PM 102.0 °F 103.3 °F 61.0 °F 26% 29.81 in 10.0 mi Calm Calm - N/A Clear 7:56 PM 96.1 °F 99.9 °F 66.9 °F 38% 29.81 in 10.0 mi Calm Calm - N/A Clear 8:56 PM 88.0 °F 89.6 °F 64.9 °F 46% 29.81 in 10.0 mi South 3.5 mph - N/A Clear 9:56 PM 82.0 °F 84.1 °F 66.0 °F 58% 29.83 in 10.0 mi Calm Calm - N/A Clear 10:56 PM 80.1 °F 82.9 °F 69.1 °F 69% 29.85 in 10.0 mi Calm Calm - N/A Clear 11:56 PM 80.1 °F 82.9 °F 69.1 °F 69% 29.85 in 10.0 mi South 4.6 mph - N/A Clear
History for Aiken, SC KAIK AP Tuesday, July 3, 2012
Time
(EDT) Temp.
Heat
Index
Dew
Point Humidity Pressure Visibility
Wind
Dir
Wind
Speed
Gust
Speed Precip Conditions
12:15 AM 82.4 °F 85.4 °F 68.0 °F 62% 30.05 in 10.0 mi SSW 6.9 mph - N/A Clear
12:35 AM 80.6 °F 83.2 °F 68.0 °F 65% 30.06 in 10.0 mi SSW 3.5 mph - N/A Clear
12:55 AM 80.6 °F 83.9 °F 69.8 °F 70% 30.06 in 10.0 mi Calm Calm - N/A Clear
1:15 AM 80.6 °F 83.9 °F 69.8 °F 70% 30.05 in 10.0 mi Calm Calm - N/A Clear
1:35 AM 80.6 °F 83.9 °F 69.8 °F 70% 30.05 in 10.0 mi Calm Calm - N/A Clear
1:55 AM 78.8 °F - 69.8 °F 74% 30.05 in 10.0 mi Calm Calm - N/A Clear
2:15 AM 78.8 °F - 69.8 °F 74% 30.05 in 10.0 mi Calm Calm - N/A Clear
2:35 AM 78.8 °F - 69.8 °F 74% 30.05 in 10.0 mi Calm Calm - N/A Clear
2:55 AM 77.0 °F - 69.8 °F 78% 30.04 in 10.0 mi Calm Calm - N/A Clear
3:35 AM 77.0 °F - 69.8 °F 78% 30.03 in 10.0 mi Calm Calm - N/A Clear
3:55 AM 75.2 °F - 69.8 °F 83% 30.03 in 10.0 mi Calm Calm - N/A Clear
4:15 AM 73.4 °F - 69.8 °F 88% 30.03 in 10.0 mi Calm Calm - N/A Clear
4:35 AM 73.4 °F - 69.8 °F 88% 30.03 in 10.0 mi Calm Calm - N/A Clear
4:55 AM 73.4 °F - 69.8 °F 88% 30.02 in 10.0 mi Calm Calm - N/A Clear
5:15 AM 73.4 °F - 69.8 °F 88% 30.03 in 10.0 mi Calm Calm - N/A Clear
5:35 AM 73.4 °F - 68.0 °F 83% 30.03 in 10.0 mi Calm Calm - N/A Clear
5:55 AM 73.4 °F - 68.0 °F 83% 30.03 in 10.0 mi Calm Calm - N/A Clear
6:15 AM 71.6 °F - 68.0 °F 88% 30.03 in 10.0 mi Calm Calm - N/A Clear
6:35 AM 71.6 °F - 68.0 °F 88% 30.03 in 10.0 mi Calm Calm - N/A Clear
6:55 AM 71.6 °F - 68.0 °F 88% 30.04 in 10.0 mi Calm Calm - N/A Clear
7:15 AM 73.4 °F - 69.8 °F 88% 30.04 in 10.0 mi Calm Calm - N/A Clear

Time
(EDT) Temp.
Heat
Index
Dew
Point Humidity Pressure Visibility
Wind
Dir
Wind
Speed
Gust
Speed Precip Conditions
7:35 AM 75.2 °F - 69.8 °F 83% 30.05 in 10.0 mi Calm Calm - N/A Clear
7:55 AM 78.8 °F - 71.6 °F 78% 30.05 in 10.0 mi Calm Calm - N/A Clear
8:15 AM 80.6 °F 84.6 °F 71.6 °F 74% 30.05 in 10.0 mi Calm Calm - N/A Clear
8:35 AM 82.4 °F 87.2 °F 71.6 °F 70% 30.05 in 10.0 mi WSW 3.5 mph - N/A Clear
9:15 AM 86.0 °F 91.8 °F 71.6 °F 62% 30.06 in 10.0 mi Calm Calm - N/A Clear
9:35 AM 87.8 °F 93.8 °F 71.6 °F 58% 30.06 in 10.0 mi Calm Calm - N/A Clear
9:55 AM 89.6 °F 96.2 °F 71.6 °F 55% 30.06 in 10.0 mi Calm Calm - N/A Clear
10:15 AM 91.4 °F 98.4 °F 71.6 °F 52% 30.07 in 10.0 mi Calm Calm - N/A Clear
10:35 AM 91.4 °F 96.8 °F 69.8 °F 49% 30.07 in 10.0 mi South 3.5 mph - N/A Clear
10:55 AM 93.2 °F 98.8 °F 69.8 °F 46% 30.07 in 10.0 mi WSW 3.5 mph - N/A Clear
11:15 AM 95.0 °F 101.3 °F 69.8 °F 44% 30.07 in 10.0 mi West 4.6 mph - N/A Sct Clouds
11:35 AM 95.0 °F 101.3 °F 69.8 °F 44% 30.07 in 10.0 mi West 5.8 mph - N/A Mostly Cloudy
11:55 AM 95.0 °F 99.5 °F 68.0 °F 41% 30.06 in 10.0 mi Calm Calm - N/A Mostly Cloudy
12:15 PM 95.0 °F 101.3 °F 69.8 °F 44% 30.06 in 10.0 mi SSW 5.8 mph - N/A Sct Clouds
12:35 PM 95.0 °F 99.5 °F 68.0 °F 41% 30.05 in 10.0 mi Calm Calm - N/A Clear
12:55 PM 95.0 °F 99.5 °F 68.0 °F 41% 30.05 in 10.0 mi SW 3.5 mph - N/A Clear
1:15 PM 96.8 °F 101.8 °F 68.0 °F 39% 30.05 in 10.0 mi Calm Calm - N/A Sct Clouds
1:35 PM 95.0 °F 99.5 °F 68.0 °F 41% 30.04 in 10.0 mi Calm Calm - N/A Mostly Cloudy
1:55 PM 96.8 °F 101.8 °F 68.0 °F 39% 30.04 in 10.0 mi WNW 4.6 mph - N/A Mostly Cloudy
2:15 PM 95.0 °F 99.5 °F 68.0 °F 41% 30.03 in 10.0 mi South 4.6 mph - N/A Mostly Cloudy
2:35 PM 95.0 °F 99.5 °F 68.0 °F 41% 30.03 in 10.0 mi SW 6.9 mph - N/A Mostly Cloudy
3:15 PM 96.8 °F 101.8 °F 68.0 °F 39% 30.01 in 10.0 mi ENE 6.9 mph - N/A Clear
3:35 PM 95.0 °F 98.5 °F 66.2 °F 39% 30.00 in 10.0 mi ESE 3.5 mph - N/A Clear
3:55 PM 96.8 °F 101.8 °F 68.0 °F 39% 29.98 in 10.0 mi Calm Calm - N/A Clear
4:15 PM 96.8 °F 100.7 °F 66.2 °F 37% 29.97 in 10.0 mi South 3.5 mph - N/A Clear
4:35 PM 96.8 °F 101.8 °F 68.0 °F 39% 29.98 in 10.0 mi SE 5.8 mph - N/A Clear
4:55 PM 89.6 °F 92.2 °F 66.2 °F 46% 29.99 in 10.0 mi SW 15.0 mph - N/A Clear
5:15 PM 89.6 °F 92.2 °F 66.2 °F 46% 30.00 in 10.0 mi SSW 12.7 mph 21.9 mph N/A Sct Clouds
5:35 PM 89.6 °F 92.2 °F 66.2 °F 46% 29.99 in 10.0 mi SSW 15.0 mph 23.0 mph N/A Sct Clouds
5:55 PM 89.6 °F 93.4 °F 68.0 °F 49% 29.98 in 10.0 mi SW 11.5 mph - N/A Clear
6:15 PM 89.6 °F 92.2 °F 66.2 °F 46% 30.00 in 10.0 mi SSW 10.4 mph - N/A Clear
6:35 PM 86.0 °F 89.4 °F 68.0 °F 55% 30.02 in 10.0 mi NE 10.4 mph - N/A Sct Clouds
6:55 PM 78.8 °F - 68.0 °F 69% 30.04 in 10.0 mi NE 10.4 mph - N/A Mostly Cloudy
7:15 PM 78.8 °F - 66.2 °F 65% 30.04 in 10.0 mi NNW 4.6 mph - N/A Sct Clouds
7:35 PM 80.6 °F 82.3 °F 64.4 °F 58% 30.03 in 10.0 mi WNW 4.6 mph - N/A Clear
7:55 PM 80.6 °F 82.7 °F 66.2 °F 61% 30.03 in 10.0 mi NW 8.1 mph - N/A Clear
8:15 PM 80.6 °F 82.7 °F 66.2 °F 61% 30.03 in 10.0 mi WNW 4.6 mph - N/A Clear
8:35 PM 78.8 °F - 69.8 °F 74% 30.03 in 10.0 mi West 5.8 mph - N/A Light Rain
8:55 PM 77.0 °F - 69.8 °F 78% 30.03 in 10.0 mi WNW 3.5 mph - N/A Light Rain
9:15 PM 77.0 °F - 71.6 °F 83% 30.03 in 10.0 mi WNW 6.9 mph - N/A Clear
9:35 PM 75.2 °F - 71.6 °F 89% 30.05 in 10.0 mi NW 4.6 mph - N/A Light Drizzle
9:55 PM 75.2 °F - 71.6 °F 89% 30.05 in 10.0 mi Calm Calm - N/A Clear
10:15 PM 75.2 °F - 71.6 °F 89% 30.05 in 10.0 mi SW 6.9 mph - N/A Clear
10:35 PM 75.2 °F - 71.6 °F 89% 30.06 in 10.0 mi SW 6.9 mph - N/A Clear
10:55 PM 77.0 °F - 71.6 °F 83% 30.05 in 10.0 mi WSW 3.5 mph - N/A Clear
11:15 PM 75.2 °F - 71.6 °F 89% 30.05 in 10.0 mi SW 5.8 mph - N/A Clear
11:35 PM 77.0 °F - 69.8 °F 78% 30.05 in 10.0 mi SW 6.9 mph - N/A Clear
11:55 PM 77.0 °F - 69.8 °F 78% 30.06 in 10.0 mi SSW 8.1 mph - N/A Clear
9
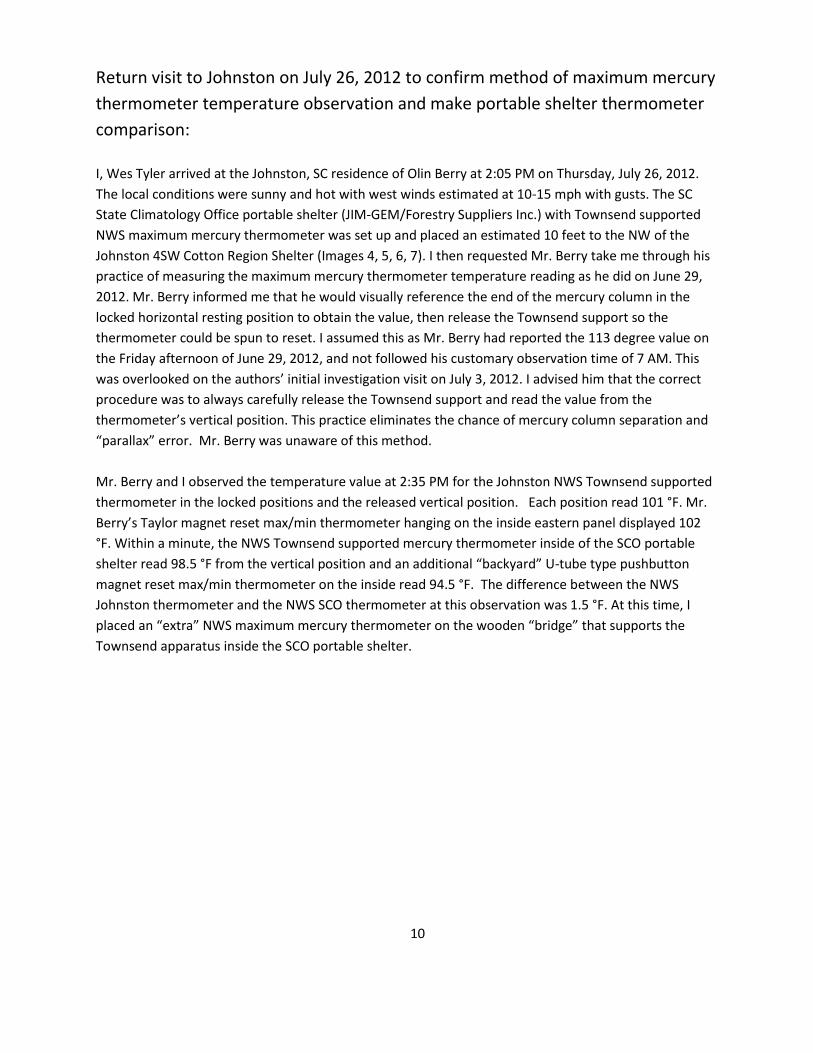
Return visit to Johnston on July 26, 2012 to confirm method of maximum mercury
thermometer temperature observation and make portable shelter thermometer
comparison:
I, Wes Tyler arrived at the Johnston, SC residence of Olin Berry at 2:05 PM on Thursday, July 26, 2012.
The local conditions were sunny and hot with west winds estimated at 10-15 mph with gusts. The SC
State Climatology Office portable shelter (JIM-GEM/Forestry Suppliers Inc.) with Townsend supported
NWS maximum mercury thermometer was set up and placed an estimated 10 feet to the NW of the
Johnston 4SW Cotton Region Shelter (Images 4, 5, 6, 7). I then requested Mr. Berry take me through his
practice of measuring the maximum mercury thermometer temperature reading as he did on June 29,
2012. Mr. Berry informed me that he would visually reference the end of the mercury column in the
locked horizontal resting position to obtain the value, then release the Townsend support so the
thermometer could be spun to reset. I assumed this as Mr. Berry had reported the 113 degree value on
the Friday afternoon of June 29, 2012, and not followed his customary observation time of 7 AM. This
was overlooked on the authors’ initial investigation visit on July 3, 2012. I advised him that the correct
procedure was to always carefully release the Townsend support and read the value from the
thermometer’s vertical position. This practice eliminates the chance of mercury column separation and
“parallax” error. Mr. Berry was unaware of this method.
Mr. Berry and I observed the temperature value at 2:35 PM for the Johnston NWS Townsend supported
thermometer in the locked positions and the released vertical position. Each position read 101 °F. Mr.
Berry’s Taylor magnet reset max/min thermometer hanging on the inside eastern panel displayed 102
°F. Within a minute, the NWS Townsend supported mercury thermometer inside of the SCO portable
shelter read 98.5 °F from the vertical position and an additional “backyard” U-tube type pushbutton
magnet reset max/min thermometer on the inside read 94.5 °F. The difference between the NWS
Johnston thermometer and the NWS SCO thermometer at this observation was 1.5 °F. At this time, I
placed an “extra” NWS maximum mercury thermometer on the wooden “bridge” that supports the
Townsend apparatus inside the SCO portable shelter.
10

July 26, 2012 results from analyzing the un-shaded, exposed nearby surface
temperatures to the Johnston 4SW Cotton Region Shelter using the Gilson Laser
Thermometer, model MA-372:
At 2:40 PM:
Polyethylene 100 gallon sprayer - 138.4 °F.
Rusting steel tank - 135.8 °F
Bare ground adjacent to shelter - 128.5 °F
Light colored discarded roof covering at foot of
shelter - 126.9 °F
Green lawn grass - 118.4 °F
Black tarp over farm implements estimated 15 feet
southwest - 149.0 °F (Image right)
The steel utility trailer that had been near the
shelter on July 3, 2012, had been moved an
estimated 100 feet to the north.
July 26, 2012 comparison of the SCO
portable shelter thermometer to the
Johnston shelter thermometer:
(All NWS maximum mercury thermometer values
read from 2:50 PM in the released vertical position
and not reset by centrifuge actions).
At 2:50 PM:
The SCO portable NWS thermometer read 99.0 °F.
The “extra” thermometer read 98.0 °F.
The SCO pushbutton read 95.0 °F.
The Johnston shelter NWS thermometer read
101.2 °F and the “Taylor” read 103.0 °F.
Observed difference in the SCO/Johnston NWS thermometer temperature values: 2.2 °F
At 3:00 PM:
The SCO portable NWS thermometer read 99.0 °F. The “extra” thermometer read 98.0 °F.
The SCO pushbutton read 96 °F.
The Johnston shelter NWS thermometer read 101.2 while the “Taylor” read 103 °F.
Observed difference in the SCO/Johnston NWS thermometer temperature values: 2.2 °F
11
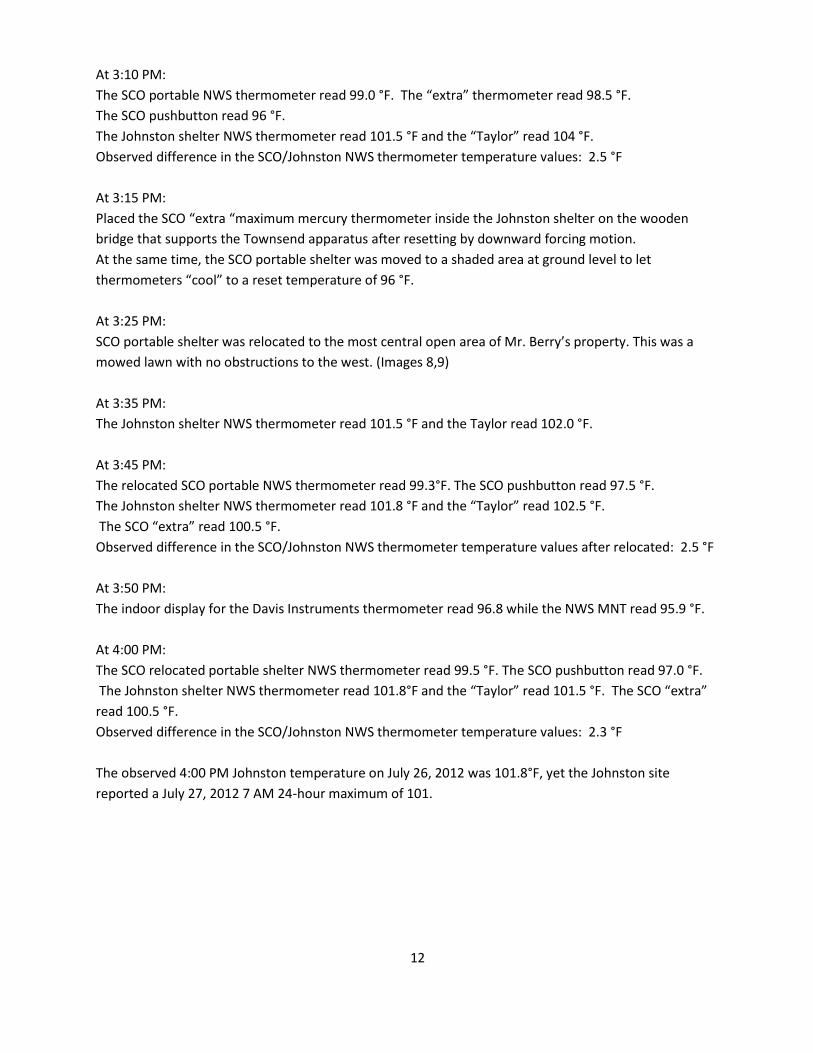
At 3:10 PM:
The SCO portable NWS thermometer read 99.0 °F. The “extra” thermometer read 98.5 °F.
The SCO pushbutton read 96 °F.
The Johnston shelter NWS thermometer read 101.5 °F and the “Taylor” read 104 °F.
Observed difference in the SCO/Johnston NWS thermometer temperature values: 2.5 °F
At 3:15 PM:
Placed the SCO “extra “maximum mercury thermometer inside the Johnston shelter on the wooden
bridge that supports the Townsend apparatus after resetting by downward forcing motion.
At the same time, the SCO portable shelter was moved to a shaded area at ground level to let
thermometers “cool” to a reset temperature of 96 °F.
At 3:25 PM:
SCO portable shelter was relocated to the most central open area of Mr. Berry’s property. This was a
mowed lawn with no obstructions to the west. (Images 8,9)
At 3:35 PM:
The Johnston shelter NWS thermometer read 101.5 °F and the Taylor read 102.0 °F.
At 3:45 PM:
The relocated SCO portable NWS thermometer read 99.3°F. The SCO pushbutton read 97.5 °F.
The Johnston shelter NWS thermometer read 101.8 °F and the “Taylor” read 102.5 °F.
The SCO “extra” read 100.5 °F.
Observed difference in the SCO/Johnston NWS thermometer temperature values after relocated: 2.5 °F
At 3:50 PM:
The indoor display for the Davis Instruments thermometer read 96.8 while the NWS MNT read 95.9 °F.
At 4:00 PM:
The SCO relocated portable shelter NWS thermometer read 99.5 °F. The SCO pushbutton read 97.0 °F.
The Johnston shelter NWS thermometer read 101.8°F and the “Taylor” read 101.5 °F. The SCO “extra”
read 100.5 °F.
Observed difference in the SCO/Johnston NWS thermometer temperature values: 2.3 °F
The observed 4:00 PM Johnston temperature on July 26, 2012 was 101.8°F, yet the Johnston site
reported a July 27, 2012 7 AM 24-hour maximum of 101.
12
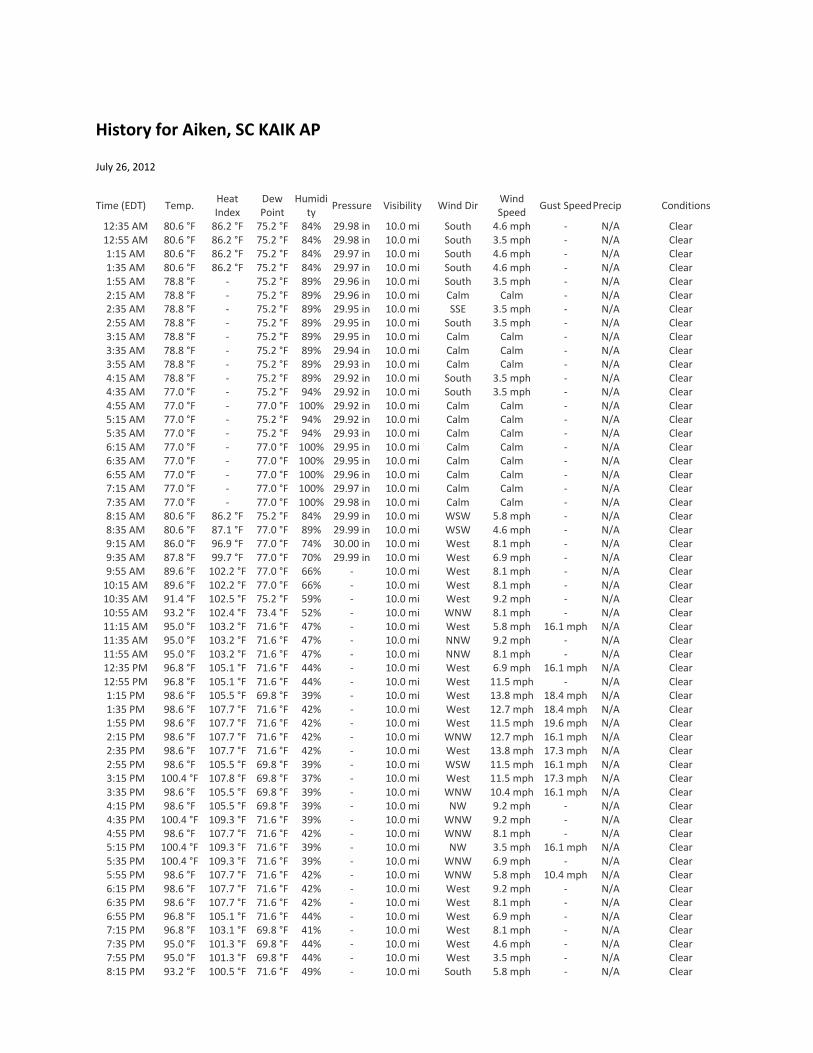
History for Aiken, SC KAIK AP
July 26, 2012
Time (EDT) Temp. Heat Index
Dew Point
Humidity
Pressure Visibility Wind Dir Wind Speed
Gust Speed Precip
Conditions
12:35 AM 80.6 °F 86.2 °F 75.2 °F 84% 29.98 in 10.0 mi South 4.6 mph - N/A
Clear 12:55 AM 80.6 °F 86.2 °F 75.2 °F 84% 29.98 in 10.0 mi South 3.5 mph - N/A
Clear
1:15 AM 80.6 °F 86.2 °F 75.2 °F 84% 29.97 in 10.0 mi South 4.6 mph - N/A
Clear 1:35 AM 80.6 °F 86.2 °F 75.2 °F 84% 29.97 in 10.0 mi South 4.6 mph - N/A
Clear
1:55 AM 78.8 °F - 75.2 °F 89% 29.96 in 10.0 mi South 3.5 mph - N/A
Clear 2:15 AM 78.8 °F - 75.2 °F 89% 29.96 in 10.0 mi Calm Calm - N/A
Clear
2:35 AM 78.8 °F - 75.2 °F 89% 29.95 in 10.0 mi SSE 3.5 mph - N/A
Clear 2:55 AM 78.8 °F - 75.2 °F 89% 29.95 in 10.0 mi South 3.5 mph - N/A
Clear
3:15 AM 78.8 °F - 75.2 °F 89% 29.95 in 10.0 mi Calm Calm - N/A
Clear 3:35 AM 78.8 °F - 75.2 °F 89% 29.94 in 10.0 mi Calm Calm - N/A
Clear
3:55 AM 78.8 °F - 75.2 °F 89% 29.93 in 10.0 mi Calm Calm - N/A
Clear 4:15 AM 78.8 °F - 75.2 °F 89% 29.92 in 10.0 mi South 3.5 mph - N/A
Clear
4:35 AM 77.0 °F - 75.2 °F 94% 29.92 in 10.0 mi South 3.5 mph - N/A
Clear 4:55 AM 77.0 °F - 77.0 °F 100% 29.92 in 10.0 mi Calm Calm - N/A
Clear
5:15 AM 77.0 °F - 75.2 °F 94% 29.92 in 10.0 mi Calm Calm - N/A
Clear 5:35 AM 77.0 °F - 75.2 °F 94% 29.93 in 10.0 mi Calm Calm - N/A
Clear
6:15 AM 77.0 °F - 77.0 °F 100% 29.95 in 10.0 mi Calm Calm - N/A
Clear 6:35 AM 77.0 °F - 77.0 °F 100% 29.95 in 10.0 mi Calm Calm - N/A
Clear
6:55 AM 77.0 °F - 77.0 °F 100% 29.96 in 10.0 mi Calm Calm - N/A
Clear 7:15 AM 77.0 °F - 77.0 °F 100% 29.97 in 10.0 mi Calm Calm - N/A
Clear
7:35 AM 77.0 °F - 77.0 °F 100% 29.98 in 10.0 mi Calm Calm - N/A
Clear 8:15 AM 80.6 °F 86.2 °F 75.2 °F 84% 29.99 in 10.0 mi WSW 5.8 mph - N/A
Clear
8:35 AM 80.6 °F 87.1 °F 77.0 °F 89% 29.99 in 10.0 mi WSW 4.6 mph - N/A
Clear 9:15 AM 86.0 °F 96.9 °F 77.0 °F 74% 30.00 in 10.0 mi West 8.1 mph - N/A
Clear
9:35 AM 87.8 °F 99.7 °F 77.0 °F 70% 29.99 in 10.0 mi West 6.9 mph - N/A
Clear 9:55 AM 89.6 °F 102.2 °F 77.0 °F 66% - 10.0 mi West 8.1 mph - N/A
Clear
10:15 AM 89.6 °F 102.2 °F 77.0 °F 66% - 10.0 mi West 8.1 mph - N/A
Clear 10:35 AM 91.4 °F 102.5 °F 75.2 °F 59% - 10.0 mi West 9.2 mph - N/A
Clear
10:55 AM 93.2 °F 102.4 °F 73.4 °F 52% - 10.0 mi WNW 8.1 mph - N/A
Clear 11:15 AM 95.0 °F 103.2 °F 71.6 °F 47% - 10.0 mi West 5.8 mph 16.1 mph N/A
Clear
11:35 AM 95.0 °F 103.2 °F 71.6 °F 47% - 10.0 mi NNW 9.2 mph - N/A
Clear 11:55 AM 95.0 °F 103.2 °F 71.6 °F 47% - 10.0 mi NNW 8.1 mph - N/A
Clear
12:35 PM 96.8 °F 105.1 °F 71.6 °F 44% - 10.0 mi West 6.9 mph 16.1 mph N/A
Clear 12:55 PM 96.8 °F 105.1 °F 71.6 °F 44% - 10.0 mi West 11.5 mph - N/A
Clear
1:15 PM 98.6 °F 105.5 °F 69.8 °F 39% - 10.0 mi West 13.8 mph 18.4 mph N/A
Clear 1:35 PM 98.6 °F 107.7 °F 71.6 °F 42% - 10.0 mi West 12.7 mph 18.4 mph N/A
Clear
1:55 PM 98.6 °F 107.7 °F 71.6 °F 42% - 10.0 mi West 11.5 mph 19.6 mph N/A
Clear 2:15 PM 98.6 °F 107.7 °F 71.6 °F 42% - 10.0 mi WNW 12.7 mph 16.1 mph N/A
Clear
2:35 PM 98.6 °F 107.7 °F 71.6 °F 42% - 10.0 mi West 13.8 mph 17.3 mph N/A
Clear 2:55 PM 98.6 °F 105.5 °F 69.8 °F 39% - 10.0 mi WSW 11.5 mph 16.1 mph N/A
Clear
3:15 PM 100.4 °F 107.8 °F 69.8 °F 37% - 10.0 mi West 11.5 mph 17.3 mph N/A
Clear 3:35 PM 98.6 °F 105.5 °F 69.8 °F 39% - 10.0 mi WNW 10.4 mph 16.1 mph N/A
Clear
4:15 PM 98.6 °F 105.5 °F 69.8 °F 39% - 10.0 mi NW 9.2 mph - N/A
Clear 4:35 PM 100.4 °F 109.3 °F 71.6 °F 39% - 10.0 mi WNW 9.2 mph - N/A
Clear
4:55 PM 98.6 °F 107.7 °F 71.6 °F 42% - 10.0 mi WNW 8.1 mph - N/A
Clear 5:15 PM 100.4 °F 109.3 °F 71.6 °F 39% - 10.0 mi NW 3.5 mph 16.1 mph N/A
Clear
5:35 PM 100.4 °F 109.3 °F 71.6 °F 39% - 10.0 mi WNW 6.9 mph - N/A
Clear 5:55 PM 98.6 °F 107.7 °F 71.6 °F 42% - 10.0 mi WNW 5.8 mph 10.4 mph N/A
Clear
6:15 PM 98.6 °F 107.7 °F 71.6 °F 42% - 10.0 mi West 9.2 mph - N/A
Clear 6:35 PM 98.6 °F 107.7 °F 71.6 °F 42% - 10.0 mi West 8.1 mph - N/A
Clear
6:55 PM 96.8 °F 105.1 °F 71.6 °F 44% - 10.0 mi West 6.9 mph - N/A
Clear 7:15 PM 96.8 °F 103.1 °F 69.8 °F 41% - 10.0 mi West 8.1 mph - N/A
Clear
7:35 PM 95.0 °F 101.3 °F 69.8 °F 44% - 10.0 mi West 4.6 mph - N/A
Clear 7:55 PM 95.0 °F 101.3 °F 69.8 °F 44% - 10.0 mi West 3.5 mph - N/A
Clear
8:15 PM 93.2 °F 100.5 °F 71.6 °F 49% - 10.0 mi South 5.8 mph - N/A
Clear

Time (EDT) Temp. Heat Index
Dew Point
Humidity
Pressure Visibility Wind Dir Wind Speed
Gust Speed Precip
Conditions
8:35 PM 91.4 °F 98.4 °F 71.6 °F 52% - 10.0 mi SW 4.6 mph - N/A
Clear 8:55 PM 91.4 °F 98.4 °F 71.6 °F 52% - 10.0 mi SW 3.5 mph - N/A
Clear
9:35 PM 89.6 °F 96.2 °F 71.6 °F 55% - 10.0 mi SW 8.1 mph - N/A
Clear 9:55 PM 89.6 °F 96.2 °F 71.6 °F 55% - 10.0 mi WSW 4.6 mph - N/A
Clear
10:35 PM 87.8 °F 93.8 °F 71.6 °F 58% - 10.0 mi SW 5.8 mph - N/A
Clear 10:55 PM 87.8 °F 93.8 °F 71.6 °F 58% - 10.0 mi SW 6.9 mph - N/A
Clear
11:15 PM 87.8 °F 95.6 °F 73.4 °F 62% - 10.0 mi WNW 3.5 mph - N/A
Scattered Clouds 11:35 PM 86.0 °F 91.8 °F 71.6 °F 62% - 10.0 mi WSW 3.5 mph - N/A
Clear
Image 4
14

Image 5
Image 6
15

Image 7
Image8
16

Image 9
17

High temperature event of August 1983 for West Central Climate Division
Division: West Central
Station Name
Temperature (°F F) Precipitation (inches)
Averages Extremes
Percent
Available
Totals Extremes
Percent
Available Max Min Mean Depart High Date Low Date Obs Depart Pct
Norm
1-
Day
Max
Date
AIKEN 5SE 95.6 68.1 81.9 1.8 109 8/22 55 8/15 100 4.85 -0.43 92 1.50 8/4 100
CALHOUN
FALLS 95.4 70.4 82.9 4.5 105 8/23+ 64 8/15 100 2.15 -1.57 58 1.65 8/2 100
CLARK HILL
1 W 95.5 69.1 82.3 2.3 108 8/22 61 8/15 100 0.94 -3.26 22 0.42 8/2 100
GREENWOOD 93.9 67.1 80.5 2.9 105 8/22 57 8/15 100 2.10 -1.52 58 0.62 8/2 100
JOHNSTON 4
SW 93.9 68.2 81.1 3.8 106 8/22 58 8/15 100 2.63 -2.34 53 0.88 8/4 100
LITTLE MTN 93.7 70.4 82.0 4.0 104 8/21 60 8/14 100 3.92 -0.83 83 2.55 8/25 100
NEWBERRY 95.6 69.5 82.6 4.0 108 8/21 59 8/14 100 6.50 1.62 133 5.21 8/25 100
SALUDA 95.6 64.1 79.8 0.3 107 8/22 54 8/15 100 1.61 -2.94 35 0.47 8/8 100
High temperature event of August 2007 for West Central Climate Division
Division: West Central
Station Name
Temperature (°F F) Precipitation (inches)
Averages Extremes Percent
Available
Totals Extremes Percent
Available Max Min Mean Depart High Date Low Date Obs Depart Pct
Norm
1-Day
Max Date
AIKEN 5SE 96.5 72.6 84.6 4.5 106 8/11 68 8/4 100 1.71 -3.57 32 0.59 8/18 100
CALHOUN
FALLS 98.0 70.9 84.5 6.1 106 8/11 61 8/5 100 0.30 -3.42 8 0.09 8/18 96
CLARK HILL
1 W 97.6 70.6 84.1 4.1 105 8/10 65 8/4 100 3.86 -0.34 92 1.40 8/31 100
GREENWOOD 97.9 73.4 85.6 8.0 105 8/13 69 8/13+ 74 1.23 -2.39 34 0.56 8/24 93
JOHNSTON 4
SW 99.6 64.5 82.0 4.7 110 8/11 60 8/4+ 100 2.94 -2.03 59 1.42 8/27 96
LITTLE MTN 96.1 72.1 84.1 6.1 105 8/10 65 8/4 100 1.26 -3.49 27 0.77 8/26 100
SALUDA 98.7 71.5 85.1 5.6 107 8/11+ 65 8/4 100 2.60 -1.95 57 1.05 8/27 100
18
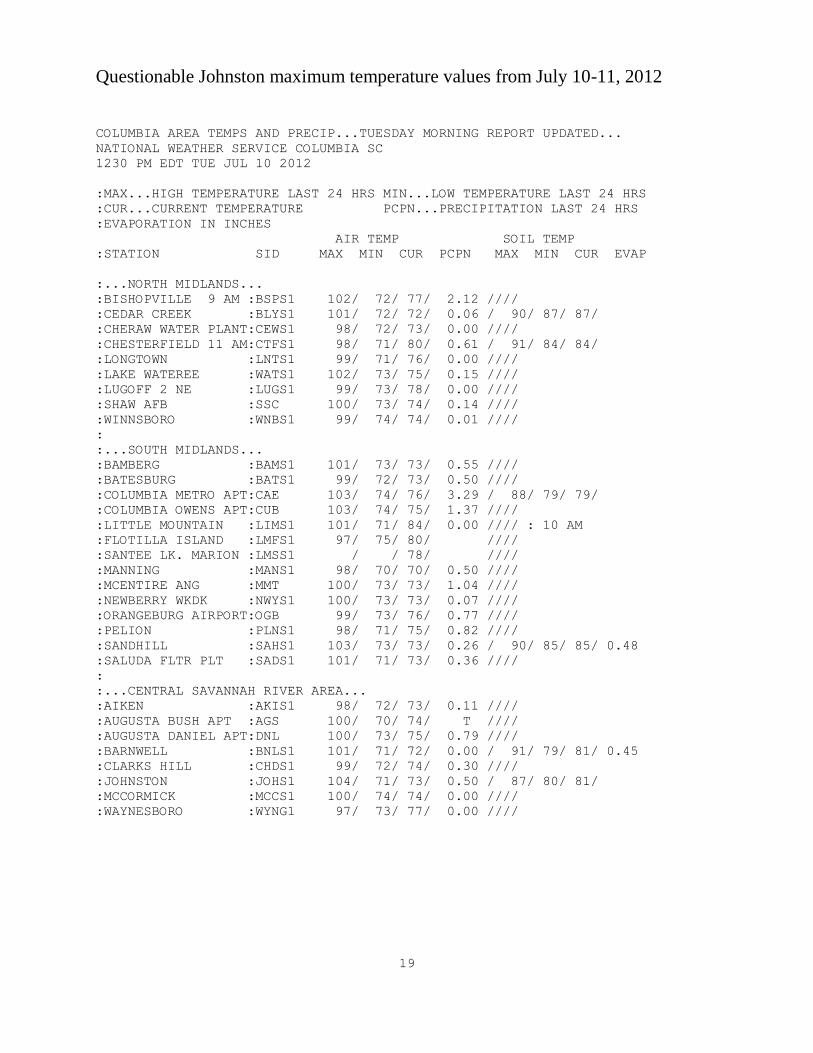
Questionable Johnston maximum temperature values from July 10-11, 2012
COLUMBIA AREA TEMPS AND PRECIP...TUESDAY MORNING REPORT UPDATED...
NATIONAL WEATHER SERVICE COLUMBIA SC
1230 PM EDT TUE JUL 10 2012
:MAX...HIGH TEMPERATURE LAST 24 HRS MIN...LOW TEMPERATURE LAST 24 HRS
:CUR...CURRENT TEMPERATURE PCPN...PRECIPITATION LAST 24 HRS
:EVAPORATION IN INCHES
AIR TEMP SOIL TEMP
:STATION SID MAX MIN CUR PCPN MAX MIN CUR EVAP
:...NORTH MIDLANDS...
:BISHOPVILLE 9 AM :BSPS1 102/ 72/ 77/ 2.12 ////
:CEDAR CREEK :BLYS1 101/ 72/ 72/ 0.06 / 90/ 87/ 87/
:CHERAW WATER PLANT:CEWS1 98/ 72/ 73/ 0.00 ////
:CHESTERFIELD 11 AM:CTFS1 98/ 71/ 80/ 0.61 / 91/ 84/ 84/
:LONGTOWN :LNTS1 99/ 71/ 76/ 0.00 ////
:LAKE WATEREE :WATS1 102/ 73/ 75/ 0.15 ////
:LUGOFF 2 NE :LUGS1 99/ 73/ 78/ 0.00 ////
:SHAW AFB :SSC 100/ 73/ 74/ 0.14 ////
:WINNSBORO :WNBS1 99/ 74/ 74/ 0.01 ////
:
:...SOUTH MIDLANDS...
:BAMBERG :BAMS1 101/ 73/ 73/ 0.55 ////
:BATESBURG :BATS1 99/ 72/ 73/ 0.50 ////
:COLUMBIA METRO APT:CAE 103/ 74/ 76/ 3.29 / 88/ 79/ 79/
:COLUMBIA OWENS APT:CUB 103/ 74/ 75/ 1.37 ////
:LITTLE MOUNTAIN :LIMS1 101/ 71/ 84/ 0.00 //// : 10 AM
:FLOTILLA ISLAND :LMFS1 97/ 75/ 80/ ////
:SANTEE LK. MARION :LMSS1 / / 78/ ////
:MANNING :MANS1 98/ 70/ 70/ 0.50 ////
:MCENTIRE ANG :MMT 100/ 73/ 73/ 1.04 ////
:NEWBERRY WKDK :NWYS1 100/ 73/ 73/ 0.07 ////
:ORANGEBURG AIRPORT:OGB 99/ 73/ 76/ 0.77 ////
:PELION :PLNS1 98/ 71/ 75/ 0.82 ////
:SANDHILL :SAHS1 103/ 73/ 73/ 0.26 / 90/ 85/ 85/ 0.48
:SALUDA FLTR PLT :SADS1 101/ 71/ 73/ 0.36 ////
:
:...CENTRAL SAVANNAH RIVER AREA...
:AIKEN :AKIS1 98/ 72/ 73/ 0.11 ////
:AUGUSTA BUSH APT :AGS 100/ 70/ 74/ T ////
:AUGUSTA DANIEL APT:DNL 100/ 73/ 75/ 0.79 ////
:BARNWELL :BNLS1 101/ 71/ 72/ 0.00 / 91/ 79/ 81/ 0.45
:CLARKS HILL :CHDS1 99/ 72/ 74/ 0.30 ////
:JOHNSTON :JOHS1 104/ 71/ 73/ 0.50 / 87/ 80/ 81/
:MCCORMICK :MCCS1 100/ 74/ 74/ 0.00 ////
:WAYNESBORO :WYNG1 97/ 73/ 77/ 0.00 ////
19
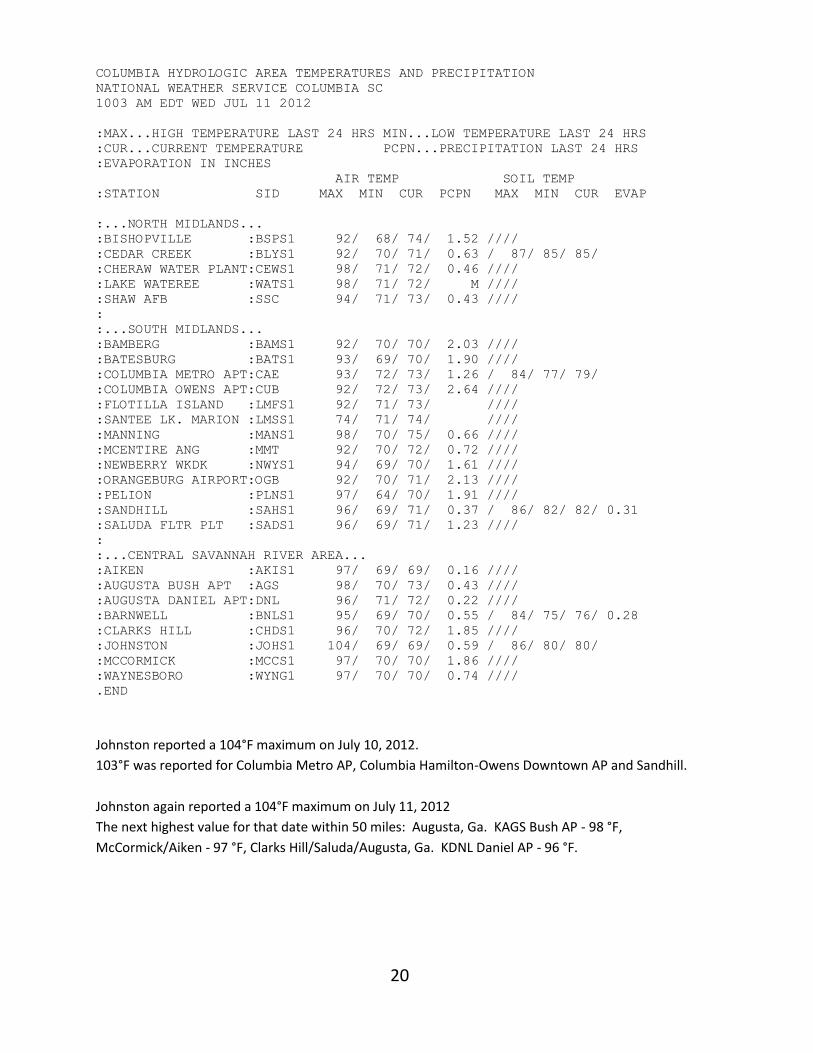
COLUMBIA HYDROLOGIC AREA TEMPERATURES AND PRECIPITATION
NATIONAL WEATHER SERVICE COLUMBIA SC
1003 AM EDT WED JUL 11 2012
:MAX...HIGH TEMPERATURE LAST 24 HRS MIN...LOW TEMPERATURE LAST 24 HRS
:CUR...CURRENT TEMPERATURE PCPN...PRECIPITATION LAST 24 HRS
:EVAPORATION IN INCHES
AIR TEMP SOIL TEMP
:STATION SID MAX MIN CUR PCPN MAX MIN CUR EVAP
:...NORTH MIDLANDS...
:BISHOPVILLE :BSPS1 92/ 68/ 74/ 1.52 ////
:CEDAR CREEK :BLYS1 92/ 70/ 71/ 0.63 / 87/ 85/ 85/
:CHERAW WATER PLANT:CEWS1 98/ 71/ 72/ 0.46 ////
:LAKE WATEREE :WATS1 98/ 71/ 72/ M ////
:SHAW AFB :SSC 94/ 71/ 73/ 0.43 ////
:
:...SOUTH MIDLANDS...
:BAMBERG :BAMS1 92/ 70/ 70/ 2.03 ////
:BATESBURG :BATS1 93/ 69/ 70/ 1.90 ////
:COLUMBIA METRO APT:CAE 93/ 72/ 73/ 1.26 / 84/ 77/ 79/
:COLUMBIA OWENS APT:CUB 92/ 72/ 73/ 2.64 ////
:FLOTILLA ISLAND :LMFS1 92/ 71/ 73/ ////
:SANTEE LK. MARION :LMSS1 74/ 71/ 74/ ////
:MANNING :MANS1 98/ 70/ 75/ 0.66 ////
:MCENTIRE ANG :MMT 92/ 70/ 72/ 0.72 ////
:NEWBERRY WKDK :NWYS1 94/ 69/ 70/ 1.61 ////
:ORANGEBURG AIRPORT:OGB 92/ 70/ 71/ 2.13 ////
:PELION :PLNS1 97/ 64/ 70/ 1.91 ////
:SANDHILL :SAHS1 96/ 69/ 71/ 0.37 / 86/ 82/ 82/ 0.31
:SALUDA FLTR PLT :SADS1 96/ 69/ 71/ 1.23 ////
:
:...CENTRAL SAVANNAH RIVER AREA...
:AIKEN :AKIS1 97/ 69/ 69/ 0.16 ////
:AUGUSTA BUSH APT :AGS 98/ 70/ 73/ 0.43 ////
:AUGUSTA DANIEL APT:DNL 96/ 71/ 72/ 0.22 ////
:BARNWELL :BNLS1 95/ 69/ 70/ 0.55 / 84/ 75/ 76/ 0.28
:CLARKS HILL :CHDS1 96/ 70/ 72/ 1.85 ////
:JOHNSTON :JOHS1 104/ 69/ 69/ 0.59 / 86/ 80/ 80/
:MCCORMICK :MCCS1 97/ 70/ 70/ 1.86 ////
:WAYNESBORO :WYNG1 97/ 70/ 70/ 0.74 ////
.END
Johnston reported a 104°F maximum on July 10, 2012.
103°F was reported for Columbia Metro AP, Columbia Hamilton-Owens Downtown AP and Sandhill.
Johnston again reported a 104°F maximum on July 11, 2012
The next highest value for that date within 50 miles: Augusta, Ga. KAGS Bush AP - 98 °F,
McCormick/Aiken - 97 °F, Clarks Hill/Saluda/Augusta, Ga. KDNL Daniel AP - 96 °F.
20
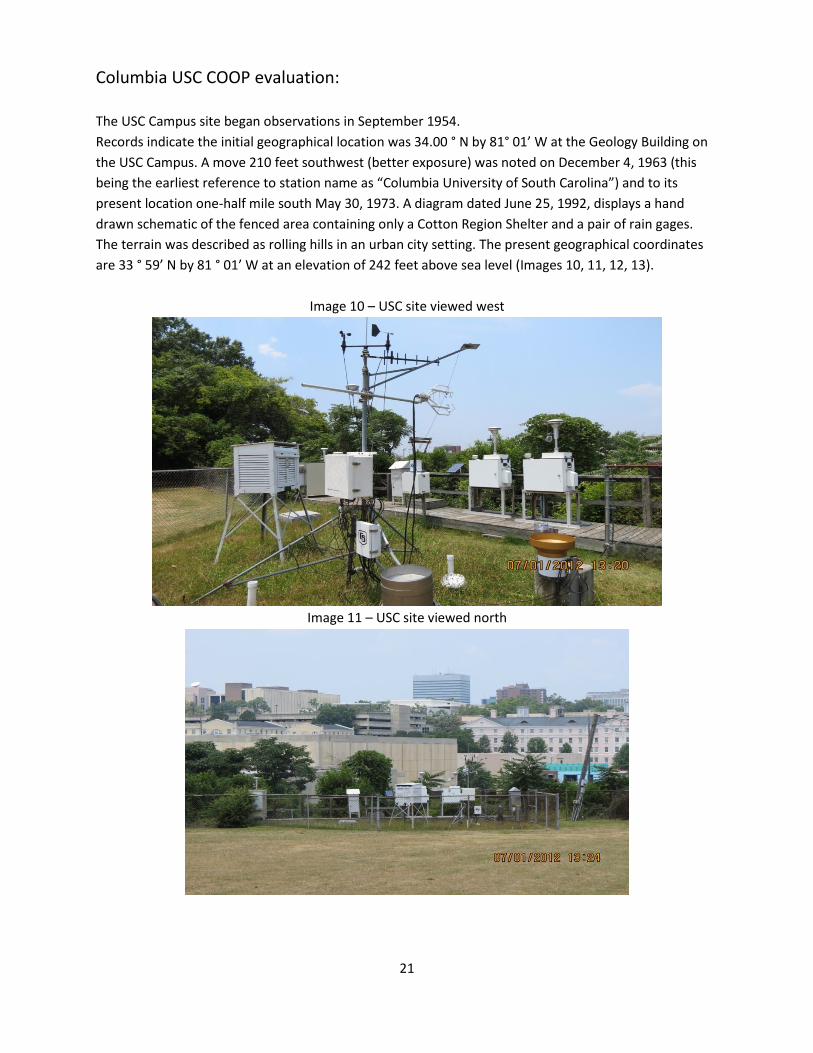
Columbia USC COOP evaluation:
The USC Campus site began observations in September 1954.
Records indicate the initial geographical location was 34.00 ° N by 81° 01’ W at the Geology Building on
the USC Campus. A move 210 feet southwest (better exposure) was noted on December 4, 1963 (this
being the earliest reference to station name as “Columbia University of South Carolina”) and to its
present location one-half mile south May 30, 1973. A diagram dated June 25, 1992, displays a hand
drawn schematic of the fenced area containing only a Cotton Region Shelter and a pair of rain gages.
The terrain was described as rolling hills in an urban city setting. The present geographical coordinates
are 33 ° 59’ N by 81 ° 01’ W at an elevation of 242 feet above sea level (Images 10, 11, 12, 13).
Image 10 – USC site viewed west
Image 11 – USC site viewed north
21
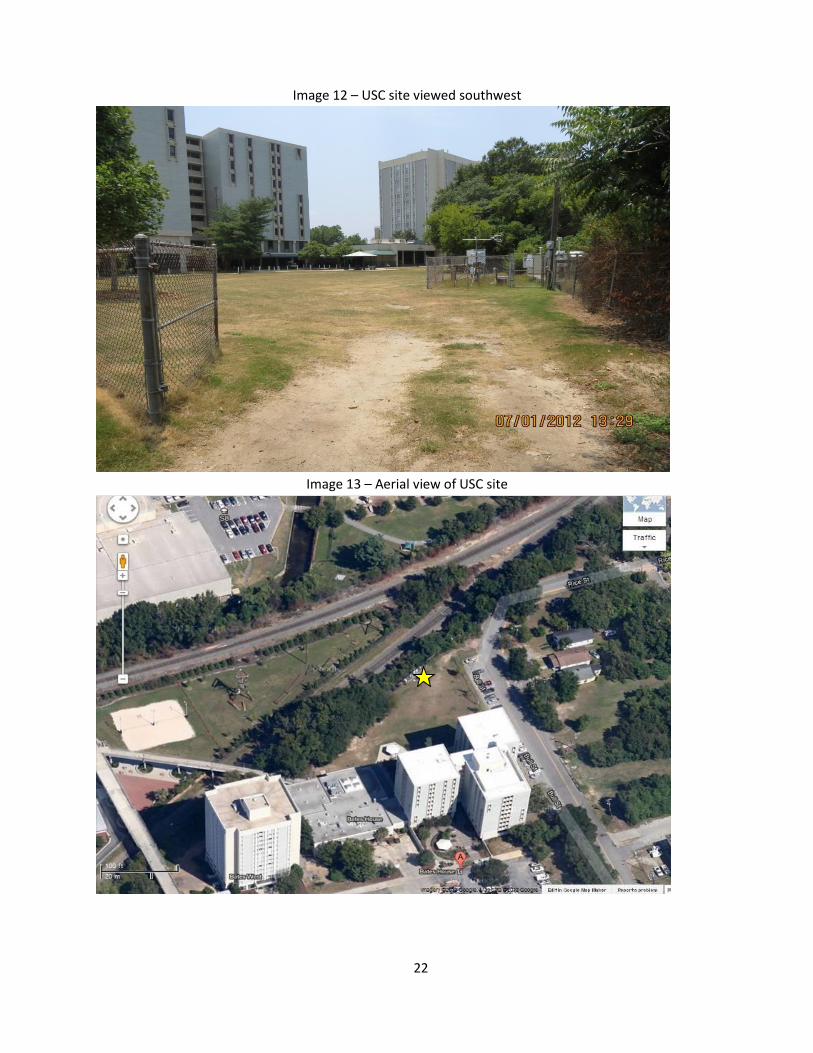
Image 12 – USC site viewed southwest
Image 13 – Aerial view of USC site
22

Observations on visit to Columbia USC COOP site Saturday July 7, 2012, at 4 PM
with Dr. Cary Mock, Professor of Climatology and shared administrator of
observing duties at the site:
At 4:05 PM, I, Wes Tyler placed a standard NWS mercury maximum thermometer inside the Cotton
Region Shelter (same instrument used to compare Johnston NWS thermometer) just above Townsend
support maximum and minimum thermometers on the wooden “bridge” for comparison. Dr. Mock and
I then made tape measurements from the nearest point of the shelter to all nearby sampling units
within the fenced area. These measurements are included in the DHEC sampling unit’s explanation by
April Hiscox and Scott Reynolds.
By using a handheld compass it was determined that the USC Cotton Region Shelter was geographically
oriented 10° north by 190° south. The shelter was inside a fenced-in area of unirrigated ground cover. A
wooden unpainted deck (estimated four feet in width by 40 feet in length and raised about one foot
over ground) was positioned eight feet northwest of the shelter at its closest point and supported
multiple SC Department of Health and Environmental Control sampling units. To the northeast is an
asphalt sidewalk that adjoins Bull Street at a distance of 61 feet. Bates House student dormitories of 10
floors were an estimated 200 feet south of the shelter at their closest point. On the northern side of the
DHEC wooden platform are assorted shrubbery/small trees and an abrupt elevation change of an
estimated 40 feet down to a railroad track.
At 5:05 PM, both thermometers were read by Dr. Mock and me in the shade of the shelter and were
identical in displaying 102°F from the Townsend support’s locked horizontal position and “bridge.”
At 5:30 PM, the USC observer had not arrived for the usual 5:00 PM observation. Dr. Mock left a
handwritten note in the shelter saying the maximum temperature had been made at 102 °F and the
thermometer had been reset. I did not observe Dr. Mock record the value or reset the thermometer.
Before exiting the fenced area it was discovered that a stainless steel fan/shovel blade (unknown
source) was on top of the Cotton Region Shelter. Estimated blade size was 8 inches by 5 inches with
about 3 inches of a broken handle. It was photographed, removed from the top of shelter and left on
site (Image 14).
23
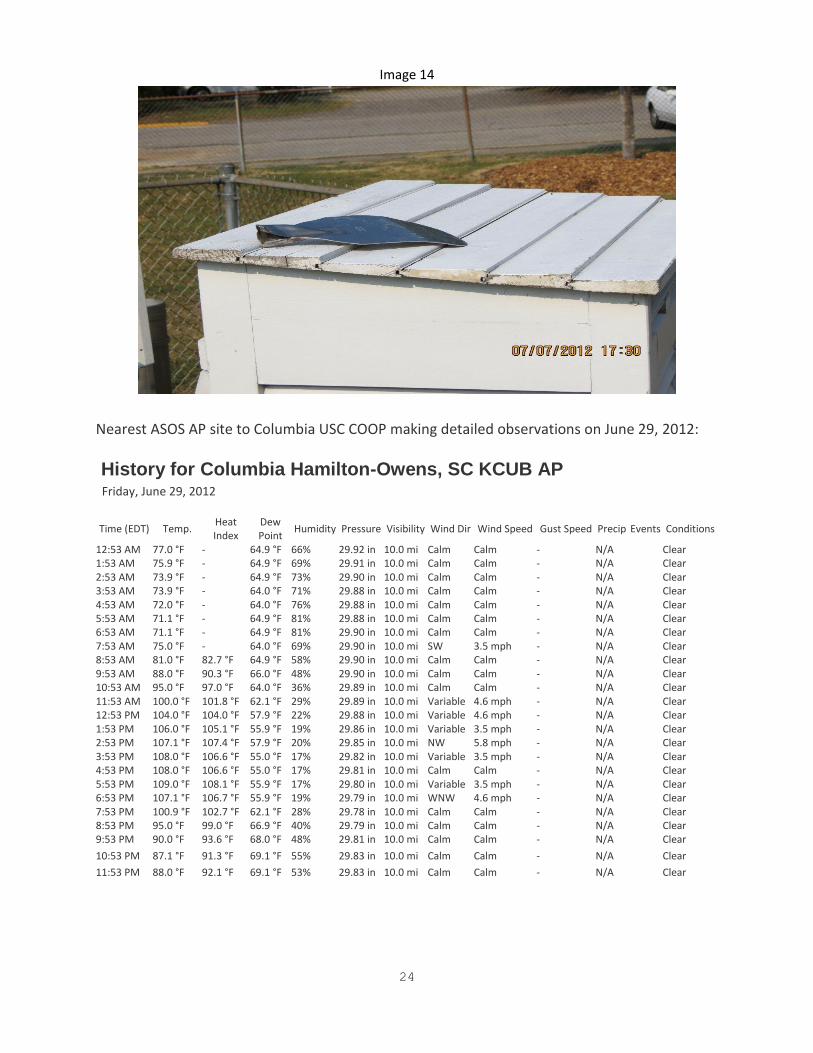
Image 14
Nearest ASOS AP site to Columbia USC COOP making detailed observations on June 29, 2012:
History for Columbia Hamilton-Owens, SC KCUB AP Friday, June 29, 2012
Time (EDT) Temp. Heat Index
Dew Point
Humidity Pressure Visibility Wind Dir Wind Speed Gust Speed Precip Events Conditions
12:53 AM 77.0 °F - 64.9 °F 66% 29.92 in 10.0 mi Calm Calm - N/A
Clear 1:53 AM 75.9 °F - 64.9 °F 69% 29.91 in 10.0 mi Calm Calm - N/A
Clear
2:53 AM 73.9 °F - 64.9 °F 73% 29.90 in 10.0 mi Calm Calm - N/A
Clear 3:53 AM 73.9 °F - 64.0 °F 71% 29.88 in 10.0 mi Calm Calm - N/A
Clear
4:53 AM 72.0 °F - 64.0 °F 76% 29.88 in 10.0 mi Calm Calm - N/A
Clear 5:53 AM 71.1 °F - 64.9 °F 81% 29.88 in 10.0 mi Calm Calm - N/A
Clear
6:53 AM 71.1 °F - 64.9 °F 81% 29.90 in 10.0 mi Calm Calm - N/A
Clear 7:53 AM 75.0 °F - 64.0 °F 69% 29.90 in 10.0 mi SW 3.5 mph - N/A
Clear
8:53 AM 81.0 °F 82.7 °F 64.9 °F 58% 29.90 in 10.0 mi Calm Calm - N/A
Clear 9:53 AM 88.0 °F 90.3 °F 66.0 °F 48% 29.90 in 10.0 mi Calm Calm - N/A
Clear
10:53 AM 95.0 °F 97.0 °F 64.0 °F 36% 29.89 in 10.0 mi Calm Calm - N/A
Clear 11:53 AM 100.0 °F 101.8 °F 62.1 °F 29% 29.89 in 10.0 mi Variable 4.6 mph - N/A
Clear
12:53 PM 104.0 °F 104.0 °F 57.9 °F 22% 29.88 in 10.0 mi Variable 4.6 mph - N/A
Clear 1:53 PM 106.0 °F 105.1 °F 55.9 °F 19% 29.86 in 10.0 mi Variable 3.5 mph - N/A
Clear
2:53 PM 107.1 °F 107.4 °F 57.9 °F 20% 29.85 in 10.0 mi NW 5.8 mph - N/A
Clear 3:53 PM 108.0 °F 106.6 °F 55.0 °F 17% 29.82 in 10.0 mi Variable 3.5 mph - N/A
Clear
4:53 PM 108.0 °F 106.6 °F 55.0 °F 17% 29.81 in 10.0 mi Calm Calm - N/A
Clear 5:53 PM 109.0 °F 108.1 °F 55.9 °F 17% 29.80 in 10.0 mi Variable 3.5 mph - N/A
Clear
6:53 PM 107.1 °F 106.7 °F 55.9 °F 19% 29.79 in 10.0 mi WNW 4.6 mph - N/A
Clear 7:53 PM 100.9 °F 102.7 °F 62.1 °F 28% 29.78 in 10.0 mi Calm Calm - N/A
Clear
8:53 PM 95.0 °F 99.0 °F 66.9 °F 40% 29.79 in 10.0 mi Calm Calm - N/A
Clear 9:53 PM 90.0 °F 93.6 °F 68.0 °F 48% 29.81 in 10.0 mi Calm Calm - N/A
Clear
10:53 PM 87.1 °F 91.3 °F 69.1 °F 55% 29.83 in 10.0 mi Calm Calm - N/A
Clear
11:53 PM 88.0 °F 92.1 °F 69.1 °F 53% 29.83 in 10.0 mi Calm Calm - N/A
Clear
24
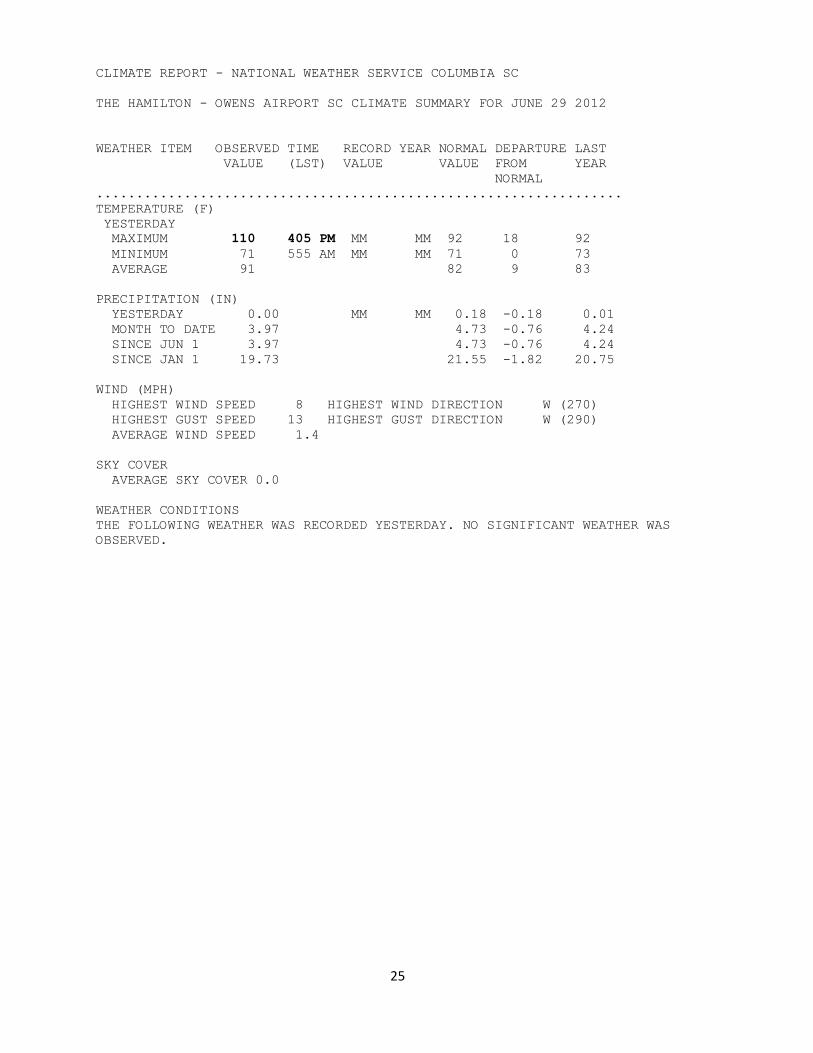
CLIMATE REPORT - NATIONAL WEATHER SERVICE COLUMBIA SC
THE HAMILTON - OWENS AIRPORT SC CLIMATE SUMMARY FOR JUNE 29 2012
WEATHER ITEM OBSERVED TIME RECORD YEAR NORMAL DEPARTURE LAST
VALUE (LST) VALUE VALUE FROM YEAR
NORMAL
..................................................................
TEMPERATURE (F)
YESTERDAY
MAXIMUM 110 405 PM MM MM 92 18 92
MINIMUM 71 555 AM MM MM 71 0 73
AVERAGE 91 82 9 83
PRECIPITATION (IN)
YESTERDAY 0.00 MM MM 0.18 -0.18 0.01
MONTH TO DATE 3.97 4.73 -0.76 4.24
SINCE JUN 1 3.97 4.73 -0.76 4.24
SINCE JAN 1 19.73 21.55 -1.82 20.75
WIND (MPH)
HIGHEST WIND SPEED 8 HIGHEST WIND DIRECTION W (270)
HIGHEST GUST SPEED 13 HIGHEST GUST DIRECTION W (290)
AVERAGE WIND SPEED 1.4
SKY COVER
AVERAGE SKY COVER 0.0
WEATHER CONDITIONS
THE FOLLOWING WEATHER WAS RECORDED YESTERDAY. NO SIGNIFICANT WEATHER WAS
OBSERVED.
25

Aerial image of Columbia Hamilton-Owens AP
ASOS
Ground image of Columbia Hamilton-Owens AP ASOS instrumentation array
26

Return visit to Columbia USC site to confirm method of maximum mercury
thermometer temperature observation on July 12, 2012:
I, Wes Tyler, met Mike Leitzke, Columbia USC COOP observer at 4:55 PM at the USC COOP site for an
interview on the method of observation he made on June 29, 2012. Mr. Leitzke allowed access to the
fenced-in area by unlocking gate. I explained to Mr. Leitzke that I wanted him to go through the
procedure of observing the temperatures from the NWS Townsend supported NWS standard mercury
maximum and alcohol minimum thermometers as he did on June 29, 2012. Mr. Leitzke opened the
front door of the unlocked shelter. He then observed the maximum value from the thermometers
horizontal-resting locked position and voiced to me that the maximum was 96°F. The minimum was
then read from its resting position but I do not recall the value. At this time he accessed his cell phone
and began to forward the values to the local NWS by the weather coder method. I stopped him and said
the procedure he used to measure the maximum temperature was not part of the guidelines and
demonstrated that the recommended practice for measuring the maximum temperature was to
carefully release the Townsend support so that the thermometer could be read in a vertical position. He
said that he had always measured the maximum temperature the other way and pointed to a placard
inside the shelter with instructions. His interpretation of the instructions was incorrect. The value
observed from the “released” Townsend supported mercury thermometer read in the vertical position
was an agreed 95 °F. To reset the maximum thermometer he “gently” rotated the thermometer in a
clockwise manner. Although this is in part a recommended procedure I explained to him that the
rotation to reset must be forcefully done to create enough of a centrifuge to reset the mercury column
through the bore constriction to attain the present temperature. I gave a demonstration and the
mercury column was reset and the thermometer was replaced to its locked setting. Readings of the
maximum temperature from the Townsend supported horizontal locked resting position versus the
vertical position can result in a separation of the mercury column. This is a common problem caused by
external forcing (jarring) of the shelter and/or thermometer since or from when previously reset.
Explanation of USC Department of Geography and DHEC monitoring instruments
at USC site:
On July 16, 2012 at 2:30 PM, I was accompanied by April Hiscox, USC Department of Geography and
administrator of the USC NWS COOP site responsibilities for an explanation to the platform mounted
DHEC sampling units and on July 18, I had a more detailed phone conversation on the descriptions of the
sampling units with Scott Reynolds, SCDHEC Bureau of Environmental Services who maintains those
instruments. DHEC operates units 1-5 that are located on the raised wooden platform that was placed
at the site in November of 1998.
27
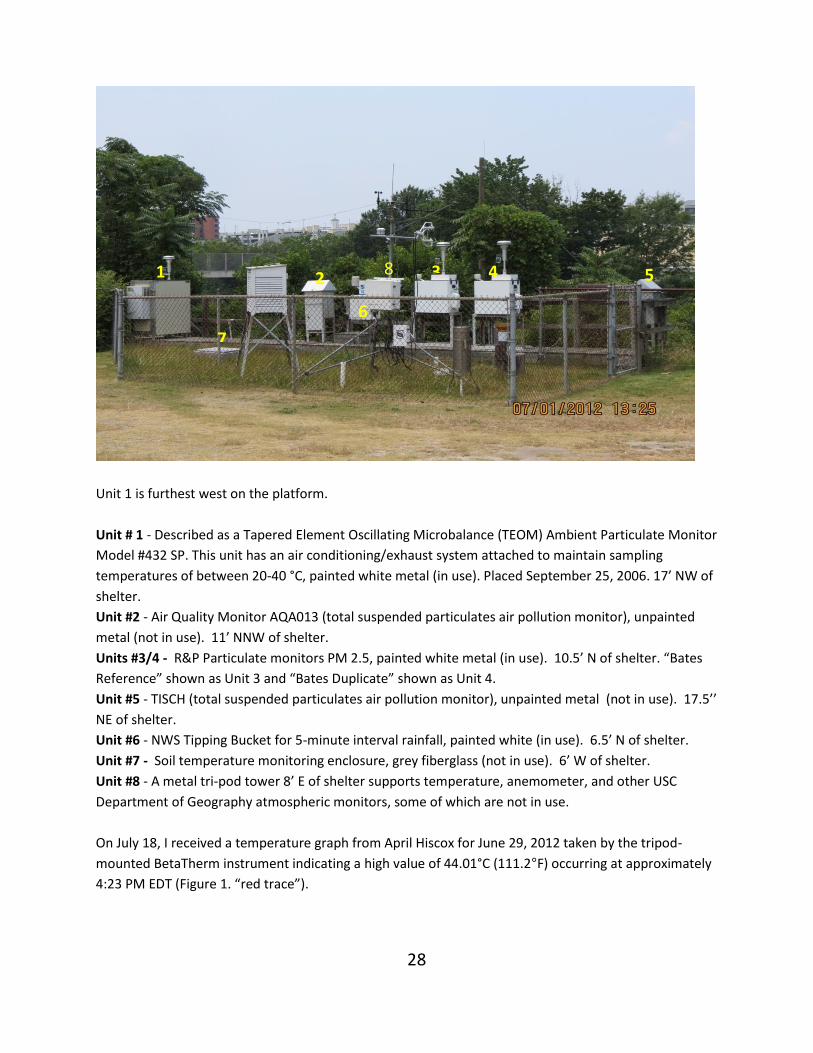
Unit 1 is furthest west on the platform.
Unit # 1 - Described as a Tapered Element Oscillating Microbalance (TEOM) Ambient Particulate Monitor
Model #432 SP. This unit has an air conditioning/exhaust system attached to maintain sampling
temperatures of between 20-40 °C, painted white metal (in use). Placed September 25, 2006. 17’ NW of
shelter.
Unit #2 - Air Quality Monitor AQA013 (total suspended particulates air pollution monitor), unpainted
metal (not in use). 11’ NNW of shelter.
Units #3/4 - R&P Particulate monitors PM 2.5, painted white metal (in use). 10.5’ N of shelter. “Bates
Reference” shown as Unit 3 and “Bates Duplicate” shown as Unit 4.
Unit #5 - TISCH (total suspended particulates air pollution monitor), unpainted metal (not in use). 17.5’’
NE of shelter.
Unit #6 - NWS Tipping Bucket for 5-minute interval rainfall, painted white (in use). 6.5’ N of shelter.
Unit #7 - Soil temperature monitoring enclosure, grey fiberglass (not in use). 6’ W of shelter.
Unit #8 - A metal tri-pod tower 8’ E of shelter supports temperature, anemometer, and other USC
Department of Geography atmospheric monitors, some of which are not in use.
On July 18, I received a temperature graph from April Hiscox for June 29, 2012 taken by the tripod-
mounted BetaTherm instrument indicating a high value of 44.01°C (111.2°F) occurring at approximately
4:23 PM EDT (Figure 1. “red trace”).
28
1 2 3 4 5
6
7
8
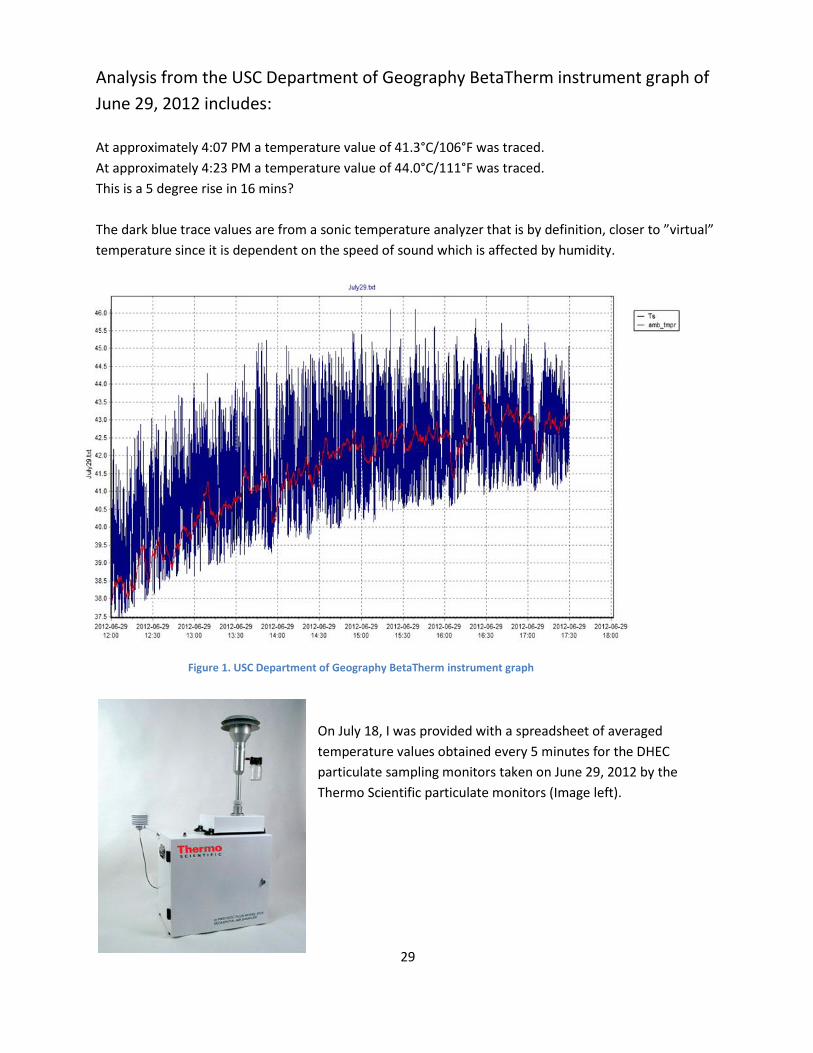
Analysis from the USC Department of Geography BetaTherm instrument graph of
June 29, 2012 includes:
At approximately 4:07 PM a temperature value of 41.3°C/106°F was traced.
At approximately 4:23 PM a temperature value of 44.0°C/111°F was traced.
This is a 5 degree rise in 16 mins?
The dark blue trace values are from a sonic temperature analyzer that is by definition, closer to ”virtual”
temperature since it is dependent on the speed of sound which is affected by humidity.
Figure 1. USC Department of Geography BetaTherm instrument graph
On July 18, I was provided with a spreadsheet of averaged
temperature values obtained every 5 minutes for the DHEC
particulate sampling monitors taken on June 29, 2012 by the
Thermo Scientific particulate monitors (Image left).
29

EST Bates Reference (°C) Bates Reference (°F) Bates Duplicate (°C) Bates Duplicate (°F)
6/29/2012 14:30 43.2 109.76 43.2 109.76
6/29/2012 14:35 43.3 109.94 43.3 109.94
6/29/2012 14:40 43.3 109.94 42.9 109.22
6/29/2012 14:45 43 109.4 43.2 109.76
6/29/2012 14:50 42.9 109.22 43 109.4
6/29/2012 14:55 42.9 109.22 43.3 109.94
6/29/2012 15:00 43.7 110.66 43.7 110.66
6/29/2012 15:05 43.4 110.12 43.2 109.76
6/29/2012 15:10 43.4 110.12 43.1 109.58
6/29/2012 15:15 43.1 109.58 42.9 109.22
6/29/2012 15:20 43.2 109.76 43.1 109.58
6/29/2012 15:25 43.8 110.84 43.9 111.02
6/29/2012 15:30 44.6 112.28 44.9 112.82
6/29/2012 15:35 44.3 111.74 44.5 112.1
6/29/2012 15:40 44 111.2 44 111.2
6/29/2012 15:45 43.1 109.58 42.8 109.04
6/29/2012 15:50 43.3 109.94 43.3 109.94
6/29/2012 15:55 43.5 110.3 43.4 110.12
6/29/2012 16:00 43.3 109.94 43.3 109.94
6/29/2012 16:05 43.4 110.12 43.5 110.3
6/29/2012 16:10 43.9 111.02 43.7 110.66
6/29/2012 16:15 43.1 109.58 42.9 109.22
6/29/2012 16:20 43.4 110.12 43.7 110.66
6/29/2012 16:25 43.5 110.3 43.6 110.48
6/29/2012 16:30 43.4 110.12 43.6 110.48
Highest sampled value 45.1°C/113.2°F (unknown which unit or time)
Highest 5 minute average Unit 1 “Bates Reference” 44.6°C/112.3°F @ 4:30 PM EDT (shown on
spreadsheet as 15:30 EST)
Highest 5 minute average Unit 2 “Bates Duplicate” 44.9°C/112.8°F @ 4:30 PM EDT (shown on
spreadsheet as 15:30 EST)
Greatest movement/change of 5 minute average temperatures within any 15 minute interval on June
29, 2012 of either “Bates Reference” or “Bates Duplicate” between 14:30 EST and 16:30 EST.
“Bates Duplicate” – 5 minute average temperature ending at:
15:20 EST 43.1°C/109.6°F 15:30 EST 44.9°C/112.8°F (+3.2°F in 15 mins) 15:35 EST 44.5°C/112.1°F 15:45 EST 42.8°C/109.0°F (-3.1°F in 15 mins) 30

A visit to compare temperatures between SCO portable shelter and on-site DHEC
instruments on July 24, 2012:
I, Wes Tyler, arrived at the Columbia USC site at 3:40 PM.
The SCO portable temperature shelter was set up approximately 12 feet south of USC Cotton Region
Shelter just outside of fenced-in area (Images 15, 16). Weather conditions were sunny and hot with a
steady northwest wind of an estimated 8-10 mph.
The SCO portable temperature shelter included a NWS maximum mercury Townsend support
thermometer, a NWS maximum mercury thermometer placed on the “bridge” over the Townsend
support, an expanded scale (indexed 160°F) probe thermometer and a “backyard” U-tube type
pushbutton magnet reset max/min mercury thermometer.
Image 15
31

Image 16
Leonard Vaughan, CAE NWS, arrived at 4:00 PM and assisted in making SCO portable shelter
temperature observations every 10 minutes beginning at 16:25 EDT without using any centrifuge
methods of resetting:
SCO Portable Shelter Observations July 24, 2012
Time (EDT)
Max Mercury Townsend
Townsend Vertical Ob
Max Mercury on “bridge”
Vertical Ob X Probe PB
16:25 99°F 98.5° 103.5°F 103°F 94.2°F 96°F
16:35 99.5°F 99°F 103.5°F 103°F 92.5°F* 96.3°F
16:45 99.2°F 99°F 103.5°F 103°F 93°F 96.3°F
16:55 99.3°F 99°F ** N/A 92.5°F 96.3°F
17:05 100°F 99.8°F 98.8°F 98.5°F 94°F 97°F
*replaced completely inside shelter **rese **reset bridge thermometer, seemed too high
Table Key:
Townsend supported NWS max/mercury at offset horizontal rest = Max Mercury Townsend Townsend supported NWS max/mercury released to vertical position = Townsend Vertical Ob.
NWS max/mercury thermometer at horizontal rest on “bridge” = Max Mercury on “bridge”
Read in vertical position = Vertical Ob.
Expanded scale probe = X probe
Pushbutton U tube = PB
Scott Reynolds, DHEC, arrived at the USC COOP site at around 5:05 PM and allowed access to inside of
fenced-in area of Cotton Region Shelter and adjacent monitoring instruments.
32

Using the Gilson Laser thermometer the following temperature observations were
made on selected un-shaded exposed surfaces at around 5:10 PM on July 24,
2012:
Top of Particulate monitor (Bates Reference Unit #3) 107.4 °F
Wooden unpainted raised platform 128.3 °F
Wooden rail 132.0 °F
Top of Tapered Element Oscillating Microbalance (TEOM Unit #1) 115.7 °F
Top of soil temperature Unit #7 133.3 °F
5:15 PM - At this time USC observer had not arrived so we took the liberty to read the USC Townsend
supported maximum/mercury thermometer within the USC Cotton Region Shelter.
Resting in the offset horizontal position 100.2°F
Released in the vertical position 99.8°F.
We did not spin the thermometer to reset.
5:15 PM - Scott Reynolds was able to observe the current temperatures of “Bates Reference” Unit #3
and “Bates Duplicate” Unit #4.
“Bates Reference” Unit #3 36.7°C (98.4°F)
“Bates Duplicate” Unit #4 37.3°C (99.1°F)
USC observer Mike Lietzke arrived at around 5:25 PM and made his observation:
Value of 100 °F was reported to the NWS from vertical observation of Townsend released maximum
mercury thermometer. Then spun to reset.
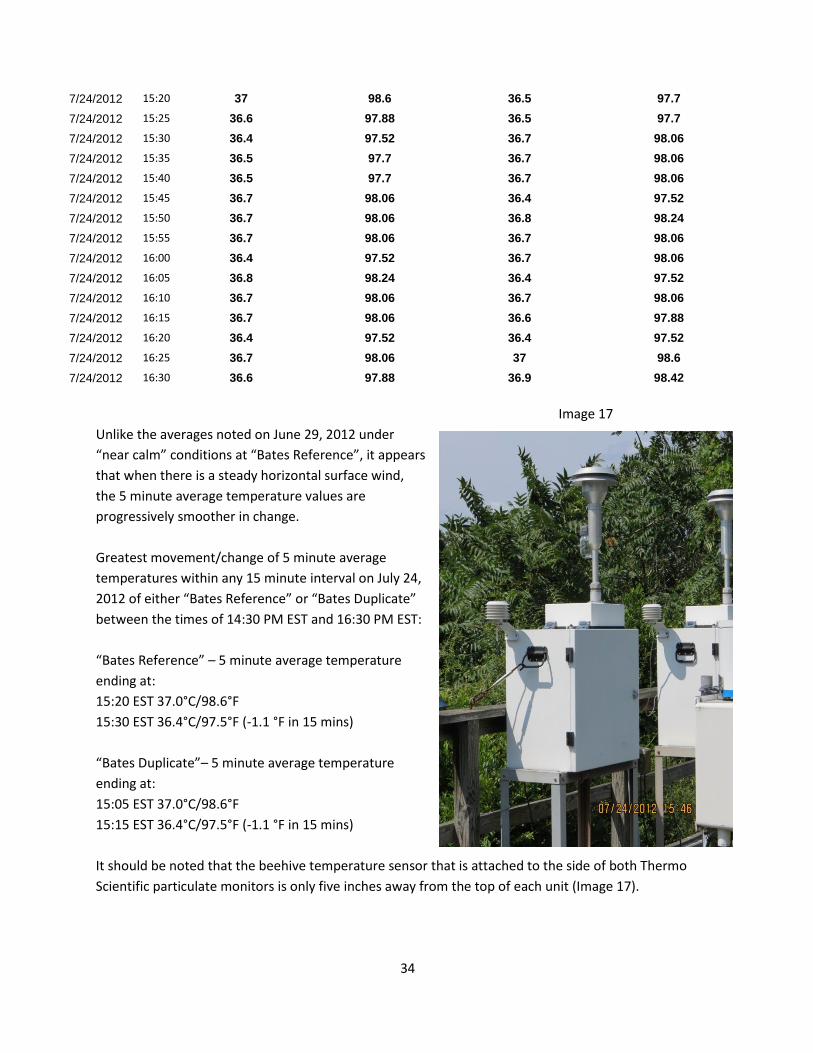
Below are the 3:30 PM-5:30 PM EDT 5-min average values on July 24, 2012 for the DHEC “Bates
Reference” and “Bates Duplicate” monitors:
EST Bates Reference (°C) Bates Reference (°F) Bates Duplicate (°C) Bates Duplicate (°F)
7/24/2012 14:30 36.2 97.16 36.4 97.52
7/24/2012 14:35 36.3 97.34 36.4 97.52
7/24/2012 14:40 36.4 97.52 36.2 97.16
7/24/2012 14:45 36.4 97.52 36.6 97.88
7/24/2012 14:50 36.4 97.52 36.7 98.06
7/24/2012 14:55 36.2 97.16 36.6 97.88
7/24/2012 15:00 36.6 97.88 36.4 97.52
7/24/2012 15:05 36.7 98.06 37 98.6
7/24/2012 15:10 36.6 97.88 36.6 97.88
7/24/2012 15:15 36.4 97.52 36.4 97.52
7/24/2012 15:20 37 98.6 36.5 97.7
7/24/2012 15:25 36.6 97.88 36.5 97.7
7/24/2012 15:30 36.4 97.52 36.7 98.06
7/24/2012 15:35 36.5 97.7 36.7 98.06
7/24/2012 15:40 36.5 97.7 36.7 98.06
7/24/2012 15:45 36.7 98.06 36.4 97.52
7/24/2012 15:50 36.7 98.06 36.8 98.24
7/24/2012 15:55 36.7 98.06 36.7 98.06
7/24/2012 16:00 36.4 97.52 36.7 98.06
7/24/2012 16:05 36.8 98.24 36.4 97.52
7/24/2012 16:10 36.7 98.06 36.7 98.06
7/24/2012 16:15 36.7 98.06 36.6 97.88
7/24/2012 16:20 36.4 97.52 36.4 97.52
7/24/2012 16:25 36.7 98.06 37 98.6
7/24/2012 16:30 36.6 97.88 36.9 98.42
Image 17
Unlike the averages noted on June 29, 2012 under
“near calm” conditions at “Bates Reference”, it appears
that when there is a steady horizontal surface wind,
the 5 minute average temperature values are
progressively smoother in change.
Greatest movement/change of 5 minute average
temperatures within any 15 minute interval on July 24,
2012 of either “Bates Reference” or “Bates Duplicate”
between the times of 14:30 PM EST and 16:30 PM EST:
“Bates Reference” – 5 minute average temperature
ending at:
15:20 EST 37.0°C/98.6°F
15:30 EST 36.4°C/97.5°F (-1.1 °F in 15 mins)
“Bates Duplicate”– 5 minute average temperature
ending at:
15:05 EST 37.0°C/98.6°F
15:15 EST 36.4°C/97.5°F (-1.1 °F in 15 mins)
It should be noted that the beehive temperature sensor that is attached to the side of both Thermo
Scientific particulate monitors is only five inches away from the top of each unit (Image 17).
34

SC DHEC Platform Mounted Environmental Sampling Monitors
SCO Portable Shelter Scott Reynolds, DHEC, kneeling – “Bates Reference”
35

Ambient temperatures on July 24, 2012 as recorded by the BetaTherm instrument
belonging to the USC Department of Geography (Figure 2):
The high value of 37.74°C (99.9°F) was recorded at approximately 18:00 EDT. Of note, at approximately
13:35 EDT, the value of 36.0°C/96.8°F fell to 34.8°C/94.6°F (2.2°F in 10 minutes). During the next 10
minutes, the temperature rose to 36.0°C/96.8°F (2.2°F). At approximately 17:30 EDT, the temperature
value rose 1.6°C (2.9°F) from 36.1°C/97.0°F to the 18:00 EDT value of 37.7°C/99.9°F. The temperature
fluctuations after the observed peak (18:00 EDT) are significantly smaller than the ones prior to the
peak, resulting in a much smoother temperature trace.
Figure 2. USC Department of Geography BetaTherm instrument graph.
36
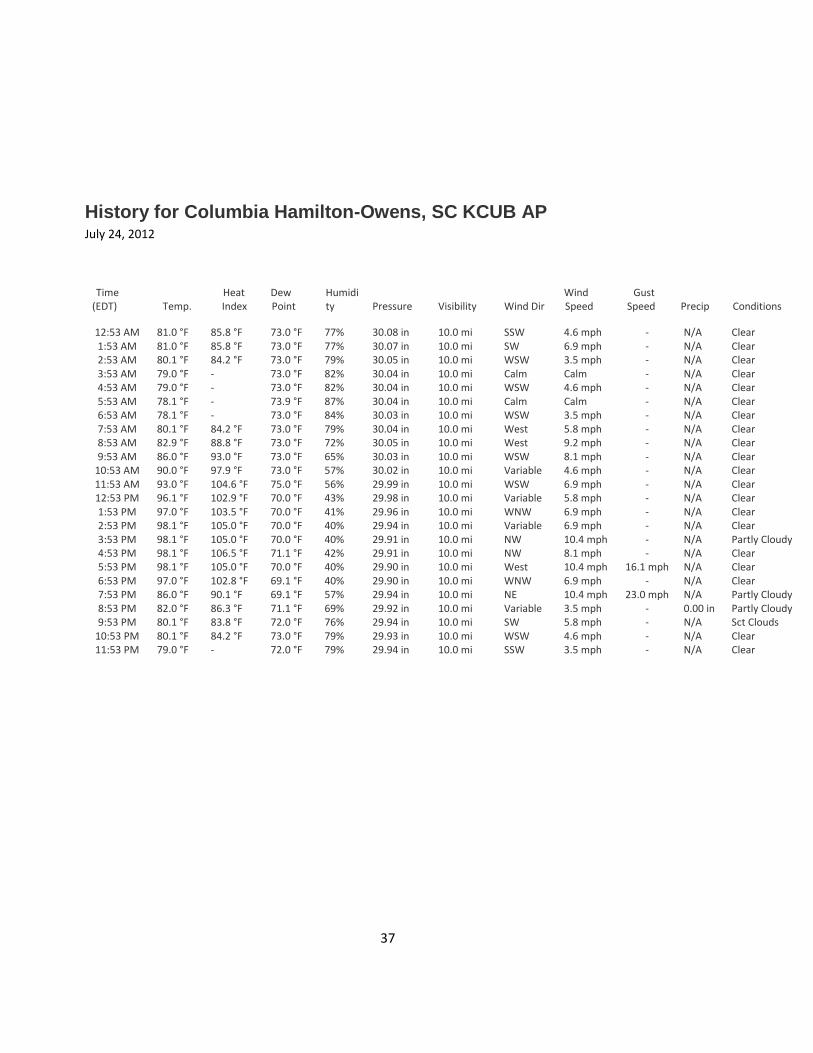
History for Columbia Hamilton-Owens, SC KCUB AP July 24, 2012
Time (EDT) Temp.
Heat Index
Dew Point
Humidity Pressure Visibility Wind Dir
Wind Speed
Gust Speed Precip Conditions
12:53 AM 81.0 °F 85.8 °F 73.0 °F 77% 30.08 in 10.0 mi SSW 4.6 mph - N/A Clear 1:53 AM 81.0 °F 85.8 °F 73.0 °F 77% 30.07 in 10.0 mi SW 6.9 mph - N/A Clear 2:53 AM 80.1 °F 84.2 °F 73.0 °F 79% 30.05 in 10.0 mi WSW 3.5 mph - N/A Clear 3:53 AM 79.0 °F - 73.0 °F 82% 30.04 in 10.0 mi Calm Calm - N/A Clear 4:53 AM 79.0 °F - 73.0 °F 82% 30.04 in 10.0 mi WSW 4.6 mph - N/A Clear 5:53 AM 78.1 °F - 73.9 °F 87% 30.04 in 10.0 mi Calm Calm - N/A Clear 6:53 AM 78.1 °F - 73.0 °F 84% 30.03 in 10.0 mi WSW 3.5 mph - N/A Clear 7:53 AM 80.1 °F 84.2 °F 73.0 °F 79% 30.04 in 10.0 mi West 5.8 mph - N/A Clear 8:53 AM 82.9 °F 88.8 °F 73.0 °F 72% 30.05 in 10.0 mi West 9.2 mph - N/A Clear 9:53 AM 86.0 °F 93.0 °F 73.0 °F 65% 30.03 in 10.0 mi WSW 8.1 mph - N/A Clear
10:53 AM 90.0 °F 97.9 °F 73.0 °F 57% 30.02 in 10.0 mi Variable 4.6 mph - N/A Clear 11:53 AM 93.0 °F 104.6 °F 75.0 °F 56% 29.99 in 10.0 mi WSW 6.9 mph - N/A Clear 12:53 PM 96.1 °F 102.9 °F 70.0 °F 43% 29.98 in 10.0 mi Variable 5.8 mph - N/A Clear 1:53 PM 97.0 °F 103.5 °F 70.0 °F 41% 29.96 in 10.0 mi WNW 6.9 mph - N/A Clear 2:53 PM 98.1 °F 105.0 °F 70.0 °F 40% 29.94 in 10.0 mi Variable 6.9 mph - N/A Clear 3:53 PM 98.1 °F 105.0 °F 70.0 °F 40% 29.91 in 10.0 mi NW 10.4 mph - N/A Partly Cloudy 4:53 PM 98.1 °F 106.5 °F 71.1 °F 42% 29.91 in 10.0 mi NW 8.1 mph - N/A Clear 5:53 PM 98.1 °F 105.0 °F 70.0 °F 40% 29.90 in 10.0 mi West 10.4 mph 16.1 mph N/A Clear 6:53 PM 97.0 °F 102.8 °F 69.1 °F 40% 29.90 in 10.0 mi WNW 6.9 mph - N/A Clear 7:53 PM 86.0 °F 90.1 °F 69.1 °F 57% 29.94 in 10.0 mi NE 10.4 mph 23.0 mph N/A Partly Cloudy 8:53 PM 82.0 °F 86.3 °F 71.1 °F 69% 29.92 in 10.0 mi Variable 3.5 mph - 0.00 in Partly Cloudy 9:53 PM 80.1 °F 83.8 °F 72.0 °F 76% 29.94 in 10.0 mi SW 5.8 mph - N/A Sct Clouds
10:53 PM 80.1 °F 84.2 °F 73.0 °F 79% 29.93 in 10.0 mi WSW 4.6 mph - N/A Clear 11:53 PM 79.0 °F - 72.0 °F 79% 29.94 in 10.0 mi SSW 3.5 mph - N/A Clear
37
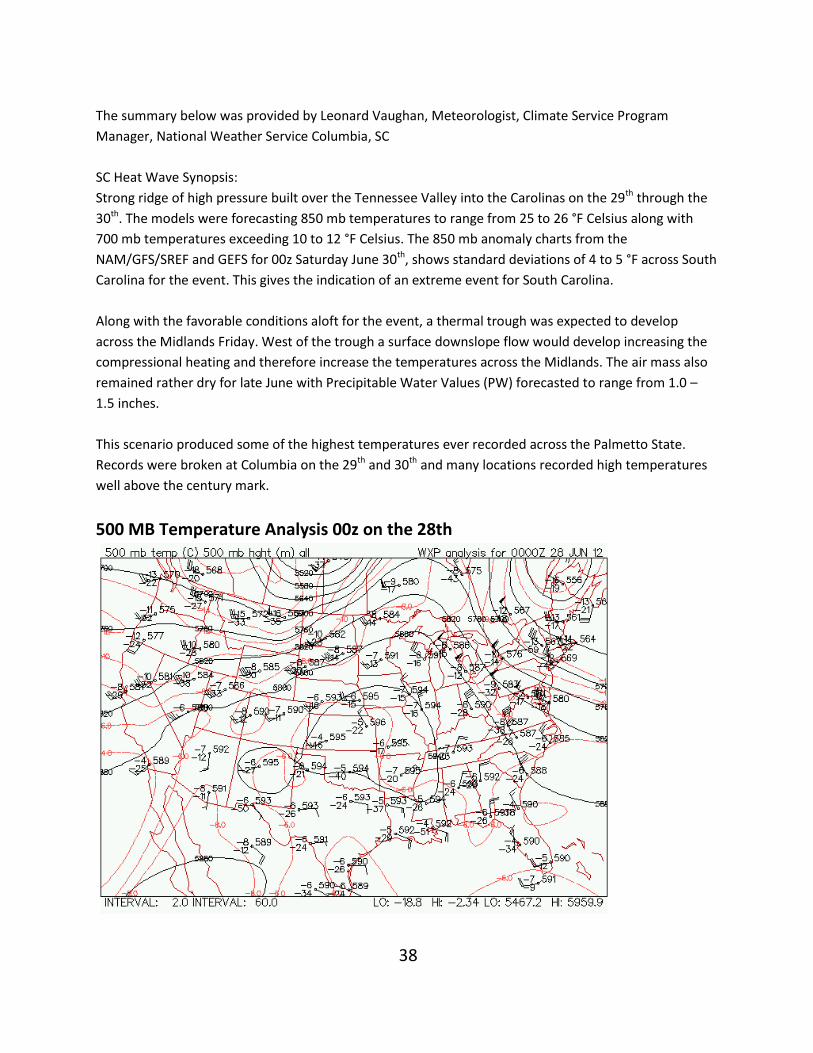
The summary below was provided by Leonard Vaughan, Meteorologist, Climate Service Program
Manager, National Weather Service Columbia, SC
SC Heat Wave Synopsis:
Strong ridge of high pressure built over the Tennessee Valley into the Carolinas on the 29th through the
30th. The models were forecasting 850 mb temperatures to range from 25 to 26 °F Celsius along with
700 mb temperatures exceeding 10 to 12 °F Celsius. The 850 mb anomaly charts from the
NAM/GFS/SREF and GEFS for 00z Saturday June 30th, shows standard deviations of 4 to 5 °F across South
Carolina for the event. This gives the indication of an extreme event for South Carolina.
Along with the favorable conditions aloft for the event, a thermal trough was expected to develop
across the Midlands Friday. West of the trough a surface downslope flow would develop increasing the
compressional heating and therefore increase the temperatures across the Midlands. The air mass also
remained rather dry for late June with Precipitable Water Values (PW) forecasted to range from 1.0 –
1.5 inches.
This scenario produced some of the highest temperatures ever recorded across the Palmetto State.
Records were broken at Columbia on the 29th and 30th and many locations recorded high temperatures
well above the century mark.
500 MB Temperature Analysis 00z on the 28th
38

500 MB Temperature Analysis 12z on the 28th
500 MB Temperature Analysis 00z on the 29th
39

500 MB Temperature Analysis 00z on the 30th
500 MB Temperature Analysis 12z on the 30th
40
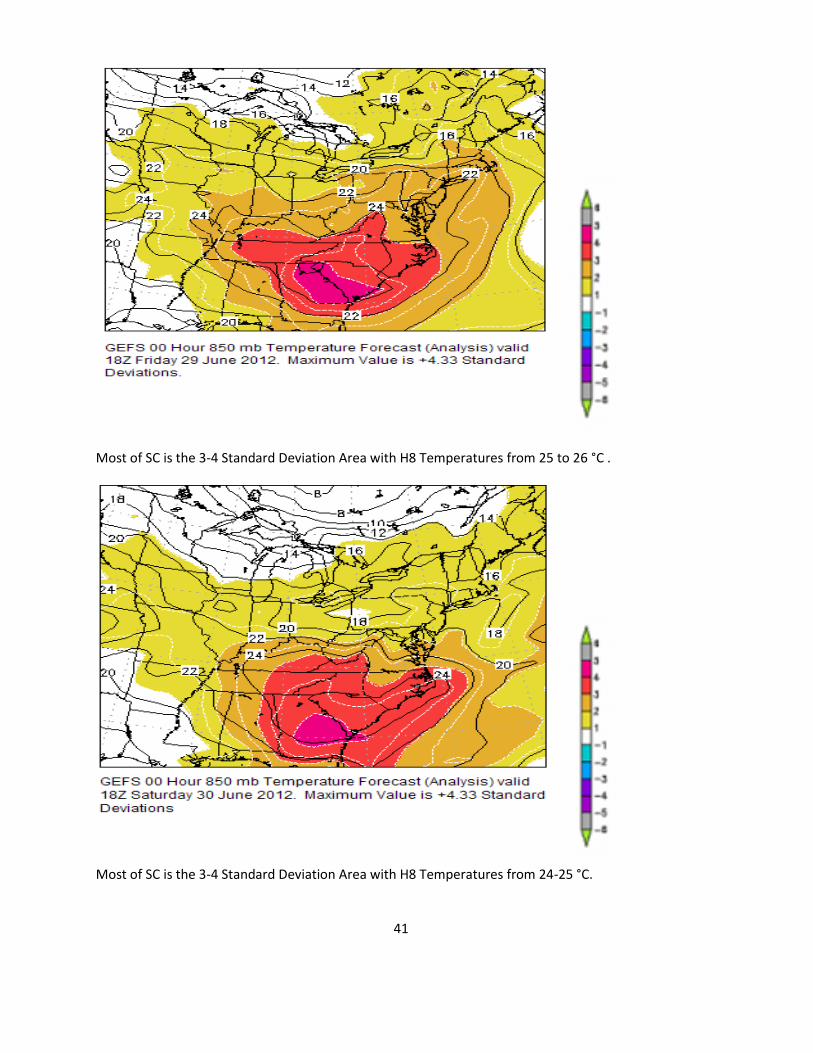
Most of SC is the 3-4 Standard Deviation Area with H8 Temperatures from 25 to 26 °C .
Most of SC is the 3-4 Standard Deviation Area with H8 Temperatures from 24-25 °C.
41
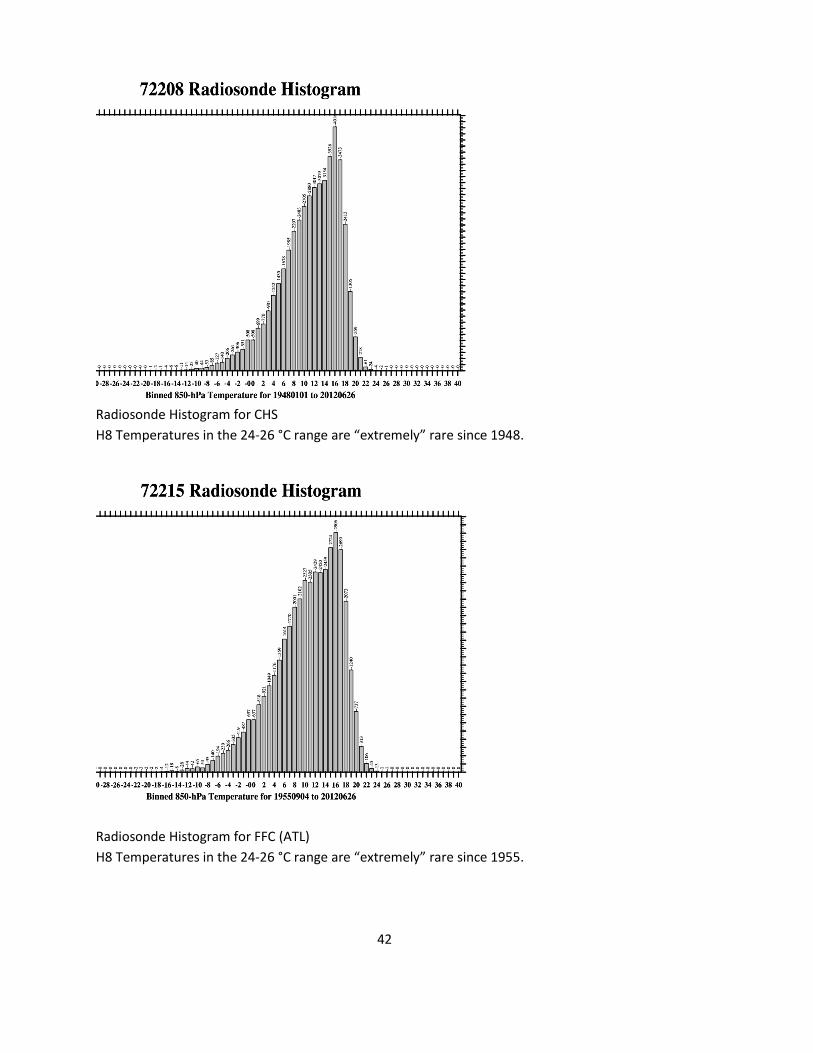
Radiosonde Histogram for CHS
H8 Temperatures in the 24-26 °C range are “extremely” rare since 1948.
Radiosonde Histogram for FFC (ATL)
H8 Temperatures in the 24-26 °C range are “extremely” rare since 1955.
42

Radiosonde Histogram for GSO
H8 Temperatures in the 24-26 °C range are “extremely” rare since 1948.
43
44

The Record Breaking Heatwave that occurred on June 29th and 30th was an extremely rare event. The
850mb Temperatures that occurred across the area were extremely rare when compared to histograms
from ATL, GSO and CHS. There had been very few cases in the past 57 to 64 years. This would include
the historic record head event of the 1950s, especially the 1952 event. The “Standard Deviations” for
this event were in the 3 to 4 positive range with the highest values around plus 4.33 along the Savannah
River Valley and across South-Central Georgia.
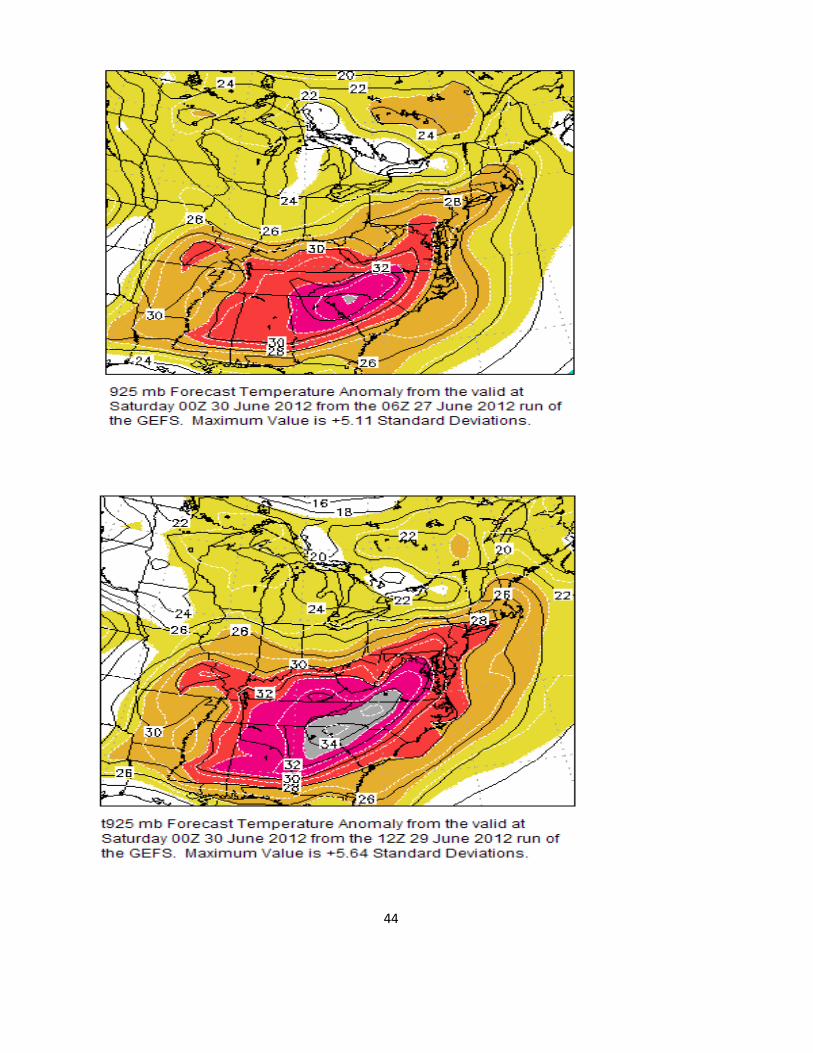
The 925mb Temperatures were even more impressive with Standard Deviations between 5 and 5.64
positive range and values in the 30 to 34 degree Celsius range
45
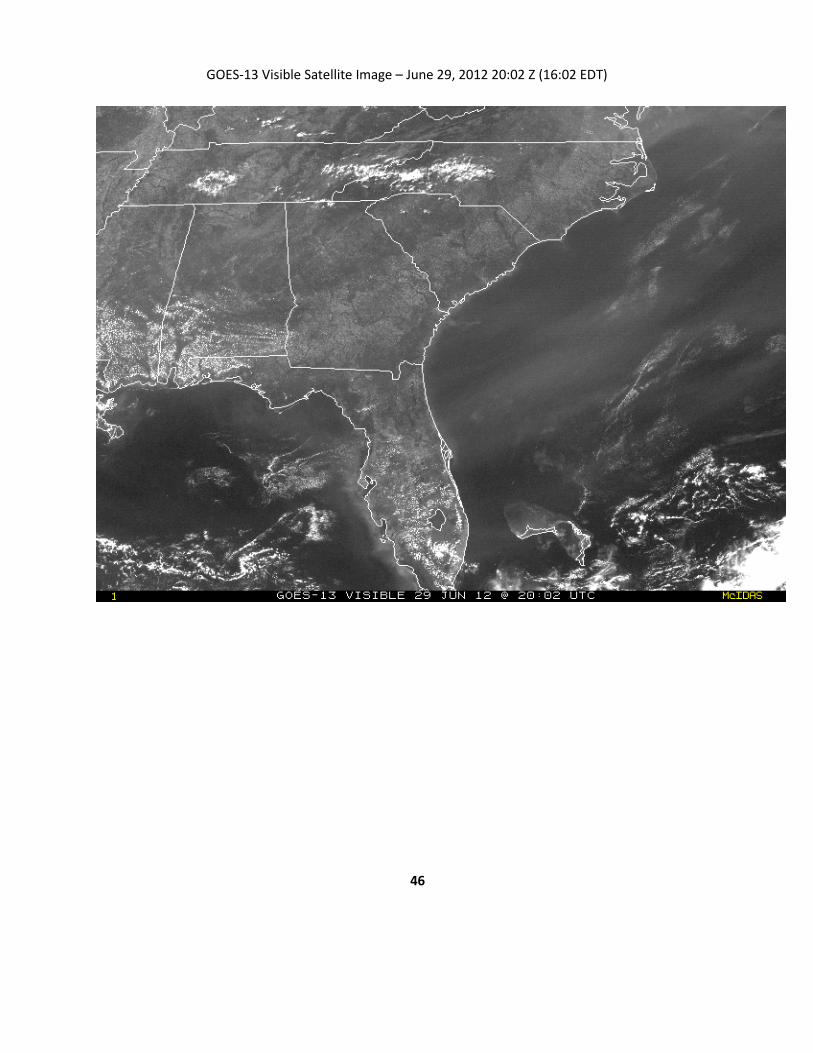
GOES-13 Visible Satellite Image – June 29, 2012 20:02 Z (16:02 EDT)
46

State Climate Extremes Committee National Oceanic and Atmospheric Administration
National Climatic Data Center
Overview Operational Details
Reports Elements Tracked
Records Contact
A fully-detailed set of operational guidelines are also available in National Weather
Service Instruction 10-1004.
1. Purpose
The formation of a State Climate Extremes Committee (SCEC) addresses the
consideration of potentially record-setting extreme meteorological elements observed at
the statewide level. The purpose of the SCEC is to mirror the activities of the National
Climatic Extremes Committee (NCEC), but for observations challenging state records,
rather than national ones. The SCEC serves as an advisory panel that will make
recommendations regarding state records to the director of the NCDC. With the
agreement of the NCDC Director, such records will become officially sanctioned, and
recognized by the meteorological and climatological community.
2. Scope
The SCEC is to provide counsel and a recommendation regarding the status of an
observation of a meteorological element (e.g., maximum temperature) that challenges
the existing, official record value for that element for a given state. If such observations
also challenge a national record, the involvement of the SCEC will be to render a
recommendation regarding the state record only. The case will be forwarded and
considered separately by the NCEC.
While many aspects of meteorological elements may be tracked, and record extremes
determined, officiating and tracking many of the elements that are of extremely limited
47

interest or use to the public would unnessicarily burden the SCEC. Therefore, the SCEC
has compiled an inital list of elements that are to be tracked. These elements have
demonstrated a strong public interest, and the historical data for these elements are
readily available for a large number of observation stations across the United States.
3. Composition and convening
The SCEC will be an ad hoc committee comprised of the following five voting members:
A representative from the Weather Forecast Office (WFO) holding jurisdiction over the station recording a potential record. The Meteorologist in charge (MIC), or the climate focal point is preferred.
The State Climatologist (SC) for the state in which the record is being challenged. If the state does not have an SC, the SC from a neighboring state will be asked to serve.
A representative from the NWS Regional Headquarters. Preferrably this will be the NWS Regional Climate Services Program Manager (CSPM) or the Regional COOP Program Manager.
A representative from the relevant Regional Climate Center. Preferrably this will be the Regional Climatologist or the RCC Director.
A representative from NCDC. The NCDC National Partnership Liaison will serve in this capacity.
Additional non-voting members may be asked to participate. This is often the case
where the input of a particular subject matter expert is desirable. A quorum of the
committee is considered to be three of the five voting members.
The committee may be called by any member, but in general, it will be expected that
either the relevant WFO or the SC for the affected state will call for the committee to
convene. The committee will dissolve once a recommendation has been reached
regarding a challenged record value, or when the challenge has been withdrawn.
Recommendations will carry with a simple majority vote. The director of the NCDC
renders the final decision regarding any SCEC recommendation, and may override
SCEC voting results or send the decision back to the SCEC for further review.
It is expected that most discussion and voting of the committee will take place via either
E-mail or teleconference (see Section 4). Occasionally, it may be necessary for the
committee to meet in person. If the in-person meeting is to discuss a particular state
record, the meeting should occur in the state in question (as a site visit may be
necessary). Such a meeting should be arranged by a member based in that state.
4. Record Recognition Process
48

The SCEC will compile a list of the extant records listed in Table 1 for each state of the
United States. These records will be reviewed to determine their validity and, if found to
be acceptable, will be recommended to the NCDC Director for inclusion in the statewide
records data set. As of April, 2010 NCDC has reviewed and updated the statewide
extremes tables for all-time maximum and minimum temperature, 24-hr precipitation
and snowfall, and all-time greatest snow depth. Remaining tables of the tracked
elements will be subsequently updated.
Thereafter, the challenge of an SCEC officially recognized statewide record is expected
to follow the following guidelines:
1. If the WFO or the SC thinks a statewide record may have been set, a representative from the WFO or SC office (preferably the WFO) should visit the site of the record within 2 days of notification of the record and take the following action.
o Test equipment to ensure proper working order. o Examine and describe exposure and take pictures.
2. After the site visit, the WFO representative or SC should send an E-mail to all members of the SCEC (see Section 3) informing them of a challenge to the record. Information/photos from the site visit should be attached to the E-mail.
3. At this point, the WFO should transmit a preliminary Record Event Report (RER). The RER should clearly indicate that the record is under review, and final determination will be forthcoming.
4. Once the WFO or SC sends the initial SCEC E-mail, they should set up a teleconference call that includes all members of the SCEC.
o The teleconference should take place within the soonest practical timeframe after the E-mail from the WFO or SC is received.
o If any member of the SCEC is unavailable, they should notify the committee of their absence. They may provide input via E-mail, but their vote would either be abstained, or cast by their alternate or other proxy acceptable to the committee.
5. Each SCEC member will review the validity of the proposed record value, using all tools available to them, prior to the teleconference. They should be prepared to discuss and vote on the validity of the record during the conference call. A second call may be needed if new information is brought to light in the first call.
6. The SCEC will vote for or against recommending to the director of the NCDC that the record be updated. A simple majority will carry the vote.
7. The director of the NCDC will be informed of the challenge to the record, and will be given the recommendation of the SCEC. The director, or their officially designated proxy, will render an official decision on the record. The decision of the NCDC Director or proxy will be final.
NWS Instruction 10-1004 limited recognition of statewide climate records to those
values originating from official NOAA-sanctioned weather stations. However, it has
49

become evident that limiting the recognition of official climatological records to only
official observations (e.g., NOAA weather stations) may result in legitimate
meteorological observations being dismissed on non scientific grounds. Therefore, the
SCEC has taken the informal stance that a meteorolgical observation being considered
for a statewide record may come from any legitimate metorological observation
platform, provided the value has first been vetted by either the State Climatologist or a
local NWS representative. When evaluating a value that has come from a source
external to NOAA's officially sanctioned weather observing network, the SCEC requires
that:
The observation is meteorologically sound and climatologically representative of the climate of the region (e.g., not biased by micro-climatological, anthropogenic, geologic, or combustion factors).
The observing platform meets or exceeds instrument and siting standards set forth by the WMO, OFCM, and NOAA.
The instrument/sensor has operational parameters which support the observation. If an observation is beyond the operational envelope of the instrument, the instrument may be forwarded to a standards facility for testing.
The data collected by the instrument is archived indefinitely, along with any quality control and metadata information pertaining to the data, sensor, platform or network.
Public access to the data and all accompanying metadata is unrestricted (although the access may be fee-based).
5. Erroneous records
If upon future examination, it comes to the attention of a member of an organization
represented on the SCEC that an officially recognized statewide record may be in error
or otherwise invalid, that member of the SCEC should send an E-mail to the committee,
informing them of the questionable record, and including documentation in support of
the challenge.
The challenging member should then invite all members to a teleconference, where the
record will be discussed and a recommendation regarding validity voted upon.
If a challenge to the validity of an existing official statewide record is made by someone
outside the committee structure, the challenge should be directed toward the relevant
WFO or SC, who will review the challenge and, if the evidence warrants it, forward the
challenge to the committee as per the steps outlined in the previous paragraph. If the
NCDC Director or designated proxy determines that a record value should be changed,
they have the authority to order the change without involving the SCEC, but are
50

expected to notify the NCDC National Partnership Liaison of their decision so the SCEC
records tables may be updated.
6. Public visibility
NCDC, NWS, State Climatologists, and/or the American Association of State
Climatologists may wish to publish a table of state records and/or post them on the web.
The table may include the officially sanctioned record values, the date on which the
records were set, and the stations at which they were set. Web postings may also
describe the SCEC mission, the records it tracks, and the steps for reporting potential
records or challenging existing records. This SCEC website contains all of the
aforementioned information.
51

NATIONAL WEATHER SERVICE MANUAL 10-1315
October 5, 2010
Operations and Services
Surface Observing Program (Land), NDSPD 10-13
Cooperative Station Observations
APPENDIX B – Air Temperature Table of Contents: Page 1. Definition ................................................................................................................................B-2 2. Types of Thermometers .........................................................................................................B-2 3. Instrument Shelters ................................................................................................................B-3 3.1 Shelter Placement ................................................................................................................B-3 3.2 Shelter Maintenance ............................................................................................................B-4 4. Liquid-in-Glass Maximum/Minimum Thermometers ...............................................................B-4 4.1 Mercury Clean-Up ................................................................................................................B-4 4.2 Maximum Thermometer - How It Works ..............................................................................B-5 4.3 Minimum Thermometer - How It Works................................................................................B-6 4.4 Mounting and Maintaining the Thermometer Support .........................................................B-6 4.5 Mounting the Thermometers.................................................................................................B-7 4.6 How to Read and Record Temperatures .............................................................................B-7 4.6.1 Reading and Setting the Maximum Thermometer.............................................................B-9 4.6.2 Reading and Setting the Minimum Thermometer .............................................................B-11 4.6.3 Reading the Current Temperature.....................................................................................B-11 5. Correcting Thermometer Errors..............................................................................................B-11 5.1 Correcting Maximum Thermometers ...................................................................................B-11 5.2 Correcting Minimum Thermometers ....................................................................................B-12 1. Definitions. The word temperature as used in this appendix refers only to the air temperature. Temperature readings are taken from maximum and minimum thermometers, or from the digital displays of an electronic thermometer. The minimum temperature is the lowest temperature to have occurred since the minimum thermometer or on the electronic thermometer since it was last read and reset. The maximum temperature is the highest temperature since the maximum thermometer or electronic thermometer since it was last read and reset. The current temperature is the temperature at the time the thermometer or electronic thermometer is read. This is read from the maximum thermometer while in a vertical position after it has been whirled.
2. Types of Thermometers. There are two types of temperature sensors approved at cooperative stations; the liquid-in-glass maximum and minimum thermometers (Figure B-1) and the electronic thermometers (seen in background of Figure B-2). Figure B-1 shows the liquid-inglass (LIG) maximum and minimum thermometers in their correct operating or measuring positions. The LIG thermometers are required to be housed within a Cotton Region Shelter (CRS). The CRS is pictured in Figure B-2.
52
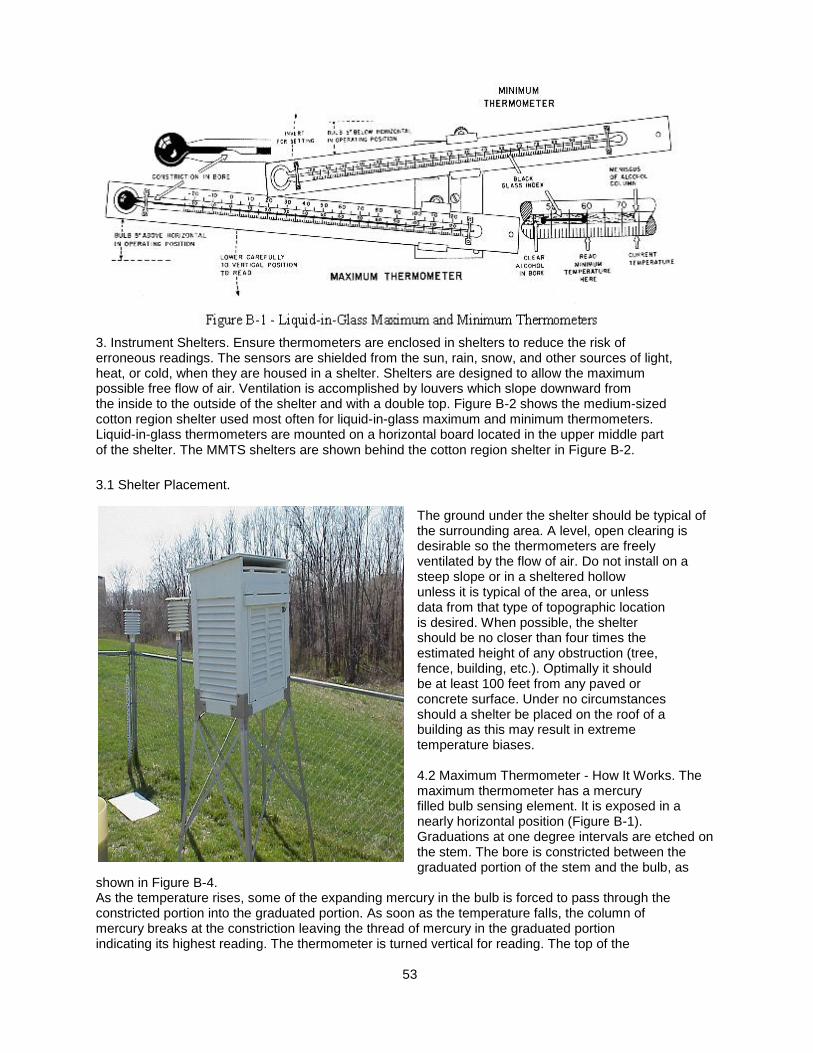
3. Instrument Shelters. Ensure thermometers are enclosed in shelters to reduce the risk of erroneous readings. The sensors are shielded from the sun, rain, snow, and other sources of light, heat, or cold, when they are housed in a shelter. Shelters are designed to allow the maximum possible free flow of air. Ventilation is accomplished by louvers which slope downward from the inside to the outside of the shelter and with a double top. Figure B-2 shows the medium-sized cotton region shelter used most often for liquid-in-glass maximum and minimum thermometers. Liquid-in-glass thermometers are mounted on a horizontal board located in the upper middle part of the shelter. The MMTS shelters are shown behind the cotton region shelter in Figure B-2.
3.1 Shelter Placement. The ground under the shelter should be typical of the surrounding area. A level, open clearing is desirable so the thermometers are freely ventilated by the flow of air. Do not install on a steep slope or in a sheltered hollow unless it is typical of the area, or unless data from that type of topographic location is desired. When possible, the shelter should be no closer than four times the estimated height of any obstruction (tree, fence, building, etc.). Optimally it should be at least 100 feet from any paved or concrete surface. Under no circumstances should a shelter be placed on the roof of a building as this may result in extreme temperature biases. 4.2 Maximum Thermometer - How It Works. The maximum thermometer has a mercury filled bulb sensing element. It is exposed in a nearly horizontal position (Figure B-1). Graduations at one degree intervals are etched on the stem. The bore is constricted between the graduated portion of the stem and the bulb, as
shown in Figure B-4. As the temperature rises, some of the expanding mercury in the bulb is forced to pass through the constricted portion into the graduated portion. As soon as the temperature falls, the column of mercury breaks at the constriction leaving the thread of mercury in the graduated portion indicating its highest reading. The thermometer is turned vertical for reading. The top of the 53

mercury column indicates the highest temperature reached. Once the maximum temperature is read, the max thermometer is spun in its mount to force the mercury in the graduated tube past the constriction until it joins the mercury in the bulb. When joined, the maximum thermometer will indicate the current air temperature.
4.6 How to Read and Record Temperatures. Thermometers are read and recorded to the nearest whole degree Fahrenheit. Readings are usually recorded on WS Form B-82, and WS Form B-91, or WS Form B-92. Temperatures below zero are recorded with a minus (−) sign to the left of the digits; i.e., −15°F for 15°F below zero. The thermometers should be reset after they are read, as described in Sections 4.6.1, 4.6.2 and Figure B-7. Caution: Stand as far from the thermometers as possible to prevent body heat from changing the readings. This is particularly important in cold weather. The bulbs of the thermometers should not be touched. 4.6.1 Reading and Setting the Maximum Thermometer. The highest temperature occurring since the maximum temperature was previously reset is the reading at the top of the mercury column, taken with the bulb end lowered. Release the support catch on the back of the clamp and carefully lower the bulb end of the thermometer. See Figure B-9. To reset the maximum thermometer, start with the bulb end lowered and whirl it rapidly, allowing it to spin freely until it comes to rest. Repeat the whirling if necessary until the mercury will not retreat farther into the bulb; i.e., until the column is no longer separated at or below the constriction. See Figure B-10. Next, move the catch on the support until it touches the longer shaft. Carefully elevate the bulb end of the thermometer until the catch locks the shaft in place on the support. The thermometer is now “set” to indicate the maximum temperature that occurs before it is set again.
54
Summary Findings
Johnston 4SW There were a wide range of same-time temperature values observed by the Johnston Cotton Region Shelter mercury thermometer, the Davis and Nimbus MMTS systems. For example: On July 3 at 10:30 AM, the Nimbus MMT displayed 88.8°F while the Davis displayed 89.1°F (within 0.3 degrees of each other) yet the shelter thermometer read 94.8°F. The Davis instrument logged a maximum value on June 29, 2012 of 106.6°F. The nearest highest value reported by a NWS COOP site on June 29, 2012 was Saluda with 109°F (4 degrees less than Johnston). The nearest AWOS airport highest value reported on June 29, 2012 was 105.8°F at Aiken, SC KAIK AP and the nearest ASOS airport highest value reported was 107°F at Augusta, GA KDNL “Daniel” AP. Wind speeds recorded at nearby Aiken AP were from the south and generally less than 5 mph after the 2:35 PM observation with periods of calm air through the peak heating of the day. The reported maximum temperature of 104°F on the morning of July 11, 2012 was suspiciously the same value as the day before and 8 degrees higher than its nearest NWS COOP site of Saluda that reported 96 degrees. This 104°F report suggests that the maximum thermometer was not reset the day before. On July 26, 2012, it was discovered that the method of making the daily maximum temperature value at Johnston on June 29, 2012 was not made according to the NWS guidelines of viewing the indexed temperature value by releasing the locked Townsend supported NWS maximum mercury thermometer horizontal position to the vertical viewing position. This is a known error that compromises accuracy. Temperature comparisons using the SCO portable shelter on July 26 with the Johnston Cotton Region Shelter revealed a running temperature difference of between 2.2 and 2.5 degrees during the test. The SCO portable NWS standard thermometer was continuously cooler regardless of being only a few feet away or relocated to a more open area on Mr. Berry’s property. Surface winds on this date were quite brisk from the west all during the visit. 55

Columbia USC Once again the practice of observing the daily maximum temperature at the USC site was discovered on July 12, 2012 to be outside of the NWS recommended guidelines. The observer, Mike Leitzke, was unaware of the correct method of viewing the Townsend supported maximum mercury thermometers temperature value from the released vertical position. Continuous temperature recordings by the USC Department of Geography BetaTherm instrument adjacent to the USC shelter on June 29, 2012 indicated a high value of 111.2°F at approximately 4:23 PM EDT. Of interest is that between the approximate times of 4:07 PM EDT and 4:23 PM EDT (a period of 16 minutes) the temperature rose from 106°F to 111°F. The nearest ASOS surface weather observations at Columbia Hamilton-Owens AP on June 29, 2012
reported a high value of 110°F at 5:05 PM EDT. SC DHEC particulate monitors that also record temperature reported a high value of 113.2°F but the time could not be determined. By reviewing the 5-minute average values it is likely that the 113.2°F occurred near 4:30 PM EDT. There were two notable fluctuations in the DHEC 5-minute average temperature observations on June 29, 2012 within any 15-minute interval. The 5-minute average temperature for the 15-minute interval ending at 15:30 EST rose 3.2 degrees. The 5-minute average temperature for the 15-minute interval ending at 15:45 EST fell 3.1 degrees. This represents a 6.3 degree range in average temperature over 30 minutes. This would suggest that air speeds over nearby and direct sun-exposed surfaces were influencing the sensitivity of the temperature sensor. Temperature comparisons on July, 24 2012 between the SCO portable shelter, DHEC monitors, USC Department of Geography BetaTherm instrument and the USC COOP shelter revealed the following: There were also two notable temperature fluctuations in the running USC BetaTherm trace on July 24, 2012. At approximately 13:35 EDT, the temperature was traced at 36.2°F/97.2°F and in 10 minutes fell to 34.8°C/94.6°F (a change of 1.4°C/2.6°F). During the following 15 minutes, the temperature rose to 36.0°C/96.8°F (a change of 1.2°C/2.2°F). At 5:15 PM on July 24, 2012, the SCO portable NWS maximum thermometer read 99.0 °F released from the Townsend support and in the vertical position. The USC thermometer read 99.8 °F in the released vertical position and the DHEC monitor “Bates Reference “read 98.4 °F while the “Bates Duplicate” read 99.1 °F. At this observation, NW winds were steady at around 8-10 mph. The SCO portable shelter thermometer and DHEC thermometers were within 0.6°F of each other. The USC shelter thermometer was at least 0.7°F higher. The maximum temperature recorded on this date by the USC BetaTherm was 99.9°F at approximately 6:02 PM. Numerous monitoring units are near the USC Cotton Region Shelter and may contribute as artificial heat sources, especially on days of light winds or calm air and thus influence the observable temperature. 56

Acknowledgements: Dr. Hope Mizzell, South Carolina State Climatologist Kim Campbell, Meteorologist in Charge, NWS Columbia, SC Dr. Cary Mock, University of South Carolina Department of Geography April Hiscox, Associate Professor University of South Carolina Department of Geography Scott Reynolds, Division of Air Quality Analysis, South Carolina Department of Health and Environmental Control Steve Dennis, Environmental Quality Manager, South Carolina Department of Health and Environmental Control Ivetta Abramyan, Meteorologist, Florida State University, Masters Program, University of South Carolina, SC State Climatology Office Intern Deke Arndt, State Climate Extremes Committee, NCDC, Asheville, NC Jeff Robel, Physical Scientist, NCDC, Asheville, NC Axel Grauman, Meteorologist, Satellite Services Group, Asheville, NC Sam McCown, Meteorologist, NESDIS, NCDC, Asheville, NC Southeast Regional Climate Center, Chapel Hill, NC Ann Nolte, Editor, South Carolina Department of Natural Resources Denise Frost, Graphics, South Carolina Department of Natural Resources
57

Appendix B Johnston 4 SW and Columbia USC Cooperative Records: June 2012
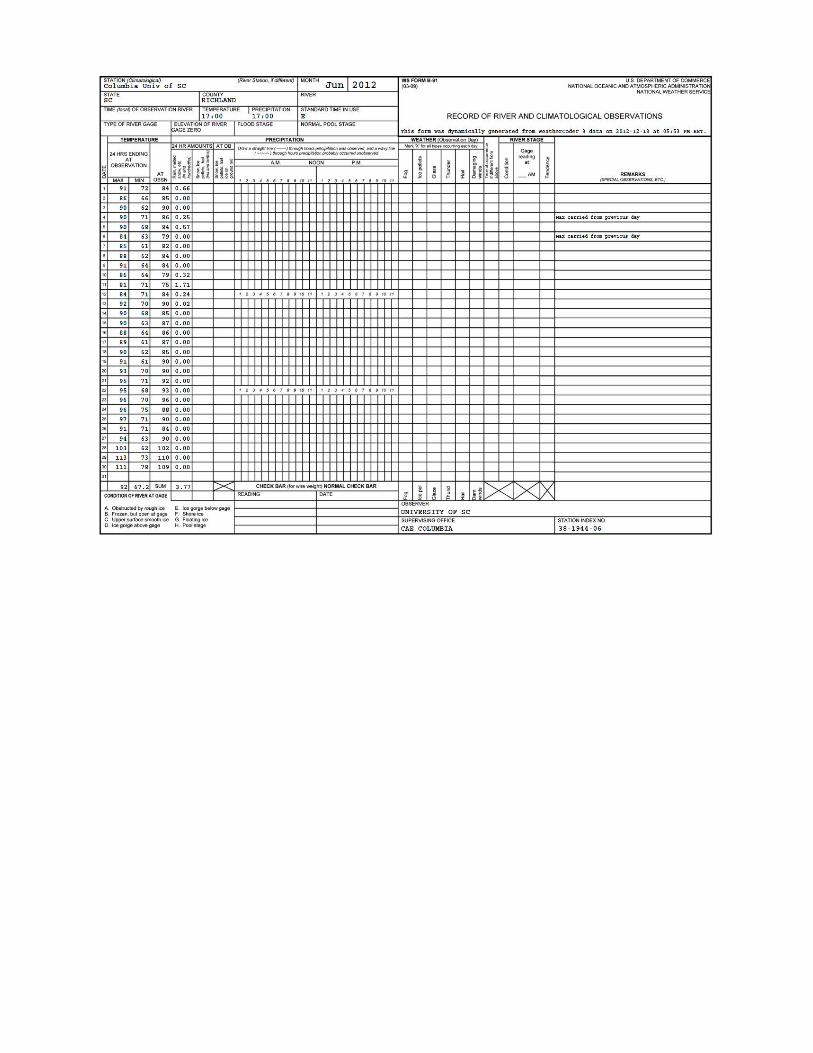

Appendix C: Blackville and Calhoun Falls Cooperative Records September 1925
Camden 2 WSW Cooperative Record June 1954