South Carolina Economic Analysis Report...Gross Domestic Product (GDP) The Gross Domestic Product...
51
South Carolina Economic Analysis Report June 30 2015 An examination of the state’s economy and workforce.
Transcript of South Carolina Economic Analysis Report...Gross Domestic Product (GDP) The Gross Domestic Product...
South Carolina Economic Analysis Report
June 30
2015
An examination of the state’s economy and workforce.

South Carolina Department of Employment and Workforce
1 South Carolina 2015 Economic Analysis Report

South Carolina Department of Employment and Workforce
2 South Carolina 2015 Economic Analysis Report
The 2015 South Carolina Economic Analysis Report is published by the Business Intelligence
Department (BID) of the South Carolina Department of Employment and Workforce (SCDEW).
The information and analyses provided in this publication are based on data collected from
sources throughout South Carolina and the United States.
About SCDEW and BID:
The Business Intelligence Department compiles and publishes employment statistics, job
forecasts, wage data, demographics, and other labor market information to help public and
private organizations, researchers, and others better understand today’s complex workforce.
The Business Intelligence Department produced this report under the leadership of:
Executive Director - Cheryl Stanton
Business Intelligence Department Director - Brenda Lisbon
South Carolina Department of Employment and Workforce
1550 Gadsden Street Columbia, South Carolina 29201
(803) 737-2660
www.dew.sc.gov
www.scworkforceinfo.com

South Carolina Department of Employment and Workforce
3 South Carolina 2015 Economic Analysis Report

South Carolina Department of Employment and Workforce
4 South Carolina 2015 Economic Analysis Report
Table of Contents
Executive Summary ...................................................................................................................... 8
Introduction ................................................................................................................................... 9
Gross Domestic Product (GDP) ................................................................................................. 10
Comparison of GDP of Southern Region and South Carolina ................................................. 10
GDP in Recovery Since the Great Recession ........................................................................... 11
GDP by Metropolitan Statistical Area ...................................................................................... 11
State Personal Income ................................................................................................................ 12
Per Capita Personal Income by Metropolitan Statistical Area .................................................. 13
Population Characteristics of South Carolina ......................................................................... 14
South Carolina Labor Force ...................................................................................................... 16
Unemployment Rate ................................................................................................................. 17
Jobless Populations Facing Challenges ..................................................................................... 18
Hispanics ................................................................................................................................... 18
Native Americans...................................................................................................................... 18
Homeless ................................................................................................................................... 18
Veterans .................................................................................................................................... 19
Ex-Offenders ............................................................................................................................. 19
Juvenile Offenders .................................................................................................................... 20
Limited English Proficiency ..................................................................................................... 20
Illiterate ..................................................................................................................................... 20
Migrant/Seasonal Workers........................................................................................................ 21
Foster Care ................................................................................................................................ 21
Temporary Assistance for Needy Families (TANF) ................................................................. 21
Disabled .................................................................................................................................... 22
South Carolina Industry Employment ..................................................................................... 22
South Carolina Leading Industries............................................................................................ 22
South Carolina Occupational Employment ............................................................................. 24

South Carolina Department of Employment and Workforce
5 South Carolina 2015 Economic Analysis Report
Statewide and Local Workforce Investment Area (LWIA) Industry and Occupational
Employment Projections ............................................................................................................ 25
Statewide Industry Employment Projections ............................................................................ 25
Local Workforce Investment Area Industry Employment Projections ..................................... 26
Statewide Occupational Employment Projections .................................................................... 27
Growing or Declining Statewide Occupations ......................................................................... 28
Local Workforce Investment Area Occupational Employment Projections ............................. 30
South Carolina Commuting Patterns ....................................................................................... 30
Job Skills Gap.............................................................................................................................. 33
Data Sources ............................................................................................................................. 33
Labor Supply ............................................................................................................................. 34
Labor Force and Jobs ................................................................................................................ 35
Labor Demand .......................................................................................................................... 37
Labor Supply Versus Labor Demand ....................................................................................... 39
Recent Postsecondary Completers Versus Projected Annual Job Openings ............................ 41
Twelfth Grade Student Career Cluster Choices Versus Projected Annual Openings .............. 44
Soft Skills .................................................................................................................................. 46
Job Skills Gap Conclusion ........................................................................................................ 47
Required Language ..................................................................................................................... 48

South Carolina Department of Employment and Workforce
6 South Carolina 2015 Economic Analysis Report
List of Figures
Figure 1 - South Carolina Real GDP Growth .............................................................................. 10
Figure 2 - Southeastern U.S. Real GDP Growth .......................................................................... 10
Figure 3 - South Carolina Real GDP, 2010-2014 ......................................................................... 11
Figure 4 - Real GDP by Metropolitan Area, 2009-2013 .............................................................. 12
Figure 5 - South Carolina Personal Income as a Percent of U.S. ................................................. 13
Figure 6 - Per Capita Personal Income by Metropolitan Area, 2009-2013 .................................. 13
Figure 7 - Chart: Per Capita Personal Income by Metropolitan Area, 2009-2013 ....................... 14
Figure 8 - South Carolina Demographic Characteristics .............................................................. 15
Figure 9 - South Carolina Population Censuses and Projection ................................................... 15
Figure 10 - South Carolina Labor Force, 2005-2015 .................................................................... 16
Figure 11 - South Carolina Unemployment Rate, 2005-2015 ...................................................... 17
Figure 12 - South Carolina Nonfarm Industry Employment, 2009, 2014 .................................... 23
Figure 13 - South Carolina Private Industry Employment, 2014 ................................................. 23
Figure 14 - South Carolina Occupational Employment, May 2014 ............................................. 24
Figure 15 - South Carolina Top Occupations, 2014 ..................................................................... 25
Figure 16 - South Carolina Industry Employment Projections to 2022........................................ 26
Figure 17 - Local Workforce Investment Area Industry Employment Projections, 2012-2022 .. 27
Figure 18 - South Carolina Occupational Employment Projections to 2022................................ 28
Figure 19 - Top 20 Fastest Growing or Declining Occupations, 2012-2022................................ 29
Figure 20 - Local Workforce Investment Area Projected Annual Job Openings, 2012-2022 ...... 30
Figure 21 - South Carolina County Commuting Patterns, 2011 ................................................... 32
Figure 22 - South Carolina Measures of Labor Supply by Education Level ................................ 34
Figure 23 - South Carolina Labor Force Versus Jobs ................................................................... 35
Figure 24 - Top Occupations Requiring High School or Less But Filled by Higher Educated ... 36
Figure 25 - South Carolina Labor Force Versus Employment ..................................................... 36
Figure 26 - South Carolina Measures of Labor Demand by Education Level.............................. 37
Figure 27 - South Carolina Total Hires Versus Job Postings ....................................................... 38
Figure 28 - South Carolina Total Hires Versus Job Openings...................................................... 38
Figure 29 - South Carolina Labor Force Versus Job Openings .................................................... 39
Figure 30 - South Carolina Labor Force Versus Job Postings ...................................................... 39
Figure 31 - South Carolina Unemployed Versus Job Postings ..................................................... 40
Figure 32 - South Carolina Labor Force Versus Total Hires ........................................................ 40
Figure 33 - South Carolina Postsecondary Completers by Career Cluster, 2012-2013 ................ 42
Figure 34 - South Carolina Projected Annual Job Openings by Career Cluster, 2012-2022 ....... 42
Figure 35 - South Carolina Postsecondary Education Gap by Career Cluster, 2012-2013 .......... 43
Figure 36 - South Carolina Twelfth Grade Student Choices by Cluster and LWIA, 2012-2013 . 45

South Carolina Department of Employment and Workforce
7 South Carolina 2015 Economic Analysis Report
South Carolina Department of Employment and Workforce
8 South Carolina 2015 Economic Analysis Report
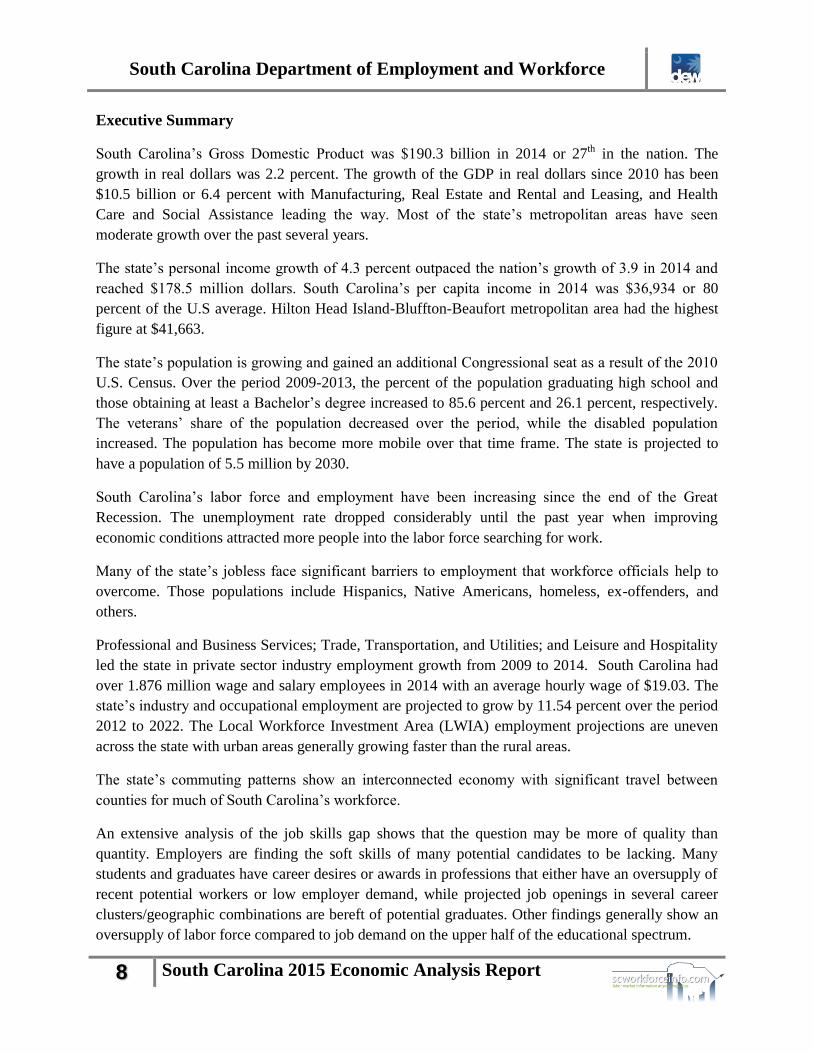
Executive Summary
South Carolina’s Gross Domestic Product was $190.3 billion in 2014 or 27th in the nation. The
growth in real dollars was 2.2 percent. The growth of the GDP in real dollars since 2010 has been
$10.5 billion or 6.4 percent with Manufacturing, Real Estate and Rental and Leasing, and Health
Care and Social Assistance leading the way. Most of the state’s metropolitan areas have seen
moderate growth over the past several years.
The state’s personal income growth of 4.3 percent outpaced the nation’s growth of 3.9 in 2014 and
reached $178.5 million dollars. South Carolina’s per capita income in 2014 was $36,934 or 80
percent of the U.S average. Hilton Head Island-Bluffton-Beaufort metropolitan area had the highest
figure at $41,663.
The state’s population is growing and gained an additional Congressional seat as a result of the 2010
U.S. Census. Over the period 2009-2013, the percent of the population graduating high school and
those obtaining at least a Bachelor’s degree increased to 85.6 percent and 26.1 percent, respectively.
The veterans’ share of the population decreased over the period, while the disabled population
increased. The population has become more mobile over that time frame. The state is projected to
have a population of 5.5 million by 2030.
South Carolina’s labor force and employment have been increasing since the end of the Great
Recession. The unemployment rate dropped considerably until the past year when improving
economic conditions attracted more people into the labor force searching for work.
Many of the state’s jobless face significant barriers to employment that workforce officials help to
overcome. Those populations include Hispanics, Native Americans, homeless, ex-offenders, and
others.
Professional and Business Services; Trade, Transportation, and Utilities; and Leisure and Hospitality
led the state in private sector industry employment growth from 2009 to 2014. South Carolina had
over 1.876 million wage and salary employees in 2014 with an average hourly wage of $19.03. The
state’s industry and occupational employment are projected to grow by 11.54 percent over the period
2012 to 2022. The Local Workforce Investment Area (LWIA) employment projections are uneven
across the state with urban areas generally growing faster than the rural areas.
The state’s commuting patterns show an interconnected economy with significant travel between
counties for much of South Carolina’s workforce.
An extensive analysis of the job skills gap shows that the question may be more of quality than
quantity. Employers are finding the soft skills of many potential candidates to be lacking. Many
students and graduates have career desires or awards in professions that either have an oversupply of
recent potential workers or low employer demand, while projected job openings in several career
clusters/geographic combinations are bereft of potential graduates. Other findings generally show an
oversupply of labor force compared to job demand on the upper half of the educational spectrum.
South Carolina Department of Employment and Workforce
9 South Carolina 2015 Economic Analysis Report
Introduction
South Carolina has made notable progress in recovering from the Great Recession of the 2007-
2010 period (the officially-recognized definition from the National Bureau of Economic
Research, NBER, is December 2007 to June 2009.) Most economic indicators now point to
increasing activity. Mark Vitner, Senior Economist with Well Fargo Securities, wrote in his
economic roundup in early 2015, “South Carolina’s recovery is accelerating and is now firmly
outpacing the nation. The state has bounced back as a formidable manufacturing hub, with a high
concentration in transportation-related production, thanks to BMW and Boeing.”1
The report went on to praise the state for its economic development efforts in the export markets,
including tire manufacturing. The South Carolina Department of Commerce reported that the
state in 2014 closed deals worth over $5 billion in capital investments, adding over 19,000 new
jobs to the state.2 Recently, Volvo Car Corporation selected the Charleston, South Carolina area
for the location of its first North American plant.
Certainly, these projects will add momentum to the state’s recovery as highlighted in this report.
The purpose of the South Carolina Economic Analysis Report is to present an overview of key
metrics used in examining South Carolina’s economy and workforce. The Business Intelligence
Department of the Department of Employment and Workforce compiles and publishes numerous
data series on the state of the workforce. These measures and other pertinent data sources were
utilized in this examination.
This report highlights a number of measures that illuminate several aspects of the state’s
economy. The following section gives an overview of Gross Domestic Product for the state,
region, and metropolitan areas. Personal income of the state and metropolitan areas continues in
the next section followed by population data and demographic characteristics. A detailed
discussion of the state’s labor force follows. A presentation of the jobless population that faces
significant barriers to employment continues afterward.
South Carolina’s industry employment and leading industries highlight a subsequent section of
the report along with a portrayal of current occupational employment. Employment projections
for industries and occupations statewide and by Local Workforce Investment Area follow. A
detailed presentation and explanation of the state’s commuting patterns succeeds the projections
narrative. Finally, an in-depth study of the job skills gap completes the document.
1 Wells Fargo, Southern States: 2015 Economic Outlook, February 12, 2015;
https://www08.wellsfargomedia.com/downloads/pdf/com/insights/economics/regional-
reports/Southern_Economic_Chartbook_02122015.pdf; accessed on May 21, 2015. 2 SC Department of Commerce, 2014 Activity Report;
http://sccommerce.com/sites/default/files/document_directory/activity_report.pdf; accessed on May 21, 2015.
South Carolina Department of Employment and Workforce
10 South Carolina 2015 Economic Analysis Report
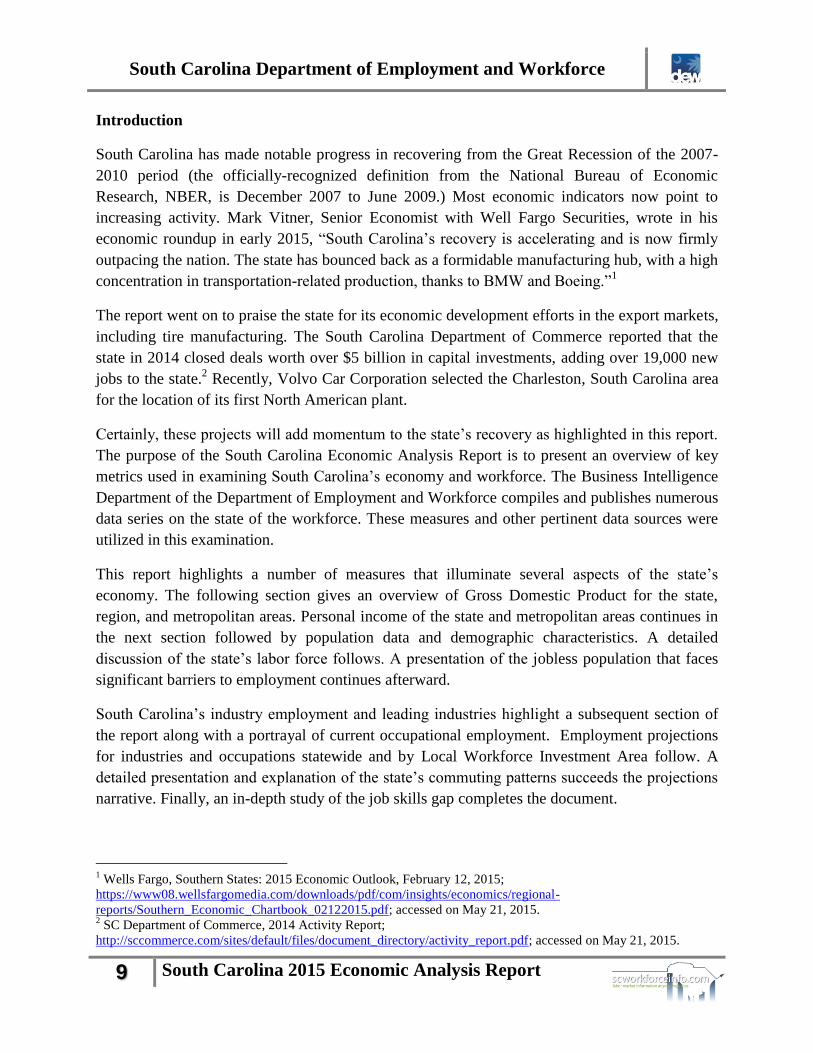
Gross Domestic Product (GDP)
The Gross Domestic
Product (GDP) statistic
is a measure of the
overall health of a
state’s economy. It is
an inflation–adjusted
measure of a state's
production based on a
weighted average of
national prices for
those products
produced within each
state. In 2014, the state
had a growth of 2.2
percent in real dollars
from the previous year,
while the nation also
grew at 2.2 percent. Figure 1 highlights the percentage growth of the state’s GDP for the period
2004-2014. GDP year-over-year growth hovered around 2 percent before the Great Recession
then fell to a decline of nearly 4 percent in 2009 before rebounding above 1 percent. In current
dollars, the GDP for South Carolina was $190.3 billion in 2014. This figure ranks 27th
in the
nation.
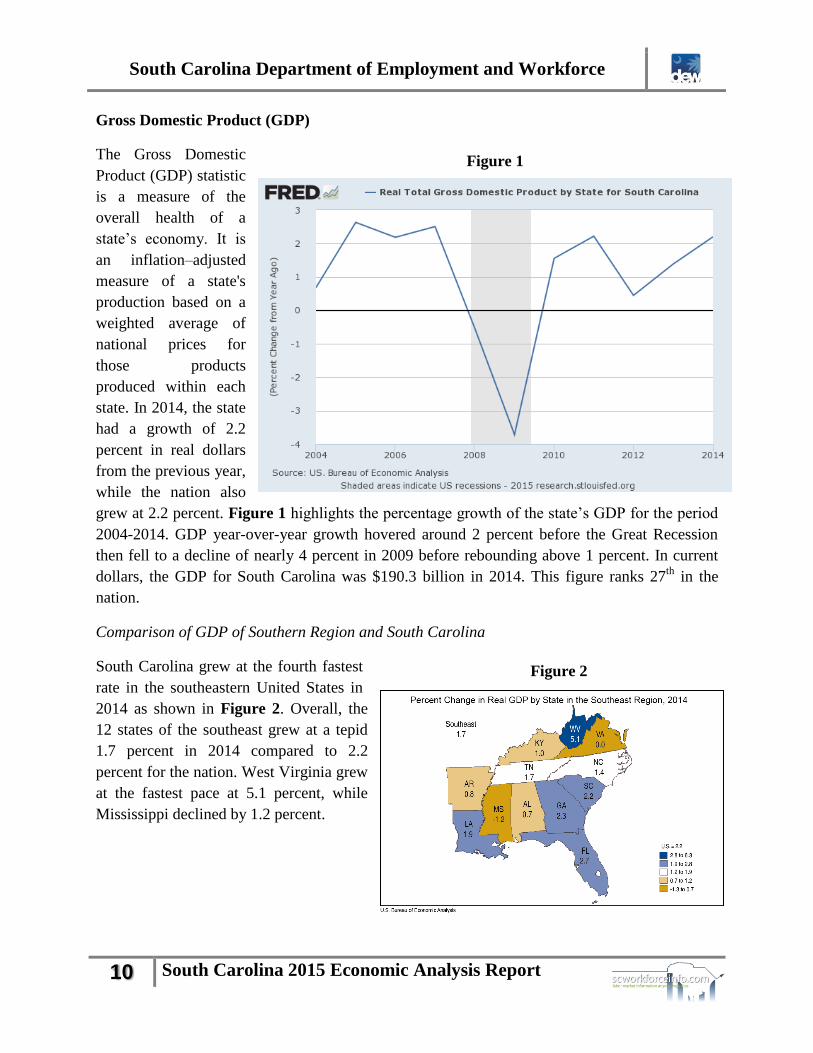
Comparison of GDP of Southern Region and South Carolina
South Carolina grew at the fourth fastest
rate in the southeastern United States in
2014 as shown in Figure 2. Overall, the
12 states of the southeast grew at a tepid
1.7 percent in 2014 compared to 2.2
percent for the nation. West Virginia grew
at the fastest pace at 5.1 percent, while
Mississippi declined by 1.2 percent.
Figure 2
Figure 1

South Carolina Department of Employment and Workforce
11 South Carolina 2015 Economic Analysis Report
GDP in Recovery Since the Great Recession
For a more detailed view of the state’s economy, Figure 3 reveals South Carolina’s GDP by
industry for 2010-2014. Overall, the economy grew over $10.5 billion dollars in real terms over
the 5-year period, or 6.4 percent. Manufacturing has grown $1.8 billion or almost 7 percent to
become the state’s largest industry. Other industries showing notable GDP growth levels include
Real Estate and Rental and Leasing; Health Care and Social Assistance; Wholesale Trade; and
Professional, Scientific, and Technical Services. Agriculture, Utilities, Construction, and Finance
and Insurance declined over the period.
Figure 3
GDP by Metropolitan Statistical Area
Figure 4 shows the GDP for the state’s Metropolitan Statistical Areas (MSAs) over the period
2009-2013. Each MSA, except Hilton Head Island-Bluffton-Beaufort, has seen positive growth
in GDP, though the growth has been uneven. The Charlotte MSA, which includes Chester,
Lancaster, and York counties, grew the most over the period, even outpacing the state’s growth
overall. Charleston-North Charleston and Greenville-Anderson-Mauldin grew the most of the
wholly internal South Carolina MSAs.
Industry 2010 2011 2012 2013 2014Change
2010 to 2014
Percent
Change
2010 to 2014
All industry total $164,081 $167,724 $168,477 $170,816 $174,573 $10,492 6.4%
Agriculture, forestry, fishing, and hunting 1,108 860 1,004 1,106 1,046 -62 -5.6%
Mining 238 242 244 269 276 38 16.0%
Utilities 4,910 4,931 4,453 4,531 4,456 -454 -9.2%
Construction 7,262 6,936 7,219 7,315 7,199 -63 -0.9%
Manufacturing 27,060 28,570 28,557 28,005 28,893 1,833 6.8%
Wholesale trade 8,984 9,208 9,495 9,681 10,152 1,168 13.0%
Retail trade 12,064 12,029 12,098 12,652 13,007 943 7.8%
Transportation and warehousing 3,649 3,788 3,831 3,899 4,068 419 11.5%
Information 4,472 4,343 4,364 4,638 4,794 322 7.2%
Finance and insurance 7,535 7,352 6,965 7,213 7,143 -392 -5.2%
Real estate and rental and leasing 20,610 21,559 21,473 21,869 22,402 1,792 8.7%
Professional, scientific, and technical services 7,750 8,250 8,362 8,470 8,787 1,037 13.4%
Management of companies and enterprises 1,431 1,517 1,671 1,754 1,826 395 27.6%
Administrative and waste management services 7,081 7,402 7,517 7,530 7,970 889 12.6%
Educational services 1,128 1,144 1,147 1,115 1,151 23 2.0%
Health care and social assistance 10,641 10,899 10,947 11,280 11,831 1,190 11.2%
Arts, entertainment, and recreation 1,106 1,158 1,160 1,175 1,221 115 10.4%
Accommodation and food services 5,787 6,011 6,135 6,271 6,293 506 8.7%
Other services, except government 3,977 3,971 4,005 4,130 4,121 144 3.6%
Government 27,343 27,704 27,916 27,958 28,050 707 2.6%
SOURCE: US Bureau of Economic Analysis
Dollars in millions of chained 2009 dollars
South Carolina Real GDP, 2010-2014

South Carolina Department of Employment and Workforce
12 South Carolina 2015 Economic Analysis Report
Figure 4
State Personal Income
Personal income is defined as the income received for persons in a given area from all sources.
South Carolina’s total personal income in 2014 in current dollars was $178.5 million dollars, an
increase of 4.3 percent from a year earlier. This percent increase was the 15th
highest in the
nation. The national change in income was 3.9 percent for the year.
Per capita personal income is calculated as the total personal income of the residents of an area
divided by the population of the area. It is often used as an indicator of consumers' purchasing
power and of the economic well-being of the residents of an area. South Carolina’s per capita
personal income in 2014 was $36,934. The per capita income is 80 percent of the national
average of $46,129. The state has been falling further behind the nation over the past 11 years, as
illustrated in Figure 5, but did improve its position last year.
2009 2010 2011 2012 2013 2010 2011 2012 2013
U.S. metropolitan areas $12,994,636 $13,268,823 $13,474,305 $13,826,165 $14,060,496 2.1 1.5 2.6 1.7
Augusta-Richmond County, GA-SC 18,780 19,352 19,634 19,740 19,497 3.0 1.5 0.5 -1.2
Charleston-North Charleston, SC 27,641 28,137 29,577 30,215 30,667 1.8 5.1 2.2 1.5
Charlotte-Concord-Gastonia, NC-SC 112,306 115,229 120,092 125,714 130,318 2.6 4.2 4.7 3.7
Columbia, SC 31,492 31,410 32,024 32,541 33,199 -0.3 2.0 1.6 2.0
Florence, SC 7,003 6,896 6,979 7,141 7,369 -1.5 1.2 2.3 3.2
Greenville-Anderson-Mauldin, SC 29,880 30,837 32,162 32,377 32,841 3.2 4.3 0.7 1.4
Hilton Head Island-Bluffton-Beaufort, SC 7,491 7,337 7,144 7,226 7,264 -2.1 -2.6 1.1 0.5
Myrtle Beach-Conway-North Myrtle Beach, SC-NC 13,292 13,446 13,842 14,005 14,221 1.2 2.9 1.2 1.5
Spartanburg, SC 10,645 11,322 11,955 12,136 12,193 6.4 5.6 1.5 0.5
Sumter, SC 2,976 2,983 3,101 3,342 3,257 0.2 4.0 7.8 -2.5
South Carolina 160,046 162,616 167,704 170,212 172,176 1.6 3.1 1.5 1.2
SOURCE: US Bureau of Economic Analysis
Real Gross Domestic Product (GDP) by Metropolitan Area, 2009-2013
Metropolitan Area
Millions of chained (2009) dollars Percent Change
South Carolina Department of Employment and Workforce
13 South Carolina 2015 Economic Analysis Report
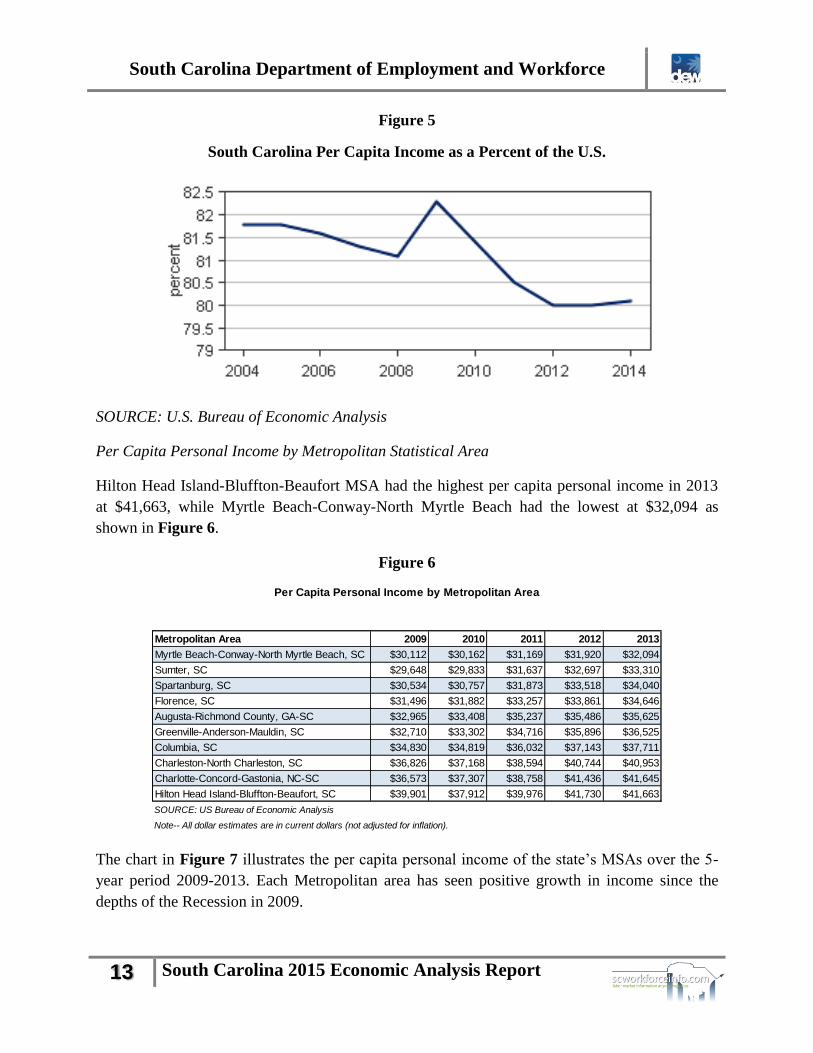
Figure 5
South Carolina Per Capita Income as a Percent of the U.S.
SOURCE: U.S. Bureau of Economic Analysis
Per Capita Personal Income by Metropolitan Statistical Area
Hilton Head Island-Bluffton-Beaufort MSA had the highest per capita personal income in 2013
at $41,663, while Myrtle Beach-Conway-North Myrtle Beach had the lowest at $32,094 as
shown in Figure 6.
Figure 6
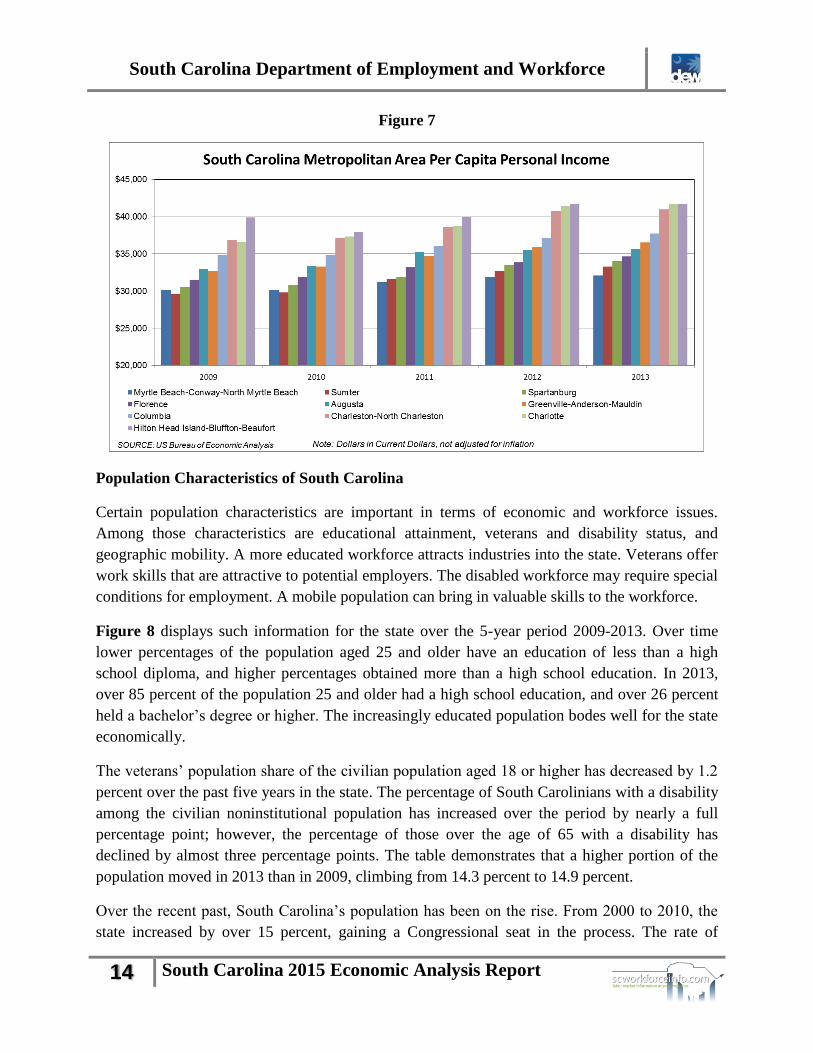
The chart in Figure 7 illustrates the per capita personal income of the state’s MSAs over the 5-
year period 2009-2013. Each Metropolitan area has seen positive growth in income since the
depths of the Recession in 2009.
Metropolitan Area 2009 2010 2011 2012 2013
Myrtle Beach-Conway-North Myrtle Beach, SC $30,112 $30,162 $31,169 $31,920 $32,094
Sumter, SC $29,648 $29,833 $31,637 $32,697 $33,310
Spartanburg, SC $30,534 $30,757 $31,873 $33,518 $34,040
Florence, SC $31,496 $31,882 $33,257 $33,861 $34,646
Augusta-Richmond County, GA-SC $32,965 $33,408 $35,237 $35,486 $35,625
Greenville-Anderson-Mauldin, SC $32,710 $33,302 $34,716 $35,896 $36,525
Columbia, SC $34,830 $34,819 $36,032 $37,143 $37,711
Charleston-North Charleston, SC $36,826 $37,168 $38,594 $40,744 $40,953
Charlotte-Concord-Gastonia, NC-SC $36,573 $37,307 $38,758 $41,436 $41,645
Hilton Head Island-Bluffton-Beaufort, SC $39,901 $37,912 $39,976 $41,730 $41,663
SOURCE: US Bureau of Economic Analysis
Note-- All dollar estimates are in current dollars (not adjusted for inflation).
Per Capita Personal Income by Metropolitan Area
South Carolina Department of Employment and Workforce
14 South Carolina 2015 Economic Analysis Report
Figure 7
Population Characteristics of South Carolina
Certain population characteristics are important in terms of economic and workforce issues.
Among those characteristics are educational attainment, veterans and disability status, and
geographic mobility. A more educated workforce attracts industries into the state. Veterans offer
work skills that are attractive to potential employers. The disabled workforce may require special
conditions for employment. A mobile population can bring in valuable skills to the workforce.
Figure 8 displays such information for the state over the 5-year period 2009-2013. Over time
lower percentages of the population aged 25 and older have an education of less than a high
school diploma, and higher percentages obtained more than a high school education. In 2013,
over 85 percent of the population 25 and older had a high school education, and over 26 percent
held a bachelor’s degree or higher. The increasingly educated population bodes well for the state
economically.
The veterans’ population share of the civilian population aged 18 or higher has decreased by 1.2
percent over the past five years in the state. The percentage of South Carolinians with a disability
among the civilian noninstitutional population has increased over the period by nearly a full
percentage point; however, the percentage of those over the age of 65 with a disability has
declined by almost three percentage points. The table demonstrates that a higher portion of the
population moved in 2013 than in 2009, climbing from 14.3 percent to 14.9 percent.
Over the recent past, South Carolina’s population has been on the rise. From 2000 to 2010, the
state increased by over 15 percent, gaining a Congressional seat in the process. The rate of

South Carolina Department of Employment and Workforce
15 South Carolina 2015 Economic Analysis Report
increase is projected to decline to just over 4 percent over each of the next several 5-year periods
to 2030 as illustrated in Figure 9.
Figure 8
Figure 9
2012
Estimate
2011
Estimate
2010
Estimate
2009
Estimate
3,151,616 3,110,532 3,074,357 3,019,333
5.2% 5.6% 5.5% 5.9%
10.0% 10.3% 10.5% 10.5%
29.8% 30.7% 30.5% 30.3%
21.1% 20.8% 20.6% 20.6%
8.9% 8.6% 8.4% 8.4%
16.0% 15.6% 15.8% 15.9%
9.1% 8.4% 8.8% 8.4%
84.9% 84.2% 84.1% 83.6%
25.1% 24.1% 24.5% 24.3%
3,609,405 3,563,610 3,521,443 3,441,651
10.9% 11.2% 11.6% 11.2%
4,623,171 4,579,231 4,536,835 4,454,344
14.0% 13.8% 13.9% 13.6%
1,078,022 1,079,476 1,078,477 1,078,199
4.0% 3.8% 3.7% 3.6%
2,868,533 2,862,576 2,841,495 2,777,503
12.4% 12.3% 12.4% 11.9%
676,616 637,179 616,863 598,642
37.1% 37.4% 38.4% 40.0%
4,668,886 4,624,180 4,577,399 4,501,739
84.2% 84.3% 84.6% 85.3%
15.4% 15.2% 15.1% 14.3%
8.6% 8.8% 8.4% 8.1%
6.8% 6.4% 6.6% 6.2%
3.5% 3.0% 3.3% 3.0%
3.4% 3.4% 3.3% 3.2%
0.4% 0.4% 0.4% 0.4%
Source: U.S. Census Bureau, 2013 American Community Survey, Table - CP02: Comparative Social Characteristics in the United States
Different state 3.5%
Abroad 0.4%
Same county 8.3%
Different county 6.6%
Same state 3.1%
Population 1 year and over 4,720,602
Same house 84.7%
Different house in the U.S. 14.9%
With a disability 37.2%
RESIDENCE 1 YEAR AGO
With a disability 12.7%
65 years and over 707,659
With a disability 4.6%
18 to 64 years 2,893,842
With a disability 14.5%
Under 18 years 1,076,621
DISABILITY STATUS OF THE CIVILIAN
NONINSTITUTIONALIZED POPULATION
Total Civilian Noninstitutionalized Population 4,678,122
VETERAN STATUS
Civilian population 18 years and over 3,669,343
Civilian veterans 10.0%
Percent high school graduate or higher 85.6%
Percent bachelor's degree or higher 26.1%
Bachelor's degree 16.6%
Graduate or professional degree 9.5%
High school graduate (includes equivalency) 29.4%
Some college, no degree 21.3%
Associate's degree 8.9%
Population 25 years and over 3,198,816
Less than 9th grade 5.0%
9th to 12th grade, no diploma 9.3%
EDUCATIONAL ATTAINMENT
2013
Estimate
Subject South Carolina
April 1, 2000 April 1, 2010 July 1, 2015 July 1, 2020 July 1, 2025 July 1, 2030
Census Census Projection Projection Projection Projection
South Carolina 4,012,012 4,625,364 4,823,200 5,020,800 5,235,500 5,451,700
South Carolina Population Census and Projections: 2000 - 2030
Source: U.S. Census Bureau, Census 2000 and Census 2010, S.C. Department of Health and Environmental Control -
Vital Records Department. Population projections calculated by South Carolina Budget and Control Board, Office of
Research and Statistics.
South Carolina Department of Employment and Workforce
16 South Carolina 2015 Economic Analysis Report
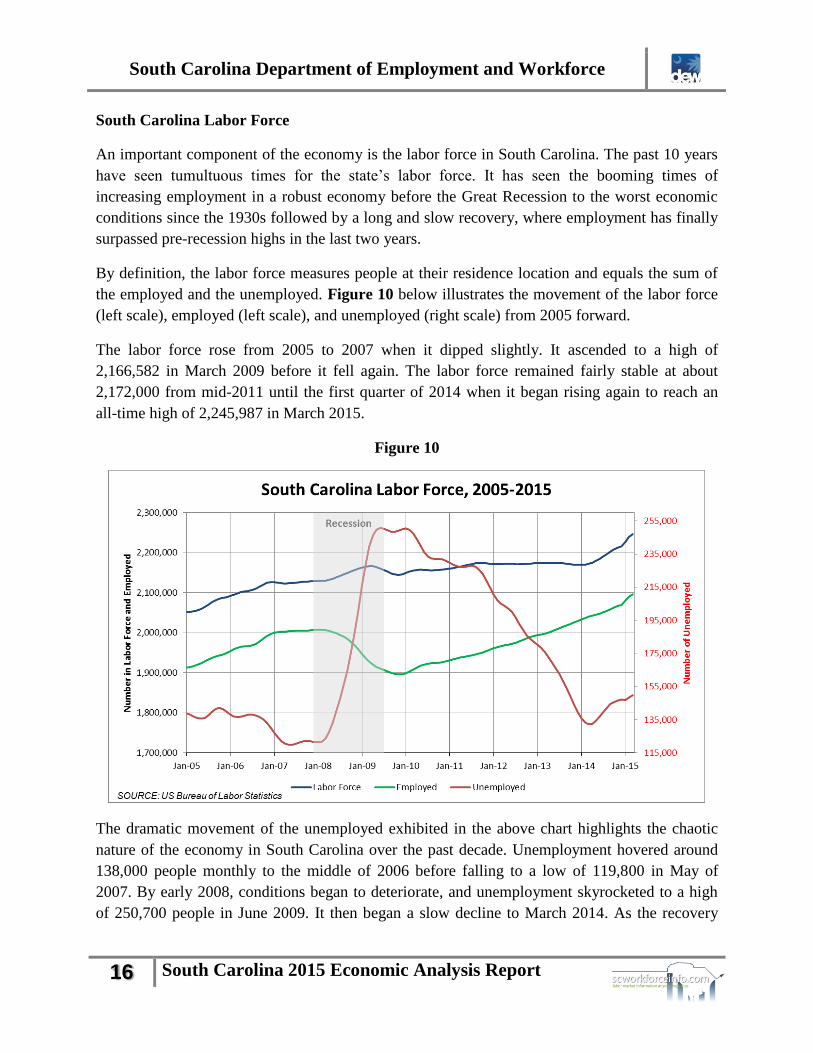
South Carolina Labor Force
An important component of the economy is the labor force in South Carolina. The past 10 years
have seen tumultuous times for the state’s labor force. It has seen the booming times of
increasing employment in a robust economy before the Great Recession to the worst economic
conditions since the 1930s followed by a long and slow recovery, where employment has finally
surpassed pre-recession highs in the last two years.
By definition, the labor force measures people at their residence location and equals the sum of
the employed and the unemployed. Figure 10 below illustrates the movement of the labor force
(left scale), employed (left scale), and unemployed (right scale) from 2005 forward.
The labor force rose from 2005 to 2007 when it dipped slightly. It ascended to a high of
2,166,582 in March 2009 before it fell again. The labor force remained fairly stable at about
2,172,000 from mid-2011 until the first quarter of 2014 when it began rising again to reach an
all-time high of 2,245,987 in March 2015.
Figure 10
The dramatic movement of the unemployed exhibited in the above chart highlights the chaotic
nature of the economy in South Carolina over the past decade. Unemployment hovered around
138,000 people monthly to the middle of 2006 before falling to a low of 119,800 in May of
2007. By early 2008, conditions began to deteriorate, and unemployment skyrocketed to a high
of 250,700 people in June 2009. It then began a slow decline to March 2014. As the recovery

South Carolina Department of Employment and Workforce
17 South Carolina 2015 Economic Analysis Report
accelerated, unemployment began to rise again as many people became encouraged over job
prospects and initiated job searches.
Employment steadily rose over the period 2005 to 2008, where it reached its pre-recession high
of 2,007,667 in January 2008. Then employment began to decline as the recession intensified.
Employment fell by almost 112,000 people from January 2008 to November 2009, the depth of
the employment recession. Since that low, employment has steadily risen by over 200,000 to
reach a record high of 2,096,110 in March 2015.
Unemployment Rate
The unemployment rate is the percent of the labor force that is unemployed. In South Carolina,
the unemployment rate remained relatively steady at about 6.7 percent from 2005 through the
third quarter of 2006 when it fell to a pre-recession low of 5.6 percent in May and June of 2007.
In early 2008, the rate began to climb and accelerated in the fall of that year to reach a high of
11.7 percent by December 2009 and January 2010. The unemployment rate then began to fall,
reaching 6.1 percent in early 2014. At that point, the rate rose modestly to 6.7 percent in March
2015, as the job recovery enticed people to join the workforce. Figure 11 highlights the
movement of the unemployment rate over the period.
Figure 11

South Carolina Department of Employment and Workforce
18 South Carolina 2015 Economic Analysis Report
Jobless Populations Facing Challenges
South Carolina citizens and its workforce are very diverse. Different population groups often
face varying challenges and barriers and may need more specific or dedicated services to meet
their employment and training needs.
Hispanics
Hispanics have accounted for a significant portion of the state’s population growth. This
population more than doubled from 2000 to 2010 and has continued to increase, reaching
254,780 in 2013. Hispanics were responsible for almost a quarter of the state’s 2000-2010
population growth and now represent a bit over five percent of the state’s population. Though
the growth has slowed to 13 percent of population change since 2010, this still means a growing
need for services tailored to Hispanics.
Native Americans
The 2013 U.S. Census of Annual Estimates of Resident Population shows that there were 25,706
single-race American Indians/Alaskan Natives and another 25,494 mixed-race American
Indians/Alaskan Natives in South Carolina. The state is home to several Native American tribes
and groups, including the Catawba, the Pee Dee, the Waccamaw, and the Santee.
Native Americans had nearly double the poverty rate (29.1%) of the total U.S. population
(15.9%) in 2012. They had a lower percent of their population with a high school diploma than
the U.S. population (82.0 percent vs 86.4 percent) and also a lower percent having a Bachelor’s
degree than the nation’s population as a whole (17.4 percent vs. 29.1 percent). Potential workers
may not have the necessary technical or scholastic training to obtain good employment. In
addition, the unavailability or lack of access to services exacerbates the presence of poverty in
the Native American community.
Homeless
On a given night in January 2013, there were an estimated 6,544 homeless people in South
Carolina, including 636 veterans, according to the U.S. Interagency Council on Homelessness.
South Carolina’s homeless rate per 10,000 people is 13.7, while the national rate is 19.3. The
state’s rate of veteran homelessness is 16.1, and for the nation the figure is 27.3. The state’s
number of homeless increased by 33 percent from 2012 to 2013.
For the homeless, basic needs are a priority. Some people may need help finding treatment to
address an underlying cause of homelessness. The unpredictability of being homeless causes
employers to be wary of this group. There is a stigma associated with being homeless that makes
it more difficult to find employment. People are homeless for many reasons including:
misfortune, substance abuse problems, medical issues, mental health issues, etc. All these

South Carolina Department of Employment and Workforce
19 South Carolina 2015 Economic Analysis Report
reasons contribute to the difficulty of finding employment. The simple issues of having a bath, a
shave, and a suit for a job interview become major hurdles. Education and training are important
but may be secondary to transportation to the job. Creating stability of transportation, housing,
and health/nutrition will raise the employability of this group. The stigma of being homeless
must also be addressed. Many homeless people are also military veterans, adding to the already
complicated issue. The National Coalition for the Homeless states that almost 40 percent of
homeless men are military veterans.
Veterans
According to the 2012 American Community Survey (ACS), South Carolina had 394,220
civilian veterans aged 18 or older. Veterans made up 8.3 percent of the state’s total population,
compared to 6.8 percent of the nation’s population. From 2012 to 2013, veteran unemployment
fell from 6.9 percent to 4.1 percent. The state’s veteran labor force dropped to 160,000 in 2013.
Military veterans have varied and unique needs. Some veterans are homeless. Some veterans
struggle with diagnosed or undiagnosed medical and mental health issues. Some veterans have
difficulty entering the civilian world again. Veterans have a great deal to contribute to any
company. Many veterans have jobs skills that transfer directly to the civilian world. Veterans
are typically drug-free, show up to work on time, and have experience working in stressful
situations. The military is all-encompassing and takes care of every aspect of a member’s life,
including wages, medical, dental, housing, and retirement. Once a member leaves the service, it
may often be difficult for them to transition back into civilian life.
Ex-Offenders
As of June 2013, South Carolina had an inmate population of 22,168 with 9,623 inmates being
released in 2013. The average age of an inmate was 37 years old. The average sentence length
is almost 14 years, with the average time actually served being about five years. Over half—55
percent—of inmates do not have a high school diploma or GED. Inmates age 17-21 without a
high school diploma or GED are mandated to attend school and are assigned to one of the S.C.
Department of Corrections’ 10 high schools. Inmates older than 21 who are not high school or
GED graduates are served in Corrections’ Adult Education programs. For Fiscal Year (FY)
2011, over 5,700 inmates received credentials in education programs including GED/high school
academics (1,209), vocational courses (2,769), and WorkKeys® training (1,756).
People who have been imprisoned face several challenges re-entering society, such as
overcoming their past criminal history when seeking employment. Lack of education, poor
computer skills, poor people skills, low self-esteem, substance abuse problems, and access to
transportation are problems faced by an ex-offender during the job search.

South Carolina Department of Employment and Workforce
20 South Carolina 2015 Economic Analysis Report
Juvenile Offenders
In 2013, the S.C. Department of Juvenile Justice (DJJ) handled 16,754 cases, 27.5 percent less
than in 2008-2009. In these cases, 3,495 were paroled or on probation, and the average offender
population at a facility was 369. There is a 15 percent recidivism rate among young offenders in
community programs under DJJ supervision. The top five offenses putting a person into DJJ
custody are assault and battery, shoplifting, disturbing school, public disorderly conduct, and
simple marijuana possession.
Juvenile offenders have an entire lifetime ahead of them. Society at large forgives many
youthful mistakes. There is always hope with this group. Several programs train the offenders
in trades and skilled labor. Their educational training is important and obtaining a GED/diploma
is the first step towards further studies. Maintaining motivation with this group is a challenge.
Having gainful employment will provide the security and finances to prevent future problems
with the law.
Limited English Proficiency
The 2012 ACS lists 98,188 people of foreign-born status in South Carolina who were identified
as having Limited English Proficiency (LEP). Noncitizens were more likely to have LEP than
citizens (foreign-born but naturalized).
Immigrants and those with LEP often need help adjusting to life in a new country. They may
need help finding housing, jobs, educational/training resources, or other services. They may
need legal aid services to assist with paperwork and documentation. Communication is
important no matter what job someone holds. The main issue here is language, and this can be
overcome with instructional training and services.
Illiterate
The U.S. Department of Education’s National Assessment of Adult Literacy (NAAL) reported in
2003 (the latest survey available) that 15 percent of persons in households in the state lack basic
literacy. At the time, this equaled about 465,000 people in South Carolina. With rising school
enrollment and better access to education, illiteracy has declined in the last several decades.
Being illiterate increases the likelihood of being below the poverty line and having high health
costs. This population tends to be older, and their family and friends may not even know that
they cannot read. A feeling of shock is often expressed when someone confesses to being
illiterate, leaving the person who is unable to read or write with feelings of shame. It is
important to understand the group and remove the stigma. Illiteracy may stem from poor
education or a learning disorder. Education and training for this group is essential considering
reading is a central part of learning and succeeding in the workplace.

South Carolina Department of Employment and Workforce
21 South Carolina 2015 Economic Analysis Report
Migrant/Seasonal Workers
According to the U.S. Department of Labor’s National Agricultural Workers Survey in the 2009-
2010 survey period, 74 percent of all farm workers in the U.S. are born in Mexico, 82 percent are
Hispanic, and 72 percent speak English less than “well.” Sixty-three percent had less than a high
school education.
The U.S. Department of Labor highlighted, in its Migrant and Seasonal Farmworkers (MSFW)
Report for Program Year 2012, that South Carolina’s One Stop Centers had taken 1,931 job
applications for MSFWs and placed 1,271 into a job or 66 percent of those served. South
Carolina Legal Services, a nonprofit organization providing legal services to low income state
residents, notes that there are 28 registered migrant worker labor camps in 12 counties in the
state.
The growing pace of economic globalization has created more migrant workers than ever before.
Unemployment and increasing poverty have prompted many workers in developing countries to
seek work elsewhere. Unskilled and cheap labor is wanted in developed nations, so the two
forces meet. Migrant workers and their families have poorer physical health than the general
population, higher infant mortality rates, and shorter life expectancy. Migrant farm workers
often toil 12-14 hours a day, every day, during a harvest season. Issues affecting this community
include poverty, worker abuse, sanitation, legal issues, and safety. Language barriers and
mistrust of government are also common in the community.
Foster Care
The average time a child spent in foster care was 15.9 months in FY 2013, the lowest average
during the past four years, according to the South Carolina Department of Social Services (DSS).
In FY 2013, there were 1,220 children waiting for adoption. As of June 2013, there were 3,734
children receiving in-home foster care services.
This group may lack stability as children and may have problems associated with their home
situations. On a positive note, educational services are available for the children. This helps
them overcome their unique issues and pursue a path for employment.
Temporary Assistance for Needy Families (TANF)
For FY 2012-2013, the number of TANF households served decreased to 415,475 in South
Carolina, a 6.5 percent decline from the previous fiscal year. The average wage of a TANF
recipient employed through a South Carolina Department of Social Services program was $8.27
per hour. This group may have difficulty obtaining a family-sustaining wage. Even when they
have jobs, the pay is often low. Training and employment support should be provided as this
group may often lack the education and needed skills to get a better job.

South Carolina Department of Employment and Workforce
22 South Carolina 2015 Economic Analysis Report
Disabled
Estimates from U.S. Census Bureau’s American Community Survey in 2012 show the state had a
disabled labor force of more than 123,000 people. Over 27,000 of those people were
unemployed, for a disabled unemployment rate of 22.2 percent. Therefore, this group will
continue to need focused services to overcome substantial barriers to employment.
South Carolina Industry Employment
South Carolina’s economy took a significant hit during the Great Recession, but it has staged a
remarkable comeback since the bottom of the downturn in 2009. In terms of nonfarm industry
employment, the state has grown by 133,500 jobs, or 7.4 percent, between 2009 and 2014 as
shown in the table in Figure 12. The sector leading the growth is Professional and Business
Services with a gain of over 54,000 jobs; followed by Trade, Transportation, and Utilities
gaining almost 25,000 new jobs; and Leisure and Hospitality adding 20,000 positions.
Government, the largest of all sectors, gained 8,700 or 2.5 percent.
Several sectors declined over the period, led by Construction down nearly 6 percent; Natural
Resources and Mining down by almost 5 percent; Financial Activities down by 4.3 percent; and
Information, dropping by 2.6 percent.
In terms of the private sector economy, Retail Trade is the largest sector in 2014 with 15 percent
of the employment, followed by Manufacturing with 14 percent, and Accommodations and Food
Services with 13 percent. The chart in Figure 13 illustrates the percentage breakdown of private
industry employment.
South Carolina Leading Industries
Another measure of the strength of an economy is industry specialization or answering the
question “How does an industry’s portion of the employment mix in the state compare to its
portion in the nation?” This question identifies the definition of the location quotient (LQ). An
LQ above 1.0 indicates that the industry has a higher concentration of employment in the state
than it does in the nation. In South Carolina, six industry sectors led the state in 2013 in terms of
employment specialization with LQs greater than 1.0 as measured by the Quarterly Census of
Employment and Wages (QCEW)—Utilities, Construction, Manufacturing, Retail Trade,
Administrative and Waste Services, and Accommodation and Food Services.
These industries highlight the state’s strong economic base of tourism and manufacturing.

South Carolina Department of Employment and Workforce
23 South Carolina 2015 Economic Analysis Report
Figure 12
Figure 13
Series Code Title 2009 2014 2014-2009Percent
Growth
00000000 Total nonfarm 1,815,100 1,948,600 133,500 7.4%
05000000 Total private 1,467,500 1,592,300 124,800 8.5%
06000000 Goods-producing 305,400 316,300 10,900 3.6%
07000000 Service-providing 1,509,700 1,632,300 122,600 8.1%
08000000 Private service-providing 1,162,100 1,276,000 113,900 9.8%
10000000 Natural resources and mining 4,100 3,900 -200 -4.9%
20000000 Construction 87,500 82,300 -5,200 -5.9%
30000000 Manufacturing 213,800 230,100 16,300 7.6%
40000000 Trade, transportation, and utilities 348,200 373,100 24,900 7.2%
50000000 Information 27,200 26,500 -700 -2.6%
55000000 Financial activities 100,800 96,500 -4,300 -4.3%
60000000 Professional and business services 199,700 254,100 54,400 27.2%
65000000 Education and health services 208,400 225,800 17,400 8.3%
70000000 Leisure and hospitality 208,500 228,500 20,000 9.6%
80000000 Other services 69,400 71,700 2,300 3.3%
90000000 Government 347,600 356,300 8,700 2.5%
SOURCE: US Bureau of Labor Statistics, Current Employment Statistics (CES) Program
South Carolina Nonfarm Industry Employment - Annual Averages 2009, 2014
South Carolina Department of Employment and Workforce
24 South Carolina 2015 Economic Analysis Report
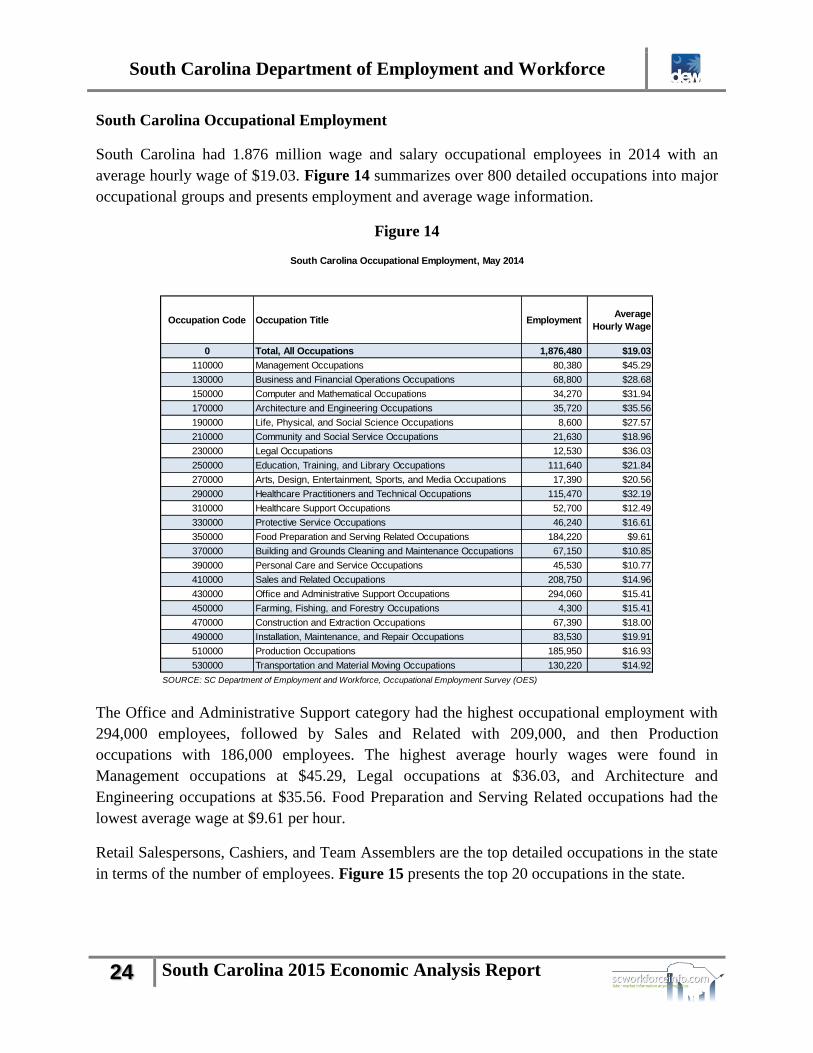
South Carolina Occupational Employment
South Carolina had 1.876 million wage and salary occupational employees in 2014 with an
average hourly wage of $19.03. Figure 14 summarizes over 800 detailed occupations into major
occupational groups and presents employment and average wage information.
Figure 14
The Office and Administrative Support category had the highest occupational employment with
294,000 employees, followed by Sales and Related with 209,000, and then Production
occupations with 186,000 employees. The highest average hourly wages were found in
Management occupations at $45.29, Legal occupations at $36.03, and Architecture and
Engineering occupations at $35.56. Food Preparation and Serving Related occupations had the
lowest average wage at $9.61 per hour.
Retail Salespersons, Cashiers, and Team Assemblers are the top detailed occupations in the state
in terms of the number of employees. Figure 15 presents the top 20 occupations in the state.
Occupation Code Occupation Title EmploymentAverage
Hourly Wage
0 Total, All Occupations 1,876,480 $19.03
110000 Management Occupations 80,380 $45.29
130000 Business and Financial Operations Occupations 68,800 $28.68
150000 Computer and Mathematical Occupations 34,270 $31.94
170000 Architecture and Engineering Occupations 35,720 $35.56
190000 Life, Physical, and Social Science Occupations 8,600 $27.57
210000 Community and Social Service Occupations 21,630 $18.96
230000 Legal Occupations 12,530 $36.03
250000 Education, Training, and Library Occupations 111,640 $21.84
270000 Arts, Design, Entertainment, Sports, and Media Occupations 17,390 $20.56
290000 Healthcare Practitioners and Technical Occupations 115,470 $32.19
310000 Healthcare Support Occupations 52,700 $12.49
330000 Protective Service Occupations 46,240 $16.61
350000 Food Preparation and Serving Related Occupations 184,220 $9.61
370000 Building and Grounds Cleaning and Maintenance Occupations 67,150 $10.85
390000 Personal Care and Service Occupations 45,530 $10.77
410000 Sales and Related Occupations 208,750 $14.96
430000 Office and Administrative Support Occupations 294,060 $15.41
450000 Farming, Fishing, and Forestry Occupations 4,300 $15.41
470000 Construction and Extraction Occupations 67,390 $18.00
490000 Installation, Maintenance, and Repair Occupations 83,530 $19.91
510000 Production Occupations 185,950 $16.93
530000 Transportation and Material Moving Occupations 130,220 $14.92
SOURCE: SC Department of Employment and Workforce, Occupational Employment Survey (OES)
South Carolina Occupational Employment, May 2014

South Carolina Department of Employment and Workforce
25 South Carolina 2015 Economic Analysis Report
Figure 15
Statewide and Local Workforce Investment Area (LWIA) Industry and Occupational
Employment Projections
Statewide Industry Employment Projections
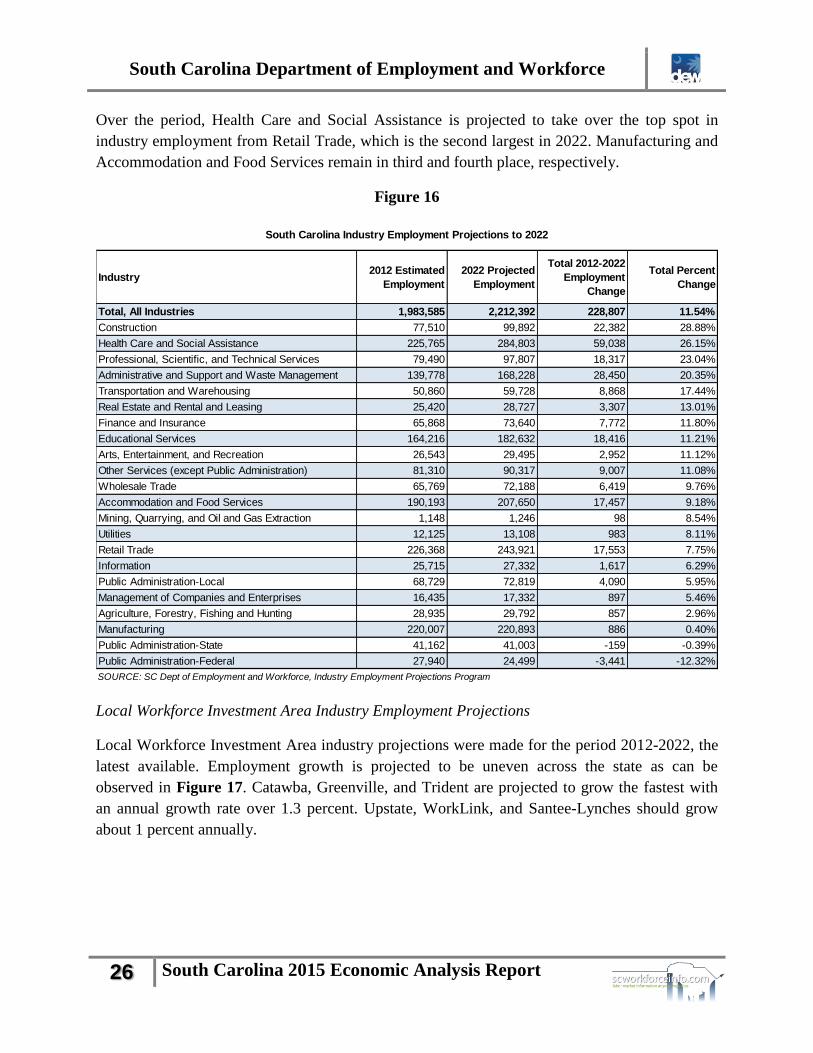
Figure 16 presents the latest available statewide industry employment projections over the 10-
year period 2012-2022. Overall, all industries are projected to grow by 11.5 percent or by
228,800 jobs. Construction; Health Care and Social Assistance; Professional, Scientific, and
Technical Services; and Administrative and Support and Waste Management are each expected
to increase employment by over 20 percent. Only State and Federal Government are projected to
decline.
South Carolina Top Occupations, May 2014
Occupation Title
Retail Salespersons
Cashiers
Team Assemblers
Combined Food Preparation and Serving Workers
Customer Service Representatives
Laborers and Freight, Stock, and Material Movers
Registered Nurses
Waiters and Waitresses
Secretaries and Administrative Assistants
Office Clerks, General
Janitors and Cleaners, Except Maids and Housekeepers
General and Operations Managers
Stock Clerks and Order Fillers
First-Line Supervisors of Office and Administrative Workers
Heavy and Tractor-Trailer Truck Drivers
Maintenance and Repair Workers, General
Bookkeeping, Accounting, and Auditing Clerks
First-Line Supervisors of Retail Sales Workers
Sales Representatives, Wholesale and Manufacturing
Nursing Assistants
SOURCE: SC Department of Employment and Workforce,
Occupational Employment Survey (OES)
South Carolina Department of Employment and Workforce
26 South Carolina 2015 Economic Analysis Report
Over the period, Health Care and Social Assistance is projected to take over the top spot in
industry employment from Retail Trade, which is the second largest in 2022. Manufacturing and
Accommodation and Food Services remain in third and fourth place, respectively.
Figure 16
Local Workforce Investment Area Industry Employment Projections
Local Workforce Investment Area industry projections were made for the period 2012-2022, the
latest available. Employment growth is projected to be uneven across the state as can be
observed in Figure 17. Catawba, Greenville, and Trident are projected to grow the fastest with
an annual growth rate over 1.3 percent. Upstate, WorkLink, and Santee-Lynches should grow
about 1 percent annually.
Industry2012 Estimated
Employment
2022 Projected
Employment
Total 2012-2022
Employment
Change
Total Percent
Change
Total, All Industries 1,983,585 2,212,392 228,807 11.54%
Construction 77,510 99,892 22,382 28.88%
Health Care and Social Assistance 225,765 284,803 59,038 26.15%
Professional, Scientific, and Technical Services 79,490 97,807 18,317 23.04%
Administrative and Support and Waste Management 139,778 168,228 28,450 20.35%
Transportation and Warehousing 50,860 59,728 8,868 17.44%
Real Estate and Rental and Leasing 25,420 28,727 3,307 13.01%
Finance and Insurance 65,868 73,640 7,772 11.80%
Educational Services 164,216 182,632 18,416 11.21%
Arts, Entertainment, and Recreation 26,543 29,495 2,952 11.12%
Other Services (except Public Administration) 81,310 90,317 9,007 11.08%
Wholesale Trade 65,769 72,188 6,419 9.76%
Accommodation and Food Services 190,193 207,650 17,457 9.18%
Mining, Quarrying, and Oil and Gas Extraction 1,148 1,246 98 8.54%
Utilities 12,125 13,108 983 8.11%
Retail Trade 226,368 243,921 17,553 7.75%
Information 25,715 27,332 1,617 6.29%
Public Administration-Local 68,729 72,819 4,090 5.95%
Management of Companies and Enterprises 16,435 17,332 897 5.46%
Agriculture, Forestry, Fishing and Hunting 28,935 29,792 857 2.96%
Manufacturing 220,007 220,893 886 0.40%
Public Administration-State 41,162 41,003 -159 -0.39%
Public Administration-Federal 27,940 24,499 -3,441 -12.32%
South Carolina Industry Employment Projections to 2022
SOURCE: SC Dept of Employment and Workforce, Industry Employment Projections Program

South Carolina Department of Employment and Workforce
27 South Carolina 2015 Economic Analysis Report
Figure 17
Trident, Midlands, and Greenville LWIAs, encompassing the state’s largest urban areas, are
expected to grow the most, adding over 35,000 jobs each. Catawba is projected to overtake
Lower Savannah in industry employment by 2022.
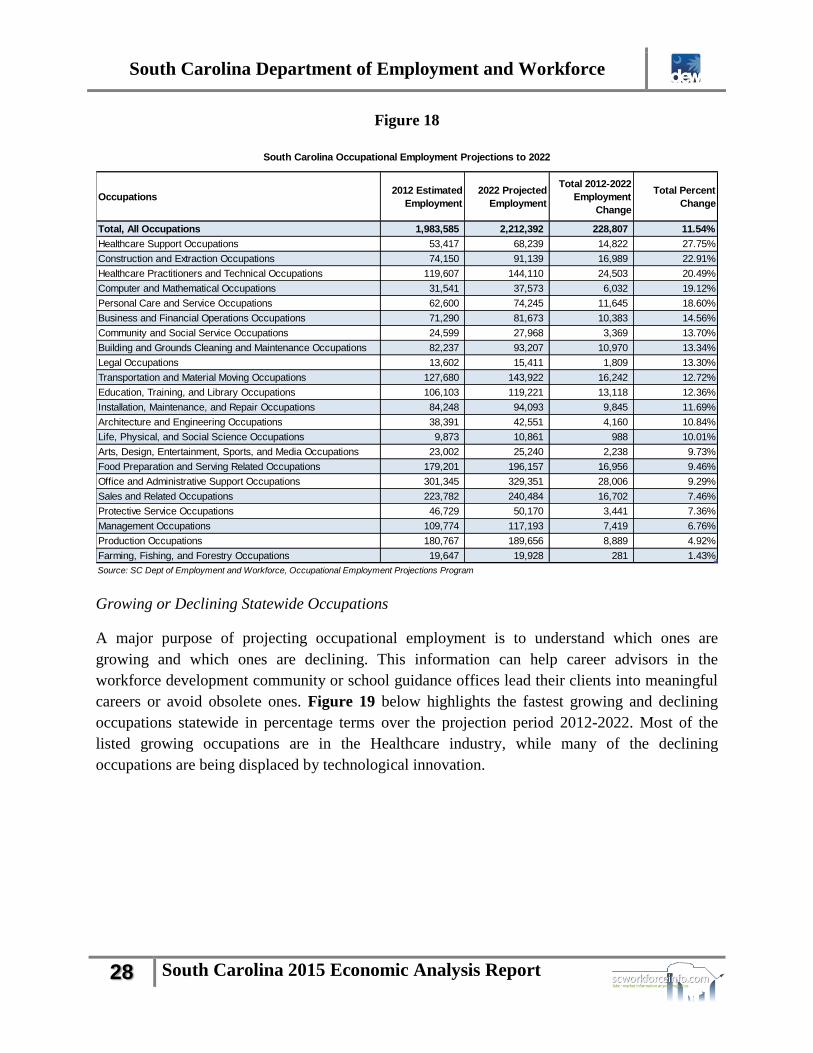
Statewide Occupational Employment Projections
The latest available statewide occupational projections coincide with the statewide industry
projections for the period 2012-2022. Figure 18 highlights the projections by major occupation
group. As with the industry projections of Construction and Health Care and Social Assistance
leading the employment growth, so two major health-related occupation groups and Construction
lead in percent increase of occupational employment growth. In numeric terms, Office and
Administrative Support occupations are projected to increase the most with over 28,000 new
positions, while Healthcare Practitioners and Technical occupations should add 24,500 jobs.
Area
2012
Estimated
Employment
2022
Projected
Employment
Average
Annual
Growth Rate
2012-2022
Employment
Change
2012-2022
Percent
Change
Catawba 113,199 132,167 1.56 18,968 16.76
Greenville 253,170 290,776 1.39 37,606 14.85
Lowcountry 91,673 104,057 1.28 12,384 13.51
Lower Savannah 116,065 128,977 1.06 12,912 11.12
Midlands 337,201 377,000 1.12 39,799 11.80
Pee Dee 126,589 140,842 1.07 14,253 11.26
Santee-Lynches 69,488 76,694 0.99 7,206 10.37
Trident 310,590 355,526 1.36 44,936 14.47
Upper Savannah 86,033 96,225 1.13 10,192 11.85
Upstate 151,495 167,510 1.01 16,015 10.57
Waccamaw 154,212 174,651 1.25 20,439 13.25
Worklink 123,940 137,185 1.02 13,245 10.69
South Carolina 1,983,585 2,212,392 1.10 228,807 11.54
SOURCE: SC Dept of Employment and Workforce, Industry Employment Projections Program
Local Workforce Investment Area Industry Employment Projections, 2012-2022
South Carolina Department of Employment and Workforce
28 South Carolina 2015 Economic Analysis Report
Figure 18
Growing or Declining Statewide Occupations
A major purpose of projecting occupational employment is to understand which ones are
growing and which ones are declining. This information can help career advisors in the
workforce development community or school guidance offices lead their clients into meaningful
careers or avoid obsolete ones. Figure 19 below highlights the fastest growing and declining
occupations statewide in percentage terms over the projection period 2012-2022. Most of the
listed growing occupations are in the Healthcare industry, while many of the declining
occupations are being displaced by technological innovation.
Occupations2012 Estimated
Employment
2022 Projected
Employment
Total 2012-2022
Employment
Change
Total Percent
Change
Total, All Occupations 1,983,585 2,212,392 228,807 11.54%
Healthcare Support Occupations 53,417 68,239 14,822 27.75%
Construction and Extraction Occupations 74,150 91,139 16,989 22.91%
Healthcare Practitioners and Technical Occupations 119,607 144,110 24,503 20.49%
Computer and Mathematical Occupations 31,541 37,573 6,032 19.12%
Personal Care and Service Occupations 62,600 74,245 11,645 18.60%
Business and Financial Operations Occupations 71,290 81,673 10,383 14.56%
Community and Social Service Occupations 24,599 27,968 3,369 13.70%
Building and Grounds Cleaning and Maintenance Occupations 82,237 93,207 10,970 13.34%
Legal Occupations 13,602 15,411 1,809 13.30%
Transportation and Material Moving Occupations 127,680 143,922 16,242 12.72%
Education, Training, and Library Occupations 106,103 119,221 13,118 12.36%
Installation, Maintenance, and Repair Occupations 84,248 94,093 9,845 11.69%
Architecture and Engineering Occupations 38,391 42,551 4,160 10.84%
Life, Physical, and Social Science Occupations 9,873 10,861 988 10.01%
Arts, Design, Entertainment, Sports, and Media Occupations 23,002 25,240 2,238 9.73%
Food Preparation and Serving Related Occupations 179,201 196,157 16,956 9.46%
Office and Administrative Support Occupations 301,345 329,351 28,006 9.29%
Sales and Related Occupations 223,782 240,484 16,702 7.46%
Protective Service Occupations 46,729 50,170 3,441 7.36%
Management Occupations 109,774 117,193 7,419 6.76%
Production Occupations 180,767 189,656 8,889 4.92%
Farming, Fishing, and Forestry Occupations 19,647 19,928 281 1.43%
Source: SC Dept of Employment and Workforce, Occupational Employment Projections Program
South Carolina Occupational Employment Projections to 2022

South Carolina Department of Employment and Workforce
29 South Carolina 2015 Economic Analysis Report
Figure 19
Rank Growing Occupations Declining Occupations
1 Insulation Workers, Mechanical Fallers
2 Home Health AidesTextile Winding, Twisting, and Drawing Out Machine
Setters, Operators, and Tenders
3 Interpreters and TranslatorsTextile Bleaching and Dyeing Machine Operators and
Tenders
4 Diagnostic Medical SonographersTextile Knitting and Weaving Machine Setters,
Operators, and Tenders
5Helpers--Brickmasons, Blockmasons, Stonemasons,
and Tile and Marble SettersData Entry Keyers
6 Personal Care Aides Postal Service Clerks
7 Information Security AnalystsPostal Service Mail Sorters, Processors, and
Processing Machine Operators
8 Skincare SpecialistsDrilling and Boring Machine Tool Setters, Operators,
and Tenders, Metal and Plastic
9 Physician AssistantsTextile Cutting Machine Setters, Operators, and
Tenders
10 Health Specialties Teachers, Postsecondary Computer Operators
11 Nursing Instructors and Teachers, Postsecondary Word Processors and Typists
12 Physical Therapist Assistants Postal Service Mail Carriers
13 Occupational Therapy Assistants Information and Record Clerks, All Other
14 Medical Secretaries Travel Agents
15 Helpers--Electricians Sewing Machine Operators
16 Personal Financial AdvisorsLathe and Turning Machine Tool Setters, Operators,
and Tenders, Metal and Plastic
17Ambulance Drivers and Attendants, Except Emergency
Medical TechniciansSwitchboard Operators, Including Answering Service
18 Physical Therapist AidesExtruding and Drawing Machine Setters, Operators,
and Tenders, Metal and Plastic
19 Dental Hygienists Meter Readers, Utilities
20 Market Research Analysts & Marketing SpecialistsExtruding and Forming Machine Setters, Operators,
and Tenders, Synthetic and Glass Fibers
SOURCE: SC Dept of Employment and Workforce, Occupational Employment Projections Program
Top 20 Projected Fastest Growing or Declining Occupations, 2012-2022
Note: Fastest growing by percent increase with at least 100 new positions; fastest declining by percent decrease with at
least 50 fewer positions.
South Carolina Department of Employment and Workforce
30 South Carolina 2015 Economic Analysis Report
Local Workforce Investment Area Occupational Employment Projections
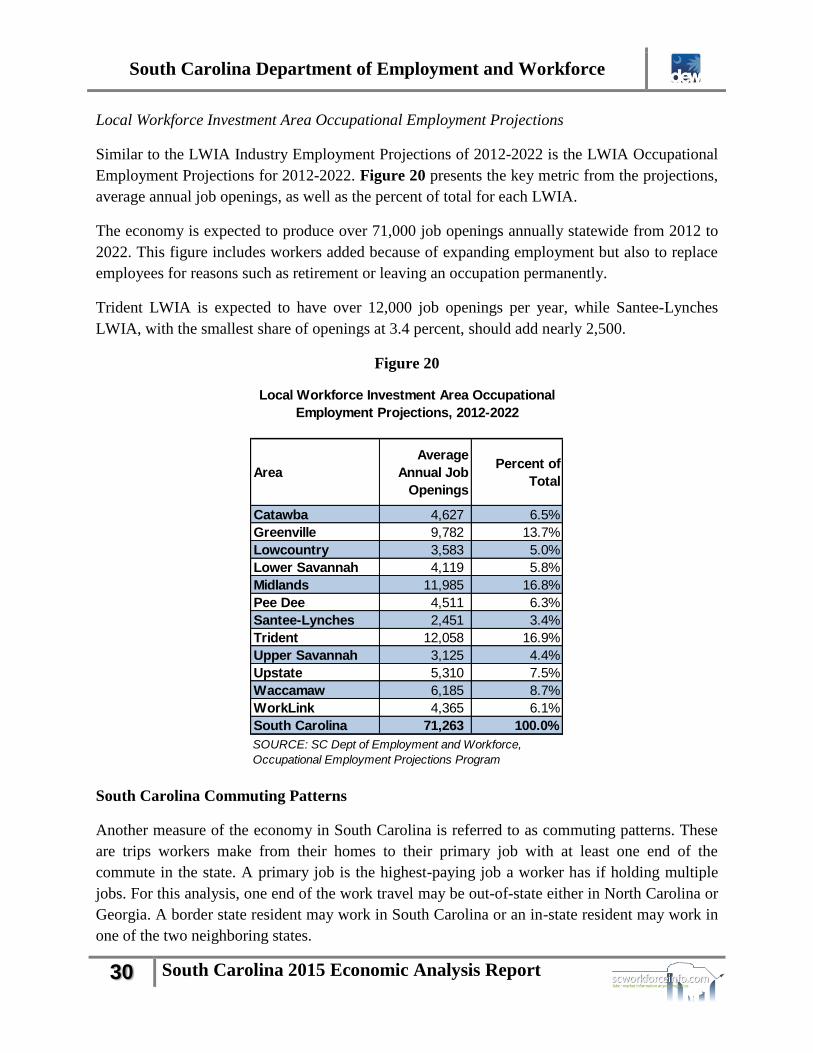
Similar to the LWIA Industry Employment Projections of 2012-2022 is the LWIA Occupational
Employment Projections for 2012-2022. Figure 20 presents the key metric from the projections,
average annual job openings, as well as the percent of total for each LWIA.
The economy is expected to produce over 71,000 job openings annually statewide from 2012 to
2022. This figure includes workers added because of expanding employment but also to replace
employees for reasons such as retirement or leaving an occupation permanently.
Trident LWIA is expected to have over 12,000 job openings per year, while Santee-Lynches
LWIA, with the smallest share of openings at 3.4 percent, should add nearly 2,500.
Figure 20
South Carolina Commuting Patterns
Another measure of the economy in South Carolina is referred to as commuting patterns. These
are trips workers make from their homes to their primary job with at least one end of the
commute in the state. A primary job is the highest-paying job a worker has if holding multiple
jobs. For this analysis, one end of the work travel may be out-of-state either in North Carolina or
Georgia. A border state resident may work in South Carolina or an in-state resident may work in
one of the two neighboring states.
Area
Average
Annual Job
Openings
Percent of
Total
Catawba 4,627 6.5%
Greenville 9,782 13.7%
Lowcountry 3,583 5.0%
Lower Savannah 4,119 5.8%
Midlands 11,985 16.8%
Pee Dee 4,511 6.3%
Santee-Lynches 2,451 3.4%
Trident 12,058 16.9%
Upper Savannah 3,125 4.4%
Upstate 5,310 7.5%
Waccamaw 6,185 8.7%
WorkLink 4,365 6.1%
South Carolina 71,263 100.0%
SOURCE: SC Dept of Employment and Workforce,
Occupational Employment Projections Program
Local Workforce Investment Area Occupational
Employment Projections, 2012-2022
South Carolina Department of Employment and Workforce
31 South Carolina 2015 Economic Analysis Report
The table in Figure 21 presents a summary of commuting patterns for the year 2011. For each
South Carolina county, the table shows IntraCounty trips, those that stay within the county, One-
Way Outbound and One-Way Inbound trips, which represent the direction of travel. A final
column of data shows the difference between inbound and outbound commuting trips.
Not surprisingly, the counties with the major urban areas and employment centers lead the list of
top commuting counties— Charleston, Greenville, and Richland. The rural counties have the
least amount of work-commuting activity. Greenville and Charleston each have over 100,000
intracounty trips.
Lexington County has the highest number of outbound trips from any county at over 63,700 trips
as nearly 43,000 of those head to Richland County. Greenville and York are next with at least
51,000 outbound trips each. Nearly 35,000 York County commuters head to North Carolina.
Richland, Greenville, and Charleston counties have the most inbound commuting trips with over
91,000 trips each. Lexington, Spartanburg, and York are also major commuting destinations.
Richland County shows the highest differential between inbound and outbound commuters with
over 67,000 more incoming than outgoing worker trips a day. Dorchester and Berkeley lead in
the greatest difference in outbound over inbound commuters at over 23,000 each. Overall, the
state has 38,000 more outgoing commuters than inbound ones.
The state’s commuting patterns show the interconnectivity of South Carolina’s economy as
nearly twice as many commuters travel outside of their residence county or state to work than
stay within county. This travel has major implications for the transportation system and its
upkeep, a major political issue in the state this year.

South Carolina Department of Employment and Workforce
32 South Carolina 2015 Economic Analysis Report
Figure 21
County IntraCounty
One-Way
Outbound From
County
One-Way
Inbound to
County
One-Way
Inbound -
Outbound
Abbeville 2,535 5,847 2,717 -3,130
Aiken 25,466 28,579 20,858 -7,721
Allendale 786 2,851 1,700 -1,151
Anderson 32,937 39,720 22,933 -16,787
Bamberg 1,525 5,729 1,792 -3,937
Barnwell 3,169 5,937 10,584 4,647
Beaufort 31,529 15,659 14,496 -1,163
Berkeley 18,481 48,337 24,686 -23,651
Calhoun 1,010 5,005 2,448 -2,557
Charleston 101,799 35,367 91,272 55,905
Cherokee 9,391 12,428 8,671 -3,757
Chester 3,408 9,123 3,964 -5,159
Chesterfield 6,698 13,283 6,609 -6,674
Clarendon 3,186 6,392 3,125 -3,267
Colleton 5,114 6,910 4,242 -2,668
Darlington 9,760 12,622 9,774 -2,848
Dillon 4,351 7,512 4,146 -3,366
Dorchester 12,432 41,659 15,276 -26,383
Edgefield 2,066 6,963 2,902 -4,061
Fairfield 2,096 5,786 4,069 -1,717
Florence 29,629 19,467 25,423 5,956
Georgetown 9,793 10,684 9,644 -1,040
Greenville 124,686 51,214 100,196 48,982
Greenwood 15,076 12,809 11,303 -1,506
Hampton 2,095 4,404 2,068 -2,336
Horry 73,060 26,056 29,726 3,670
Jasper 1,836 5,743 4,026 -1,717
Kershaw 7,396 18,361 7,170 -11,191
Lancaster 6,745 17,378 8,239 -9,139
Laurens 8,406 18,196 9,513 -8,683
Lee 1,228 5,185 2,544 -2,641
Lexington 42,311 63,744 52,128 -11,616
Marion 2,947 6,151 3,371 -2,780
Marlboro 2,957 4,815 3,057 -1,758
McCormick 537 2,754 719 -2,035
Newberry 6,297 10,791 6,480 -4,311
Oconee 12,572 17,314 8,212 -9,102
Orangeburg 16,702 14,400 13,888 -512
Pickens 16,117 22,815 17,186 -5,629
Richland 89,985 48,668 116,090 67,422
Saluda 1,781 5,108 2,729 -2,379
Spartanburg 62,662 45,612 48,803 3,191
Sumter 19,272 14,315 12,978 -1,337
Union 3,893 6,893 3,319 -3,574
Williamsburg 3,863 12,474 4,801 -7,673
York 40,490 51,000 34,143 -16,857
Total 880,075 832,060 794,020 -38,040
SOURCE: U. S. Census Bureau, Longitudinal Employer-Household Dynamics (LEHD)
Program, 2011 Primary Jobs
Note: Information consists of a commuting trips to a primary job where at least one end of the
trip is in South Carolina. The other end may be in South Carolina, North Carolina, or Georgia.
Primary jobs are those that pay a worker the highest salary if holding multiple jobs.
South Carolina County Commuting Patterns, 2011
South Carolina Department of Employment and Workforce
33 South Carolina 2015 Economic Analysis Report
Job Skills Gap
There has recently been much discussion in the workforce community and media about the
existence of a “job skills gap.” Discussions have presented wide-ranging conclusions from lack
of a skills gap to specifying gaps of various degrees, depending on information used. Some of the
research that has taken place to quantify and study the issue is detailed by the U.S. Department
of Labor.3
This analysis for South Carolina will cover the topic from a broad perspective as well as in detail
using numerous data sources from a supply versus demand perspective where possible. The data-
driven approach is meant to yield a greater understanding and clarity of the topic.
Data Sources
Labor market data for this project is drawn from a variety of government sources responsible for
producing employment and educational statistics as well as one private source of labor demand.
Several data sets from these sources are utilized and categorized as labor supply and labor
demand.
On the job demand side of the analysis, one of the best sources of information is the
Occupational Employment Projections (OEP) program, produced by SCDEW in partnership with
the U. S. Bureau of Labor Statistics (BLS). An important aspect of the OEP is the expectation of
a full-employment economy in the projected year. The data output from the program’s models,
the annual job openings and projected year employment, should be viewed as if the economy
reaches full production capacity in the projection year. From this source, the average annual job
openings and the projected year employment by detailed occupation are used for comparison.
The job openings metric includes openings due to growth in the economy as well as due to
replacements from retirements or others permanently leaving the occupation. Another demand
source utilized is the Help Wanted Online® (HWOL) data series, produced by The Conference
Board. A final source of job demand is the Total Hires data from the U.S. Census Bureau’s
Quarterly Workforce Indicators (QWI) program.
The sources used for labor supply analyses are the OEP base year employment of the two
employment projections (2010, 2012), QWI Beginning of Quarter Employment, the
Occupational Employment Statistics (OES), U.S. Census Bureau’s American Community Survey
(ACS) and Current Population Survey (CPS), the South Carolina Commission on Higher
Education (CHE), and the South Carolina Department of Education.
3 Labor Market Information (LMI) Win-Win Network Community of Practice
(https://winwin.workforce3one.org/page/about)

South Carolina Department of Employment and Workforce
34 South Carolina 2015 Economic Analysis Report
Labor Supply
Figure 22 highlights the sources of labor supply used for statewide analysis. The information is
identified by four general categories of educational attainment—Less than high school, High
school diploma or equivalent, Some college or associate’s degree, and Bachelor’s degree or
higher. This categorization was used because each data element can be classified in this manner,
and it makes for a like comparison across the data sources. Defining and quantifying actual job
skills would not yield as unifying a metric as educational attainment does as the information does
not exist in all data series.
Figure 22
The figure includes 11 separate measures of labor supply. The analysis includes base year
employment (2010 and 2012) from the past two occupational employment projections, the OES
for 2013, the 2013 average annual beginning-of-quarter employment from the QWI, two sets of
2013 annual averages from the CPS, and the 2013 one-year estimate of employment from the
ACS.
Education LevelEstim 2010 OEP
Employment% of Total
Estim 2012 OEP
Employment% of Total OES 2013 % of Total
QWI 2013 Beg
Qtr Employ 25+% of Total
Less than high school 485,840 28% 559,324 29% 531,300 29% 208,446 13%
High school diploma or equivalent 766,313 45% 792,736 41% 781,960 43% 486,671 31%
Some college or associate's 187,200 11% 222,246 11% 197,110 11% 507,458 33%
Bachelor's or higher 282,491 16% 364,675 19% 302,080 17% 354,044 23%
Total 1,721,844 100% 1,938,981 100% 1,812,450 100% 1,556,620 100%
Education LevelCPS 2013
Employed*% of Total
CPS 2013
Unemployed*% of Total
CPS 2013 Labor
Force*% of Total
ACS 2013
Employed Ages
25-64
% of Total
Less than high school 128,200 7% 17,900 15% 146,000 8% 142,921 8%
High school diploma or equivalent 514,800 29% 42,900 37% 557,700 30% 442,642 26%
Some college or associate's 487,900 28% 34,900 30% 522,500 28% 571,198 34%
Bachelor's or higher 628,500 36% 20,000 17% 648,500 35% 537,601 32%
Total 1,759,400 100% 115,700 100% 1,874,700 100% 1,694,362 100%
Education LevelCPS 2013
Employed**% of Total
CPS 2013
Unemployed**% of Total
CPS 2013 Labor
Force**% of Total
Less than high school 173,153 9% 34,597 21% 207,750 10%
High school diploma or equivalent 582,187 29% 62,062 37% 644,249 30%
Some college or associate's 602,449 30% 46,879 28% 649,328 30%
Bachelor's or higher 657,004 33% 22,467 14% 679,471 31%
Total 2,014,792 100% 166,005 100% 2,180,797 100%
SOURCES: Bureau of Labor Statistics (BLS) & SCDEW, Occupational Employment Projections (OEP) Program, Occupational Employment Statistics Program (OES);
U.S. Census Bureau 2013 Quarterly Workforce Indicators Data (QWI) Longitudinal-Employer Household Dynamics Program, Current Population Survey (CPS),
American Community Survey (ACS).
Notes: Percentages may not add due to rounding.
* Current Population Survey, 2013 Annual Average for Persons aged 25 years and older
** Current Population Survey, 2013 Annual Average for Persons aged 16 years and older
South Carolina Measures of Labor Supply by Education Level

South Carolina Department of Employment and Workforce
35 South Carolina 2015 Economic Analysis Report
The employment projections and occupation employment data include an occupation code that is
matched to worker characteristics defined by the BLS and include the typical educational
requirements for entry into the occupations. These data are measures of jobs. The QWI data are
also a measure of jobs. The ACS and CPS data are the result of interviews of respondents as to
their level of education. These two elements are measures of people. The differences in what is
being measured and the method by which the data are collected and disseminated produce
numeric and percentage differences in the educational breakdown of the labor supply
information. The jobs data (OES and OEP) align much more closely with each other than with
the person-survey (CPS and ACS) information. The QWI jobs or employment measure uses ACS
data in its processing and is somewhat of a hybrid between the other jobs data and person
surveys, and its results generally fall between them.
The CPS and ACS data show higher percentages on the upper two levels of education and lower
percentages on the lower two levels as compared to the BLS data (except for the unemployed,
which measures a much smaller segment of the population).
Labor Force and Jobs
A common labor supply comparison made is shown in Figure 23. The chart highlights the
composition of the labor force (employed plus unemployed) and the number of jobs in
percentage terms by educational level. In the Bachelor’s degree or higher category, 31 percent of
the workforce says they are educated to that level, while only 17 percent of the jobs require that
level of training. In the Some college or associate’s degree category, 30 percent of the workforce
is trained to that level to fill the 11
percent of the jobs requiring that
education level.
In the lower two categories of
education combined, the chart shows
that 72 percent of the jobs require a
high school diploma or lower, while
40 percent of the persons in the labor
force have only those levels of
education. The chart implies that, in
general terms, much of the workforce
is overeducated for the jobs they
hold.
Figure 23
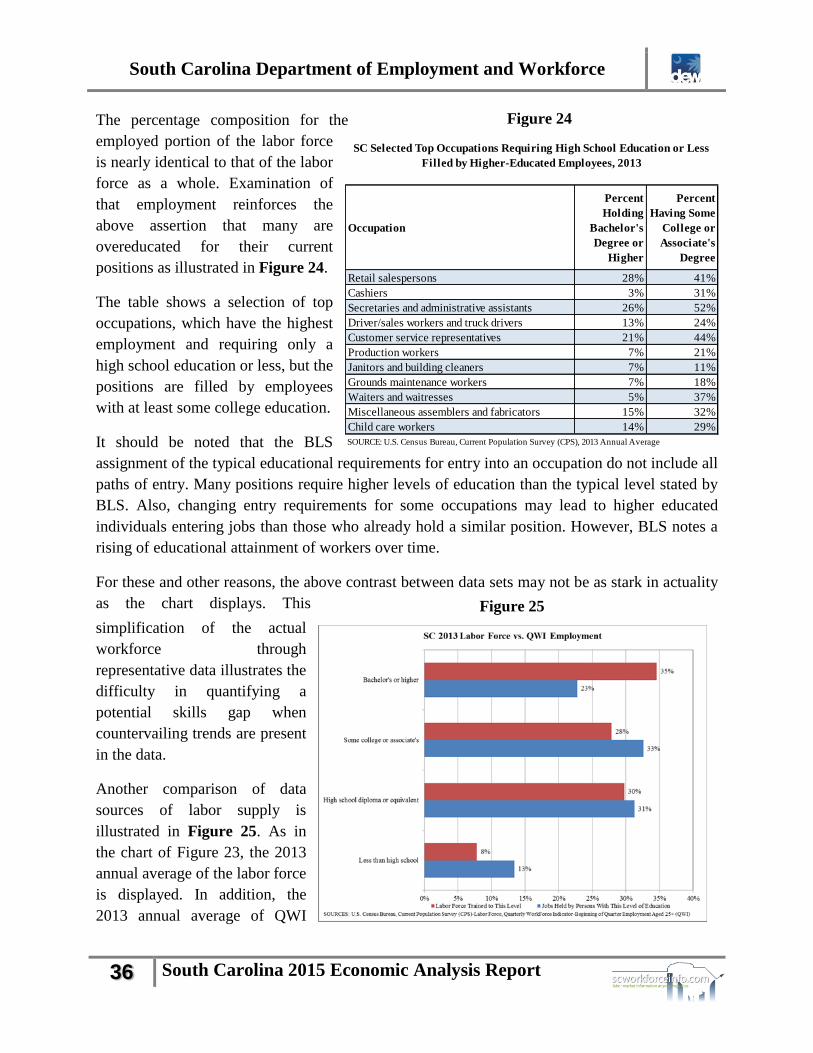
South Carolina Department of Employment and Workforce
36 South Carolina 2015 Economic Analysis Report
The percentage composition for the
employed portion of the labor force
is nearly identical to that of the labor
force as a whole. Examination of
that employment reinforces the
above assertion that many are
overeducated for their current
positions as illustrated in Figure 24.
The table shows a selection of top
occupations, which have the highest
employment and requiring only a
high school education or less, but the
positions are filled by employees
with at least some college education.
It should be noted that the BLS
assignment of the typical educational requirements for entry into an occupation do not include all
paths of entry. Many positions require higher levels of education than the typical level stated by
BLS. Also, changing entry requirements for some occupations may lead to higher educated
individuals entering jobs than those who already hold a similar position. However, BLS notes a
rising of educational attainment of workers over time.
For these and other reasons, the above contrast between data sets may not be as stark in actuality
as the chart displays. This
simplification of the actual
workforce through
representative data illustrates the
difficulty in quantifying a
potential skills gap when
countervailing trends are present
in the data.
Another comparison of data
sources of labor supply is
illustrated in Figure 25. As in
the chart of Figure 23, the 2013
annual average of the labor force
is displayed. In addition, the
2013 annual average of QWI
Figure 24
Figure 25
Occupation
Percent
Holding
Bachelor's
Degree or
Higher
Percent
Having Some
College or
Associate's
Degree
Retail salespersons 28% 41%
Cashiers 3% 31%
Secretaries and administrative assistants 26% 52%
Driver/sales workers and truck drivers 13% 24%
Customer service representatives 21% 44%
Production workers 7% 21%
Janitors and building cleaners 7% 11%
Grounds maintenance workers 7% 18%
Waiters and waitresses 5% 37%
Miscellaneous assemblers and fabricators 15% 32%
Child care workers 14% 29%
SOURCE: U.S. Census Bureau, Current Population Survey (CPS), 2013 Annual Average
SC Selected Top Occupations Requiring High School Education or Less
Filled by Higher-Educated Employees, 2013
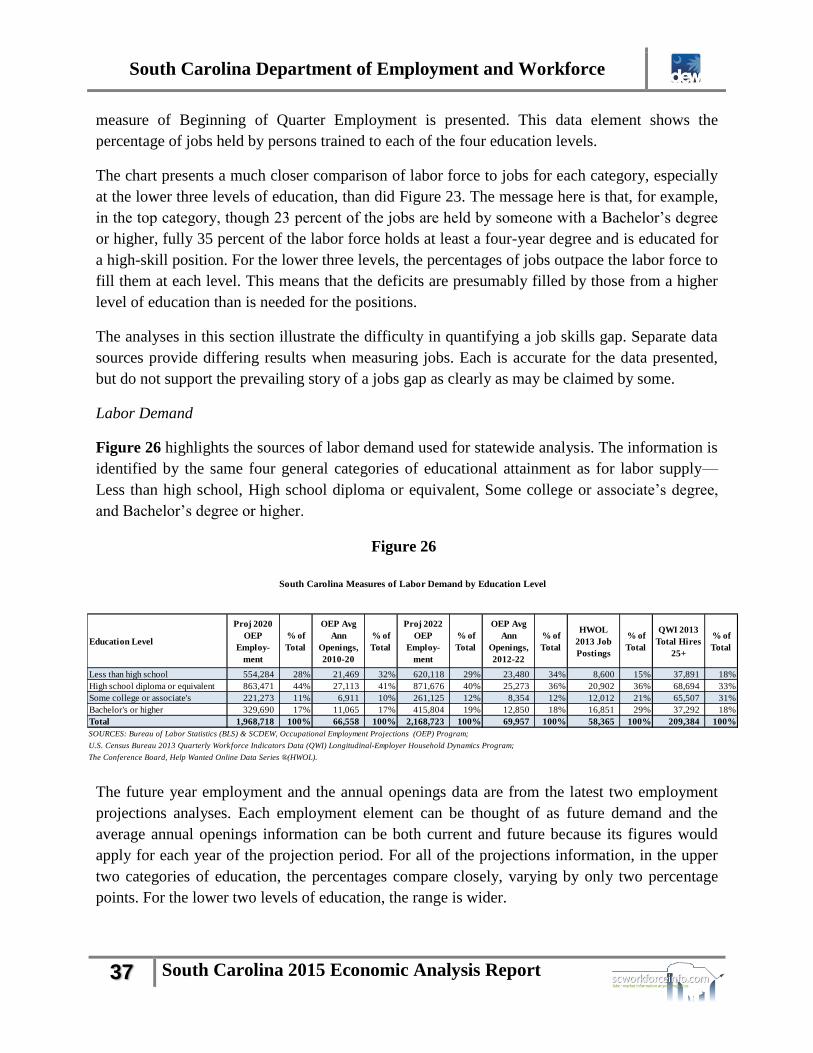
South Carolina Department of Employment and Workforce
37 South Carolina 2015 Economic Analysis Report
Education Level
Proj 2020
OEP
Employ-
ment
% of
Total
OEP Avg
Ann
Openings,
2010-20
% of
Total
Proj 2022
OEP
Employ-
ment
% of
Total
OEP Avg
Ann
Openings,
2012-22
% of
Total
HWOL
2013 Job
Postings
% of
Total
QWI 2013
Total Hires
25+
% of
Total
Less than high school 554,284 28% 21,469 32% 620,118 29% 23,480 34% 8,600 15% 37,891 18%
High school diploma or equivalent 863,471 44% 27,113 41% 871,676 40% 25,273 36% 20,902 36% 68,694 33%
Some college or associate's 221,273 11% 6,911 10% 261,125 12% 8,354 12% 12,012 21% 65,507 31%
Bachelor's or higher 329,690 17% 11,065 17% 415,804 19% 12,850 18% 16,851 29% 37,292 18%
Total 1,968,718 100% 66,558 100% 2,168,723 100% 69,957 100% 58,365 100% 209,384 100%
SOURCES: Bureau of Labor Statistics (BLS) & SCDEW, Occupational Employment Projections (OEP) Program;
U.S. Census Bureau 2013 Quarterly Workforce Indicators Data (QWI) Longitudinal-Employer Household Dynamics Program;
The Conference Board, Help Wanted Online Data Series ®(HWOL).
South Carolina Measures of Labor Demand by Education Level
measure of Beginning of Quarter Employment is presented. This data element shows the
percentage of jobs held by persons trained to each of the four education levels.
The chart presents a much closer comparison of labor force to jobs for each category, especially
at the lower three levels of education, than did Figure 23. The message here is that, for example,
in the top category, though 23 percent of the jobs are held by someone with a Bachelor’s degree
or higher, fully 35 percent of the labor force holds at least a four-year degree and is educated for
a high-skill position. For the lower three levels, the percentages of jobs outpace the labor force to
fill them at each level. This means that the deficits are presumably filled by those from a higher
level of education than is needed for the positions.
The analyses in this section illustrate the difficulty in quantifying a job skills gap. Separate data
sources provide differing results when measuring jobs. Each is accurate for the data presented,
but do not support the prevailing story of a jobs gap as clearly as may be claimed by some.
Labor Demand
Figure 26 highlights the sources of labor demand used for statewide analysis. The information is
identified by the same four general categories of educational attainment as for labor supply—
Less than high school, High school diploma or equivalent, Some college or associate’s degree,
and Bachelor’s degree or higher.
The future year employment and the annual openings data are from the latest two employment
projections analyses. Each employment element can be thought of as future demand and the
average annual openings information can be both current and future because its figures would
apply for each year of the projection period. For all of the projections information, in the upper
two categories of education, the percentages compare closely, varying by only two percentage
points. For the lower two levels of education, the range is wider.
Figure 26

South Carolina Department of Employment and Workforce
38 South Carolina 2015 Economic Analysis Report
The Help Wanted Online® data series shown is the annual average for 2013 and includes an
occupational code that is matched to worker characteristics of required education for entry into
an occupation. The findings are compiled from over 16,000 internet job boards monthly. The
HWOL percentage summary varies widely for the two upper levels of education compared to the
projections data. There is about a 10
percent difference in each of the two
levels in the desired demand
versus the projected demand. The
gap is even wider at the lowest
education level. The QWI Total
Hires actual demand data
compares much more closely for
the lower two categories to the
HWOL desired employer demand
in percentage terms as shown in
Figure 27. There is much
variation in the upper two
categories. This presents a
comparison of unfilled jobs
(HWOL) to filled jobs (QWI).
There appears to be unmet
demand at the Bachelor’s degree level.
The chart in Figure 28 highlights
the comparison of the latest annual
average projected openings to the
QWI Total Hires by percent. This
graphic compares projected
demand to actual demand. For the
Bachelor’s degree or higher level,
the demand matches well at about
18 percent for each source. The
High School level also compares
well. However, 31 percent of the
actual hirings occurred at the Some
College category, while only 12
percent of total openings were
projected to be available at that
level. About one-third of openings
Figure 28
Figure 27

South Carolina Department of Employment and Workforce
39 South Carolina 2015 Economic Analysis Report
were projected to be available at the lowest education level, while only 18 percent of jobs filled
took place there.
Labor Supply Versus Labor
Demand
Comparing various measures of
labor supply and demand yields
an understanding of whether or
not supply can or will meet
demand. One such comparison is
the available labor force to the
projected job openings as shown
in Figure 29.
For the top two educational
categories, the graphic shows that
61 percent of the labor force is
trained with at least some college,
while only 30 percent of the job
openings are available at those
same levels.
Generally, the opposite situation is true for the lower two levels. That is, more job openings are
available (70 percent) for a smaller share of the labor force (40 percent). This means that persons
not able to find positions at their
higher level of training must search
for jobs requiring less education.
Another useful comparison is the
labor force and the HWOL job
postings information. Figure 30
shows a close agreement between
the data sets for the Bachelor’s
degree or higher category with just
a two percent difference. In fact,
the greatest difference for any
category is nine percent.
Overall, this is a very good match
between labor supply and demand.
Taking the top three categories
Figure 29
Figure 30
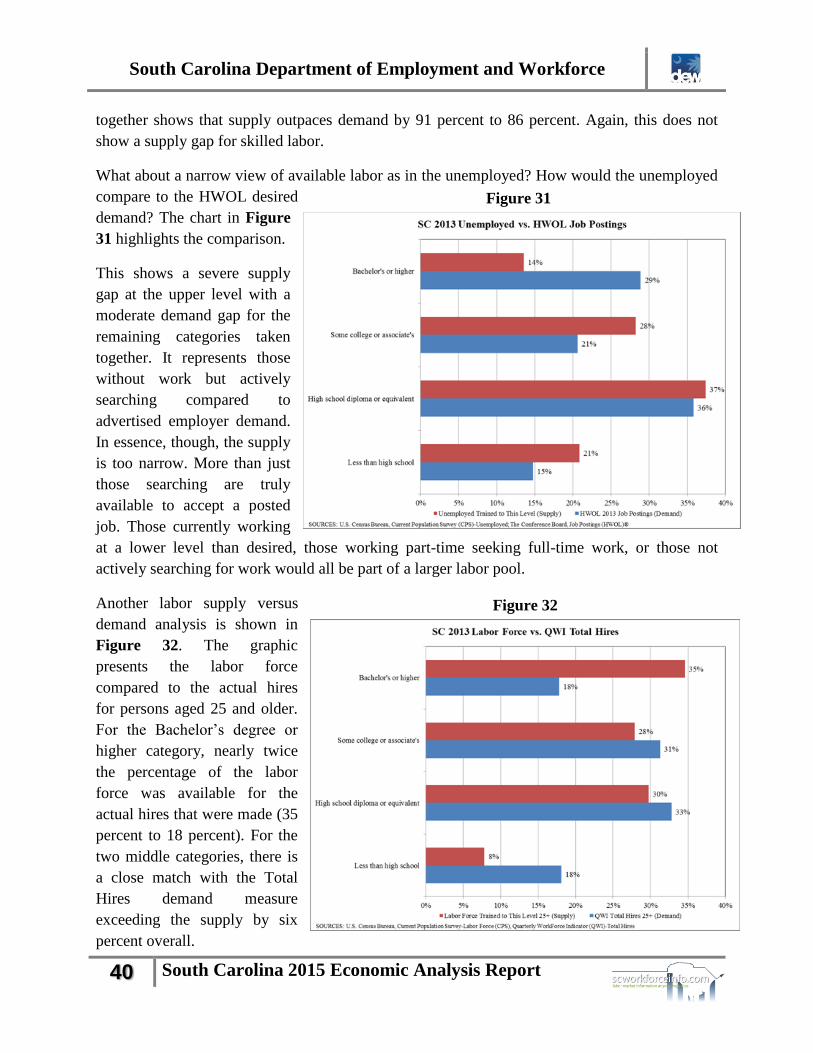
South Carolina Department of Employment and Workforce
40 South Carolina 2015 Economic Analysis Report
together shows that supply outpaces demand by 91 percent to 86 percent. Again, this does not
show a supply gap for skilled labor.
What about a narrow view of available labor as in the unemployed? How would the unemployed
compare to the HWOL desired
demand? The chart in Figure
31 highlights the comparison.
This shows a severe supply
gap at the upper level with a
moderate demand gap for the
remaining categories taken
together. It represents those
without work but actively
searching compared to
advertised employer demand.
In essence, though, the supply
is too narrow. More than just
those searching are truly
available to accept a posted
job. Those currently working
at a lower level than desired, those working part-time seeking full-time work, or those not
actively searching for work would all be part of a larger labor pool.
Another labor supply versus
demand analysis is shown in
Figure 32. The graphic
presents the labor force
compared to the actual hires
for persons aged 25 and older.
For the Bachelor’s degree or
higher category, nearly twice
the percentage of the labor
force was available for the
actual hires that were made (35
percent to 18 percent). For the
two middle categories, there is
a close match with the Total
Hires demand measure
exceeding the supply by six
percent overall.
Figure 31
Figure 32
South Carolina Department of Employment and Workforce
41 South Carolina 2015 Economic Analysis Report
The comparison supports the point made earlier that labor oversupply on the upper end of the
educational spectrum leads to many in the workforce taking positions for which they are over
trained.
Recent Postsecondary Completers Versus Projected Annual Job Openings
A more detailed analysis of supply and demand gap statewide is shown by comparing the
number of completions from public and independent postsecondary schools with projected
annual job openings. This analysis uses data from the CHE for the state and compares it to the
latest available statewide analysis on the average annual job openings from SCDEW’s OEP
Program, 2012-2022, which shows the openings for an average year over the 10-year period. The
listed openings are projected to be available for each of the ten years.
The CHE completer database covers the most recently available school year 2012-2013 (July 1
to June 30 for the term) and includes the Classification of Instructional Programs (CIP) code, the
institution name, and number of graduates in each of 10 degree classifications. Each CIP code is
matched to one of 16 career clusters for comparison to the OEP data. The OEP data details the
expected job openings for an average year over the period 2012 to 2022 and includes the
occupational code, which is matched to a career cluster, to the educational job requirements to
enter the occupation, to the typical work experience needed for the job, and to the on-the-job
training needed for the position.
The CHE databases were summarized by career cluster and by degree awarded. The employment
projections were summarized by career cluster and by education level required for the job for
those categories matching the CHE degree program summaries. A comparison was made for the
two primary data sets in terms of the number of graduates to the number of projected job
openings for each of the two variables. Figures 33, 34, and 35 present tables highlighting the
entire analysis.

South Carolina Department of Employment and Workforce
42 South Carolina 2015 Economic Analysis Report
Figure 33
Figure 34
Career Clusters
Postsecond-
ary Non-
Degree Award
Associate's Bachelor's Master's Doctorate Total
Agriculture, Food & Natural Resources 50 95 357 68 12 582
Architecture & Construction 598 189 140 53 5 985
Arts, Audio/Video Technology & Communications 150 95 2,139 194 25 2,603
Business Management & Administration 525 1,003 3,246 997 15 5,786
Education & Training 271 3,056 4,409 2,092 158 9,986
Finance 235 236 950 154 - 1,575
Government & Public Adminstration - - 739 67 13 819
Health Science 3,147 2,127 1,703 655 756 8,388
Hospitality & Tourism 268 167 474 31 7 947
Human Services 648 610 1,927 802 41 4,028
Information Technology 359 464 473 111 16 1,423
Law, Public Safety, Corrections & Security 153 667 600 42 218 1,680
Manufacturing 1,185 479 31 - - 1,695
Marketing 31 77 858 40 - 1,006
Science, Technology, Engineering & Mathematics 95 591 5,535 840 251 7,312
Transportation, Distribution & Logistics 689 144 3 7 - 843
Grand Total 8,404 10,000 23,584 6,153 1,517 49,658
SOURCE: SC Commission on Higher Education (CHE)
NOTE: For CHE, all awards above Bachelor's degree and below Doctorate level were included in Master's.
South Carolina Postsecondary Completers by Career Cluster, 2012-2013
Career Cluster
Postsecond-
ary Non-
Degree Award
Associate's Bachelor's Master's Doctorate Total
Agriculture, Food & Natural Resources 45 86 - 131
Architecture & Construction 211 34 463 708
Arts, Audio/Video Technology & Communications 126 16 274 416
Business, Management and Administration 2,008 7 2,015
Education & Training 94 178 2,373 574 370 3,589
Finance 1,179 1,179
Government & Public Adminstration 158 24 182
Health Science 2,395 2,438 494 305 905 6,537
Hospitality & Tourism 120 120
Human Service 270 21 334 161 786
Information Technology 86 886 972
Law, Public Safety, Corrections & Security 214 159 15 214 602
Manufacturing 224 293 517
Marketing 629 629
Science, Technology, Engineering & Mathematics 1,160 19 10 1,189
Transportation, Distribution & Logistics 857 18 82 957
Grand Total 4,391 3,288 10,261 1,090 1,499 20,529
SOURCE: BLS, SCDEW, Occupational Employment Projections (OEP), 2012-2022 Projections
South Carolina Projected Average Annual Job Openings by Career Cluster, 2012-2022
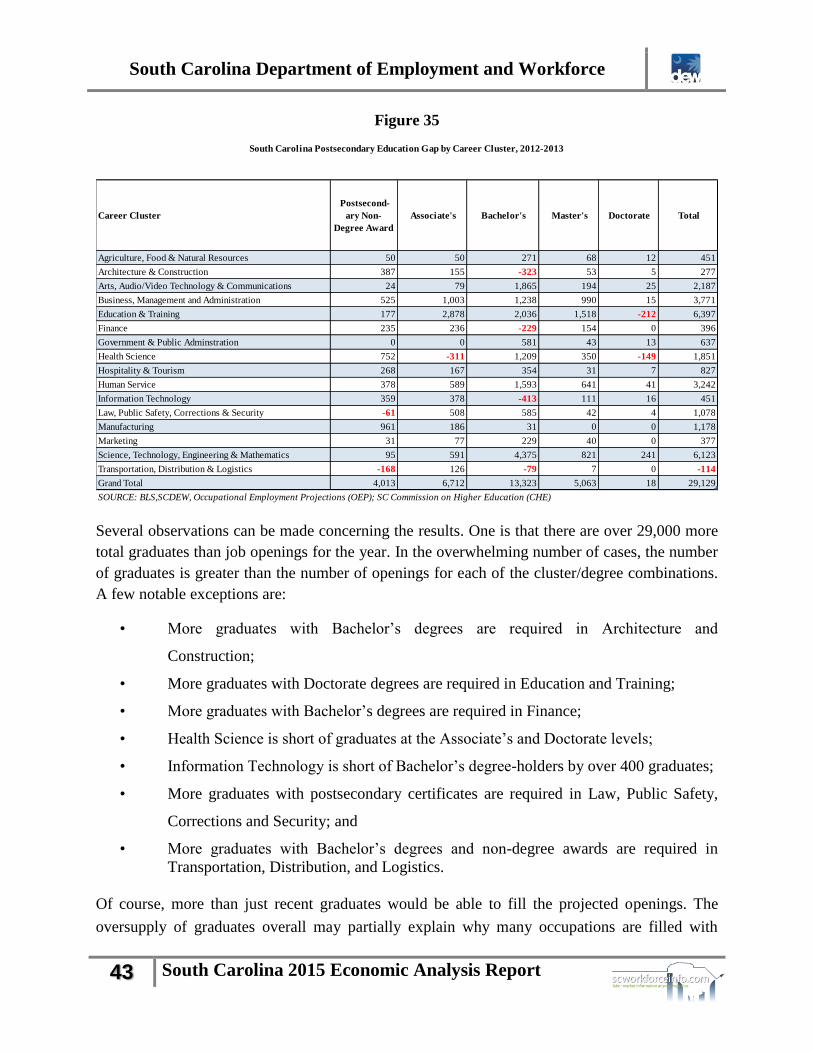
South Carolina Department of Employment and Workforce
43 South Carolina 2015 Economic Analysis Report
Figure 35
Several observations can be made concerning the results. One is that there are over 29,000 more
total graduates than job openings for the year. In the overwhelming number of cases, the number
of graduates is greater than the number of openings for each of the cluster/degree combinations.
A few notable exceptions are:
• More graduates with Bachelor’s degrees are required in Architecture and
Construction;
• More graduates with Doctorate degrees are required in Education and Training;
• More graduates with Bachelor’s degrees are required in Finance;
• Health Science is short of graduates at the Associate’s and Doctorate levels;
• Information Technology is short of Bachelor’s degree-holders by over 400 graduates;
• More graduates with postsecondary certificates are required in Law, Public Safety,
Corrections and Security; and
• More graduates with Bachelor’s degrees and non-degree awards are required in
Transportation, Distribution, and Logistics.
Of course, more than just recent graduates would be able to fill the projected openings. The
oversupply of graduates overall may partially explain why many occupations are filled with
Career Cluster
Postsecond-
ary Non-
Degree Award
Associate's Bachelor's Master's Doctorate Total
Agriculture, Food & Natural Resources 50 50 271 68 12 451
Architecture & Construction 387 155 -323 53 5 277
Arts, Audio/Video Technology & Communications 24 79 1,865 194 25 2,187
Business, Management and Administration 525 1,003 1,238 990 15 3,771
Education & Training 177 2,878 2,036 1,518 -212 6,397
Finance 235 236 -229 154 0 396
Government & Public Adminstration 0 0 581 43 13 637
Health Science 752 -311 1,209 350 -149 1,851
Hospitality & Tourism 268 167 354 31 7 827
Human Service 378 589 1,593 641 41 3,242
Information Technology 359 378 -413 111 16 451
Law, Public Safety, Corrections & Security -61 508 585 42 4 1,078
Manufacturing 961 186 31 0 0 1,178
Marketing 31 77 229 40 0 377
Science, Technology, Engineering & Mathematics 95 591 4,375 821 241 6,123
Transportation, Distribution & Logistics -168 126 -79 7 0 -114
Grand Total 4,013 6,712 13,323 5,063 18 29,129
SOURCE: BLS,SCDEW, Occupational Employment Projections (OEP); SC Commission on Higher Education (CHE)
South Carolina Postsecondary Education Gap by Career Cluster, 2012-2013
South Carolina Department of Employment and Workforce
44 South Carolina 2015 Economic Analysis Report
overqualified candidates as highlighted in Figure 24. Analysis of the two previous school-year
completers, not shown, revealed similar numbers of graduates as well as distributions across
degrees and career clusters.
Twelfth Grade Student Career Cluster Choices Versus Projected Annual Openings
A final examination of potential labor supply and projected demand is with South Carolina
twelfth grade students and projected job openings. Many high schools seniors are on the cusp of
entering the workforce within one year. High school students in the state must choose one of 16
career clusters in order to focus their educational efforts. For the school year 2012-2013, their
choices were summarized by career cluster and LWIA on a percentage basis. The average annual
job openings from the 2012-2022 OEP program, the latest available at the LWIA level, were
summarized in a similar manner. Again, the OEP data details the expected job openings for each
year over the period 2012 to 2022. The differences between the two data sets show whether or
not a gap exists between potential labor supply and demand. Obviously, there is no certainty that
the students will actually join the workforce in an occupation within their chosen cluster or in the
geographic area in which they attended school. The tables below in Figure 36 highlight this
analysis.
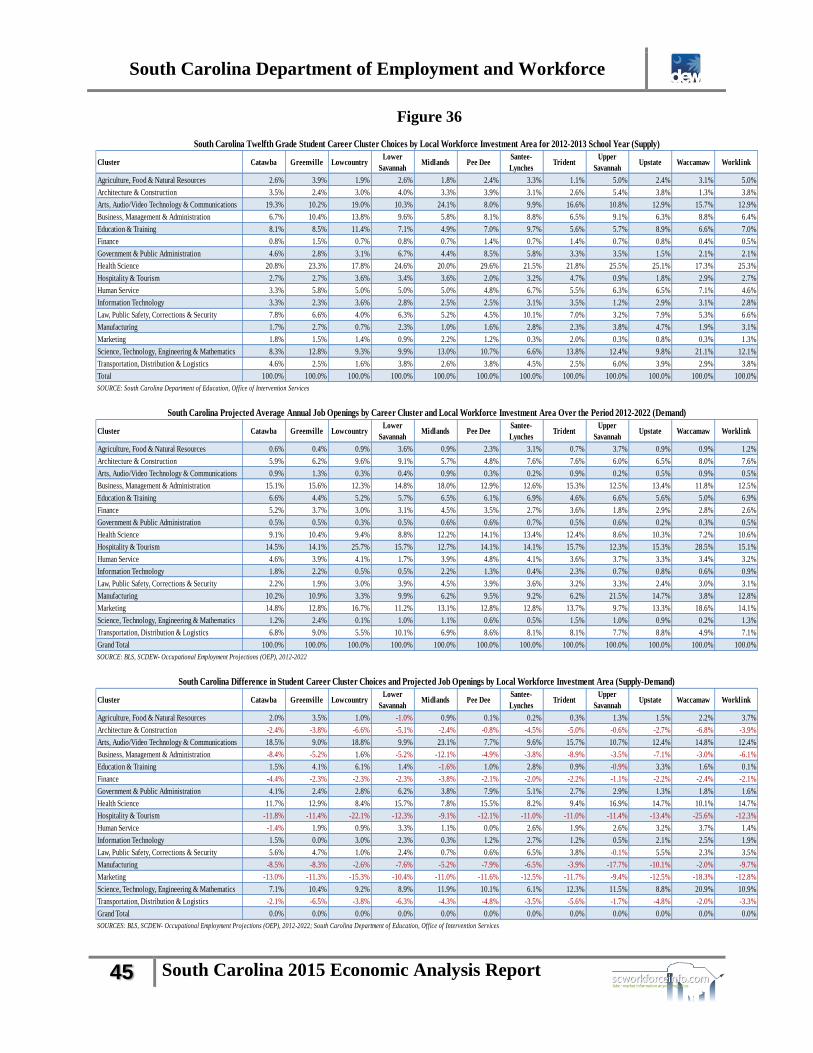
South Carolina Department of Employment and Workforce
45 South Carolina 2015 Economic Analysis Report
Cluster Catawba Greenville LowcountryLower
SavannahMidlands Pee Dee
Santee-
LynchesTrident
Upper
SavannahUpstate Waccamaw Worklink
Agriculture, Food & Natural Resources 2.6% 3.9% 1.9% 2.6% 1.8% 2.4% 3.3% 1.1% 5.0% 2.4% 3.1% 5.0%
Architecture & Construction 3.5% 2.4% 3.0% 4.0% 3.3% 3.9% 3.1% 2.6% 5.4% 3.8% 1.3% 3.8%
Arts, Audio/Video Technology & Communications 19.3% 10.2% 19.0% 10.3% 24.1% 8.0% 9.9% 16.6% 10.8% 12.9% 15.7% 12.9%
Business, Management & Administration 6.7% 10.4% 13.8% 9.6% 5.8% 8.1% 8.8% 6.5% 9.1% 6.3% 8.8% 6.4%
Education & Training 8.1% 8.5% 11.4% 7.1% 4.9% 7.0% 9.7% 5.6% 5.7% 8.9% 6.6% 7.0%
Finance 0.8% 1.5% 0.7% 0.8% 0.7% 1.4% 0.7% 1.4% 0.7% 0.8% 0.4% 0.5%
Government & Public Administration 4.6% 2.8% 3.1% 6.7% 4.4% 8.5% 5.8% 3.3% 3.5% 1.5% 2.1% 2.1%
Health Science 20.8% 23.3% 17.8% 24.6% 20.0% 29.6% 21.5% 21.8% 25.5% 25.1% 17.3% 25.3%
Hospitality & Tourism 2.7% 2.7% 3.6% 3.4% 3.6% 2.0% 3.2% 4.7% 0.9% 1.8% 2.9% 2.7%
Human Service 3.3% 5.8% 5.0% 5.0% 5.0% 4.8% 6.7% 5.5% 6.3% 6.5% 7.1% 4.6%
Information Technology 3.3% 2.3% 3.6% 2.8% 2.5% 2.5% 3.1% 3.5% 1.2% 2.9% 3.1% 2.8%
Law, Public Safety, Corrections & Security 7.8% 6.6% 4.0% 6.3% 5.2% 4.5% 10.1% 7.0% 3.2% 7.9% 5.3% 6.6%
Manufacturing 1.7% 2.7% 0.7% 2.3% 1.0% 1.6% 2.8% 2.3% 3.8% 4.7% 1.9% 3.1%
Marketing 1.8% 1.5% 1.4% 0.9% 2.2% 1.2% 0.3% 2.0% 0.3% 0.8% 0.3% 1.3%
Science, Technology, Engineering & Mathematics 8.3% 12.8% 9.3% 9.9% 13.0% 10.7% 6.6% 13.8% 12.4% 9.8% 21.1% 12.1%
Transportation, Distribution & Logistics 4.6% 2.5% 1.6% 3.8% 2.6% 3.8% 4.5% 2.5% 6.0% 3.9% 2.9% 3.8%
Total 100.0% 100.0% 100.0% 100.0% 100.0% 100.0% 100.0% 100.0% 100.0% 100.0% 100.0% 100.0%
SOURCE: South Carolina Department of Education, Office of Intervention Services
Cluster Catawba Greenville LowcountryLower
SavannahMidlands Pee Dee
Santee-
LynchesTrident
Upper
SavannahUpstate Waccamaw Worklink
Agriculture, Food & Natural Resources 0.6% 0.4% 0.9% 3.6% 0.9% 2.3% 3.1% 0.7% 3.7% 0.9% 0.9% 1.2%
Architecture & Construction 5.9% 6.2% 9.6% 9.1% 5.7% 4.8% 7.6% 7.6% 6.0% 6.5% 8.0% 7.6%
Arts, Audio/Video Technology & Communications 0.9% 1.3% 0.3% 0.4% 0.9% 0.3% 0.2% 0.9% 0.2% 0.5% 0.9% 0.5%
Business, Management & Administration 15.1% 15.6% 12.3% 14.8% 18.0% 12.9% 12.6% 15.3% 12.5% 13.4% 11.8% 12.5%
Education & Training 6.6% 4.4% 5.2% 5.7% 6.5% 6.1% 6.9% 4.6% 6.6% 5.6% 5.0% 6.9%
Finance 5.2% 3.7% 3.0% 3.1% 4.5% 3.5% 2.7% 3.6% 1.8% 2.9% 2.8% 2.6%
Government & Public Administration 0.5% 0.5% 0.3% 0.5% 0.6% 0.6% 0.7% 0.5% 0.6% 0.2% 0.3% 0.5%
Health Science 9.1% 10.4% 9.4% 8.8% 12.2% 14.1% 13.4% 12.4% 8.6% 10.3% 7.2% 10.6%
Hospitality & Tourism 14.5% 14.1% 25.7% 15.7% 12.7% 14.1% 14.1% 15.7% 12.3% 15.3% 28.5% 15.1%
Human Service 4.6% 3.9% 4.1% 1.7% 3.9% 4.8% 4.1% 3.6% 3.7% 3.3% 3.4% 3.2%
Information Technology 1.8% 2.2% 0.5% 0.5% 2.2% 1.3% 0.4% 2.3% 0.7% 0.8% 0.6% 0.9%
Law, Public Safety, Corrections & Security 2.2% 1.9% 3.0% 3.9% 4.5% 3.9% 3.6% 3.2% 3.3% 2.4% 3.0% 3.1%
Manufacturing 10.2% 10.9% 3.3% 9.9% 6.2% 9.5% 9.2% 6.2% 21.5% 14.7% 3.8% 12.8%
Marketing 14.8% 12.8% 16.7% 11.2% 13.1% 12.8% 12.8% 13.7% 9.7% 13.3% 18.6% 14.1%
Science, Technology, Engineering & Mathematics 1.2% 2.4% 0.1% 1.0% 1.1% 0.6% 0.5% 1.5% 1.0% 0.9% 0.2% 1.3%
Transportation, Distribution & Logistics 6.8% 9.0% 5.5% 10.1% 6.9% 8.6% 8.1% 8.1% 7.7% 8.8% 4.9% 7.1%
Grand Total 100.0% 100.0% 100.0% 100.0% 100.0% 100.0% 100.0% 100.0% 100.0% 100.0% 100.0% 100.0%
SOURCE: BLS, SCDEW- Occupational Employment Projections (OEP), 2012-2022
Cluster Catawba Greenville LowcountryLower
SavannahMidlands Pee Dee
Santee-
LynchesTrident
Upper
SavannahUpstate Waccamaw Worklink
Agriculture, Food & Natural Resources 2.0% 3.5% 1.0% -1.0% 0.9% 0.1% 0.2% 0.3% 1.3% 1.5% 2.2% 3.7%
Architecture & Construction -2.4% -3.8% -6.6% -5.1% -2.4% -0.8% -4.5% -5.0% -0.6% -2.7% -6.8% -3.9%
Arts, Audio/Video Technology & Communications 18.5% 9.0% 18.8% 9.9% 23.1% 7.7% 9.6% 15.7% 10.7% 12.4% 14.8% 12.4%
Business, Management & Administration -8.4% -5.2% 1.6% -5.2% -12.1% -4.9% -3.8% -8.9% -3.5% -7.1% -3.0% -6.1%
Education & Training 1.5% 4.1% 6.1% 1.4% -1.6% 1.0% 2.8% 0.9% -0.9% 3.3% 1.6% 0.1%
Finance -4.4% -2.3% -2.3% -2.3% -3.8% -2.1% -2.0% -2.2% -1.1% -2.2% -2.4% -2.1%
Government & Public Administration 4.1% 2.4% 2.8% 6.2% 3.8% 7.9% 5.1% 2.7% 2.9% 1.3% 1.8% 1.6%
Health Science 11.7% 12.9% 8.4% 15.7% 7.8% 15.5% 8.2% 9.4% 16.9% 14.7% 10.1% 14.7%
Hospitality & Tourism -11.8% -11.4% -22.1% -12.3% -9.1% -12.1% -11.0% -11.0% -11.4% -13.4% -25.6% -12.3%
Human Service -1.4% 1.9% 0.9% 3.3% 1.1% 0.0% 2.6% 1.9% 2.6% 3.2% 3.7% 1.4%
Information Technology 1.5% 0.0% 3.0% 2.3% 0.3% 1.2% 2.7% 1.2% 0.5% 2.1% 2.5% 1.9%
Law, Public Safety, Corrections & Security 5.6% 4.7% 1.0% 2.4% 0.7% 0.6% 6.5% 3.8% -0.1% 5.5% 2.3% 3.5%
Manufacturing -8.5% -8.3% -2.6% -7.6% -5.2% -7.9% -6.5% -3.9% -17.7% -10.1% -2.0% -9.7%
Marketing -13.0% -11.3% -15.3% -10.4% -11.0% -11.6% -12.5% -11.7% -9.4% -12.5% -18.3% -12.8%
Science, Technology, Engineering & Mathematics 7.1% 10.4% 9.2% 8.9% 11.9% 10.1% 6.1% 12.3% 11.5% 8.8% 20.9% 10.9%
Transportation, Distribution & Logistics -2.1% -6.5% -3.8% -6.3% -4.3% -4.8% -3.5% -5.6% -1.7% -4.8% -2.0% -3.3%
Grand Total 0.0% 0.0% 0.0% 0.0% 0.0% 0.0% 0.0% 0.0% 0.0% 0.0% 0.0% 0.0%
SOURCES: BLS, SCDEW- Occupational Employment Projections (OEP), 2012-2022; South Carolina Department of Education, Office of Intervention Services
South Carolina Twelfth Grade Student Career Cluster Choices by Local Workforce Investment Area for 2012-2013 School Year (Supply)
South Carolina Projected Average Annual Job Openings by Career Cluster and Local Workforce Investment Area Over the Period 2012-2022 (Demand)
South Carolina Difference in Student Career Cluster Choices and Projected Job Openings by Local Workforce Investment Area (Supply-Demand)
Figure 36
South Carolina Department of Employment and Workforce
46 South Carolina 2015 Economic Analysis Report
Arts, Audio-Video Technology, and Communications; Health Sciences; and Science,
Technology, Engineering, and Mathematics (STEM) were the top three student choices in most
of the LWIAs, while Business Management and Administration; Marketing; and Hospitality and
Tourism were, generally, the top three clusters with the largest projected openings. These six
clusters were where most of the gaps occurred between the supply and demand for the LWIAs.
There were additional clusters with other mismatches for a few of the LWIAs as well.
Occupations such as Customer Service Representatives, Retail Salesperson, Waiters and
Waitresses, Food Preparation and Serving Workers, seen in the Marketing and Hospitality and
Tourism clusters, are among the most demanded by South Carolina employers but not what
students are choosing. These occupations require less education than many occupations that
students desire.
This analysis gives an indication as to the skills gap that has been in the news over the past
several years. Students’ choices for a career do not match up with the needs of employers in
many situations. The previous analysis of recent college completers produced similar results in
that there were severe supply/demand mismatches in several key comparisons. Though overall
supply seems to meet employer demand, examining the data at a deeper level reveals supply gaps
in certain clusters/degrees and geographies in the state, at least as far as new potential workers
are concerned. Of course, not all the students and graduates would find work in-state, and also
many out-of-state graduates would come to South Carolina to work. The analysis does not imply
a closed system but presents the available information to better understand the dynamics of the
workforce.
Soft Skills
Soft skills are those attributes not defined by technical accomplishments or certifications
attained. They are interpersonal skills or character traits that define an individual. Job
advertisements from the HWOL database identify hard and soft skills that employers seek.
Analysis of data over the past three years indicates that many soft skills are listed as a part of the
job postings, such as communication skills, integrity, team-orientation, detail-orientation,
problem solving skills, and self-motivation. For example, oral and written communication skills
appeared in 46,800 job postings in the state or 27 percent of the total ads over a four-month
period in the latter part of 2014 and early 2015. Over 20,500 ads for the same time frame listed
the soft skill “integrity.”
Many of these requisite soft skills appear in ads across the workforce spectrum, including most
occupations, experience levels desired, or education required. These skills can be learned or
improved upon through proper training. They should be a part of the basic educational package
that high school and postsecondary students should be expected to have mastered before entering
the workforce, but those skills are missing in many individuals. The fact that advertisements list
these requirements indicates that there is a soft skills gap experienced by employers.

South Carolina Department of Employment and Workforce
47 South Carolina 2015 Economic Analysis Report
Job Skills Gap Conclusion
This examination utilized 19 separate data series in a comprehensive analysis but may not be the
final answer on this complex subject as other sources or specific employer surveys may highlight
differing aspects of the skills gap topic.
Perhaps, there is a question of quality of the workforce not so much as quantity. Many students
and graduates have career desires or awards in professions that have either an oversupply of
recent potential workers or a low employer demand. Employers require improved soft skills of
their potential employees across the workforce.
In terms of supply versus demand, the findings generally show that there is an oversupply of the
labor force on the upper half of the educational spectrum when compared to job demand.
South Carolina Department of Employment and Workforce
48 South Carolina 2015 Economic Analysis Report
Required Language
This workforce product was funded by a grant awarded by the U.S. Department of Labor’s
Employment and Training Administration. The product was created by the recipient and does not
necessarily reflect the official position of the U.S. Department of Labor. The Department of
Labor makes no guarantees, warranties, or assurances of any kind, express or implied, with
respect to such information, including any information on linked sites and including, but not
limited to, accuracy of the information or its completeness, timeliness, usefulness, adequacy,
continued availability, or ownership. This product is copyrighted by the institution that created it.
Internal use by an organization and/or personal use by an individual for non-commercial
purposes is permissible. All other uses require the prior authorization of the copyright owner.”
The Federal Government reserves a paid-up, nonexclusive and irrevocable license to reproduce,
publish or otherwise use, and to authorize others to use for federal purposes: i) the copyright in
all products developed under the grant, including a subgrant or contract under the grant or
subgrant; and ii) any rights of copyright to which the recipient, subrecipient or a contractor
purchases ownership under an award (including but not limited to curricula, training models,
technical assistance products, and any related materials). Such uses include, but are not limited
to, the right to modify and distribute such products worldwide by any means, electronically or
otherwise. Federal funds may not be used to pay any royalty or license fee for use of a
copyrighted work, or the cost of acquiring by purchase a copyright in a work, where the
Department has a license or rights of free use in such work, although they may be used to pay
costs for obtaining a copy which is limited to the developer/seller costs of copying and shipping.
If revenues are generated through selling products developed with grant funds, including
intellectual property, these revenues are program income. Program income must be used in
accordance with the provisions of this grant award and 2 CFR 200.307.

South Carolina Department of Employment and Workforce
49 South Carolina 2015 Economic Analysis Report

South Carolina Department of Employment and Workforce
50 South Carolina 2015 Economic Analysis Report
South Carolina Department of Employment and Workforce
1550 Gadsden Street Columbia, South Carolina 29201
(803) 737-2660
www.dew.sc.gov
www.scworkforceinfo.com