South Australian Recreational Fishing Survey 2013/14 · 2015-12-11 · South Australian...
75
South Australian Recreational Fishing Survey 2013/14 July 2015 Fisheries Victoria Internal Report Series No. 62
Transcript of South Australian Recreational Fishing Survey 2013/14 · 2015-12-11 · South Australian...
South Australian Recreational Fishing Survey 2013/14
July 2015 Fisheries Victoria Internal Report Series No. 62

South Australian Recreational Fishing Survey 2013/14 Khageswor Giri and Kylie Hall
July 2015
Fisheries Victoria Internal Report Series No. 62
Published by the Victorian Government, Department of Economic Development, Jobs, Transport and Resources (DEDJTR), July 2015
© The State of Victoria, Department of Economic Development, Jobs, Transport and Resources Melbourne 2015 This publication is copyright. No part may be reproduced by any process except in accordance with the provisions of the Copyright Act 1968.
Authorised by the Victorian Government, 1 Spring Street, Melbourne.
Printed by DEDJTR Queenscliff, Victoria.
Preferred way to cite this publication: Giri K and Hall K (2015) South Australian Recreational Fishing Survey. Fisheries Victoria Internal Report Series No. 62.
Author Contact Details: Khageswor Giri C/- Fisheries Management and Science Branch, Fisheries Victoria PO Box 114, Queenscliff Vic 3225
Copies are available from the website www.ecodev.vic.gov.au/fishing
For more information contact the DEDJTR Customer Service Centre 136 186
Disclaimer This publication may be of assistance to you but the State of Victoria and its employees do not guarantee that the publication is without flaw of any kind or is wholly appropriate for your particular purposes and therefore disclaims all liability for any error, loss or other consequence which may arise from you relying on any information in this publication.
Accessibility If you would like to receive this publication in an accessible format, such as large print or audio, please telephone 136 186, or email [email protected]
Deaf, hearing impaired or speech impaired? Call us via the National Relay Service on 133 677 or visit www.relayservice.com.au
This document is also available in PDF format on the internet at www.ecodev.vic.gov.au
SA recreational fishing survey 2013/14 ii
Contents
Executive Summary 1
Key Findings 1 Resident Participation and Demographics 1 Fishing Effort 2 Catch (Total, Harvested and Released Numbers) 2 Comparison between the 2000/01, 2007/08 and 2013/14 Surveys 2 Catches of Key Species 2
Introduction 4
Background 4 Objectives 4 Report Structure 5
Survey Methods and Analysis 6
Survey Scope 6 Survey Methods 6 Survey Overview 6 Sampling Design 7 Screening Survey 7 Telephone Diary Survey 9 Non-intending Fisher Survey 9 Attitudinal/’Wash-up’ Survey 9 On-site Surveys 10 Data Management 10 Online/Telephone Survey Components 10 On-site Surveys 10 Data Analysis 10 Regions 11 Sampling Regions 11 Fishing Regions 12 Fishing Effort 13 Fishing Methods 13 Catch 13
Results — Sample and Response Profiles 14
Screening Survey 14 Diary Survey 15 Non-intending Fisher Survey 16 Attitudinal/’Wash-up’ Survey 16 On-site Surveys 16 Diary Survey Catch Length Measurements 17
Results — Fisher Profiles 18
Numbers of Fishers and Participation Rates 18 Age and Gender 19
SA recreational fishing survey 2013/14 iii
Results — Fishing Effort 20
Days Fished by Fisher 20 Fishing Method 21 Fishing Region 22 Fishing by Stratum 23 Fishing Platform 24
Results — Catch 25
Total Catch, Harvested and Released Numbers 25 Harvest Weights 29
Results — Key Species 34
King George Whiting (Sillaginodes punctatus) 34 Snapper (Chrysophrys auratus formerly Pagrus auratus) 35 Southern Garfish (Hyporhamphus melanochir) 36 Southern Calamari (Sepioteuthis australis) 37 Blue Swimmer Crab (Portunus armatus formerly Portunus pelagicus) 38 Southern Rock Lobster (Jasus edwardsii) 40 Mulloway (Argyrosomus japonicus formerly Argyrosomus hololepidotus) 42 Australian Salmon (Arripis truttaceus) 43 Pipi (Plebidonax deltoids) 44
Results — Comparison with the 2007/08 Survey 45
Response Profiles 45 Fisher Characteristics 46 Participation Rates 46 Age and Gender 47 Fishing Effort 49 Catch 50
Discussion 53
Changes in Participation, Participation Rates and Fishing Effort 53 Validation of Estimates from Large Surveys 53 Improving the Precision of Species Catch Estimates 53 Interstate Component of Recreational Fishing in South Australia 54 Use of Estimates for Future Management of the Recreational Fishery and Resource Allocation Decisions 54
Acknowledgements 55
References 56
Appendices 58
A.1 Angler Diary Cover Letter and Instructions 2013/14 58 A.2 Estimated number of SA resident recreational fishers, aged 5 years or older, who fished in SA during 2013/14, by gender, age group and statistical division (SD). 64
SA recreational fishing survey 2013/14 iv
A.3 Estimated participation rate (% of resident population) of SA resident recreational fishers, aged 5 years or older, who fished in SA during 2013/14, by gender, age group and statistical division (SD). 65
List of Tables
Table 1: South Australian private-dwelling population (number of households), sample size, and sample loss/response profiles for the screening survey, by stratum (statistical division, SD). ............... 14
Table 2: Screening survey samples and call outcomes for landline and mobile households. .................. 15 Table 3: Diary recruitment performance.................................................................................................... 15 Table 4: Household response profiles for the diary survey by stratum (statistical division, SD). ............. 16 Table 5: Proportion (%) of fishing effort according to method of capture. ................................................ 21 Table 6: Fishing effort by stratum (statistical division, SD). ...................................................................... 23 Table 7: Numbers of fishers by stratum (statistical division, SD). ............................................................. 24 Table 8: Estimated annual catch (total, harvested and released numbers) and release rates (%) of
marine finfish species, by SA residents aged 5 years or older in 2013/14, with key species in bold. ............................................................................................................................................. 25
Table 9: Estimated annual catch (total, harvested and released numbers) and release rates (%) of marine shellfish, crustacean and cephalopod species, by SA residents aged 5 years or older in 2013/14, with key species in bold. .............................................................................................. 27
Table 10: Estimated annual catch (total, harvested and released numbers) and release rates (%) of freshwater species, by SA residents aged 5 years or older in 2013/14. ..................................... 28
Table 11: Proportion of regulated recreational catch released by SA residents aged 5 years or older in 2013/14. ...................................................................................................................................... 29
Table 12: Estimated annual harvest (numbers), average weight (kg), estimated harvest weight (kg, live weight) and % of total harvest for key and other regulated species taken by SA recreational fishers in SA aged 5 years or older in 2013/14, compared with the commercial harvest for 2013/14. ...................................................................................................................................... 30
Table 13: Response profiles of households participating in the screening and diary surveys in 2007/08 and 2013/14, based on the net sample (total gross sample less sample loss). ......................... 45
Table 14: Fishing participation in the 12 months prior to October 2007 and November 2013 by strata (statistical division, SD) for persons aged 5 years or older; A: Number of persons and B: Proportion (%) of the resident population. .................................................................................. 46
List of Figures
Figure 1: Diagrammatic representation of the 2013/14 SA recreational fishing survey. .............................. 8 Figure 2: Map of South Australia showing survey strata – statistical divisions. ......................................... 11 Figure 3: Map of South Australia showing the locations of 35 regions used for reporting fishing activities
— coastal and inland fishing regions. ......................................................................................... 12 Figure 4: Fishing participation in the 12 months prior to November 2013 by statistical division by SA
residents aged 5 years or older: A) number of fishers; and B) proportion (%) of the resident population. ................................................................................................................................... 18
Figure 5: Fishing participation in the 12 months prior to November 2013 by age group and gender by SA residents aged 5 years or older: A) number of fishers; and B) proportion (%) of the resident population. ................................................................................................................................... 19
Figure 6: Frequency distribution (%) of number of days fished during the survey period by 237,702 recreational fishers (SA residents). ............................................................................................. 20
Figure 7: Relationship between the number of fishers and their cumulative fishing effort (% of days fished) for SA residents aged 5 years or older in SA during the survey period. Dotted lines indicate that 80% of the total number of fishers accounted for approximately 44% of the total effort. ........... 21
Figure 8: Percentage of fishing effort (fisher days) undertaken by SA residents during the period of the survey in 2013/14 according to the major fishing regions of the state. ....................................... 22
Figure 9: Percentage of fisher days and fishers by stratum (statistical division) in the 2013/14 diary survey period. ......................................................................................................................................... 23
Figure 10: Percentage of fishing effort (fisher days) expended by SA residents during the period of the survey in 2013/14 by fishing platform. ........................................................................................ 24
Figure 11: Regional proportional (%) catches of King George Whiting in SA by recreational fishers, aged 5 years or older in 2013/14; A: total numbers; B: harvested numbers; C: released numbers and D: proportion (%) of catch harvested or released by boat or shore-based fishers. ......................... 34
SA recreational fishing survey 2013/14 v
Figure 12: Regional proportional (%) catches of Snapper in SA by recreational fishers, aged 5 years or
older in 2013/14; A: total numbers; B: harvested numbers; C: released numbers and D: proportion (%) of catch harvested or released by boat or shore-based fishers. ......................... 35
Figure 13: Regional proportional (%) catches of Southern Garfish in SA by recreational fishers, aged 5 years or older in 2013/14; A: total numbers; B: harvested numbers; C: released numbers and D: proportion (%) of catch harvested or released by boat or shore-based fishers. ......................... 36
Figure 14: Regional proportional (%) catches of Southern Calamari in SA by recreational fishers, aged 5 years or older in 2013/14; A: total numbers; B: harvested numbers and C: proportion (%) of catch harvested or released by boat or shore-based fishers. ..................................................... 37
Figure 15: Regional proportional (%) catches of Blue Swimmer Crab in SA by recreational fishers, aged 5 years or older in 2013/14; A: total numbers; B: harvested numbers; C: released numbers and D: proportion (%) of catch harvested or released by boat or shore-based fishers. ......................... 38
Figure 16: Proportional (%) catches (total numbers) of Blue Swimmer Crabs in SA by recreational fishers, aged 5 years or older in 2013/14 by method of capture. ............................................................ 39
Figure 17: Regional proportional (%) catches of Southern Rock Lobster in SA by recreational fishers, aged 5 years or older in 2013/14; A: total numbers; B: harvested numbers; C: released numbers and D: proportion (%) of catch harvested or released by boat or shore-based fishers. ......................... 40
Figure 18: Proportional (%) catches (total numbers) of Southern Rock Lobster in SA by recreational fishers, aged 5 years or older in 2013/14 by method of capture. ............................................................ 41
Figure 19: Regional proportional (%) catches of Mulloway in SA by recreational fishers, aged 5 years or older in 2013/14; A: total numbers; B: harvested numbers; C: released numbers and D: proportion (%) of catch harvested or released by boat or shore-based fishers. ................................................. 42
Figure 20: Regional proportional (%) catches of Australian Salmon in SA by recreational fishers, aged 5 years or older in 2013/14; A: total numbers; B: harvested numbers; C: released numbers and D: proportion (%) of catch harvested or released by boat or shore-based fishers. ......................... 43
Figure 21: Fishing participation (number of fishers) in the 12 months prior to October 2007 or November 2013 by strata (statistical division, SD) for persons aged 5 or older........................................... 47
Figure 22: Fishing participation by male fishers in the 12 months prior to October 2007 and November 2013 by strata (statistical division, SD) for persons aged 5 years or older; A: Number of persons and B: Proportion (%) of the resident population. .............................................................................. 48
Figure 23: Fishing participation by female fishers in the 12 months prior to October 2007 and November 2013 by strata (statistical division, SD) for persons aged 5 years or older; A: Number of persons and B: Proportion (%) of the resident population. ....................................................................... 49
Figure 24: Differences in A: total catch numbers and B: harvested catch numbers of key species between 2013/14 and 2007/08 for South Australian residents aged 5 years or older (Negative figures indicate decreases in catches from 2007/08 to 2013/14). .......................................................... 51
Figure 25: Differences in A: total catch weight (tonnage) and B: harvested catch weight (tonnage) of key species between 2013/14 and 2007/08 for South Australian residents aged 5 years or older (Negative figures indicate decreases in catches from 2007/08 to 2013/14). .............................. 52
SA recreational fishing survey 2013/14 vi

SA recreational fishing survey 2013/14 vii
Executive Summary
This study represents the third state-wide assessment of recreational fishing in South Australia (SA). Conducted in 2013/14, it provides statistically robust estimates of:
a) the state-wide and regional participation levels and demographics of SA private-dwelling residents who recreationally fished in SA
b) recreational fishing effort and catches (harvested and released), by species.
Similar surveys using the same methods were carried out in 2000/01 and 2007/08 which has allowed the results from this report to be compared with the results from these surveys.
The 2013/14 survey consisted of three parts:
a) a telephone interview screening survey of 9,297 randomly chosen households, to ascertain participation and demographics of recreational fishers in the 12 months prior to November 2013. From this survey 2,782 households completed the full screening interview, and were thus classified as in-scope ‘South Australian fishing households’. From this sample, 663 fishing households agreed to participate in the survey and two weeks later, at the diary explanation stage, 610 households were recruited to the 12-month diary survey. As part of the survey, household catches (numbers of harvested and released fish) and fishing effort were monitored over the period between December 2013 and November 2014. Households reported their fishing activity using either an online diary or computer assisted telephone interviewing (CATI).
b) supplementary on-site surveys provided information on harvested lengths of key species, for later expansion to total harvest weights.
c) two short surveys were carried out at the completion of the 12-month survey. The first to measure the additional fishing effort from originally non-intending fishers, and the second to determine the attitudes and motivation of the previously surveyed fishing households.
All survey results were expanded to the Australian Bureau of Statistics (ABS) June 2013 estimated resident population benchmarks. Estimates of all parameters with associated levels of precision were generated using a Fisheries Research and Development Corporation (FRDC) funded statistical analysis package recsurvey (Lyle et al 2010) and the survey statistical analysis package by Lumely (2004).
Key Findings Resident Participation and Demographics • In the 12 months prior to November 2013, an estimated 277,027 SA residents, aged 5 years or older, fished at least
once, representing a participation rate of 18.3% of the SA population. Recreational fishing was more popular among males (27%) than females (9.6%). This represents an increase from the last survey in 2007/08 where the estimated number of fishing residents was 236,463, which at that time represented a participation rate of 16.2% of the SA population.
• By region, the highest participation rate (34.3%) was found in the generally rural Eyre statistical division (SD), where most of the population lives near the coast. The Eyre SD also had the highest participation rate in the 2007/08 survey (40.5%). The lowest participation rate by region was the Adelaide SD (16.1%); similarly, this most urban SD also had the lowest participation rate in the previous survey (13.6%).
• By age, highest participation rates (36.6% males; 26.2% females) occurred within the youngest age group surveyed (5–14 years), with both male and female participation rates in this age group showing an increase from 2007/08 (29.5% males; 14.8% females). Female participation in this age group almost doubled.
• The lowest participation rates (19.3% males; 4.4% females) again belonged to the oldest age group (60 years or more), and similarly both male and female participation rates in this age group have increased since 2007/08 (14.9% males; 2.6% females).
• For males, the greatest number of recreational fishers occurred in the age group of 45–59 years, whereas for females, the greatest number of recreational fishers came from the youngest age group of 5–14 years.
SA recreational fishing survey 2013/14 1
Fishing Effort • SA residents spent an estimated 0.97 million fisher days of effort in SA over the period 1 December 2013 to 30
November 2014 (compared with 1.05 million fisher days in 2007/08).
• Line fishing (with bait or lures) was the predominant method used (84.3% of total fisher days), followed by rock lobster pots/crab nets (9.4%), dab netting (1.8%) and the remaining 4.5% included other methods such as hand collecting, diving and gill/drag netting.
• Most (87%) fishing effort occurred in marine waters, including estuaries, inshore and offshore waters where as freshwater only accounted for 13% of fishing effort. Regionally, Spencer Gulf had the highest fishing effort (37%) followed by Gulf St Vincent and Kangaroo Island (KI) waters (28%), the West Coast (16%) and the South East coast (6%). Most freshwater fishing was in the River Murray.
• Overall, boat-based fishing effort (60.5%) was higher than the shore-based (39.5%) fishing effort.
• The survey indicated that 20% of South Australian recreational fishers accounted for 56% of the total effort in 2013/14. This highlights the potential for a relatively small proportion of the recreational fisher population to have a substantial impact and suggests that minor changes within this part of the fishery could have significant implications for total recreational effort (and catch).
Catch (Total, Harvested and Released Numbers) • A total of 89 individual species or species groups were reported by recreational fishers as being caught during 2013/14
(98 species in 2007/08), translating to 6.9 million marine finfish, 4.9 million marine shellfish (crustaceans, molluscs) and almost 840,000 freshwater fish/yabbies. In 2007/08, there were 6.5 million marine finfish, 3.3 million marine shellfish (crustaceans, molluscs) and almost 400,000 freshwater fish/yabbies.
• The release rates varied considerably with the different species, ranging from very high rates (> 70%) for Mulloway, Black Bream and Silver Perch, to very low rates (< 5%) for Southern Calamari.
Comparison between the 2000/01, 2007/08 and 2013/14 Surveys • Participation and demographics
The estimated number of SA resident recreational fishers has increased slightly to 277,027 in 2013/14 (18.3% participation rate) from 236,463 (16.2%) in 2007/08, but is still substantially lower than the 2000/01 participation rate of 317,223 people (23.3%). Participation in the youngest age group (5–14 years) has increased, particularly for females, whereas the participation rates for males and females remained relatively stable amongst the older age groups.
• Fishing effort
The estimated number of fisher days has decreased by 8.4% from 1.05 million in 2007/08 to 0.97 million in 2013/14. Boat-based effort increased by about 7.5% and the shore-based effort decreased substantially by 27.5% from the 2007/08 survey.
Catches of Key Species • Australian Salmon
Total numbers caught decreased by 53.6% to 220,332 fish in 2013/14 from 474,717 fish in 2007/08. The release rate decreased to 32.7% in 2013/14 from 36.1% in 2007/08. The estimated recreational harvest (148,361 fish or 56.23 tonnes) was 48% of the total harvest weight.
• Blue Swimmer Crab
Total numbers caught increased by 31% to 2.46 million crabs in 2013/14 from 1.88 million crabs in 2007/08. The release rate increased slightly to 42% in 2013/14 from 39% in 2007/08. The estimated recreational harvest (1.42 million crabs or 375.8 tonnes) was 39.5% of the total harvest weight.
This report additionally provides catch and effort estimates from data collected from an on-site survey of recreational fishers in northern Gulf St Vincent (from northern metro Adelaide to Port Vincent) during daylight hours over the survey period from 1 January 2014 to 31 December 2014 (Giri and Hall 2015). These data are scaled up to provide a total recreational catch estimate for this period for Blue Swimmer Crab in northern Gulf St Vincent. The estimated number of Blue Swimmer Crabs caught was 430,000 of which 245,000 were harvested and 185,000 were released with a release rate of 43%. The estimated weight of the harvested Blue Swimmer Crabs was 65 tonnes during the 2014 on-site survey period.
These estimates can be compared to the regional catch estimates for northern Gulf St Vincent (fishing regions 16, 17 and 18) from the 2013/14 survey (although the 2013/14 survey was one month temporally shifted, it also spanned a 12
SA recreational fishing survey 2013/14 2
month period). The estimates are very similar; the total number of Blue Swimmer Crabs caught in this region was 507,000 with 255,000 harvested and 252,000 released with a release rate of 49%. The estimated total weight of Blue Swimmer Crabs harvested in this region was 67 tonnes.
• King George Whiting
Total numbers caught increased by 11.4% to 2.0 million fish in 2013/14 from 1.8 million fish in 2007/08. Release rates decreased slightly to 26.7% in 2013/14 from just above 30% in 2007/08. The estimated recreational harvest (1.46 million fish or 367 tonnes) was more than half (58.1%) of the total harvest weight.
• Mulloway
Total numbers caught decreased by 30.6% to 47,238 fish in 2013/14 from 68,038 fish in 2007/08. The release rate decreased to 79.1% in 2013/14 from 85.1% in 2007/08. The recreational harvest (9,883 fish or 59.5 tonnes) was 46.3% of the total harvest weight.
• Snapper
Total numbers caught increased by 14% to 437,329 fish in 2013/14 from 384,077 fish in 2007/08. The release rate decreased to 52.5% from 74.7% in 2007/08. The estimated recreational harvest (207,809 fish or 332 tonnes) comprised 37.6% of the total harvest weight.
• Southern Calamari
Total numbers caught decreased by 2.6% to 480,016 in 2013/14 from 492,736 in 2007/08. The release rate decreased slightly to 1.3% from 1.7%. The estimated recreational harvest (473,803 or 154.93 tonnes) comprised 30.2% of the total harvest weight.
• Southern Garfish
Total numbers caught decreased by 2.1% to 980,566 fish in 2013/14 from 1.0 million fish in 2007/08. The release rate decreased to 11.3% from 19% in 2007/08. The estimated recreational harvest (870,147 fish or 79.2 tonnes) comprised 23.3% of the total harvest weight.
• Southern Rock Lobster
Total numbers caught decreased by 3.3% to102,931 lobsters in 2013/14 from 106,483 lobsters in 2007/08. The release rate decreased to 39.4% in 2013/14 from 55% in 2007/08. The recreational harvest (62,346 lobsters or 74.9 tonnes) was 4.5% of the total harvest weight.
• Pipi (Goolwa Cockle)
The numbers of recreational fishers fishing for Pipi was low in all survey years, and so determining catch trends for this species is not possible from these surveys alone. In 2013/14 the estimate of the total catch was 1,076,368 Pipi with a recreational harvest of 378,158 Pipi or 3.78 tonnes (306,000 Pipi or 5 tonnes in 2007/08). The recreational harvest was 0.9% of the total harvest weight (0.8% in 2007/08).
To supplement the catch and effort data from the diary survey, data were collected from an on-site survey of recreational Pipi fishers in the Goolwa region during daylight hours over the fishery open season from December 2013 to May 2014. These data are scaled up to provide a total recreational catch estimate for the 2013/14 fishing season. The estimated number of Pipi caught during the 2013/14 fishing season was 3.24 million (± 1.09 standard error, SE) and the estimated weight of the recreational Pipi harvest was 33 tonnes (± 11 SE).
Potential reasons for between-survey differences in levels of participation, catch and effort may include a number of social and demographic factors determining the motivations of recreational fishers, and/or changes in availability of fish. Most of the increase in participation occurred with younger recreational fishers, whereas the number of older fishers was quite stable.
SA recreational fishing survey 2013/14 3
Introduction
Background Recreational fishers collectively harvest significant proportions of the total catch for a number of key species caught in SA (Fowler et al 2012, 2014).
The need for statistically robust estimates of their catches is crucial in managing resource shares between sectors, as well as assessing the biological sustainability for each fishery and managing the state’s aquatic resources under the Fisheries Management Act 2007. Meeting the objectives of the Fisheries Management Act 2007 also includes deciding how to best share the available aquatic resources amongst users for the benefit of the community. Fishery management plans allocate aquatic resources consistent with an Allocation Policy which determines the process for both the initial setting of shares and the process for adjusting those shares. These recreational catch estimates, along with the commercial fishery data will be used in accordance with the processes set out in the fishery management plans.
The methods developed for surveying recreational fishers differ significantly from those used for commercial fishers who report on their fishing activities by way of compulsory logbooks. This latter method would clearly be cost-prohibitive to undertake for every recreational fisher in the state. During the late 1990s, a telephone-diary survey method was developed in Australia to estimate total non-commercial catch and effort for national, state-wide or large regional areas (Lyle et al 2002) and was implemented in a national survey during 2000/01, called the National Recreational and Indigenous Fishing Survey (NRIFS 2000/01; Henry and Lyle 2003). The recreational fishing component of the national survey is referred to as the NRFS and detailed additional results for SA were reported in Jones and Doonan (2005).
The same method was used in 2007/08 and has been used here for the SA 2013/14 recreational fishing survey. These surveys are designed to provide annual estimates of the participation rates of recreational SA resident fishers, their fishing effort and the harvested and released numbers of key species for use in stock assessment and management plans. This report focuses on these estimates and their precision. Additional information was collected on other fishing activities during the survey period, including fishers’ attitudes to fishing related issues and their awareness of recreational fishing regulations.
Objectives The primary objectives of the survey were:
1. To determine the participation rate in recreational fishing throughout SA by SA residents and to profile the demographic characteristics of these recreational fishers.
2. To quantify the catch and effort of the South Australian recreational fishing sector, with special reference to key species, namely:
• King George Whiting (Sillaginodes punctatus)
• Snapper (Chrysophrys auratus)
• Southern Garfish (Hyporhamphus melanochir)
• Southern Calamari (Sepioteuthis australis)
• Blue Swimmer Crab (Portunus armatus)
• Southern Rock Lobster (Jasus edwardsii)
• Mulloway (Argyrosomus japonicus)
• Australian Salmon (Arripis truttaceus)
• Pipi (Plebidonax deltoids)
3. To collect information on attitudes and awareness of recreational fishers in terms of various fisheries-related issues.
SA recreational fishing survey 2013/14 4
Report Structure This report is partitioned into sections. The introduction outlines the background for the reasons and objectives of the survey, and the structure of the report. The survey methods and analysis section provides comprehensive information on the survey methods employed, how the databases were managed and data analysis.
The results section provides detailed information on the sample and response profiles for each component of the survey. Other results sections (fisher profiles, fishing effort and catch) provide state-wide and regional estimates on participation, fishing effort and catches for all species, expanded to reflect all SA private-dwelling household residents, aged 5 years or older, who recreationally fished in SA. In the results section for key species, the expanded catch (total, harvested and released numbers and harvested weights) for the nine key species are detailed on a regional and platform basis.
Finally, the discussion compares estimates from the three surveys, discusses potential reasons for the variations, and provides advice on the direction for future surveys of this nature, especially for the key and other regulated species caught by recreational fishers in this state.
SA recreational fishing survey 2013/14 5
Survey Methods and Analysis
The primary data collection was based on an online/telephone-diary approach, an off-site method developed to provide cost-effective data over large spatial scales, such as for an entire state. A detailed description of the telephone-diary design philosophy and method is provided in Lyle et al (2002) and Henry and Lyle (2003). Detailed interviewing procedures, definitions and materials for the screening and diary surveys are contained in two interviewer manuals (West and Jones, 2007a, b). The 2013/14 survey design was based on these methods. Data analysis procedures are similar to those described in detail by Lyle et al (2010) and have been undertaken using the statistical computing language R (R Development Core Team 2009), using the R statistical analysis packages survey (Lumley 2004, 2014) and recsurvey (Lyle et al 2010). An overview of the survey methodology and data analysis is provided in this section.
Survey Scope The survey encompassed the private-dwelling resident population of SA aged five years and older, and their recreational fishing activity. In this context, recreational fishing was defined broadly as the capture or attempted capture of aquatic animals in SA waters (freshwater, estuarine and marine) other than for commercial purposes. In addition to line fishing, all other recreational fishing techniques and harvesting activities were included, namely the use of lobster pots, crab and fish nets, spears, diving and hand collection.
Fishing activities by non-residents in SA and by SA residents in other states of Australia were not included.
Survey Methods Survey Overview The online telephone-diary method involved a multi-phase survey design, the principal components being an initial screening phase to gather profiling information from a sample of the population and a subsequent, intensive phase, in which ‘intending fisher’ respondents provided detailed catch and effort information over a 12-month period. In this second phase, respondents were encouraged to use a simple diary to record key fishing data and to self-enter this data online, and were contacted regularly by survey interviewers, who were responsible for collecting the information. The underlying design philosophy is focussed on minimising respondent burden and maximising response and data quality.
Additional survey components included a non-intending fisher follow-up survey and an attitudinal/’wash-up’ survey among diarists. The non-intending fisher follow-up survey involved a sample of households that had indicated at screening they were unlikely to do any recreational fishing during the diary period. This component was designed to identify and account for ‘unexpected fishing’ that may have occurred during the diary period. At the end of the diary period, a 'wash up' survey collected information on motivation, awareness and attitude of diary participants to various fishing-related matters. All the above survey components were conducted by specialist telephone interviewers of The Social Research Centre.
The screening survey was conducted during October and November 2013. The diary survey then monitored the fishing activity of selected fishers from 1 December 2013 through to 30 November 2014. The attitudinal/’wash-up’ survey was conducted during December 2014 and the non-intending fisher survey was conducted during February/March 2015.
Limited on-site (creel) surveys were also conducted during the diary survey period, primarily to determine the recreational catch and effort of Blue Swimmer Crab in northern Gulf St Vincent (Giri and Hall 2015) and of Pipi at Goolwa (Hall et al 2015). These surveys were used to obtain size distribution information for Blue Swimmer Crab, Pipi and other recreationally harvested species. However, most of the size distribution data for finfish was derived from surveys which covered most of the boat ramps along the SA coastline from Ceduna to Beachport. These surveys were conducted from 1 January to 2 August 2014 coinciding with the diary survey period.
All survey components were conducted on a voluntary basis and in accordance with relevant state and national privacy legislation. All information collected through the study has been treated as strictly confidential and will be used for statistical purposes only. The relationships of all survey components are depicted in Figure 1.
SA recreational fishing survey 2013/14 6
Sampling Design The SA 2013/14 recreational fishing survey was based on single-stage cluster sampling (Thompson 1992) where the household represented the primary sampling unit and recreational fishers within the household represented the secondary sampling unit, with all fishers in the household included in the sample. Cluster sampling is often a cost effective way of sampling and this sampling is recommended where there is no frame listing of all elements, or where a frame listing is prohibitively expensive to obtain (Schaeffer et al 1996 in Pitcher and Hollingworth 2008). The major advantages of cluster sampling over simple random sampling are the provision of correct weightings to both single and multiple fisher-households and a cost benefit in providing multiple fisher data through a single contact (Henry and Lyle 2003).
Screening Survey The primary role of the screening survey was to assess fishing participation and profiling information for all household members, as well as establishing eligibility to participate in the subsequent diary survey phase. Profiling information is important not only to characterise the sample population but also to examine issues relating to representation and response.
The screening interview involved a structured questionnaire conducted by telephone with a random sample of South Australian households. Households were selected based on dual frame sampling of landline and mobile phones. For landlines, an ‘exchange-based’ approach to the generation of a random digit dialling (RDD) landline sample was utilised (SamplePages) whereas a list-based approach to mobile sampling was chosen and the mobile sample frame was sourced from a list-based supplier (Global Data).
The decision to use a dual frame design, and to incorporate a greater mobile sample into the frame, was driven mainly by a desire to address the increasing under-coverage of traditional landline RDD sample frames, particularly for young persons.
The building blocks for the ‘exchange-based’ list product are the Australian Communication and Media Authority (ACMA) exchange blocks (not a directory listing) with all possible numbers within an exchange block generated and tested (i.e. confirmed as working or non-working phone numbers). In addition to this, exchange-based RDD numbers are generated and tested at the time of each request rather than being drawn from a pre-existing pool.
The advantages of this exchange-based approach to RDD sample generation, relative to alternative list-based frames, include:
• improved coverage in areas where new exchanges have been activated
• improved coverage in growth corridors, peri-urban areas and CBD developments
• higher landline connection rates and therefore greater fieldwork efficiency.
For each selected telephone number the suburb was also noted enabling the selection to be assigned to a local government area (LGA) and statistical division (SD). Stratified random sampling was undertaken and within each SD, the proportional breakdown of the sample at the LGA level was aligned to the known proportion of households based on ABS data. In each sampling frame, each telephone number had equal probability of selection within a stratum. In order to minimise non-contacts, an unlimited call regime protocol was used, whereby calls were made to each live telephone number up to the point where establishing contact or obtaining an interview seemed highly unlikely. Disconnected numbers, business and non-private-dwelling numbers, screened out numbers (i.e. non South Australian households or households with no-one over 18), non-contact (i.e. no answer, incoming call restrictions) and facsimile numbers were treated as sample loss and not replaced.
The screening survey was conducted during October and November 2013; with the aim of achieving pre-determined targets of households for participation in the diary survey (approximately 70 households accepting the diary at screening in all SDs apart from Adelaide where this number is approximately doubled — see further reference to this in the Results — Sample and Response Profiles; Screening Survey).
SA recreational fishing survey 2013/14 7
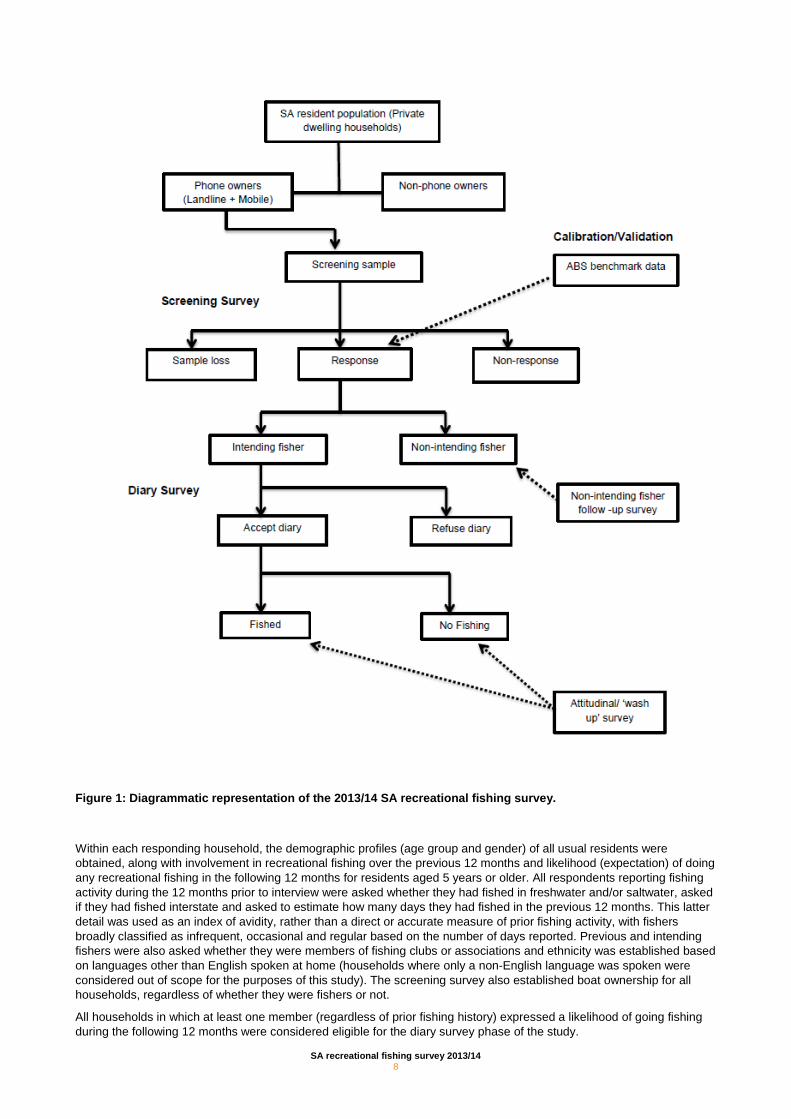
Figure 1: Diagrammatic representation of the 2013/14 SA recreational fishing survey.
Within each responding household, the demographic profiles (age group and gender) of all usual residents were obtained, along with involvement in recreational fishing over the previous 12 months and likelihood (expectation) of doing any recreational fishing in the following 12 months for residents aged 5 years or older. All respondents reporting fishing activity during the 12 months prior to interview were asked whether they had fished in freshwater and/or saltwater, asked if they had fished interstate and asked to estimate how many days they had fished in the previous 12 months. This latter detail was used as an index of avidity, rather than a direct or accurate measure of prior fishing activity, with fishers broadly classified as infrequent, occasional and regular based on the number of days reported. Previous and intending fishers were also asked whether they were members of fishing clubs or associations and ethnicity was established based on languages other than English spoken at home (households where only a non-English language was spoken were considered out of scope for the purposes of this study). The screening survey also established boat ownership for all households, regardless of whether they were fishers or not.
All households in which at least one member (regardless of prior fishing history) expressed a likelihood of going fishing during the following 12 months were considered eligible for the diary survey phase of the study.
SA recreational fishing survey 2013/14 8
Telephone Diary Survey All households identified as eligible for the diary survey were invited to participate in the telephone diary phase of the study.
A diary pack was prepared by the Social Research Centre and posted by the Department of Primary Industries and Regions South Australia (PIRSA) to all households prior to the diary explanation stage. The diary pack contained: an approach letter from PIRSA (Appendix A.1), a diary card, calendar, fishing zone map (Figure 3) and a catch-limits brochure (PIRSA 2013). The approach letter introduced the survey, and provided the user name and password details for the household’s online diary. The online diary questionnaire was designed in such a way that it was user friendly and free of any ambiguities.
The approach taken in this survey differs from conventional angler diary surveys in two important ways. Firstly, the diary is employed more as a ‘memory jogger’ than a logbook, with diarists receiving email prompts and telephone calls to enter data online. Secondly, diarists using online data entry were therefore partially responsible for data collection, supported by survey interviewers.
As part of the data collection procedures, arrangements were put in place to send (additional) packs to clients who either failed to receive the original pack or who requested a second copy of the pack.
After receiving the diary kit, data requirements were explained to respondents in a brief interview and the next contact arranged.
Fishing activity of all household members aged 5 years and older was monitored between December 2013 and November 2014 inclusive.
Respondents were encouraged to record basic information in their diaries, such as date, location, start and finish times, and catch and release numbers. It is intended that the diary acts as a memory prompt for subsequent data entry either using online or telephone interview options, at which point more detailed data, such as target species, fishing method, fishing platform (boat or shore-based), water body type (river, lake, estuary, inshore, offshore, etc.), and reasons for release, for each individual fishing event were collected and recorded. For some anglers, all information was collected during telephone interviews.
Non-intending Fisher Survey The objective of the non-intending fisher survey component is to account for those persons who may have unexpectedly ‘dropped-in’ to the fishery, providing symmetry for those persons who unexpectedly ‘dropped-out’ of the fishery, the latter group identified as diarists who, despite indicating an expectation to fish in the diary period, did not actually do so.
A random sample of households, which at screening had indicated no intention to fish during the survey period (i.e. were not eligible for the diary survey), was re-contacted shortly after the diary period in early 2015. Whether any fishing had occurred during the diary period was established in a brief interview, with particular care to identify whether a change had occurred in the household (e.g. telephone number reallocated) and that individual household members were the same as those at screening. Further details were collected from those households in which fishing was reported, including demographic profile (age group and gender), whether individual members had fished in SA and/or interstate, in salt and/or freshwater, estimated number of days fished during the 12 months of the diary period and whether key species were caught and kept.
Respondents who were identified as not being residents of the household at the time of screening were excluded from the analysis.
Attitudinal/’Wash-up’ Survey An attitudinal/’wash up’ survey was conducted with all diarists at the end of the diary period in December 2014. This survey was designed to assess a range of information, including their fishing motivations, opinions regarding various fishing related issues and their awareness of fishing regulations. All such information was obtained from the main/key fisher in the household, aged 15 years or older. The survey also confirmed with respondents the completeness of data for each household member, whether they had reported fishing or not.
SA recreational fishing survey 2013/14 9
On-site Surveys On-site surveys were conducted with the aim of providing statistically robust estimates of the total recreational catch and effort for Pipi and Blue Swimmer Crab. The Pipi creel survey was conducted from 1 November 2013 to 2 May 2014 in daylight hours from Goolwa Beach and adjacent beaches at Middleton and the Sir Richard Peninsula. The Blue Swimmer Crab survey was conducted from 1 January 2014 to 31 December 2014 in Gulf St Vincent. During the diary period, creel surveys were also conducted from 1 January to 2 August 2014 which covered most of the major boat ramps along the coastline from Ceduna to Beachport.
From these surveys, size frequency information was collected for key species and this information along with published length-weight relationships was used to convert the harvest estimates (numbers) to harvest weights, enabling comparison to commercial catch statistics on a total weight basis.
Data Management Online/Telephone Survey Components The Microsoft Access relational database from the 2007/08 survey was provided to the Social Research Centre, and was used as a template for the design of the survey database to ensure comparability between surveys.
All data collection, entry and management of the database was undertaken by database managers at the Social Research Centre. All data entry was undertaken progressively and any errors, omissions or ambiguities in the data were referred to interviewing staff who in turn, re-contacted respondents where necessary. Data was further scrutinised and edited to ensure its integrity. At the completion of the study, the edited database in various modules was provided to Fisheries Victoria for data analysis.
On-site Surveys All data from the marine on-site surveys were entered, data checked and edited by Fisheries Victoria staff. Incomplete or ambiguous forms were referred back to the interviewers. On completion of the survey, analyses were undertaken including calculation of average lengths.
Data Analysis Data analysis for the population survey components was based on single stage cluster sampling, with the household representing the primary sampling unit (PSU) and residents within the household, the secondary sampling unit (SSU). In determining household and individual expansion factors, an integrated procedure was applied to non-response adjustment and calibration against population benchmarks, taking account of household size and demographics. Calibration relied on ABS data for SA as at June 2013 — estimated resident population (ERP) and private-dwelling household (number of households). The ABS data were used to assess sample representation and provide correct weightings for expanded population estimates. Person-based benchmarks by age group and gender, and household-based benchmarks by household size were developed for each of the survey stratum and were then compared with screening survey results. Calibration forces the survey estimates of the person and household-based benchmarks to exactly match the known population totals, thus reducing bias in the known quantities as well as in the other key survey estimates.
Integrated weighting was applied to adjust for sample representation at household and person levels by calculating weighting factors to expand sample data to population estimates. Integrated weighting considers household (size and composition) and person (age and gender) based characteristics simultaneously and seeks to maximise convergence with benchmarks at all levels, namely stratum, household and person. By using this approach all persons in a particular household and the household itself were given the same weight, and this weight is applied when determining person and household level estimates.
To address the issue of under-coverage of landlines, mobile phone samples were incorporated into the frame, thus resulting in a dual frame sampling design. When a sample frame overlap happens, the households in the overlap are double-covered since they could have been selected from the landline frame or the mobile phone frame, requiring a weighting adjustment for those households.
SA recreational fishing survey 2013/14 10
The most common method of adjusting weights in sample overlaps is to multiply the weights in one sample (landline) by a weighting adjustment factor λ, and multiply the weights in the other sample (mobile phone) by (1-λ). This is often referred to as composite weighting and corrects the double-counting problem (Xia et al 2010). Let 𝑛𝑛𝐿𝐿 be the number of households with a landline in the overlap sample and 𝑛𝑛𝑀𝑀 is the number of households with mobile phones in the overlap sample, then a λ value proportional to the sample size in the landline sample of overlap is:
λ = 𝑛𝑛𝐿𝐿𝑛𝑛𝐿𝐿+𝑛𝑛𝑀𝑀
and composite weight, 𝑊𝑊𝑐𝑐𝑐𝑐𝑐𝑐𝑐𝑐 = �𝑊𝑊 for single frame user households𝑊𝑊 × λ for landline households in overlap 𝑊𝑊 × (1 − λ) for mobile households in overlap
where weight W was calculated using ABS data.
Not all eligible fishers actually fished during the diary period and these in effect represented unexpected ‘drop-outs’ from the fishery. Some non-intending fishers will fish during the diary period and these are called ‘drop-ins’ to the fishery. In order to take account of ‘drop-ins’ a final adjustment was necessary based on the non-intending fisher follow-up survey. Thus the final estimates were adjusted for ‘drop-ins’ and ‘drop-outs’ by calibrating the design to the participation levels estimated from the call-back data. Unless otherwise indicated, parameter estimates provided in this report are based on expanded data, scaled-up to represent the population rather than the sample from which they were derived.
As a consequence of surveying a sample rather than the entire population of fishers, all parameters estimated have some associated statistical uncertainty, i.e. the estimates may differ from those that would have been produced had the entire population been included in the survey. This uncertainty is often expressed in terms of standard error (SE) or relative standard error and in this report uncertainty is reported in terms of SE.
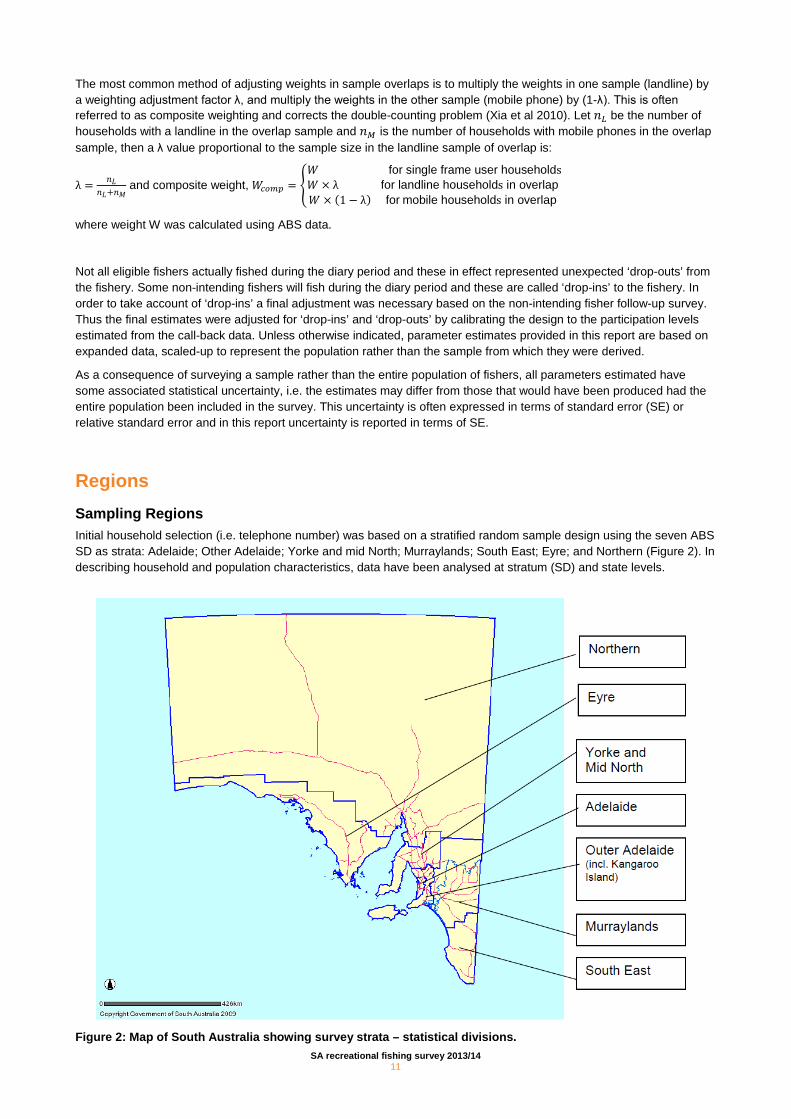
Regions Sampling Regions Initial household selection (i.e. telephone number) was based on a stratified random sample design using the seven ABS SD as strata: Adelaide; Other Adelaide; Yorke and mid North; Murraylands; South East; Eyre; and Northern (Figure 2). In describing household and population characteristics, data have been analysed at stratum (SD) and state levels.
Figure 2: Map of South Australia showing survey strata – statistical divisions.
SA recreational fishing survey 2013/14 11
NB: The Australian Bureau of Statistics has changed the reporting of population parameters to the Australian Statistical Geography Standard (ASGS) statistical areas. Sampling regions of any future surveys will be based on statistical areas rather than statistical divisions.
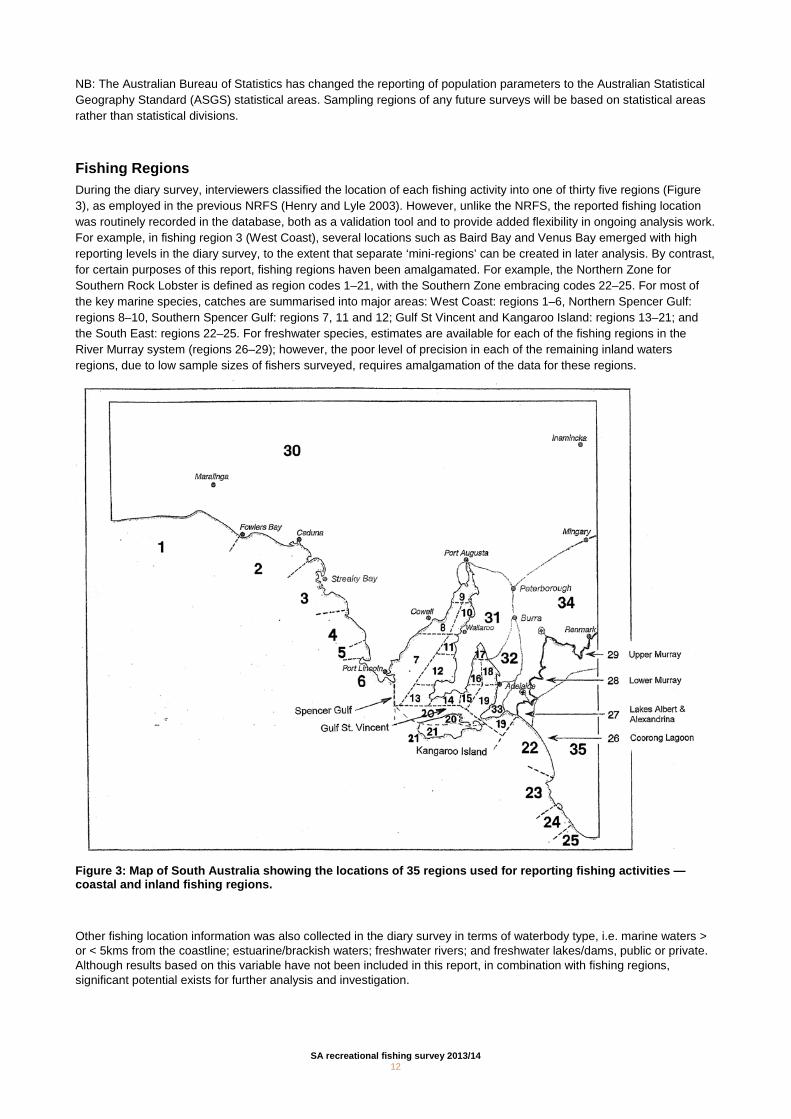
Fishing Regions During the diary survey, interviewers classified the location of each fishing activity into one of thirty five regions (Figure 3), as employed in the previous NRFS (Henry and Lyle 2003). However, unlike the NRFS, the reported fishing location was routinely recorded in the database, both as a validation tool and to provide added flexibility in ongoing analysis work. For example, in fishing region 3 (West Coast), several locations such as Baird Bay and Venus Bay emerged with high reporting levels in the diary survey, to the extent that separate ‘mini-regions’ can be created in later analysis. By contrast, for certain purposes of this report, fishing regions haven been amalgamated. For example, the Northern Zone for Southern Rock Lobster is defined as region codes 1–21, with the Southern Zone embracing codes 22–25. For most of the key marine species, catches are summarised into major areas: West Coast: regions 1–6, Northern Spencer Gulf: regions 8–10, Southern Spencer Gulf: regions 7, 11 and 12; Gulf St Vincent and Kangaroo Island: regions 13–21; and the South East: regions 22–25. For freshwater species, estimates are available for each of the fishing regions in the River Murray system (regions 26–29); however, the poor level of precision in each of the remaining inland waters regions, due to low sample sizes of fishers surveyed, requires amalgamation of the data for these regions.
Figure 3: Map of South Australia showing the locations of 35 regions used for reporting fishing activities — coastal and inland fishing regions.
Other fishing location information was also collected in the diary survey in terms of waterbody type, i.e. marine waters > or < 5kms from the coastline; estuarine/brackish waters; freshwater rivers; and freshwater lakes/dams, public or private. Although results based on this variable have not been included in this report, in combination with fishing regions, significant potential exists for further analysis and investigation.
SA recreational fishing survey 2013/14
12
Fishing Effort Fishing information was collected on an ‘event’ basis, where an event was defined as a discrete fishing episode and the actual household member(s) involved in the event were recorded. Separate fishing events were defined where there was a change in fishing region or waterbody type, target species or fishing method. In this way, a day’s fishing trip could comprise more than one event. For example, where a fisher gathers bait prior to fishing for King George Whiting, both the bait gathering and the subsequent fishing were considered to be separate events, since the effort expended in the capture of bait cannot be attributed to the capture of any King George Whiting and vice versa. Similarly, the use of passive fishing gear, such as lobster pots or crab nets, whilst line fishing was recorded as separate fishing events. The delineation of fishing activity in this manner provided an ability to analyse effort (and catch) on the basis of fishing method and target species/fishery. Furthermore, three measures of effort can be analysed, namely fishing days (i.e. separate days in which some form of fishing was undertaken), fishing events and hours fished.
It should be noted that person-based effort has been calculated for this report. For active fishing methods such as line fishing and dive harvesting this is clearly appropriate, but where shared or joint activities occurred, such as fishing with lobster pots or crab nets, this can over-estimate effort. In such instances, effort was calculated as the number of pots/nets used divided by the number of persons who participated in the fishing activity on any given day, providing an effort measure based on the number of person pot/net days of effort.
Fishing Methods A variety of discrete fishing/harvesting methods were accounted for in the diary survey including: line fishing (bait, lures or both); traditional lobster pots; other passive traps/nets (e.g. hoop nets); dab/scoop nets; other active nets; recreational gillnets; spearfishing (diving); other diving (snorkelling and scuba/surface air); surface spearing; raking; and hand collecting. For this report, the methods have been appropriately amalgamated (e.g. all forms of line fishing). However, the potential remains for separate analysis of the discrete methods.
Catch A species identification guide (including clear colour images) was provided to all diarists to optimise the accuracy of species identification in the survey.
Catches were reported as numbers kept or harvested and numbers released or discarded by individual species or species group. Length information provided by the on-site surveys and length-weight relationships from other studies, were used to convert numeric estimates of harvest to weights.
SA recreational fishing survey 2013/14 13
Results — Sample and Response Profiles
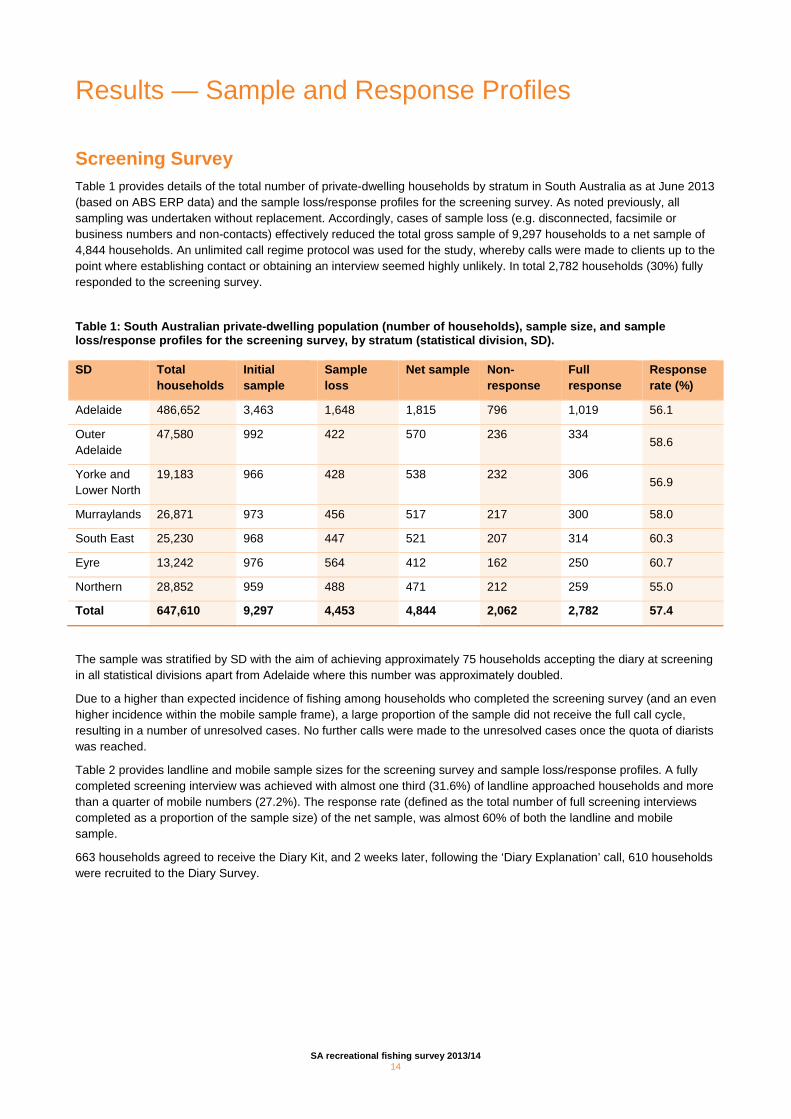
Screening Survey Table 1 provides details of the total number of private-dwelling households by stratum in South Australia as at June 2013 (based on ABS ERP data) and the sample loss/response profiles for the screening survey. As noted previously, all sampling was undertaken without replacement. Accordingly, cases of sample loss (e.g. disconnected, facsimile or business numbers and non-contacts) effectively reduced the total gross sample of 9,297 households to a net sample of 4,844 households. An unlimited call regime protocol was used for the study, whereby calls were made to clients up to the point where establishing contact or obtaining an interview seemed highly unlikely. In total 2,782 households (30%) fully responded to the screening survey.
Table 1: South Australian private-dwelling population (number of households), sample size, and sample loss/response profiles for the screening survey, by stratum (statistical division, SD).
SD Total households
Initial sample
Sample loss
Net sample Non-response
Full response
Response rate (%)
Adelaide 486,652 3,463 1,648 1,815 796 1,019 56.1
Outer Adelaide
47,580 992 422 570 236 334 58.6
Yorke and Lower North
19,183 966 428 538 232 306 56.9
Murraylands 26,871 973 456 517 217 300 58.0
South East 25,230 968 447 521 207 314 60.3
Eyre 13,242 976 564 412 162 250 60.7
Northern 28,852 959 488 471 212 259 55.0
Total 647,610 9,297 4,453 4,844 2,062 2,782 57.4
The sample was stratified by SD with the aim of achieving approximately 75 households accepting the diary at screening in all statistical divisions apart from Adelaide where this number was approximately doubled.
Due to a higher than expected incidence of fishing among households who completed the screening survey (and an even higher incidence within the mobile sample frame), a large proportion of the sample did not receive the full call cycle, resulting in a number of unresolved cases. No further calls were made to the unresolved cases once the quota of diarists was reached.
Table 2 provides landline and mobile sample sizes for the screening survey and sample loss/response profiles. A fully completed screening interview was achieved with almost one third (31.6%) of landline approached households and more than a quarter of mobile numbers (27.2%). The response rate (defined as the total number of full screening interviews completed as a proportion of the sample size) of the net sample, was almost 60% of both the landline and mobile sample.
663 households agreed to receive the Diary Kit, and 2 weeks later, following the ‘Diary Explanation’ call, 610 households were recruited to the Diary Survey.
SA recreational fishing survey 2013/14 14
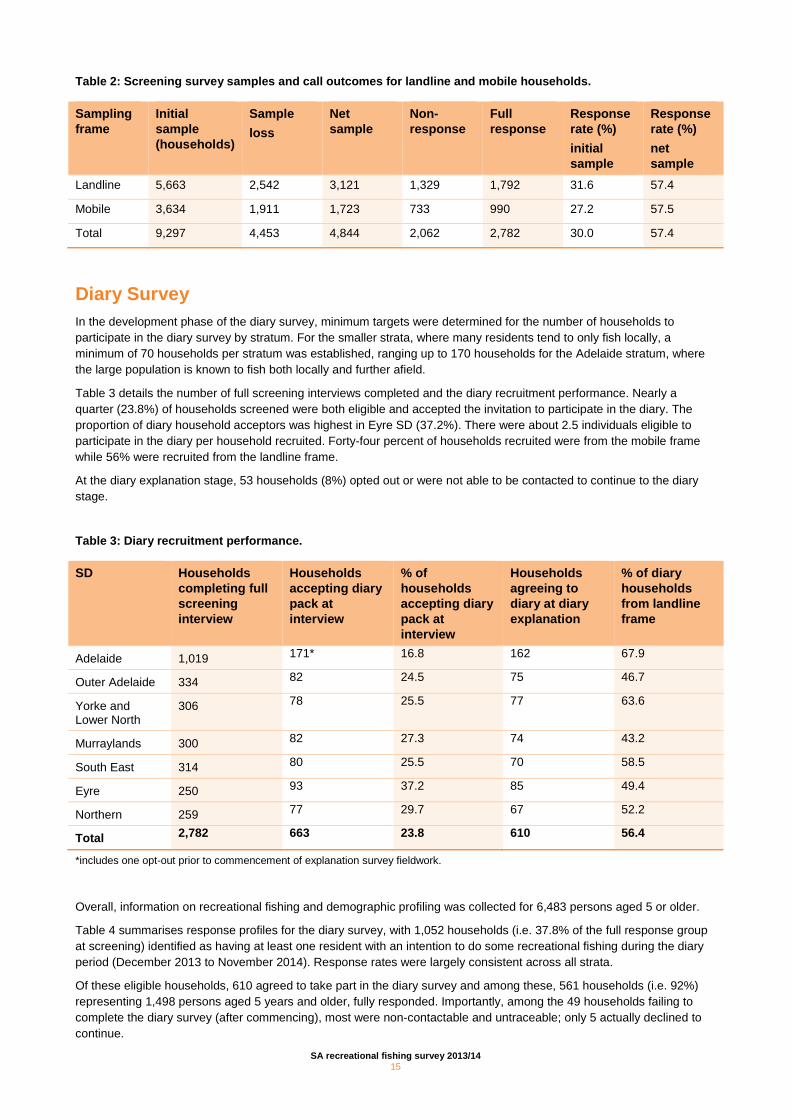
Table 2: Screening survey samples and call outcomes for landline and mobile households.
Sampling frame
Initial sample (households)
Sample loss
Net sample
Non-response
Full response
Response rate (%) initial sample
Response rate (%) net sample
Landline 5,663 2,542 3,121 1,329 1,792 31.6 57.4
Mobile 3,634 1,911 1,723 733 990 27.2 57.5
Total 9,297 4,453 4,844 2,062 2,782 30.0 57.4
Diary Survey In the development phase of the diary survey, minimum targets were determined for the number of households to participate in the diary survey by stratum. For the smaller strata, where many residents tend to only fish locally, a minimum of 70 households per stratum was established, ranging up to 170 households for the Adelaide stratum, where the large population is known to fish both locally and further afield.
Table 3 details the number of full screening interviews completed and the diary recruitment performance. Nearly a quarter (23.8%) of households screened were both eligible and accepted the invitation to participate in the diary. The proportion of diary household acceptors was highest in Eyre SD (37.2%). There were about 2.5 individuals eligible to participate in the diary per household recruited. Forty-four percent of households recruited were from the mobile frame while 56% were recruited from the landline frame.
At the diary explanation stage, 53 households (8%) opted out or were not able to be contacted to continue to the diary stage.
Table 3: Diary recruitment performance.
SD Households completing full screening interview
Households accepting diary pack at interview
% of households accepting diary pack at interview
Households agreeing to diary at diary explanation
% of diary households from landline frame
Adelaide 1,019 171* 16.8 162 67.9
Outer Adelaide 334 82 24.5 75 46.7
Yorke and Lower North
306 78 25.5 77 63.6
Murraylands 300 82 27.3 74 43.2
South East 314 80 25.5 70 58.5
Eyre 250 93 37.2 85 49.4
Northern 259 77 29.7 67 52.2
Total 2,782 663 23.8 610 56.4
*includes one opt-out prior to commencement of explanation survey fieldwork.
Overall, information on recreational fishing and demographic profiling was collected for 6,483 persons aged 5 or older.
Table 4 summarises response profiles for the diary survey, with 1,052 households (i.e. 37.8% of the full response group at screening) identified as having at least one resident with an intention to do some recreational fishing during the diary period (December 2013 to November 2014). Response rates were largely consistent across all strata.
Of these eligible households, 610 agreed to take part in the diary survey and among these, 561 households (i.e. 92%) representing 1,498 persons aged 5 years and older, fully responded. Importantly, among the 49 households failing to complete the diary survey (after commencing), most were non-contactable and untraceable; only 5 actually declined to continue.
SA recreational fishing survey 2013/14 15
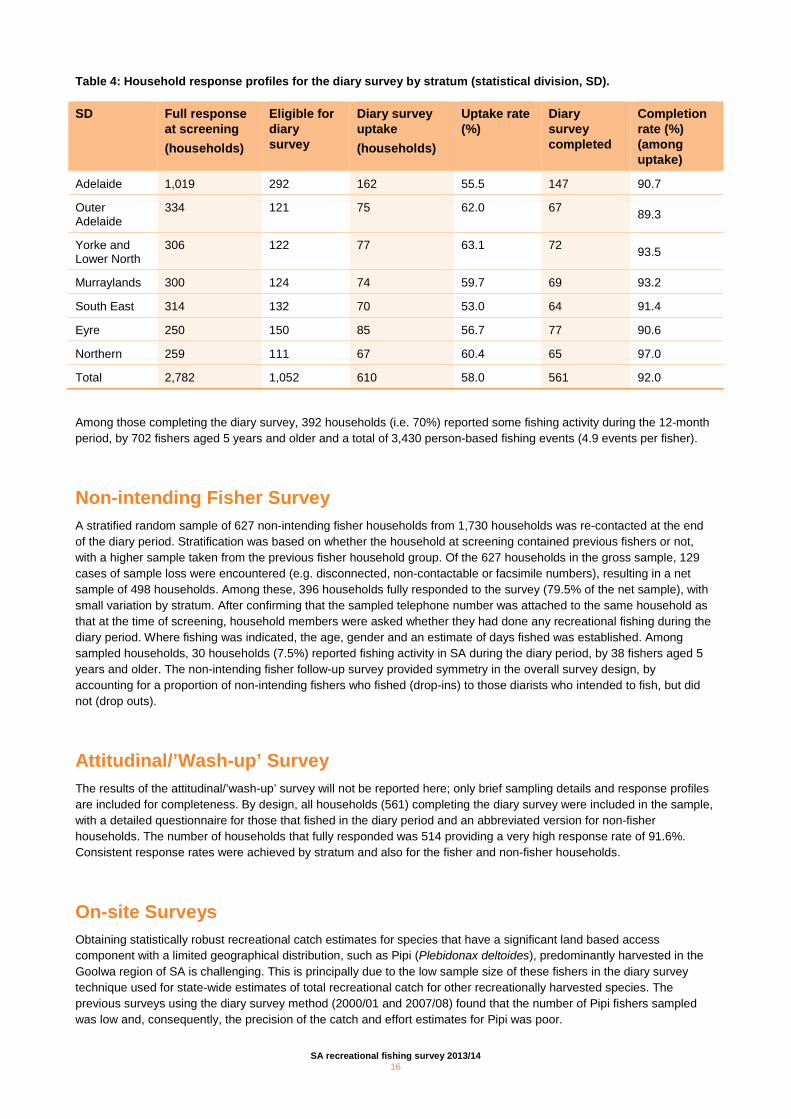
Table 4: Household response profiles for the diary survey by stratum (statistical division, SD).
SD Full response at screening (households)
Eligible for diary survey
Diary survey uptake (households)
Uptake rate (%)
Diary survey completed
Completion rate (%) (among uptake)
Adelaide 1,019 292 162 55.5 147 90.7
Outer Adelaide
334 121 75 62.0 67 89.3
Yorke and Lower North
306 122 77 63.1 72 93.5
Murraylands 300 124 74 59.7 69 93.2
South East 314 132 70 53.0 64 91.4
Eyre 250 150 85 56.7 77 90.6
Northern 259 111 67 60.4 65 97.0
Total 2,782 1,052 610 58.0 561 92.0
Among those completing the diary survey, 392 households (i.e. 70%) reported some fishing activity during the 12-month period, by 702 fishers aged 5 years and older and a total of 3,430 person-based fishing events (4.9 events per fisher).
Non-intending Fisher Survey A stratified random sample of 627 non-intending fisher households from 1,730 households was re-contacted at the end of the diary period. Stratification was based on whether the household at screening contained previous fishers or not, with a higher sample taken from the previous fisher household group. Of the 627 households in the gross sample, 129 cases of sample loss were encountered (e.g. disconnected, non-contactable or facsimile numbers), resulting in a net sample of 498 households. Among these, 396 households fully responded to the survey (79.5% of the net sample), with small variation by stratum. After confirming that the sampled telephone number was attached to the same household as that at the time of screening, household members were asked whether they had done any recreational fishing during the diary period. Where fishing was indicated, the age, gender and an estimate of days fished was established. Among sampled households, 30 households (7.5%) reported fishing activity in SA during the diary period, by 38 fishers aged 5 years and older. The non-intending fisher follow-up survey provided symmetry in the overall survey design, by accounting for a proportion of non-intending fishers who fished (drop-ins) to those diarists who intended to fish, but did not (drop outs).
Attitudinal/’Wash-up’ Survey The results of the attitudinal/’wash-up’ survey will not be reported here; only brief sampling details and response profiles are included for completeness. By design, all households (561) completing the diary survey were included in the sample, with a detailed questionnaire for those that fished in the diary period and an abbreviated version for non-fisher households. The number of households that fully responded was 514 providing a very high response rate of 91.6%. Consistent response rates were achieved by stratum and also for the fisher and non-fisher households.
On-site Surveys Obtaining statistically robust recreational catch estimates for species that have a significant land based access component with a limited geographical distribution, such as Pipi (Plebidonax deltoides), predominantly harvested in the Goolwa region of SA is challenging. This is principally due to the low sample size of these fishers in the diary survey technique used for state-wide estimates of total recreational catch for other recreationally harvested species. The previous surveys using the diary survey method (2000/01 and 2007/08) found that the number of Pipi fishers sampled was low and, consequently, the precision of the catch and effort estimates for Pipi was poor.
SA recreational fishing survey 2013/14 16
A more cost-effective and statistically robust way to measure the land based recreational catch of a geographically ‘localised’ species such as Pipi, is to conduct on-site surveys. Targeted on-site angler survey methods are more efficient than off-site methods and will improve the precision of total catch and effort estimates.
On-site surveys were conducted with the aim of providing statistically robust estimates of the total recreational catch and effort for Pipi and Blue Swimmer Crab. The Pipi survey was conducted from 1 November 2013 to 2 May 2014 in daylight hours from Goolwa Beach and adjacent beaches at Middleton and the Sir Richard Peninsula. The Blue Swimmer Crab survey was conducted from 1 January 2014 to 31 December 2014 in northern Gulf St Vincent. During the Pipi survey period, 152 Pipi harvesting parties (574 fishers) were interviewed during 20 days of sampling and 13 fishers declined to be interviewed, which is about 2% of the total fishers approached for an interview. During the Blue Swimmer Crab survey 379 fishing parties (811 fishers) were interviewed during 49 days of sampling and 20 (2.46%) fishers declined to be interviewed. Detailed results from the on-site Pipi survey are provided elsewhere (Hall et al 2015) and results from the on-site Blue Swimmer Crab survey are provided in Giri and Hall (2015) and in the Results — Key Species section of this report.
Diary Survey Catch Length Measurements At the commencement of the program, keen diarists were additionally requested to provide length measurements of caught species:
“For keen anglers willing to make additional records at the time of fishing, size measurements will be reported for all kept species, as per measurement instructions in the South Australian Recreational Fishing Guide (where total length measurements are made for fish to the nearest 0.5 cm, rounded down; exceptions being garfish and sharks). Carapace length (cm) will be recorded for crabs. Length measurements for shellfish will be reported in mm.” (Letter to Diarists, Appendix 1.A).
Measurements were provided for a total of 6,039 individual fish and other species (5,872 marine and 167 freshwater).
SA recreational fishing survey 2013/14 17
Results — Fisher Profiles
The following results are based on information derived from the screening survey of SA residents and are expanded to represent the private-dwelling household residential population of SA.
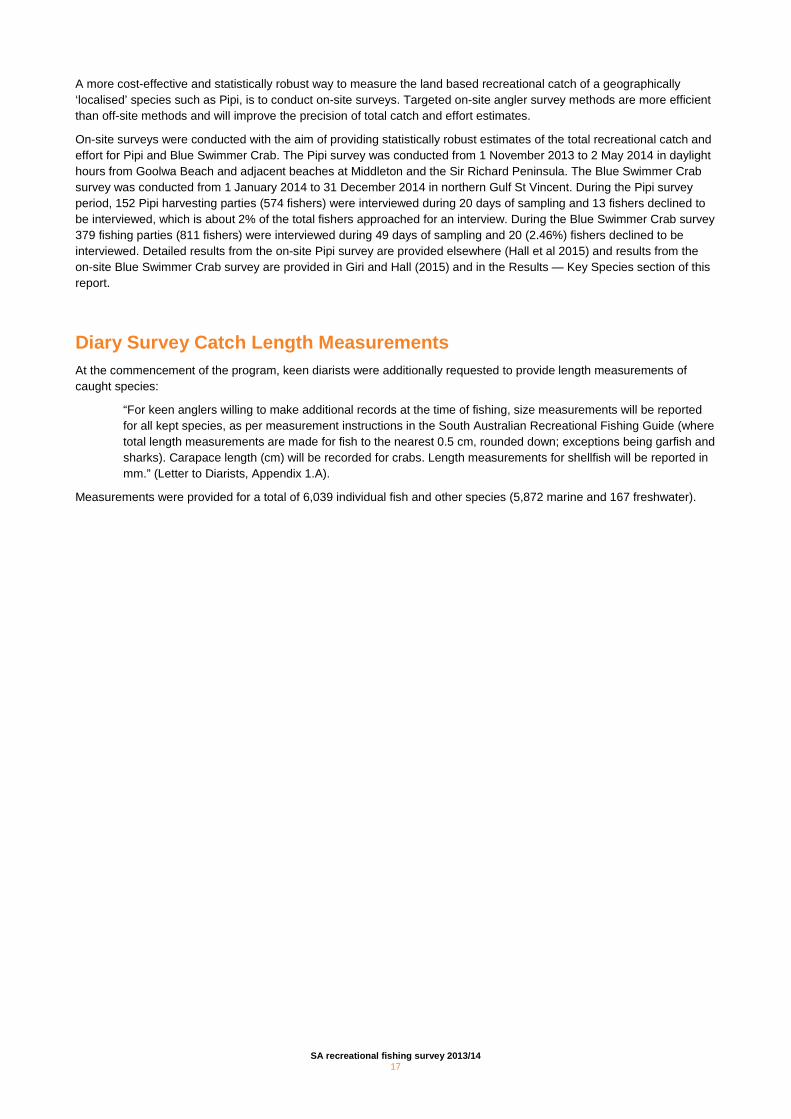
Numbers of Fishers and Participation Rates Based on reported fishing activity in the 12 months prior to November 2013, an estimated 277,027 (± 13,564) SA residents (of private-dwelling households) aged 5 years or older fished at least once, representing a participation rate of 18.3% of the SA population (Figure 4A). Fishers residing in the Adelaide metropolitan stratum represented the greatest number of the state’s fishers (185,002; 66.8% of the state-wide number of fishers), with the outer Adelaide stratum the next highest (26,321; 9.5%). The other five strata (considered to be generally more rural), totalled 65,704 fishers (23.7%). The participation rates varied considerably among strata with the Eyre SD having the highest participation rate of 34.3% (40.5% in 2007/08) and the Adelaide SD having the lowest participation rate of 16.1% (13.6% in 2007/08) (Figure 4B).
Figure 4: Fishing participation in the 12 months prior to November 2013 by statistical division by SA residents aged 5 years or older: A) number of fishers; and B) proportion (%) of the resident population.
A
B
SA recreational fishing survey 2013/14 18
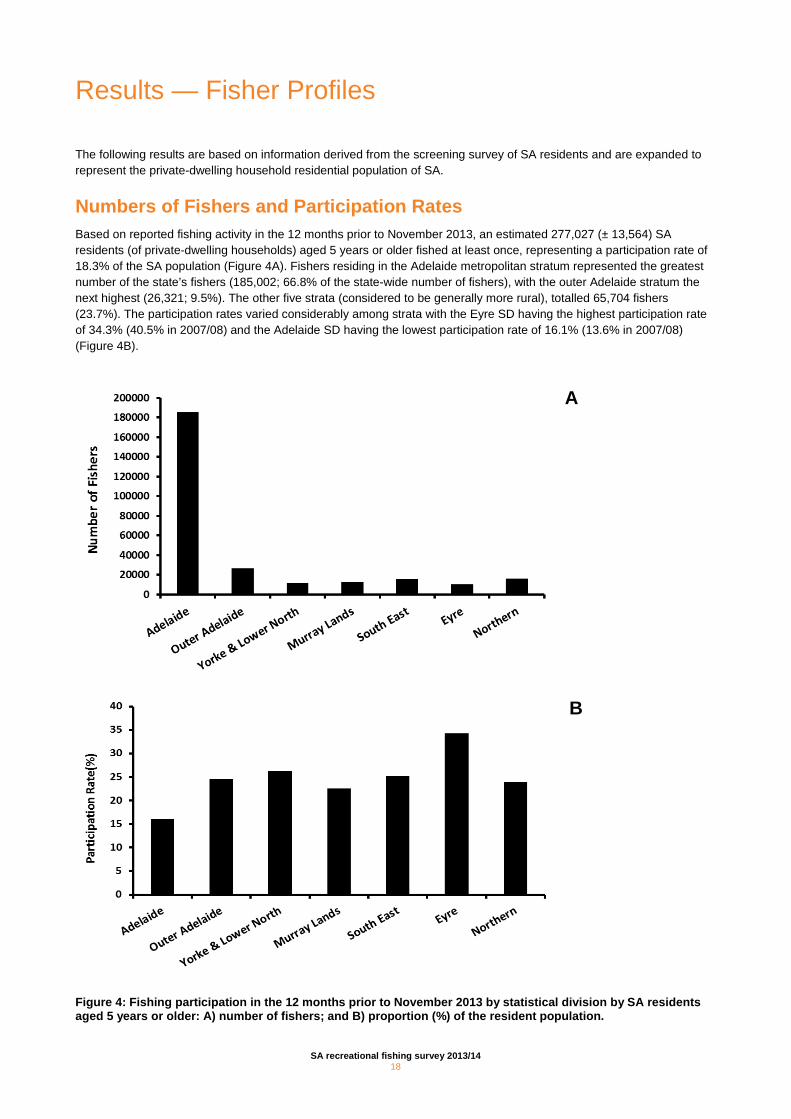
Age and Gender Recreational fishing was more popular amongst males, with 27% of the male and 9.6% of the female resident population in SA aged 5 years or older participating in recreational fishing in the 12 months prior to November 2013, compared with 23% of the male and 9.5% of the female resident population in 2007/08. By numbers, almost three times as many males (203,686 Appendix A.2) than females (73,341 Appendix A.2) did some recreational fishing (Figure 5A). The predominance of males by number and participation rate was evident across all age groups (Figure 5B) and by SD, however this dominance was least pronounced in the 5–14 year old age group. Although the highest participation rates for males and females were in the 5–14 year old age group (36.6% for males and 26.2% for females), the highest numbers of fishers were in the 45–59 year old age group for males (47,621) and in the 5–14 year old age group for females (24,309). The most pronounced increases across sexes and age groups were observed for 5–14 year old females, where the participation rate increased from 14.8% in 2007/08 to 26.2% in 20013/14 (See also Appendix A.3).
Figure 5: Fishing participation in the 12 months prior to November 2013 by age group and gender by SA residents aged 5 years or older: A) number of fishers; and B) proportion (%) of the resident population.
A
B
SA recreational fishing survey 2013/14 19
Results — Fishing Effort
Fishing effort is used to describe the pressure applied to a resource by fishers and to derive (with catch data) indices of resource abundance. The response of fish populations to variations in fishing effort represents an important foundation for stock assessment.
For the purposes of this report, only effort undertaken by SA residents in SA waters was considered. Effort can be described in several ways, i.e. on the basis of fisher days (regardless of time fished on the day), hours fished, or events (as defined in this study). For this report, the primary measure of effort used is fisher day, noting that fisher days of effort can be disaggregated by fishing region, fishing platform and/or method of capture.
Based on reported fishing activity by diarists, with appropriate non-response and ‘drop-out’ and ‘drop-in’ adjustments, it was estimated that overall 237,702 (± 17,977) South Australians fished between December 2013 and November 2014. This represents a small decrease (14.2%) over the estimated number of persons who fished in the 12 months prior to this period, based on the screening survey data (277,027 South Australians). In 2007/08 an estimated 215,972 (± 18,157) South Australians fished between November 2007 and October 2008, representing a small decrease (8.7%) over the estimated number of persons who fished in the 12 months prior to this period (236,463 South Australians).
In terms of effort, SA residents accounted for over 965,561 (± 87,352) days fished (compared with 1,054,200 (± 113,302) days fished in 2007/08).
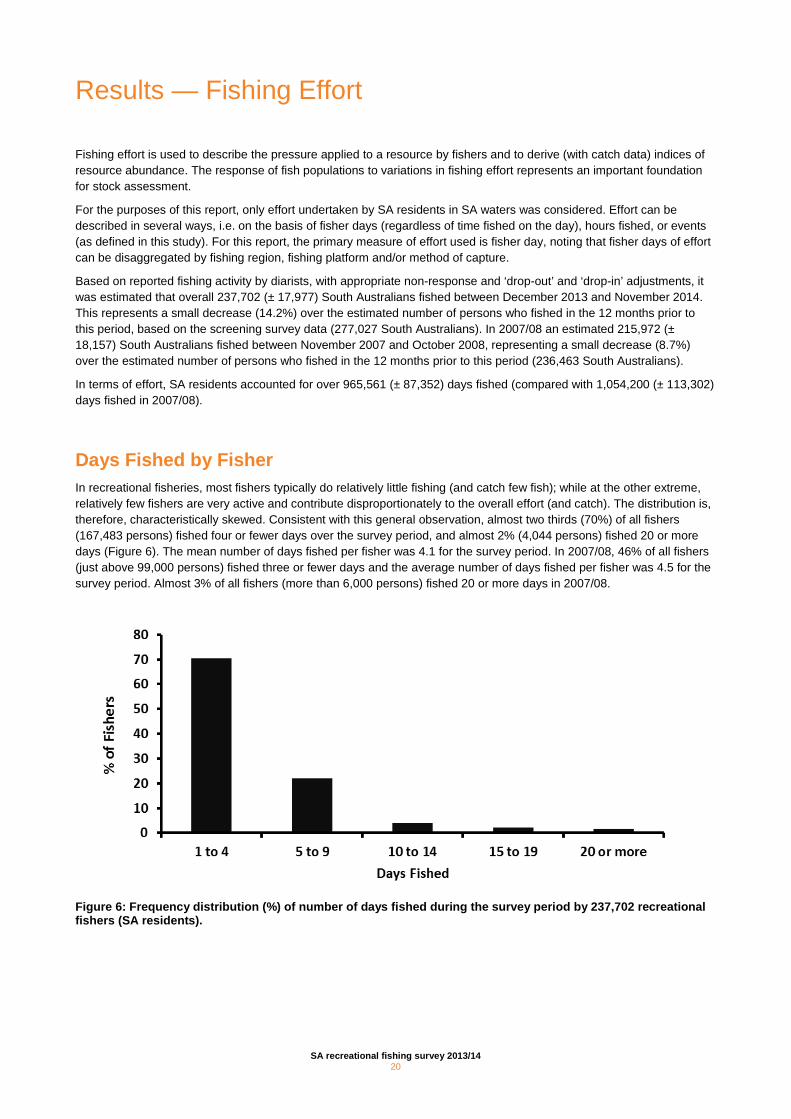
Days Fished by Fisher In recreational fisheries, most fishers typically do relatively little fishing (and catch few fish); while at the other extreme, relatively few fishers are very active and contribute disproportionately to the overall effort (and catch). The distribution is, therefore, characteristically skewed. Consistent with this general observation, almost two thirds (70%) of all fishers (167,483 persons) fished four or fewer days over the survey period, and almost 2% (4,044 persons) fished 20 or more days (Figure 6). The mean number of days fished per fisher was 4.1 for the survey period. In 2007/08, 46% of all fishers (just above 99,000 persons) fished three or fewer days and the average number of days fished per fisher was 4.5 for the survey period. Almost 3% of all fishers (more than 6,000 persons) fished 20 or more days in 2007/08.
Figure 6: Frequency distribution (%) of number of days fished during the survey period by 237,702 recreational fishers (SA residents).
SA recreational fishing survey 2013/14 20
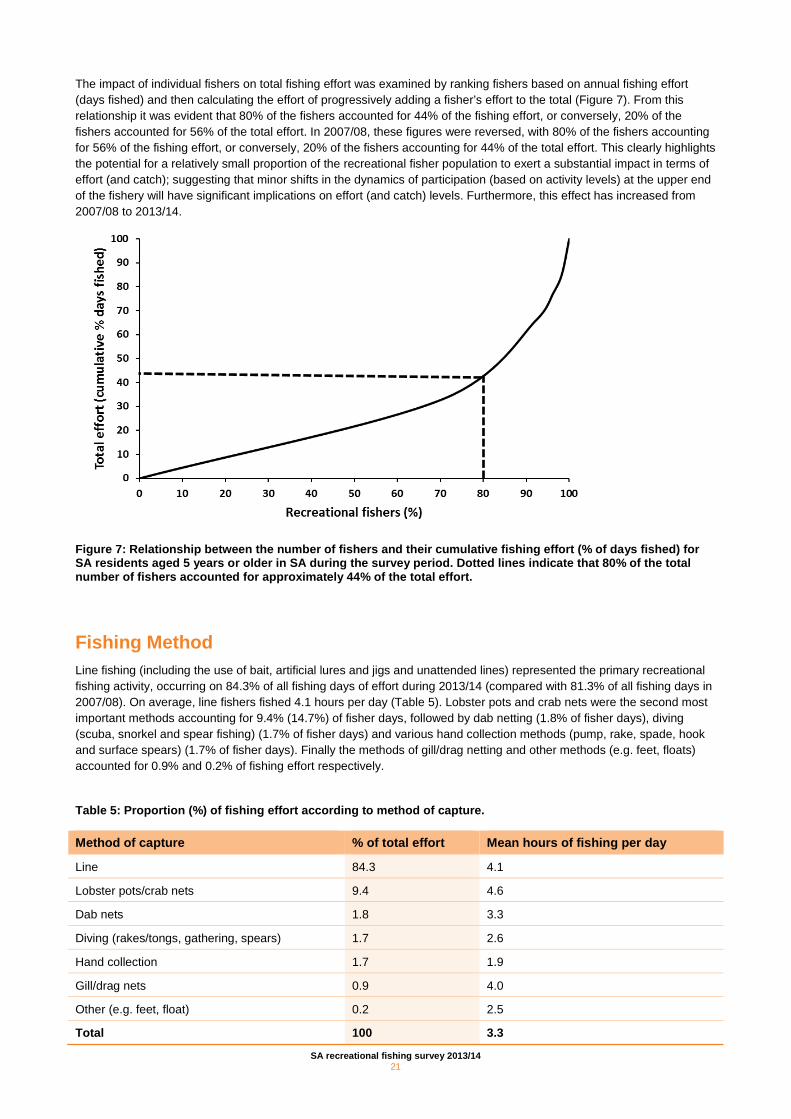
The impact of individual fishers on total fishing effort was examined by ranking fishers based on annual fishing effort (days fished) and then calculating the effort of progressively adding a fisher’s effort to the total (Figure 7). From this relationship it was evident that 80% of the fishers accounted for 44% of the fishing effort, or conversely, 20% of the fishers accounted for 56% of the total effort. In 2007/08, these figures were reversed, with 80% of the fishers accounting for 56% of the fishing effort, or conversely, 20% of the fishers accounting for 44% of the total effort. This clearly highlights the potential for a relatively small proportion of the recreational fisher population to exert a substantial impact in terms of effort (and catch); suggesting that minor shifts in the dynamics of participation (based on activity levels) at the upper end of the fishery will have significant implications on effort (and catch) levels. Furthermore, this effect has increased from 2007/08 to 2013/14.
Figure 7: Relationship between the number of fishers and their cumulative fishing effort (% of days fished) for SA residents aged 5 years or older in SA during the survey period. Dotted lines indicate that 80% of the total number of fishers accounted for approximately 44% of the total effort.
Fishing Method Line fishing (including the use of bait, artificial lures and jigs and unattended lines) represented the primary recreational fishing activity, occurring on 84.3% of all fishing days of effort during 2013/14 (compared with 81.3% of all fishing days in 2007/08). On average, line fishers fished 4.1 hours per day (Table 5). Lobster pots and crab nets were the second most important methods accounting for 9.4% (14.7%) of fisher days, followed by dab netting (1.8% of fisher days), diving (scuba, snorkel and spear fishing) (1.7% of fisher days) and various hand collection methods (pump, rake, spade, hook and surface spears) (1.7% of fisher days). Finally the methods of gill/drag netting and other methods (e.g. feet, floats) accounted for 0.9% and 0.2% of fishing effort respectively.
Table 5: Proportion (%) of fishing effort according to method of capture.
Method of capture % of total effort Mean hours of fishing per day
Line 84.3 4.1
Lobster pots/crab nets 9.4 4.6
Dab nets 1.8 3.3
Diving (rakes/tongs, gathering, spears) 1.7 2.6
Hand collection 1.7 1.9
Gill/drag nets 0.9 4.0
Other (e.g. feet, float) 0.2 2.5
Total 100 3.3
SA recreational fishing survey 2013/14 21
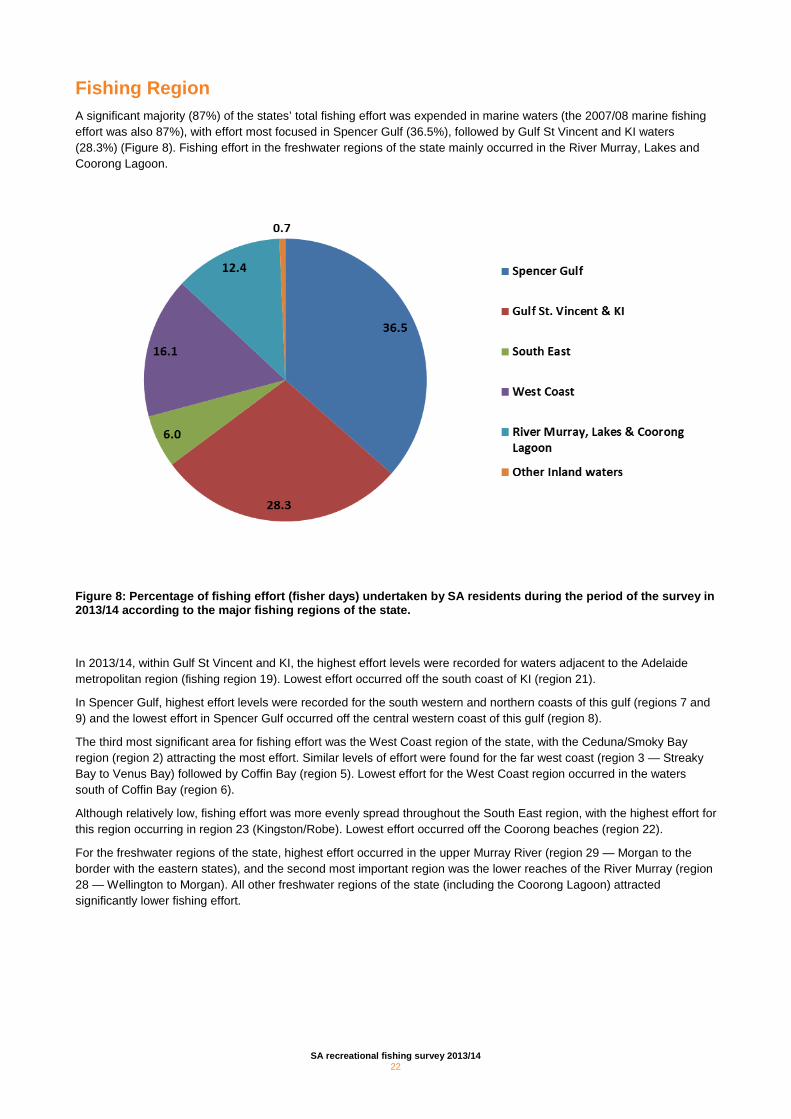
Fishing Region A significant majority (87%) of the states’ total fishing effort was expended in marine waters (the 2007/08 marine fishing effort was also 87%), with effort most focused in Spencer Gulf (36.5%), followed by Gulf St Vincent and KI waters (28.3%) (Figure 8). Fishing effort in the freshwater regions of the state mainly occurred in the River Murray, Lakes and Coorong Lagoon.
Figure 8: Percentage of fishing effort (fisher days) undertaken by SA residents during the period of the survey in 2013/14 according to the major fishing regions of the state.
In 2013/14, within Gulf St Vincent and KI, the highest effort levels were recorded for waters adjacent to the Adelaide metropolitan region (fishing region 19). Lowest effort occurred off the south coast of KI (region 21).
In Spencer Gulf, highest effort levels were recorded for the south western and northern coasts of this gulf (regions 7 and 9) and the lowest effort in Spencer Gulf occurred off the central western coast of this gulf (region 8).
The third most significant area for fishing effort was the West Coast region of the state, with the Ceduna/Smoky Bay region (region 2) attracting the most effort. Similar levels of effort were found for the far west coast (region 3 — Streaky Bay to Venus Bay) followed by Coffin Bay (region 5). Lowest effort for the West Coast region occurred in the waters south of Coffin Bay (region 6).
Although relatively low, fishing effort was more evenly spread throughout the South East region, with the highest effort for this region occurring in region 23 (Kingston/Robe). Lowest effort occurred off the Coorong beaches (region 22).
For the freshwater regions of the state, highest effort occurred in the upper Murray River (region 29 — Morgan to the border with the eastern states), and the second most important region was the lower reaches of the River Murray (region 28 — Wellington to Morgan). All other freshwater regions of the state (including the Coorong Lagoon) attracted significantly lower fishing effort.
SA recreational fishing survey 2013/14 22
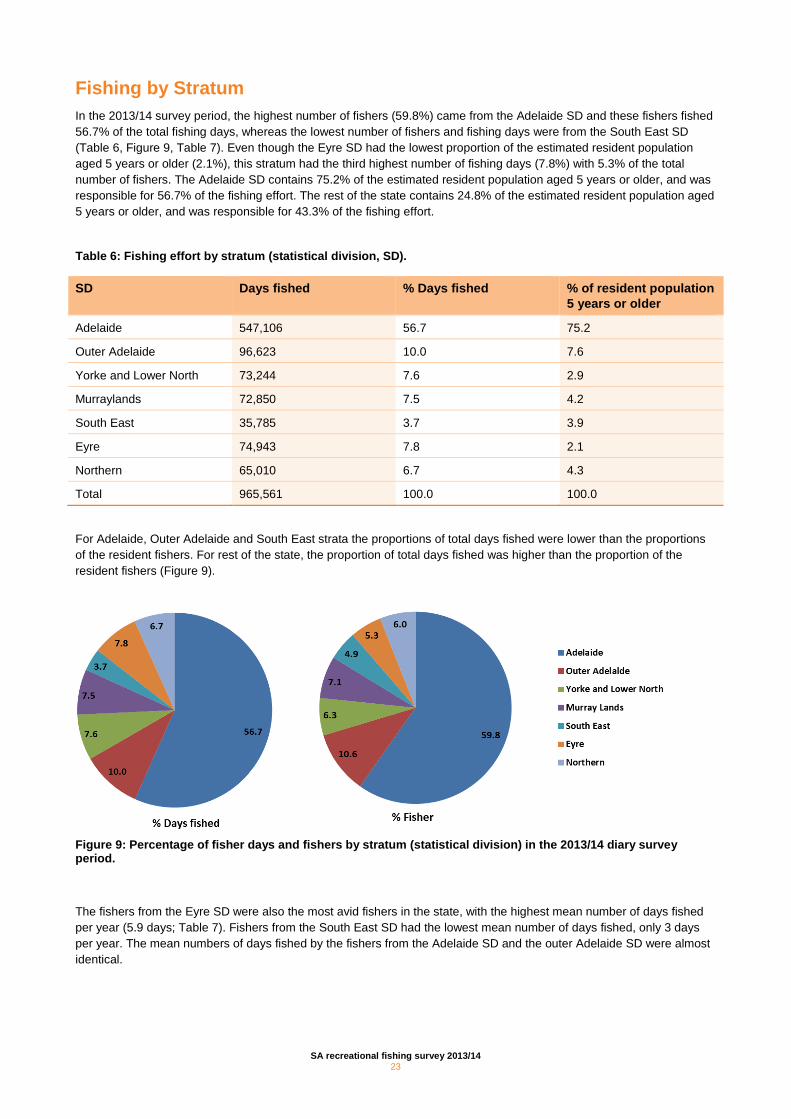
Fishing by Stratum In the 2013/14 survey period, the highest number of fishers (59.8%) came from the Adelaide SD and these fishers fished 56.7% of the total fishing days, whereas the lowest number of fishers and fishing days were from the South East SD (Table 6, Figure 9, Table 7). Even though the Eyre SD had the lowest proportion of the estimated resident population aged 5 years or older (2.1%), this stratum had the third highest number of fishing days (7.8%) with 5.3% of the total number of fishers. The Adelaide SD contains 75.2% of the estimated resident population aged 5 years or older, and was responsible for 56.7% of the fishing effort. The rest of the state contains 24.8% of the estimated resident population aged 5 years or older, and was responsible for 43.3% of the fishing effort.
Table 6: Fishing effort by stratum (statistical division, SD).
SD Days fished % Days fished % of resident population 5 years or older
Adelaide 547,106 56.7 75.2
Outer Adelaide 96,623 10.0 7.6
Yorke and Lower North 73,244 7.6 2.9
Murraylands 72,850 7.5 4.2
South East 35,785 3.7 3.9
Eyre 74,943 7.8 2.1
Northern 65,010 6.7 4.3
Total 965,561 100.0 100.0
For Adelaide, Outer Adelaide and South East strata the proportions of total days fished were lower than the proportions of the resident fishers. For rest of the state, the proportion of total days fished was higher than the proportion of the resident fishers (Figure 9).
Figure 9: Percentage of fisher days and fishers by stratum (statistical division) in the 2013/14 diary survey period.
The fishers from the Eyre SD were also the most avid fishers in the state, with the highest mean number of days fished per year (5.9 days; Table 7). Fishers from the South East SD had the lowest mean number of days fished, only 3 days per year. The mean numbers of days fished by the fishers from the Adelaide SD and the outer Adelaide SD were almost identical.
SA recreational fishing survey 2013/14 23
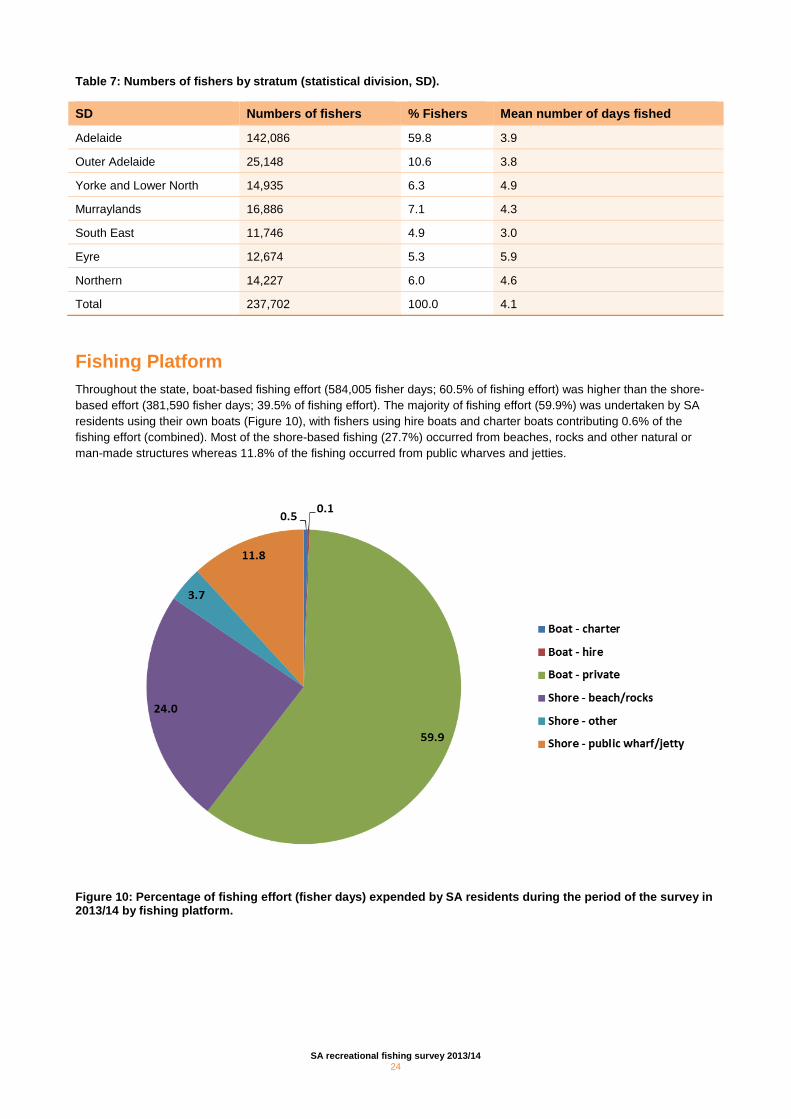
Table 7: Numbers of fishers by stratum (statistical division, SD).
SD Numbers of fishers % Fishers Mean number of days fished
Adelaide 142,086 59.8 3.9
Outer Adelaide 25,148 10.6 3.8
Yorke and Lower North 14,935 6.3 4.9
Murraylands 16,886 7.1 4.3
South East 11,746 4.9 3.0
Eyre 12,674 5.3 5.9
Northern 14,227 6.0 4.6
Total 237,702 100.0 4.1
Fishing Platform Throughout the state, boat-based fishing effort (584,005 fisher days; 60.5% of fishing effort) was higher than the shore-based effort (381,590 fisher days; 39.5% of fishing effort). The majority of fishing effort (59.9%) was undertaken by SA residents using their own boats (Figure 10), with fishers using hire boats and charter boats contributing 0.6% of the fishing effort (combined). Most of the shore-based fishing (27.7%) occurred from beaches, rocks and other natural or man-made structures whereas 11.8% of the fishing occurred from public wharves and jetties.
Figure 10: Percentage of fishing effort (fisher days) expended by SA residents during the period of the survey in 2013/14 by fishing platform.
SA recreational fishing survey 2013/14 24
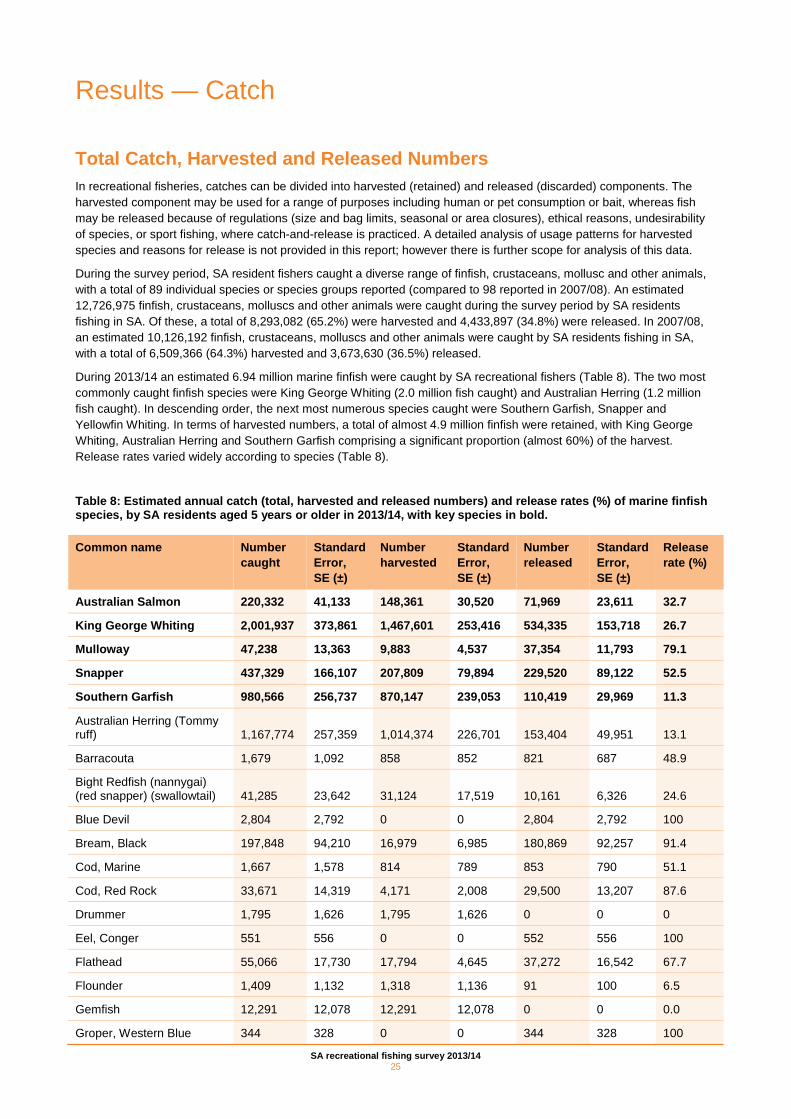
Results — Catch
Total Catch, Harvested and Released Numbers In recreational fisheries, catches can be divided into harvested (retained) and released (discarded) components. The harvested component may be used for a range of purposes including human or pet consumption or bait, whereas fish may be released because of regulations (size and bag limits, seasonal or area closures), ethical reasons, undesirability of species, or sport fishing, where catch-and-release is practiced. A detailed analysis of usage patterns for harvested species and reasons for release is not provided in this report; however there is further scope for analysis of this data.
During the survey period, SA resident fishers caught a diverse range of finfish, crustaceans, mollusc and other animals, with a total of 89 individual species or species groups reported (compared to 98 reported in 2007/08). An estimated 12,726,975 finfish, crustaceans, molluscs and other animals were caught during the survey period by SA residents fishing in SA. Of these, a total of 8,293,082 (65.2%) were harvested and 4,433,897 (34.8%) were released. In 2007/08, an estimated 10,126,192 finfish, crustaceans, molluscs and other animals were caught by SA residents fishing in SA, with a total of 6,509,366 (64.3%) harvested and 3,673,630 (36.5%) released.
During 2013/14 an estimated 6.94 million marine finfish were caught by SA recreational fishers (Table 8). The two most commonly caught finfish species were King George Whiting (2.0 million fish caught) and Australian Herring (1.2 million fish caught). In descending order, the next most numerous species caught were Southern Garfish, Snapper and Yellowfin Whiting. In terms of harvested numbers, a total of almost 4.9 million finfish were retained, with King George Whiting, Australian Herring and Southern Garfish comprising a significant proportion (almost 60%) of the harvest. Release rates varied widely according to species (Table 8).
Table 8: Estimated annual catch (total, harvested and released numbers) and release rates (%) of marine finfish species, by SA residents aged 5 years or older in 2013/14, with key species in bold.
Common name Number caught
Standard Error, SE (±)
Number harvested
Standard Error, SE (±)
Number released
Standard Error, SE (±)
Release rate (%)
Australian Salmon 220,332 41,133 148,361 30,520 71,969 23,611 32.7
King George Whiting 2,001,937 373,861 1,467,601 253,416 534,335 153,718 26.7
Mulloway 47,238 13,363 9,883 4,537 37,354 11,793 79.1
Snapper 437,329 166,107 207,809 79,894 229,520 89,122 52.5
Southern Garfish 980,566 256,737 870,147 239,053 110,419 29,969 11.3
Australian Herring (Tommy ruff) 1,167,774 257,359 1,014,374 226,701 153,404 49,951 13.1
Barracouta 1,679 1,092 858 852 821 687 48.9
Bight Redfish (nannygai) (red snapper) (swallowtail) 41,285 23,642 31,124 17,519 10,161 6,326 24.6
Blue Devil 2,804 2,792 0 0 2,804 2,792 100
Bream, Black 197,848 94,210 16,979 6,985 180,869 92,257 91.4
Cod, Marine 1,667 1,578 814 789 853 790 51.1
Cod, Red Rock 33,671 14,319 4,171 2,008 29,500 13,207 87.6
Drummer 1,795 1,626 1,795 1,626 0 0 0
Eel, Conger 551 556 0 0 552 556 100
Flathead 55,066 17,730 17,794 4,645 37,272 16,542 67.7
Flounder 1,409 1,132 1,318 1,136 91 100 6.5
Gemfish 12,291 12,078 12,291 12,078 0 0 0.0
Groper, Western Blue 344 328 0 0 344 328 100
SA recreational fishing survey 2013/14 25
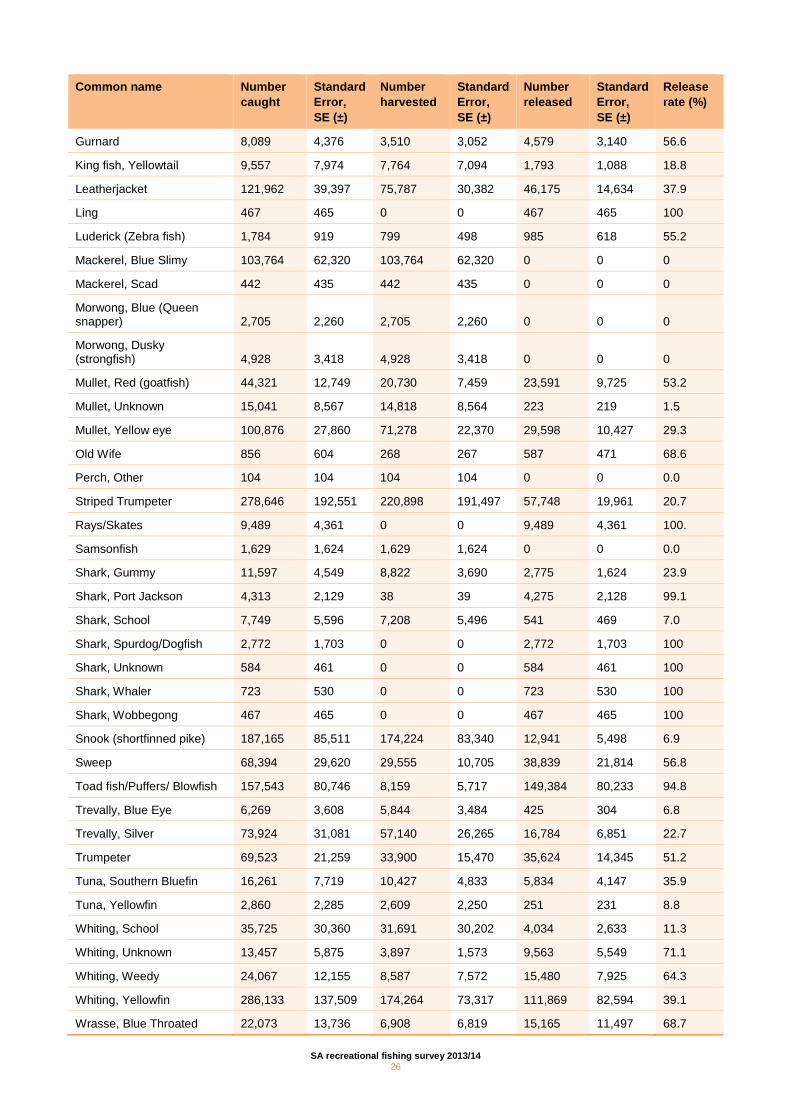
Common name Number caught
Standard Error, SE (±)
Number harvested
Standard Error, SE (±)
Number released
Standard Error, SE (±)
Release rate (%)
Gurnard 8,089 4,376 3,510 3,052 4,579 3,140 56.6
King fish, Yellowtail 9,557 7,974 7,764 7,094 1,793 1,088 18.8
Leatherjacket 121,962 39,397 75,787 30,382 46,175 14,634 37.9
Ling 467 465 0 0 467 465 100
Luderick (Zebra fish) 1,784 919 799 498 985 618 55.2
Mackerel, Blue Slimy 103,764 62,320 103,764 62,320 0 0 0
Mackerel, Scad 442 435 442 435 0 0 0
Morwong, Blue (Queen snapper) 2,705 2,260 2,705 2,260 0 0 0
Morwong, Dusky (strongfish) 4,928 3,418 4,928 3,418 0 0 0
Mullet, Red (goatfish) 44,321 12,749 20,730 7,459 23,591 9,725 53.2
Mullet, Unknown 15,041 8,567 14,818 8,564 223 219 1.5
Mullet, Yellow eye 100,876 27,860 71,278 22,370 29,598 10,427 29.3
Old Wife 856 604 268 267 587 471 68.6
Perch, Other 104 104 104 104 0 0 0.0
Striped Trumpeter 278,646 192,551 220,898 191,497 57,748 19,961 20.7
Rays/Skates 9,489 4,361 0 0 9,489 4,361 100.
Samsonfish 1,629 1,624 1,629 1,624 0 0 0.0
Shark, Gummy 11,597 4,549 8,822 3,690 2,775 1,624 23.9
Shark, Port Jackson 4,313 2,129 38 39 4,275 2,128 99.1
Shark, School 7,749 5,596 7,208 5,496 541 469 7.0
Shark, Spurdog/Dogfish 2,772 1,703 0 0 2,772 1,703 100
Shark, Unknown 584 461 0 0 584 461 100
Shark, Whaler 723 530 0 0 723 530 100
Shark, Wobbegong 467 465 0 0 467 465 100
Snook (shortfinned pike) 187,165 85,511 174,224 83,340 12,941 5,498 6.9
Sweep 68,394 29,620 29,555 10,705 38,839 21,814 56.8
Toad fish/Puffers/ Blowfish 157,543 80,746 8,159 5,717 149,384 80,233 94.8
Trevally, Blue Eye 6,269 3,608 5,844 3,484 425 304 6.8
Trevally, Silver 73,924 31,081 57,140 26,265 16,784 6,851 22.7
Trumpeter 69,523 21,259 33,900 15,470 35,624 14,345 51.2
Tuna, Southern Bluefin 16,261 7,719 10,427 4,833 5,834 4,147 35.9
Tuna, Yellowfin 2,860 2,285 2,609 2,250 251 231 8.8
Whiting, School 35,725 30,360 31,691 30,202 4,034 2,633 11.3
Whiting, Unknown 13,457 5,875 3,897 1,573 9,563 5,549 71.1
Whiting, Weedy 24,067 12,155 8,587 7,572 15,480 7,925 64.3
Whiting, Yellowfin 286,133 137,509 174,264 73,317 111,869 82,594 39.1
Wrasse, Blue Throated 22,073 13,736 6,908 6,819 15,165 11,497 68.7
SA recreational fishing survey 2013/14 26
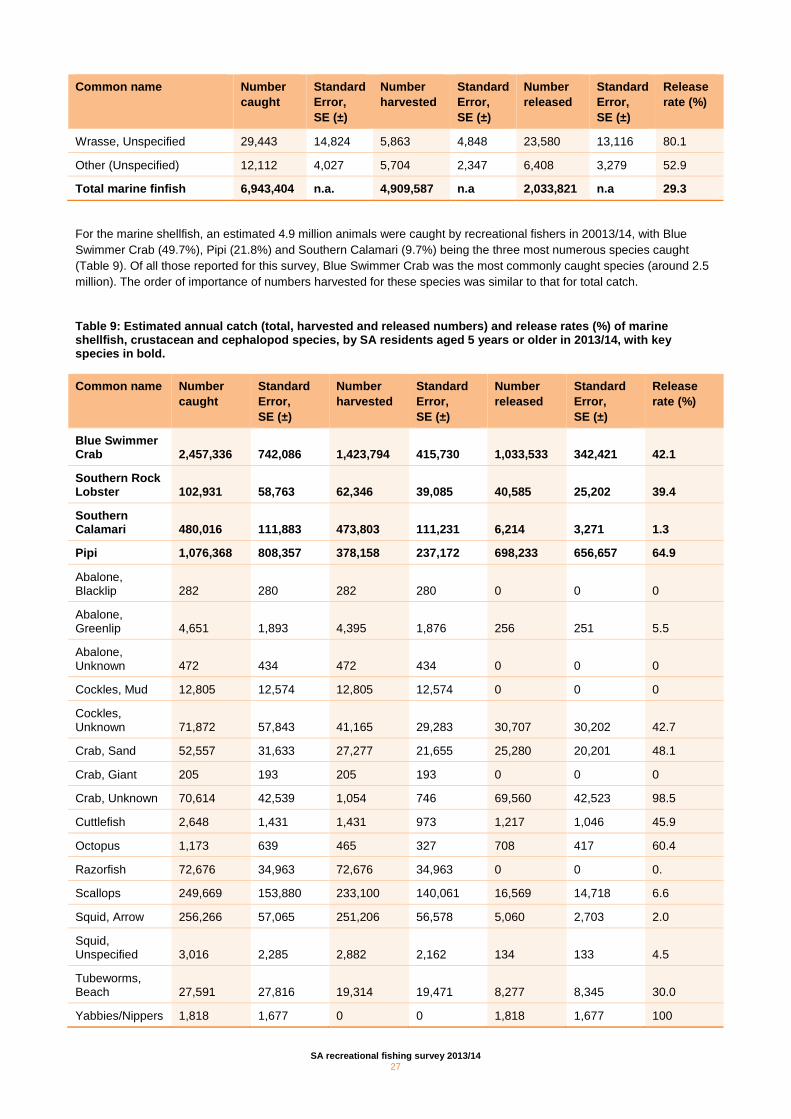
Common name Number caught
Standard Error, SE (±)
Number harvested
Standard Error, SE (±)
Number released
Standard Error, SE (±)
Release rate (%)
Wrasse, Unspecified 29,443 14,824 5,863 4,848 23,580 13,116 80.1
Other (Unspecified) 12,112 4,027 5,704 2,347 6,408 3,279 52.9
Total marine finfish 6,943,404 n.a. 4,909,587 n.a 2,033,821 n.a 29.3
For the marine shellfish, an estimated 4.9 million animals were caught by recreational fishers in 20013/14, with Blue Swimmer Crab (49.7%), Pipi (21.8%) and Southern Calamari (9.7%) being the three most numerous species caught (Table 9). Of all those reported for this survey, Blue Swimmer Crab was the most commonly caught species (around 2.5 million). The order of importance of numbers harvested for these species was similar to that for total catch.
Table 9: Estimated annual catch (total, harvested and released numbers) and release rates (%) of marine shellfish, crustacean and cephalopod species, by SA residents aged 5 years or older in 2013/14, with key species in bold.
Common name Number caught
Standard Error, SE (±)
Number harvested
Standard Error, SE (±)
Number released
Standard Error, SE (±)
Release rate (%)
Blue Swimmer Crab 2,457,336 742,086 1,423,794 415,730 1,033,533 342,421 42.1
Southern Rock Lobster 102,931 58,763 62,346 39,085 40,585 25,202 39.4
Southern Calamari 480,016 111,883 473,803 111,231 6,214 3,271 1.3
Pipi 1,076,368 808,357 378,158 237,172 698,233 656,657 64.9
Abalone, Blacklip 282 280 282 280 0 0 0
Abalone, Greenlip 4,651 1,893 4,395 1,876 256 251 5.5
Abalone, Unknown 472 434 472 434 0 0 0
Cockles, Mud 12,805 12,574 12,805 12,574 0 0 0
Cockles, Unknown 71,872 57,843 41,165 29,283 30,707 30,202 42.7
Crab, Sand 52,557 31,633 27,277 21,655 25,280 20,201 48.1
Crab, Giant 205 193 205 193 0 0 0
Crab, Unknown 70,614 42,539 1,054 746 69,560 42,523 98.5
Cuttlefish 2,648 1,431 1,431 973 1,217 1,046 45.9
Octopus 1,173 639 465 327 708 417 60.4
Razorfish 72,676 34,963 72,676 34,963 0 0 0.
Scallops 249,669 153,880 233,100 140,061 16,569 14,718 6.6
Squid, Arrow 256,266 57,065 251,206 56,578 5,060 2,703 2.0
Squid, Unspecified 3,016 2,285 2,882 2,162 134 133 4.5
Tubeworms, Beach 27,591 27,816 19,314 19,471 8,277 8,345 30.0
Yabbies/Nippers 1,818 1,677 0 0 1,818 1,677 100
SA recreational fishing survey 2013/14 27
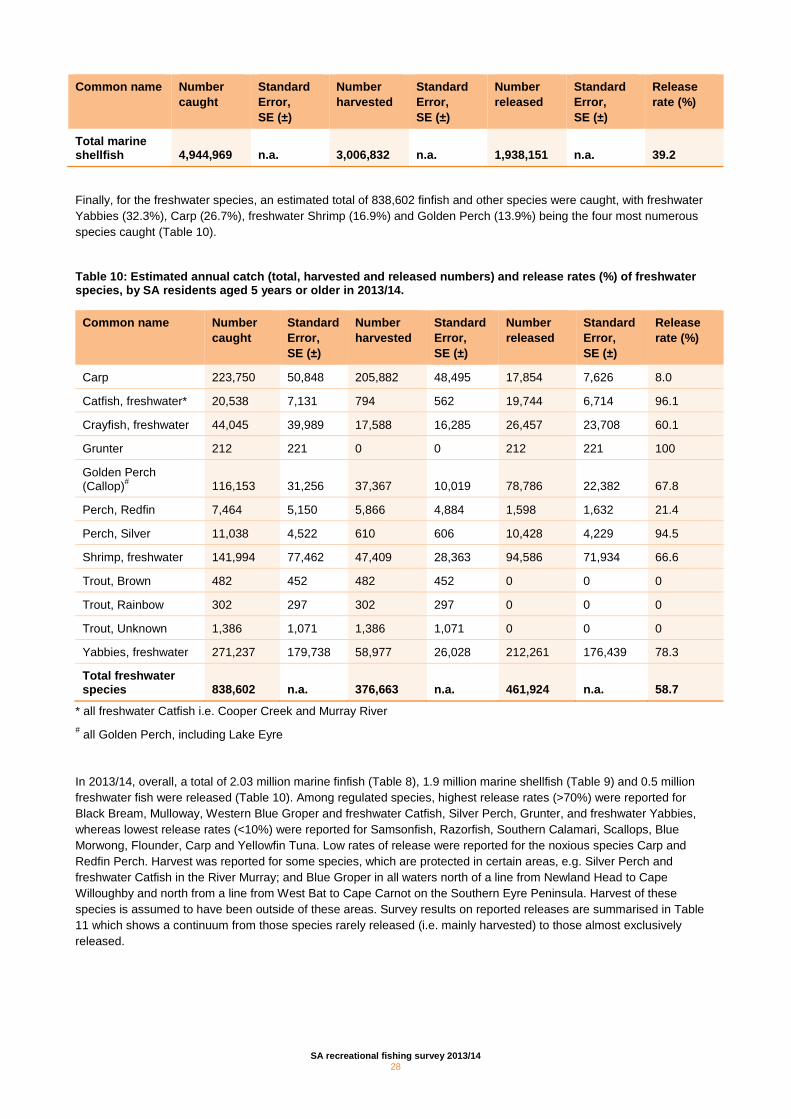
Common name Number caught
Standard Error, SE (±)
Number harvested
Standard Error, SE (±)
Number released
Standard Error, SE (±)
Release rate (%)
Total marine shellfish 4,944,969 n.a. 3,006,832 n.a. 1,938,151 n.a. 39.2
Finally, for the freshwater species, an estimated total of 838,602 finfish and other species were caught, with freshwater Yabbies (32.3%), Carp (26.7%), freshwater Shrimp (16.9%) and Golden Perch (13.9%) being the four most numerous species caught (Table 10).
Table 10: Estimated annual catch (total, harvested and released numbers) and release rates (%) of freshwater species, by SA residents aged 5 years or older in 2013/14.
Common name Number caught
Standard Error, SE (±)
Number harvested
Standard Error, SE (±)
Number released
Standard Error, SE (±)
Release rate (%)
Carp 223,750 50,848 205,882 48,495 17,854 7,626 8.0
Catfish, freshwater* 20,538 7,131 794 562 19,744 6,714 96.1
Crayfish, freshwater 44,045 39,989 17,588 16,285 26,457 23,708 60.1
Grunter 212 221 0 0 212 221 100
Golden Perch (Callop)# 116,153 31,256 37,367 10,019 78,786 22,382 67.8
Perch, Redfin 7,464 5,150 5,866 4,884 1,598 1,632 21.4
Perch, Silver 11,038 4,522 610 606 10,428 4,229 94.5
Shrimp, freshwater 141,994 77,462 47,409 28,363 94,586 71,934 66.6
Trout, Brown 482 452 482 452 0 0 0
Trout, Rainbow 302 297 302 297 0 0 0
Trout, Unknown 1,386 1,071 1,386 1,071 0 0 0
Yabbies, freshwater 271,237 179,738 58,977 26,028 212,261 176,439 78.3
Total freshwater species 838,602 n.a. 376,663 n.a. 461,924 n.a. 58.7
* all freshwater Catfish i.e. Cooper Creek and Murray River # all Golden Perch, including Lake Eyre
In 2013/14, overall, a total of 2.03 million marine finfish (Table 8), 1.9 million marine shellfish (Table 9) and 0.5 million freshwater fish were released (Table 10). Among regulated species, highest release rates (>70%) were reported for Black Bream, Mulloway, Western Blue Groper and freshwater Catfish, Silver Perch, Grunter, and freshwater Yabbies, whereas lowest release rates (<10%) were reported for Samsonfish, Razorfish, Southern Calamari, Scallops, Blue Morwong, Flounder, Carp and Yellowfin Tuna. Low rates of release were reported for the noxious species Carp and Redfin Perch. Harvest was reported for some species, which are protected in certain areas, e.g. Silver Perch and freshwater Catfish in the River Murray; and Blue Groper in all waters north of a line from Newland Head to Cape Willoughby and north from a line from West Bat to Cape Carnot on the Southern Eyre Peninsula. Harvest of these species is assumed to have been outside of these areas. Survey results on reported releases are summarised in Table 11 which shows a continuum from those species rarely released (i.e. mainly harvested) to those almost exclusively released.
SA recreational fishing survey 2013/14 28
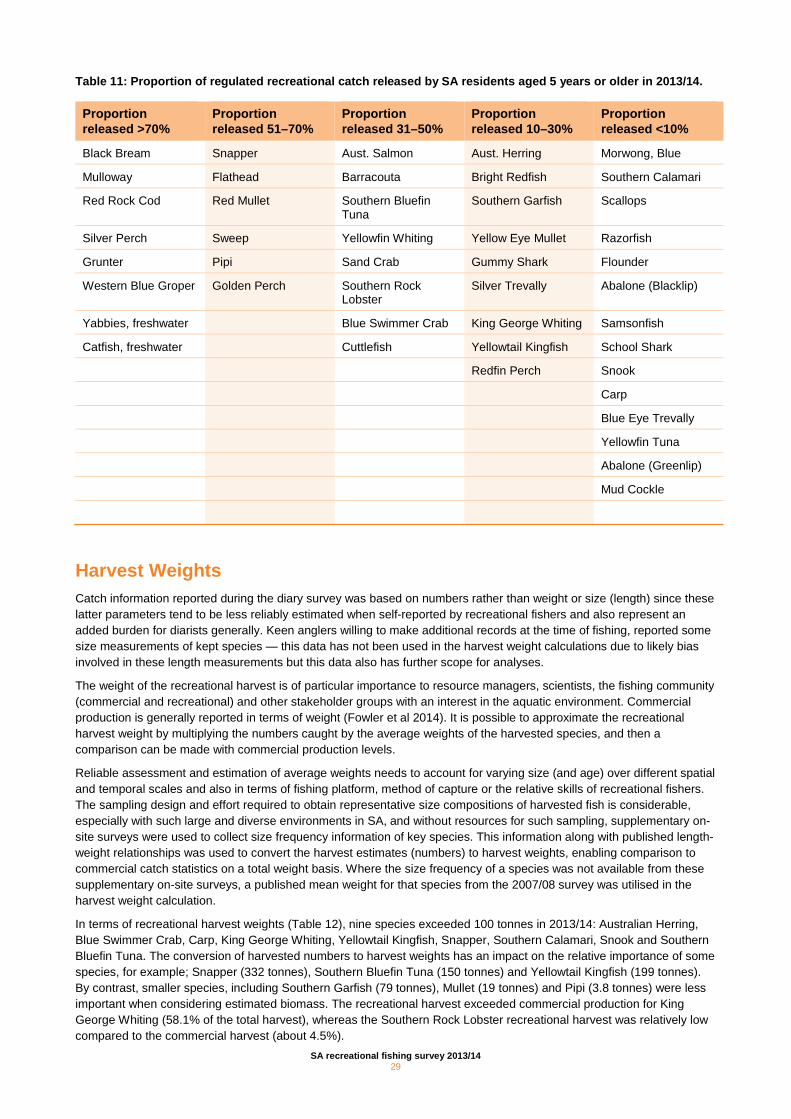
Table 11: Proportion of regulated recreational catch released by SA residents aged 5 years or older in 2013/14.
Proportion released >70%
Proportion released 51–70%
Proportion released 31–50%
Proportion released 10–30%
Proportion released <10%
Black Bream Snapper Aust. Salmon Aust. Herring Morwong, Blue
Mulloway Flathead Barracouta Bright Redfish Southern Calamari
Red Rock Cod Red Mullet Southern Bluefin Tuna
Southern Garfish Scallops
Silver Perch Sweep Yellowfin Whiting Yellow Eye Mullet Razorfish
Grunter Pipi Sand Crab Gummy Shark Flounder
Western Blue Groper Golden Perch Southern Rock Lobster
Silver Trevally Abalone (Blacklip)
Yabbies, freshwater Blue Swimmer Crab King George Whiting Samsonfish
Catfish, freshwater Cuttlefish Yellowtail Kingfish School Shark
Redfin Perch Snook
Carp
Blue Eye Trevally
Yellowfin Tuna
Abalone (Greenlip)
Mud Cockle
Harvest Weights Catch information reported during the diary survey was based on numbers rather than weight or size (length) since these latter parameters tend to be less reliably estimated when self-reported by recreational fishers and also represent an added burden for diarists generally. Keen anglers willing to make additional records at the time of fishing, reported some size measurements of kept species — this data has not been used in the harvest weight calculations due to likely bias involved in these length measurements but this data also has further scope for analyses.
The weight of the recreational harvest is of particular importance to resource managers, scientists, the fishing community (commercial and recreational) and other stakeholder groups with an interest in the aquatic environment. Commercial production is generally reported in terms of weight (Fowler et al 2014). It is possible to approximate the recreational harvest weight by multiplying the numbers caught by the average weights of the harvested species, and then a comparison can be made with commercial production levels.
Reliable assessment and estimation of average weights needs to account for varying size (and age) over different spatial and temporal scales and also in terms of fishing platform, method of capture or the relative skills of recreational fishers. The sampling design and effort required to obtain representative size compositions of harvested fish is considerable, especially with such large and diverse environments in SA, and without resources for such sampling, supplementary on-site surveys were used to collect size frequency information of key species. This information along with published length-weight relationships was used to convert the harvest estimates (numbers) to harvest weights, enabling comparison to commercial catch statistics on a total weight basis. Where the size frequency of a species was not available from these supplementary on-site surveys, a published mean weight for that species from the 2007/08 survey was utilised in the harvest weight calculation.
In terms of recreational harvest weights (Table 12), nine species exceeded 100 tonnes in 2013/14: Australian Herring, Blue Swimmer Crab, Carp, King George Whiting, Yellowtail Kingfish, Snapper, Southern Calamari, Snook and Southern Bluefin Tuna. The conversion of harvested numbers to harvest weights has an impact on the relative importance of some species, for example; Snapper (332 tonnes), Southern Bluefin Tuna (150 tonnes) and Yellowtail Kingfish (199 tonnes). By contrast, smaller species, including Southern Garfish (79 tonnes), Mullet (19 tonnes) and Pipi (3.8 tonnes) were less important when considering estimated biomass. The recreational harvest exceeded commercial production for King George Whiting (58.1% of the total harvest), whereas the Southern Rock Lobster recreational harvest was relatively low compared to the commercial harvest (about 4.5%).
SA recreational fishing survey 2013/14 29
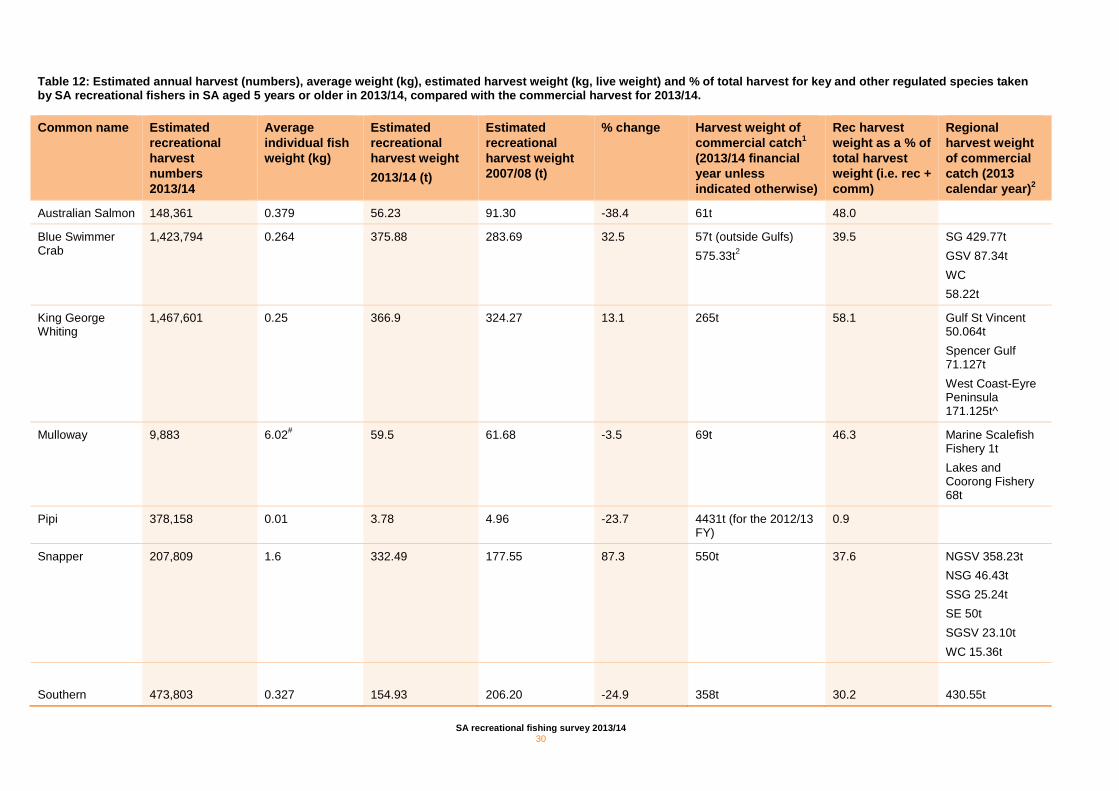
Table 12: Estimated annual harvest (numbers), average weight (kg), estimated harvest weight (kg, live weight) and % of total harvest for key and other regulated species taken by SA recreational fishers in SA aged 5 years or older in 2013/14, compared with the commercial harvest for 2013/14.
Common name Estimated recreational harvest numbers 2013/14
Average individual fish weight (kg)
Estimated recreational harvest weight 2013/14 (t)
Estimated recreational harvest weight 2007/08 (t)
% change Harvest weight of commercial catch1 (2013/14 financial year unless indicated otherwise)
Rec harvest weight as a % of total harvest weight (i.e. rec + comm)
Regional harvest weight of commercial catch (2013 calendar year)2
Australian Salmon 148,361 0.379 56.23 91.30 -38.4 61t 48.0
Blue Swimmer Crab
1,423,794 0.264 375.88 283.69 32.5 57t (outside Gulfs) 575.33t2
39.5 SG 429.77t GSV 87.34t WC 58.22t
King George Whiting
1,467,601 0.25 366.9 324.27 13.1 265t 58.1 Gulf St Vincent 50.064t Spencer Gulf 71.127t West Coast-Eyre Peninsula 171.125t^
Mulloway 9,883 6.02# 59.5 61.68 -3.5 69t 46.3 Marine Scalefish Fishery 1t Lakes and Coorong Fishery 68t
Pipi 378,158 0.01 3.78 4.96 -23.7 4431t (for the 2012/13 FY)
0.9
Snapper 207,809 1.6 332.49 177.55 87.3 550t 37.6 NGSV 358.23t NSG 46.43t SSG 25.24t SE 50t SGSV 23.10t WC 15.36t
Southern
473,803
0.327
154.93
206.20
-24.9
358t
30.2
430.55t
SA recreational fishing survey 2013/14 30
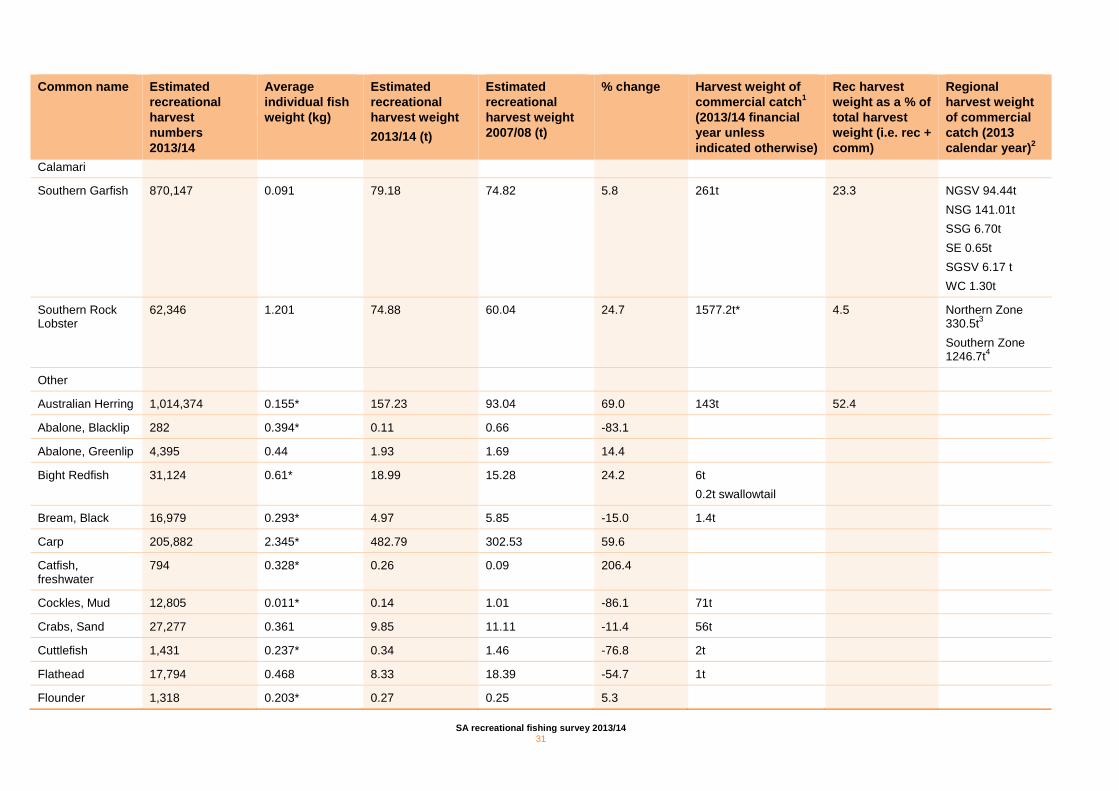
Common name Estimated recreational harvest numbers 2013/14
Average individual fish weight (kg)
Estimated recreational harvest weight 2013/14 (t)
Estimated recreational harvest weight 2007/08 (t)
% change Harvest weight of commercial catch1 (2013/14 financial year unless indicated otherwise)
Rec harvest weight as a % of total harvest weight (i.e. rec + comm)
Regional harvest weight of commercial catch (2013 calendar year)2
Calamari
Southern Garfish 870,147 0.091 79.18 74.82 5.8 261t 23.3 NGSV 94.44t NSG 141.01t SSG 6.70t SE 0.65t SGSV 6.17 t WC 1.30t
Southern Rock Lobster
62,346 1.201 74.88 60.04 24.7 1577.2t* 4.5 Northern Zone 330.5t3 Southern Zone 1246.7t4
Other
Australian Herring 1,014,374 0.155* 157.23 93.04 69.0 143t 52.4
Abalone, Blacklip 282 0.394* 0.11 0.66 -83.1
Abalone, Greenlip 4,395 0.44 1.93 1.69 14.4
Bight Redfish 31,124 0.61* 18.99 15.28 24.2 6t 0.2t swallowtail
Bream, Black 16,979 0.293* 4.97 5.85 -15.0 1.4t
Carp 205,882 2.345* 482.79 302.53 59.6
Catfish, freshwater
794 0.328* 0.26 0.09 206.4
Cockles, Mud 12,805 0.011* 0.14 1.01 -86.1 71t
Crabs, Sand 27,277 0.361 9.85 11.11 -11.4 56t
Cuttlefish 1,431 0.237* 0.34 1.46 -76.8 2t
Flathead 17,794 0.468 8.33 18.39 -54.7 1t
Flounder 1,318 0.203* 0.27 0.25 5.3
SA recreational fishing survey 2013/14 31
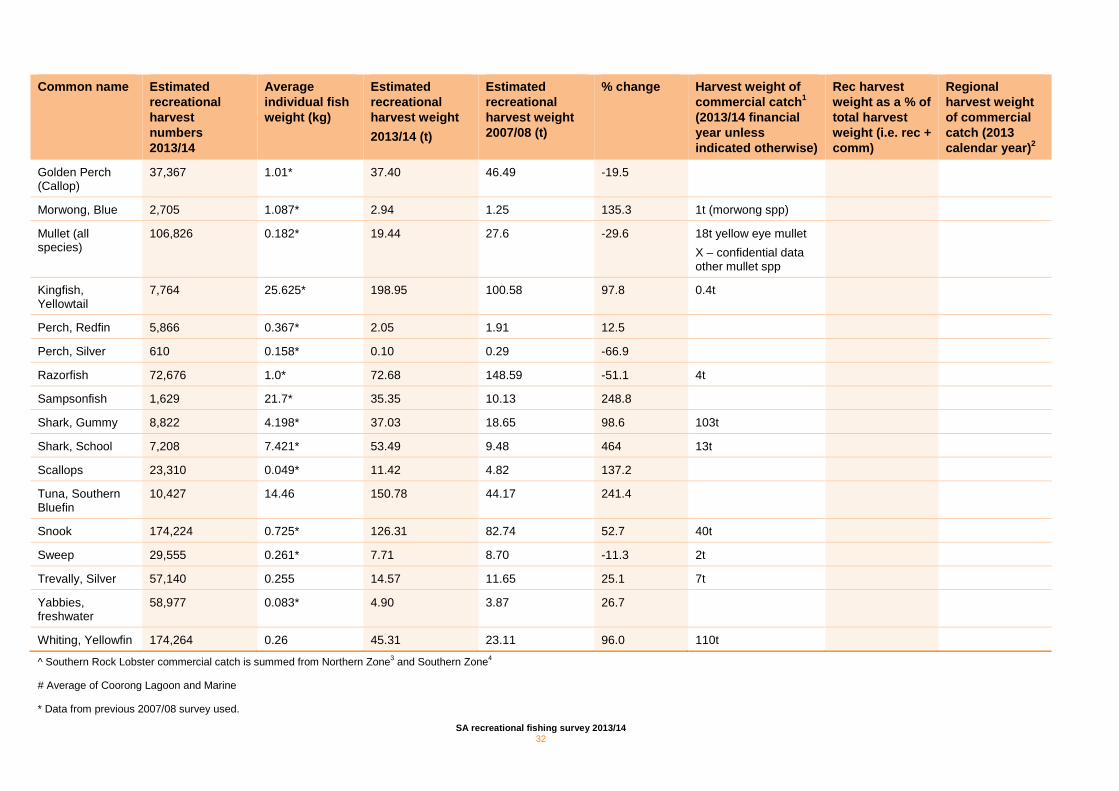
Common name Estimated recreational harvest numbers 2013/14
Average individual fish weight (kg)
Estimated recreational harvest weight 2013/14 (t)
Estimated recreational harvest weight 2007/08 (t)
% change Harvest weight of commercial catch1 (2013/14 financial year unless indicated otherwise)
Rec harvest weight as a % of total harvest weight (i.e. rec + comm)
Regional harvest weight of commercial catch (2013 calendar year)2
Golden Perch (Callop)
37,367 1.01* 37.40 46.49 -19.5
Morwong, Blue 2,705 1.087* 2.94 1.25 135.3 1t (morwong spp)
Mullet (all species)
106,826 0.182* 19.44 27.6 -29.6 18t yellow eye mullet X – confidential data other mullet spp
Kingfish, Yellowtail
7,764 25.625* 198.95 100.58 97.8 0.4t
Perch, Redfin 5,866 0.367* 2.05 1.91 12.5
Perch, Silver 610 0.158* 0.10 0.29 -66.9
Razorfish 72,676 1.0* 72.68 148.59 -51.1 4t
Sampsonfish 1,629 21.7* 35.35 10.13 248.8
Shark, Gummy 8,822 4.198* 37.03 18.65 98.6 103t
Shark, School 7,208 7.421* 53.49 9.48 464 13t
Scallops 23,310 0.049* 11.42 4.82 137.2
Tuna, Southern Bluefin
10,427 14.46 150.78 44.17 241.4
Snook 174,224 0.725* 126.31 82.74 52.7 40t
Sweep 29,555 0.261* 7.71 8.70 -11.3 2t
Trevally, Silver 57,140 0.255 14.57 11.65 25.1 7t
Yabbies, freshwater
58,977 0.083* 4.90 3.87 26.7
Whiting, Yellowfin 174,264 0.26 45.31 23.11 96.0 110t
^ Southern Rock Lobster commercial catch is summed from Northern Zone3 and Southern Zone4
# Average of Coorong Lagoon and Marine
* Data from previous 2007/08 survey used.
SA recreational fishing survey 2013/14 32
1 Fowler, A.J., McGarvey, R., Steer, M.A. and J.E Fenestra (2014). The South Australian Marine Scalefish Fishery Report - Analysis of Fishery Statistics for 2013/14. Report to PIRSA Fisheries and Aquaculture. South Australian Research and Development Institute (Aquatic Sciences), Adelaide. F2007/000565-9. SARDI Research Report Series No. 816.
2 2013 calendar year biological stock or management unit breakdown of catch data from Flood, M, Stobutzki, I, Andrews, J, Ashby, C, Begg, G, Fletcher, R, Gardner, C, Georgeson, L, Hansen, S, Hartmann, K, Hone, P, Horvat, P, Maloney, L, McDonald, B, Moore, A, Roelofs, A, Sainsbury, K, Saunders, T, Smith, T, Stewardson, C, Stewart, J and Wise, B (eds) (2014). Status of key Australian fish stocks reports 2014, Fisheries Research and Development Corporation, Canberra.
3 Linnane, A, McGarvey, R and JE Feenstra (2014). Northern Zone Rock Lobster (Jasus edwardsii) Fishery Status Report 2013/14. Status Report to PIRSA Fisheries and Aquaculture. South Australian Research and Development Institute (Aquatic Sciences), Adelaide. SARDI Publication Number F2007/000714-8. SARDI Research Report Series No. 811.
4 Linnane, A, McGarvey, R, Feenstra, JE and P Hawthorne (2014). Southern Zone Rock Lobster (Jasus edwardsii) Fishery Status Report 2013/14. Status Report to PIRSA Fisheries and Aquaculture. South Australian Research and Development Institute (Aquatic Sciences), Adelaide. SARDI Publication Number F2007/000715-8. SARDI Research Report Series No. 812.
SA recreational fishing survey 2013/14 33
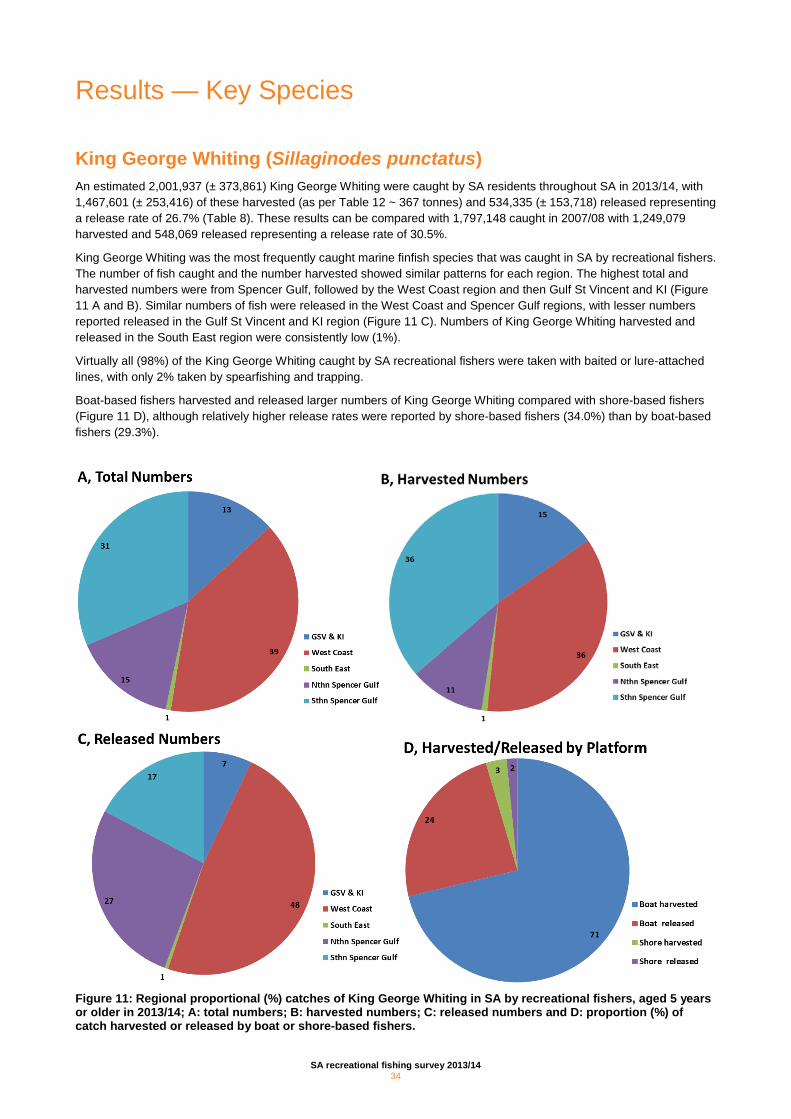
Results — Key Species
King George Whiting (Sillaginodes punctatus) An estimated 2,001,937 (± 373,861) King George Whiting were caught by SA residents throughout SA in 2013/14, with 1,467,601 (± 253,416) of these harvested (as per Table 12 ~ 367 tonnes) and 534,335 (± 153,718) released representing a release rate of 26.7% (Table 8). These results can be compared with 1,797,148 caught in 2007/08 with 1,249,079 harvested and 548,069 released representing a release rate of 30.5%.
King George Whiting was the most frequently caught marine finfish species that was caught in SA by recreational fishers. The number of fish caught and the number harvested showed similar patterns for each region. The highest total and harvested numbers were from Spencer Gulf, followed by the West Coast region and then Gulf St Vincent and KI (Figure 11 A and B). Similar numbers of fish were released in the West Coast and Spencer Gulf regions, with lesser numbers reported released in the Gulf St Vincent and KI region (Figure 11 C). Numbers of King George Whiting harvested and released in the South East region were consistently low (1%).
Virtually all (98%) of the King George Whiting caught by SA recreational fishers were taken with baited or lure-attached lines, with only 2% taken by spearfishing and trapping.
Boat-based fishers harvested and released larger numbers of King George Whiting compared with shore-based fishers (Figure 11 D), although relatively higher release rates were reported by shore-based fishers (34.0%) than by boat-based fishers (29.3%).
Figure 11: Regional proportional (%) catches of King George Whiting in SA by recreational fishers, aged 5 years or older in 2013/14; A: total numbers; B: harvested numbers; C: released numbers and D: proportion (%) of catch harvested or released by boat or shore-based fishers.
SA recreational fishing survey 2013/14 34
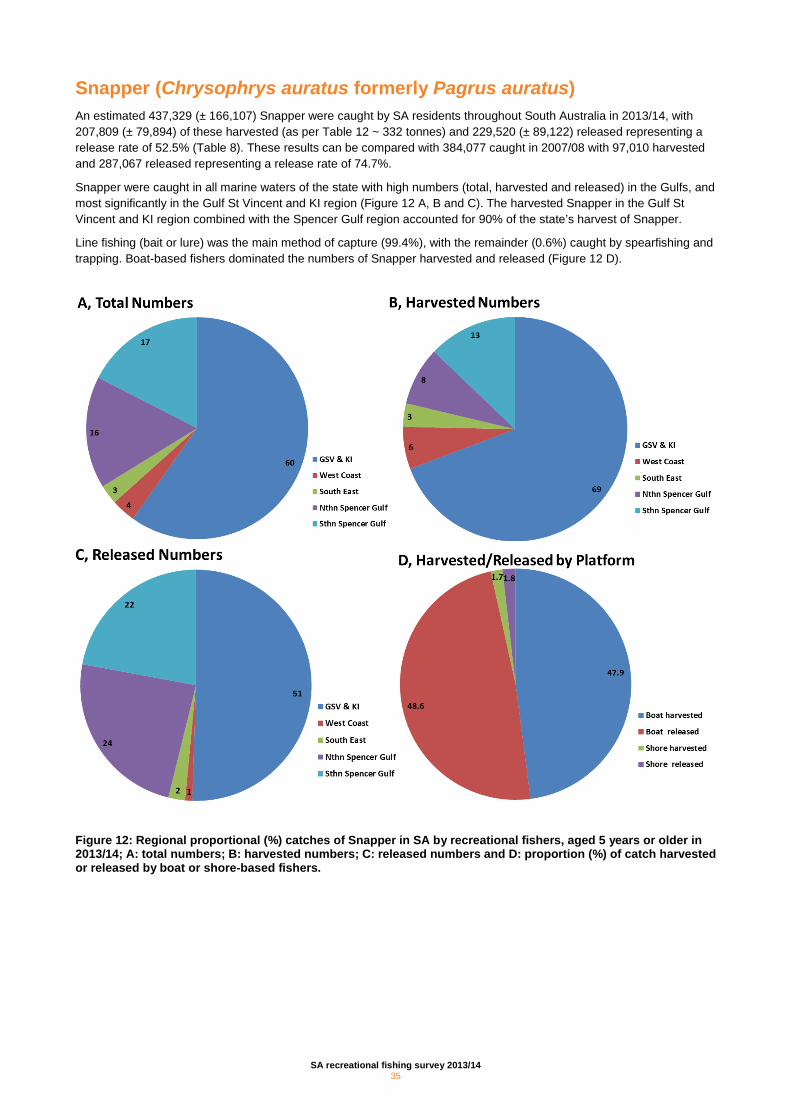
Snapper (Chrysophrys auratus formerly Pagrus auratus) An estimated 437,329 (± 166,107) Snapper were caught by SA residents throughout South Australia in 2013/14, with 207,809 (± 79,894) of these harvested (as per Table 12 ~ 332 tonnes) and 229,520 (± 89,122) released representing a release rate of 52.5% (Table 8). These results can be compared with 384,077 caught in 2007/08 with 97,010 harvested and 287,067 released representing a release rate of 74.7%.
Snapper were caught in all marine waters of the state with high numbers (total, harvested and released) in the Gulfs, and most significantly in the Gulf St Vincent and KI region (Figure 12 A, B and C). The harvested Snapper in the Gulf St Vincent and KI region combined with the Spencer Gulf region accounted for 90% of the state’s harvest of Snapper.
Line fishing (bait or lure) was the main method of capture (99.4%), with the remainder (0.6%) caught by spearfishing and trapping. Boat-based fishers dominated the numbers of Snapper harvested and released (Figure 12 D).
Figure 12: Regional proportional (%) catches of Snapper in SA by recreational fishers, aged 5 years or older in 2013/14; A: total numbers; B: harvested numbers; C: released numbers and D: proportion (%) of catch harvested or released by boat or shore-based fishers.
SA recreational fishing survey 2013/14 35
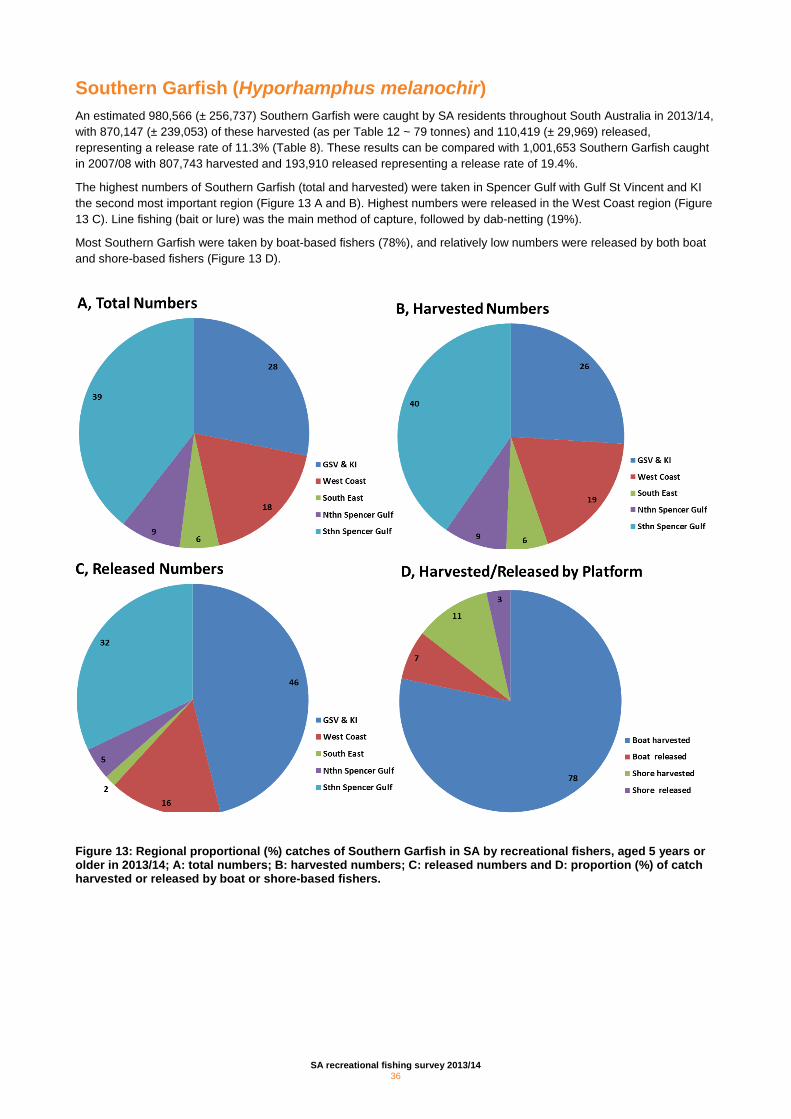
Southern Garfish (Hyporhamphus melanochir) An estimated 980,566 (± 256,737) Southern Garfish were caught by SA residents throughout South Australia in 2013/14, with 870,147 (± 239,053) of these harvested (as per Table 12 ~ 79 tonnes) and 110,419 (± 29,969) released, representing a release rate of 11.3% (Table 8). These results can be compared with 1,001,653 Southern Garfish caught in 2007/08 with 807,743 harvested and 193,910 released representing a release rate of 19.4%.
The highest numbers of Southern Garfish (total and harvested) were taken in Spencer Gulf with Gulf St Vincent and KI the second most important region (Figure 13 A and B). Highest numbers were released in the West Coast region (Figure 13 C). Line fishing (bait or lure) was the main method of capture, followed by dab-netting (19%).
Most Southern Garfish were taken by boat-based fishers (78%), and relatively low numbers were released by both boat and shore-based fishers (Figure 13 D).
Figure 13: Regional proportional (%) catches of Southern Garfish in SA by recreational fishers, aged 5 years or older in 2013/14; A: total numbers; B: harvested numbers; C: released numbers and D: proportion (%) of catch harvested or released by boat or shore-based fishers.
SA recreational fishing survey 2013/14 36
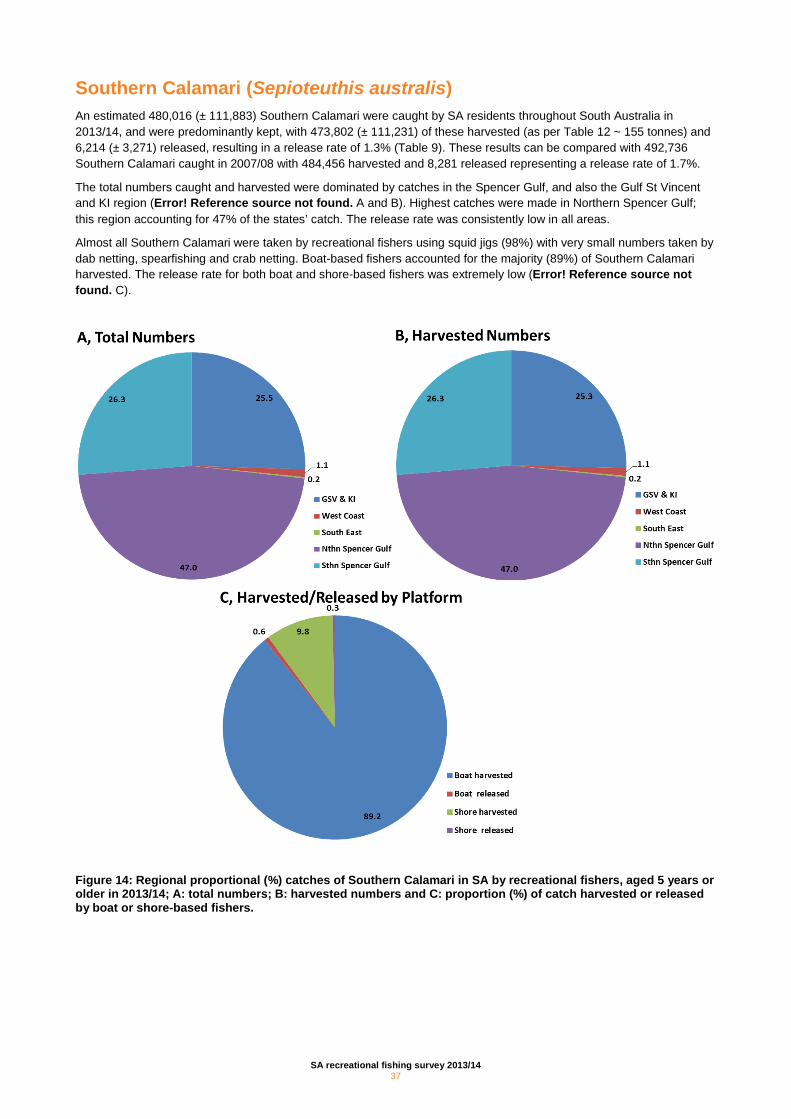
Southern Calamari (Sepioteuthis australis) An estimated 480,016 (± 111,883) Southern Calamari were caught by SA residents throughout South Australia in 2013/14, and were predominantly kept, with 473,802 (± 111,231) of these harvested (as per Table 12 ~ 155 tonnes) and 6,214 (± 3,271) released, resulting in a release rate of 1.3% (Table 9). These results can be compared with 492,736 Southern Calamari caught in 2007/08 with 484,456 harvested and 8,281 released representing a release rate of 1.7%.
The total numbers caught and harvested were dominated by catches in the Spencer Gulf, and also the Gulf St Vincent and KI region (Error! Reference source not found. A and B). Highest catches were made in Northern Spencer Gulf; this region accounting for 47% of the states’ catch. The release rate was consistently low in all areas.
Almost all Southern Calamari were taken by recreational fishers using squid jigs (98%) with very small numbers taken by dab netting, spearfishing and crab netting. Boat-based fishers accounted for the majority (89%) of Southern Calamari harvested. The release rate for both boat and shore-based fishers was extremely low (Error! Reference source not found. C).
Figure 14: Regional proportional (%) catches of Southern Calamari in SA by recreational fishers, aged 5 years or older in 2013/14; A: total numbers; B: harvested numbers and C: proportion (%) of catch harvested or released by boat or shore-based fishers.
SA recreational fishing survey 2013/14 37
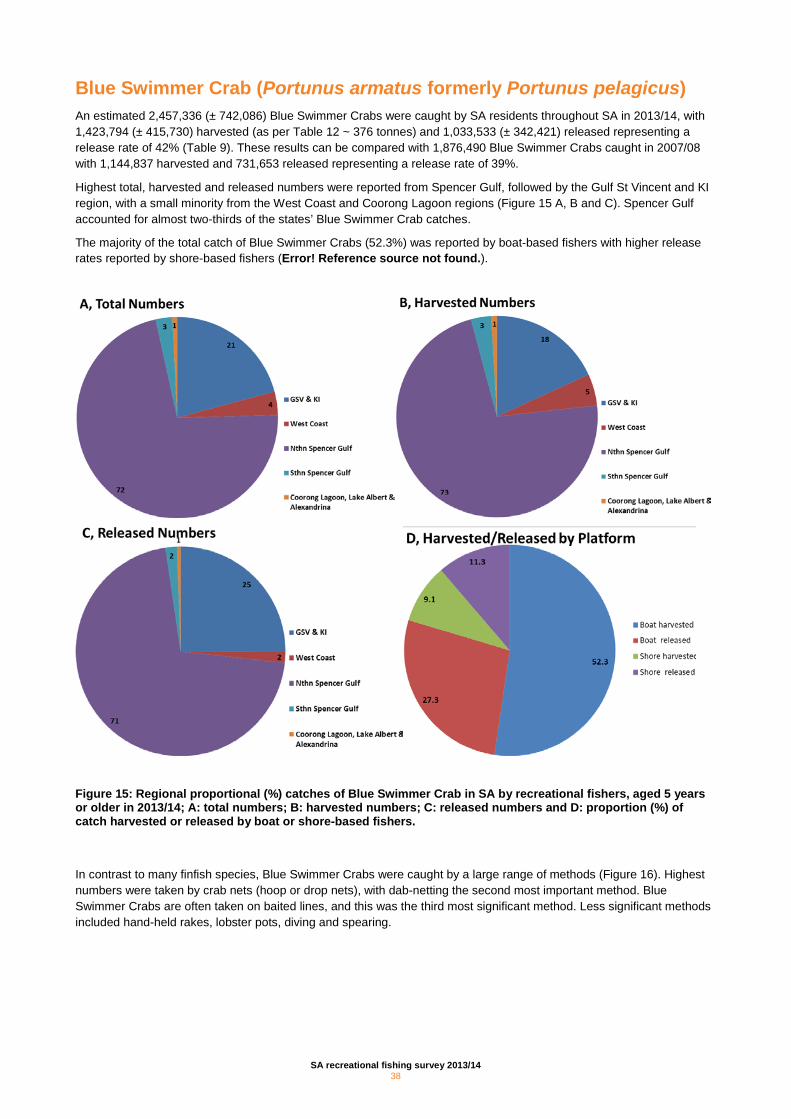
Blue Swimmer Crab (Portunus armatus formerly Portunus pelagicus) An estimated 2,457,336 (± 742,086) Blue Swimmer Crabs were caught by SA residents throughout SA in 2013/14, with 1,423,794 (± 415,730) harvested (as per Table 12 ~ 376 tonnes) and 1,033,533 (± 342,421) released representing a release rate of 42% (Table 9). These results can be compared with 1,876,490 Blue Swimmer Crabs caught in 2007/08 with 1,144,837 harvested and 731,653 released representing a release rate of 39%.
Highest total, harvested and released numbers were reported from Spencer Gulf, followed by the Gulf St Vincent and KI region, with a small minority from the West Coast and Coorong Lagoon regions (Figure 15 A, B and C). Spencer Gulf accounted for almost two-thirds of the states’ Blue Swimmer Crab catches.
The majority of the total catch of Blue Swimmer Crabs (52.3%) was reported by boat-based fishers with higher release rates reported by shore-based fishers (Error! Reference source not found.).
Figure 15: Regional proportional (%) catches of Blue Swimmer Crab in SA by recreational fishers, aged 5 years or older in 2013/14; A: total numbers; B: harvested numbers; C: released numbers and D: proportion (%) of catch harvested or released by boat or shore-based fishers.
In contrast to many finfish species, Blue Swimmer Crabs were caught by a large range of methods (Figure 16). Highest numbers were taken by crab nets (hoop or drop nets), with dab-netting the second most important method. Blue Swimmer Crabs are often taken on baited lines, and this was the third most significant method. Less significant methods included hand-held rakes, lobster pots, diving and spearing.
SA recreational fishing survey 2013/14 38
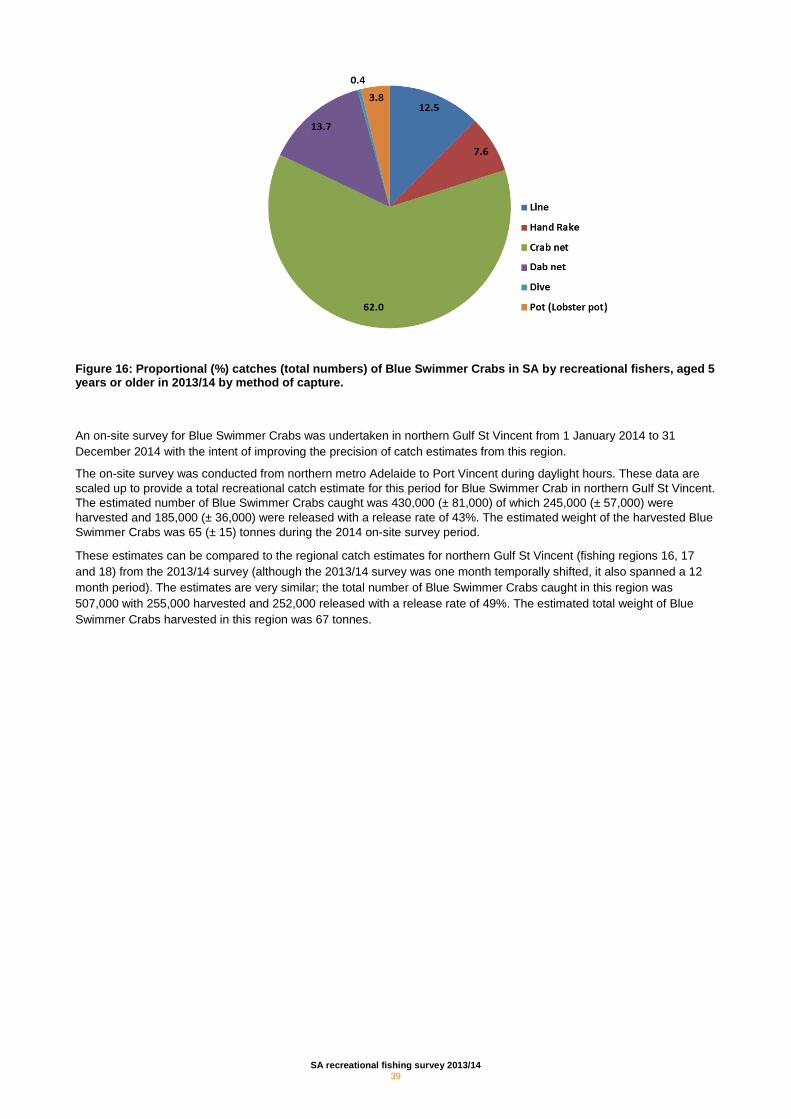
Figure 16: Proportional (%) catches (total numbers) of Blue Swimmer Crabs in SA by recreational fishers, aged 5 years or older in 2013/14 by method of capture.
An on-site survey for Blue Swimmer Crabs was undertaken in northern Gulf St Vincent from 1 January 2014 to 31 December 2014 with the intent of improving the precision of catch estimates from this region.
The on-site survey was conducted from northern metro Adelaide to Port Vincent during daylight hours. These data are scaled up to provide a total recreational catch estimate for this period for Blue Swimmer Crab in northern Gulf St Vincent. The estimated number of Blue Swimmer Crabs caught was 430,000 (± 81,000) of which 245,000 (± 57,000) were harvested and 185,000 (± 36,000) were released with a release rate of 43%. The estimated weight of the harvested Blue Swimmer Crabs was 65 (± 15) tonnes during the 2014 on-site survey period.
These estimates can be compared to the regional catch estimates for northern Gulf St Vincent (fishing regions 16, 17 and 18) from the 2013/14 survey (although the 2013/14 survey was one month temporally shifted, it also spanned a 12 month period). The estimates are very similar; the total number of Blue Swimmer Crabs caught in this region was 507,000 with 255,000 harvested and 252,000 released with a release rate of 49%. The estimated total weight of Blue Swimmer Crabs harvested in this region was 67 tonnes.
SA recreational fishing survey 2013/14 39
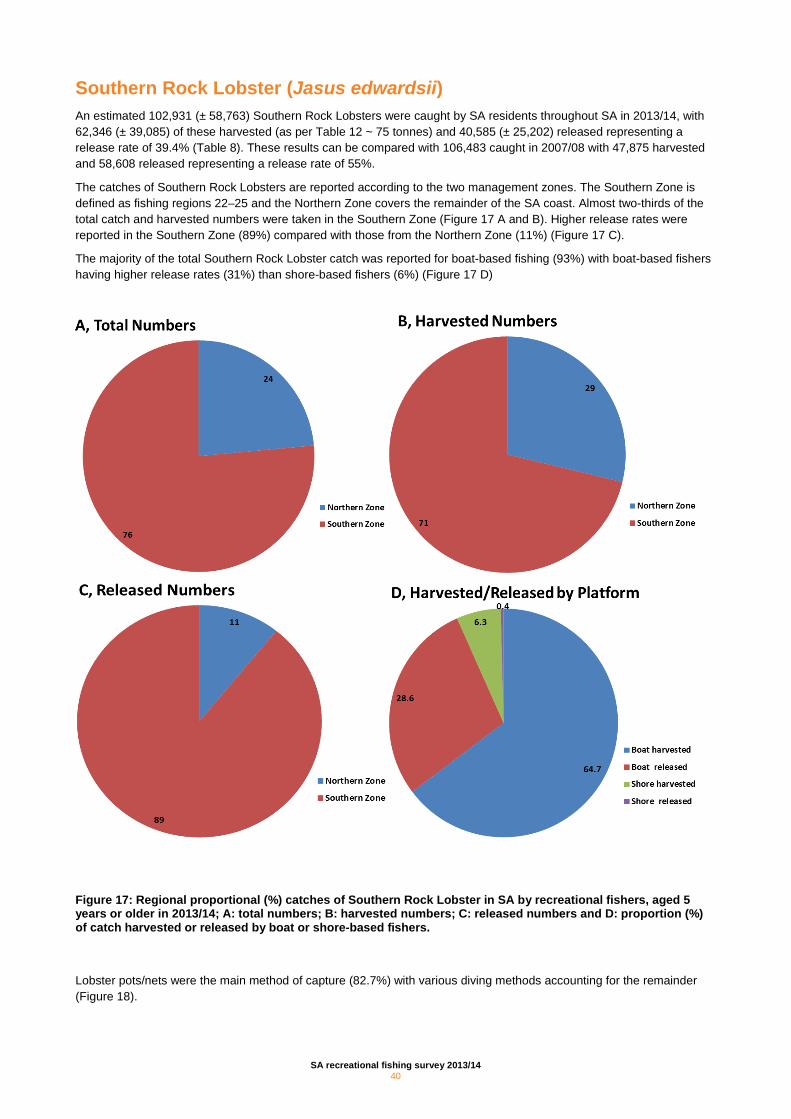
Southern Rock Lobster (Jasus edwardsii) An estimated 102,931 (± 58,763) Southern Rock Lobsters were caught by SA residents throughout SA in 2013/14, with 62,346 (± 39,085) of these harvested (as per Table 12 ~ 75 tonnes) and 40,585 (± 25,202) released representing a release rate of 39.4% (Table 8). These results can be compared with 106,483 caught in 2007/08 with 47,875 harvested and 58,608 released representing a release rate of 55%.
The catches of Southern Rock Lobsters are reported according to the two management zones. The Southern Zone is defined as fishing regions 22–25 and the Northern Zone covers the remainder of the SA coast. Almost two-thirds of the total catch and harvested numbers were taken in the Southern Zone (Figure 17 A and B). Higher release rates were reported in the Southern Zone (89%) compared with those from the Northern Zone (11%) (Figure 17 C).
The majority of the total Southern Rock Lobster catch was reported for boat-based fishing (93%) with boat-based fishers having higher release rates (31%) than shore-based fishers (6%) (Figure 17 D)
Figure 17: Regional proportional (%) catches of Southern Rock Lobster in SA by recreational fishers, aged 5 years or older in 2013/14; A: total numbers; B: harvested numbers; C: released numbers and D: proportion (%) of catch harvested or released by boat or shore-based fishers.
Lobster pots/nets were the main method of capture (82.7%) with various diving methods accounting for the remainder (Figure 18).
SA recreational fishing survey 2013/14 40
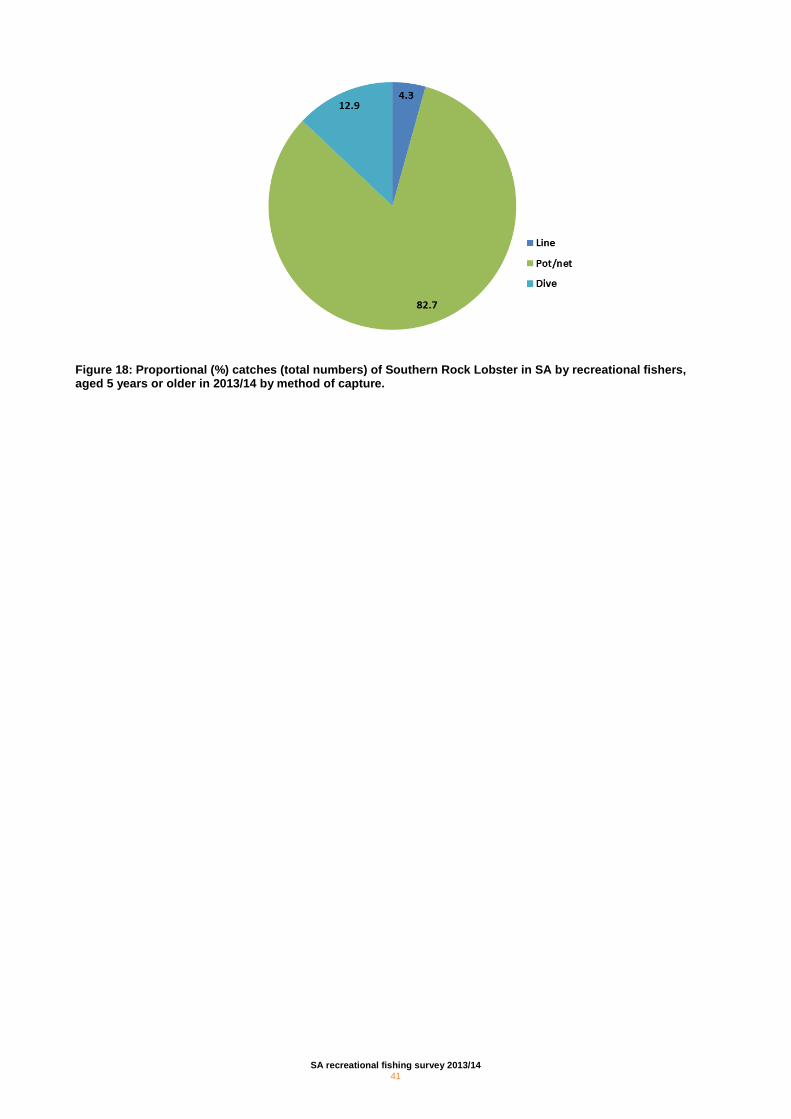
Figure 18: Proportional (%) catches (total numbers) of Southern Rock Lobster in SA by recreational fishers, aged 5 years or older in 2013/14 by method of capture.
SA recreational fishing survey 2013/14 41
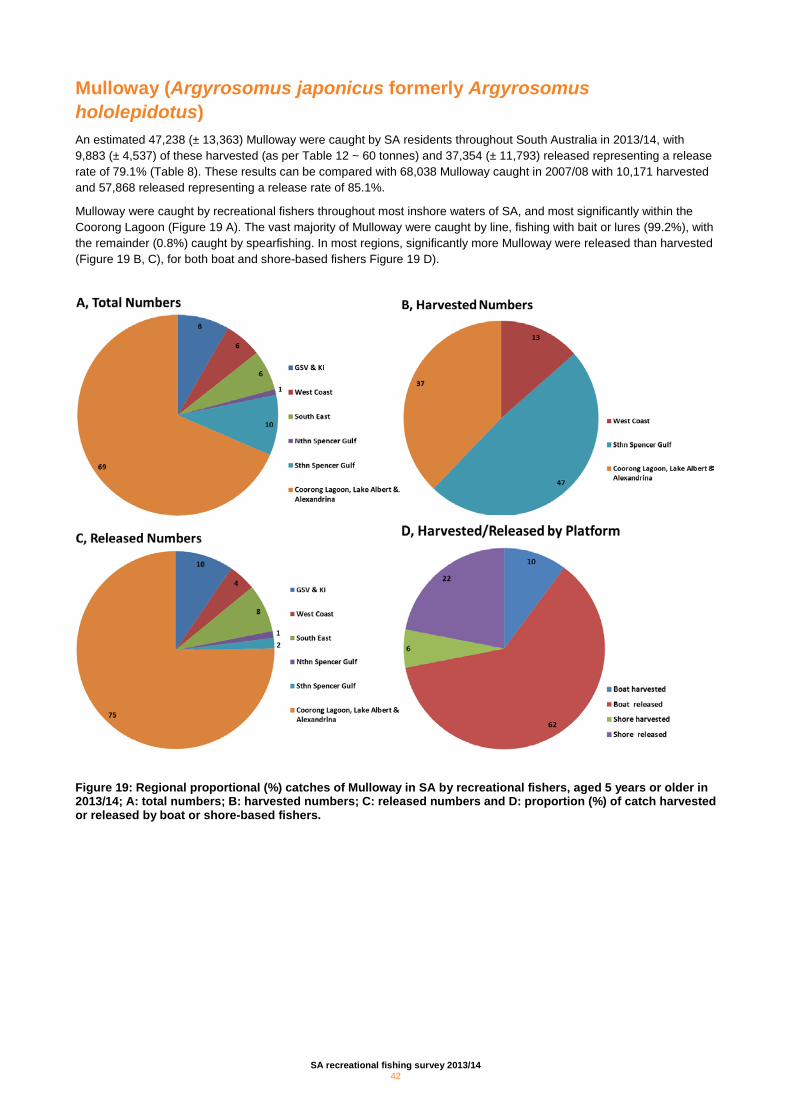
Mulloway (Argyrosomus japonicus formerly Argyrosomus hololepidotus) An estimated 47,238 (± 13,363) Mulloway were caught by SA residents throughout South Australia in 2013/14, with 9,883 (± 4,537) of these harvested (as per Table 12 ~ 60 tonnes) and 37,354 (± 11,793) released representing a release rate of 79.1% (Table 8). These results can be compared with 68,038 Mulloway caught in 2007/08 with 10,171 harvested and 57,868 released representing a release rate of 85.1%.
Mulloway were caught by recreational fishers throughout most inshore waters of SA, and most significantly within the Coorong Lagoon (Figure 19 A). The vast majority of Mulloway were caught by line, fishing with bait or lures (99.2%), with the remainder (0.8%) caught by spearfishing. In most regions, significantly more Mulloway were released than harvested (Figure 19 B, C), for both boat and shore-based fishers Figure 19 D).
Figure 19: Regional proportional (%) catches of Mulloway in SA by recreational fishers, aged 5 years or older in 2013/14; A: total numbers; B: harvested numbers; C: released numbers and D: proportion (%) of catch harvested or released by boat or shore-based fishers.
SA recreational fishing survey 2013/14 42
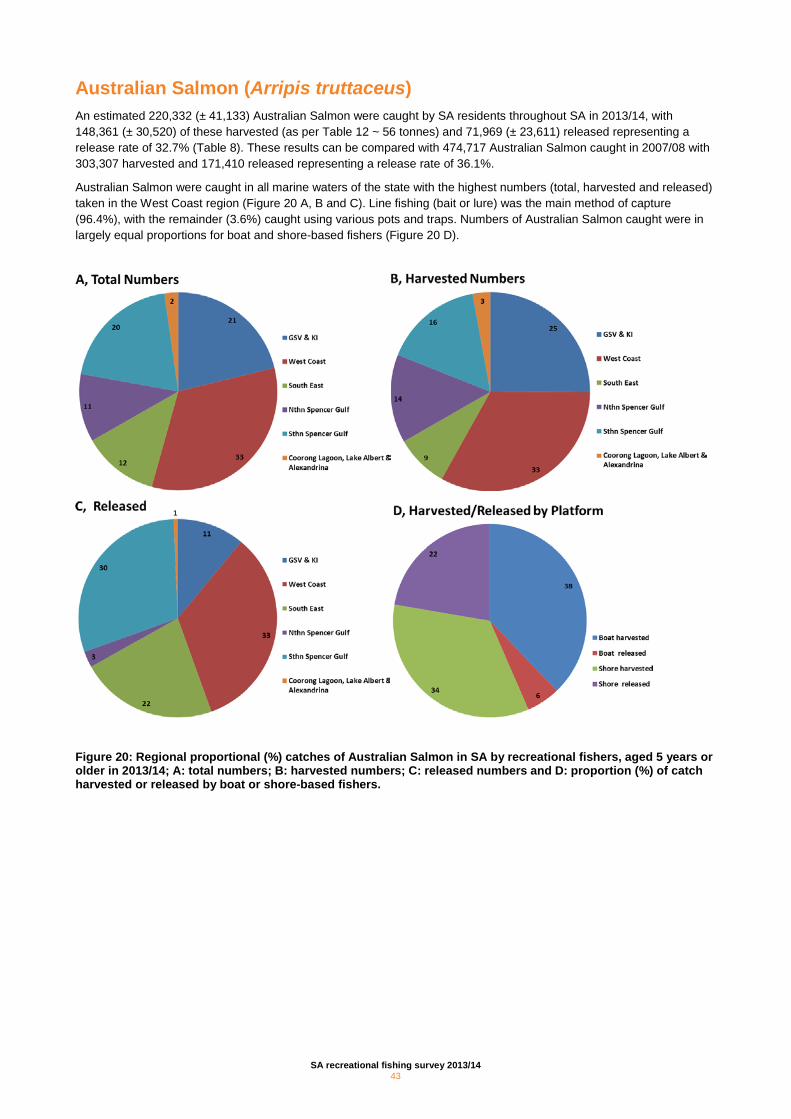
Australian Salmon (Arripis truttaceus) An estimated 220,332 (± 41,133) Australian Salmon were caught by SA residents throughout SA in 2013/14, with 148,361 (± 30,520) of these harvested (as per Table 12 ~ 56 tonnes) and 71,969 (± 23,611) released representing a release rate of 32.7% (Table 8). These results can be compared with 474,717 Australian Salmon caught in 2007/08 with 303,307 harvested and 171,410 released representing a release rate of 36.1%.
Australian Salmon were caught in all marine waters of the state with the highest numbers (total, harvested and released) taken in the West Coast region (Figure 20 A, B and C). Line fishing (bait or lure) was the main method of capture (96.4%), with the remainder (3.6%) caught using various pots and traps. Numbers of Australian Salmon caught were in largely equal proportions for boat and shore-based fishers (Figure 20 D).
Figure 20: Regional proportional (%) catches of Australian Salmon in SA by recreational fishers, aged 5 years or older in 2013/14; A: total numbers; B: harvested numbers; C: released numbers and D: proportion (%) of catch harvested or released by boat or shore-based fishers.
SA recreational fishing survey 2013/14 43
Pipi (Plebidonax deltoids) Throughout the state, an estimated 1,076,368 (± 808,357) Pipi (Goolwa Cockle) were caught by SA residents in 2013/14 with 378,158 (± 237,172) harvested (as per Table 12 ~ 3.8 tonnes) and 698,233 (± 656,657) released representing a release rate of 64.9% (Table 9). These results can be compared with 312,479 Pipi caught in 2007/08 with 316,107 harvested and 6,371 released representing a release rate of 2.1%. For both surveys Pipi were taken from the Goolwa beach region (region 19). Although small quantities of Pipi were reportedly taken in fishing regions 6 and 22 in the 2007/08 survey, this was not reported in 2013/14.
Due to the consistently low sample size of localised fishers in this type of survey, these results have low precision (i.e. the 2007/08 survey 95% confidence limit was greater than 80% of the original estimate), an undertaking resulted from the 2007/08 survey to augment Pipi catch estimates from the 2013/14 survey with a localised on-site survey at Goolwa over the fishery open season period from December 2013 to May 2014. From this on-site survey (details reported in Hall et al 2014) the estimated number of Pipi caught during the 2013/14 fishing season was 3.24 million (± 1.09) and the estimated weight of the Pipi harvest was 33 tonnes (± 11.00). An interesting observation from the on-site survey at Goolwa is that in this fishery, females are almost participating as much as males. This study also found that most fishers are travelling from inner city regions.
SA recreational fishing survey 2013/14 44
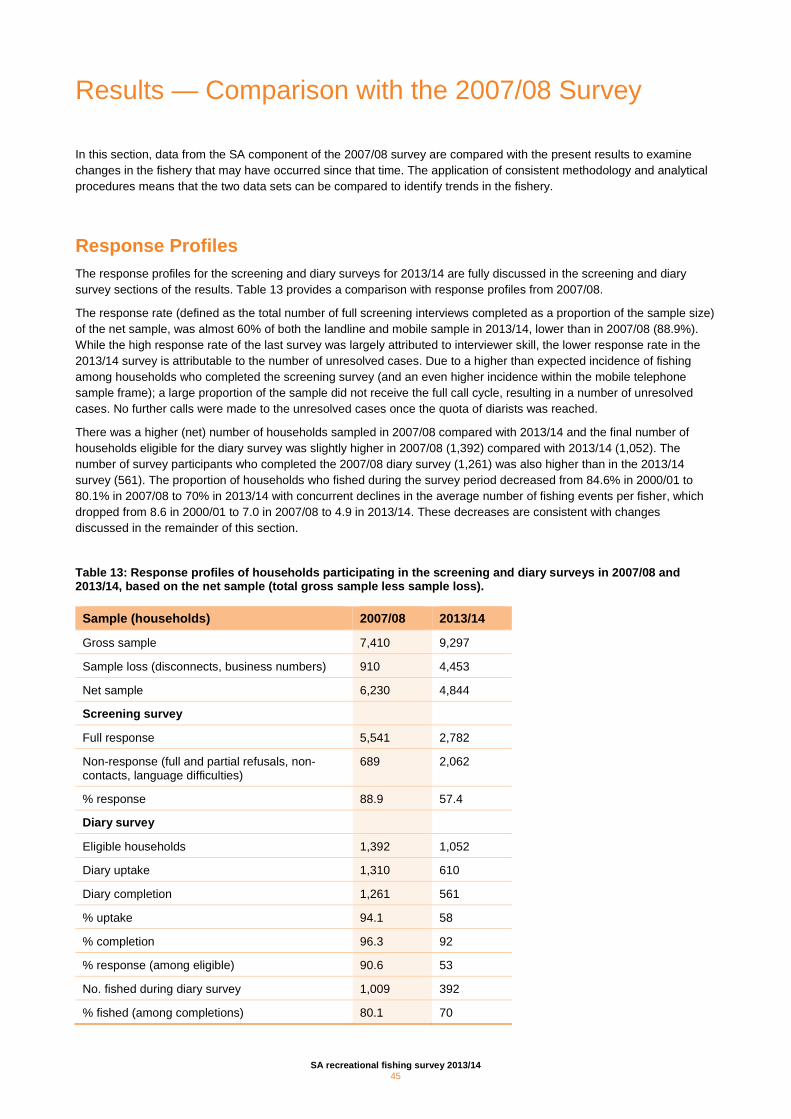
Results — Comparison with the 2007/08 Survey
In this section, data from the SA component of the 2007/08 survey are compared with the present results to examine changes in the fishery that may have occurred since that time. The application of consistent methodology and analytical procedures means that the two data sets can be compared to identify trends in the fishery.
Response Profiles The response profiles for the screening and diary surveys for 2013/14 are fully discussed in the screening and diary survey sections of the results. Table 13 provides a comparison with response profiles from 2007/08.
The response rate (defined as the total number of full screening interviews completed as a proportion of the sample size) of the net sample, was almost 60% of both the landline and mobile sample in 2013/14, lower than in 2007/08 (88.9%). While the high response rate of the last survey was largely attributed to interviewer skill, the lower response rate in the 2013/14 survey is attributable to the number of unresolved cases. Due to a higher than expected incidence of fishing among households who completed the screening survey (and an even higher incidence within the mobile telephone sample frame); a large proportion of the sample did not receive the full call cycle, resulting in a number of unresolved cases. No further calls were made to the unresolved cases once the quota of diarists was reached.
There was a higher (net) number of households sampled in 2007/08 compared with 2013/14 and the final number of households eligible for the diary survey was slightly higher in 2007/08 (1,392) compared with 2013/14 (1,052). The number of survey participants who completed the 2007/08 diary survey (1,261) was also higher than in the 2013/14 survey (561). The proportion of households who fished during the survey period decreased from 84.6% in 2000/01 to 80.1% in 2007/08 to 70% in 2013/14 with concurrent declines in the average number of fishing events per fisher, which dropped from 8.6 in 2000/01 to 7.0 in 2007/08 to 4.9 in 2013/14. These decreases are consistent with changes discussed in the remainder of this section.
Table 13: Response profiles of households participating in the screening and diary surveys in 2007/08 and 2013/14, based on the net sample (total gross sample less sample loss).
Sample (households) 2007/08 2013/14
Gross sample 7,410 9,297
Sample loss (disconnects, business numbers) 910 4,453
Net sample 6,230 4,844
Screening survey
Full response 5,541 2,782
Non-response (full and partial refusals, non-contacts, language difficulties)
689 2,062
% response 88.9 57.4
Diary survey
Eligible households 1,392 1,052
Diary uptake 1,310 610
Diary completion 1,261 561
% uptake 94.1 58
% completion 96.3 92
% response (among eligible) 90.6 53
No. fished during diary survey 1,009 392
% fished (among completions) 80.1 70
SA recreational fishing survey 2013/14 45
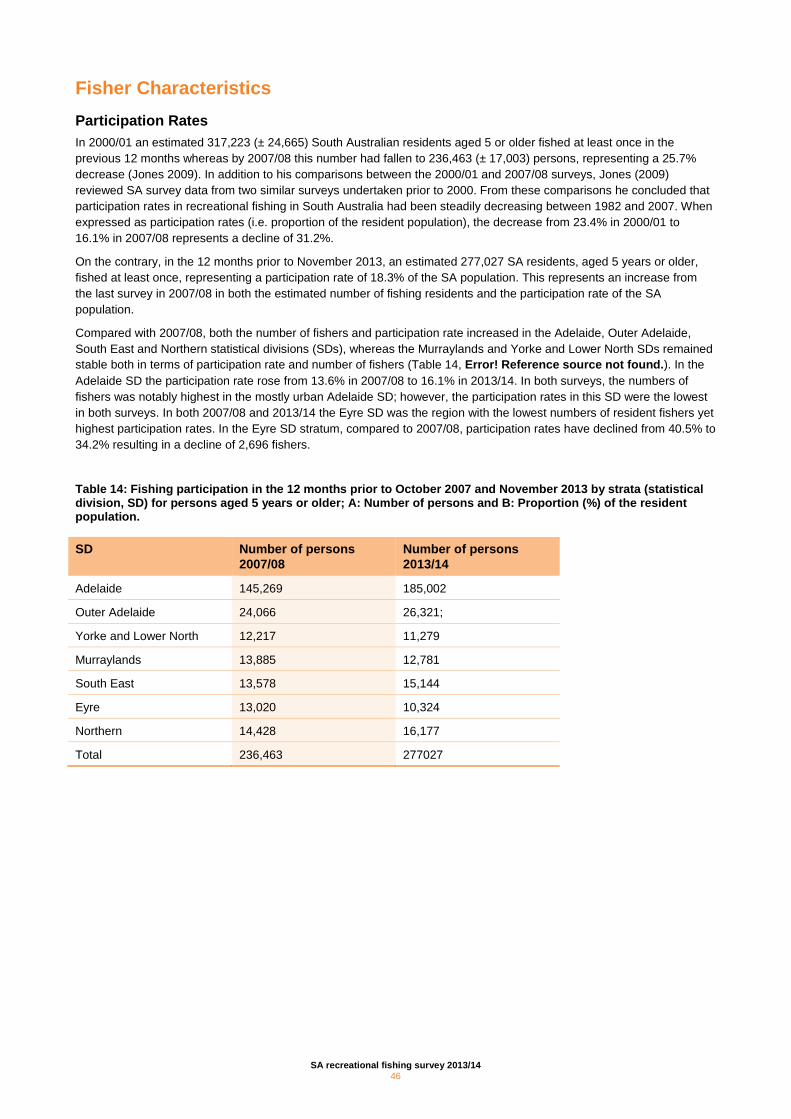
Fisher Characteristics Participation Rates In 2000/01 an estimated 317,223 (± 24,665) South Australian residents aged 5 or older fished at least once in the previous 12 months whereas by 2007/08 this number had fallen to 236,463 (± 17,003) persons, representing a 25.7% decrease (Jones 2009). In addition to his comparisons between the 2000/01 and 2007/08 surveys, Jones (2009) reviewed SA survey data from two similar surveys undertaken prior to 2000. From these comparisons he concluded that participation rates in recreational fishing in South Australia had been steadily decreasing between 1982 and 2007. When expressed as participation rates (i.e. proportion of the resident population), the decrease from 23.4% in 2000/01 to 16.1% in 2007/08 represents a decline of 31.2%.
On the contrary, in the 12 months prior to November 2013, an estimated 277,027 SA residents, aged 5 years or older, fished at least once, representing a participation rate of 18.3% of the SA population. This represents an increase from the last survey in 2007/08 in both the estimated number of fishing residents and the participation rate of the SA population.
Compared with 2007/08, both the number of fishers and participation rate increased in the Adelaide, Outer Adelaide, South East and Northern statistical divisions (SDs), whereas the Murraylands and Yorke and Lower North SDs remained stable both in terms of participation rate and number of fishers (Table 14, Error! Reference source not found.). In the Adelaide SD the participation rate rose from 13.6% in 2007/08 to 16.1% in 2013/14. In both surveys, the numbers of fishers was notably highest in the mostly urban Adelaide SD; however, the participation rates in this SD were the lowest in both surveys. In both 2007/08 and 2013/14 the Eyre SD was the region with the lowest numbers of resident fishers yet highest participation rates. In the Eyre SD stratum, compared to 2007/08, participation rates have declined from 40.5% to 34.2% resulting in a decline of 2,696 fishers.
Table 14: Fishing participation in the 12 months prior to October 2007 and November 2013 by strata (statistical division, SD) for persons aged 5 years or older; A: Number of persons and B: Proportion (%) of the resident population.
SD Number of persons 2007/08
Number of persons 2013/14
Adelaide 145,269 185,002
Outer Adelaide 24,066 26,321;
Yorke and Lower North 12,217 11,279
Murraylands 13,885 12,781
South East 13,578 15,144
Eyre 13,020 10,324
Northern 14,428 16,177
Total 236,463 277027
SA recreational fishing survey 2013/14 46
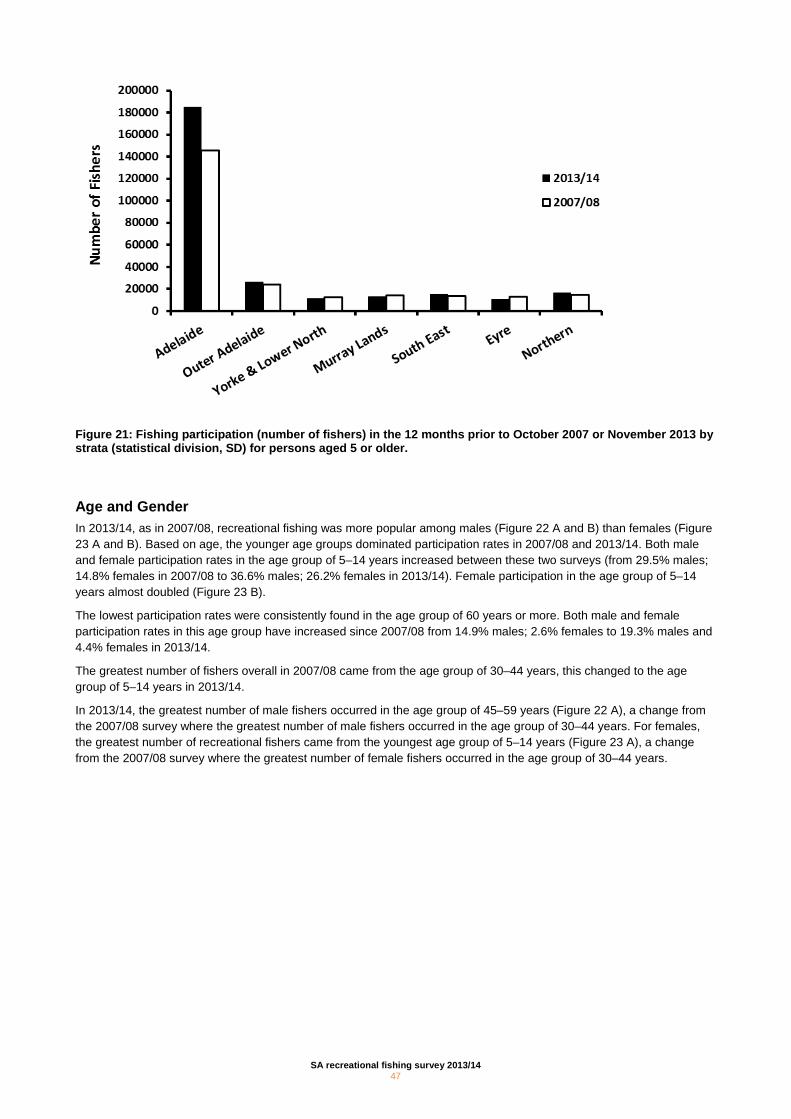
Figure 21: Fishing participation (number of fishers) in the 12 months prior to October 2007 or November 2013 by strata (statistical division, SD) for persons aged 5 or older.
Age and Gender In 2013/14, as in 2007/08, recreational fishing was more popular among males (Figure 22 A and B) than females (Figure 23 A and B). Based on age, the younger age groups dominated participation rates in 2007/08 and 2013/14. Both male and female participation rates in the age group of 5–14 years increased between these two surveys (from 29.5% males; 14.8% females in 2007/08 to 36.6% males; 26.2% females in 2013/14). Female participation in the age group of 5–14 years almost doubled (Figure 23 B).
The lowest participation rates were consistently found in the age group of 60 years or more. Both male and female participation rates in this age group have increased since 2007/08 from 14.9% males; 2.6% females to 19.3% males and 4.4% females in 2013/14.
The greatest number of fishers overall in 2007/08 came from the age group of 30–44 years, this changed to the age group of 5–14 years in 2013/14.
In 2013/14, the greatest number of male fishers occurred in the age group of 45–59 years (Figure 22 A), a change from the 2007/08 survey where the greatest number of male fishers occurred in the age group of 30–44 years. For females, the greatest number of recreational fishers came from the youngest age group of 5–14 years (Figure 23 A), a change from the 2007/08 survey where the greatest number of female fishers occurred in the age group of 30–44 years.
SA recreational fishing survey 2013/14 47
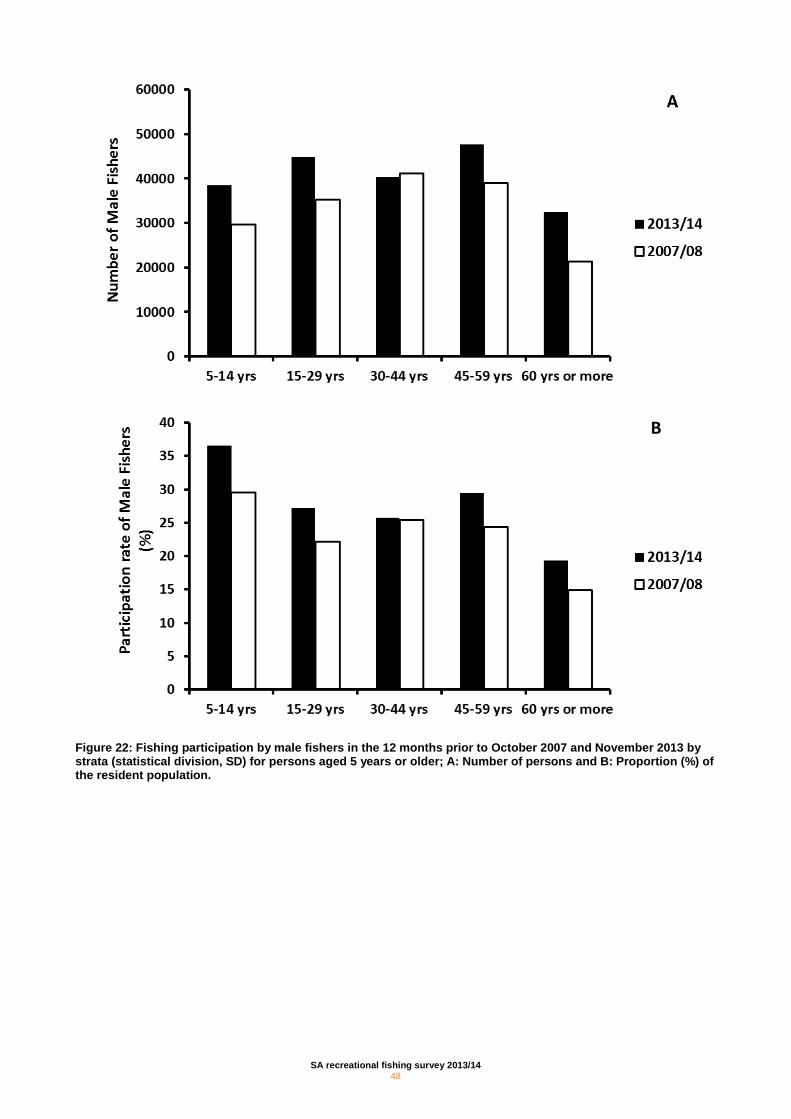
Figure 22: Fishing participation by male fishers in the 12 months prior to October 2007 and November 2013 by strata (statistical division, SD) for persons aged 5 years or older; A: Number of persons and B: Proportion (%) of the resident population.
SA recreational fishing survey 2013/14 48
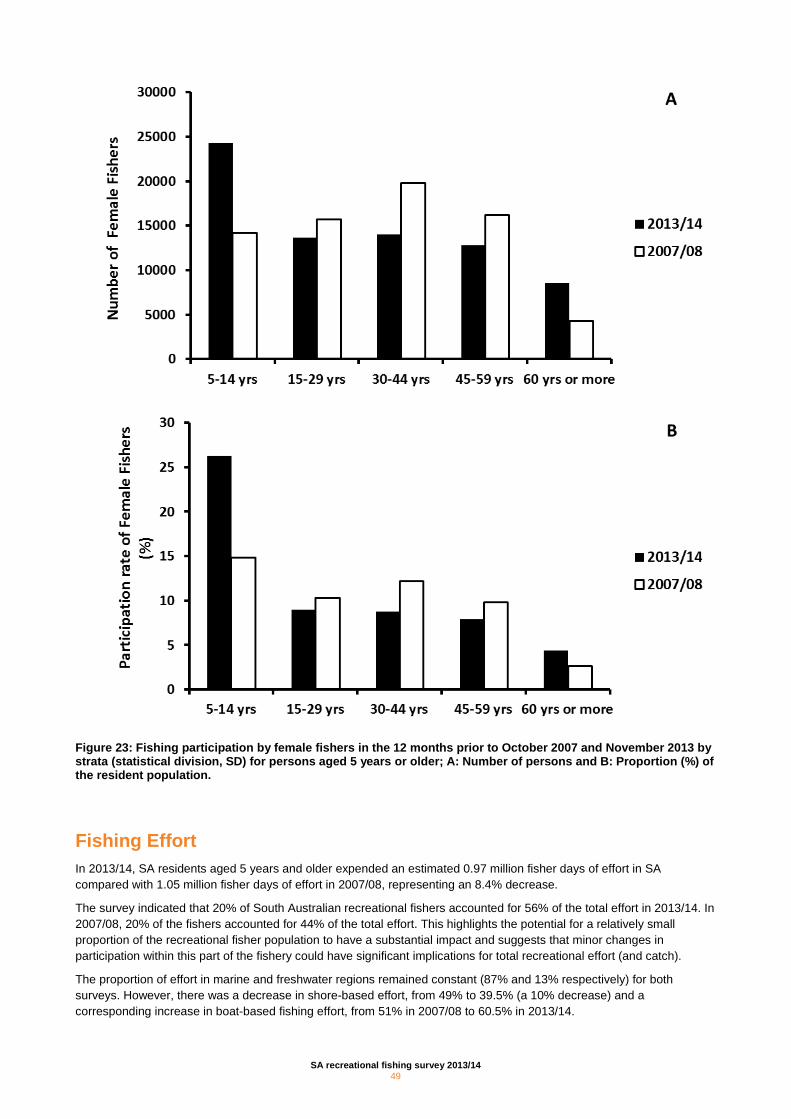
Figure 23: Fishing participation by female fishers in the 12 months prior to October 2007 and November 2013 by strata (statistical division, SD) for persons aged 5 years or older; A: Number of persons and B: Proportion (%) of the resident population.
Fishing Effort In 2013/14, SA residents aged 5 years and older expended an estimated 0.97 million fisher days of effort in SA compared with 1.05 million fisher days of effort in 2007/08, representing an 8.4% decrease.
The survey indicated that 20% of South Australian recreational fishers accounted for 56% of the total effort in 2013/14. In 2007/08, 20% of the fishers accounted for 44% of the total effort. This highlights the potential for a relatively small proportion of the recreational fisher population to have a substantial impact and suggests that minor changes in participation within this part of the fishery could have significant implications for total recreational effort (and catch).
The proportion of effort in marine and freshwater regions remained constant (87% and 13% respectively) for both surveys. However, there was a decrease in shore-based effort, from 49% to 39.5% (a 10% decrease) and a corresponding increase in boat-based fishing effort, from 51% in 2007/08 to 60.5% in 2013/14.
SA recreational fishing survey 2013/14 49
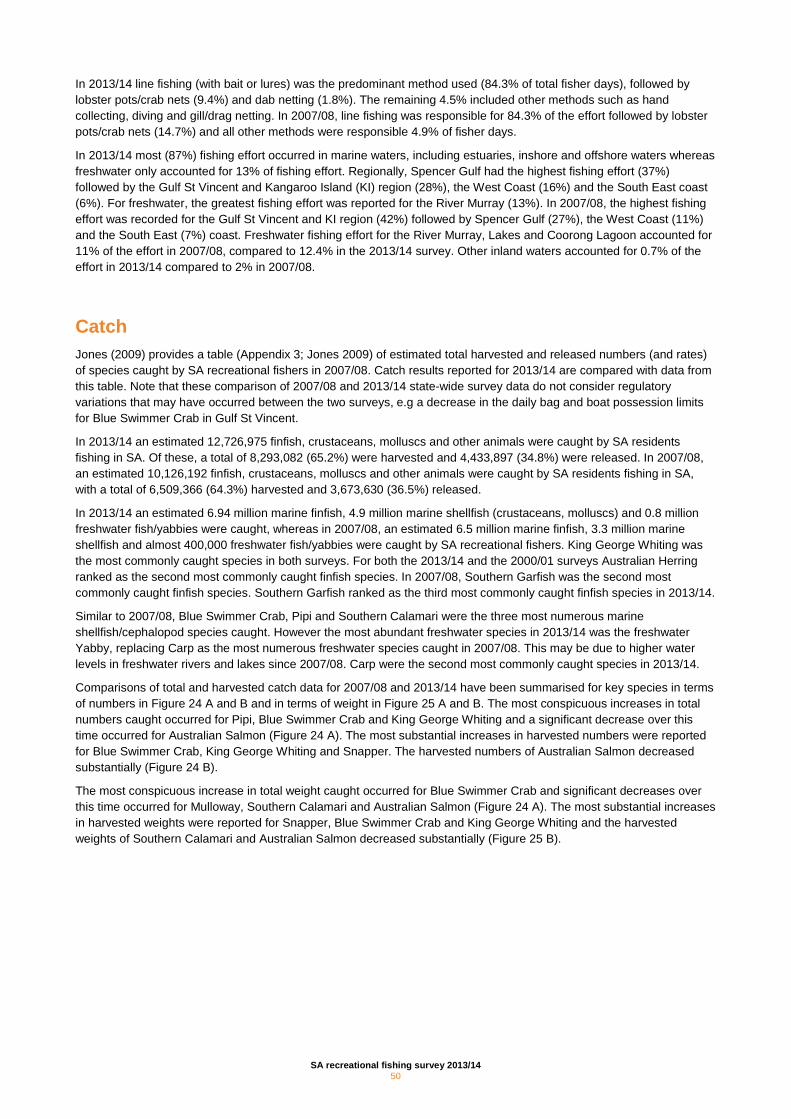
In 2013/14 line fishing (with bait or lures) was the predominant method used (84.3% of total fisher days), followed by lobster pots/crab nets (9.4%) and dab netting (1.8%). The remaining 4.5% included other methods such as hand collecting, diving and gill/drag netting. In 2007/08, line fishing was responsible for 84.3% of the effort followed by lobster pots/crab nets (14.7%) and all other methods were responsible 4.9% of fisher days.
In 2013/14 most (87%) fishing effort occurred in marine waters, including estuaries, inshore and offshore waters whereas freshwater only accounted for 13% of fishing effort. Regionally, Spencer Gulf had the highest fishing effort (37%) followed by the Gulf St Vincent and Kangaroo Island (KI) region (28%), the West Coast (16%) and the South East coast (6%). For freshwater, the greatest fishing effort was reported for the River Murray (13%). In 2007/08, the highest fishing effort was recorded for the Gulf St Vincent and KI region (42%) followed by Spencer Gulf (27%), the West Coast (11%) and the South East (7%) coast. Freshwater fishing effort for the River Murray, Lakes and Coorong Lagoon accounted for 11% of the effort in 2007/08, compared to 12.4% in the 2013/14 survey. Other inland waters accounted for 0.7% of the effort in 2013/14 compared to 2% in 2007/08.
Catch Jones (2009) provides a table (Appendix 3; Jones 2009) of estimated total harvested and released numbers (and rates) of species caught by SA recreational fishers in 2007/08. Catch results reported for 2013/14 are compared with data from this table. Note that these comparison of 2007/08 and 2013/14 state-wide survey data do not consider regulatory variations that may have occurred between the two surveys, e.g a decrease in the daily bag and boat possession limits for Blue Swimmer Crab in Gulf St Vincent.
In 2013/14 an estimated 12,726,975 finfish, crustaceans, molluscs and other animals were caught by SA residents fishing in SA. Of these, a total of 8,293,082 (65.2%) were harvested and 4,433,897 (34.8%) were released. In 2007/08, an estimated 10,126,192 finfish, crustaceans, molluscs and other animals were caught by SA residents fishing in SA, with a total of 6,509,366 (64.3%) harvested and 3,673,630 (36.5%) released.
In 2013/14 an estimated 6.94 million marine finfish, 4.9 million marine shellfish (crustaceans, molluscs) and 0.8 million freshwater fish/yabbies were caught, whereas in 2007/08, an estimated 6.5 million marine finfish, 3.3 million marine shellfish and almost 400,000 freshwater fish/yabbies were caught by SA recreational fishers. King George Whiting was the most commonly caught species in both surveys. For both the 2013/14 and the 2000/01 surveys Australian Herring ranked as the second most commonly caught finfish species. In 2007/08, Southern Garfish was the second most commonly caught finfish species. Southern Garfish ranked as the third most commonly caught finfish species in 2013/14.
Similar to 2007/08, Blue Swimmer Crab, Pipi and Southern Calamari were the three most numerous marine shellfish/cephalopod species caught. However the most abundant freshwater species in 2013/14 was the freshwater Yabby, replacing Carp as the most numerous freshwater species caught in 2007/08. This may be due to higher water levels in freshwater rivers and lakes since 2007/08. Carp were the second most commonly caught species in 2013/14.
Comparisons of total and harvested catch data for 2007/08 and 2013/14 have been summarised for key species in terms of numbers in Figure 24 A and B and in terms of weight in Figure 25 A and B. The most conspicuous increases in total numbers caught occurred for Pipi, Blue Swimmer Crab and King George Whiting and a significant decrease over this time occurred for Australian Salmon (Figure 24 A). The most substantial increases in harvested numbers were reported for Blue Swimmer Crab, King George Whiting and Snapper. The harvested numbers of Australian Salmon decreased substantially (Figure 24 B).
The most conspicuous increase in total weight caught occurred for Blue Swimmer Crab and significant decreases over this time occurred for Mulloway, Southern Calamari and Australian Salmon (Figure 24 A). The most substantial increases in harvested weights were reported for Snapper, Blue Swimmer Crab and King George Whiting and the harvested weights of Southern Calamari and Australian Salmon decreased substantially (Figure 25 B).
SA recreational fishing survey 2013/14 50
Figure 24: Differences in A: total catch numbers and B: harvested catch numbers of key species between 2013/14 and 2007/08 for South Australian residents aged 5 years or older (Negative figures indicate decreases in catches from 2007/08 to 2013/14).
A
B
SA recreational fishing survey 2013/14 51
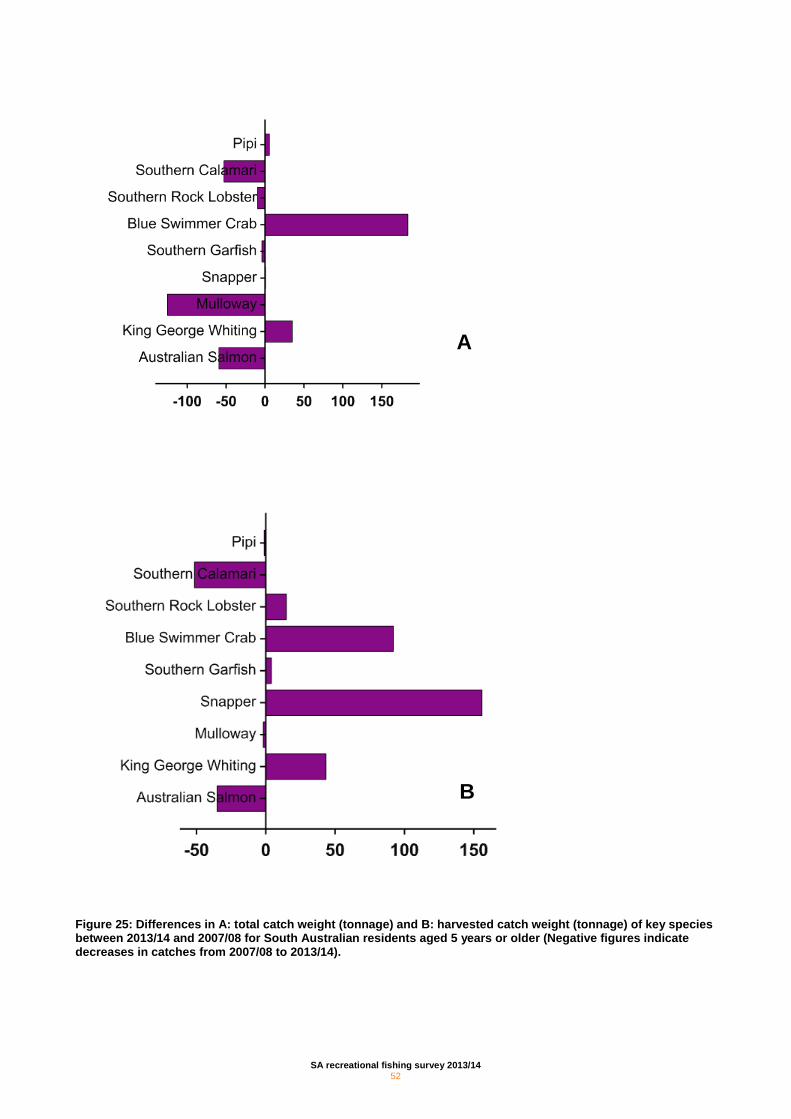
Figure 25: Differences in A: total catch weight (tonnage) and B: harvested catch weight (tonnage) of key species between 2013/14 and 2007/08 for South Australian residents aged 5 years or older (Negative figures indicate decreases in catches from 2007/08 to 2013/14).
A
B
SA recreational fishing survey 2013/14 52
Discussion
The 2013/14 survey of the SA Recreational Fishery is the third state-wide assessment of this fishery. It has provided researchers and fishery managers with estimates and accompanying SEs of a) the participation and demographic profiles of SA recreational fishers; and b) their fishing effort and catches (harvested and released numbers and harvest weights), with special emphasis on regional information for 9 key species.
Changes in Participation, Participation Rates and Fishing Effort In the 12 months prior to November 2013 a total of 277,027 SA residents recreationally fished at least once in SA, representing 18.3% of the SA resident population. The 2007/08 survey showed a slightly lower level of participation (236,463 SA residents) and a lower participation rate (16.2%). Thus, participation by SA residents in recreational fishing has increased slightly since the last survey. Males continue to have a higher participation rate than females. This increase is also driven by an increase in the participation rate of the youngest age group of females. The greatest number of male recreational fishers occurred in the age group of 45–59 years. This may be a response to the substantial decline in participation rates for 5–14 year olds in 2007/08, or it could reflect a societal trend for fathers in particular to spend more time fishing with their children. The number and level of participation for both males and females remains substantially lower than for the 2000/01 survey. The results indicate that while the participation rate has increased, the average number of fishing events per fisher (i.e. avidity) has steadily decreased.
There was a decrease in fishing effort from 1.01 million fisher days in 2007/08 to 0.97 million fisher days in 2013/14, with a proportionally higher rate of decrease for shore-based fishers compared to boat-based fishers. Popularity of boat-based fishing may be due to people having improved access to boats due to improved living standards. This trend is consistent with the previous survey. A combination of an increase in participation rate and decrease in fishing effort suggest fishers are fishing less frequently than previously.
The results also suggest that people are willing to travel further in order to go fishing. Spencer Gulf in particular had the highest level of fishing effort whereas the region closest to Adelaide (Gulf St Vincent/Kangaroo Island) showed a slight decrease in effort.
Validation of Estimates from Large Surveys It is important to develop a direct validation method to compare estimates with those obtained from such a large survey; however, direct validation of such estimates is difficult to undertake. Direct validation with comprehensive on-site surveys may be one option; however it may not be feasible due to prohibitive costs.
There are a number of alternative ways that the present estimates could be indirectly validated (compared) through the use of independent recreational or commercial catch and effort data (e.g. charter boat records). In SA, there are two recreationally important fisheries that are managed using gear registrations. Therefore, a cost-effectively selected number of recreational fishers could be regularly monitored.
Improving the Precision of Species Catch Estimates There are several ways precision can be discussed, however this report uses relative error (which is the percentage standard error of the estimate) of the estimate. The relative error of parameters relating to participation rate and participation numbers and fishing effort are very good (<10%), however the same is not true for some catch estimates. The rarely caught species tend to have very high relative errors as the numbers of fishers catching those species in the diary survey tends to be low. King George Whiting is the species with the lowest relative error which is expected given that it remains the most popular finfish species in South Australia. Other species which have a similarly low range of relative error are Australian Salmon, Australian Herring, Carp, Southern Calamari, Southern Garfish, Mulloway, Mullet and Blue Swimmer Crab. However, there were some species that were reported rarely by the fishers in the diary survey and they have a consequently high relative error (> 50%) such as Pipi, Abalone, Samsonfish, Yellowtail Kingfish, Yellowfin Tuna, Brown Trout and Rainbow Trout and some Shark species. Southern Bluefin Tuna, which were caught in substantially higher numbers than in the 2007/08 survey, had a relative error of 47%.
SA recreational fishing survey 2013/14 53
For localised fisheries like Pipi and Blue Swimmer Crab, on-site survey methods are known to improve the accuracy and precision of the catch and effort estimates. Therefore on-site surveys were conducted with the aim of providing statistically robust estimates (with improved precision) of the total recreational catch and effort for Pipi and Blue Swimmer Crab.
An alternative way to improve the precision of survey estimates is to increase the sample size of the screening and diary sample which ultimately would increase the overall cost of the project.
Interstate Component of Recreational Fishing in South Australia By design, the 2013/14 assessment of the SA recreational fishery does not include any estimates of catch and effort by interstate of residents or overseas visitors. Previous surveys (marine on-site surveys in 2007/08 and the 2000/01 survey) suggest an indicative figure of around 5% of the total fishing effort is likely to be derived from interstate residents.
Use of Estimates for Future Management of the Recreational Fishery and Resource Allocation Decisions The SA recreational fishery is traditionally managed by minimum/maximum size limits and personal daily bag and boat limits. Survey databases can potentially be analysed further to determine the effectiveness of these management tools. The overall release rate in this survey is slightly down from 2007/08. For example release rates for King George Whiting and Southern Garfish have decreased and are now at the level of release rates recorded during 2000/01. The release rate for Mulloway has also decreased but remains higher than that recorded for the 2000/01 survey.
While calculating harvest weight for various species, this report used the size frequency data from supplementary on-site surveys conducted during the 2013/14 diary period. Where size frequency of a species was not available, the published mean weight for that species from the 2007/08 survey was utilised in the harvest weight calculation. If the size frequency of a species has not changed, this method provides fisheries managers with a good approximation of the harvest weight. This study does not provide patterns of regional size/weight variation due to a lack of comprehensive on-site surveys.
Finally, the 2013/14 study provides reasonable performance standards for research of this kind. While this report contains quite detailed results from the study, there is potential for further interrogation of the survey database.
SA recreational fishing survey 2013/14 54
Acknowledgements
We are very grateful to the thousands of recreational fishers in South Australia who voluntarily participated in the survey and provided their fishing details during the online, telephone and on-site surveys and demonstrated support for the monitoring and responsible management of recreational fishing in South Australia. Throughout the survey, recreational fishing stakeholder groups showed their strong support. The exceptional response rates achieved in the study have greatly enhanced the quality and utility of the survey results.
The work of Keith Jones and Laurie West and his team at Kewagama Research is acknowledged in their design and implementation of the various telephone survey components of the 2007/08 survey, upon which the design of this project (screening, diary surveys etc.) was based. Keith Jones greatly assisted with his expertise and advice throughout the project. The structure and content of this report remain largely the same as the previous 2007/08 SA survey report (Jones 2009).
The professional team at the Social Research Centre are gratefully acknowledged for their work in developing and applying the online and telephone survey database.
We thank all the staff who conducted the on-site surveys and the fishers who provided information.
The support of Keith Rowling at PIRSA Fisheries and Aquaculture was consistent throughout the survey and Jacqui Shirmer provided the ABS 2013 SA resident population data. James Andrews provided valuable advice and comments on the draft report, and Stephen Mayfield (SARDI Aquatic Sciences) peer reviewed the draft report.
Funds provided by PIRSA Fisheries and Aquaculture and the Mt Lofty Natural Resources Management (NRM) Board enabled the undertaking of the survey.
SA recreational fishing survey 2013/14 55
References
Australian Bureau of Statistics (2008). South Australia’s ageing population and the labour force. ABS Report 1344.4 – SA Stats, 2008. Website: http://www.abs.gov.au/AUSSTATS. Accessed: October 27, 2009.
Ashford, J.R., Jones, C.M. and Fegley, L. (2009). A licence registry improves sampling efficiency for a marine recreational survey. Transactions of the American Fisheries Society 138:984–989.
Cierpicki, S., Riquier, C. and Kennedy, R. (1998). South Australian Recreational Fishing Survey 1997. SA Fisheries Management Series. Paper No. 25.
Currie, D.R., Sorokin, S.J. and Ward, T.M. (2006). Survey of recreational rock lobster fishing in South Australia during 2004/05. South Australian Research and Development Institute (Aquatic Sciences), Adelaide, SARDI Research Report Series No. 98/169.
Finney, K, and Lyle, J.M. (2000). Data management strategy for the national recreational and indigenous fishing survey. In: SDWG: Development of the National Recreational and Indigenous fishing survey. Final Report to FRDC. Project No. 98/169.
Fowler, A.J., McGarvey, R., Steer, M.A. and Feenstra, J.E. (2014). The South Australian Marine Scalefish Fishery Status Report — Analysis of Fishery Statistics for 2013/14. Report to PIRSA Fisheries and Aquaculture. South Australian Research and Development Institute (Aquatic Sciences), Adelaide. F2007/000565-9, SARDI Research Report Series No. 816.
Fowler, A.J., McGarvey, R., Steer, M.A. and Feenstra, J.E. (2012). South Australian Marine Scalefish Fishery — Stock Status Report 2011/12. Report to PIRSA Fisheries and Aquaculture. South Australian Research and Development Institute (Aquatic Sciences), Adelaide. F2007/000565-7, SARDI Research Report Series No. 681.
Giri, K. and Hall, K. (2014). South Australian Recreational Blue Swimmer Crab Fishery Estimates of Harvest 2014 – Northern Gulf St Vincent Survey. Fisheries Victoria Internal Report Series. No 49.
Hall, K., Giri, K. and Jones K. (2014). South Australian Recreational Pipi Fishery Estimates of Harvest 2013-14 – Goolwa on-site surveys. Fisheries Victoria Internal Report Series. No 60.
Hofmann, N. (2008). Gone fishing: A profile of recreational fishing in Canada. Statistics Canada. Website: http://www.statcan.gc.ca/pub/16-002-x/2008002/article/10622-eng.htm. 6 pp. Accessed: October 13, 2009.
Jones, K. and Doonan, A. (2005). 2000-01 National Recreational and Indigenous Fishing Survey. South Australian Information. SA Fisheries Management Series Paper No. 46.
Jones, K. (2007). Survey of Recreational Fishing in South Australia – 2007/08. On-site Interview Surveys and Recreational Logbooks. Sampling methodology, guidelines for interviewers and length: weight relationships for all retained species. Nov, 2007. PIRSA Fisheries Unpublished Report.
Knight, M.A. (2010). South Australian charter boat fishery report 2009. SARDI Research Report Series.
Lumley, T. (2004). Analysis of complex survey samples. Journal of Statistical Software 9:1–19.
Lumley, T. (2014). "survey: analysis of complex survey samples". R package version 3.30.
Lyle, J.M. and Campbell, D.A. (1999). Species and size composition of recreational catches with particular reference to licenced fishing methods. Tasmanian Aquaculture and Fisheries Institute. Final Report to MRFAC.
Lyle, J.M. Coleman, A.P.M., West, L., Campbell, D. and Henry, G.W. (2002). New large-scale methods for evaluating sport fisheries. In: Pitcher, T.J. and Hollingworth, C.E. (Editors). Recreational Fisheries: Ecological, Economic and Social Evaluation. Pp 207–226. Blackwell Science. Oxford, UK.
Lyle, J.M., Wotherspoon S. and Stark, K.E. (2010). Developing an analytical module for large scale recreational fishery data based on phone diary survey methodology FRDC Project 2007/064
Philipson, M., Byrne, J. and Rohan, G (1986). Participation in recreational fishing in South Australia. Fish. Res. Pap. Dep. Fish (South Australia) No 16.
Presser, J. and Mavrakis, V. (2005). Management Plan for the South Australian Recreational Charter Boat Fishery. SA Fisheries Management Series Paper No. 43.
PIRSA (2006). South Australian Fisheries Resources. Current Status and Recent Trends 2006. SA Fisheries Management Series Paper No. 49.
SA recreational fishing survey 2013/14 56
PIRSA (2013). South Australian Recreational Fishing Size, Bag, Boat and Possession Limits. Fisheries and Aquaculture PIRSA tri-fold brochure.
R Development Core Team (2009). An introduction to R. Notes on R: A Programming Environment for Data, Analysis and Graphics. Version 2.9.0 (2009-04-17).
Schaeffer, R.L., Mendenhall, W. and Ott, R.L. (1996). Elementary survey sampling, fifth edition. Duxbury press, Belmont California.
Sutton, S., Dew, K. and Higges, J. (2009). Why do people drop out of recreational fishing? A study of lapsed fishers from Queensland, Australia. Fisheries 34:443–452.
Venema, S., Boxall, V. and Ward, T.W. (2009). Survey of the recreational rock lobster fishery in South Australia, during 2001/02. Final Rep. to PIRSA Fisheries Policy Group. SARDI Aquatic Sciences, Adelaide.
West, L. and Jones, K. (2007a). Survey of Recreational Fishing in South Australia – 2007/08. Interviewer Manual, Part 1. Screening Survey. Unpublished Report PIRSA & Kewagama Research.
West, L. and Jones, K. (2007b). Survey of Recreational Fishing in South Australia – 2007/08. Interviewer Manual, Part 1. Diary Survey. Unpublished Report PIRSA & Kewagama Research.
Wotherspoon, S., Stark, K. and Lyle, J.M. (2010). Recfish. Manual for using an R-based analytical package to estimate recreational catch and effort in large regional surveys. (Provided as part of Lyle, J.M., Wotherspoon S. and Stark, K.E. (2010) FRDC Project 2007/064)
Xia, K., Pedlow, S. and Davern, M. (2010). Dual-Frame Weights (Landline and Cell) for the 2009 Minnesota Health Access Survey, Section on Survey Research Methods – JSM 2010, Canada.
SA recreational fishing survey 2013/14 57
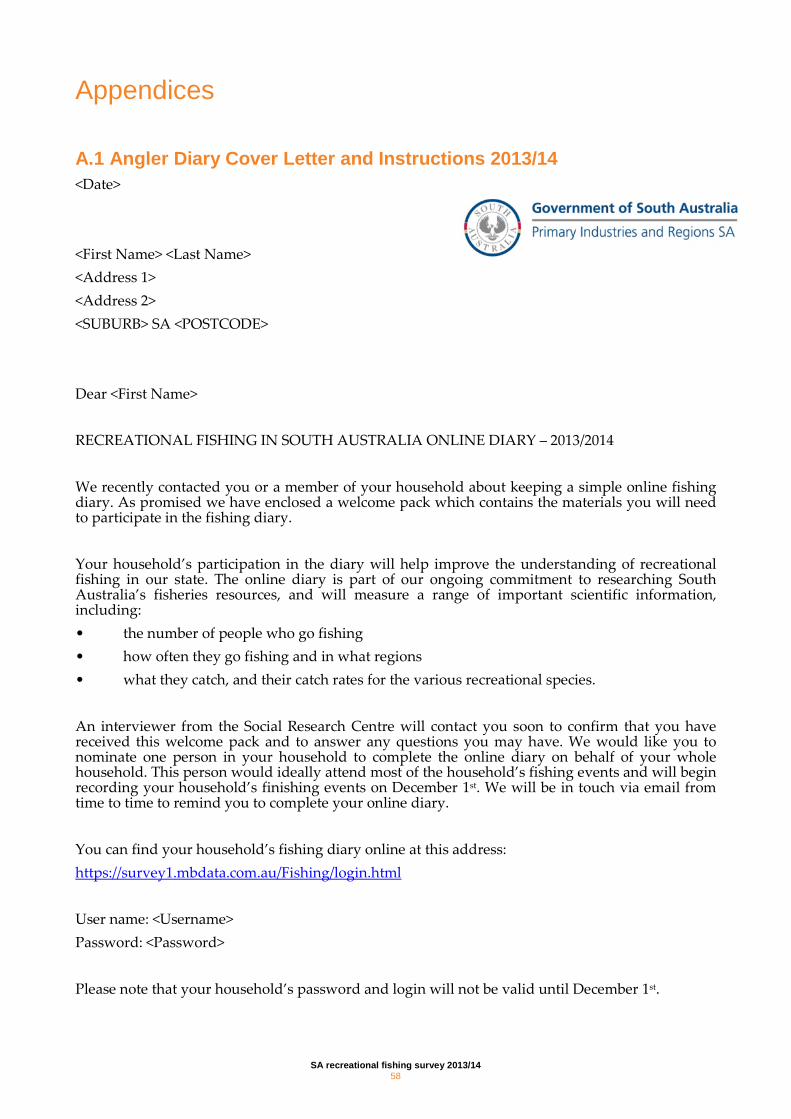
Appendices
A.1 Angler Diary Cover Letter and Instructions 2013/14 <Date> <First Name> <Last Name> <Address 1> <Address 2> <SUBURB> SA <POSTCODE> Dear <First Name> RECREATIONAL FISHING IN SOUTH AUSTRALIA ONLINE DIARY – 2013/2014 We recently contacted you or a member of your household about keeping a simple online fishing diary. As promised we have enclosed a welcome pack which contains the materials you will need to participate in the fishing diary. Your household’s participation in the diary will help improve the understanding of recreational fishing in our state. The online diary is part of our ongoing commitment to researching South Australia’s fisheries resources, and will measure a range of important scientific information, including: • the number of people who go fishing • how often they go fishing and in what regions • what they catch, and their catch rates for the various recreational species. An interviewer from the Social Research Centre will contact you soon to confirm that you have received this welcome pack and to answer any questions you may have. We would like you to nominate one person in your household to complete the online diary on behalf of your whole household. This person would ideally attend most of the household’s fishing events and will begin recording your household’s finishing events on December 1st. We will be in touch via email from time to time to remind you to complete your online diary. You can find your household’s fishing diary online at this address: https://survey1.mbdata.com.au/Fishing/login.html User name: <Username> Password: <Password> Please note that your household’s password and login will not be valid until December 1st.
SA recreational fishing survey 2013/14 58
Please be assured that all information obtained through the survey will be treated in the strictest confidence. For assistance, please contact the Recreational Fishing in South Australia helpline on 1800 023 040 (freecall from a landline telephone). Again, we thank you for assisting with this most important research. Yours sincerely
Prof Mehdi Doroudi
EXECUTIVE DIRECTOR, FISHERIES AND AQUACULTURE
SA recreational fishing survey 2013/14 59
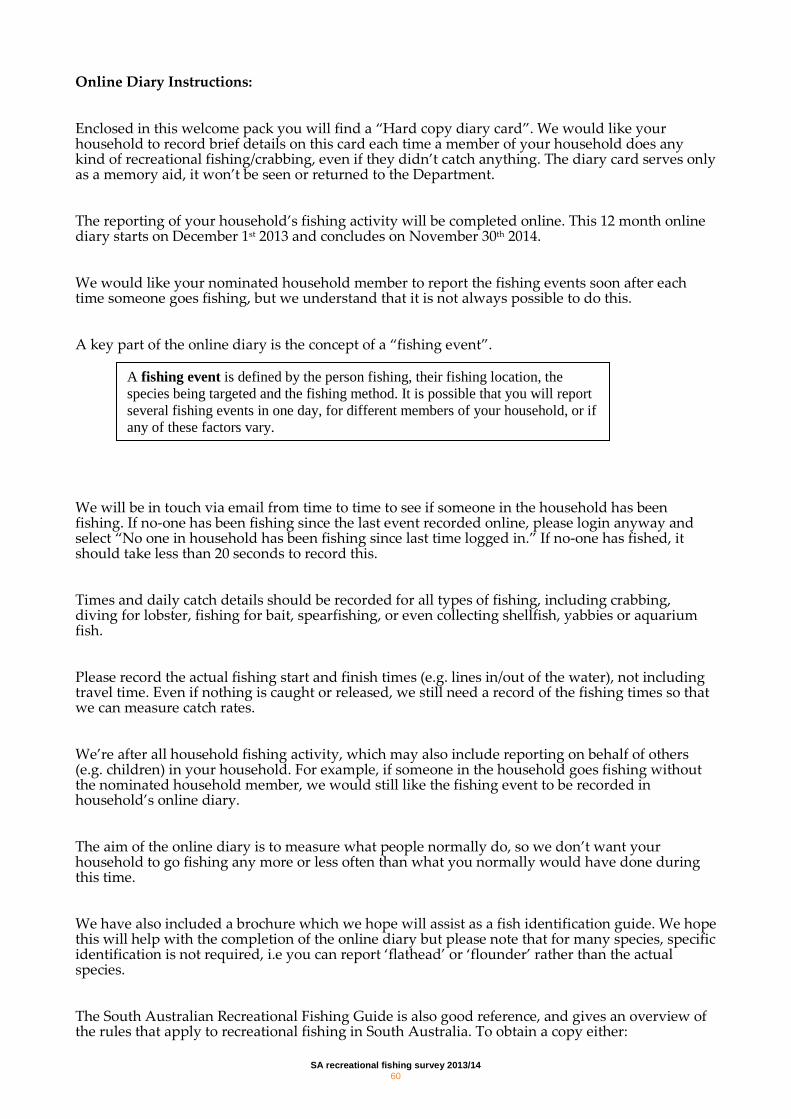
Online Diary Instructions: Enclosed in this welcome pack you will find a “Hard copy diary card”. We would like your household to record brief details on this card each time a member of your household does any kind of recreational fishing/crabbing, even if they didn’t catch anything. The diary card serves only as a memory aid, it won’t be seen or returned to the Department. The reporting of your household’s fishing activity will be completed online. This 12 month online diary starts on December 1st 2013 and concludes on November 30th 2014. We would like your nominated household member to report the fishing events soon after each time someone goes fishing, but we understand that it is not always possible to do this. A key part of the online diary is the concept of a “fishing event”. We will be in touch via email from time to time to see if someone in the household has been fishing. If no-one has been fishing since the last event recorded online, please login anyway and select “No one in household has been fishing since last time logged in.” If no-one has fished, it should take less than 20 seconds to record this. Times and daily catch details should be recorded for all types of fishing, including crabbing, diving for lobster, fishing for bait, spearfishing, or even collecting shellfish, yabbies or aquarium fish. Please record the actual fishing start and finish times (e.g. lines in/out of the water), not including travel time. Even if nothing is caught or released, we still need a record of the fishing times so that we can measure catch rates. We’re after all household fishing activity, which may also include reporting on behalf of others (e.g. children) in your household. For example, if someone in the household goes fishing without the nominated household member, we would still like the fishing event to be recorded in household’s online diary. The aim of the online diary is to measure what people normally do, so we don’t want your household to go fishing any more or less often than what you normally would have done during this time. We have also included a brochure which we hope will assist as a fish identification guide. We hope this will help with the completion of the online diary but please note that for many species, specific identification is not required, i.e you can report ‘flathead’ or ‘flounder’ rather than the actual species. The South Australian Recreational Fishing Guide is also good reference, and gives an overview of the rules that apply to recreational fishing in South Australia. To obtain a copy either:
A fishing event is defined by the person fishing, their fishing location, the species being targeted and the fishing method. It is possible that you will report several fishing events in one day, for different members of your household, or if any of these factors vary.
SA recreational fishing survey 2013/14 60
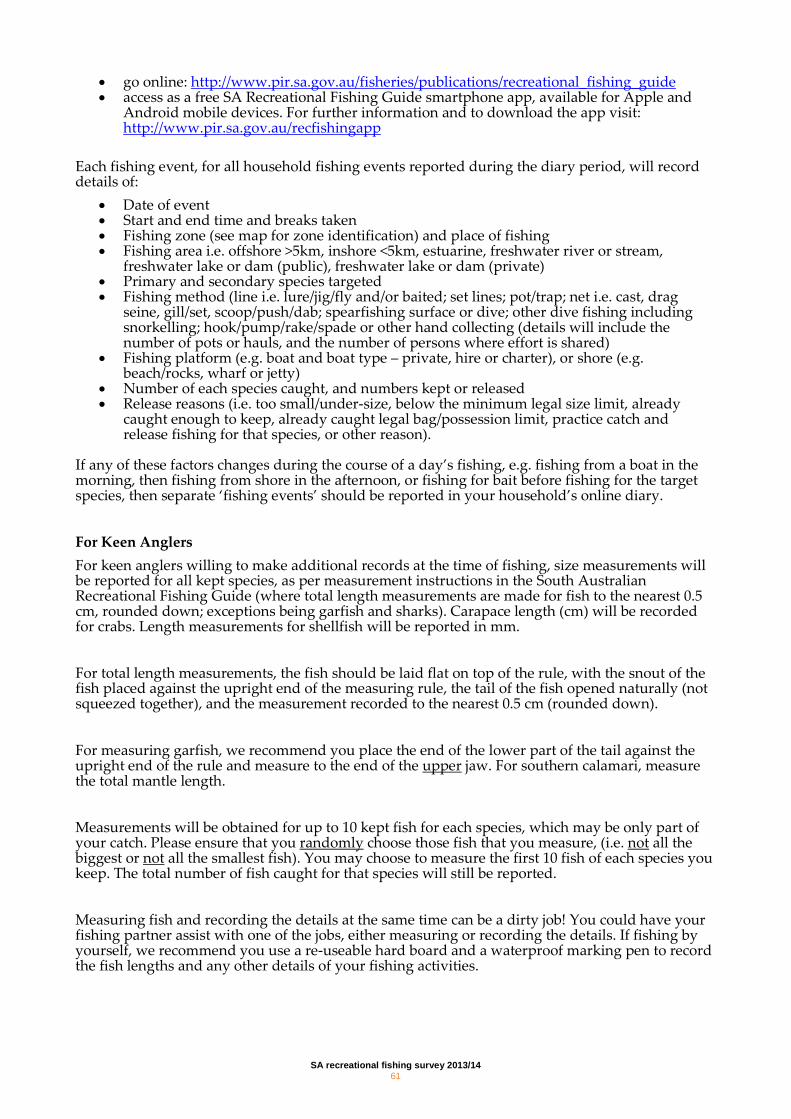
• go online: http://www.pir.sa.gov.au/fisheries/publications/recreational_fishing_guide • access as a free SA Recreational Fishing Guide smartphone app, available for Apple and
Android mobile devices. For further information and to download the app visit: http://www.pir.sa.gov.au/recfishingapp
Each fishing event, for all household fishing events reported during the diary period, will record details of:
• Date of event • Start and end time and breaks taken • Fishing zone (see map for zone identification) and place of fishing • Fishing area i.e. offshore >5km, inshore <5km, estuarine, freshwater river or stream,
freshwater lake or dam (public), freshwater lake or dam (private) • Primary and secondary species targeted • Fishing method (line i.e. lure/jig/fly and/or baited; set lines; pot/trap; net i.e. cast, drag
seine, gill/set, scoop/push/dab; spearfishing surface or dive; other dive fishing including snorkelling; hook/pump/rake/spade or other hand collecting (details will include the number of pots or hauls, and the number of persons where effort is shared)
• Fishing platform (e.g. boat and boat type – private, hire or charter), or shore (e.g. beach/rocks, wharf or jetty)
• Number of each species caught, and numbers kept or released • Release reasons (i.e. too small/under-size, below the minimum legal size limit, already
caught enough to keep, already caught legal bag/possession limit, practice catch and release fishing for that species, or other reason).
If any of these factors changes during the course of a day’s fishing, e.g. fishing from a boat in the morning, then fishing from shore in the afternoon, or fishing for bait before fishing for the target species, then separate ‘fishing events’ should be reported in your household’s online diary. For Keen Anglers For keen anglers willing to make additional records at the time of fishing, size measurements will be reported for all kept species, as per measurement instructions in the South Australian Recreational Fishing Guide (where total length measurements are made for fish to the nearest 0.5 cm, rounded down; exceptions being garfish and sharks). Carapace length (cm) will be recorded for crabs. Length measurements for shellfish will be reported in mm. For total length measurements, the fish should be laid flat on top of the rule, with the snout of the fish placed against the upright end of the measuring rule, the tail of the fish opened naturally (not squeezed together), and the measurement recorded to the nearest 0.5 cm (rounded down). For measuring garfish, we recommend you place the end of the lower part of the tail against the upright end of the rule and measure to the end of the upper jaw. For southern calamari, measure the total mantle length. Measurements will be obtained for up to 10 kept fish for each species, which may be only part of your catch. Please ensure that you randomly choose those fish that you measure, (i.e. not all the biggest or not all the smallest fish). You may choose to measure the first 10 fish of each species you keep. The total number of fish caught for that species will still be reported. Measuring fish and recording the details at the same time can be a dirty job! You could have your fishing partner assist with one of the jobs, either measuring or recording the details. If fishing by yourself, we recommend you use a re-useable hard board and a waterproof marking pen to record the fish lengths and any other details of your fishing activities.
SA recreational fishing survey 2013/14 61
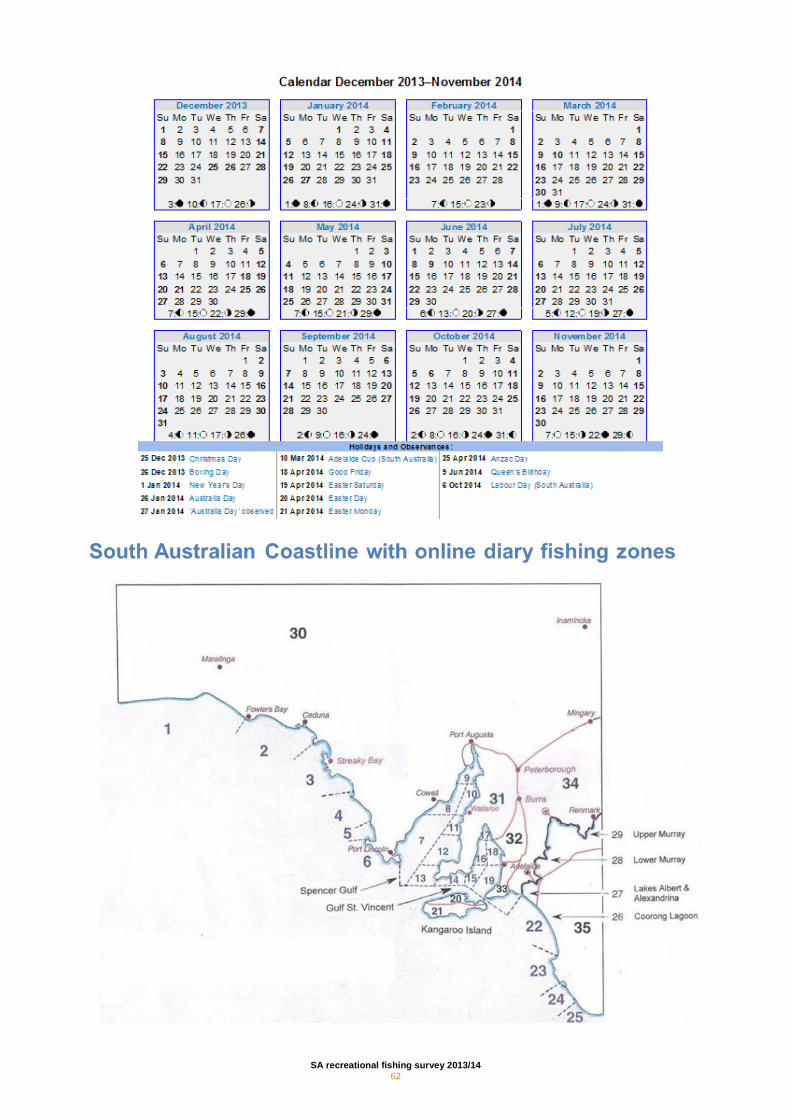
SA recreational fishing survey 2013/14 62
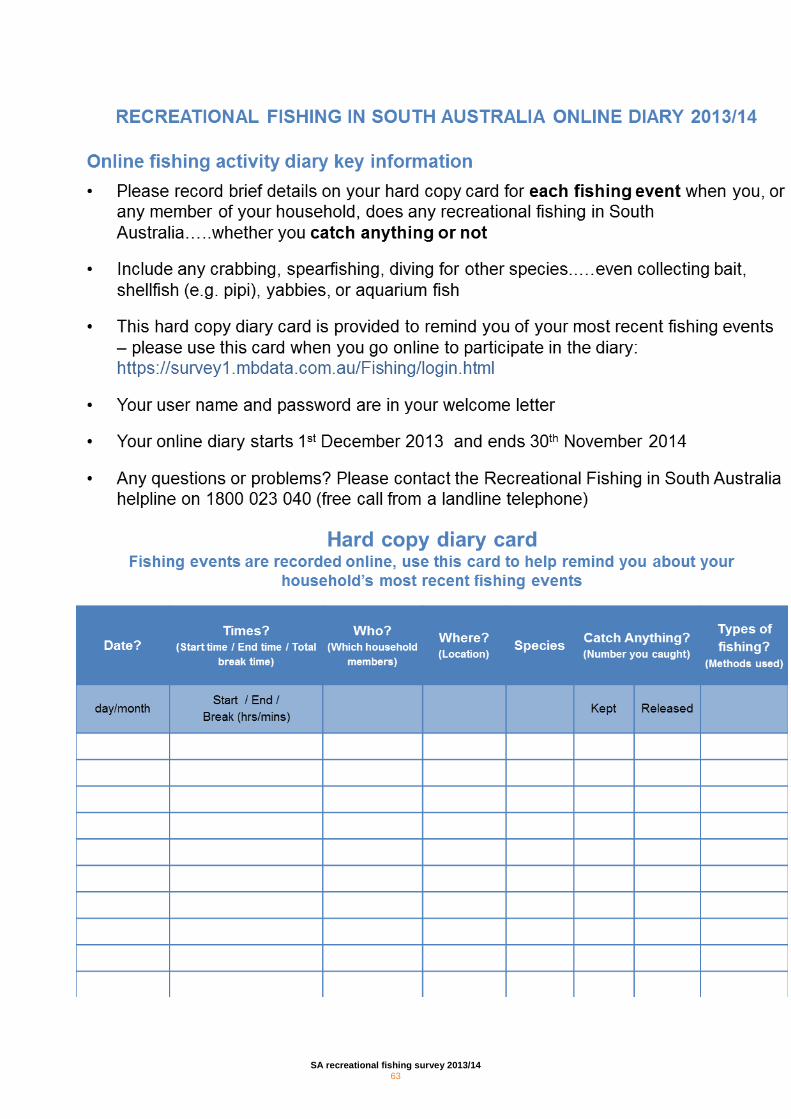
SA recreational fishing survey 2013/14 63
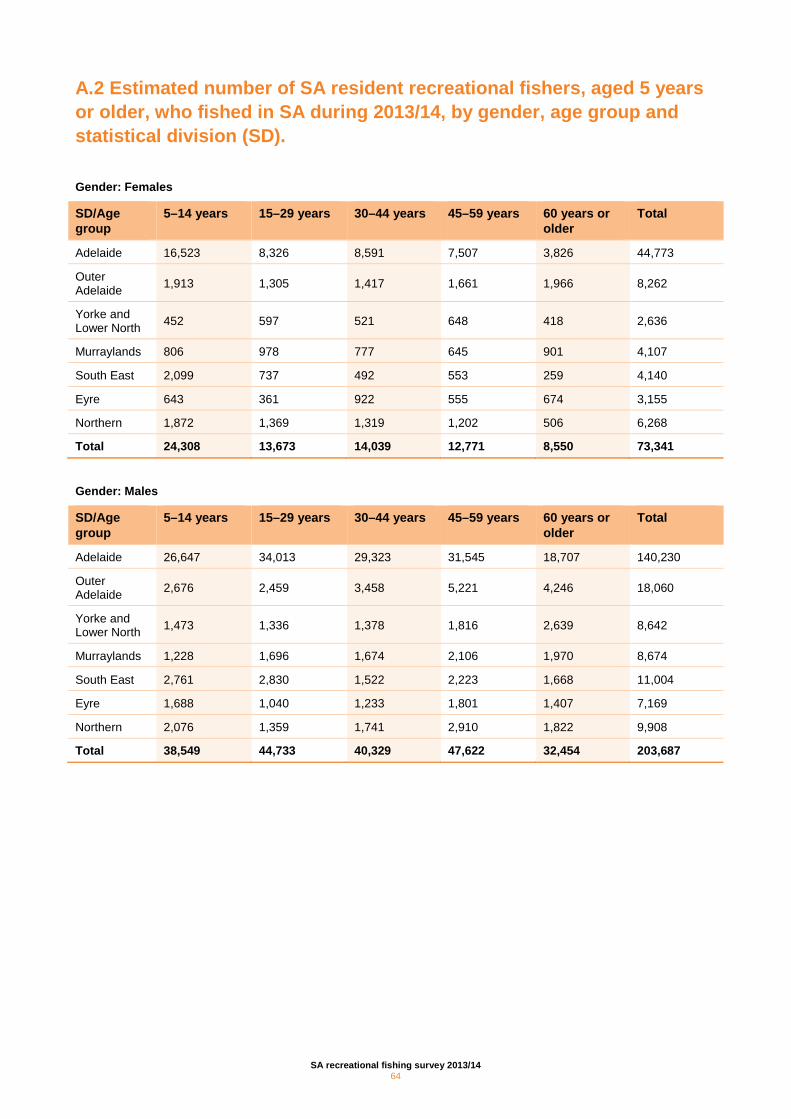
A.2 Estimated number of SA resident recreational fishers, aged 5 years or older, who fished in SA during 2013/14, by gender, age group and statistical division (SD).
Gender: Females
SD/Age group
5–14 years 15–29 years 30–44 years 45–59 years 60 years or older
Total
Adelaide 16,523 8,326 8,591 7,507 3,826 44,773
Outer Adelaide 1,913 1,305 1,417 1,661 1,966 8,262
Yorke and Lower North 452 597 521 648 418 2,636
Murraylands 806 978 777 645 901 4,107
South East 2,099 737 492 553 259 4,140
Eyre 643 361 922 555 674 3,155
Northern 1,872 1,369 1,319 1,202 506 6,268
Total 24,308 13,673 14,039 12,771 8,550 73,341
Gender: Males
SD/Age group
5–14 years 15–29 years 30–44 years 45–59 years 60 years or older
Total
Adelaide 26,647 34,013 29,323 31,545 18,707 140,230
Outer Adelaide 2,676 2,459 3,458 5,221 4,246 18,060
Yorke and Lower North 1,473 1,336 1,378 1,816 2,639 8,642
Murraylands 1,228 1,696 1,674 2,106 1,970 8,674
South East 2,761 2,830 1,522 2,223 1,668 11,004
Eyre 1,688 1,040 1,233 1,801 1,407 7,169
Northern 2,076 1,359 1,741 2,910 1,822 9,908
Total 38,549 44,733 40,329 47,622 32,454 203,687
SA recreational fishing survey 2013/14 64
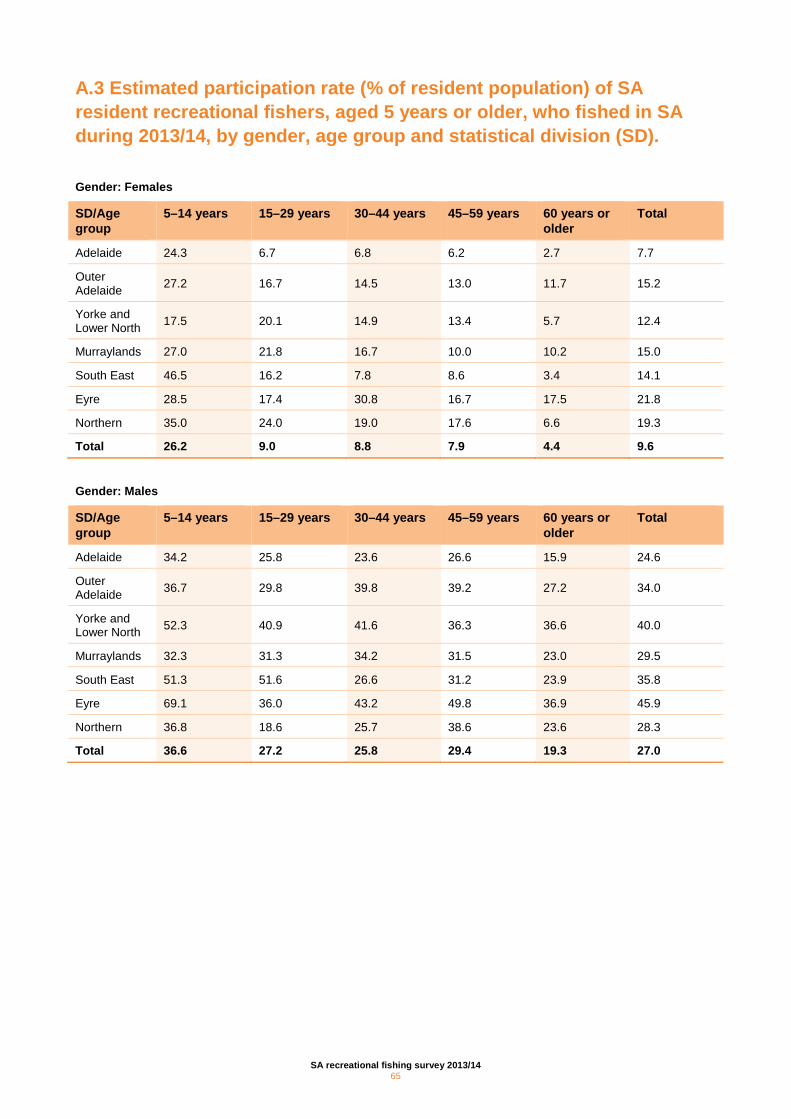
A.3 Estimated participation rate (% of resident population) of SA resident recreational fishers, aged 5 years or older, who fished in SA during 2013/14, by gender, age group and statistical division (SD).
Gender: Females
SD/Age group
5–14 years 15–29 years 30–44 years 45–59 years 60 years or older
Total
Adelaide 24.3 6.7 6.8 6.2 2.7 7.7
Outer Adelaide 27.2 16.7 14.5 13.0 11.7 15.2
Yorke and Lower North 17.5 20.1 14.9 13.4 5.7 12.4
Murraylands 27.0 21.8 16.7 10.0 10.2 15.0
South East 46.5 16.2 7.8 8.6 3.4 14.1
Eyre 28.5 17.4 30.8 16.7 17.5 21.8
Northern 35.0 24.0 19.0 17.6 6.6 19.3
Total 26.2 9.0 8.8 7.9 4.4 9.6
Gender: Males
SD/Age group
5–14 years 15–29 years 30–44 years 45–59 years 60 years or older
Total
Adelaide 34.2 25.8 23.6 26.6 15.9 24.6
Outer Adelaide 36.7 29.8 39.8 39.2 27.2 34.0
Yorke and Lower North 52.3 40.9 41.6 36.3 36.6 40.0
Murraylands 32.3 31.3 34.2 31.5 23.0 29.5
South East 51.3 51.6 26.6 31.2 23.9 35.8
Eyre 69.1 36.0 43.2 49.8 36.9 45.9
Northern 36.8 18.6 25.7 38.6 23.6 28.3
Total 36.6 27.2 25.8 29.4 19.3 27.0
SA recreational fishing survey 2013/14 65

Customer Service Centre 136 186
www.ecodev.vic.gov.au