South Asia Economic Report 2008 - Asian Development Bank · third Report is “Foreign Direct...
68
Transcript of South Asia Economic Report 2008 - Asian Development Bank · third Report is “Foreign Direct...
Asian Development Bank6 ADB Avenue, Mandaluyong City1550 Metro Manila, Philippineswww.adb.orgPublication Stock No. BBK091808ISSN 1995-560X Printed in the Philippines
South Asia Economic Report
This issue of the South Asia Economic Report (SAER) is the third in a series of biannual reports on economic and development issues in South Asia. It is a cooperative effort of the South Asia Department and the Central and West Asia Department of the Asian Development Bank (ADB). The SAER aims to provide information to policy makers, academics, and ADB management and staff. It highlights issues that help promote debate and foster appropriate policies and greater cooperation and integration in the region. The themes of the first and second issues of the SAER were, respectively, “Banking, Governance, and the Investment Climate,” and “Social Sectors in Transition: Accelerating Inclusive Growth and Human Development.” This issue’s theme is “Foreign Direct Investment in South Asia.”
The key messages of this third SAER are recapitulated below:
• South Asia continues on a high growth track.
• Foreign direct investment (FDI) is one of the key elements required for sustainable economic growth in the region.
• The region has made efforts to liberalize its policies, and FDI inflows into the region have been increasing.
• The absolute amount of FDI, however, is still low compared to other developing regions and countries of Asia.
• The region’s main obstacle in attracting FDI is its poor business climate.
• South Asia has great opportunities for increasing FDI, and foreign investors’ perception of the region is becoming progressively more positive.
• Macroeconomic and political stability, appropriate policy and regulatory frameworks, infrastructure development, accelerated development of small and medium-sized enterprises, improvement in the quality of local workers, and enhancement of regional cooperation are all needed for further promotion of FDI in South Asia.
About the Asian Development Bank
ADB aims to improve the welfare of the people in the Asia and Pacific region, particularly the nearly 1.9 billion who live on less than $2 a day. Despite many success stories, the region remains home to two thirds of the world’s poor. ADB is a multilateral development finance institution owned by 67 members, 48 from the region and 19 from other parts of the globe. ADB’s vision is a region free of poverty. Its mission is to help its developin g member countries reduce poverty and improve their quality of life.
ADB’s main instruments for helping its developing member countries are policy dialogue, loans, equity investments, guarantees, grants, and technical assistance.
ADB’s headquarters is in Manila. It has 26 offices around the world and more than 2,000 employees from over 50 countries.
South Asia Economic_2007.indd 2 2/22/08 5:12:36 PM


South Asia Economic_title page.i1 1 2/22/08 7:13:11 PM

© 2008 Asian Development Bank
All rights reserved. Published in 2008.Printed in the Philippines.
Cataloging-in-Publication Data
ISSN: 1995-560XPublication Stock Number: BBK091808
Asian Development Bank
The periodical South Asia Economic Report provides information and data on developing South Asian countries.
JEL Classifications: F21, 011, 024
The views expressed in this report are those of the authors and do not necessarily reflect the views and policies of the Asian Development Bank or its Board of Governors or the governments they represent.
The Asian Development Bank does not guarantee the accuracy of the data included in this publication and accepts no responsibility for any consequence of their use.
Use of the term “country” does not imply any judgment by the authors or the Asian Development Bank as to the legal or other status of any territorial entity.
South Asia Economic Report 2008_ii iiSouth Asia Economic Report 2008_ii ii 2/25/2008 11:25:52 AM2/25/2008 11:25:52 AM

FOREWORDWe are pleased to present the third issue of the South Asia Economic Report (SAER), a series of biannual reports on economic and development issues in South Asia. The SAER is a cooperative effort of the South Asia Department and the Central and West Asia Department of the Asian Development Bank (ADB).
The SAER provides a biannual update on the South Asian economy and a theme chapter on an important development issue. In the first Report, published in October 2006, the theme was “Banking, Governance, and the Investment Climate.” The second SAER, issued in June 2007, featured “Social Sectors in Transition: Accelerating Inclusive Growth and Human Development,” and covered education and health. The theme of the third Report is “Foreign Direct Investment in South Asia.” The SAER also incorporates a country section assessing the current economic situation in South Asia.
Reflecting accelerated economic growth since the early 1990s, this issue confirms that South Asia remains on a solid track of high growth as it continues to be one of the leading regional economies in developing Asia and the world. This is because of its strong macroeconomic fundamentals, price stability, implementation of appropriate macroeconomic policies, and promotion of structural and market-oriented reforms. The region’s strong economic performance has also been bolstered by international trade and investments, particularly by fast growth of merchandise exports and imports, buoyant services exports, huge inflows of workers’ remittances, and a surge in private capital inflows—including foreign direct investment (FDI). All these favorable economic developments can help alleviate regional poverty in the medium to long run.
FDI is a vital requirement for sustained economic growth in South Asia. It can generate employment in the host countries, in addition to supplementing domestic savings and helping meet the huge demand for investment. FDI can also bring foreign currencies into the host countries by stimulating exports of goods and services. Expectations of significant future domestic demand, especially in countries with large populations such as those in South Asia, can result in FDI from foreign companies establishing large production bases for these domestic markets. Such FDI will expand product variety and consumer choices, and promote technology transfers and knowledge spillovers through forward and backward linkages in the host economies.
The Report highlights the strong inducements for FDI offered by South Asia, such as its robust economic growth with the impressive showing of the services sector and exports, its large domestic markets, and the positive perceptions of foreign investors. However, the level of FDI inflow into South Asia is still low compared to other Asian regions. This is considered to be the result of the poor business climate, poor infrastructure, restrictive labor policy and labor unrest, political uncertainties and civil conflicts, weak regulatory systems, and rampant corruption.
South Asia Economic Report 2008_iii iiiSouth Asia Economic Report 2008_iii iii 2/25/2008 11:25:52 AM2/25/2008 11:25:52 AM

iv South Asia Economic Report
The Report consequently urges South Asian countries to maximize efforts aimed at macroeconomic and political stability, institute appropriate regulatory and policy frameworks for foreign investment, promote infrastructure development, facilitate the development of small and medium-sized enterprises, enhance the quality of local labor through education and training, and facilitate greater regional cooperation in terms of promotion of trade and investment. These measures are also necessary to sustain the current momentum of economic growth in the region.
We hope this SAER will help all stakeholders—especially senior policy makers in governments—appreciate important global and regional trends and take effective proactive steps to capitalize on opportunities and mitigate risks in order to help promote FDI and ensure accelerated and inclusive growth. ADB is committed to catalyzing the provision of technical and financial support to the region to help sustain growth and eradicate poverty.
We would like to thank the staff and consultants from the South Asia Department and the Central and West Asia Department of ADB for preparing this issue of the SAER, in close collaboration with the Economics and Research Department. The work was conducted under the overall guidance of Sultan Hafeez Rahman and Yukiko Kojima. Production of the SAER was led by Shunsuke Bando, assisted by Tadateru Hayashi and Angelo Taningco.
The introduction and section on foreign direct investment in South Asia were prepared by Shunsuke Bando, Tadateru Hayashi, and Angelo Taningco. The country section was written by the following country economists: Mohammad Ishaque Sarwari for Afghanistan, Rezaul Khan for Bangladesh, Abid Hussain and Tadateru Hayashi for Bhutan and Maldives, Hiranya Mukhopadhyay for India, Paolo Spantigati and Shyamal Krishna Shrestha for Nepal, Farzana Noshab for Pakistan, and Johanna Boestel and Nimali Hasitha Wickremasinghe for Sri Lanka. Angelo Taningco compiled the statistical appendix.
Sally Mabaquiao and Jane de Ocampo provided administrative support. Barry V. Lanier did the style and copyediting. The publication was made possible by the cooperation of the Department of External Relations and the Printing Unit.
Finally, we would like to thank these and other numerous colleagues from different departments who provided invaluable inputs and comments: Francis J. Harrigan, William E. James, Diwesh Sharan, Myo Thant, Ganeshan Wignaraja, and Xianbin Yao.
Kunio Senga Juan MirandaDirector General Director GeneralSouth Asia Department Central and West Asia Department
South Asia Economic Report 2008_iv ivSouth Asia Economic Report 2008_iv iv 2/25/2008 11:25:52 AM2/25/2008 11:25:52 AM

CONTENTS
Foreword iii
Abbreviations and Acronyms vii
Explanatory Notes viii
1. Introduction 1
2. Foreign Direct Investment in South Asia 5Introduction 5FDI Flows in Developing Asia 6FDI in South Asia 9Constraints to FDI in South Asia 15Potential for FDI in South Asia 22The Way Forward—Promotion of More FDI in South Asia 25
3. Country Section 29Afghanistan 29Bangladesh 30Bhutan 32India 34Maldives 36Nepal 37Pakistan 39Sri Lanka 41
References 43
Statistical Appendix 47
Tables1.1 Major Items in Balance of Payments for South Asian Countries, 2006 22.1 Net FDI Flows into Developing Countries, Annual Net Growth of FDI Infl ows, and the South Asia Share
of World FDI, 2000–2006 92.2 Net FDI Infl ows for South Asian Countries, 2005–2006 102.3 FDI Infl ows by Sector in India, 2004–2006 112.4 FDI Infl ows by Sector in Pakistan, 2005–2007 112.5 FDI Infl ows by Sector in Bangladesh, 2004 122.6 Intra-Regional FDI in South Asia 132.7 Leading Source Countries of FDI in India, 2004–2006 142.8 Leading Source Countries of Foreign Private Investment in Pakistan, 2005–2007 152.9 Leading Source Countries of FDI in Bangladesh, 2004 152.10 Global Ranking on the Ease of Doing Business, by Region, 2007 162.11 Global Ranking on the Ease of Doing Business, by South Asian Country, 2007–2008 17
South Asia Economic Report 2008_v vSouth Asia Economic Report 2008_v v 2/25/2008 11:25:52 AM2/25/2008 11:25:52 AM

2.12 Infrastructure Indicators, by Region 182.13 Infrastructure Access Indicators in South Asia and East Asia, end-2004 182.14 Global Rankings of Selected Labor Policy Indicators, by Region and South Asian Country, 2007 192.15 Corruption Perceptions Index (CPI) for South Asian Countries, 2006 212.16 Bribe Payers Index (BPI) for Asian Countries, 2006 212.17 GDP Growth Rates by Region in Asia and the Pacifi c, 2005–2008 222.18 Inward FDI Performance Index and Inward FDI Potential Index Rankings of Selected South Asian
Countries 232.19 Scores on Variables Included in UNCTAD Inward FDI Potential Index for Selected South Asian Countries,
2003–2005 242.20 Global Rankings on Starting a Business and Protecting Investors, by Region and South Asian Country,
2007 253.1 Country Macroeconomic Indicators: Afghanistan 293.2 Country Macroeconomic Indicators: Bangladesh 303.3 Country Macroeconomic Indicators: Bhutan 323.4 Country Macroeconomic Indicators: India 343.5 Country Macroeconomic Indicators: Maldives 363.6 Country Macroeconomic Indicators: Nepal 373.7 Country Macroeconomic Indicators: Pakistan 393.8 Country Macroeconomic Indicators: Sri Lanka 41
Figures1.1 Growth in South Asia 11.2 Major Sectors in the South Asian Economy—Shares of GDP and Annual Growth Rates 12.1 Net FDI Infl ows and Growth in South Asia, 2002–2006 92.2 FDI Stock as a Precentage of GDP in South Asia in 1990, 2000, and 2006 132.3 FDI Stock as a Percentage of GDP in Selected Asian Regions and Countries, 2006 132.4 Global Competitiveness Index Ranking of Infrastructure in Selected South Asian Countries, 2007–
2008 173.1 India Infl ation Rate, 2007 343.2 Nominal Exchange Rate of Indian Rupee vs United States Dollar, 2007 353.3 Sector Contribution to GDP Growth in Nepal, 2002–2007 383.4 Value of Nepal Exports and Workers’ Remittances, and Growth Rates of Exports and Imports, 2005–
2007 393.5 Pakistan Government Revenues and Expenditures, 2004–2007 403.6 External Sector of Pakistan, 2006–2007 41
South Asia Economic Report 2008_vi viSouth Asia Economic Report 2008_vi vi 2/25/2008 11:25:52 AM2/25/2008 11:25:52 AM

ABBREVIATIONS AND ACRONYMS
ADB ⎯ Asian Development BankADO ⎯ Asian Development OutlookASEAN ⎯ Association of Southeast Asian NationsBPC ⎯ Bangladesh Petroleum CorporationBPI ⎯ Bribe Payers IndexCPI ⎯ Corruption Perceptions IndexEU ⎯ European UnionFDI ⎯ foreign direct investmentFY ⎯ fiscal yearGDP ⎯ gross domestic productICT ⎯ information and communication technologyIMF ⎯ International Monetary FundJBIC ⎯ Japan Bank for International CooperationMNC ⎯ multinational corporationNCB ⎯ nationalized commercial bankNPL ⎯ nonperforming loanOECD ⎯ Organisation for Economic Co-operation and DevelopmentPRC ⎯ People’s Republic of ChinaPRGF ⎯ Poverty Reduction Growth FacilityR&D ⎯ research and developmentRBI ⎯ Reserve Bank of IndiaSAER ⎯ South Asia Economic ReportSMEs ⎯ small and medium-sized enterprisesUK ⎯ United KingdomUNCTAD ⎯ United Nations Conference on Trade and DevelopmentUS ⎯ United StatesWEF ⎯ World Economic Forum
NOTE: In this report, “$” refers to US dollars.
South Asia Economic Report 2008_vii viiSouth Asia Economic Report 2008_vii vii 2/25/2008 11:25:52 AM2/25/2008 11:25:52 AM

EXPLANATORY NOTES
For the purposes of this issue of the South Asia Economic Report, the following analytical or geographical groupings apply: • South Asia comprises Afghanistan, Bangladesh, Bhutan, India,
Maldives, Nepal, Pakistan, and Sri Lanka. • Developing Asia refers to the 44 developing member countries
of the Asian Development Bank.In section 2, tables and figures containing regional comparisons follow the regional classification and years of the World Bank, the United Nations Conference on Trade and Development (UNCTAD), and others, as indicated.
The countries in South Asia have varying fiscal years. The fiscal years of Maldives and Sri Lanka correspond to the calendar year. The fiscal years of other South Asian countries are shown below. Unless otherwise indicated, “year” refers to calendar year in the text and fiscal year in figures and tables.
Country Fiscal Year CaptionAfghanistan 21 March 2007 to 20 March 2008 FY2007Bangladesh 1 July 2006 to 30 June 2007 FY2007Bhutan 1 July 2006 to 30 June 2007 FY2007India 1 April 2007 to 31 March 2008 FY2007Nepal 16 July 2006 to 15 July 2007 FY2007Pakistan 1 July 2006 to 30 June 2007 FY2007
Regional aggregates (sums and averages) for South Asia that are reported in the text and in figures and tables reflect aggregates of national-level data of all South Asian countries for the relevant fiscal year.
This issue of the SAER incorporates data available as of 15 November 2007. Unless otherwise specified, data in the figures and tables presented in this issue were obtained from the Asian Development Outlook (ADO) 2007 and ADO 2007 Update, and updated with official statistical publications. A detailed explanation of the computations and sources of data may be found in the Statistical Notes of the Statistical Appendix.
South Asia Economic Report 2008_viii viiiSouth Asia Economic Report 2008_viii viii 2/25/2008 11:25:52 AM2/25/2008 11:25:52 AM
1. INTRODUCTION
South Asia exhibited robust macroeconomic performance in 2006. Economic growth was strong, with savings and investment rates high, inflation moderate, trade and foreign direct investment (FDI) expanding, and fiscal deficits lower. South Asian countries are expected to sustain high growth rates in 2007 and 2008.
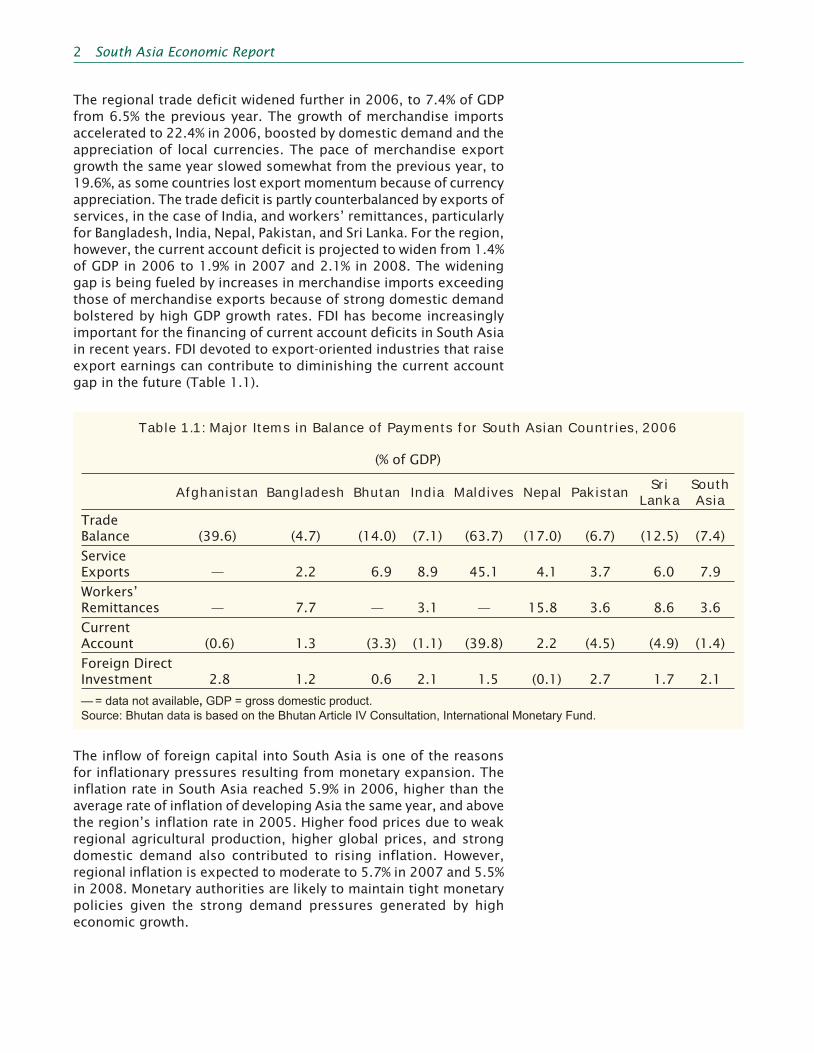
Economic growth in South Asia was stronger in 2006, as aggregate gross domestic product (GDP) posted an 8.8% expansion (Figure 1.1). It was the second consecutive year of the highest growth rate in the region since 2003. Most economies in South Asia registered GDP growth rates exceeding 6.0% in 2006, largely the result of impressive performance by the services sector and the industrial sector. The rise of services, even prior to sustained industrialization in the region, has been a prominent feature of the development of South Asia. From 50.8% in 2001, the share of the services sector in regional GDP expanded to 54.3% in 2006 (Figure 1.2). The sector’s share of GDP in Bangladesh, India, Pakistan, and Sri Lanka was likewise relatively large, at 49.1%, 54.9%, 52.8%, and 56.2%, respectively. While the services sector continues to lead economic growth in the region, expansion of industrial output has accelerated to catch up with that of the services sector. All countries in South Asia, except Nepal, are expected to continue their present momentum of robust economic performance, with GDP growth rates exceeding 6.0% in both 2007 and 2008.
Expansion of the consumption demand component of GDP was surpassed by investment growth in the region for the sixth consecutive year. This is attributed to the positive outlook of investors and expectations of continued high rates of growth. The rate of investment in South Asia reached a high of 31.9% of GDP in 2006, up from 22.2% in 2001. The expansion of regional consumption was also outpaced by that of the savings rate, which rose from 22.0% of GDP in 2001 to 28.9% in 2006. However, the domestic savings rate in South Asian countries is not as high as in many countries in East and Southeast Asia, and is not sufficient to finance the huge amount of capital required for domestic fixed capital formation. As a result, capital inflows from outside the region have played an important role in supplementing domestic savings. FDI in South Asia in 2006 amounted to $24.3 billion, or 2.1% of GDP, a sharp increase from the 2005 level of $10.4 billion. The surge in regional FDI inflows reflects good growth prospects, rising investor confidence, a much-improved international credit standing, and the progressive development of financial and capital markets. The strong growth of FDI can augment the efficiency of investment through enhancement of the skills of local labor and introduction of new and advanced technology.
GDP = gross domestic product.
Figure 1.1: Growth in South Asia
%
0
2
4
6
8
10
f = forecast, GDP = gross domestic product.
GDP growth
(% annual change)
8.18.18.88.7
7.47.8
3.75.1
2001
2003
2004
2006
2007
f
2008
f
2002
2005
Figure 1.2: Major Sectors in the South Asian Economy—Shares of GDP
and Annual Growth Rates
0
10
20
30
40
50
60
70
80
90
100
2001 2002 2003 2004 2005 2006
Sector % of GDP
(8)
(6)
(4)
(2)
0
2
4
6
8
10
12
Sector Growth Rate (%)
Agriculture share
Industry share
Services share
Agriculture growth
Industry growth
Services growth
South Asia Economic Report 2008_Sec1:1 Sec1:1South Asia Economic Report 2008_Sec1:1 Sec1:1 2/25/2008 11:25:52 AM2/25/2008 11:25:52 AM
2 South Asia Economic Report
The regional trade deficit widened further in 2006, to 7.4% of GDP from 6.5% the previous year. The growth of merchandise imports accelerated to 22.4% in 2006, boosted by domestic demand and the appreciation of local currencies. The pace of merchandise export growth the same year slowed somewhat from the previous year, to 19.6%, as some countries lost export momentum because of currency appreciation. The trade deficit is partly counterbalanced by exports of services, in the case of India, and workers’ remittances, particularly for Bangladesh, India, Nepal, Pakistan, and Sri Lanka. For the region, however, the current account deficit is projected to widen from 1.4% of GDP in 2006 to 1.9% in 2007 and 2.1% in 2008. The widening gap is being fueled by increases in merchandise imports exceeding those of merchandise exports because of strong domestic demand bolstered by high GDP growth rates. FDI has become increasingly important for the financing of current account deficits in South Asia in recent years. FDI devoted to export-oriented industries that raise export earnings can contribute to diminishing the current account gap in the future (Table 1.1).
Table 1.1: Major Items in Balance of Payments for South Asian Countries, 2006
(% of GDP)
Afghanistan Bangladesh Bhutan India Maldives Nepal Pakistan Sri Lanka
South Asia
Trade Balance (39.6) (4.7) (14.0) (7.1) (63.7) (17.0) (6.7) (12.5) (7.4)
Service Exports — 2.2 6.9 8.9 45.1 4.1 3.7 6.0 7.9
Workers’ Remittances — 7.7 — 3.1 — 15.8 3.6 8.6 3.6
Current Account (0.6) 1.3 (3.3) (1.1) (39.8) 2.2 (4.5) (4.9) (1.4)
Foreign Direct Investment 2.8 1.2 0.6 2.1 1.5 (0.1) 2.7 1.7 2.1
— = data not available, GDP = gross domestic product.Source: Bhutan data is based on the Bhutan Article IV Consultation, International Monetary Fund.
The inflow of foreign capital into South Asia is one of the reasons for inflationary pressures resulting from monetary expansion. The inflation rate in South Asia reached 5.9% in 2006, higher than the average rate of inflation of developing Asia the same year, and above the region’s inflation rate in 2005. Higher food prices due to weak regional agricultural production, higher global prices, and strong domestic demand also contributed to rising inflation. However, regional inflation is expected to moderate to 5.7% in 2007 and 5.5% in 2008. Monetary authorities are likely to maintain tight monetary policies given the strong demand pressures generated by high economic growth.
South Asia Economic Report 2008_Sec1:2 Sec1:2South Asia Economic Report 2008_Sec1:2 Sec1:2 2/25/2008 11:25:52 AM2/25/2008 11:25:52 AM
Introduction 3
While growth prospects for South Asia are favorable, the region faces formidable challenges to sustained development and growth in the longer term. These challenges include the need to develop physical and social infrastructure, accelerate inclusive growth and human development, promote FDI, diversify domestic industries, revive agriculture, institute structural policy reforms, and secure political stability and security.
Against this backdrop, the first issue of the South Asia Economic Report (SAER) highlighted the need for institutional reforms and well-targeted public investment to sustain and accelerate growth. The first Report recommended that public investment be aimed at areas where infrastructure bottlenecks are emerging, particularly power, roads, urban infrastructure, and ports. The second SAER focused on education and health, and argued that sustaining and enhancing the inclusiveness of growth are crucial. It recommended six actions for governments in the region: (i) focus on the poor, (ii) respond effectively to new global opportunities and challenges, (iii) enhance the responsiveness and agility of the social sectors, (iv) proactively address the potential inequality of the transition, (v) leverage information and communication technology (ICT) to address current and transitional challenges, and (vi) prepare the social sectors for a “borderless world.” This third issue of SAER provides an in-depth examination of the main factors influencing FDI in South Asia, and recommendations for governments to strengthen incentives for FDI. Section 2 deals with FDI in selected South Asian countries, including a discussion of its potential benefits to the region’s economies. Section 2 also assesses the latest trends of factors governing inter and intra-regional FDI flows, as well as the major constraints to those flows. Economic reforms and policies that will help attract FDI into South Asian countries are identified. The section concludes with specific recommendations for economic reforms that will help invigorate the region’s FDI inflow. As mentioned above, however, the challenges to sustained development and growth in the longer term also should be addressed for effective promotion of FDI and sustainable growth in South Asia.
Section 3 supplements analyses provided in Section 2 with an in-depth look at the latest information on economic performance, outlook, and risks in each of the eight countries of South Asia, namely, Afghanistan, Bangladesh, Bhutan, India, Maldives, Nepal, Pakistan, and Sri Lanka.
South Asia Economic Report 2008_Sec1:3 Sec1:3South Asia Economic Report 2008_Sec1:3 Sec1:3 2/25/2008 11:25:53 AM2/25/2008 11:25:53 AM

South Asia Economic Report 2008_Sec1:4 Sec1:4South Asia Economic Report 2008_Sec1:4 Sec1:4 2/25/2008 11:25:53 AM2/25/2008 11:25:53 AM
2. FOREIGN DIRECT INVESTMENT IN SOUTH ASIA
Introduction
Foreign direct investment (FDI) is an important type of private capital financing for developing countries. It is normally defined as foreign acquisition of at least 10% of the assets of a firm (Markusen 2000). In recent years, FDI in developing Asia has risen tremendously, largely induced by the liberalization of investment policies such as investment incentives, and the lowering or removal of capital controls and other types of investment barriers. The promotion of these policies was triggered by a myriad of factors, including (i) rapid improvements in technology, (ii) the advent of global and regional production networks, (iii) the forging of bilateral investment agreements, (iv) policy advice coming from international agencies, (v) and increasing recognition of the positive effects of FDI (Asian Development Bank [ADB] 2004).
Recent years have seen the rise of FDI in South Asia. This can be partly attributed to liberalization policies initiated by most South Asian governments during the 1990s and early 2000s, as well as to the strong economic growth of most countries in the region. The flow of foreign investment into the region will continue its upward trend. However, South Asian countries face challenges that could hamper the inflow of foreign capital.
This section provides an in-depth discussion of FDI in South Asia. The trends in FDI in the developing Asia region as a whole are discussed first, highlighting the important role of FDI in boosting economic growth, as well as its main economic benefits to host countries. Also examined are the main economic drivers that induce investment in capital-scarce developing countries by investors in capital-rich developed countries. The current picture of FDI in South Asia is then assessed—including the latest trends at regional, country, and sectoral levels—as are the major barriers to FDI in the region. This leads to an examination of the potential for FDI growth in South Asia, and the policy implications for South Asian governments wishing to attract greater amounts of FDI.
South Asia Economic Report 2008_Sec1:5 Sec1:5South Asia Economic Report 2008_Sec1:5 Sec1:5 2/25/2008 11:25:53 AM2/25/2008 11:25:53 AM

6 South Asia Economic Report
FDI Flows in Developing Asia
Background and Trends
Developing Asian economies have maintained high levels of economic growth in recent years, particularly since the late 1980s after the 1985 Plaza Accord. Before then, these economies were unable to mobilize enough domestic savings to fulfill their huge investment requirements and sustain growth. Even though their savings rates were relatively high, the amount of capital needed was enormous. Also, financial intermediation was limited because domestic financial and capital markets were not developed enough to supply sufficient long-term capital to domestic firms. To overcome the shortage of capital and sustain growth, Asian governments actively and successfully promoted inward FDI. Despite the economic stagnation and other severe effects of the 1997 financial crisis, the growth potential of the developing economies of Asia is still considered high compared to most other developing countries. The capital requirements to sustain developing Asia’s robust growth continue to be very high.
A key factor that enabled Asian economies to sustain high growth rates was foreign demand for manufactured goods produced by these countries. Accordingly, Asian economic growth often has been characterized as export-led development. Multinational corporations (MNCs) in developed countries invested in developing Asian economies to profit from factor endowments that account for the region’s comparative advantage, particularly low labor costs. This was instrumental in promoting the export of manufactured goods from developing Asian economies. Initially, FDI concentrated on relatively low value-added and labor-intensive industries, such as textiles and food processing. Subsequently, however, high value-added industries such as those for electronic components and automobiles benefited from considerable FDI.
The following are prominent features of export-oriented growth in developing Asia and worldwide. First, globalization of trade and investment, as well as stronger economic links between Asian economies, contributed to the active flow of funds from developed countries to developing Asia, and—in some cases—between developing Asian countries. Globalization of trade lowered material and transaction costs. Globalization of investment facilitated easier and faster movement of capital. This was complemented by the progressive development of capital markets in developing Asian countries. In addition, Asian governments proactively promoted FDI through such measures as tax incentives, marketing campaigns, and the establishment of industrial estates and export processing zones. FDI from developed countries, especially Japan, increased dramatically after the 1985 Plaza Accord, spurred by the appreciation of the yen. Since the currencies of many developing Asian countries at that time
South Asia Economic Report 2008_Sec1:6 Sec1:6South Asia Economic Report 2008_Sec1:6 Sec1:6 2/25/2008 11:25:53 AM2/25/2008 11:25:53 AM

Foreign Direct Investment in South Asia 7
were pegged to United States (US) dollar, those currencies depreciated against the yen. Additionally, Japan was then experiencing a surge in the cost of domestic labor. Many Japanese firms, including small and medium-sized enterprises (SMEs), consequently started to invest in developing Asian economies, particularly in countries belonging to the Association of Southeast Asian Nations (ASEAN) and in the People’s Republic of China (PRC), to take advantage of lower labor costs.
Second, while some Asian economies such as Hong Kong, China; Republic of Korea; Singapore; and Taipei,China suffered from labor shortages and increasing labor costs because of their relatively small populations, high levels of unemployment and underemployment were prevalent in other developing Asian countries. This generated wage differences between the two groups, and promoted direct investment from the former group in the latter. In general, most developing Asian countries have a reservoir of unutilized and underutilized labor. This labor force is of relatively high quality compared with that in other developing countries, and is attractive to foreign firms seeking lower labor costs—particularly in labor-intensive industries. This promoted FDI among developing Asian economies.
Finally, the development of ICT has created a new and dynamic forum for business relationships and transactions. ICT has expanded business networks around the world, including developing Asia, and lowered business costs. It has also contributed to the global distribution of manufacturing facilities, service centers, and research and development (R&D) centers. The development of ICT has created new business opportunities for countries worldwide.
Benefi ts of FDI
FDI can play a role in the transfer of capital from developed countries to developing countries, thereby benefiting developing countries and the world as a whole. There is extensive literature assessing the economic impacts of FDI on host countries. In general, FDI inflows can contribute to the growth and development of the economy in host countries by generating employment, increasing earnings of foreign currencies through exports, and expanding the supply of goods. FDI associated with MNCs can create spillover effects, providing new skills, technologies, and marketing networks for local producers. It is important to note, however, that FDI benefits are not evenly distributed within the host country, or across countries. This suggests the need for policies in host countries aimed at widening the distribution of the benefits of FDI (ADB 2004).
A successful policy of FDI promotion can create employment opportunities in domestic labor markets in developing countries with large populations. Foreign firms also can provide training for workers—not only in manufacturing processes but also in
South Asia Economic Report 2008_Sec1:7 Sec1:7South Asia Economic Report 2008_Sec1:7 Sec1:7 2/25/2008 11:25:53 AM2/25/2008 11:25:53 AM

8 South Asia Economic Report
management. Such training can make local workers more productive, particularly when technology transfer is involved, and increase their wages. In the case of the automobile industry—a common target for FDI, the production of one passenger car is conservatively estimated to generate direct and indirect employment of 5.3 people (Mohnot 2007).
FDI can help earn foreign currencies for host countries by increasing the manufacture of goods and services that are exported. The earning of foreign currencies is critical for developing countries to generate a current account surplus to finance the import of necessary inputs, among other things. If a current account surplus is not available to finance imports, the country’s capital account must be relied upon, which can lead to debt accumulation. FDI focused on export-oriented industries can positively affect the volume of trade in the host country, and stimulate economic growth. In addition, the global marketing network of MNCs that invest in export-oriented industries can be used to market products of local affiliates and other worthy local firms in the host country. In India, FDI from the US has been observed to positively and significantly affect the export intensities of domestic firms operating in the nontraditional export market (Banga 2002).
If the domestic market of a prospective host country is expected to be large in the future, especially in countries with large populations, MNCs may use FDI to establish large domestic production bases in those markets. Purchasing power and consumption can expand quickly in developing economies with rapidly expanding economies. Countries with large populations can thus provide rich business opportunities for MNCs for the production of goods for domestic markets at local production bases. Such production can replace imports and reduce the burden of foreign borrowing. This type of FDI can also expand consumer welfare in the host country if local consumers are provided a wider range of products of better quality at lower prices.
Technology transfer and knowledge spillovers often can be expected from FDI in developing countries. Spillovers are indirect effects of FDI, and can be defined as circumstances where FDI improves the technology or productivity of domestic firms. Spillover effects can have both vertical and horizontal impacts on host economies. Vertical spillovers refer to inter-industry impacts. For example, when foreign manufacturing firms tap local suppliers for procurement of inputs, the demand for local inputs expands production possibilities in the host country through backward linkages. Horizontal spillovers occur when FDI promotes intra-industry competition in local markets through imitation effects, and positive effects on human capital, industrial relations, market competition, and technology transfer. Vertical and horizontal effects can help local firms raise productivity as a result of improvements in human capital and industrial management skills, competition and efficiency, production processes, technological capabilities, and R&D. Through these linkages, FDI can help diversify
South Asia Economic Report 2008_Sec1:8 Sec1:8South Asia Economic Report 2008_Sec1:8 Sec1:8 2/25/2008 11:25:53 AM2/25/2008 11:25:53 AM
Foreign Direct Investment in South Asia 9
local industries and thus diminish the economic vulnerability of host economies to external shocks that result from a narrowly based industrial structure.
Empirical studies have confirmed the economic benefits of FDI in South Asian countries. Agarwal (2000) showed that FDI inflows in South Asia led to greater domestic investment and faster economic growth, particularly during the late 1980s and early 1990s. Bosworth, Collins, and Virmani (2007) found that augmenting FDI in India will likely stimulate the country’s economic growth. Bergman (2006) demonstrated that FDI in the pharmaceutical industry in India rendered positive spillover effects, such as greater competition and improved industrial management skills in that industry.
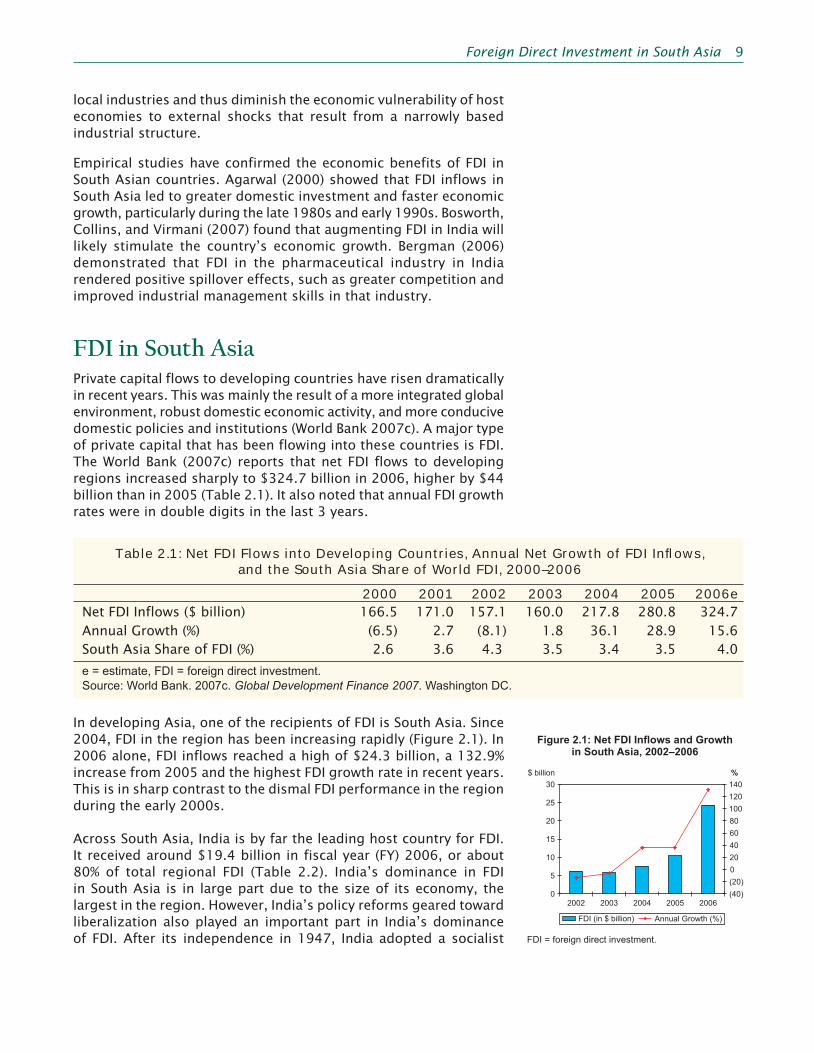
FDI in South AsiaPrivate capital flows to developing countries have risen dramatically in recent years. This was mainly the result of a more integrated global environment, robust domestic economic activity, and more conducive domestic policies and institutions (World Bank 2007c). A major type of private capital that has been flowing into these countries is FDI. The World Bank (2007c) reports that net FDI flows to developing regions increased sharply to $324.7 billion in 2006, higher by $44 billion than in 2005 (Table 2.1). It also noted that annual FDI growth rates were in double digits in the last 3 years.
Table 2.1: Net FDI Flows into Developing Countries, Annual Net Growth of FDI Infl ows, and the South Asia Share of World FDI, 2000–2006
2000 2001 2002 2003 2004 2005 2006eNet FDI Inflows ($ billion) 166.5 171.0 157.1 160.0 217.8 280.8 324.7Annual Growth (%) (6.5) 2.7 (8.1) 1.8 36.1 28.9 15.6South Asia Share of FDI (%) 2.6 3.6 4.3 3.5 3.4 3.5 4.0
e = estimate, FDI = foreign direct investment.Source: World Bank. 2007c. Global Development Finance 2007. Washington DC.
In developing Asia, one of the recipients of FDI is South Asia. Since 2004, FDI in the region has been increasing rapidly (Figure 2.1). In 2006 alone, FDI inflows reached a high of $24.3 billion, a 132.9% increase from 2005 and the highest FDI growth rate in recent years. This is in sharp contrast to the dismal FDI performance in the region during the early 2000s.
Across South Asia, India is by far the leading host country for FDI. It received around $19.4 billion in fiscal year (FY) 2006, or about 80% of total regional FDI (Table 2.2). India’s dominance in FDI in South Asia is in large part due to the size of its economy, the largest in the region. However, India’s policy reforms geared toward liberalization also played an important part in India’s dominance of FDI. After its independence in 1947, India adopted a socialist FDI = foreign direct investment.
Figure 2.1: Net FDI Infl ows and Growth in South Asia, 2002–2006
2002 2003 2004 2005 2006
0
20
40
60
80
(40)
(20)
100
120
140
%
0
5
10
15
20
25
30
$ billion
FDI (in $ billion) Annual Growth (%)
South Asia Economic Report 2008_Sec1:9 Sec1:9South Asia Economic Report 2008_Sec1:9 Sec1:9 2/25/2008 11:25:53 AM2/25/2008 11:25:53 AM

10 South Asia Economic Report
planned economy. Inefficiency was a problem in all sectors, making it a high-cost economy. Regulations on imports and FDI were strict, and the domestic market was virtually closed. In the late l980s, however, the Government gradually liberalized the economy and lifted restrictions on FDI. Consequently, India achieved high economic growth in 1988 and 1989. In July 1991, the New Industrial Policy was announced. Under this policy, foreign investment was approved without conditions, formalities for granting import licenses were simplified, and private companies were permitted to enter fields that previously had been dominated by government-owned companies. India changed itself from a closed economy to an open economy. Movement toward liberalization in terms of FDI promotion is now common to all countries in South Asia.
Table 2.2: Net FDI Infl ows for South Asian Countries,2005–2006
FDI ($ million)Annual Growth
(%)
Share ofReg’l FDI Total (%)2005 2006
Afghanistan 271 231 (14.8) 1.0Bangladesh 800 743 (7.1) 3.1Bhutan 9 6 (32.2) 0.0India 7,661 19,442 153.8 79.9Maldives 10 14 46.3 0.1Nepal 2 (6) (441.6) 0.0Pakistan 1,459 3,451 136.5 14.2Sri Lanka 234 451 92.7 1.9
FDI = foreign direct investment, Reg’l = regional.Source: Asian Development Bank. 2007c. South Asia Economic Report: Social Sectors in Transition. Manila.
Other countries in the region that also fared well in attracting more FDI in FY2006 were Pakistan and Sri Lanka, with FDI growth that year of 136.5% and 92.7%, respectively. Nepal, on the other hand, suffered from net FDI outflows in FY2006.
FDI in India is highest in the country’s services sector. In FY2006, that sector received the most, at $4.8 billion, followed by the electrical equipment sector, with $2.7 billion (Table 2.3). This differed from FY2004–FY2005, when the electrical equipment sector was the largest recipient. In FY2006, the services sector also registered the highest FDI growth rate, at 717.4%, while construction came in next with 552.3%. Conversely, three sectors experienced a decline in FDI that year—cement and gypsum (-46.2%), chemicals (-53.9%), and telecommunications (-23.4%). The attractiveness of India’s services sector to FDI is explained by robust sectoral growth, rapid deregulation and liberalization of sector policies, and the successful privatization of government-owned services (Gordon and Gupta 2004).
South Asia Economic Report 2008_Sec1:10 Sec1:10South Asia Economic Report 2008_Sec1:10 Sec1:10 2/25/2008 11:25:53 AM2/25/2008 11:25:53 AM

Foreign Direct Investment in South Asia 11
Table 2.3: FDI Infl ows by Sector in India, 2004–2006
($ million)
2004 2005 2006Cement and Gypsum Products 0 452 243Chemicals 198 447 206Construction 152 151 985Drugs and Pharmaceuticals 292 172 215Electrical Equipment 721 1,451 2,733Fuel 166 94 250Food Processing 38 42 98Services Sector 469 581 4,749Telecommunications 129 680 521Transportation 179 222 466Source: Department of Industrial Policy and Promotion. 2007. Factsheet on Foreign Direct Investment. New Delhi: Government of India.
In Pakistan, the communications sector has consistently been the top sectoral FDI recipient, with $1.9 billion in FY2007 and a FY2005–FY2007 yearly average of $1.5 billion (Table 2.4). However, the sector suffered a decline in FDI of about 2.0% in FY2007. Following communications in FDI in FY2007 were the financial sector, with $930 million, and the oil and gas explorations sector, with $545 million. The surge in FDI in the communications sector is largely attributed to foreign investment incentives, such as no minimum requirement of foreign ownership, and full repatriation of profits, among other things (Pakistan Telecommunication Authority 2007). On the other hand, the large FDI inflow in the financial sector was due mainly to banking consolidation brought about by mergers and acquisitions (ADB 2007a).
Table 2.4: FDI Infl ows by Sector in Pakistan, 2005–2007
($ million)
2005 2006 2007Communications 518 1,938 1,899Financial Business 269 329 930Oil and Gas Explorations 194 313 545Tobacco and Cigarettes 7 3 390Power 73 321 205Trade 52 118 173Construction 43 90 157Petroleum Refining 24 31 155Beverages 6 6 89Personal Services 24 62 84
FDI = foreign direct investment.Source: State Bank of Pakistan. 2007. Statistical Bulletin, October. Available: http://www.sbp.org.pk/reports/stat_reviews/Bulletin/2007/Oct_07/index.htm
South Asia Economic Report 2008_Sec1:11 Sec1:11South Asia Economic Report 2008_Sec1:11 Sec1:11 2/25/2008 11:25:53 AM2/25/2008 11:25:53 AM

12 South Asia Economic Report
In Bangladesh, the telecommunications sector has also been the major host of FDI. The latest FDI survey by the Bangladesh Board of Investment in 2004 revealed that the telecommunications sector received $237 million, or 35.9% of total FDI (Table 2.5). The other top FDI host sectors in 2004 were energy and power ($133 million or 20.1%), textiles ($117 million or 17.7%), other services ($71 million or 10.7%), and chemicals ($47 million or 7.2%).
Table 2.5: FDI Infl ows by Sector in Bangladesh, 2004
2004($ million) % Share
Telecommunications 237 35.9Energy and Power 133 20.1Textiles 117 17.7Other Services 71 10.7Chemicals 47 7.2Leather and Rubber 19 2.8Engineering 13 1.9Misc/Nec 10 1.5Agro-based 9 1.4Food and Allied 3 0.5Glass and Ceramics 1 0.2Printing and Publications 1 0.1FDI = foreign direct investment, Misc = miscellaneous, Nec = not elsewhere counted.Note: 2004 is calendar year.Source: Bangladesh Board of Investment. 2005. FDI in Bangladesh in 2004. Dhaka.
In Sri Lanka, the services sector has been the leading sector recipient of FDI since 2000, followed by manufacturing. In 2000, for example, FDI in the services sector accounted for 55.6% of the FDI total, while the manufacturing sector received around 41.7% (United Nations Conference on Trade and Development [UNCTAD] 2004). The major subsectors that continue to attract large amounts of FDI are telecommunications and business process outsourcing (World Bank 2007e). Telecommunications alone received about half of the total FDI in the services sector (UNCTAD 2004). Prior to the 2000, the manufacturing sector accounted for the largest share of FDI.
In Nepal, a large share of FDI has been in the manufacturing sector. In 2003, around 49.1% of the total approved FDI projects in Nepal were in that sector, while 24.0% and 21.4% were in the tourism sector and services sector, respectively (Pant and Sigdel 2004). In manufacturing, the key recipients were the food, beverage, and tobacco subsector, with an FDI-approved project share of 25.0% of the total, and the textile and garment subsector, with a 24.0% share.
South Asia Economic Report 2008_Sec1:12 Sec1:12South Asia Economic Report 2008_Sec1:12 Sec1:12 2/25/2008 11:25:53 AM2/25/2008 11:25:53 AM

Foreign Direct Investment in South Asia 13
In terms of FDI stock as a percentage of GDP, the South Asia ratio of 1.2% in 1990 gradually rose to 4.7% in 2000 and 6.5% in 2006 (Figure 2.2). Maldives FDI stock was consistently the highest since 1990, reaching 21.4% in 2006—reflecting the small size of its economy. Notably, most South Asian countries were able to raise their FDI stock ratios since 1990. However, the FDI stock of South Asia remains small compared to that of East Asia and Southeast Asia (Figure 2.3). In 2006, South Asia’s FDI stock to GDP ratio of 6.5% was far below Southeast Asia’s 39.5% and East Asia’s 29.1%. In the same year, Thailand and Viet Nam had FDI stock to GDP ratios of 33.0% and 54.8%. It is also noteworthy that the PRC acquired more FDI than India, as the former had a ratio of 11.1% compared to the latter’s 5.7%. This shows the huge potential of South Asia for attracting more FDI.
FDI flows between South Asia, East Asia, and Southeast Asia have risen in recent years and now account for almost 50.0% of the Asian region’s total FDI inflows. FDI flows between East Asia and Southeast Asia have been significant. However, FDI flows between South Asia and East and Southeast Asia are relatively small. Within East Asia, there is a relatively high level of intra-regional FDI, due mainly to the presence of the PRC, an attractive destination for foreign investment. On the other hand, cross-border FDI within South Asia is negligible (Ahmed and Ghani 2007), as may be seen in Table 2.6. India is the only country in the region that is investing to any extent in its neighbors.
Table 2.6: Intra-Regional FDI in South Asia
(% of total regional FDI inflows)
Source of FDI Recipient of FDIIndia Pakistan Sri Lanka Bangladesh Nepal
India — 2.60 0.20 51.00Pakistan — 0.60 0.10 0.03Sri Lanka 0.01 — 0.10 —Bangladesh 0.01 0.08 0.18 —Nepal — — — —Share of South Asia 0.04 — 2.10 0.40 37.60— = data not available, FDI = foreign direct investment.Source: Bhattacharya, Debapriya. 2007. South Asia: Intra-Regional Opportunities and Challenges. Presented at the Fostering Trade through Private-Public Dialogue Expert Meeting on Regional Integration in Asia, New Delhi, 28–29 March; other sources and time periods.
The major source countries of FDI in South Asia are predominantly in developed regions—North America and Western Europe. But other important FDI suppliers are located in East Asia and the Middle East.
Figure 2.2: FDI Stock as a Percentage of GDP in South Asia in 1990,
2000, and 2006
FDI = foreign direct investment, GDP = gross domestic product.Source: United Nations Conference on Trade and Development. 2007. World Investment Report 2007. Geneva.
Figure 2.3: FDI Stock as a Percentage of GDP in Selected Asian Regions
and Countries, 2006
FDI = foreign direct investment, GDP = gross domestic product, PRC = People’s Republic of China.Source: United Nations Conference on Trade and Development. 2007. World Investment Report 2007. Geneva.
0 5 10 15 20 25
South Asia
Afghanistan
Bangladesh
Bhutan
India
Maldives
Nepal
Pakistan
Sri Lanka
%
200620001990
1.2
0.3
1.0
0.7
0.5
11.6
0.3
3.6
8.5
4.7
0.6
4.4
2.5
3.8
19.0
1.3
9.8
9.8
6.5
0.3
6.3
2.8
5.7
21.4
1.5
11.4
10.9
29.1
6.5
39.5
6.3 5.7
21.4
11.410.9
11.1
33.0
54.8
0
10
20
30
40
50
60
East Asia
India
PRC
South Asia
Maldives
Thailand
Southeast Asia
Pakistan
Viet Nam
Bangladesh
Sri Lanka
%
South Asia Economic Report 2008_Sec1:13 Sec1:13South Asia Economic Report 2008_Sec1:13 Sec1:13 2/25/2008 11:25:53 AM2/25/2008 11:25:53 AM

14 South Asia Economic Report
For India, the top three FDI source countries were Mauritius, the United Kingdom (UK), and the US in FY2006 (Table 2.7). Mauritius1 invested $6.4 billion while the UK and the US infused $1.9 billion and $856 million, respectively. Notably, Singapore, Japan, and the Republic of Korea were included in the list of top FDI sources for India.
For Pakistan in FY2007, the countries that provided most of foreign private investments were the UK, the US, the Netherlands, and the PRC (Table 2.8). The largest amount of foreign private investment in Pakistan came from the UK, at $1.8 billion, while the US provided the second-largest amount. The PRC was the largest Asian investor in Pakistan in FY2007, with foreign private investments amounting to $712 million.
For Bangladesh, the top three FDI source countries are all in developed regions. In 2004, Norway accounted for the most FDI in Bangladesh, at $176 million or 26.6% of the year’s total, followed by the UK ($108 million or 16.3%) and the US ($61 million or 9.2%) (Table 2.9). Notably, 5 out of the top 10 FDI suppliers in Bangladesh in 2004 were based in Asia—in Hong Kong, China; Republic of Korea; Malaysia; Taipei,China; and Japan.
Overall, the increasing investments from countries in East Asia indicate the future possibility that these countries may become large investors in South Asia through promotion of interregional FDI.
Table 2.7: Leading Source Countries of FDI in India, 2004–2006
($ million)
2004 2005 2006Mauritius 1,129 2,570 6,363United Kingdom 101 266 1,878United States 669 502 856Netherlands 267 76 644Singapore 184 275 578Germany 145 303 120France 117 18 117Japan 126 208 85Republic of Korea 35 60 71Switzerland 77 96 56FDI = foreign direct investment.Source: Department of Industrial Policy and Promotion. 2007. Factsheet on Foreign Direct Investment. New Delhi: Government of India.
1 Foreign investors from various countries use the India–Mauritius Double Taxation Avoidance Agreement (DTAA) to their advantage by first establishing their holding companies in Mauritius and then investing in India, thereby significantly lowering their tax obligations. The DTAA allows for the bypass of capital gains tax and other tax payments in India. See Office of Industries, US International Trade Commission (2007).
South Asia Economic Report 2008_Sec1:14 Sec1:14South Asia Economic Report 2008_Sec1:14 Sec1:14 2/25/2008 11:25:54 AM2/25/2008 11:25:54 AM

Foreign Direct Investment in South Asia 15
Table 2.8: Leading Source Countries of Foreign Private Investment in Pakistan, 2005–2007
($ million)
2005 2006 2007United Kingdom 199 225 1,820United States 373 821 1,767Netherlands 60 120 778People’s Republic of China 1 2 712United Arab Emirates 417 1,488 677Singapore 11 16 139Saudi Arabia 18 279 105Mauritius 65 83 91Germany 15 25 86Japan 42 48 68
Note: Foreign private investment refers to foreign direct investment and foreign portfolio investments.Source: State Bank of Pakistan. 2007. Statistical Bulletin, October. Available: http://www.sbp.org.pk/reports/stat_reviews/Bulletin/2007/Oct_07/index.htm
Table 2.9: Leading Source Countries of FDI in Bangladesh, 2004
2004($ million) % Share
Norway 176 26.6United Kingdom 108 16.3United States 61 9.2Republic of Korea 60 9.1Malaysia 45 6.8Hong Kong, China 33 4.9Taipei,China 32 4.9Japan 31 4.7Canada 27 4.1Egypt 20 3.0FDI = foreign direct investment.Note: 2004 is calendar year. Source: Bangladesh Board of Investment. 2005. FDI in Bangladesh in 2004. Dhaka.
Constraints to FDI in South Asia Despite the gains of recent years, South Asia remains a less attractive destination for FDI compared to other regions in the world. In 2006, FDI inflows into South Asia were very limited. The top two FDI host regions were the European Union (EU) and North America, with shares of world total FDI of 40% and 19%, respectively (UNCTAD 2007). Among Asian regions, South Asia was the least attractive FDI destination.
South Asia Economic Report 2008_Sec1:15 Sec1:15South Asia Economic Report 2008_Sec1:15 Sec1:15 2/25/2008 11:25:54 AM2/25/2008 11:25:54 AM

16 South Asia Economic Report
Several surveys have identified bottlenecks that hinder FDI in South Asia: the poor business climate, poor infrastructure, restrictive labor policy and labor unrest, political uncertainties and civil conflicts, weak regulatory systems, and rampant corruption. The perception of investors of the business climate in host countries is a primary determinant of FDI. This is in turn dependent on economic and political conditions in host countries, such as the development of infrastructure, labor relations, the political situation, and enforcement of regulations and laws. Surveys discussed below indicate the bottlenecks to activities of MNCs in host countries that affect investor perceptions.
Poor Business Climate
The World Bank (2007c) reported that South Asia is the second-least business-friendly region in the world, after Sub-Saharan Africa, based on its Doing Business 2008 survey of the perceptions of foreign investors of 178 countries. As shown in Table 2.10, South Asian countries’ global rankings on the ease of doing business averaged 107. Table 2.11 shows the World Bank’s global ranking of the ease of doing business for each South Asian country for 2007 and 2008. Maldives was ranked the most business-friendly South Asian country in both 2007 and 2008. On the other hand, Afghanistan was ranked the most business-unfriendly country in the region. India, the largest economy in South Asia, ranked relatively low, at 120, but this was an improvement over its 2007 ranking of 132. Only India and Bhutan posted slight improvements in their global rankings in 2008, suggesting an improving business climate in those countries. Conversely, the global rankings of the remaining South Asian countries deteriorated in 2008, indicating a worsening business environment in those countries. These deteriorating rankings are considered to derive from foreign investor perceptions of poor infrastructure, restrictive labor policy and labor unrest, political uncertainties and civil conflicts, weak regulatory systems, and rampant corruption.
Table 2.10: Global Ranking on the Ease of Doing Business, by Region, 2007
RegionAverage of Regions’ Country Rankings
OECD 22Eastern Europe and Central America 76East Asia and Pacific 77Latin America and Caribbean 87Middle East and North Africa 96South Asia 107Sub-Saharan Africa 136OECD = Organisation for Economic Co-operation and Development.Note: South Asia comprises Afghanistan, Bhutan, Bangladesh, India, Maldives, Nepal, Pakistan, and Sri Lanka.Source of basic data: World Bank. 2007c. Doing Business 2008: Overview. Washington DC. Available: http://www.doingbusiness.org/documents/DB-2008-overview.pdf
South Asia Economic Report 2008_Sec1:16 Sec1:16South Asia Economic Report 2008_Sec1:16 Sec1:16 2/25/2008 11:25:54 AM2/25/2008 11:25:54 AM
Foreign Direct Investment in South Asia 17
Table 2.11: Global Ranking on the Ease of Doing Business, by South Asian Country, 2007–2008
2007 2008Afghanistan 156 159Bangladesh 102 107Bhutan 122 119India 132 120Maldives 58 60Nepal 104 111Pakistan 73 76Sri Lanka 100 101
Source: World Bank. 2007c. Doing Business 2008: Overview. Washington DC. Available: http://www.doingbusiness.org/documents/DB-2008-overview.pdf
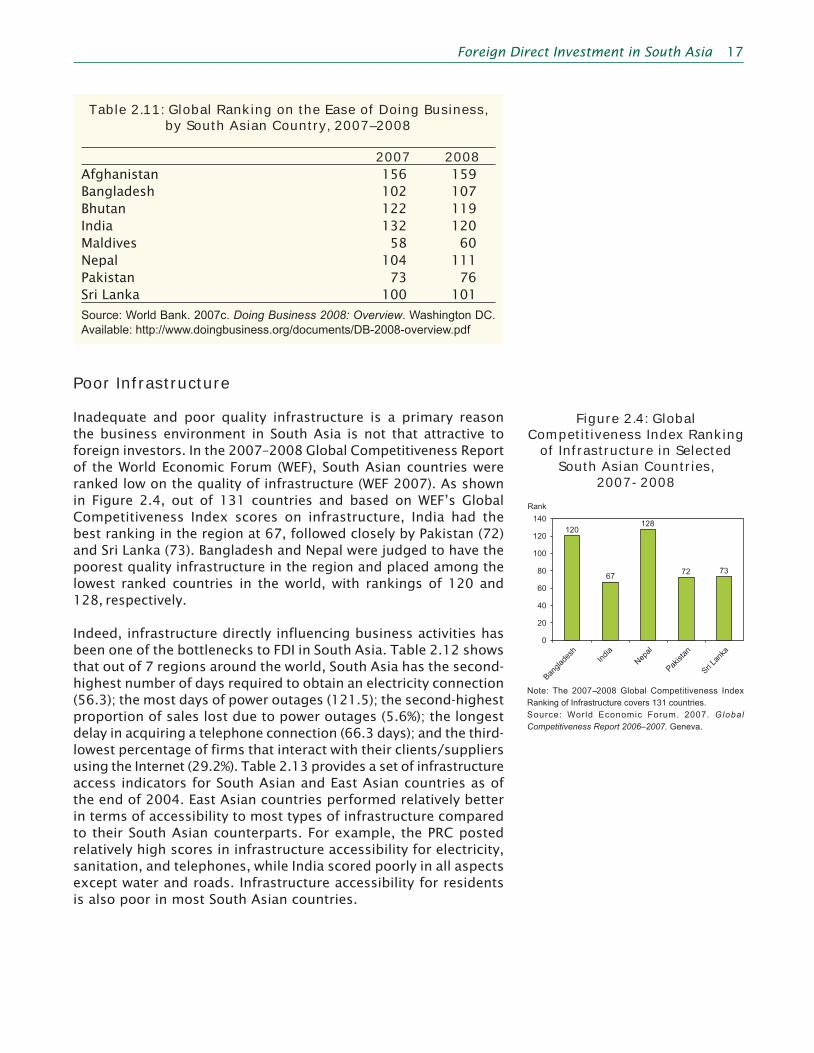
Poor Infrastructure
Inadequate and poor quality infrastructure is a primary reason the business environment in South Asia is not that attractive to foreign investors. In the 2007–2008 Global Competitiveness Report of the World Economic Forum (WEF), South Asian countries were ranked low on the quality of infrastructure (WEF 2007). As shown in Figure 2.4, out of 131 countries and based on WEF’s Global Competitiveness Index scores on infrastructure, India had the best ranking in the region at 67, followed closely by Pakistan (72) and Sri Lanka (73). Bangladesh and Nepal were judged to have the poorest quality infrastructure in the region and placed among the lowest ranked countries in the world, with rankings of 120 and 128, respectively.
Indeed, infrastructure directly influencing business activities has been one of the bottlenecks to FDI in South Asia. Table 2.12 shows that out of 7 regions around the world, South Asia has the second-highest number of days required to obtain an electricity connection (56.3); the most days of power outages (121.5); the second-highest proportion of sales lost due to power outages (5.6%); the longest delay in acquiring a telephone connection (66.3 days); and the third-lowest percentage of firms that interact with their clients/suppliers using the Internet (29.2%). Table 2.13 provides a set of infrastructure access indicators for South Asian and East Asian countries as of the end of 2004. East Asian countries performed relatively better in terms of accessibility to most types of infrastructure compared to their South Asian counterparts. For example, the PRC posted relatively high scores in infrastructure accessibility for electricity, sanitation, and telephones, while India scored poorly in all aspects except water and roads. Infrastructure accessibility for residents is also poor in most South Asian countries.
Note: The 2007--2008 Global Competitiveness Index Ranking of Infrastructure covers 131 countries.Source: World Economic Forum. 2007. Global Competitiveness Report 2006–2007. Geneva.
Figure 2.4: Global Competitiveness Index Ranking
of Infrastructure in Selected South Asian Countries,
2007-2008
120
67
128
72 73
0
20
40
60
80
100
120
140
Banglad
esh
India
Nep
al
Pakista
n
Sri La
nka
Rank
South Asia Economic Report 2008_Sec1:17 Sec1:17South Asia Economic Report 2008_Sec1:17 Sec1:17 2/25/2008 11:25:54 AM2/25/2008 11:25:54 AM

18 South Asia Economic Report
Table 2.12: Infrastructure Indicators, by Region
Region
Delay in Obtaining
an Electrical
Connection (days)
Number of Electrical Outages
(days)
Value Lost Due to
Electrical Outages
(% of sales)
Number of Water Supply
Failures (days)
Delay in Obtaining a Mainline Telephone Connection
(days)
Firms Using the Web in Interaction with Clients
and Suppliers
(%)East Asia and Pacific 14.2 9.0 2.4 3.1 11.3 25.2Europe and Central Asia 9.3 14.0 3.1 7.5 13.4 56.7Latin America and Caribbean 33.0 17.8 3.1 14.5 46.5 41.0Middle East and North Africa 57.5 46.1 4.7 41.7 64.0 32.8OECD 9.7 1.5 2.3 0.3 9.0 80.2South Asia 56.3 121.5 5.6 12.0 66.3 29.2Sub-Saharan Africa 43.8 56.4 5.7 37.2 58.4 20.4OECD = Organisation for Economic Co-operation and Development.Source: World Bank. Various dates. Enterprise Surveys. Available: http://www.enterprisesurveys.org
Table 2.13: Infrastructure Access Indicators in South Asia and East Asia, end-2004
Region/Country
Electricity(% of population
with access to network)
Water(% of population with access to
improved sources)
Sanitation(% of population with access to
improved sanitation)
Teledensity(fixed line and
mobile subscribers per 1000 people)
Roads(% of rural population
living within 2 kms. of an
all- season road)
South Asia Afghanistan 5 13 8 12 — Bangladesh 25 75 48 16 1.6 India 40 86 30 71 3.2 Nepal 15 84 27 18 0.6 Pakistan 55 90 54 44 1.8 Sri Lanka 75 78 91 122 —
East Asia Cambodia 10 34 16 38 1.0 PRC 97 77 44 424 1.4 Indonesia 80 78 52 127 1.7 Myanmar 5 80 73 8 — Viet Nam 60 73 41 88 1.2
— = data not available, kms. = kilometers, PRC = People’s Republic of China.Source: Estache, Antonio, and Ana Goicoechea. 2005. A “Research” Database on Infrastructure Economic Performance. World Bank Policy Research Paper 3643. Washington DC.
South Asia Economic Report 2008_Sec1:18 Sec1:18South Asia Economic Report 2008_Sec1:18 Sec1:18 2/25/2008 11:25:54 AM2/25/2008 11:25:54 AM

Foreign Direct Investment in South Asia 19
An important reason for poor infrastructure in South Asia is the scant investment in infrastructure by the private sector. Although such investment has been increasing, between 1984 and 2005 South Asia received only one fourth of total private sector investment in infrastructure in developing Asia, while Southeast Asia received half of the total (Nataraj 2007).
Restrictive Labor Policy and Labor Unrest
According to the World Bank (2007b), labor policy in South Asia is characterized as restrictive and inflexible, and may hamper FDI in the region. Out of 7 regions in the world, based on the World Bank’s Doing Business in South Asia survey for 2007 (Table 2.14), South Asia ranked sixth in terms of “employing workers,” making it the second-worst region in this category. South Asia ranked last in terms of the “cost of firing” workers, with firing cost equivalent to 72 weeks of wages (the highest in the world). In addition, South Asia ranked second-worst in terms of the “difficulty of firing” index, and was the poorest performer in terms of “enforcing contracts.” On the other hand, it had the lowest hiring cost worldwide. Among South Asian countries, Maldives was the best in terms of employing workers—ranking fifth in the world out of 175 countries, while Bhutan had the best rank (56th) in South Asia with respect to enforcing contracts. The worst South Asian country in employing workers was Nepal (150), while in enforcing contracts, the lowest ranking was Bangladesh (174). India was likewise ranked relatively low in employing workers (112) and enforcing contracts (173).
Table 2.14: Global Rankings of Selected Labor Policy Indicators, by Region and South Asian Country, 2007
Region/CountryEmploying Workers
Cost of Firing
Enforcing Contracts
Region High Income: OECD 2 2 1 East Asia and Pacifi c 1 3 3 Eastern Europe and Central Asia 5 1 2 Latin America and Caribbean 3 5 6 Middle East and North Africa 4 4 4 South Asia 6 7 7 Sub-Saharan Africa 7 6 5South Asia Afghanistan 74 — 165 Bangladesh 75 — 174 Bhutan 116 — 56 India 112 — 173 Maldives 5 — 83 Nepal 150 — 105 Pakistan 126 — 163 Sri Lanka 98 — 90— = data not available, OECD = Organisation for Economic Co-operation and Development.Note: This global ranking covers 175 countries.Source: World Bank. 2007b. Doing Business in South Asia 2007. Washington DC.
South Asia Economic Report 2008_Sec1:19 Sec1:19South Asia Economic Report 2008_Sec1:19 Sec1:19 2/25/2008 11:25:54 AM2/25/2008 11:25:54 AM

20 South Asia Economic Report
There are a number of explanations as to why labor policies in South Asia are perceived as inflexible. In India, Nepal, and Sri Lanka, for example, procedures for redundancy dismissal remain rigid. The mandated notice period for firing a worker in India is around 13 weeks, and the severance payment in Sri Lanka is around 39 months of wages. There are also maximum time limits on term labor contracts—1 year in Bhutan and 9 months in Pakistan. Such limits and procedures may hurt employment and firm performance. They may discourage both local and foreign firms to hire, leading to low employment, and can reduce the ability of firms to expand and improve performance (World Bank 2007b).
Such rigidities in labor regulations increase the likelihood of frictions between employers and workers, which can affect decisions on foreign investment. Menon and Sanyal (2004) demonstrated that labor unrest in various states in India negatively influenced foreign investment inflows into that country. Similarly, labor disputes in Nepal, brought about by restrictive labor policies, have contributed to the reduced attractiveness of that country’s investment climate (ADB 2007a).
Political Uncertainties and Civil Confl icts
Political instability and civil conflicts have been found to be a major factor in reducing the attractiveness of South Asia as a host for foreign capital. Afghanistan, Pakistan, and Sri Lanka continue to face political uncertainties and security challenges that are likely to hinder FDI. Empirical evidence demonstrates that FDI inflows into Sri Lanka are vulnerable to the ongoing civil conflict there (Chaitanya 2007). Likewise, in Afghanistan, the pace of foreign investment also may be slow because of the sporadic suicide bombings, kidnappings, and attacks (World Bank 2007d). Sahoo (2006) cited political instability as a major drawback for foreign investment in Nepal, while the worsening political situation in Pakistan (particularly in late 2007) may also hamper FDI inflows into that country.
Weak Regulatory Systems and Rampant Corruption
It is well documented that existing regulatory systems governing investment in South Asia are weak. Specifically, corruption continues to be rampant; governance remains poor; “red tape regulatory obstacles” commonly affect the conduct of business activities; capital flows are stringently controlled; and there are a lack of “facilitating harmonized frameworks on competition and infrastructure” (Dutz 2004). The 2006 Corruption Perceptions Index (CPI) of Transparency International, based on a survey of 163 countries (Transparency International 2007), showed that Bhutan is the least-corrupt country in South Asia (Table 2.15). Conversely, the remaining countries of the region are positioned well down in CPI scores and country ranking. Bangladesh scored as the most corrupt country in the region and positioned lowest in the ranking of regional countries. Transparency International’s Bribe Payers Index (BPI), a measure of the propensity
South Asia Economic Report 2008_Sec1:20 Sec1:20South Asia Economic Report 2008_Sec1:20 Sec1:20 2/25/2008 11:25:54 AM2/25/2008 11:25:54 AM

Foreign Direct Investment in South Asia 21
of the leading exporters in a country to offer bribes (out of a sample of 30 countries), is presented in Table 2.16. It shows that India had the worst BPI in 2006 among the 30 countries sampled, including the 8 Asian countries sampled. Transparency International notes that one of the most corrupt branches of government in South Asia is the judiciary.
Table 2.15: Corruption Perceptions Index (CPI) for South Asian Countries, 2006
Country CPI ScoreCPI Country
RankingBangladesh 2.0 156Bhutan 6.0 32India 3.3 70Nepal 2.5 121Pakistan 2.2 142Sri Lanka 3.1 84Note: CPI score has a range from 0 (highly corrupt) to 10 (highly clean).Source: Transparency International. 2007. Global Corruption Report 2007. United Kingdom.
Table 2.16: Bribe Payers Index (BPI) for Selected Asian Countries, 2006
Country BPI ScoreBPI Country
RankingJapan 7.1 11Singapore 6.8 12Hong Kong, China 6.0 18Republic of Korea 5.8 21Malaysia 5.6 25Taipei,China 5.4 26PRC 4.9 29India 4.6 30PRC = People’s Republic of China.Note: BPI score has a range from 0 (high propensity of fi rms to bribe) to 10 (low propensity of fi rms to bribe)Source: Transparency International. 2007. Global Corruption Report 2007. United Kingdom.
South Asia also continues to rank low relative to the other regions in the world in terms of cross-border trade, credit availability, property registration, contract enforcement, and business closure. An example is Bangladesh, where registering property requires 425 days. For the whole of South Asia, the average number of days needed to transfer a property is 118. In the Organisation for Economic Co-operation and Development (OECD) and East Asia, the number of days needed to transfer a property is 32 and 86 days, respectively (World Bank 2007b).
South Asia Economic Report 2008_Sec1:21 Sec1:21South Asia Economic Report 2008_Sec1:21 Sec1:21 2/25/2008 11:25:54 AM2/25/2008 11:25:54 AM
22 South Asia Economic Report
Potential for FDI in South AsiaThere is still much potential for South Asian countries to promote FDI despite the barriers discussed above. Surveys and other evidence support this assertion.
Robust economic growth is one of the principal factors supporting the strong potential for FDI in South Asia. The region posted GDP growth rates of 8.7% in 2005 and 8.8% in 2006, both of which were higher than the average GDP growth rates of developing Asia in the same years. Robust regional growth was due in large part to the booming economy of India, but the strong showing of the services sector region-wide was also an important factor. A liberalized regulatory environment in the services sector can help attract more FDI into South Asia (Ahmed and Ghani 2007). South Asia is expected to continue to experience relatively high economic growth in the short to medium term, with GDP expansion projected at 8.1% for both 2007 and 2008 (Table 2.17). Such high rates of economic expansion will allow for an improvement in disposable incomes, thereby making South Asia more attractive to “market-seeking” FDI.
Table 2.17: GDP Growth Rates, by Region in Asia and the Pacifi c, 2005–2008
Region 2005 2006 2007f 2008fCentral Asia 11.1 12.4 11.1 10.1East Asia 8.3 9.0 8.9 8.7South Asia 8.7 8.8 8.1 8.1Southeast Asia 5.6 6.0 6.1 6.1Pacific 2.6 2.6 3.5 3.2Average 8.0 8.5 8.3 8.2f = forecast, GDP = gross domestic product.
South Asia continues to experience impressive export growth, which is also an important driver of FDI. In 2005 and 2006, exports of goods grew sharply by 21.0% and 19.6%, respectively. They are expected to continue double-digit expansion, reaching 14.4% in 2007 and 14.5% in 2008. Indeed, buoyant export growth will enable the region to attract more FDI, especially if intra-firm and intra-regional trade increases. Another aspect of the region that enhances its potential for FDI is its vibrant services sector. The sector is now the main engine of growth, as regional services output expanded by 10.5% in 2006. In most South Asian countries, including India, the services sector hosted more FDI than any other sector.
The development of India’s ICT sector and its expanding role in a knowledge-based economy has likewise spurred FDI inflows into the region, making it an attractive location for ICT-related activities of MNCs. Indeed, global firms have established R&D centers in India in recognition of that country’s capabilities and resources (Kumar 2003). India’s endowment of skilled workers, the high quality of its
South Asia Economic Report 2008_Sec1:22 Sec1:22South Asia Economic Report 2008_Sec1:22 Sec1:22 2/25/2008 11:25:54 AM2/25/2008 11:25:54 AM
Foreign Direct Investment in South Asia 23
tertiary education, and its use of English as a medium of instruction have all been important factors boosting ICT-related investment by MNCs (Balasubramanyam and Sapsford 2007).
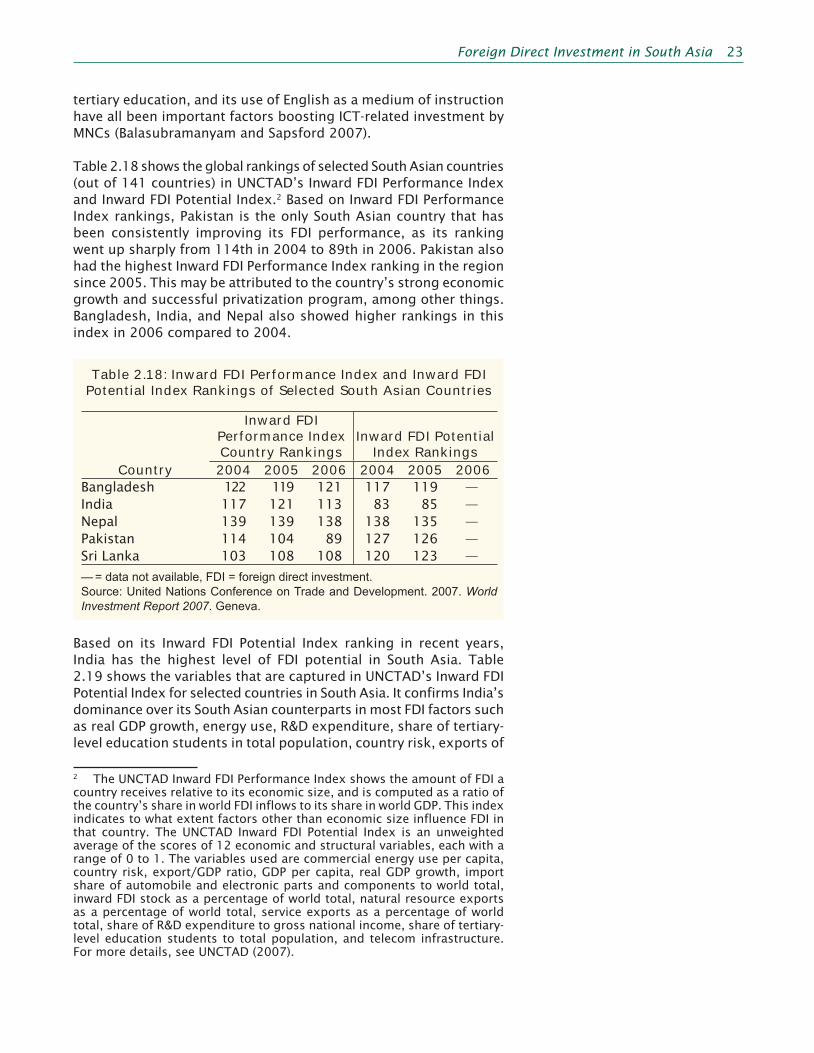
Table 2.18 shows the global rankings of selected South Asian countries (out of 141 countries) in UNCTAD’s Inward FDI Performance Index and Inward FDI Potential Index.2 Based on Inward FDI Performance Index rankings, Pakistan is the only South Asian country that has been consistently improving its FDI performance, as its ranking went up sharply from 114th in 2004 to 89th in 2006. Pakistan also had the highest Inward FDI Performance Index ranking in the region since 2005. This may be attributed to the country’s strong economic growth and successful privatization program, among other things. Bangladesh, India, and Nepal also showed higher rankings in this index in 2006 compared to 2004.
Table 2.18: Inward FDI Performance Index and Inward FDI Potential Index Rankings of Selected South Asian Countries
Inward FDI Performance Index Country Rankings
Inward FDI Potential Index Rankings
Country 2004 2005 2006 2004 2005 2006Bangladesh 122 119 121 117 119 —India 117 121 113 83 85 —Nepal 139 139 138 138 135 —Pakistan 114 104 89 127 126 —Sri Lanka 103 108 108 120 123 —
— = data not available, FDI = foreign direct investment.Source: United Nations Conference on Trade and Development. 2007. World Investment Report 2007. Geneva.
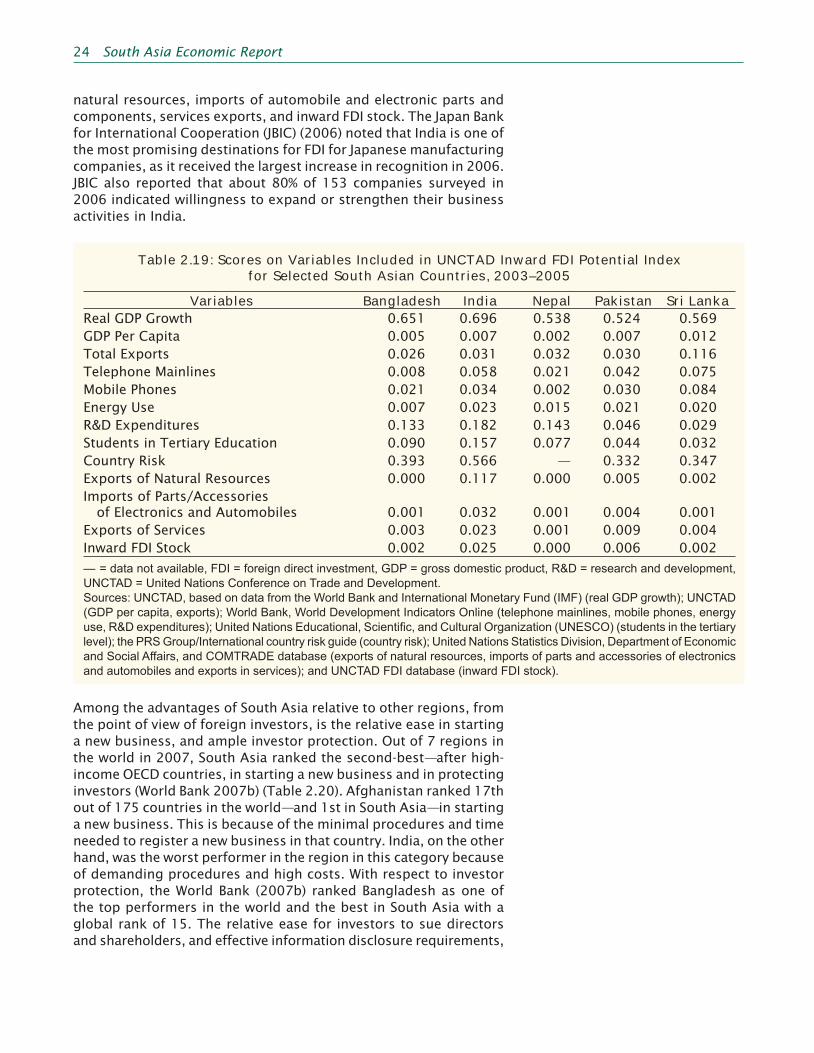
Based on its Inward FDI Potential Index ranking in recent years, India has the highest level of FDI potential in South Asia. Table 2.19 shows the variables that are captured in UNCTAD’s Inward FDI Potential Index for selected countries in South Asia. It confirms India’s dominance over its South Asian counterparts in most FDI factors such as real GDP growth, energy use, R&D expenditure, share of tertiary-level education students in total population, country risk, exports of
2 The UNCTAD Inward FDI Performance Index shows the amount of FDI a country receives relative to its economic size, and is computed as a ratio of the country’s share in world FDI inflows to its share in world GDP. This index indicates to what extent factors other than economic size influence FDI in that country. The UNCTAD Inward FDI Potential Index is an unweighted average of the scores of 12 economic and structural variables, each with a range of 0 to 1. The variables used are commercial energy use per capita, country risk, export/GDP ratio, GDP per capita, real GDP growth, import share of automobile and electronic parts and components to world total, inward FDI stock as a percentage of world total, natural resource exports as a percentage of world total, service exports as a percentage of world total, share of R&D expenditure to gross national income, share of tertiary-level education students to total population, and telecom infrastructure. For more details, see UNCTAD (2007).
South Asia Economic Report 2008_Sec1:23 Sec1:23South Asia Economic Report 2008_Sec1:23 Sec1:23 2/25/2008 11:25:54 AM2/25/2008 11:25:54 AM
24 South Asia Economic Report
natural resources, imports of automobile and electronic parts and components, services exports, and inward FDI stock. The Japan Bank for International Cooperation (JBIC) (2006) noted that India is one of the most promising destinations for FDI for Japanese manufacturing companies, as it received the largest increase in recognition in 2006. JBIC also reported that about 80% of 153 companies surveyed in 2006 indicated willingness to expand or strengthen their business activities in India.
Table 2.19: Scores on Variables Included in UNCTAD Inward FDI Potential Index for Selected South Asian Countries, 2003–2005
Variables Bangladesh India Nepal Pakistan Sri LankaReal GDP Growth 0.651 0.696 0.538 0.524 0.569GDP Per Capita 0.005 0.007 0.002 0.007 0.012Total Exports 0.026 0.031 0.032 0.030 0.116Telephone Mainlines 0.008 0.058 0.021 0.042 0.075Mobile Phones 0.021 0.034 0.002 0.030 0.084Energy Use 0.007 0.023 0.015 0.021 0.020R&D Expenditures 0.133 0.182 0.143 0.046 0.029Students in Tertiary Education 0.090 0.157 0.077 0.044 0.032Country Risk 0.393 0.566 — 0.332 0.347Exports of Natural Resources 0.000 0.117 0.000 0.005 0.002Imports of Parts/Accessories of Electronics and Automobiles 0.001 0.032 0.001 0.004 0.001Exports of Services 0.003 0.023 0.001 0.009 0.004Inward FDI Stock 0.002 0.025 0.000 0.006 0.002
— = data not available, FDI = foreign direct investment, GDP = gross domestic product, R&D = research and development, UNCTAD = United Nations Conference on Trade and Development.Sources: UNCTAD, based on data from the World Bank and International Monetary Fund (IMF) (real GDP growth); UNCTAD (GDP per capita, exports); World Bank, World Development Indicators Online (telephone mainlines, mobile phones, energy use, R&D expenditures); United Nations Educational, Scientifi c, and Cultural Organization (UNESCO) (students in the tertiary level); the PRS Group/International country risk guide (country risk); United Nations Statistics Division, Department of Economic and Social Affairs, and COMTRADE database (exports of natural resources, imports of parts and accessories of electronics and automobiles and exports in services); and UNCTAD FDI database (inward FDI stock).
Among the advantages of South Asia relative to other regions, from the point of view of foreign investors, is the relative ease in starting a new business, and ample investor protection. Out of 7 regions in the world in 2007, South Asia ranked the second-best—after high-income OECD countries, in starting a new business and in protecting investors (World Bank 2007b) (Table 2.20). Afghanistan ranked 17th out of 175 countries in the world—and 1st in South Asia—in starting a new business. This is because of the minimal procedures and time needed to register a new business in that country. India, on the other hand, was the worst performer in the region in this category because of demanding procedures and high costs. With respect to investor protection, the World Bank (2007b) ranked Bangladesh as one of the top performers in the world and the best in South Asia with a global rank of 15. The relative ease for investors to sue directors and shareholders, and effective information disclosure requirements,
South Asia Economic Report 2008_Sec1:24 Sec1:24South Asia Economic Report 2008_Sec1:24 Sec1:24 2/25/2008 11:25:54 AM2/25/2008 11:25:54 AM

Foreign Direct Investment in South Asia 25
are some of the key factors of Bangladesh’s high global ranking. Conversely, Afghanistan is the worst performer in South Asia and one of the worst in the world in terms of protecting investors. This is largely explained by the lack of: an active stock market, procedures for information disclosure, and penalties for abusive directors and managers.
Table 2.20: Global Rankings on Starting a Business and Protecting Investors, by Region and South Asian
Country, 2007
Starting a Business
Protecting Investors
Regional Ranking High Income: OECD 1 1
East Asia and Pacific 3 3
Eastern Europe and Central Asia 4 5
Latin America and Caribbean 5 4
Middle East and North Africa 6 6
South Asia 2 2
Sub-Saharan Africa 7 7
Country Ranking Afghanistan 17 173
Bangladesh 68 15
Bhutan 79 118
India 88 33
Maldives 31 60
Nepal 49 60
Pakistan 54 19
Sri Lanka 44 60
OECD = Organisation for Economic Co-operation and Development.Note: The global rankings cover 7 regions and 175 countries. The lower (higher) the ranking, the better (poorer) the performance. The ranking on “starting a business” is the average ranking on the time, procedures, minimum capital requirements, and costs in registering a business. The ranking on “protecting investors” is based on an average index of subindices measuring disclosure, director liability, and shareholder suits. See World Bank (2007b) for details.Source: World Bank. 2007b. Doing Business in South Asia 2007. Washington DC.
The Way Forward—Promotion of More FDI in South AsiaRapid changes in consumer tastes and consumption patterns now affect production patterns globally. Products can quickly become obsolete. Firms must closely follow the life cycles of their products as well as world market trends, and make every effort to maintain their competitive edge. This is particularly true in labor-intensive industries
South Asia Economic Report 2008_Sec1:25 Sec1:25South Asia Economic Report 2008_Sec1:25 Sec1:25 2/25/2008 11:25:55 AM2/25/2008 11:25:55 AM
26 South Asia Economic Report
characterized as “footloose.” In these industries, foreign companies, particularly MNCs, may shift their production bases from one country to another in search of lower labor and production costs. In addition, the globalization of production processes has accentuated the division of labor worldwide. In this context, advantages in attracting FDI can be gradually lost, such as the competitive edge in labor costs. Host countries should proactively prepare for changes in products and locations of production bases by foreign firms. The population of South Asian countries is still growing much faster than in other Asian countries. Consequently, South Asian countries must create employment opportunities as well as maintain sustained pro-poor and inclusive growth. Their efforts to promote FDI may be seen as crucial in this context.
South Asia can become one of the more attractive FDI destinations in developing Asia, as shown by rising regional FDI inflows, and by surveys. Liberalization policies as well as increasing private sector participation in investment projects have been instrumental in the growth of FDI inflows in recent years. A number of bilateral and regional trade and investment agreements with countries outside the region have also contributed. This type of integration, together with ongoing domestic policy reforms, will contribute further to attracting more FDI into South Asia.
Compared to other regions, however, South Asia is still far from fulfilling its potential as a destination for FDI. Unfavorable perceptions by foreign investors of the business climate in South Asian countries, for the reasons discussed above, remain an impediment. To realize more of the region’s potential for FDI, the following measures should be pursued to improve the business climate and investor confidence.
Infrastructure development is a vital ingredient in measures needed to attract more foreign investment and accelerate regional economic development (World Bank 2005). It has been argued that private sector participation is necessary to improve the quality of regional infrastructure (Nataraj 2007). Additionally, regional cooperation should be continued. This is seen as critical in reducing the infrastructure deficit and addressing the energy requirements of the region (Ahmed and Ghani 2007). Cross-border infrastructure supply systems, such as power, road, and telecommunication networks, are promising for regional cooperation and for the promotion of FDI.
South Asian countries also need to establish macroeconomic and political stability, and an appropriate policy and regulatory framework for foreign investments—including labor policy. The region must continue to attain high economic growth; ensure price stability; maintain trade, investment, and exchange rate policies conducive to local and foreign businesses; and mitigate the risks associated with investment. Further, there may be a need to harmonize regulatory mechanisms in the region—such as investment laws— to make the domestic investment climate more attractive for FDI (Dutz 2004). This
South Asia Economic Report 2008_Sec1:26 Sec1:26South Asia Economic Report 2008_Sec1:26 Sec1:26 2/25/2008 11:25:55 AM2/25/2008 11:25:55 AM
Foreign Direct Investment in South Asia 27
could lead to region-wide FDI promotion. For example, unification of custom systems among South Asian countries and one-stop customs are very useful to facilitate the flow of people and goods among the countries. Importantly, the enforcement of laws and regulations related to FDI should be ensured. Improvement in governance should be prioritized in the region.
The development of human resources and associated industries in the region is vital, not only to attract FDI but also to achieve sustainable and inclusive economic growth. South Asian countries have an abundant supply of labor. The problem, however, is the quality of that labor. An abundant labor force that lacks skills will not contribute sufficiently to the attraction of FDI and, more importantly, to national economic development. Formal education and vocational training are essential to enhance the quality of the labor force and its productivity. They will also contribute to social development, expansion of employment opportunities, and higher incomes—all critical elements of inclusive economic growth.
The development of supporting industries, particularly SMEs, is also essential to promote more FDI and to help sustain economic growth. FDI that benefits the local economy through forward and backward linkages will contribute to sustained economic growth. SME development is quite important to ensure the growth of forward and backward linkages with manufacturers established with FDI. If not procured from domestic SMEs, inputs of such manufacturers are likely to be imported, deteriorating the balance of payments of the FDI host country. Development of SMEs is also critical in terms of job creation, in that most SMEs are in labor-intensive industries.
Finally, regional cooperation should be vigorously promoted. Policies to facilitate cross-border trade and investment are also required to promote FDI regionally. It is important to note that intra-regional FDI in South Asia remains small compared to the levels in other Asian regions. India stands almost alone as an investor in its regional neighbors. Measures to encourage investment from India in other South Asian countries may help promote regional cooperation.
South Asia Economic Report 2008_Sec1:27 Sec1:27South Asia Economic Report 2008_Sec1:27 Sec1:27 2/25/2008 11:25:55 AM2/25/2008 11:25:55 AM

South Asia Economic Report 2008_Sec1:28 Sec1:28South Asia Economic Report 2008_Sec1:28 Sec1:28 2/25/2008 11:25:55 AM2/25/2008 11:25:55 AM
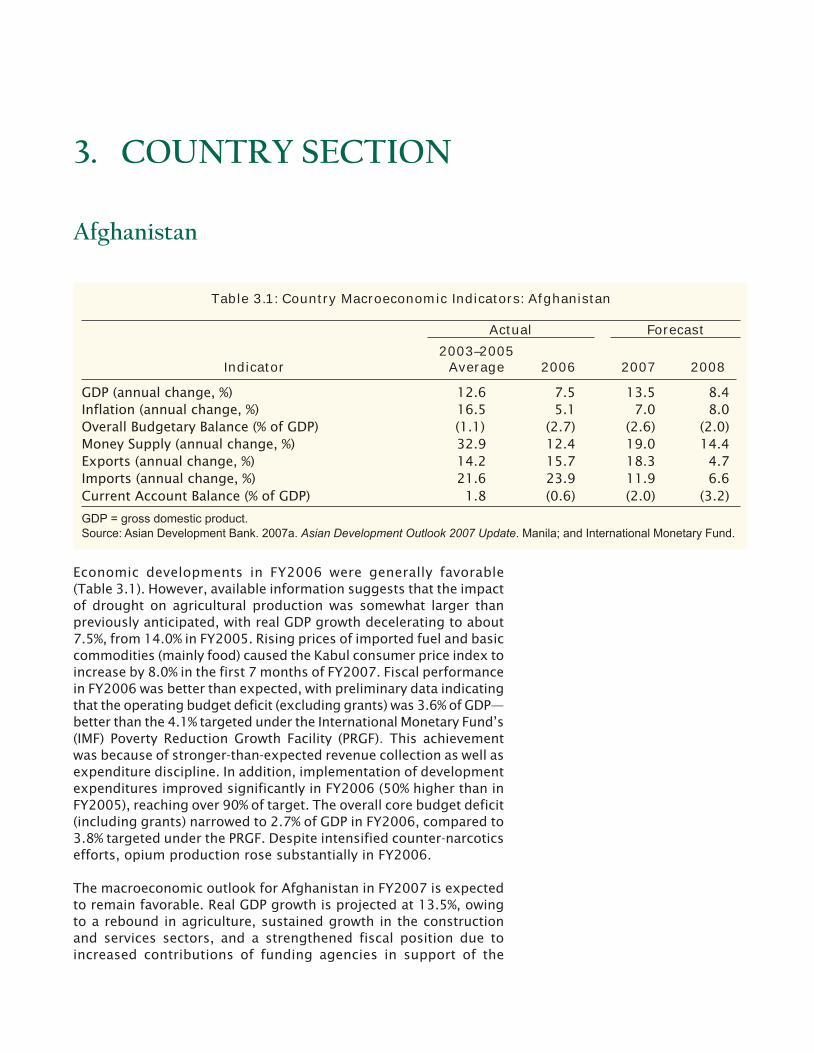
3. COUNTRY SECTION
Afghanistan
Table 3.1: Country Macroeconomic Indicators: Afghanistan
Actual Forecast
Indicator2003–2005
Average 2006 2007 2008
GDP (annual change, %) 12.6 7.5 13.5 8.4Inflation (annual change, %) 16.5 5.1 7.0 8.0Overall Budgetary Balance (% of GDP) (1.1) (2.7) (2.6) (2.0)Money Supply (annual change, %) 32.9 12.4 19.0 14.4Exports (annual change, %) 14.2 15.7 18.3 4.7Imports (annual change, %) 21.6 23.9 11.9 6.6Current Account Balance (% of GDP) 1.8 (0.6) (2.0) (3.2)
GDP = gross domestic product.Source: Asian Development Bank. 2007a. Asian Development Outlook 2007 Update. Manila; and International Monetary Fund.
Economic developments in FY2006 were generally favorable (Table 3.1). However, available information suggests that the impact of drought on agricultural production was somewhat larger than previously anticipated, with real GDP growth decelerating to about 7.5%, from 14.0% in FY2005. Rising prices of imported fuel and basic commodities (mainly food) caused the Kabul consumer price index to increase by 8.0% in the first 7 months of FY2007. Fiscal performance in FY2006 was better than expected, with preliminary data indicating that the operating budget deficit (excluding grants) was 3.6% of GDP—better than the 4.1% targeted under the International Monetary Fund’s (IMF) Poverty Reduction Growth Facility (PRGF). This achievement was because of stronger-than-expected revenue collection as well as expenditure discipline. In addition, implementation of development expenditures improved significantly in FY2006 (50% higher than in FY2005), reaching over 90% of target. The overall core budget deficit (including grants) narrowed to 2.7% of GDP in FY2006, compared to 3.8% targeted under the PRGF. Despite intensified counter-narcotics efforts, opium production rose substantially in FY2006.
The macroeconomic outlook for Afghanistan in FY2007 is expected to remain favorable. Real GDP growth is projected at 13.5%, owing to a rebound in agriculture, sustained growth in the construction and services sectors, and a strengthened fiscal position due to increased contributions of funding agencies in support of the
South Asia Economic Report 2008_Sec1:29 Sec1:29South Asia Economic Report 2008_Sec1:29 Sec1:29 2/25/2008 11:25:55 AM2/25/2008 11:25:55 AM

30 South Asia Economic Report
Afghanistan National Development Strategy. This document will serve as the country-owned Poverty Reduction Strategy Paper. Inflation is expected to increase slightly compared to FY2006 to 7.0% because of rising transportation costs and higher energy prices.
Bangladesh
Table 3.2: Country Macroeconomic Indicators: Bangladesh
Actual Actual/2003–2005 Estimate Forecast
Indicator Average 2006 2007 2008GDP (annual change, %) 5.8 6.6 6.5 6.0
Inflation (annual change, %) 5.6 7.2 7.2 8.0
Overall Budgetary Balance (% of GDP) (3.3) (3.2) (3.2) (4.2)
Money Supply (annual change, %) 15.4 19.5 17.0 15.0
Exports (annual change, %) 13.1 21.5 15.8 13.5
Imports (annual change, %) 15.6 12.1 16.6 15.9
Current Account Balance (% of GDP) (0.1) 1.3 1.4 1.2GDP = gross domestic product.Source: Asian Development Bank. 2007a. Asian Development Outlook 2007 Update. Manila; International Monetary Fund; and staff estimates.
GDP growth is estimated at 6.5% in FY2007, slightly lower than the 6.6% in FY2006 because of moderating growth of agriculture following the post-flood high growth of FY2006 (Table 3.2). Growth of GDP was bolstered by private investment and was underpinned by steady expansion of manufacturing and services. GDP growth is forecast to slow somewhat to 6.0% in FY2008 because of the extensive flooding during July–September 2007, a devastating cyclone in mid-November 2007, and a slowdown in external demand for garments. The major challenge facing the country is to boost business confidence. Major reforms are needed to overhaul tax administration, restructure state-owned enterprises, and augment financial sector restructuring. Economic prospects will depend on rehabilitation following the floods and the cyclone, the rebound of private sector activity, and political stability in the lead up to the general elections scheduled for the end of 2008.
Inflation accelerated compared to recent years, reaching 7.2% in FY2007, with rises in both food and nonfood prices. Rising domestic demand aided by steady GDP expansion and continued high monetary growth amplified inflationary pressures. In December 2006, broad money growth reached a record high 22.3%, but slowed in subsequent months to 17.0% in June 2007. Increases in credit to the private sector were contained by the erosion of business confidence rather than by monetary tightening. Inflation is forecast to rise further to 8.0% in

Country Section 31
FY2008, driven by higher food and commodity prices and shortfalls in crop production following the floods and the cyclone.
Although Bangladesh carried out some fiscal reform measures in recent years, revenue performance remained weak. Bangladesh’s revenue (10.3% of GDP in FY2007) and its recent trend compare unfavorably with other countries. But because of underperformance in development spending, the fiscal deficit stood at 3.2% of GDP, lower than the 3.7% target for FY2007. In FY2008, although revenue is projected to rise to 10.8% of GDP, higher expenditure due to a rise in development spending is expected to push up the fiscal deficit to 4.2% of GDP. Unless revenue collection increases significantly, the higher expenditure needed for faster economic growth and rapid poverty reduction cannot be met without pushing fiscal deficits to unsustainable levels. Major reforms in the tax system and tax laws will be needed to augment tax revenues.
The losses of state-owned enterprises and associated quasi-fiscal obligations pose a significant fiscal risk for the period ahead. The fuel price adjustments of 16–21% in April 2007 cut Bangladesh Petroleum Corporation (BPC) losses, bringing domestic prices of diesel and kerosene to 79% of breakeven in July 2007. But BPC’s losses in FY2007 were still estimated at $460 million, or 0.7% of GDP. To facilitate the corporation’s operations, the Government assumed BPC’s overdue bank loans through a $1.1 billion bond issue. The Government needs to introduce an automatic price adjustment mechanism to avoid re-accumulation of BPC losses and nonperforming loans (NPLs) of nationalized commercial banks (NCBs). Similarly, switching to an electricity tariff structure that reflects actual costs would be desirable.
Despite improvement, gross NPLs of the banks remain high (14.0% in June 2007). High lending rates caused by the large NPLs of state-owned banks and weak financial intermediation discourage investment and reduce the financial sector’s contribution to economic growth. Bangladesh Bank has made progress, however, in adopting international best practice in prudential regulations and in improving banks’ compliance with reporting and risk management. The recent increase in the capital adequacy ratio to 10% was a positive step. The Bank Company Act (Amendment) of 2007 was another step toward improved efficiency in the financial sector. Under this amended act, each bank will have to increase its capital base to taka 2 billion, among other requirements. The sale of Rupali Bank (one of four NCBs) has been concluded, although handover of the bank is experiencing difficulties, as the highest bidder remains unresponsive. The other three NCBs have been formed into corporations by the Government in preparation for their eventual privatization. The capital market remains small, with market capitalization amounting to 14% of GDP despite the recent uptrend in share prices.
Exports and imports during FY2007 grew by 15.8% and 16.6%, respectively. The rise in the trade deficit was more than offset by a
South Asia Economic Report 2008_Sec1:31 Sec1:31South Asia Economic Report 2008_Sec1:31 Sec1:31 2/25/2008 11:25:55 AM2/25/2008 11:25:55 AM

32 South Asia Economic Report
25% increase in overseas workers’ remittances, leading to a current account surplus of 1.4% of GDP. Despite recent slower growth in garment exports, the strength of the external sector in FY2008 is likely to be sustained by strong growth in overseas workers’ remittances. A weak US economy, aggravated by the subprime mortgage crisis, sustained higher oil prices, and increased prices of raw materials—including cotton, yarn, and dyeing chemicals—contributed to the recent slowdown in garment exports. Also, political uncertainty and labor turmoil in 2006, resulting in damaged factories and the temporary shutdown of the Dhaka Export Processing Zone, contributed to the slowdown as some buyers moved to other countries. But the industry is optimistic that orders will surge as global demand for low-cost apparel returns to normal in the upcoming winter season. However, the country still runs the risk of tough competition in its two largest markets (the EU and the US) as the safeguard quota on the PRC is due to expire in 2008. Much of Bangladesh’s competitive advantage depends on its abundant low-cost labor, flexible exchange rate, and close ties with some large buyers. To deal with the intense competition, the industry needs to improve productivity. This will require a major improvement in infrastructure—including transport and power supply, and streamlining custom procedures. Cutting lead time also is critical if Bangladesh wants to produce high value-added products, which need prompt availability of quality fabrics and other materials.
Bhutan
Table 3.3: Country Macroeconomic Indicators: Bhutan
Actual Forecast
Indicator2003–2005
Average 2006 2007 2008GDP (annual change, %) 7.6 9.1 17.0 14.4Inflation (annual change, %) 3.5 4.9 5.2 5.0Overall Budgetary Balance (% of GDP) (5.1) (0.8) (3.4) (1.8)Money Supply (annual change, %) 14.5 24.8 7.6 —Exports (annual change, %) 22.2 47.2 67.0 31.9Imports (annual change, %) 30.7 (5.6) 17.0 17.5Current Account Balance (% of GDP) (17.8) (3.3) 10.6 10.1— = data not available, GDP = gross domestic product.Source: Asian Development Bank. 2007a. Asian Development Outlook 2007 Update. Manila; and International Monetary Fund.
Bhutan’s economy is experiencing structural changes, in both economic and political dimensions. The phased commissioning of the 1,020 megawatt Tala hydropower project since July 2006 will eventually double electricity export capacity to India and significantly boost government revenue. Accordingly, GDP growth is estimated
South Asia Economic Report 2008_Sec1:32 Sec1:32South Asia Economic Report 2008_Sec1:32 Sec1:32 2/25/2008 11:25:55 AM2/25/2008 11:25:55 AM
Country Section 33
to have reached 9.1% in FY2006 and almost doubled to 17.0% in FY2007 (Table 3.3).
As Bhutan’s currency is pegged to the Indian rupee, monetary developments have limited impact on prices. Inflation in Bhutan is heavily influenced by price developments in India. Consumer prices peaked at 6.2% in the second quarter of calendar year 2006, which resulted in inflation averaging 4.9% in FY2006. Inflation increased marginally to 5.2% in FY2007 as food prices jumped in the second quarter of 2007.
In March 2007, the Government revised fiscal figures for FY2005 and FY2006, and budget estimates for FY2007. The Government’s fiscal position in FY2006 was better than previously expected, with the overall budget deficit narrowed to ngultrum (Nu) 0.3 billion, or 0.8% of GDP. The improved fiscal position resulted mainly from a smaller capital expenditure. The revised budget estimates for FY2007 anticipate doubled nontax revenue, which will increase total government revenue by 41.6%. The budget, however, includes plans for a larger increase in capital expenditure than the Tala project windfall—e.g., for the construction of a Supreme Court building, and preconstruction work for Punatsangchu I and Dagachhu hydropower projects—as well as an increase in current expenditure. As a result, the deficit will widen to 3.4% of GDP.
The current account improved markedly in FY2006 as the deficit narrowed to $29 million (3.3% of GDP), from $217 million (28.2%) in FY 2005. This was attributed mainly to rapid growth in exports as well as to larger net transfer receipts. The 47.2% expansion in export earnings in FY2006 was about equally split between exports to India (largely electricity) and other countries. Imports declined only by 5.6% in the same year from FY2005, when imports were buoyed by the purchase of two Airbus aircraft. This appears to reflect brisk demand for imported goods from India and other countries. Tourism also continued to be strong, with growth of 27.4% in tourist numbers and 29.7% in revenues. As inflows in the capital account (including grants for the Tala project) and the financial account (mainly foreign aid loans) together amounted to $144 million and were much greater than the current account deficit, the overall balance of payments registered a large surplus. External debt outstanding as of June 2006 was 77.5% of GDP, of which around 60% was Indian rupee borrowing from the Government of India for the Tala project. The debt service ratio was only 5.8%, as almost all debt was contracted on concessional terms.
Although the Tala hydropower project should reduce dependence on foreign aid, other economic issues remain. The most pressing is the need to promote private sector activity to create employment, especially for the growing number of young entrants to the labor force. In the political sphere, Bhutan is scheduled to change from a monarchy to a two-party democratic system in 2008, though this is unlikely to have major economic impact.
South Asia Economic Report 2008_Sec1:33 Sec1:33South Asia Economic Report 2008_Sec1:33 Sec1:33 2/25/2008 11:25:55 AM2/25/2008 11:25:55 AM
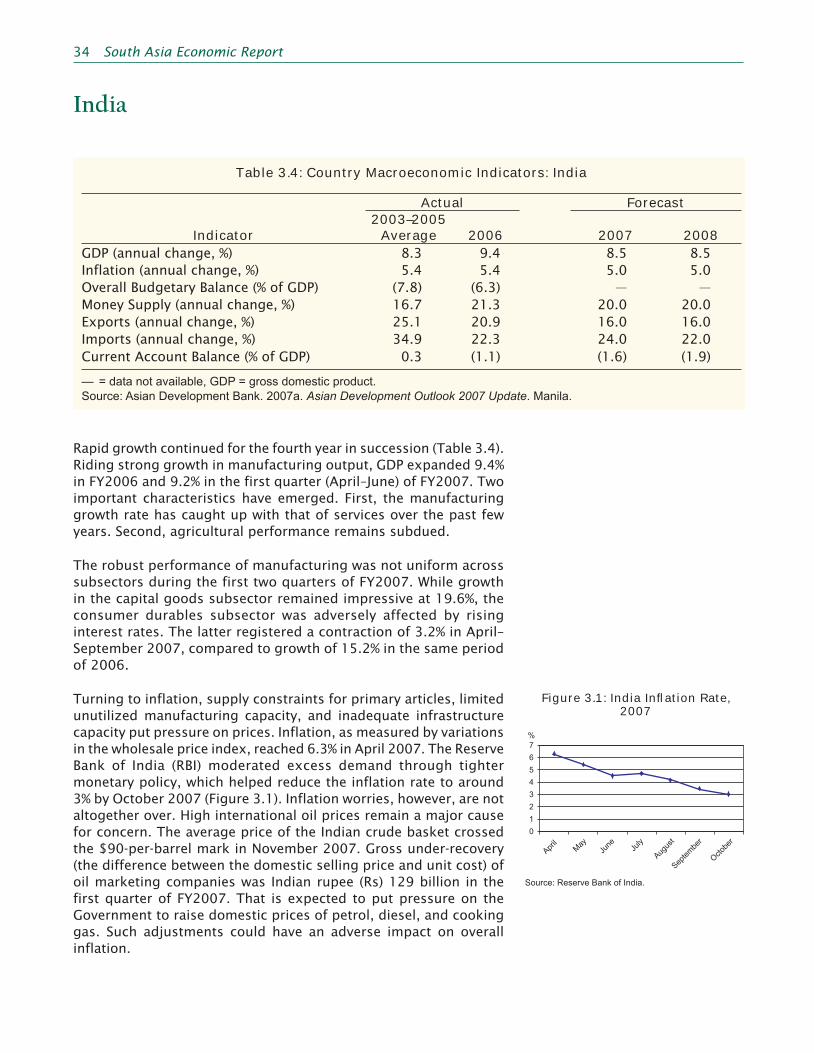
34 South Asia Economic Report
India
Table 3.4: Country Macroeconomic Indicators: India
Actual Forecast
Indicator2003–2005
Average 2006 2007 2008GDP (annual change, %) 8.3 9.4 8.5 8.5Inflation (annual change, %) 5.4 5.4 5.0 5.0Overall Budgetary Balance (% of GDP) (7.8) (6.3) — —
Money Supply (annual change, %) 16.7 21.3 20.0 20.0Exports (annual change, %) 25.1 20.9 16.0 16.0Imports (annual change, %) 34.9 22.3 24.0 22.0Current Account Balance (% of GDP) 0.3 (1.1) (1.6) (1.9)
— = data not available, GDP = gross domestic product.Source: Asian Development Bank. 2007a. Asian Development Outlook 2007 Update. Manila.
Rapid growth continued for the fourth year in succession (Table 3.4). Riding strong growth in manufacturing output, GDP expanded 9.4% in FY2006 and 9.2% in the first quarter (April –June) of FY2007. Two important characteristics have emerged. First, the manufacturing growth rate has caught up with that of services over the past few years. Second, agricultural performance remains subdued.
The robust performance of manufacturing was not uniform across subsectors during the first two quarters of FY2007. While growth in the capital goods subsector remained impressive at 19.6%, the consumer durables subsector was adversely affected by rising interest rates. The latter registered a contraction of 3.2% in April–September 2007, compared to growth of 15.2% in the same period of 2006.
Turning to inflation, supply constraints for primary articles, limited unutilized manufacturing capacity, and inadequate infrastructure capacity put pressure on prices. Inflation, as measured by variations in the wholesale price index, reached 6.3% in April 2007. The Reserve Bank of India (RBI) moderated excess demand through tighter monetary policy, which helped reduce the inflation rate to around 3% by October 2007 (Figure 3.1). Inflation worries, however, are not altogether over. High international oil prices remain a major cause for concern. The average price of the Indian crude basket crossed the $90-per-barrel mark in November 2007. Gross under-recovery (the difference between the domestic selling price and unit cost) of oil marketing companies was Indian rupee (Rs) 129 billion in the first quarter of FY2007. That is expected to put pressure on the Government to raise domestic prices of petrol, diesel, and cooking gas. Such adjustments could have an adverse impact on overall inflation.
Figure 3.1: India Infl ation Rate, 2007
Source: Reserve Bank of India.
0
1
2
3
4
5
6
7
April
May
June Ju
ly
Augus
t
Septe
mbe
r
Octob
er
%
South Asia Economic Report 2008_Sec1:34 Sec1:34South Asia Economic Report 2008_Sec1:34 Sec1:34 2/25/2008 11:25:55 AM2/25/2008 11:25:55 AM

Country Section 35
Monetary management remains a major challenge for RBI. Continuing high growth in money supply driven by commercial credit—especially during FY2006—prompted an RBI response of gradual increases in short-term interest rates and the cash reserve ratio. Strong external capital inflows further aggravated the situation, however. RBI intervened in the market by buying dollars (leading to higher money supply), which complicated RBI’s endeavor to manage liquidity and strike the right balance between the exchange rate and inflation.
While exports grew by 17.8% in the first quarter of FY2007, imports grew by 21.3%, widening the merchandise trade deficit to $21.6 billion. This deficit was significantly offset by robust inflows from invisibles, which included earnings from services such as software exports and business services, as well as private transfers from Indians working abroad. The combined current account deficit thus rose marginally to $4.7 billion from $4.6 billion in the first quarter of FY2006. A strong surplus in the capital account, however, helped finance the current account deficit without straining India’s foreign exchange reserves position. The most striking feature of net capital inflows was a sharp rise in portfolio investment by foreign institutional investors (FII). Net FII inflows rose to $7.5 billion in the first quarter of FY2007 from negative net inflows of $0.5 billion in the corresponding period the previous year. Significant moderation in export growth was noticed in April–September 2007 against the corresponding period in 2006.
The Indian rupee appreciated against the US dollar from Rs42.2 in April 2007 to below Rs40 in October 2007 (Figure 3.2). The issue of Indian rupee appreciation has attracted a great deal of attention, and softening of export growth is attributed to this phenomenon. The Government announced measures aimed at compensating exporters for losses in profit resulting from the appreciating Indian rupee.
Under the framework of the Fiscal Reforms and Budget Management Act, progress was made in fiscal consolidation. The fiscal deficit to GDP ratio of the federal Government declined from 5.9% in FY2002 to 3.8% in FY2006, while the revenue deficit to GDP ratio fell from 4.4% to 2.1% over the same period. The fiscal position of the states also improved. Consequently, the combined federal-state deficit to GDP ratio declined from 9.6% in FY 2002 to 6.3% in FY2006.
Figure 3.2: Nominal Exchange Rate of Indian Rupee vs
United States Dollar, 2007
Source: Reserve Bank of India.
38
39
40
41
42
43
April
May
June Ju
ly
Augus
t
Septe
mbe
r
Octob
er
South Asia Economic Report 2008_Sec1:35 Sec1:35South Asia Economic Report 2008_Sec1:35 Sec1:35 2/25/2008 11:25:55 AM2/25/2008 11:25:55 AM

36 South Asia Economic Report
Maldives
Table 3.5: Country Macroeconomic Indicators: Maldives
Actual Forecast
Indicator2003–2005
Average 2006 2007 2008GDP (annual change, %) 4.5 19.1 7.3 8.0Inflation (annual change, %) 2.3 3.5 7.0 6.0Overall Budgetary Balance (% of GDP) (5.3) (7.1) (27.6) —Money Supply (annual change, %) 19.7 20.6 — —Exports (annual change, %) 7.8 39.4 2.8 —Imports (annual change, %) 24.2 24.4 14.8 —Current Account Balance (% of GDP) (18.7) (39.8) (45.0) —— = data not available, GDP = gross domestic product.Source: Asian Development Bank. 2007a. Asian Development Outlook 2007 Update. Manila; Maldives Monetary Authority; and staff estimates.
The Maldives economy rebounded sharply in 2006 from its post-tsunami contraction, with GDP growth of 19.1% (Table 3.5). Expansion of GDP is projected to slow to 7.3% in 2007, as the effects of large restoration activities on the economy diminish. The tourism sector regained its pre-tsunami status in 2007 with tourist arrivals during January–September exceeding 2004 levels during the same period.
Inflation, measured by the consumer price index, recorded a moderate 3.5% rise in 2006, partly because of the pegging of the Maldives rufiyaa to the US dollar. However, inflation started to go up in 2007, reaching 10.0% in August. The increase was largely driven by higher food prices.
While large reconstruction projects are included in the government budget, government consumption also rose due to increases in public sector wages and continued power and water subsidies in Malé. Although a delay in planned capital expenditure narrowed the fiscal deficit to 7.1% of GDP in 2006, the wide gap between expenditure and revenue cannot be sustained in the medium term. The 2007 budget will result in a very high fiscal deficit of 27.6% of GDP if implemented as planned. Stronger policy measures, including a more rapid reduction in domestic expenditures, introduction of the business profit tax in 2008, and additional lease payments related to development of the tourism industry should be adopted to keep government debt at a sustainable level.
The Maldives is an import-dependent country, bringing in everything from staple foods to resort supplies, construction materials, and petroleum products. The average ratio of imports
South Asia Economic Report 2008_Sec1:36 Sec1:36South Asia Economic Report 2008_Sec1:36 Sec1:36 2/25/2008 11:25:56 AM2/25/2008 11:25:56 AM
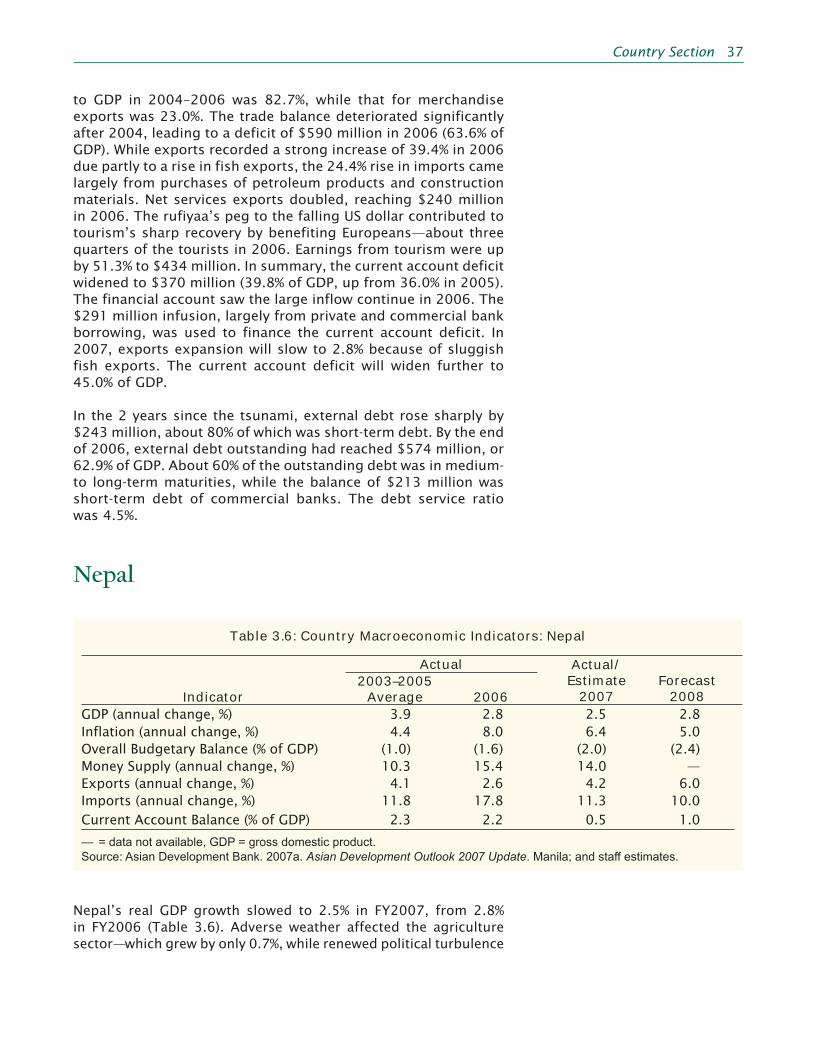
Country Section 37
to GDP in 2004–2006 was 82.7%, while that for merchandise exports was 23.0%. The trade balance deteriorated significantly after 2004, leading to a deficit of $590 million in 2006 (63.6% of GDP). While exports recorded a strong increase of 39.4% in 2006 due partly to a rise in fish exports, the 24.4% rise in imports came largely from purchases of petroleum products and construction materials. Net services exports doubled, reaching $240 million in 2006. The rufiyaa’s peg to the falling US dollar contributed to tourism’s sharp recovery by benefiting Europeans—about three quarters of the tourists in 2006. Earnings from tourism were up by 51.3% to $434 million. In summary, the current account deficit widened to $370 million (39.8% of GDP, up from 36.0% in 2005). The financial account saw the large inflow continue in 2006. The $291 million infusion, largely from private and commercial bank borrowing, was used to finance the current account deficit. In 2007, exports expansion will slow to 2.8% because of sluggish fish exports. The current account deficit will widen further to 45.0% of GDP.
In the 2 years since the tsunami, external debt rose sharply by $243 million, about 80% of which was short-term debt. By the end of 2006, external debt outstanding had reached $574 million, or 62.9% of GDP. About 60% of the outstanding debt was in medium- to long-term maturities, while the balance of $213 million was short-term debt of commercial banks. The debt service ratio was 4.5%.
Nepal
Table 3.6: Country Macroeconomic Indicators: Nepal
Actual Actual/Estimate
2007Forecast
2008Indicator2003–2005
Average 2006GDP (annual change, %) 3.9 2.8 2.5 2.8Inflation (annual change, %) 4.4 8.0 6.4 5.0Overall Budgetary Balance (% of GDP) (1.0) (1.6) (2.0) (2.4)Money Supply (annual change, %) 10.3 15.4 14.0 —Exports (annual change, %) 4.1 2.6 4.2 6.0Imports (annual change, %) 11.8 17.8 11.3 10.0Current Account Balance (% of GDP) 2.3 2.2 0.5 1.0
— = data not available, GDP = gross domestic product.Source: Asian Development Bank. 2007a. Asian Development Outlook 2007 Update. Manila; and staff estimates.
Nepal’s real GDP growth slowed to 2.5% in FY2007, from 2.8% in FY2006 (Table 3.6). Adverse weather affected the agriculture sector—which grew by only 0.7%, while renewed political turbulence
South Asia Economic Report 2008_Sec1:37 Sec1:37South Asia Economic Report 2008_Sec1:37 Sec1:37 2/25/2008 11:25:56 AM2/25/2008 11:25:56 AM
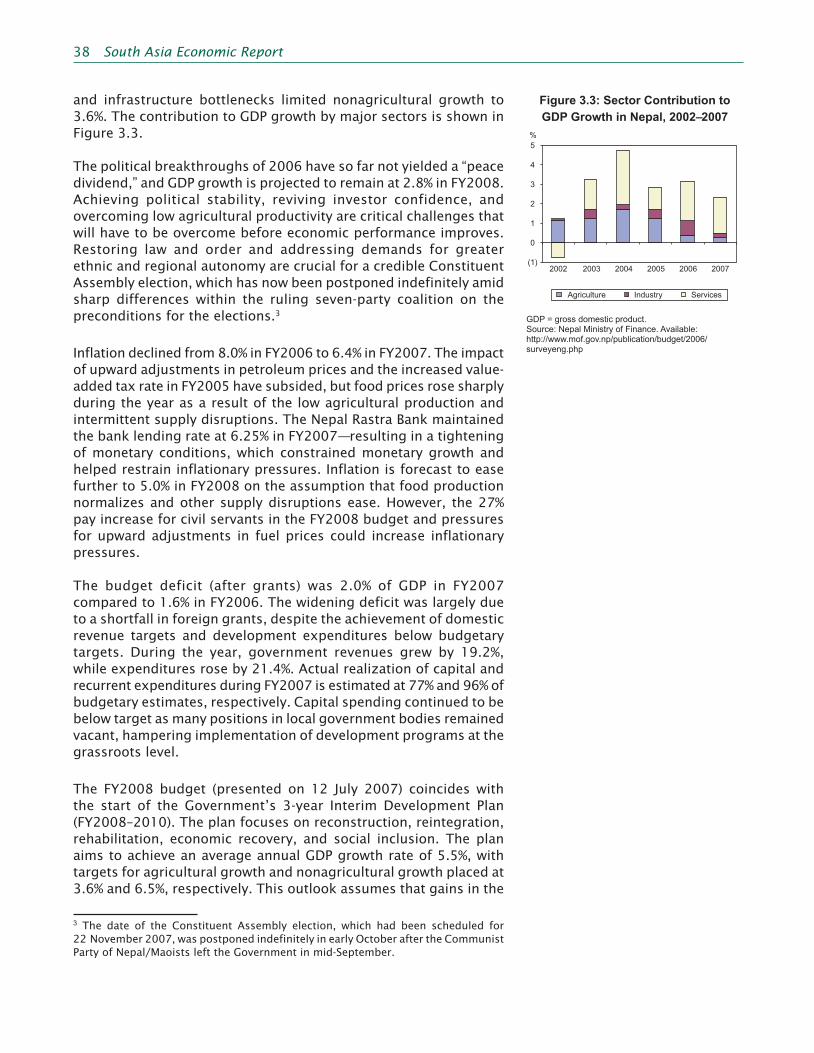
38 South Asia Economic Report
and infrastructure bottlenecks limited nonagricultural growth to 3.6%. The contribution to GDP growth by major sectors is shown in Figure 3.3.
The political breakthroughs of 2006 have so far not yielded a “peace dividend,” and GDP growth is projected to remain at 2.8% in FY2008. Achieving political stability, reviving investor confidence, and overcoming low agricultural productivity are critical challenges that will have to be overcome before economic performance improves. Restoring law and order and addressing demands for greater ethnic and regional autonomy are crucial for a credible Constituent Assembly election, which has now been postponed indefinitely amid sharp differences within the ruling seven-party coalition on the preconditions for the elections.3
Inflation declined from 8.0% in FY2006 to 6.4% in FY2007. The impact of upward adjustments in petroleum prices and the increased value-added tax rate in FY2005 have subsided, but food prices rose sharply during the year as a result of the low agricultural production and intermittent supply disruptions. The Nepal Rastra Bank maintained the bank lending rate at 6.25% in FY2007—resulting in a tightening of monetary conditions, which constrained monetary growth and helped restrain inflationary pressures. Inflation is forecast to ease further to 5.0% in FY2008 on the assumption that food production normalizes and other supply disruptions ease. However, the 27% pay increase for civil servants in the FY2008 budget and pressures for upward adjustments in fuel prices could increase inflationary pressures.
The budget deficit (after grants) was 2.0% of GDP in FY2007 compared to 1.6% in FY2006. The widening deficit was largely due to a shortfall in foreign grants, despite the achievement of domestic revenue targets and development expenditures below budgetary targets. During the year, government revenues grew by 19.2%, while expenditures rose by 21.4%. Actual realization of capital and recurrent expenditures during FY2007 is estimated at 77% and 96% of budgetary estimates, respectively. Capital spending continued to be below target as many positions in local government bodies remained vacant, hampering implementation of development programs at the grassroots level.
The FY2008 budget (presented on 12 July 2007) coincides with the start of the Government’s 3-year Interim Development Plan (FY2008–2010). The plan focuses on reconstruction, reintegration, rehabilitation, economic recovery, and social inclusion. The plan aims to achieve an average annual GDP growth rate of 5.5%, with targets for agricultural growth and nonagricultural growth placed at 3.6% and 6.5%, respectively. This outlook assumes that gains in the
3 The date of the Constituent Assembly election, which had been scheduled for 22 November 2007, was postponed indefinitely in early October after the Communist Party of Nepal/Maoists left the Government in mid-September.
Figure 3.3: Sector Contribution to GDP Growth in Nepal, 2002–2007
GDP = gross domestic product. Source: Nepal Ministry of Finance. Available:http://www.mof.gov.np/publication/budget/2006/surveyeng.php
2002 2003 2004 2005 2006 2007
Agriculture Industry Services
(1)
0
1
2
3
4
5%
South Asia Economic Report 2008_Sec1:38 Sec1:38South Asia Economic Report 2008_Sec1:38 Sec1:38 2/25/2008 11:25:56 AM2/25/2008 11:25:56 AM

Country Section 39
peace process will be consolidated, investor confidence restored, and foreign aid inflows increased.
Exports rose by only 4.2% in FY2007 (Figure 3.4) as a result of frequent economic disruptions—such as bandhs (strikes), labor–management disputes, and chronic energy shortages—and a sharp appreciation of the domestic currency. FY2007 imports rose by 11.3%, compared to 17.8% growth in FY2006. Remittances in FY2007 increased by only 4.5%, down from a 49.1% jump the previous year, because of a slowdown in labor outflows and the rising Nepalese rupee. Consequently, the current account surplus fell from 2.2% of GDP in FY2006 to 0.5% of GDP in FY2007. Foreign exchange reserves rose from $1.8 billion in FY2006 to $1.9 billion in FY2007, providing import cover of about 8.3 months. The Nepalese rupee appreciated 14.2% in 2007 by mid-July, although the trade-weighted, real effective exchange rate appreciated by only 6.9%.
Pakistan
Table 3.7: Country Macroeconomic Indicators: Pakistan
ActualActual 2007Indicator
2003–2005 Average 2006
Forecast 2008
GDP (annual change, %) 7.1 6.6 7.0 6.5Inflation (annual change, %) 5.6 7.9 7.8 6.5Overall Budgetary Balance (% of GDP) (3.1) (3.1) (4.3) (4.2)Money Supply (annual change, %) 19.0 15.2 19.3 —Exports (annual change, %) 16.4 14.9 3.3 7.0Imports (annual change, %) 26.0 33.3 7.9 10.1Current Account Balance (% of GDP) 1.2 (4.5) (5.2) (5.5)
— = data not available, GDP = gross domestic product.Source: Asian Development Bank. 2007a. Asian Development Outlook 2007 Update. Manila
After a slight reduction in the pace of expansion in FY2006, Pakistan’s economy posted robust and broad-based growth in FY2007, expanding 7.0% (Table 3.7). Growth was fueled by the strong recovery of agriculture, the continued momentum of manufacturing sector development, and sustained expansion of services. The momentum of growth is expected to continue into FY2008 in the wake of budgetary measures aimed at supporting productivity in the agriculture sector and boosting investment in the manufacturing sector. However, continuation of tight monetary policy, high international oil prices, and slow export growth is expected to curb GDP growth somewhat in FY2008, to 6.5%.
Strong aggregate demand in recent years has catalyzed growth in Pakistan, but it has also generated inflationary pressures. Inflation
Figure 3.4: Value of Nepal Exports and Workers’ Remittances,
and Growth Rates of Exports and Imports, 2005–2007
Source: Nepal Rastra Bank. 2007. Current Macroeconomic Situation. September. Kathmandu.
2005 2006 2007
0
200
400
600
800
1,000
1,200
1,400
1,600
$ Million
0
2
4
6
8
10
12
14
16
18
20
Growth Rate (%)
Exports
Workers' Remittances
Export Growth (%)
Import Growth (%)
South Asia Economic Report 2008_Sec1:39 Sec1:39South Asia Economic Report 2008_Sec1:39 Sec1:39 2/25/2008 11:25:56 AM2/25/2008 11:25:56 AM

40 South Asia Economic Report
peaked at 9.3% during FY2005, but declined only marginally to 7.8% in FY2007 from 7.9% in FY2006. Measures taken by the Central Bank during the first half of FY2007 tightening monetary conditions led to control of overall core inflation. However, shortages of some essential food items, such as rice, edible oil, meat, pulses, milk, and fresh vegetables—notwithstanding the overall strong recovery of the agriculture sector—boosted inflation of food to 10.3% in FY2007. Food prices increased further to 10.7% in October 2007. Overall inflation, however, continued a gradual decline to 7.5%, due mainly to reduced inflation for nonfood items and maintenance of tight monetary conditions.
Notwithstanding the tight monetary policy, fiscal policy continued to be expansionary. Total public expenditure in FY2007, at Pakistan rupee (Rs) 1,675 billion, was 19.5% higher than the previous year. Actual development expenditure in FY2007, at Rs434 billion, also was higher (18.9%) than development expenditure the previous year. Despite strong revenue performance, the fiscal deficit as a percentage of GDP rose to 4.3% in FY2007. The remarkable increase (around 20%) in revenue collection the same year did not prevent tax revenue as percentage of GDP from falling slightly to 10.5% in FY2007 from 10.6% in FY2006 (Figure 3.5).
Expansionary fiscal policy is expected to continue during FY2008, with a large increase in spending on development and relief measures announced in the federal budget. Public sector development expenditures, including expenditure on rehabilitation of earthquake-affected areas, are projected to increase by 19.9% from the FY2007 level. In addition, expenditure on relief and rehabilitation in areas affected by recent rains and floods will also boost public spending. As the Government expects revenue performance to continue to be robust, the revenue collection target for FY2008 has been increased by around 20% over FY2007. Accordingly, the fiscal deficit—including earthquake-related expenditure—is expected to remain at 4.2% of GDP in FY2008.
On the external front, import growth decelerated sharply to 7.9% in FY2007 from 33.3% the preceding year, a result of the reduced demand for consumer goods and industrial inputs, as well as the softening of international oil prices during the first half of the fiscal year. Export growth also declined to only 3.3% against the target of 12.9% in FY2007. While the overall decline in export growth can be attributed to the sluggish performance of the textile sector—which accounts for almost two thirds of total exports, non-textile export growth also slowed. The continued lack of diversification of Pakistan’s export base, the concentration of exports in a few markets, and poor compliance with quality standards are major factors in the country’s poor export performance, and contributed to the widening trade deficit. As a result, the FY2007 current account deficit as a percentage of GDP widened to 5.2%, from 4.5% in FY2006.
Figure 3.5: Pakistan Government Revenues and Expenditures,
2004–2007
GDP = gross domestic product.Source: State Bank of Pakistan. 2007. Economic Survey 2006–2007. Islamabad.
Total Revenue and Grants
Non-tax Revenue
Current Expenditure
Tax Revenue
Total Expenditure and Net Lending
Development Expenditure and Net Lending
14.3 13.8 14.2 14.9
11 10.1 10.6 10.5
33 3.7 3.6 3.9
16.7 17.218.5 19.2
13.5 13.3 13.615.8
3.1 3.9 4.8 4.9
2004 2005 2006 20070
5
10
15
20
25
% of GDP
South Asia Economic Report 2008_Sec1:40 Sec1:40South Asia Economic Report 2008_Sec1:40 Sec1:40 2/25/2008 11:25:56 AM2/25/2008 11:25:56 AM
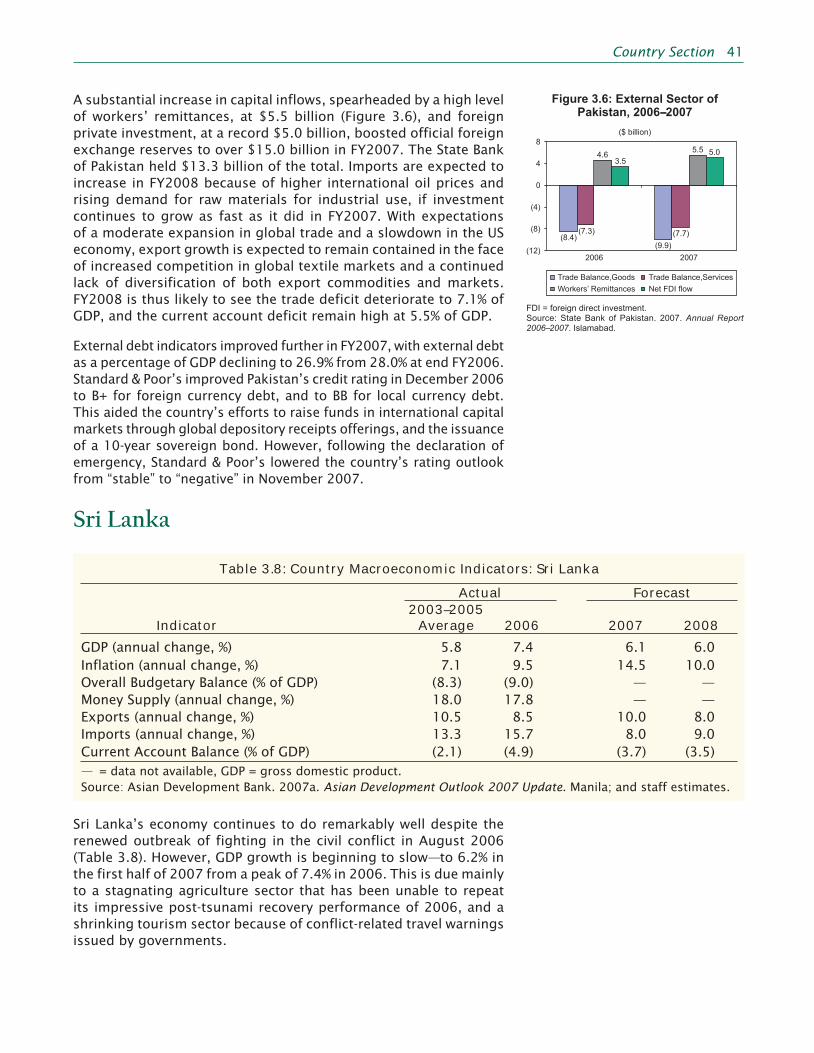
Country Section 41
A substantial increase in capital inflows, spearheaded by a high level of workers’ remittances, at $5.5 billion (Figure 3.6), and foreign private investment, at a record $5.0 billion, boosted official foreign exchange reserves to over $15.0 billion in FY2007. The State Bank of Pakistan held $13.3 billion of the total. Imports are expected to increase in FY2008 because of higher international oil prices and rising demand for raw materials for industrial use, if investment continues to grow as fast as it did in FY2007. With expectations of a moderate expansion in global trade and a slowdown in the US economy, export growth is expected to remain contained in the face of increased competition in global textile markets and a continued lack of diversification of both export commodities and markets. FY2008 is thus likely to see the trade deficit deteriorate to 7.1% of GDP, and the current account deficit remain high at 5.5% of GDP.
External debt indicators improved further in FY2007, with external debt as a percentage of GDP declining to 26.9% from 28.0% at end FY2006. Standard & Poor’s improved Pakistan’s credit rating in December 2006 to B+ for foreign currency debt, and to BB for local currency debt. This aided the country’s efforts to raise funds in international capital markets through global depository receipts offerings, and the issuance of a 10-year sovereign bond. However, following the declaration of emergency, Standard & Poor’s lowered the country’s rating outlook from “stable” to “negative” in November 2007.
Sri Lanka
Table 3.8: Country Macroeconomic Indicators: Sri Lanka
Actual Forecast
Indicator2003–2005
Average 2006 2007 2008GDP (annual change, %) 5.8 7.4 6.1 6.0Inflation (annual change, %) 7.1 9.5 14.5 10.0Overall Budgetary Balance (% of GDP) (8.3) (9.0) — —Money Supply (annual change, %) 18.0 17.8 — —Exports (annual change, %) 10.5 8.5 10.0 8.0Imports (annual change, %) 13.3 15.7 8.0 9.0Current Account Balance (% of GDP) (2.1) (4.9) (3.7) (3.5)— = data not available, GDP = gross domestic product.Source: Asian Development Bank. 2007a. Asian Development Outlook 2007 Update. Manila; and staff estimates.
Sri Lanka’s economy continues to do remarkably well despite the renewed outbreak of fighting in the civil conflict in August 2006 (Table 3.8). However, GDP growth is beginning to slow—to 6.2% in the first half of 2007 from a peak of 7.4% in 2006. This is due mainly to a stagnating agriculture sector that has been unable to repeat its impressive post-tsunami recovery performance of 2006, and a shrinking tourism sector because of conflict-related travel warnings issued by governments.
Figure 3.6: External Sector of Pakistan, 2006--2007
($ billion)
FDI = foreign direct investment.Source: State Bank of Pakistan. 2007. Annual Report 2006–2007. Islamabad.
(8.4)(9.9)
(7.3) (7.7)
4.6 5.53.5
5.0
(12)
(8)
(4)
0
4
8
2006 2007
Trade Balance,Goods Trade Balance,ServicesWorkers’ Remittances Net FDI flow
South Asia Economic Report 2008_Sec1:41 Sec1:41South Asia Economic Report 2008_Sec1:41 Sec1:41 2/25/2008 11:25:56 AM2/25/2008 11:25:56 AM
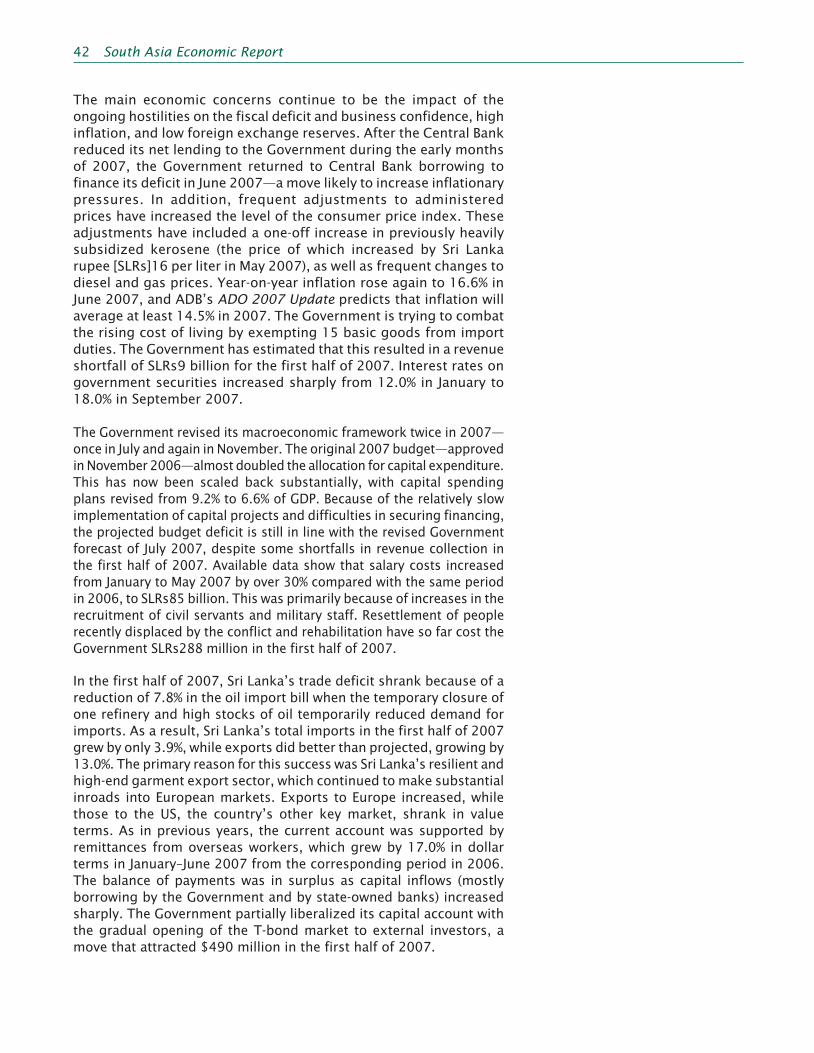
42 South Asia Economic Report
The main economic concerns continue to be the impact of the ongoing hostilities on the fiscal deficit and business confidence, high inflation, and low foreign exchange reserves. After the Central Bank reduced its net lending to the Government during the early months of 2007, the Government returned to Central Bank borrowing to finance its deficit in June 2007—a move likely to increase inflationary pressures. In addition, frequent adjustments to administered prices have increased the level of the consumer price index. These adjustments have included a one-off increase in previously heavily subsidized kerosene (the price of which increased by Sri Lanka rupee [SLRs]16 per liter in May 2007), as well as frequent changes to diesel and gas prices. Year-on-year inflation rose again to 16.6% in June 2007, and ADB’s ADO 2007 Update predicts that inflation will average at least 14.5% in 2007. The Government is trying to combat the rising cost of living by exempting 15 basic goods from import duties. The Government has estimated that this resulted in a revenue shortfall of SLRs9 billion for the first half of 2007. Interest rates on government securities increased sharply from 12.0% in January to 18.0% in September 2007.
The Government revised its macroeconomic framework twice in 2007—once in July and again in November. The original 2007 budget—approved in November 2006—almost doubled the allocation for capital expenditure. This has now been scaled back substantially, with capital spending plans revised from 9.2% to 6.6% of GDP. Because of the relatively slow implementation of capital projects and difficulties in securing financing, the projected budget deficit is still in line with the revised Government forecast of July 2007, despite some shortfalls in revenue collection in the first half of 2007. Available data show that salary costs increased from January to May 2007 by over 30% compared with the same period in 2006, to SLRs85 billion. This was primarily because of increases in the recruitment of civil servants and military staff. Resettlement of people recently displaced by the conflict and rehabilitation have so far cost the Government SLRs288 million in the first half of 2007.
In the first half of 2007, Sri Lanka’s trade deficit shrank because of a reduction of 7.8% in the oil import bill when the temporary closure of one refinery and high stocks of oil temporarily reduced demand for imports. As a result, Sri Lanka’s total imports in the first half of 2007 grew by only 3.9%, while exports did better than projected, growing by 13.0%. The primary reason for this success was Sri Lanka’s resilient and high-end garment export sector, which continued to make substantial inroads into European markets. Exports to Europe increased, while those to the US, the country’s other key market, shrank in value terms. As in previous years, the current account was supported by remittances from overseas workers, which grew by 17.0% in dollar terms in January–June 2007 from the corresponding period in 2006. The balance of payments was in surplus as capital inflows (mostly borrowing by the Government and by state-owned banks) increased sharply. The Government partially liberalized its capital account with the gradual opening of the T-bond market to external investors, a move that attracted $490 million in the first half of 2007.
South Asia Economic Report 2008_Sec1:42 Sec1:42South Asia Economic Report 2008_Sec1:42 Sec1:42 2/25/2008 11:25:56 AM2/25/2008 11:25:56 AM

REFERENCESAgarwal, Pradeep. 2000. Economic Impact of Foreign Direct Investment in South Asia. Bombay: Indira
Gandhi Institute of Development Research.
Agarwala, Ramgopal, and Brahm Prakash. 2002. Regional Cooperation in Asia: Long-term Progress, Recent Retrogression, and the Way Forward. Economics and Research Department (ERD) Working Paper Series No. 28. Manila: Asian Development Bank.
Ahmed, Sadiq, and Ejaz Ghani, eds. 2007. South Asia Growth and Regional Integration. Washington DC: World Bank.
Asian Development Bank (ADB). 2004. Asian Development Outlook 2004. Manila.———. 2006. South Asia Economic Report: Banking, Governance, and the Investment Climate. Manila.———. 2007a. Asian Development Outlook 2007 Update. Manila.———. 2007b. Quarterly Economic Update on Nepal IV (2). Manila. ———. 2007c. South Asia Economic Report: Social Sectors in Transition. Manila.
Balasubramanyam, V.N., and David Sapsford. 2007. Does India Need a Lot More FDI? Economic and Political Weekly 42 (17): 1549–1555.
Banga, Rashmi. 2002. The Differential Impact of Japanese and U.S. Foreign Direct Investments on Exports of Indian Manufacturing. New Delhi: Jesus and Mary College.
Bangladesh Board of Investment. 2005. FDI in Bangladesh during 2004. Dhaka: Government of Bangladesh.
Bergman, Annika. 2006. FDI and Spillover Effects in the Indian Pharmaceutical Industry. Research and Information System for Developing Countries (RIS) Discussion Paper No. 113. New Delhi.
Bhattacharya, Debapriya. 2007. South Asia: Intra-Regional Opportunities and Challenges. Presented at the Fostering Trade through Private-Public Dialogue Expert Meeting on Regional Integration in Asia, New Delhi, March 28–29.
Bosworth, Barry, Susan Collins, and Arvind Virmani. 2007. Sources of Growth in the Indian Economy. National Bureau of Economic Research (NBER) Working Paper No. 12901. Cambridge, United States (US).
Brooks, Douglas, and Hal Hill. 2004. Divergent Asian Views on Foreign Direct Investment and Its Governance. Asian Development Review 21 (1): 1–36.
Chaitanya, Krishna. 2007. The Effects of Civil War on Foreign Direct Investment (FDI) in Sri Lanka. Working Paper 2007-01. Galicia, Spain: University of Santiago de Compostela.
Department of Industrial Policy and Promotion. 2007. Factsheet on Foreign Direct Investment. New Delhi: Government of India.
Dutz, Mark Andrew. 2004. Harmonizing Regulatory Mechanisms: Options for Deepening Investment Integration in South Asia. Washington DC: World Bank.
Estache, Antonio, and Ana Goicoechea. 2005. A “Research” Database on Infrastructure Economic Performance. World Bank Policy Research Paper 3643. Washington DC: World Bank.
South Asia Economic Report 2008_Sec1:43 Sec1:43South Asia Economic Report 2008_Sec1:43 Sec1:43 2/25/2008 11:25:56 AM2/25/2008 11:25:56 AM

44 South Asia Economic Report
Gordon, James, and Poonam Gupta. 2004. Understanding India’s Services Revolution. International Monetary Fund (IMF) Working Paper WP/04/171. Washington DC: IMF.
Japan Bank for International Cooperation (JBIC). 2006. Survey Report on Overseas Business Operations by Japanese Manufacturing Companies. Tokyo: JBIC.
Jones, Stephen. 2006. Infrastructure Challenges in East and South Asia. Promoting Growth, Ending Poverty, Asia 2015 Conference, London, 6–7 March.
Kokko, Ari. 1992. Foreign Direct Investment, Host Country Characteristics and Spillovers. Stockholm: Stockholm School of Economics.
Kumar, Nagesh. 2003. Liberalization, Foreign Direct Investment Flows, and Economic Development: The Indian Experience in the 1990s. RIS Discussion Paper No. 65/2003. New Delhi.
Markusen, James. 2000. Foreign Direct Investment and Trade. Centre for International Economic Studies (CIES) Policy Discussion Paper No. 0019. Adelaide: CIES.
Menon, Nidhiya and Paroma Sanyal. 2004. Labor Conflict and Foreign Investments: An Analysis of FDI in India. Unpublished.
Mohnot, S.R. 2007. Intraregional Trade and Investment in South Asia Case Study: Automobile Industry. Unpublished.
Nataraj, Geethanjali. 2007. Infrastructure Challenges in South Asia: The Role of Public-Private Partnerships. ADB Institute Discussion Paper No. 80. Tokyo.
Office of Industries, US International Trade Commission. 2007. Competitive Conditions for Foreign Direct Investment in India. Publication 3931. Washington DC.
Pakistan Telecommunication Authority (PTA). 2007. Foreign Direct Investment Policy for Telecom Sector. Available: www.pta.gov.pk
Pant, Bhubanesh, and Bama Dev Sigdel. 2004. Attracting Foreign Direct Investment: Experiences and Challenges. Nepal Rastra Bank (NRB) Working Paper 1. Kathmandu: NRB.
Roland-Holst, David. 2006. Infrastructure as a Catalyst for Regional Integration, Growth, and Economic Convergence: Scenario Analysis for Asia. ERD Working Paper Series No. 91. Manila: ADB.
Sahoo, Pravakar. 2006. Foreign Direct Investment in South Asia: Policy, Trends, Impact and Determinants. ADB Institute Discussion Paper No. 56. Tokyo.
Shiu, Waicheong. 2006. FDI in India and South Asia: Trends, Determinants, and Policy. mimeo
State Bank of Pakistan. 2007. Statistical Bulletin, October. Available: http://www.sbp.org.pk/reports/stat_reviews/Bulletin/2007/Oct_07/index.htm
———. 2006. Economic Survey 2005–2006. Islamabad.
Transparency International. 2007. Global Corruption Report 2007. United Kingdom.
World Bank. 2005. World Development Report 2005: A Better Investment Climate for Everyone. Washington DC.
South Asia Economic Report 2008_Sec1:44 Sec1:44South Asia Economic Report 2008_Sec1:44 Sec1:44 2/25/2008 11:25:56 AM2/25/2008 11:25:56 AM

References 45
———. 2007a. Doing Business 2008: Overview. Washington DC. Available: http://www.doingbusiness.org/documents/DB-2008-overview.pdf
———. 2007b. Doing Business in South Asia 2007. Washington DC.———. 2007c. Global Development Finance 2007. Washington DC.———. 2007d. Interim Strategy Note for Islamic Republic of Afghanistan for the Period FY07–FY08.
Washington DC. ———. 2007e. Sri Lanka Development Forum: The Economy, Regional Disparities, and Global
Opportunities. Washington DC.———. Various dates. Enterprise Surveys. Available: http://www.enterprisesurveys.org. Accessed: 26 September 2007.
World Economic Forum (WEF). 2007. Global Competitiveness Report 2006–2007. Geneva.
United Nations Conference on Trade and Development (UNCTAD). 2004. Investment Policy Review of Sri Lanka. Geneva.
———. 2007. World Investment Report 2007. Geneva.
South Asia Economic Report 2008_Sec1:45 Sec1:45South Asia Economic Report 2008_Sec1:45 Sec1:45 2/25/2008 11:25:56 AM2/25/2008 11:25:56 AM

South Asia Economic Report 2008_Sec1:46 Sec1:46South Asia Economic Report 2008_Sec1:46 Sec1:46 2/25/2008 11:25:56 AM2/25/2008 11:25:56 AM

STATISTICAL APPENDIX
Statistical Notes
Macroeconomic Indicators
National Accounts
A1 GDP and Per Capita GDPA2 Growth Rate of GDPA3 Growth Rate of Per Capita GDPA4 Shares of Major Sectors
Money and Prices
A5 Infl ation RateA6 Money Supply Growth
Government Finance
A7 Revenues and ExpenditureA8 Fiscal Balance
External Sector
A9 Exports—GoodsA10 Imports—GoodsA11 Trade BalanceA12 Exports—ServicesA13 Workers’ RemittancesA14 Current Account BalanceA15 Foreign Direct InvestmentA16 Gross International ReservesA17 External Debt
South Asia Economic Report 2008_Sec1:47 Sec1:47South Asia Economic Report 2008_Sec1:47 Sec1:47 2/25/2008 11:25:57 AM2/25/2008 11:25:57 AM

48 South Asia Economic Report
Statistical Notes
Data in the tables presented in this issue refer to the fiscal year unless otherwise specified. Annual data were obtained from the Asian Development Outlook (ADO) and ADO 2007 Update, the Economic Information System of the South Asia Regional Department of the Asian Development Bank (ADB), official and secondary sources, and statistical publications.
As much as possible, data were standardized to allow comparability over time and across South Asian countries. However, limitations were imposed by the lack of available quarterly and monthly data records, and by differences in fiscal year coverage for most South Asian countries (for a complete list, see the Explanatory Notes).
Regional averages in the Introduction are weighted according to gross national income in current US dollars (World Bank Atlas method). Regional aggregates in Section 2 are unweighted aggregates of the relevant countries in the group, unless otherwise indicated.
Where country data are missing for a given year, regional aggregates are computed based on the available information only. For weighted regional averages where the missing data are for 2007, the data for 2006 are used instead.
Regional aggregates in the tables in the statistical appendix on annual changes of exports and imports of goods, and exports of services (Tables A9, A10, and A12) are computed based on a consistent sum (i.e., in cases where country data are missing for a given year, the sum of the prior year used for computing the growth rate excludes the corresponding country data).
Tables in Section 3 present selected national macroeconomic indicators, including gross domestic product (GDP) growth, inflation, overall budgetary surplus/deficit, money supply growth, exports and imports of goods, and current account balance. Data in these tables cover FY2003–2008: FY2003–2005 data are an average, FY2006 data are actual, and FY2007 and FY2008 data are forecasts (except for Bangladesh and Nepal, which report actual/estimates for FY2007, and Pakistan, which reports actual for FY2007).
The statistical appendix presents selected macroeconomic indicators for the eight South Asian countries. The tables are generally grouped under the following headings:• national accounts (Tables A1–A4),• money and prices (Tables A5–A6),• government finance (Tables A7–A8), and• external sector (Tables A9–A17).
Data presented in these tables are based on data provided by ADB country economists for the ADO 2007 Update. For a detailed
South Asia Economic Report 2008_Sec1:48 Sec1:48South Asia Economic Report 2008_Sec1:48 Sec1:48 2/25/2008 11:25:57 AM2/25/2008 11:25:57 AM

Statistical Appendix 49
discussion of statistical sources, methodology, definitions, scope, and limitations, refer to ADO 2007 and ADO 2007 Update.
GDP and GDP per capita valued at current market prices are presented in Table A1. GDP per capita is defined as GDP at current prices divided by total population.
Annual growth rates of GDP (A2) and GDP per capita (A3) for Afghanistan, Bangladesh, and Bhutan are reported based on GDP valued at constant market prices. For Maldives, A2 and A3 data are based on constant basic prices. For the rest of South Asia (India, Nepal, Pakistan, and Sri Lanka), A2 and A3 data are based on GDP valued at constant factor cost.
Shares of GDP for the three major sectors—agriculture, industry, and services—for 2001 to 2006 presented in Table A4 are based on constant prices. The agriculture sector includes agricultural crops, livestock, poultry, fisheries, and forestry. The industry sector includes the manufacturing and nonmanufacturing subsectors such as mining and quarrying, construction, and utilities. The services sector includes trade, banking, finance, real estate, public administration, and other services.
Data on inflation rates presented in Table A5 represent period averages based on the consumer price index except for India, which reports wholesale price index. The consumer price index for Nepal is for urban consumers, and that for Afghanistan is for Kabul only.
Except for Sri Lanka and India, money supply growth (A6) is presented as annual percentage change in the end-of-period supply of broad money as represented by M2, which is the sum of currency in circulation plus demand deposits (M1) and quasi-money. Money supply growth for Sri Lanka is based on M2b (M2 plus time and savings deposits held by commercial banks’ foreign currency banking units), while for India money supply is represented by M3 (M2 plus other assets that are less liquid, including deposits with the Reserve Bank of India).
Tables A7 and A8 present central government finance, except for India, which reports government finance on a consolidated basis. Government revenues (% of GDP) generally comprise nonrepayable current and capital receipts plus grants divided by GDP at current prices. In A7, capital receipts for Afghanistan, Bangladesh, India, and Pakistan are not reported. Grants are likewise not reported in Bangladesh, India, and Pakistan. Other items included are revenues from disinvestment in India, and privatization proceeds in Sri Lanka. Expenditures (% of GDP) comprise all nonrepayable payments to both current and capital expenses plus net lending divided by GDP at current prices. Fiscal balance (% of GDP) presented in Table A8 is the difference between government revenues and expenditures divided by GDP at current prices.
South Asia Economic Report 2008_Sec1:49 Sec1:49South Asia Economic Report 2008_Sec1:49 Sec1:49 2/25/2008 11:25:57 AM2/25/2008 11:25:57 AM
50 South Asia Economic Report
Annual changes in exports of goods (A9) are reported based on free on board (FOB) valuation of exports. Annual changes in imports of goods (A10) are also reported on an FOB basis, except for Afghanistan, Bhutan, and India, as these countries report imports on a cost, insurance, and freight (CIF) basis. Trade balance (A11) is the difference between exports and imports of goods.
Tables A12 and A13 report services exports and workers’ remittances, respectively. Services exports may include transport and travel services, communication, computers, and other services. Workers’ remittances cover current transfers by migrants who are employed in economies where they migrated and are considered residents.
Current account balances (% of GDP) presented in Table A14 are based on the sum of the balance of trade for merchandise and services, net factor income, and net transfers divided by GDP at current prices in US dollars.
Foreign direct investment presented in Table A15 refers to equity capital, reinvested earnings, investment in debt securities, and other capital associated with the transactions of enterprises, net of repatriations and intercompany loan repayments.
Except for Maldives, gross international reserves (GIR) comprise holdings of special drawing rights, reserve position in the International Monetary Fund (IMF), and foreign exchange at the end of the given period (A16). The GIR of Maldives includes all of the above plus the foreign assets of the Maldives Monetary Authority.
Table A17 presents outstanding external debt (total external debt divided by GDP) and debt service ratio (total debt service divided by exports of goods and services). For Bangladesh, the sum of exports of goods, nonfactor services, and workers’ remittances is the denominator for the latter ratio.
South Asia Economic Report 2008_Sec1:50 Sec1:50South Asia Economic Report 2008_Sec1:50 Sec1:50 2/25/2008 11:25:57 AM2/25/2008 11:25:57 AM

Statistical Appendix 51
Macroeconomic Indicators
National Accounts
Table A1: GDP and Per Capita GDP (current market prices) GDP ($ billion) Per Capita GDP ($)
2001 2006 2001 2006
South Asia 622.6 1,145.6 467.1 795.1Afghanistan 2.5 8.3 115.1 337.8Bangladesh 47.0 62.0 361.7 446.5Bhutan 0.5 1.0 693.4 1,266.6India 478.3 910.6 460.8 811.6Maldives 0.6 0.9 2,165.8 3,107.5Nepal 6.0 9.0 258.9 347.7Pakistan 72.0 126.9 504.3 809.3
Sri Lanka 15.7 27.0 840.8 1,355.2
Table A2: Growth Rate of GDP (annual change, %) 2001 2002 2003 2004 2005 2006 2007 2008
South Asia 5.1 3.7 7.8 7.4 8.7 8.8 8.1 8.1Afghanistan — 28.6 15.7 8.0 14.0 7.5 13.5 8.4Bangladesh 5.3 4.4 5.3 6.3 6.0 6.6 6.5 6.0Bhutan 7.4 8.6 8.7 7.2 6.9 9.1 17.0 14.4India 5.8 3.8 8.5 7.5 9.0 9.4 8.5 8.5Maldives 3.5 6.5 8.5 9.5 (4.6) 19.1 7.3 8.0Nepal 4.8 0.2 3.9 4.7 3.1 2.8 2.5 2.8Pakistan 2.0 3.1 4.7 7.5 9.0 6.6 7.0 6.5
Sri Lanka (1.5) 4.0 6.0 5.4 6.0 7.4 6.1 6.0
Table A3: Growth Rate of Per Capita GDP (annual change, %) 2001 2002 2003 2004 2005 2006 2007 2008
South Asia 3.3 2.1 6.0 5.7 7.0 7.3 6.6 6.8Afghanistan — — 13.6 3.3 12.1 3.4 10.1 5.6Bangladesh 5.2 3.1 3.8 4.9 4.6 5.2 5.1 5.2Bhutan 6.0 7.2 7.3 5.8 5.5 7.7 15.4 12.8India 3.9 2.1 6.7 5.8 7.3 7.9 6.9 7.0Maldives 1.7 4.8 6.8 8.0 (6.2) 17.3 5.7 —Nepal 1.9 1.9 2.0 2.1 2.3 2.4 2.7 2.7Pakistan (0.2) 0.9 2.6 6.0 6.9 4.7 4.6 —
Sri Lanka (2.9) 2.5 4.7 4.3 4.9 6.2 — —
South Asia Economic Report 2008_Sec1:51 Sec1:51South Asia Economic Report 2008_Sec1:51 Sec1:51 2/25/2008 11:25:57 AM2/25/2008 11:25:57 AM
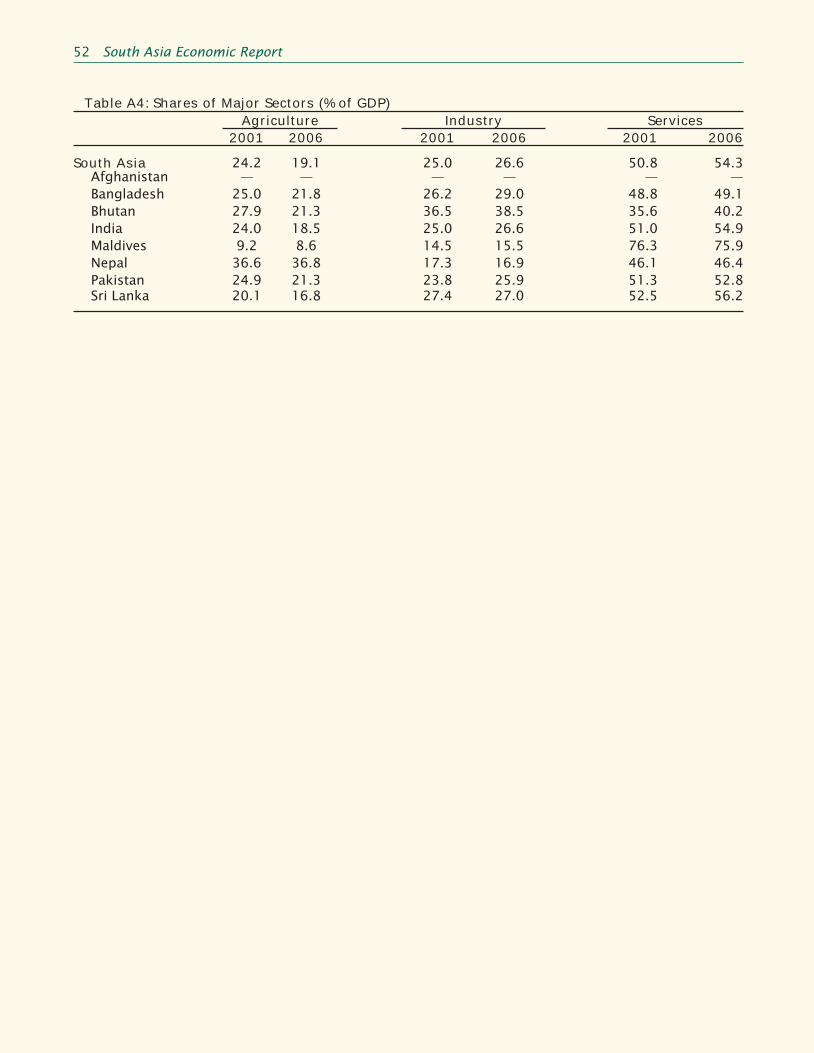
52 South Asia Economic Report
Table A4: Shares of Major Sectors (% of GDP) Agriculture Industry Services
2001 2006 2001 2006 2001 2006
South Asia 24.2 19.1 25.0 26.6 50.8 54.3Afghanistan — — — — — —Bangladesh 25.0 21.8 26.2 29.0 48.8 49.1Bhutan 27.9 21.3 36.5 38.5 35.6 40.2India 24.0 18.5 25.0 26.6 51.0 54.9Maldives 9.2 8.6 14.5 15.5 76.3 75.9Nepal 36.6 36.8 17.3 16.9 46.1 46.4Pakistan 24.9 21.3 23.8 25.9 51.3 52.8
Sri Lanka 20.1 16.8 27.4 27.0 52.5 56.2
South Asia Economic Report 2008_Sec1:52 Sec1:52South Asia Economic Report 2008_Sec1:52 Sec1:52 2/25/2008 11:25:57 AM2/25/2008 11:25:57 AM

Statistical Appendix 53
Money and Prices
Table A5: Infl ation Rate (annual change, %) a
2001 2002 2003 2004 2005 2006 2007 2008
South Asia 3.8 3.5 5.0 6.3 5.3 5.9 5.7 5.5Afghanistan — 5.1 24.1 13.2 12.3 5.1 7.0 8.0Bangladesh 1.9 2.8 4.4 5.8 6.5 7.2 7.2 8.0Bhutan 3.4 2.9 2.1 3.6 4.8 4.9 5.2 5.0India 3.7 3.4 5.4 6.4 4.4 5.4 5.0 5.0Maldives 0.7 0.9 -2.9 6.4 3.3 3.5 7.0 6.0Nepal 2.4 2.9 4.8 4.0 4.5 8.0 6.4 5.0Pakistan 4.4 3.5 3.1 4.6 9.3 7.9 7.8 6.5
Sri Lanka 12.1 10.2 2.6 7.9 10.6 9.5 14.5 10.0
a Consumer Price Index, except for India (Wholesale Price Index).
Table A6: Money Supply Growth (annual change, %) a
2001 2002 2003 2004 2005 2006 2007 2008
South Asia 13.7 14.5 16.7 13.5 20.5 20.3 19.7 19.6Afghanistan — — 50.5 31.9 16.2 12.4 19.0 14.4Bangladesh 16.6 13.1 15.6 13.8 16.8 19.5 17.0 15.0Bhutan 5.5 17.6 28.7 4.0 10.7 24.8 7.6 —India 14.1 14.7 16.7 12.3 21.2 21.3 20.0 20.0Maldives 9.1 19.5 14.5 32.7 11.7 20.6 — —Nepal 15.2 4.4 9.8 12.8 8.3 15.4 14.0 —Pakistan 9.0 15.4 18.0 19.6 19.3 15.2 19.3 —
Sri Lanka 13.6 13.4 15.3 19.6 19.1 17.8 — —
a M2, except for India (M3) and Sri Lanka (M2b). For India, M3 includes deposits with the Reserve Bank of India. For Sri Lanka, M2b includes time and savings deposits held by commercial banks’ foreign currency banking units.
South Asia Economic Report 2008_Sec1:53 Sec1:53South Asia Economic Report 2008_Sec1:53 Sec1:53 2/25/2008 11:25:57 AM2/25/2008 11:25:57 AM

54 South Asia Economic Report
Government Finance
Table A7: Revenues and Expenditure (% of GDP) Tax Revenue Total Revenue Total Expenditure
2001 2006 2001 2006 2001 2006
South Asia 12.9 15.5 16.4 19.1 25.3 24.9Afghanistan — 5.5 — 15.7 — 18.4Bangladesh 7.6 8.5 9.0 10.7 14.0 13.9Bhutan 8.9 10.5 40.5 34.2 52.7 35.0India 13.8 16.8 17.7 20.5 27.6 26.9Maldives — — 33.0 61.5 37.7 68.6Nepal 8.8 8.9 12.1 13.1 16.3 14.7Pakistan 10.5 10.6 13.1 14.2 17.4 17.3
Sri Lanka 14.6 15.5 16.6 17.2 27.5 26.2
Table A8: Fiscal Balance (% of GDP) 2001 2002 2003 2004 2005 2006 2007 2008
South Asia (8.9) (8.5) (7.5) (6.6) (6.6) (5.9) (3.9) (3.7)Afghanistan — (0.1) (3.0) (1.2) 0.9 (2.7) (2.6) (2.0)Bangladesh (5.0) (4.6) (3.4) (3.2) (3.4) (3.2) (3.2) (4.2)Bhutan (11.6) (5.0) (10.4) 1.9 (6.9) (0.8) (3.4) (1.8)India (9.9) (9.6) (8.5) (7.5) (7.4) (6.3) — —Maldives (4.7) (4.9) (3.4) (1.6) (10.9) (7.1) (27.6) —Nepal (4.2) (3.6) (1.4) (0.9) (0.8) (1.6) (2.0) (2.4)Pakistan (4.3) (4.3) (3.7) (2.4) (3.3) (3.1) (4.3) (4.2)
Sri Lanka (10.8) (8.9) (8.0) (8.2) (8.7) (9.0) — —
South Asia Economic Report 2008_Sec1:54 Sec1:54South Asia Economic Report 2008_Sec1:54 Sec1:54 2/25/2008 11:25:57 AM2/25/2008 11:25:57 AM

Statistical Appendix 55
External Sector
Table A9: Exports—Goods (annual change, %) 2001 2002 2003 2004 2005 2006 2007 2008
South Asia 0.1 13.6 20.8 24.0 21.0 19.6 14.4 14.5Afghanistan — 82.1 46.7 (13.2) 9.2 15.7 18.3 4.7Bangladesh 12.6 (7.6) 9.5 15.9 14.0 21.5 15.8 13.5Bhutan (12.9) 4.1 8.9 39.7 18.0 47.2 67.0 31.9India (1.6) 20.3 23.3 28.5 23.4 20.9 16.0 16.0Maldives 1.4 20.1 14.9 19.1 (10.7) 39.4 2.8 —Nepal 11.7 (20.3) (13.8) 14.8 11.4 2.6 4.2 6.0Pakistan 9.1 2.3 19.1 13.8 16.2 14.9 3.3 7.0
Sri Lanka (12.8) (2.4) 9.2 12.2 10.2 8.5 10.0 8.0
Table A10: Imports—Goods (annual change, %) 2001 2002 2003 2004 2005 2006 2007 2008
South Asia (1.7) 8.8 22.2 39.2 30.0 22.4 20.9 19.7Afghanistan — 52.5 50.9 2.3 11.5 23.9 11.9 6.6Bangladesh 11.4 (8.7) 13.1 13.0 20.6 12.1 16.6 15.9Bhutan 1.1 8.6 1.6 27.3 63.2 (5.6) 17.0 17.5India (2.8) 14.5 24.1 48.6 32.0 22.3 24.0 22.0Maldives 1.3 (0.5) 20.2 36.3 16.1 24.4 14.8 —Nepal 6.7 (15.3) 7.1 15.9 12.5 17.8 11.3 10.0Pakistan 6.2 (7.5) 20.1 20.0 37.8 33.3 7.9 10.1
Sri Lanka (18.4) 2.2 9.3 19.9 10.8 15.7 8.0 9.0
Table A11: Trade Balance (% of GDP) 2001 2002 2003 2004 2005 2006 2007 2008
South Asia (2.8) (2.3) (2.5) (4.9) (6.5) (7.4) (8.1) (9.2)Afghanistan (38.0) (29.8) (41.2) (37.4) (34.5) (39.6) (36.2) (34.3)Bangladesh (4.3) (3.7) (4.3) (4.1) (5.5) (4.7) (5.1) (5.9)Bhutan (18.9) (19.5) (16.1) (15.5) (32.2) (14.0) 1.1 (6.3)India (2.4) (2.1) (2.3) (4.8) (6.4) (7.1) (8.1) (9.3)Maldives (39.5) (33.2) (38.0) (49.4) (65.9) (63.7) (67.1) —Nepal (12.8) (11.6) (14.3) (14.5) (14.6) (17.0) (17.3) —Pakistan (1.8) (0.4) (0.5) (1.2) (4.0) (6.7) (6.9) (7.1)
Sri Lanka (7.3) (8.5) (8.4) (11.2) (10.7) (12.5) — —
South Asia Economic Report 2008_Sec1:55 Sec1:55South Asia Economic Report 2008_Sec1:55 Sec1:55 2/25/2008 11:25:57 AM2/25/2008 11:25:57 AM

56 South Asia Economic Report
Table A12: Exports—ServicesAnnual Change (%) % of GDP
2001 2002 2003 2004 2005 2006 2001 2006South Asia 5.5 19.1 28.5 50.6 38.5 30.9 3.5 7.9
Afghanistan — — — — — — — —
Bangladesh (10.6) 14.0 2.5 4.2 27.4 13.8 1.6 2.2
Bhutan 76.0 (5.6) (15.2) 25.6 47.6 32.6 6.7 6.9
India 5.4 21.1 29.4 61.0 42.0 32.5 3.6 8.9
Maldives 1.6 2.5 19.0 17.6 (36.4) 46.5 59.2 45.1
Nepal — — — — (22.2) 1.9 — 4.1
Pakistan (2.5) 38.5 46.4 (2.5) 32.6 23.0 2.0 3.7 Sri Lanka 42.2 (6.4) 11.3 8.2 0.9 5.5 8.6 6.0
Table A13: Workers’ Remittances ($ million)
2001 2002 2003 2004 2005 2006South Asia 20,525 23,985 31,591 30,676 35,406 41,370
Afghanistan — — — — — —Bangladesh 1,882 2,501 3,062 3,372 3,848 4,802
Bhutan — — — — — —
India a 15,760 17,189 22,182 21,075 24,560 28,223
Maldives — — — — — —
Nepal 641 619 696 794 911 1,419
Pakistan 1,087 2,389 4,237 3,871 4,169 4,600 Sri Lanka 1,155 1,287 1,414 1,564 1,918 2,326
a Data from Reserve Bank of India (RBI).
Table A14: Current Account Balance (% of GDP)
2001 2002 2003 2004 2005 2006 2007 2008South Asia 0.3 1.2 2.3 (0.2) (1.2) (1.4) (1.9) (2.1)
Afghanistan — (3.7) 3.0 1.8 0.6 (0.6) (2.0) (3.2)Bangladesh (2.3) 0.3 0.3 0.3 (0.9) 1.3 1.4 1.2Bhutan (9.4) (12.7) (14.5) (10.8) (28.2) (3.3) 10.6 10.1
India 0.7 1.2 2.3 (0.4) (1.1) (1.1) (1.6) (1.9)
Maldives (9.8) (5.6) (4.5) (15.8) (36.0) (39.8) (45.0) —
Nepal 4.9 4.0 2.4 2.7 2.0 2.2 0.5 1.0
Pakistan (0.7) 1.8 3.8 1.3 (1.6) (4.5) (5.2) (5.5) Sri Lanka (1.4) (1.4) (0.4) (3.2) (2.8) (4.9) (3.7) (3.5)

Statistical Appendix 57
Table A15: Foreign Direct Investment ($ million) 2001 2002 2003 2004 2005 2006South Asia 7,054 6,152 5,726 7,700 10,446 24,332
Afghanistan — 50 58 187 271 231Bangladesh 550 391 376 385 800 743Bhutan 0 2 2 3 9 6India 6,125 5,036 4,322 5,987 7,661 19,442Maldives 12 12 14 15 10 14Nepal 0 (4) 12 0 2 (6)Pakistan 286 483 771 906 1,459 3,451
Sri Lanka 82 181 171 217 234 451
Table A16: Gross International Reserves
$ Million Months of Import Coverage
2001 2006 2001 2006South Asia 59,815 220,867 6.7 8.4
Afghanistan — 2,063 — 4.9Bangladesh 1,307 3,484 1.6 2.7Bhutan 293 479 15.8 11.6India 54,106 199,179 9.3 9.9Maldives 94 232 2.5 3.0Nepal 1,001 1,833 6.9 7.7Pakistan 1,677 10,760 1.4 3.5
Sri Lanka 1,338 2,837 2.3 2.9
Table A17: External Debt
% of GDP
Debt Service a (% of exports of
goods and services) 2001 2006 2001 2006South Asia 25.3 19.9 14.8 9.4
Afghanistan — 19.7 — 1.5Bangladesh 31.2 30.0 6.6 4.1Bhutan 51.2 77.5 4.7 5.8India 20.7 17.0 13.4 —Maldives 35.1 62.9 4.3 4.5Nepal 44.4 36.2 6.2 9.3Pakistan 45.0 28.0 32.7 13.2
Sri Lanka 53.2 45.4 13.2 12.7
a Includes remittances for Bangladesh.
South Asia Economic Report 2008_Sec1:57 Sec1:57South Asia Economic Report 2008_Sec1:57 Sec1:57 2/25/2008 11:25:57 AM2/25/2008 11:25:57 AM

Asian Development Bank6 ADB Avenue, Mandaluyong City1550 Metro Manila, Philippineswww.adb.orgPublication Stock No. BBK091808ISSN 1995-560X Printed in the Philippines
South Asia Economic Report
This issue of the South Asia Economic Report (SAER) is the third in a series of biannual reports on economic and development issues in South Asia. It is a cooperative effort of the South Asia Department and the Central and West Asia Department of the Asian Development Bank (ADB). The SAER aims to provide information to policy makers, academics, and ADB management and staff. It highlights issues that help promote debate and foster appropriate policies and greater cooperation and integration in the region. The themes of the first and second issues of the SAER were, respectively, “Banking, Governance, and the Investment Climate,” and “Social Sectors in Transition: Accelerating Inclusive Growth and Human Development.” This issue’s theme is “Foreign Direct Investment in South Asia.”
The key messages of this third SAER are recapitulated below:
• South Asia continues on a high growth track.
• Foreign direct investment (FDI) is one of the key elements required for sustainable economic growth in the region.
• The region has made efforts to liberalize its policies, and FDI inflows into the region have been increasing.
• The absolute amount of FDI, however, is still low compared to other developing regions and countries of Asia.
• The region’s main obstacle in attracting FDI is its poor business climate.
• South Asia has great opportunities for increasing FDI, and foreign investors’ perception of the region is becoming progressively more positive.
• Macroeconomic and political stability, appropriate policy and regulatory frameworks, infrastructure development, accelerated development of small and medium-sized enterprises, improvement in the quality of local workers, and enhancement of regional cooperation are all needed for further promotion of FDI in South Asia.
About the Asian Development Bank
ADB aims to improve the welfare of the people in the Asia and Pacific region, particularly the nearly 1.9 billion who live on less than $2 a day. Despite many success stories, the region remains home to two thirds of the world’s poor. ADB is a multilateral development finance institution owned by 67 members, 48 from the region and 19 from other parts of the globe. ADB’s vision is a region free of poverty. Its mission is to help its developin g member countries reduce poverty and improve their quality of life.
ADB’s main instruments for helping its developing member countries are policy dialogue, loans, equity investments, guarantees, grants, and technical assistance.
ADB’s headquarters is in Manila. It has 26 offices around the world and more than 2,000 employees from over 50 countries.
South Asia Economic_2007.indd 2 2/22/08 5:12:36 PM