South Africans’ Views of Parliament and MPs: A Comparative Perspective Presentation to Panel for...
74
South Africans’ Views of Parliament and MPs: A Comparative Perspective Presentation to Panel for Assessment of Parliament 12 February 2008 Robert Mattes Co-Founder and Senior Adviser, Afrobarometer Director, Democracy in Africa Research Unit Centre for Social Science Research, UCT
-
Upload
merryl-jackson -
Category
Documents
-
view
213 -
download
0
Transcript of South Africans’ Views of Parliament and MPs: A Comparative Perspective Presentation to Panel for...

South Africans’ Views of Parliament and MPs:
A Comparative PerspectivePresentation to Panel for Assessment of Parliament
12 February 2008
Robert MattesCo-Founder and Senior Adviser, Afrobarometer
Director, Democracy in Africa Research UnitCentre for Social Science Research, UCT

Today’s Presentation
1. Review of relevant data from the Afrobarometer
– Knowledge About Parliament and MPs– Contact With MPs– Role Expectations of Parliament and MPs– Evaluations of Parliament and MPs– Key Determinant of Public Attitudes
2. Explaining public views of Parliament and MPs
3. New data and projects

Afrobarometer
• A comparative series of national public attitude surveys in Africa on Democracy, Markets and Civil Society
• Scientific project dedicated to accurate and precise measurement of nationally representative samples of publics
• Policy relevant project that inserts results into national and global policy discussion
• Ultimately, advancing democracy in Africa by promoting the voice of public opinion

When and Where
• In “reforming” African countries (generally, multi party regimes that have had a founding democratic election, or a re-democratizing election)
• Round 1 (12 countries, mid-1999 to mid 2001) • in West Africa: Ghana, Mali, Nigeria• in East Africa: Uganda and Tanzania• in Southern Africa: Botswana, Lesotho, Malawi, Namibia, South Africa,
Zambia and Zimbabwe
• Round 2 (16 countries, mid 2002-late 2003) – repeats original 12 (Zimbabwe in early 2004)– Adds Cape Verde, Kenya, Mozambique, and Senegal
• Round 3 (18 countries, 2005)– Adds Madagascar and Benin

Sampling
• Random
• Clustered
• Stratified
• Area Probability
• Proportionate (some exceptions: e.g Tanzania, South Africa)
• Multi Stage
• Nationally representative
• Minimum Sample Size of 1200 gives a margin of sampling error of +/- 3 percentage points (2.8 points)

Interviewing
• Personal, face-to-face interviews
• Questionnaires translated in to local languages
• Interviewers fluent in local languages
• Strong emphasis on interviewer training

South Africans’ Knowledge of Parliament and MPs

Opinionation
0%
10%
20%
30%
40%
50%
60%
70%
80%
90%
100%
President Member of Parliament Local Councilor
% Trustworthiness % Performance % Extent of Corruption
Opinions On MP Performance
0%
10%
20%
30%
40%
50%
60%
70%
80%
90%
100%
% With Opinion About MP Performance

Has View on MP’s Most Important Responsibilities
0%
10%
20%
30%
40%
50%
60%
70%
80%
90%
100%
% With View About MP Responsibilities

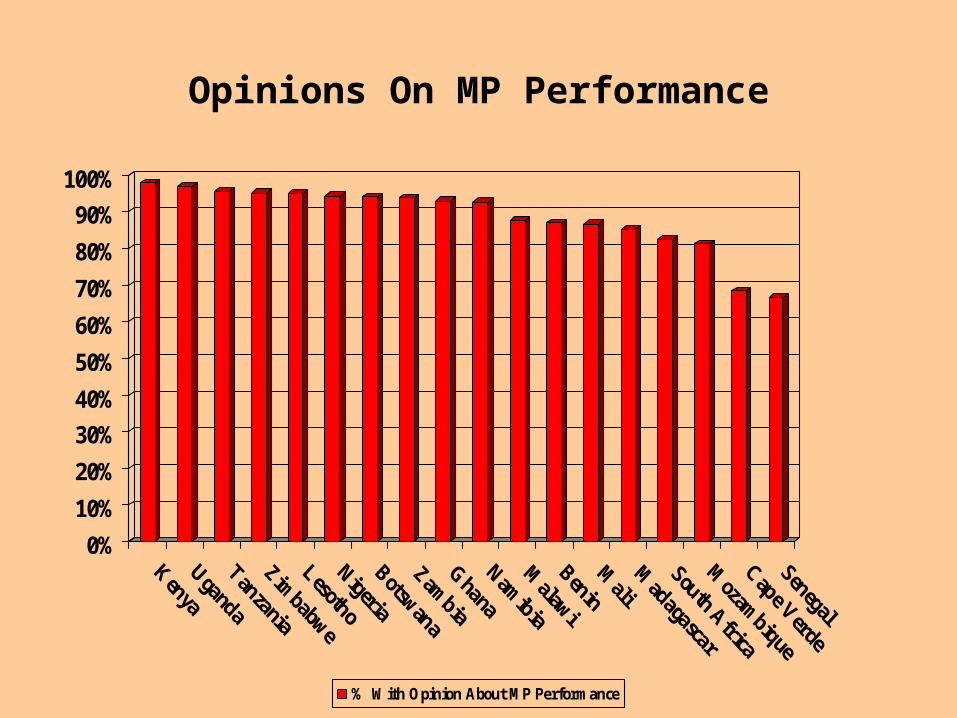
Knowledge of Incumbent Identity
0%
10%
20%
30%
40%
50%
60%
70%
80%
90%
100%
Deputy President Member of Parliament Local Councilor
% Correct Name
South Africa:Knowledge of Incumbent Identity
0%
10%
20%
30%
40%
50%
60%
70%
80%
90%
100%
Deputy President Member of Parliament Local Councilor
% Correct Name

Knowledge of MP Identity
0%
10%
20%
30%
40%
50%
60%
70%
80%
90%
100%
MP

Knowledge
• The vast majority of South Africans are – able to offer a definite view on parliamentary performance
(though at significantly lower levels than other Africans)
– Able to state their expectations about what they want from MPs
• They are far less likely than other Africans to know who their MP is supposed to be
• They have far less awareness of MPs than other elected incumbents

Public Contact With MPs
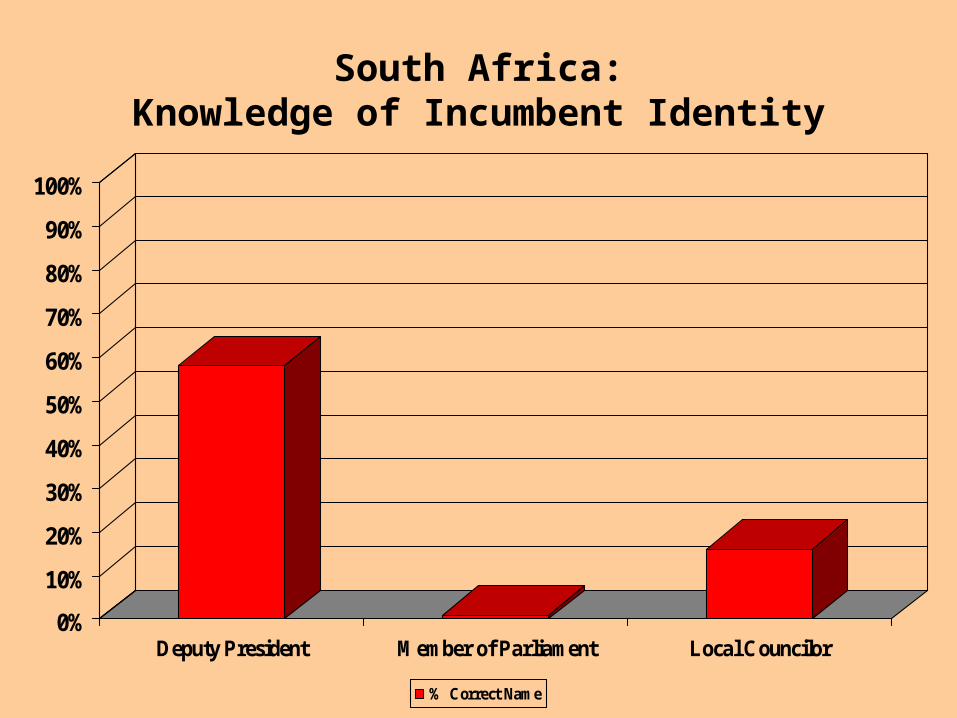
Public Contact With Officials
0%
10%
20%
30%
40%
50%
60%
70%
80%
90%
100%
ReligiousLeader
LocalCouncilor
TraditionalLeader
PartyOfficial
Member ofParliament
Government/ MinistryOfficial
Contacted In Past Year

Public Contact With Members of Parliament
0%10%20%30%40%50%60%70%80%90%
100%
Contact W/ MP

Public Contact With Members of Parliament
0%
5%
10%
15%
20%
Contact W/ MP

South Africa: Public Contact With Leaders Over Time
3127
16 1713 11
1410 94 6 64 6
2323
12
50
10
20
30
40
50
60
2002 2004 2006
Religious Leaders Local Councillors Party Officials
Traditional Leaders National Government Officials MP's

Contact
• Public contact with MPs is as much as three times lower than many other, poorer African countries
• There is no sign that it is increasing (in contrast to contact with local councilors)

South Africans’ Role Expectations ofMPs and Parliaments

Most Important Responsibilities of an MP? (Round 2)
“In your opinion, what are the most important responsibilities of a Member of Parliament?”
0102030405060708090
100
Percent

Most Important Responsibilities of an MP(Round 2 - South Africa)
0102030405060708090
100
Percent

Constituency Service
0%10%20%30%40%50%60%70%80%90%
100%
% 1 of 3 Answers
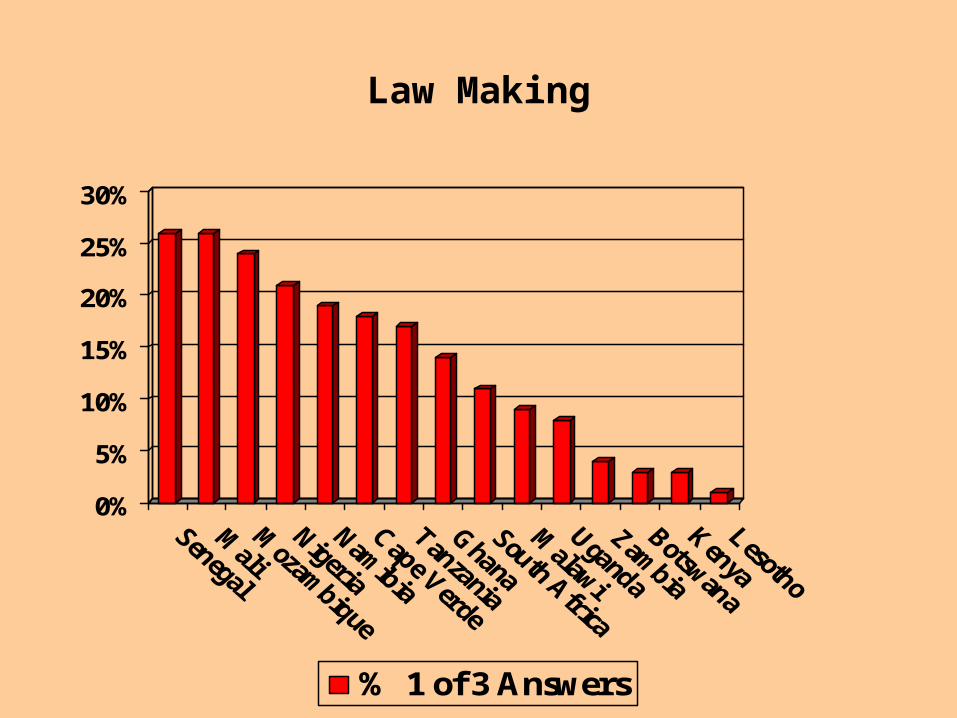
Law Making
0%
5%
10%
15%
20%
25%
30%
% 1 of 3 Answers

Elected Leaders Should Listen to Voters
0%10%20%30%40%50%60%70%80%90%
100%
Agree very strongly Agree

Desired Level of Constituency Service
0%10%20%30%40%50%60%70%80%90%
100%
All of the time At least weekly At least once a month

Responsibility for Holding Elected Leaders Accountable
0
10
20
30
40
50
President Parliament /Local Council
PoliticalParty
Voters Don’t Know
MP's Local Councilors
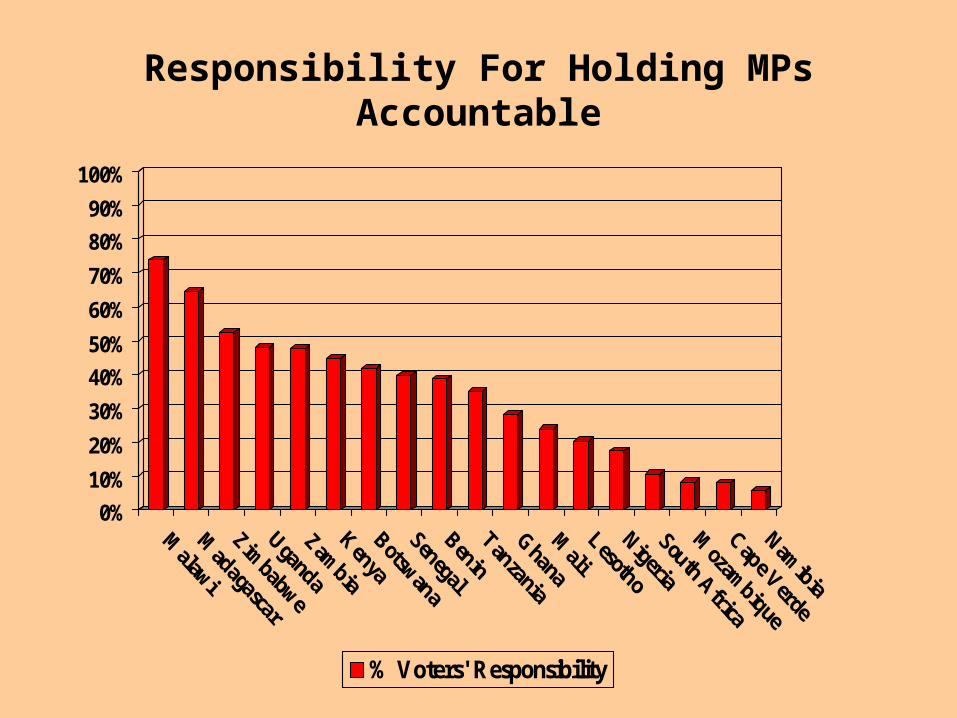
Responsibility For Holding MPs Accountable
0%
10%
20%
30%
40%
50%
60%
70%
80%
90%
100%
% Voters' Responsibility

Role Expecations
• South Africans see the major role of the MP as:– representing specific constituencies (areas, or types of
people)
– Representing people’s opinions in the political process
• They want their MP to listen to their opinions and regularly visit their identified “constituency”, though far less regularly than other Africans
• They are far less likely than other Africans to see themselves as responsible for holding MPs accountable

South Africans’ Evaluations of Parliament and MPs
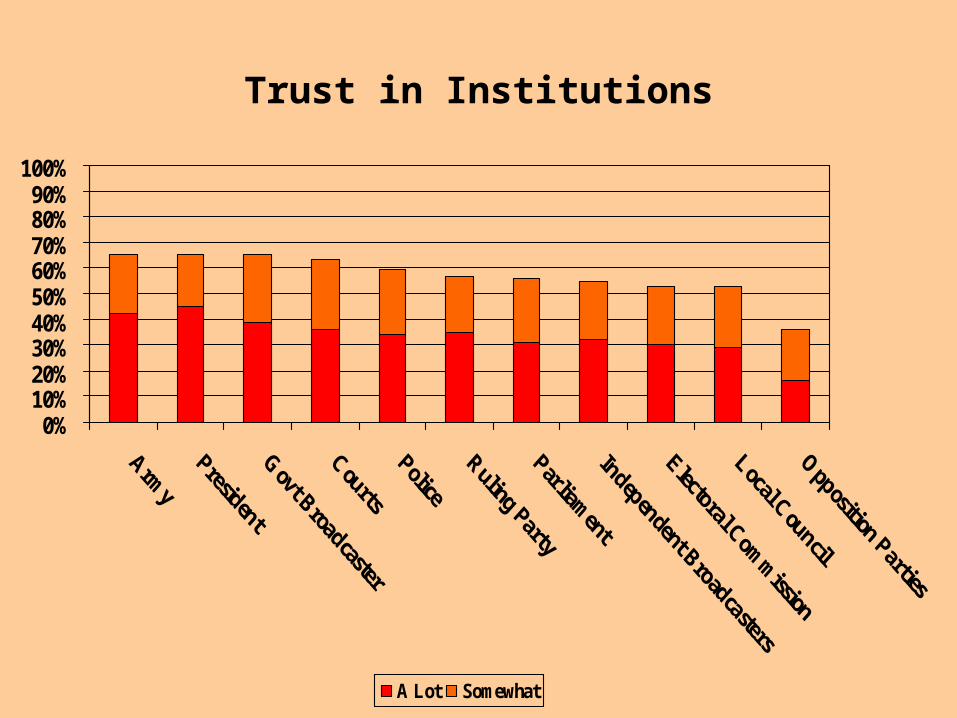
Trust in Institutions
0%10%20%30%40%50%60%70%80%90%
100%
A Lot Somewhat

South Africa:Trust In Political Institutions Over Time
61
73
4137
6770
5350
70
30 31
52 54
3237
49
28 28
52 52
31
39
2320
43 42
33
60 62
12
2629
0
10
20
30
4050
60
70
80
90
100
1995 1997 1998 2000 2002 2004 2006
President Parliament Provincial Governemt
Local Council Ruling Party Opposition Parties

Trust: President Vs. Legislature
0102030405060708090
100
President Parliament

Perceptions of Corruption
0%10%20%30%40%50%60%70%80%90%
100%
All of Them Most of Them
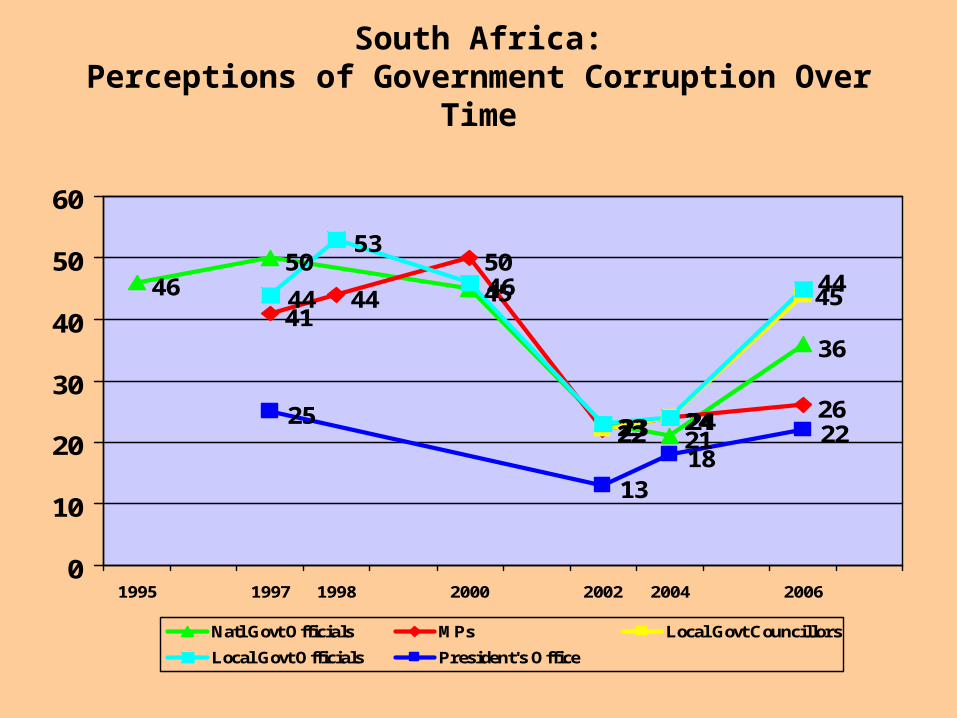
South Africa:Perceptions of Government Corruption Over Time
4650
45
23 21
3641
44
50
22 24 2622 24
44
53
46
23 2425
1318
22
4445
0
10
20
30
40
50
60
1995 1997 1998 2000 2002 2004 2006
Natl Govt Officials MPs Local Govt Councillors
Local Govt Officials President's Office

Perceptions of Corruption: President Vs. Legislature
0%
10%
20%
30%
40%
50%
60%
70%
80%
90%
100%
Office of President MPs

Job Approval of Elected Leaders
0%
10%
20%
30%
40%
50%
60%
70%
80%
90%
100%
President MP Local Councilor
Strongly Approve Approve

South Africa: Job Approval of Elected Leaders Over Time
76
64
79
50 51
7377
5346
64
45 45
6057
49
3943
6760
30
44
31 33
51
38
0
10
20
30
40
50
60
70
80
90
100
1995 1997 1998 2000 2002 2004 2006
President Parliament Provincial Premier Local Govt Council

Job Approval: President Vs. Legislature
0%
10%
20%
30%
40%
50%
60%
70%
80%
90%
100%
President MP

Perceived Ability to Make Representatives Listen (Round 2)
0%10%20%30%40%50%60%70%80%90%
100%
Strongly Agree Agree
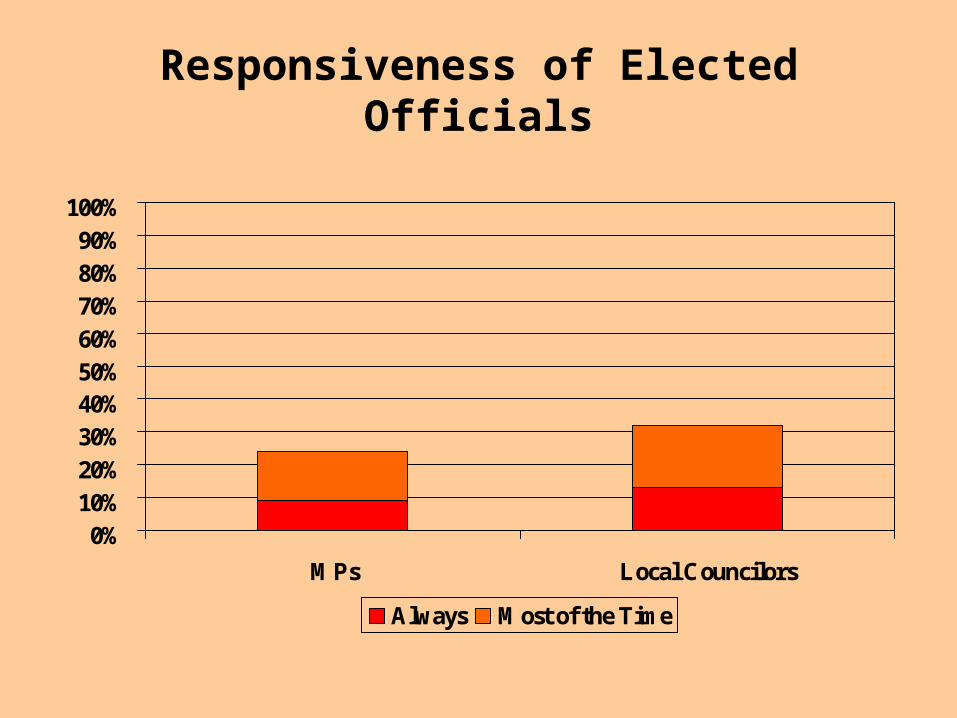
Responsiveness of Elected Officials
0%10%20%30%40%50%60%70%80%90%
100%
MPs Local Councilors
Always Most of the Time
South Africa:Government Responsiveness Over Time
62
72
46
59
41
52
3745
31
18
45
39
35232220
0
10
20
30
40
50
60
70
80
90
100
1997 1998 2000 2002 2004 2006
President Parliament Provincial Government
Local Government Council Members of Parliament Local Councilors

Responsiveness of MPs
0%
10%
20%
30%
40%
50%
60%
70%
80%
90%
100%
Often Always

Desired Level of Constituency Service
0%10%20%30%40%50%60%70%80%90%
100%
All of the time At least weekly At least once a month
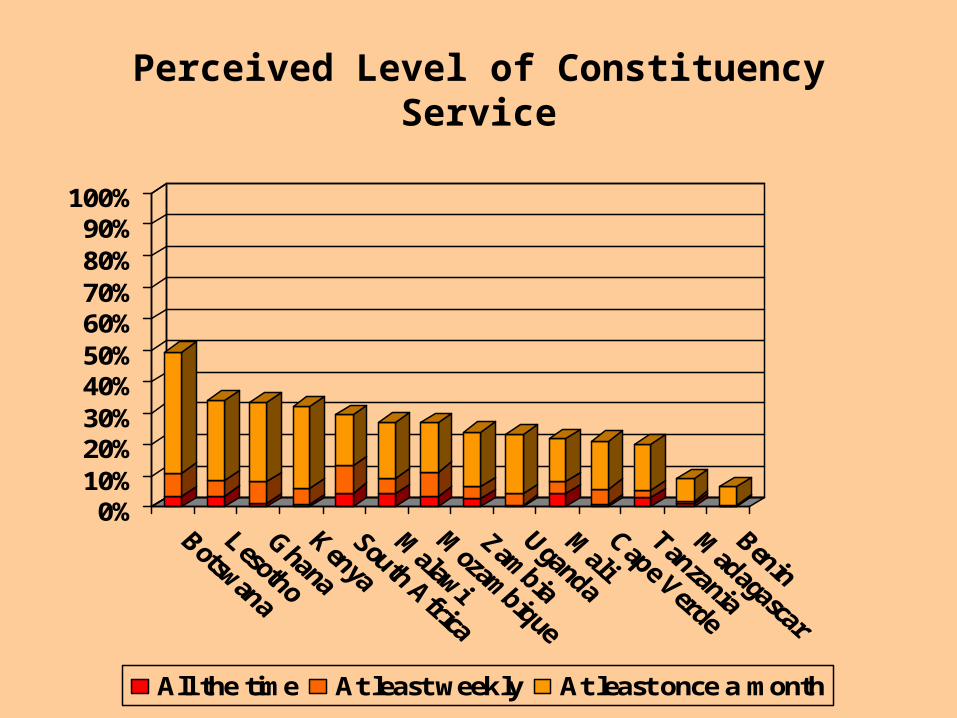
Perceived Level of Constituency Service
0%10%20%30%40%50%60%70%80%90%
100%
All the time At least weekly At least once a month

Constituency Service Deficit
-2
-1.5
-1
-0.5
0
0.5
1
1.5
2
Mean

Performance
• Public trust in Parliament has been increasing, but it has been increasing for all institutions.
• Parliament consistently lags behind the President in terms of public trust and job approval
• MPs seem to have shed a significant degree of public perceptions of their involvement in corruption
• People generally see MPs as uninterested in their opinions, distant, and do not feel they could make MPs listen to them
• There is a “representation gap” between what citizens want and what they say they are getting

What Explains These Attitudes?
• Individual Characteristics• Individual Values• Individual Evaluations• National History
– Colonial legacies– Post colonial legacies
• Political Institutions – Type of Executive (e.g. Presidential vs. Parliamentary) – Powers and Capacity of Legislature– Electoral Systems
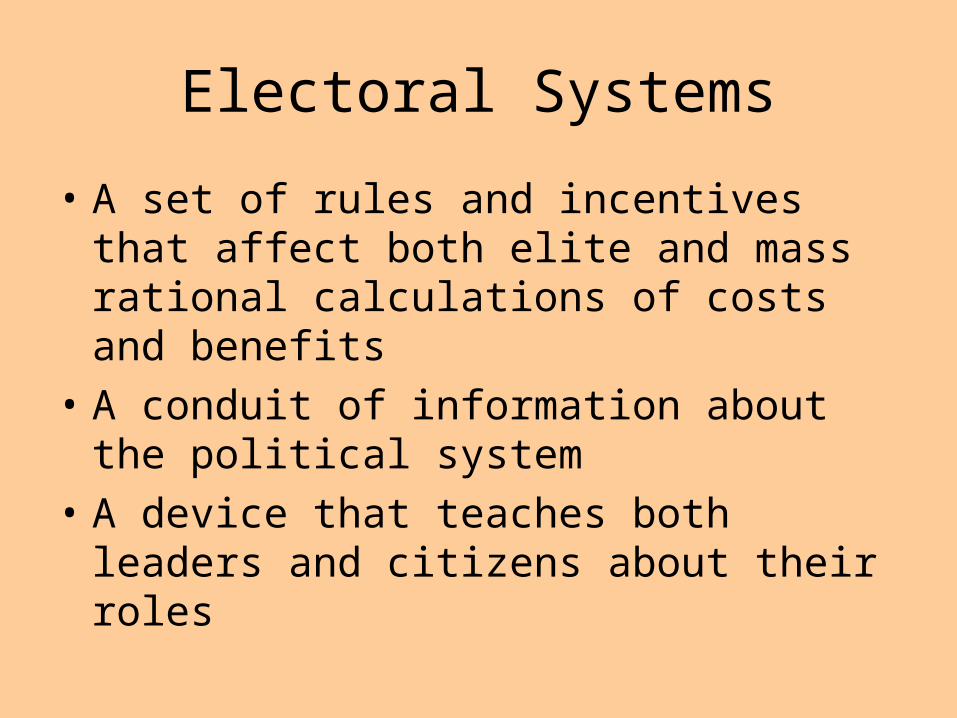
Electoral Systems
• A set of rules and incentives that affect both elite and mass rational calculations of costs and benefits
• A conduit of information about the political system
• A device that teaches both leaders and citizens about their roles

Electoral Systems From the Standpoint of the Voter
• Single Member Plurality Constituencies– Botswana, Ghana, Kenya, Malawi, Nigeria, Tanzania,
Uganda, Zambia, Zimbabwe• Mixed / Hybrid Systems
– Benin (MMD PR)– Lesotho (Mixed Member: SMDs + Top Up PR List)– Madagascar (Parallel: SMDs & MMD PR)– Mali (MMDs, Two Round Majority Run Off)– Senegal (Parallel: SMD + MMD Plurality + Top Up PR
List)• National / Regional List Proportional Representation
– Cabo Verde, Mozambique, Namibia, South Africa

Key Finding
• Citizens in African countries that use large (national / regional) list proportional representation are consistently different from others.– Less active citizens
– Less knowledgeable citizens
– Less citizen agency
– More alienated citizens / higher protest
• Both SMD and Mixed systems have various strengths and advantages over List PR in terms of democratic citizenship

Electoral System As A Conduit of Information

Know Identity of MP(by Electoral System)
0%
10%
20%
30%
40%
50%
60%
70%
80%
90%
100%
MP

Electoral System and Elements of Political Information (Measures of Association)
Eta
• Identity of MP .339 (SMD)
• Identity of Councilor .297 (Mixed)
• Identity of Deputy President .290 (SMD)
• Which party has most seats .189 (SMD)
• Number of terms President can service .098 (SMD)
• Who can declare laws unconstitutional .112 (PR)

Political Knowledge(Correct Answers Provided To Questions on Incumbent Identity and Key Political Facts)
02
46
81012
1416
1820
0 1 2 3 4 5 6
Percent

Citizen Awareness of Incumbent Identityand Key Political Facts
(Eta = .223)
0
1
2
3
4
5
6
Mean Number of Correct Answers
Electoral SystemAs A Source of Cost-Benefit
Calculus

Public Contact With MPs in Past Year(Eta = .060)
0%5%
10%15%20%25%30%35%40%45%50%
MPs
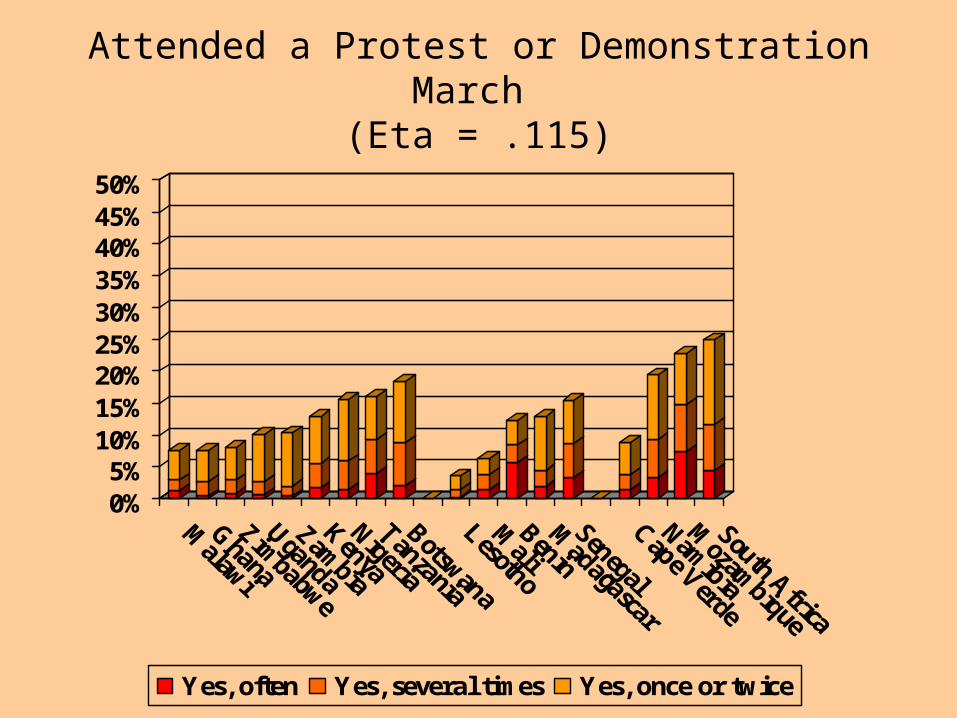
Attended a Protest or Demonstration March (Eta = .115)
0%5%
10%15%20%25%30%35%40%45%50%
Yes, often Yes, several times Yes, once or twice

Electoral System As A Source of Political Values

Elected Leaders Should Listen to Voters(Eta = .187)
0%10%20%30%40%50%60%70%80%90%
100%
Agree very strongly Agree
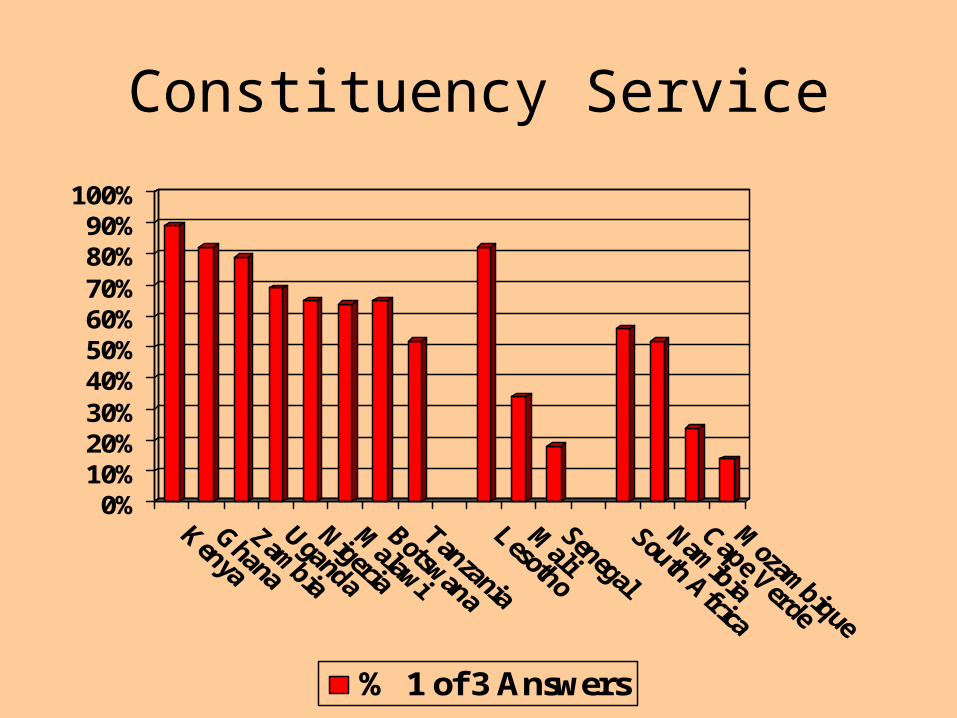
Constituency Service
0%10%20%30%40%50%60%70%80%90%
100%
% 1 of 3 Answers
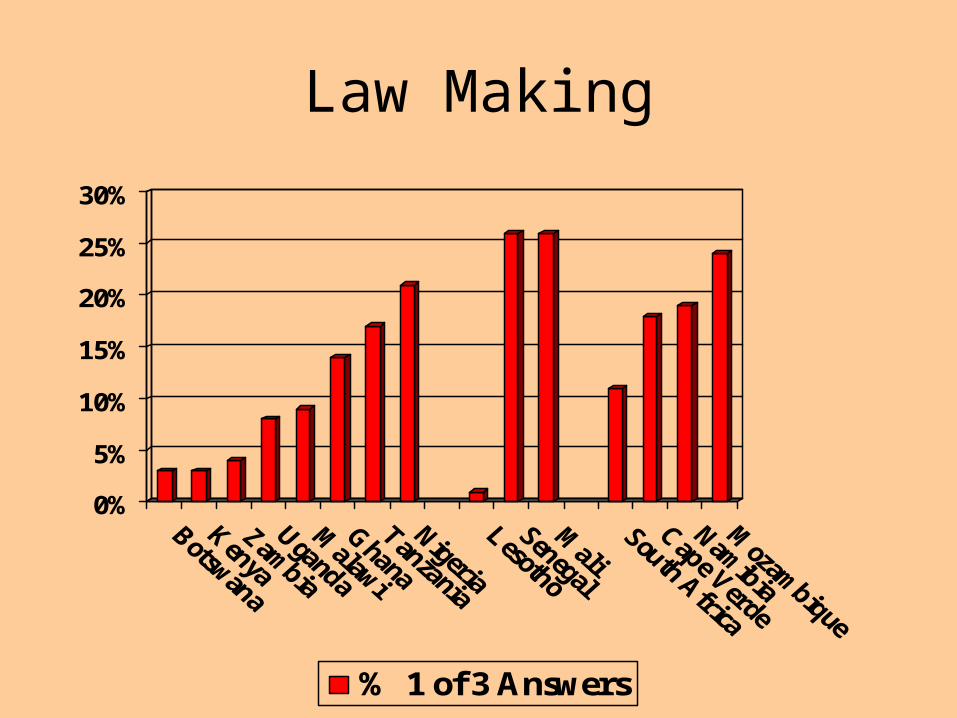
Law Making
0%
5%
10%
15%
20%
25%
30%
% 1 of 3 Answers

How Much Time Should MP Spend In Constituency? (Eta = .133)
0%
10%
20%
30%
40%
50%
60%
70%
80%
90%
100%
Malawi
Botswana
Zambia
Kenya
Zimbabwe
Uganda
Ghana
Tanzania
Nigeria
Lesotho
Mali
Senegal
Madagascar
BeninNam
ibia
Cape Verde
Mozam
bique
South Africa
All of the Time At least weekly At least once a month
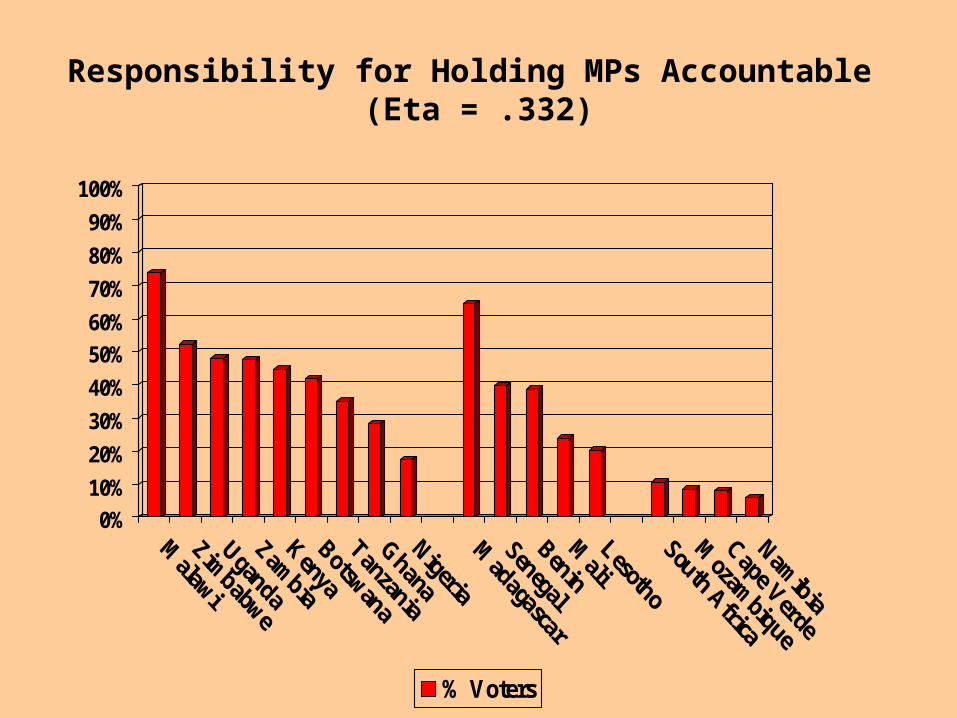
Responsibility for Holding MPs Accountable (Eta = .332)
0%
10%
20%
30%
40%
50%
60%
70%
80%
90%
100%
% Voters
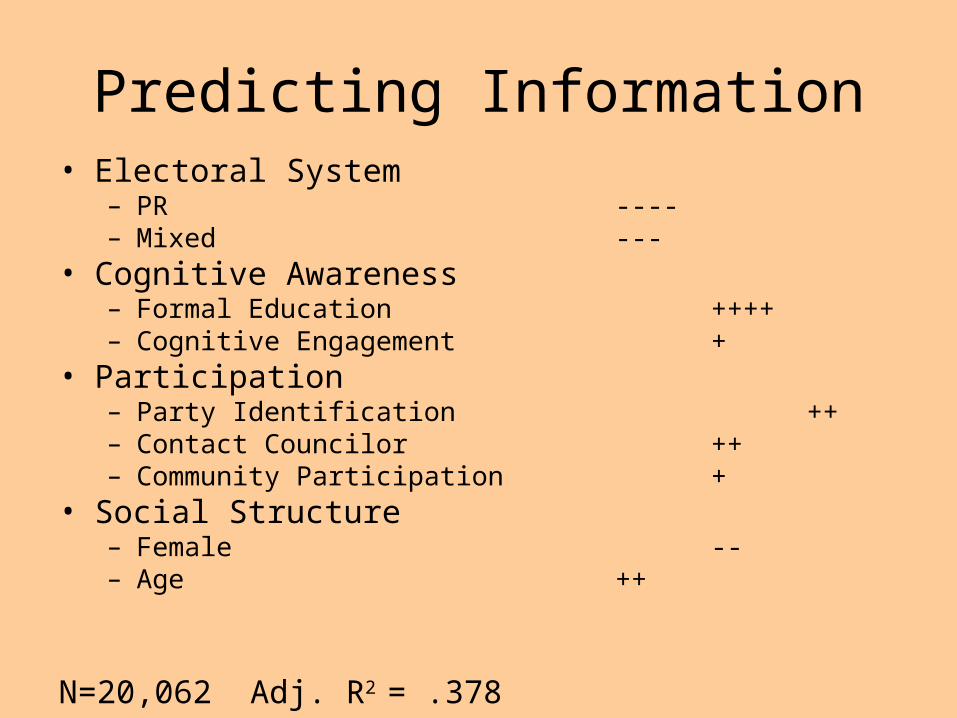
Predicting Information• Electoral System
– PR ----– Mixed ---
• Cognitive Awareness– Formal Education ++++– Cognitive Engagement +
• Participation– Party Identification ++– Contact Councilor ++– Community Participation +
• Social Structure– Female --– Age ++
N=20,062 Adj. R2 = .378

Predicting Demand for Democracy• Electoral System
– PR --– Mixed ++
• Cognitive Awareness– Political Information ++– News Media Use ++– Formal Education +– Cognitive Engagement +
• Values– Hold Bureaucrats Accountable ++– Demand Rule of Law ++– Demand Freedom of Speech ++– Support Equality +
• Performance Evaluations– People Less Free to Speak Mind _
• Social Structure– Female -
N=20,315 Adj. R2 = .244

Predicting Protest
• Electoral System– PR ++
• Cognitive Awareness– Cognitive Engagement +– News Media Use +
• Participation– Community Participation +++– Contact Govt Official +
• Performance Evaluations– Victimization +
• Social Structure– Age -
N= 20,054 Adj. R2 = .107
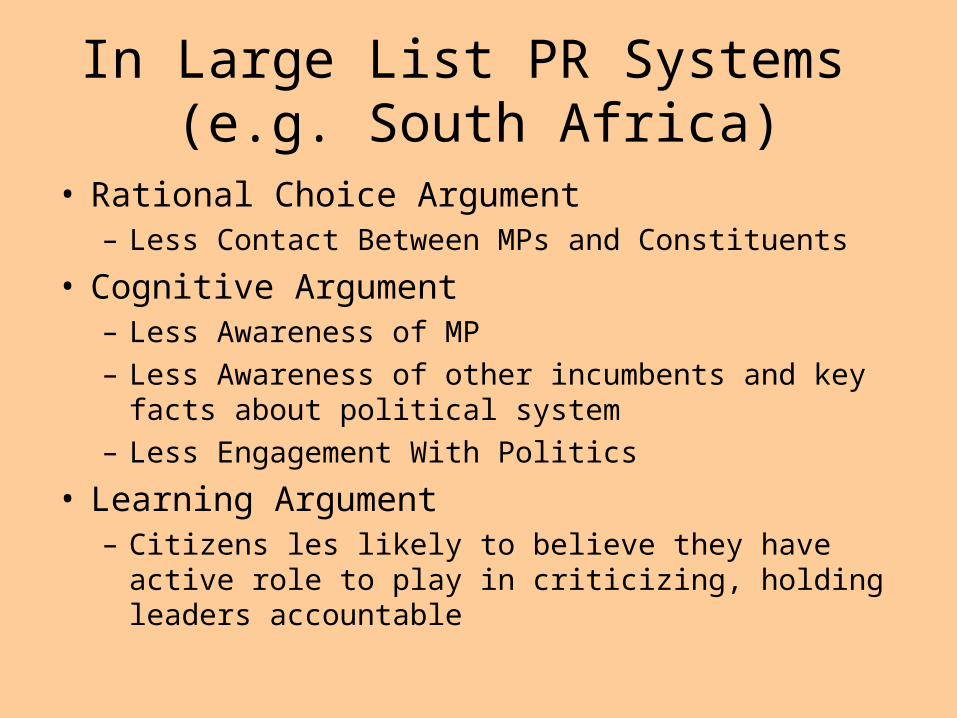
In Large List PR Systems (e.g. South Africa)
• Rational Choice Argument– Less Contact Between MPs and Constituents
• Cognitive Argument– Less Awareness of MP
– Less Awareness of other incumbents and key facts about political system
– Less Engagement With Politics
• Learning Argument– Citizens les likely to believe they have active role to play in
criticizing, holding leaders accountable

In Sum
• Large (national / regional) List PR brings these three effects together with disastrous effects. – It reduces incentives for people to remain mentally
engaged with democratic politics– It takes away the means for them to do so if they wanted to– It re-orients them toward a less active role as citizens
• And most importantly for the topic at hand, has an extremely negative impact on citizens’ relationship with their elected representatives and with the institution of Parliament

New Studies and Data
• Afrobarometer Round 4 – 18-20 Countries, 2008
• African Legislatures Project– 18-20 Countries, 2008-2009

African Legislatures Project
• Based at DARU University of Cape Town
• Purpose– Describe legislative performance in broad areas of
• Law Making
• Oversight
• Representation
– Attempt to explain performance in terms of constitutional powers, legislative rules, legislative capacity, MP values, public support
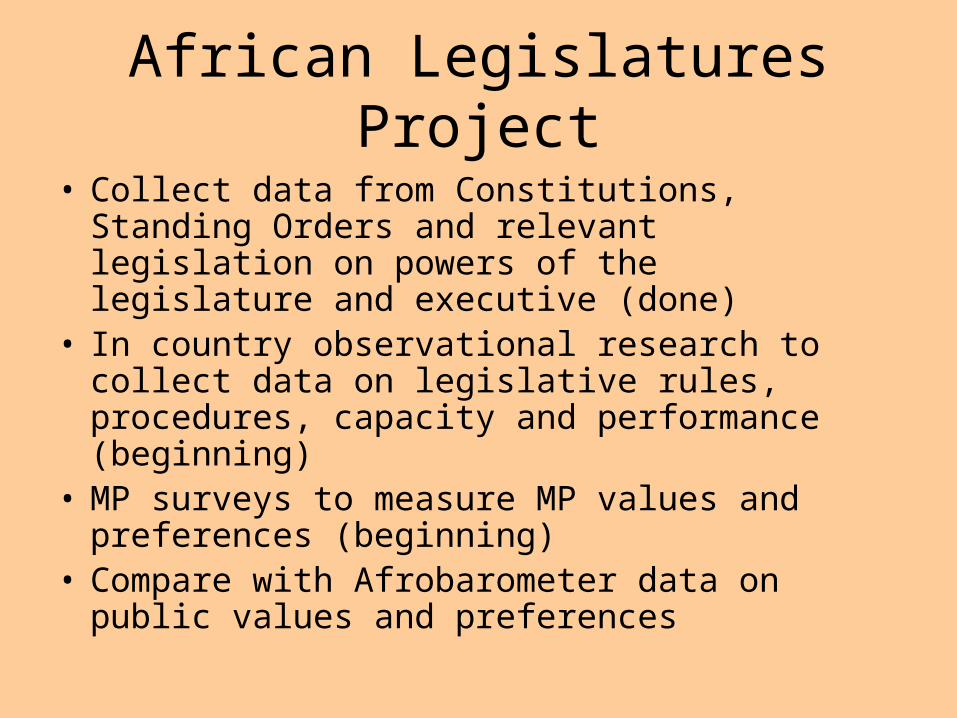
African Legislatures Project
• Collect data from Constitutions, Standing Orders and relevant legislation on powers of the legislature and executive (done)
• In country observational research to collect data on legislative rules, procedures, capacity and performance (beginning)
• MP surveys to measure MP values and preferences (beginning)
• Compare with Afrobarometer data on public values and preferences