South African Wine Industry Information and Systems (SAWIS) · South African Wine Industry...
62
1 South African Wine Industry Information and Systems (SAWIS) Macro-economic Impact of the Wine Industry on the South African Economy (also with reference to the Impacts on the Western Cape) Final Report 09 December 2009 C C o o n n n n i i n n g g a a r r t t h h E E c c o o n n o o m m i i s s t t s s P P O O B B o o x x 7 7 5 5 8 8 1 1 8 8 , , L L y y n n n n w w o o o o d d R R i i d d g g e e 0 0 0 0 4 4 0 0 , , P P r r e e t t o o r r i i a a , , S S o o u u t t h h A A f f r r i i c c a a T T e e l l : : + + 2 2 7 7 ( ( 0 0 ) ) 1 1 2 2 3 3 4 4 9 9 1 1 9 9 1 1 5 5 F F a a x x : : + + 2 2 7 7 ( ( 0 0 ) ) 1 1 2 2 3 3 4 4 9 9 1 1 0 0 1 1 5 5 E E - - m m a a i i l l : : c c o o n n g g a a r r t t h h @ @ g g l l o o b b a a l l . . c c o o . . z z a a
Transcript of South African Wine Industry Information and Systems (SAWIS) · South African Wine Industry...
1
South African Wine Industry Information and Systems (SAWIS)
Macro-economic Impact of the Wine Industry on the South African Economy (also with reference to the Impacts on the Western Cape)
Final Report 09 December 2009
CCoonnnniinnggaarrtthh EEccoonnoommiissttss PPOO BBooxx 7755881188,, LLyynnnnwwoooodd RRiiddggee 00004400,, PPrreettoorriiaa,, SSoouutthh AAffrriiccaa TTeell:: ++2277 ((00))1122 334499 11991155 FFaaxx:: ++2277 ((00))1122 334499 11001155 EE--mmaaiill:: ccoonnggaarrtthh@@gglloobbaall..ccoo..zzaa

2
Table of Contents
EXECUTIVE SUMMARY ................................................................................................. 7 PART I ................................................................................................................................ 11 1 INTRODUCTION AND BACKGROUND ............................................................. 11 2 IMPORTANT DEVELOPMENTS IN THE WINE INDUSTRY BETWEEN 2003 AND 2008 .................................................................................................................. 12
2.1 General Observations ............................................................................................ 12
2.2 Pressure on Profitability in the Wine Industry ...................................................... 13
2.3 Market Conditions 2008/09 .................................................................................. 13
3 OVERALL ECONOMIC STATUS OF THE WINE INDUSTRY IN 2008 ........ 15 4 TOURISM IN 2008 .................................................................................................... 18 5 INSTITUTIONAL ASPECTS .................................................................................. 20 6 APPENDIX A ............................................................................................................. 21
6.1 Estimating Total Turnover, Manufacturing, Production, Trade and Transport and Tax Components for 2008 pertaining to the Wine Industry ............................................ 21
PART II .............................................................................................................................. 23 7 INTRODUCTION ..................................................................................................... 23 8 SCOPE OF MACRO-ECONOMIC IMPACT ASSESSMENT ............................ 24 9 METHODOLOGY .................................................................................................... 25
9.1 Overall Macro-economic Modelling..................................................................... 25
9.2 Technical Content of the Model ........................................................................... 26
10 PRIMARY DATA AND DATA SOURCES ............................................................ 27 11 MACRO-ECONOMIC IMPACT RESULTS ......................................................... 28
11.1 Total Economic Impacts on South African and the Western Cape Economies 28
11.1.1 Impact on Gross Domestic Product (GDP) ................................................... 29
11.1.2 Impact on Capital Utilization ........................................................................ 30
11.1.3 Impact on Employment Creation ................................................................... 30
11.1.4 Comparison between Impacts on the Western Cape and Rest of South Africa 30
11.1.5 Comparison of Impact between Provinces .................................................... 31
12 COMPONENTS OF THE DIFFERENT STAGES OF BENEFICIATION OF THE WINE INDUSTRY IN SOUTH AFRICA .............................................................. 32 13 BACKWARD LINKAGES OF THE WINE INDUSTRY IN SOUTH AFRICA BASED ON THE KIND IMPACT ................................................................................... 33 14 SECTORAL IMPACT OF THE WINE INDUSTRY IN SOUTH AFRICA ....... 34 15 EMPLOYMENT IMPACT PER SKILL CATEGORY OF THE WINE INDUSTRY IN SOUTH AFRICA ................................................................................... 37 16 CAPITAL INVESTMENT IN SOUTH AFRICA SUPPORTING ALL THE LEVELS OF THE WINE INDUSTRY (VALUE - AND SUPPLY CHAIN) ............... 37 17 POVERTY ALLEVIATION PER PHASE OF BENEFICIATION OF THE WINE INDUSTRY IN SOUTH AFRICA ....................................................................... 38 18 THE WINE INDUSTRY’S BALANCE OF PAYMENTS IMPACTS FOR THE NATIONAL ECONOMY ................................................................................................. 38 19 EFFICIENCY LEVELS OF THE WINE INDUSTRY ......................................... 39

3
20 CONCLUSION .......................................................................................................... 40 20.1 Overall Developments ....................................................................................... 40
20.2 Impact Results ................................................................................................... 40
APPENDICES TO PART II ............................................................................................. 42 21 APPENDIX A: SOCIAL ACCOUNTING MATRIX ........................................... 42
21.1 The Social Accounting Matrix .......................................................................... 42
21.2 Application of the SAM .................................................................................... 43
22 APPENDIX B: MAGNITUDE OF LINKAGES ................................................... 45 23 APPENDIX C: DEFINITIONS OF MACRO-ECONOMIC AGGREGATES .. 46 24 APPENDIX D: DETAILED MACRO-ECONOMIC IMPACT OF WINE INDUSTRY ........................................................................................................................ 48 25 APPENDIX E: DETAILED SECTORAL IMPACT ............................................ 54 26 APPENDIX F: EXOGENOUS VECTOR FOR PRIMARY AGRICULTURE IN STELLENBOSCH ............................................................................................................. 56 27 APPENDIX G: PRIMARY DATA ......................................................................... 58 28 BIBLIOGRAPHY ...................................................................................................... 61 29 LIST OF INFORMATION SOURCES ................................................................... 62

4
List of Charts and Tables
Chart 1: Value Chain of Wine Dependent GDP in South Africa ....................................... 32 Chart 2: Value Chain of Wine Dependent Employment in South Africa .......................... 33 Chart 3: Wine Industry’s Direct, Indirect and Induced GDP Impact ................................. 34 Chart 4: Employment Creation by Skill Category, 2008 ................................................... 37 Diagram 1: Wine Industry Illustrated by means of the Cost Build-Up of a Production Unit (Bottle of Wine) ................................................................................................................... 23 Table 1: Index of Average Price per Ton to Producers (2000 = 100) ................................ 12 Table 2: Index of Average Price per Ton Paid to Producers (2000 = 100) ........................ 12 Table 3: 10 Year Movement in the R/US$ and R/Pound Sterling Exchange Rates ........... 13 Table 4: Exchange Rates of the Rand ................................................................................. 14 Table 5: Economic Structure and the Flow of Goods and Services in the Wine Industry (Rand millions; 2008 prices)1 .............................................................................................. 16 Table 6: Growth Rates: 2003 – 2008; Main Economic Components of the Wine Industry (2008 Prices) ........................................................................................................................ 17 Table 7: Activities of Foreign Tourists............................................................................... 19 Table 8: Wine Industry Structure in 2008 .......................................................................... 20 Table 9: Comparison of Wine Production Value between 2003 and 2008 ........................ 21 Table 10: Geographic Distribution of Wine Grape Vineyards and Wine Tonnage per Wine Region during 2008 ............................................................................................................. 28 Table 11: Total Macro-economic Impact of the Wine Industry on South Africa [Rand millions; 2008 prices] .......................................................................................................... 28 Table 12: Total Macro-economic Impact of the Wine Industry on the Western Cape [Rand millions; 2008 prices] .......................................................................................................... 29 Table 13: Impact of Different Phases of the Wine Producing and Selling Chain Inside the Western Cape and Outside the Region (GDP) .................................................................... 30 Table 14: Impact of Different Phases of the Wine Producing and Selling Chain Inside the Western Cape and Outside the Region (Labour) ................................................................. 31 Table 15: Provincial Impacts .............................................................................................. 31 Table 16: GDP: Sectoral Impact on South Africa [Rand millions; 2008 prices] .............. 36 Table 17: Capital Impact on South Africa [Rand millions; 2008 prices] ........................... 38 Table 18: Poverty Alleviation per Component in South Africa [Rand millions; 2008 prices] .................................................................................................................................. 38 Table 19: Impact on the Balance of Payments of the National Economy [Rand millions; 2008 prices] ......................................................................................................................... 39 Table 20: Impact on the Balance of Payments of the Western Cape Economy [Rand millions; 2008 prices] .......................................................................................................... 39 Table 21: Efficiency of the Impact of the Wine Industry on the National Economy in terms of Capital Utilization and Poverty Alleviation .................................................................... 40 Table 22: GDP Generated in the Western Cape through Forward and Backward Linkages of the Wine Industry of the Western Cape [Rand millions; 2008 prices] ........................... 48 Table 23: GDP Generated in South Africa through Forward and Backward Linkages of the Wine Industry of the Western Cape [Rand millions; 2008 prices]...................................... 49 Table 24: Capital Needed in the Western Cape to Support Forward and Backward Linkages of the Wine Industry of the Western Cape [Rand millions; 2008 prices] ............ 50 Table 25: Capital needed in South Africa to support forward and backward linkages of the wine industry of the Western Cape [Rand millions; 2008 prices] ....................................... 51

5
Table 26: Labour Needed in the Western Cape to Support Forward and Backward Linkages of the Wine Industry of the Western Cape [Rand millions; 2008 prices] ............ 52 Table 27: Labour Needed in South Africa to Support Forward and Backward Linkages of the Wine Industry of the Western Cape [Rand millions; 2008 prices] ................................ 53 Table 28: Sectoral Impact of GDP on detailed sectors [Rand millions; 2008 prices] ........ 54 Table 29: Exogenous Vector for Primary Agriculture in Stellenbosch .............................. 56 Table 30: Farming Production Cost for Wine Grapes for each of the Wine Regions for 2008 (Cost Items as Rand per Hectare) ............................................................................... 58 Table 31: Expenses Attributable to Bulk and Packaged Wine for 2008 (Cost per Rand per Ton) ..................................................................................................................................... 59 Table 32: Producer Income per Wine District for 2008 ..................................................... 60
6
List of Abbreviations
SAWIS: South African Wine Industry Information and Systems PWC: Price Waterhouse Coopers SAM: Social Accounting Matrix GDP: Gross Domestic Product StatsSA: Statistics South Africa DBSA: Development Bank of South Africa DPLG: Department of Provincial and Local Government GOS: Gross Operating Surplus SARB: South African Reserve Bank

7
EXECUTIVE SUMMARY
PART I: A GENERAL DESCRIPTION OF THE WINE INDUSTRY
In Part I of this study reference is made to developments in the wine industry over the past five years or so, whilst the magnitude of the industry in economic terms is given for the calendar year of 2008.
RECENT DEVELOPMENTS
For the most part of the first decade of the second millennium, the wine industry in South Africa experienced a significant swing towards red wine production - moving from 18% of planting in 1996 to 44% in 2008. This gave rise to a surplus production position putting downward pressure on producers’ prices. Given that the local demand for wine, red wine in particular, did not match the increased supply, the local industry was forced to enter the export market in a much more aggressive way than ever before. No wonder then that export, as percentage of local production increased from 21% in 1999 to 54% in 2008. Despite fluctuations in the Rand exchange rates over this period, the general trend was downwards, helping to maintain export profitability. The inflationary conditions coupled with pressure on disposable income have resulted in consumers trading down. This obviously became much more price conscious. The South African wine consumer in general is regarded as more price conscious and less likely to venture into the higher priced products. In 2008 the demand for white wine has weakened whilst red wine sales showed a moderate increase. However, as far as red wine is concerned, the supply/demand position has since moved into equilibrium.
OVERALL ECONOMIC STATUS OF THE WINE INDUSTRY IN 2008
The total turnover of the wine alcohol industry in 2008 amounted to R19 164 million. Of this amount R6 272 million was exported directly. Imports amounted to R237 million or about 2% of domestic sales. In actual fact, primary agriculture output valued at R3 320 million was beneficiated and added in value downstream to the value of R19 164 million, i.e. about 5 times the initial value of the raw materials. Another R4 263 million was generated indirectly through wine tourism. Compared with the 2003 study, it is evident that the wine industry as a whole did somewhat better over the 2003 – 2008 period. Total turnover grew by 79%. This growth can be attributed mainly to the excellent export performance (close to doubling in current rand value terms since 2003). The growth in value of domestic sales in nominal terms, over the period 2003 – 2008 amounted to 76%. These figures also indicate the much slower growth in primary producers’ income but an escalating tax haul by government. The industry has been under ever increasing inflationary pressures on the production side that ultimately had to be given through to the consumers. However, the primary producers were in a more disadvantaged position to recoup all these cost rises.

8
TOURISM
As in the previous studies, the researchers again made an attempt to establish the extent “wine tourism” features in the wine industry’s contribution to the economy. Information in this regard is rather scant, but it was possible to make use of indirect methods to establish a useable figure. The Western Cape is, as could be expected, a very popular holiday and tourist destination (15% of all local tourists and 17% of all foreign tourists in 2008). These tourists spend their time on a variety of activities, ranging from visiting wildlife; cultural, historical and heritage sites, natural attractions; shopping, etc. Assuming these tourists just spend one day of their holiday visiting the wine lands, an amount of about R1 billion in spending can be indirectly linked to this tourist attraction. However, much more research is needed to arrive at more valid figures in this regard. Lastly, in the tourism field, a brief look was given at the expected impact that the 2010 Soccer World Cup might have on “wine tourism”. Again, relevant data is scarce, if not unavailable. A special study by the Government revealed that about 500 000 visitors will enter the country during the 5 weeks. Cape Town will entertain 7 matches, roughly 70 000 people will be involved with each match, of which 50 000 will be local people. So, the extent to which they might end up in the wine lands needs further research.
PART II: MACROECONOMIC IMPACT ASSESSMENT OF THE WINE INDUSTRY
This part of the study comprised the use of macro-econometric models to calculate the total impact of the wine industry on the South African economy and the Western Cape.
IMPACT ON GDP (INCLUDING REGIONAL PERSPECTIVE)
The wine industry contributes R26 223 million to the annual GDP of South Africa. What is also important to note is the measure of value added that takes place with every step of beneficiation. Starting at farm level, the initial value of the raw material in terms of income created, amount to R3 373 million and ultimately leads to a total GDP value of R21 743 million (excluding tourism). This illustrates the exceptional ability of the industry as a creator of economic growth. However, the question is whether the wine industry contributes a fair and reasonable share to GDP per unit of capital invested compared to other industries. The study showed that its GDP/Capital ratio of 0.53 is higher than the national average of 0.46. Even though this is not a measure of the profitability of the industry, it does signify that its capital “productivity” is in line with the average for the national economy. Of the R26 223 million GDP created in South Africa by the wine industry, about R14 214 million remained in the Western Cape (approximately 54%).
IMPACT ON EMPLOYMENT
The wine industry supports employment opportunities to the tune of 275 606. Of this number 58% are unskilled, 29% semi-skilled and 13% skilled. According to the

9
labour/capital ratio (5.54) it is obvious that capital is applied much more effectively regarding employment creation as the ratio is higher than that of the national economy (3.18). The relative labour intensiveness of the wine industry is specifically the result of the intensive labour production methods which are followed in the primary agriculture. In the Western Cape, the wine industry in total is responsible for 8.8% of total employment (168 102), compared to 2.2% for the country as a whole.
CAPITAL UTILIZATION
A total capital stock of R49 768 million (2008 prices) is required nationally in the wine industry and supporting industries to sustain the present level of GDP of R26 223 million in 2008. The wine industry is probably more capital intensive than is generally believed. Although the primary agriculture portion of the wine industry is relatively labour intensive, the other portions of the industry i.e. cellars and manufacturing are more capital intensive. Thus both are the labour and capital front, the wine industry seems to be more efficient in the utilization of these productive factors.
INCOME DISTRIBUTION
Household income worth R17 124 million was generated by the wine industry in 2008, of which R2 908 million is destined for the lower income groups of which a large portion is spent in the Western Cape region. Coupled with the annual expenditure by farmers on production inputs, one can understand why the wine industry forms the backbone of the economy of many districts in the Western Cape. 17% of household income is generated by the wine industry which is only slightly above the average of 16% for the economy as a whole.
CONCLUSION
The South African wine industry has again gone through a tough period of major changes over the past 5 years, as is largely reflected by the changes in its economic structure. Its re-introduction into the world trade set-up has brought huge opportunities, as reflected by the doubling in exports but on the other hand has brought pressure on its competitiveness. As in the past, the R/$ and Rand/ Pound/Euro exchange rate development will be crucial for the country’s future economic health. In terms of the wine industry’s actual impact on the South African economy, the study again produced some interesting results. Of these the following deserves to be mentioned:
The total capital asset base (direct, indirectly and induced) of the wine industry is estimated at R49 768 million. The corresponding number of employment opportunities that are supported by the wine industry amounts to a significant 275 606. The major part is to be found in the trade, catering, accommodation and transport sectors.
In terms of GDP, the total (direct, indirect and induced) annual impact of the wine industry of the Western Cape on the national economy amounts to R26 223 million which amounts to 2.2% of the total GDP of South Africa in 2008.

10
The wine industry generates an amount of R17 124 million of private disposable income. Of this amount, 17% is destined for low-income households which are slightly higher than for the economy as a whole (16%).
The Labour/Capital ratio for the wine industry amounts to 5.54 which is much higher than that of the economy as a whole and should be highly regarded.
The GDP/Capital ratio for the wine industry in total of 0.53 is somewhat higher than that of the economy as a whole, namely 0.46. With the exception of the wholesale and retail component all the other sectors related to the wine industry show smaller GDP/Capital ratios than the average of the economy.
For purposes of this study, the regional impacts emanating from the wine industry were also calculated for both GDP and labour. Of the total impact that the wine industry has on GDP and employment creation, approximately R14 214 million and 168 102 employment, respectively, occurs in the Western Cape.

11
PART I
1 INTRODUCTION AND BACKGROUND
This study of the impact on the wine industry in the Western Cape, with 2008 as the base year, is the third consecutive study of this nature. The two previous studies with 1999 and 2003 as the respective base years produced some very interesting results pertaining to many aspects surrounding and inherent to the wine industry. One of the most important aims of these studies was to give a reasonably accurate presentation of the magnitude of the industry in monetary terms for a specific calendar year. This also includes the various stages of value added from the raw material producers’ levels right through to the final retail sales values (including exports). When these studies started off in 2000, economic data on some of these aspects were scant, but with the help of industry experts these shortcomings were overcome so that 2003 would represent an authentic picture of the structure of the wine industry. However, as we stand at present, the volume and quality of the relevant statistics have improved even further with the help of SAWIS and its constituent members who played a crucial role. With the help of Vinpro, PWC and SAWIS, it was for the first time possible to attain more accurate figures of the actual commercial income of wine producers per wine producing region. Information on the sales split between white and red wine varieties as well as the volume and value relationships between bulk and packaged sales could be brought into the equation. Obviously, information of this nature will help in identifying structural and other changes that are constantly at work in the wine industry. In addition to the improvement in the quality and availability of relevant statistics, Conningarth Economists, have since the 2003 study, also worked on improving especially its impact models. In this regard, for example, the newly compiled Western Cape Social Accounting Matrix (SAM) was employed to improve the wine impact results on the Western Cape and on the national economy. For the sake of interest, in the new SAM, separate provision is made for the wine producing sector, apart from non-alcoholic beverages. In addition, Conningarth Economists have technically improved its impact models to take better notice of possible leakages of wine’s intermediate demands to other provinces and even to overseas suppliers. All the above developments, plus others which will be covered later under the particular headings, have hopefully contributed to an improvement in the quality of quantified impact outcomes.

12
2 IMPORTANT DEVELOPMENTS IN THE WINE INDUSTRY BETWEEN 2003 AND 2008
2.1 General Observations
In general, the South African wine industry’s performance in 2008 should be viewed against the background of the worldwide financial meltdown that really started to gain momentum in the second half of 2008. South Africa’s own economy only started to move into recession in the final quarter of 2008. For the period between 2003 and 2008, a number of structural developments concerning the wine industry were foreseen in the 2003 study. For example, the changeover to red wine consumption for various reasons, both here and abroad, which caused a major increase in red varietal plantings. This has increased from 18 percent of total plantings in 1996 to 44 percent in 2008. Obviously, local producers were prepared to take on the risk of increased red wine production provided the strong tendency in red wine demand continued. The question remains whether this move has paid off? Unfortunately, the local demand did not fully match the increase in supply, leading to depressed prices of red wine grapes to producers. For example Table 1: Index of Average Price per Ton to Producers (2000 = 100)
Red Wine 2000 2008 Cabernet Sauvignon 100 41 Merlot 100 42 Pinotage 100 39 Shiraz 100 44 Source: SAWIS 2008
On the other hand, as far as white wine is concerned, the picture looked somewhat better. As shown in the table below the prices for a number of well-known white wine grapes over this 8 year period showed an upward trend. Table 2: Index of Average Price per Ton Paid to Producers (2000 = 100)
White Wine 2000 2008 Sauvignon blanc 100 140 Chardonnay 100 170 Riesling 100 211 Source: SAWIS 2008
Given these diverse price movements, it is clear that the range of the mix between red and white wine grapes of a producer would have had an important impact on profitability and commercial viability in general. Given that the local demand for wine, red wine in particular, did not match the increased supply, the local industry was forced to enter the export market in a much more aggressive way than ever before. No wonder then that those exports, as percentage of local production, increased from just 21 percent in 1999 to 54 percent in 2008. Obviously, this changed structure of demand/supply that developed over the past number of years, has made the local wine industry more susceptible to changes in inflation rates
13
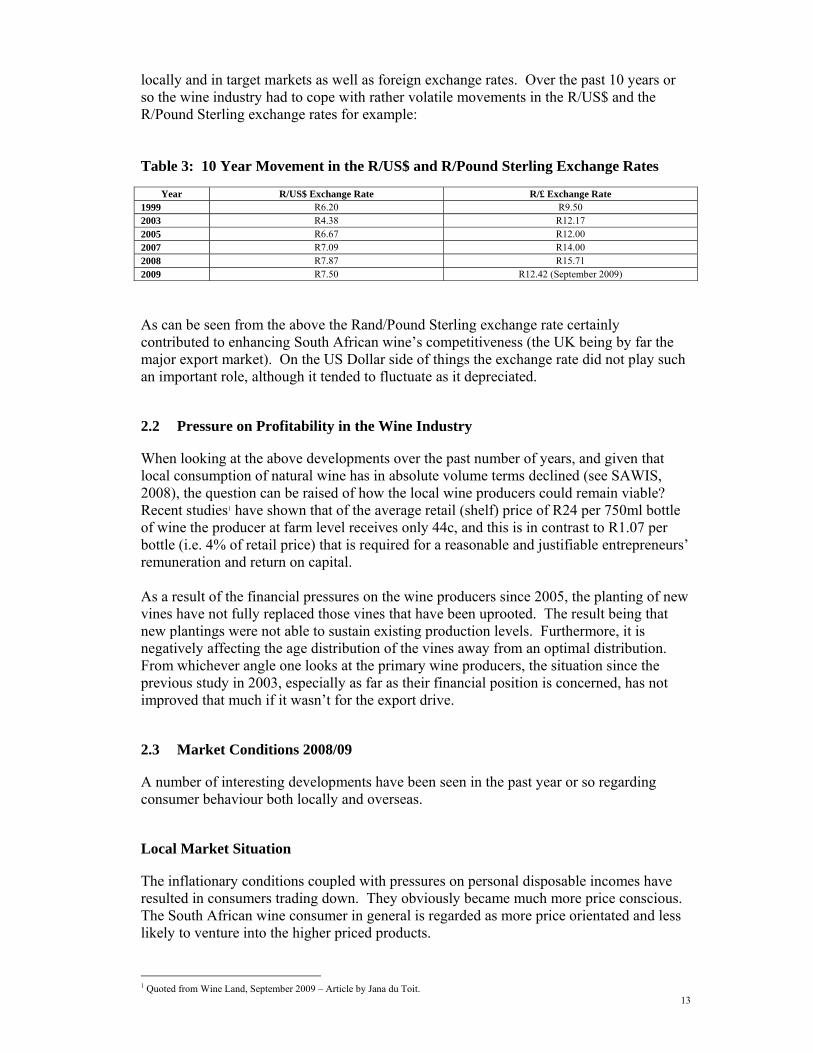
locally and in target markets as well as foreign exchange rates. Over the past 10 years or so the wine industry had to cope with rather volatile movements in the R/US$ and the R/Pound Sterling exchange rates for example: Table 3: 10 Year Movement in the R/US$ and R/Pound Sterling Exchange Rates
Year R/US$ Exchange Rate R/£ Exchange Rate 1999 R6.20 R9.50 2003 R4.38 R12.17 2005 R6.67 R12.00 2007 R7.09 R14.00 2008 R7.87 R15.71 2009 R7.50 R12.42 (September 2009)
As can be seen from the above the Rand/Pound Sterling exchange rate certainly contributed to enhancing South African wine’s competitiveness (the UK being by far the major export market). On the US Dollar side of things the exchange rate did not play such an important role, although it tended to fluctuate as it depreciated.
2.2 Pressure on Profitability in the Wine Industry
When looking at the above developments over the past number of years, and given that local consumption of natural wine has in absolute volume terms declined (see SAWIS, 2008), the question can be raised of how the local wine producers could remain viable? Recent studies1 have shown that of the average retail (shelf) price of R24 per 750ml bottle of wine the producer at farm level receives only 44c, and this is in contrast to R1.07 per bottle (i.e. 4% of retail price) that is required for a reasonable and justifiable entrepreneurs’ remuneration and return on capital. As a result of the financial pressures on the wine producers since 2005, the planting of new vines have not fully replaced those vines that have been uprooted. The result being that new plantings were not able to sustain existing production levels. Furthermore, it is negatively affecting the age distribution of the vines away from an optimal distribution. From whichever angle one looks at the primary wine producers, the situation since the previous study in 2003, especially as far as their financial position is concerned, has not improved that much if it wasn’t for the export drive.
2.3 Market Conditions 2008/09
A number of interesting developments have been seen in the past year or so regarding consumer behaviour both locally and overseas.
Local Market Situation
The inflationary conditions coupled with pressures on personal disposable incomes have resulted in consumers trading down. They obviously became much more price conscious. The South African wine consumer in general is regarded as more price orientated and less likely to venture into the higher priced products.
1 Quoted from Wine Land, September 2009 – Article by Jana du Toit.

14
In 2008 the demand for white wine has weakened whilst red wine sales showed a moderate increase. Another important development in the local wine making industry is the marked increase in small independent producers. Given the cost pressures referred to above, it is believed that most of these producers can only survive if they diversify into providing tourist services (i.e. accommodation; restaurants; olive oil etc.). Some industry observers, however, foresee that a measure of consolidation has to take place as well as sharing of packaging, marketing and distribution services.
International Markets
As indicated earlier, the export option to a large extent actually saved the local wine industry from even further financial stress over the past number of years. The amount exported increased phenomenally from “just” 115 million litres in 1998 to 407 million litres in 2008. Even though the Rand strengthened against the US Dollar and the UK Pound in recent months the overall depreciation of the Rand against these major currencies and over the longer-term has been to the advantage of exporters. However, market commentators still foresee tough competitive conditions in the next year or so. The major part of wine exports fall in the low-end price categories, in the UK this entails an average shelf price of ₤3.99 (±R50) per bottle. According to studies by Vinpro and Winetech (2008)2 it is very difficult to make a profit overseas at these prices if at all. Especially given the movement (strengthening) of the Rand in recent times (see table below). It should also be kept in mind that it is not only South Africa, as one of the “New World” exporters which has recently experienced problems in the export markets. Both Australia and New Zealand, for example, have to cope with the problem of “saturation” following huge increases in their wine exports3. Table 4: Exchange Rates of the Rand
30 Sep. 2008 to 31 Dec.
2008 31 Dec. 2008 to 31
Mar. 2009 31 Mar. 2009 to 30
Jun. 2009 30 Jun. 2009 to 25
Aug. 2009 Weighted Average* -7.8 0.8 17.5 -1.3 Euro -8.9 2.5 16.7 -1.8 US Dollar -10.6 -3.4 23.8 -0.5 Chinese Yuan -10.6 -3.2 23.8 -0.5 British Pound 11.6 -2.1 6.2 1.1 Japanese Yen -23.1 5.2 20.3 -1.7 * Against a basket of 15 currencies; Source: Quarterly Bulletin September 2009 – South African Reserve Bank
According to some of the industry’s marketing practitioners it is always a risk to progress too quickly in gaining a market share of an overseas market due to “brand tiredness” that may set in. In any event, the volatility in foreign exchange rates makes the continuous marketing of wine in overseas markets and brand fixing difficult enough – as shown in the table above.
2 Quoted in Wineland Publication, September 2009. 3 See article in New Zealand Herald; May 23, 2009.

15
3 OVERALL ECONOMIC STATUS OF THE WINE INDUSTRY IN
2008
The developments in the wine industry described in the previous sections, provides a background framework in order to interpret the significance of the economic aggregates presented in the following table concerning the situation in 2008. When looking at the figures represented in the following table, it is important to take the following into account:
The total turnover includes the production for the Orange River;
The Export and Current Import Level data was obtained from Statistics South Africa, as obtained from primary data provided by the Department of Customs and Excise;
For purposes of correctly modelling the system, it was necessary to impute exports and domestic sales at each of the value chain stages. It is important to note that the exports at each stage are equal to the amount of total exports;
The term manufacturing is defined as processing, packaging, bottling and labelling. It also includes brandy and grape juice;
The current import level for manufacturing figure is at c.i.f. value plus import taxes. This is due to the fact that the trade and transport margins as well as VAT and excise taxes have already been accounted for in the local sales figure;
The trade and transport margins were obtained from the 1993 Input-Output table (CSS). For how it was derived, see Appendix A to Part I;
The data for the taxes (VAT and excise) is based on structures provided by SA Tourism (2008 Annual Report). See also Appendix A to Part I for more detail;
The 2008 figure, given in the SAWIS book of Statistics 2008; Table 11.3 was used;
The data for tourism is based on structures by SA Tourism (2008 Annual Report). See also Appendix A to Part I for more detail.

16
Table 5: Economic Structure and the Flow of Goods and Services in the Wine Industry (Rand millions; 2008 prices)1
Market Segment
Economic Sector
(1) (2) (3) = (1) - (2) (4) Incremental Turnover1 Exports2 Domestic Sales Current Import Level2
A Primary 1 Primary Agricultural 2 236 8933 1 343 0 2 Cellar 1 084 433 651 0
Total Primary 3 320 1 326 1 994 0 B Manufacturing, Wholesale and Retail Trade 1 Manufacturing4 5 644 2 254 3 390 2115
2 Trade, Catering and Accommodation6 6 741 2 692 4 049 26 3 Taxes (VAT and Excise)7 3 4598 0 3 459 0
Total Manufacturing, Wholesale and Retail and Transport 15 844 4 947 10 898 237 C Sub-Total (A + B) 19 164 6 272 12 892 237 D Tourism9
1 Foreign 3 463 3 463 0 0 2 Local 800 0 800 0
Total Tourism 4263 3 463 800 0 Grand Total (C +D) 23 427 9 735 13 692 237
Source: SAWIS 2008 structures used unless otherwise indicated. 1. The total incremental turnover includes the production for the Orange River; 2. The Export and Current Import Level data was obtained from Statistics South Africa, as obtained from primary data provided by the Department of Customs and Excise; 3. For purposes of correctly modeling the system, it was necessary to impute exports and domestic sales at each of the value chain stages. It is important to note that the exports at each stage are equal to the amount of total exports; 4. The term manufacturing is defined as processing, packaging, bottling and labeling. It also includes brandy and grape juice; 5. The current import level for manufacturing figure is at c.i.f. value plus import taxes. This is due to the fact that the trade and transport margins as well as VAT and excise taxes have already been accounted for in the local sales
figure; 6. The trade and transport margins were obtained from the 1993 Input-Output table (CSS). For how it was derived, see Appendix A to Part I; 7. The data for the taxes (VAT and excise) is based on structures provided by SA Tourism (2008 Annual Report). See also Appendix A to Part I for more detail; 8. The 2008 figure, given in the SAWIS book of Statistics 2008; Table 11.3 was used; 9. The data for tourism is based on structures by SA Tourism (2008 Annual Report). See also Appendix A to Part I for more detail.
17
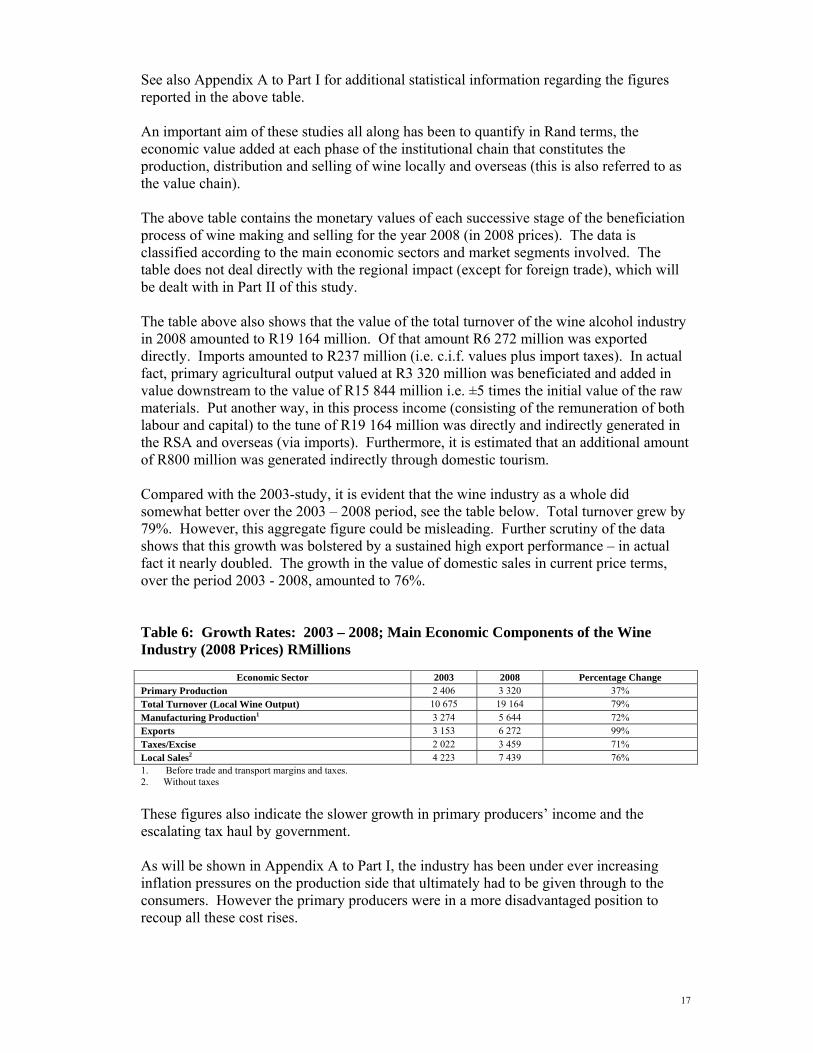
See also Appendix A to Part I for additional statistical information regarding the figures reported in the above table. An important aim of these studies all along has been to quantify in Rand terms, the economic value added at each phase of the institutional chain that constitutes the production, distribution and selling of wine locally and overseas (this is also referred to as the value chain). The above table contains the monetary values of each successive stage of the beneficiation process of wine making and selling for the year 2008 (in 2008 prices). The data is classified according to the main economic sectors and market segments involved. The table does not deal directly with the regional impact (except for foreign trade), which will be dealt with in Part II of this study. The table above also shows that the value of the total turnover of the wine alcohol industry in 2008 amounted to R19 164 million. Of that amount R6 272 million was exported directly. Imports amounted to R237 million (i.e. c.i.f. values plus import taxes). In actual fact, primary agricultural output valued at R3 320 million was beneficiated and added in value downstream to the value of R15 844 million i.e. ±5 times the initial value of the raw materials. Put another way, in this process income (consisting of the remuneration of both labour and capital) to the tune of R19 164 million was directly and indirectly generated in the RSA and overseas (via imports). Furthermore, it is estimated that an additional amount of R800 million was generated indirectly through domestic tourism. Compared with the 2003-study, it is evident that the wine industry as a whole did somewhat better over the 2003 – 2008 period, see the table below. Total turnover grew by 79%. However, this aggregate figure could be misleading. Further scrutiny of the data shows that this growth was bolstered by a sustained high export performance – in actual fact it nearly doubled. The growth in the value of domestic sales in current price terms, over the period 2003 - 2008, amounted to 76%. Table 6: Growth Rates: 2003 – 2008; Main Economic Components of the Wine Industry (2008 Prices) RMillions
Economic Sector 2003 2008 Percentage Change Primary Production 2 406 3 320 37% Total Turnover (Local Wine Output) 10 675 19 164 79% Manufacturing Production1 3 274 5 644 72% Exports 3 153 6 272 99% Taxes/Excise 2 022 3 459 71% Local Sales2 4 223 7 439 76% 1. Before trade and transport margins and taxes. 2. Without taxes
These figures also indicate the slower growth in primary producers’ income and the escalating tax haul by government. As will be shown in Appendix A to Part I, the industry has been under ever increasing inflation pressures on the production side that ultimately had to be given through to the consumers. However the primary producers were in a more disadvantaged position to recoup all these cost rises.

18
4 TOURISM IN 2008
In both previous studies (1999 and 2003) an attempt was made to measure the impact on the Western Cape economy of tourists visiting the Western Cape but also spending some of their time visiting the Cape Wine Routes. The key to the whole exercise was to come up with a reasonably trustworthy figure of the number of tourists who actually venture into the wine lands – i.e. either visitors from overseas and of course South Africans that visit these wine lands. Unfortunately such data is not readily available unless direct survey methods are employed, and therefore indirect methods had to be employed to obtain useable figures.
Local Tourism
Fortunately a whole range of useful tourist information can be gleaned from the Annual Reports of South African Tourism, the official state sponsored body to promote tourism in South Africa. The following interesting data was extracted from the 2008 Annual Report:
In 2008 the Western Cape entertained 15% of all bed nights.
In 2008 R3.9 billion was spent by local tourists visiting the Western Cape (12% of the national total – being Western Cape’s share of local tourist’s destinations).
About 13% of these tourists visited so-called “natural attractions, cultural, heritage and historical sites” (probably including cellars and travelling through the vineyards).
On average spend 6 bed nights.
They spend on average of R1 910 per day; business travellers R1 640 and the rest on average R780 per day.
Another important aspect of local tourists is that a large portion stay with friends and relatives and use own transport (the so-called VFR group). In the Western Cape’s case the percentage is as high as 70%.
It should be borne in mind that the Western Cape includes the Garden Route/Klein Karoo areas which attracts part of the Western Cape total.
If an assumption is made that visitors spend roughly 15% of their time on visits to the wine routes inter alia also visiting historical, cultural sites, then a figure of R800 million as a benchmark figure for local wine tourism is possible. Given the unknown behaviour of local tourists visiting friends and relatives in the Western Cape the estimate of R800 million for spending on the Wine Route activities by local tourists may be somewhat low (there is no doubt that further in-depth studies are required to refine these figures down to levels required by tourism functionaries).
Foreign Tourism
In 2008 17% of all foreign tourists visited the Western Cape.
The Western Cape captured 28% of bed nights required by foreign tourists which amounted to 21.08 million bed nights.
Direct spending by tourists in the Western Cape amounted to R20.8 billion in 2008.
They also tend to stay an average of 8 nights in the Western Cape (that includes all kinds of visitors, those coming for holidays tend to spend longer periods).

19
Table 7: Activities of Foreign Tourists
Activities by Purpose of Visit for 2008
Holiday Shopping (Personal)
Shopping (Business)
Business Traveler
Business Tourist
Medical VFR Religion Other
Shopping 96% 99% 90% 90% 88% 71% 96% 93% 92% Nightlife 92% 63% 49% 81% 78% 0% 65% 75% 81% Theme Parks 22% 2% 2% 6% 5% 1% 8% 0% 11% Trading 1% 3% 60% 3% 2% 0% 1% 0% 1% Visits to Casino 15% 3% 1% 6% 6% 0% 7% 0% 6% Sport Competition
2% 0% 0% 6% 0% 0% 1% 0% 2%
Sport Attending 2% 0% 0% 1% 0% 0% 1% 0% 11% Business 2% 0% 2% 76% 68% 0% 1% 0% 3% Cultural, Historical and Heritage
43% 3% 1% 12% 13% 1% 19% 0% 17%
Wildlife 53% 1% 0% 14% 9% 1% 9% 0% 15% Visiting Natural Attractions
64% 2% 0% 19% 14% 2% 20% 0% 23%
Beach 42% 1% 2% 13% 0% 2% 13% 0% 20% Social 34% 35% 11% 14% 14% 37% 90% 40% 0% Medical 2% 1% 0% 0% 0% 81% 2% 0% 1% Health 1% 0% 0% 0% 0% 13% 1% 0% 1% Source: SA Tourism; 2008 Annual Report; page 59.
From the above table one can see the importance foreign tourists attach to various activities when they arrive in South Africa. The table indicates that they spend as much time on, for example, visiting natural attractions as visiting cultural, historical and heritage sites. It is not clear whether they actually combine these trips. The fact of the matter is, it is not easy to obtain hard data on the amount of time and money foreign tourists spend on visits to the wine lands in particular. The majority will most probably not stay in accommodation in the wine areas but will travel from the Cape Peninsula or elsewhere. For the sake of assumption, if the tourists on average devote one day (i.e. 1 of 8) of their stay in the Western Cape visiting the Wine Routes and other cultural and heritage sites, an amount very roughly of R4.2 billion can indirectly be linked to those that most likely have ended up in the wine lands.
Sport Tourism (2010 Soccer World Cup)
According to the Government’s 2010 Soccer World Cup Tourism Organising Plan4, ± 500 000 foreign tourists can be expected over the 4 weeks between June/July 2010. Seven matches will take place in Cape Town and for each match about 22 000 beds will be required. However, according to this report, an amount of 69 6635 people will be involved in one way or another with each match. The stadium accommodates 40 000 people, 50 000 of 69 663 people are not tourists as they are from local origin and will not require formal accommodation and will be of the VFR sort. As can be seen from the above, a more thorough study is needed to arrive at exact figures of actual foreign tourists originating from the Soccer 2010 World Cup who will actually also be visiting the wine lands, so no attempt to determine the figure was even considered.
4 Report by South Africa Tourism, 2005 5 ibid figure 12.

20
5 INSTITUTIONAL ASPECTS
The institutional chain that forwardly links all the participants in the whole economic process of beneficiation is shown in the following table. Although the major portion of actual economic value added through the process of beneficiation takes place in the Western Cape, a substantial part thereof will realise in other parts of the country, mainly through the wholesale and retail components. (This aspect will be dealt with in Part II of this study). At the retail level a large portion of the sale of alcoholic beverages is directed at the organised leisure market, i.e. people visiting restaurants, hotels, clubs, etc. This is also where the tourism market is becoming increasingly important. In relation to the wine industry, the impact of tourism on demand can be categorised in two parts, viz:
Tourists’ direct consumption of wine at hotels, guesthouses, restaurants, etc. while visiting South Africa
Tourists visiting the Western Cape with the specific aim of visiting the Wine Routes and also purchasing wine from cellars
Table 8: Wine Industry Structure in 2008
Tons Number of Producers
Production Category
Primary Grape Producers 1 – 100 1 544 101 – 500 1 423 501 – 1 000 498 1 001 – 5 000 367
5 001 – 10 000
7
Total Number of Primary Grape Producers 3 839 Wine Cellars which Crush Grapes 58 Producer Cellars 504 Private Wine Cellars 23 Producing Wholesalers Total Number of Wine Cellars which Crush Grapes
585
Bulk Wine Buyers
47 Wholesalers (including producing wholesalers)
71 Exporters (buy wine for export only) Total Number of Bulk Wine Buyers 118

21
APPENDICES TO PART I
6 APPENDIX A
6.1 Estimating Total Turnover, Manufacturing, Production, Trade and Transport and Tax Components for 2008 pertaining to the Wine Industry
Table 9: Comparison of Wine Production Value between 2003 and 2008
Beverages Retail Wine
Sales6
Year Value of Sales (R
000)7
Indices of Physical Volume of Production (1995 = 100) MPI30500
Production Price Index Alcoholic8
Value of Production
Rand millions
1 2 3 4 = 2 x 3 5 2003 2 667 142 87.45 126.6 101.75 R7 544 427 2008 4 669 245 113.09 176.1 147.76 R11 106 594 Growth (2003 – 2008)
75% 29.3% 39.1% 79.8% 47.2%
Note: See footnotes at the bottom of the page.
I. Total Turnover
As a starting point, use is made of the total sales of beverages as measured by StatsSA, to establish a growth rate of the overall Wine Industry over the period 2003-2008. This rate is then applied to the 2003 figure (R10 675 – see Table 1, 2003 Report) to obtain the 2008 figure. As shown from the above table, this increase over the 5 year period amounted to 75%. Obviously, this should be regarded as a first approximation, seeing that this figure also includes non-alcoholic beverages. However, this preliminary figure is then used as a kind of reference point to ultimately arrive at a realistic local sales figure after exports have been subtracted. It should be remembered that the figure for exports of wine products is regarded as hard, coming from official primary sources (customs and excise department).
II. Manufacturing Production (Total, including Exports)
To estimate production in the 2003 Report, use was made of the growth in the physical production index of beverages (including non-alcoholic beverages), adjusted for the Production Price Index (PPI), to arrive at a growth percentage of the period in question (1999-2003). In this report the same calculation was again made, and a growth rate over the period 2003-2008 amounted to 79.8% (See Column 4; of the above table). However, having regard of the fact that for this report new figures were obtained for retail sales of wine related products (See Column 5 of the above table). For the purpose of this
6 SAWIS/Vinpro Publications 7 Source: StatsSA: Publication No. P6241-1 8 Source: StatsSA: Website interactive data retrieval
22
study, the growth rate between 2003 and 2008 of these sales figures were regarded as authentic and useable. A figure of 47.2% is shown in Column 5 considering that the volume of consumption of wine and related products barely rose over the 2003-2008 period (±3% in volume terms) and taking note of the increase in the production price index of 39.1%, the growth rate in consumer spending of 47.2% seems acceptable and reasonable. Assuming that the official export figure is non-negotiable and the local consumption figure of wine and brandy obtained from Vinpro and SAWIS data is correct, adding these two figures should give a reasonable figure of total manufacturing turnover - imports are so small that for the purpose of this calculation it is not brought into the equation, i.e. R5 644 million with an implicit growth over the 5 year period of 72.3%. This is only slightly lower than the indirectly derived figure of 79.8% (See Column 4 of the above table).
III. Trade and Transport Margins
No changes to these margins were affected for the purposes of this study. Consequently, these margins grew at the same rates over the period 2003-2008 as the principal economic aggregate to which it is attached.
IV. Taxes
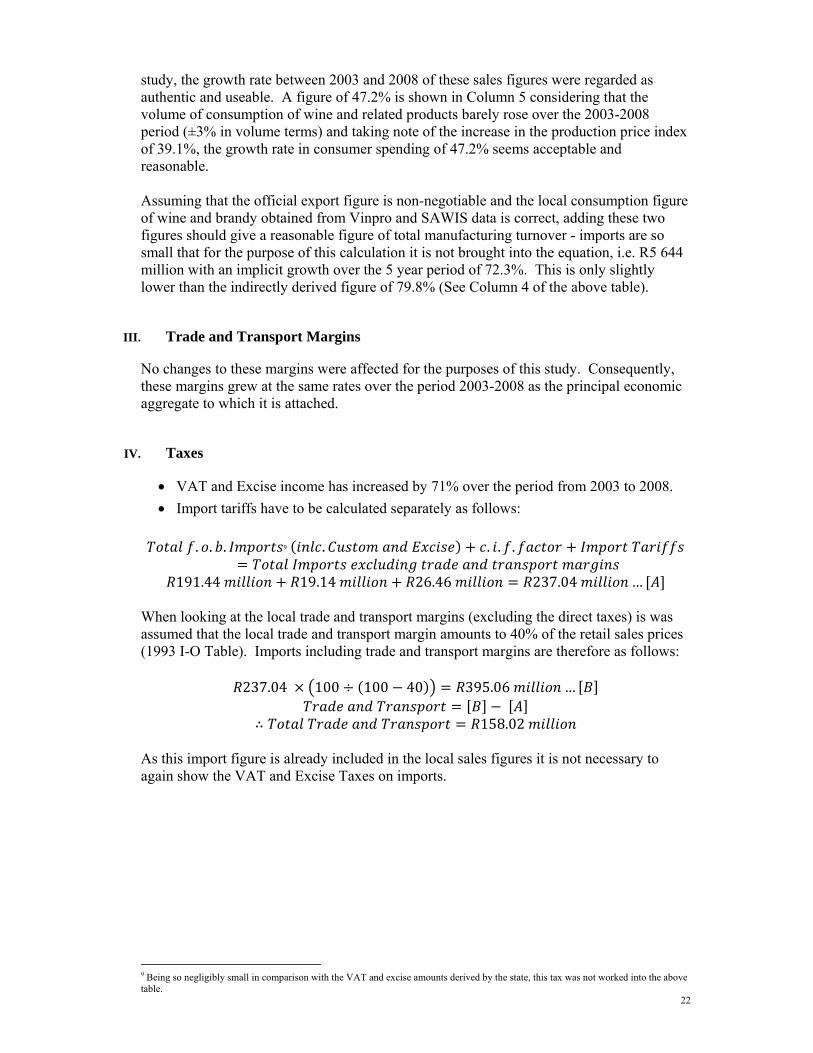
VAT and Excise income has increased by 71% over the period from 2003 to 2008.
Import tariffs have to be calculated separately as follows:
. . . 9 . . . .
191.44 19.14 26.46 237.04 …
When looking at the local trade and transport margins (excluding the direct taxes) is was assumed that the local trade and transport margin amounts to 40% of the retail sales prices (1993 I-O Table). Imports including trade and transport margins are therefore as follows:
237.04 100 100 40 395.06 …
158.02 As this import figure is already included in the local sales figures it is not necessary to again show the VAT and Excise Taxes on imports.
9 Being so negligibly small in comparison with the VAT and excise amounts derived by the state, this tax was not worked into the above table.
23
PART II
7 INTRODUCTION
In Part I of this report, a description of the nature and magnitude of the wine industry’s contribution towards the overall national economic activity was provided for the year 2008. Part II represents a more detailed and a further breakdown of the aforementioned macro-economic impact of the wine industry via various economic aggregates. Although the macro-economic impact of the wine industry relates mainly to the national economy, it was also imperative to capture and depict the impacts on the Western Cape economy. This is due to the fact that even though the wine industry is mainly situated in the Western Cape. For analytical purposes the macro-economic impact of the wine industry on the Western Cape and national economy, was based on the so-called “value added trail” viz starting with primary agriculture production progressing through to the retail sale of finished products. This represents the so-called value chain/forward linkages emanating from the various stages of wine making. These value chains/stages of refinement or forward linkages are the following:
Agriculture (production at farm level)
Cellars
Manufacturing
Trade, Catering and Accommodation
Tourism
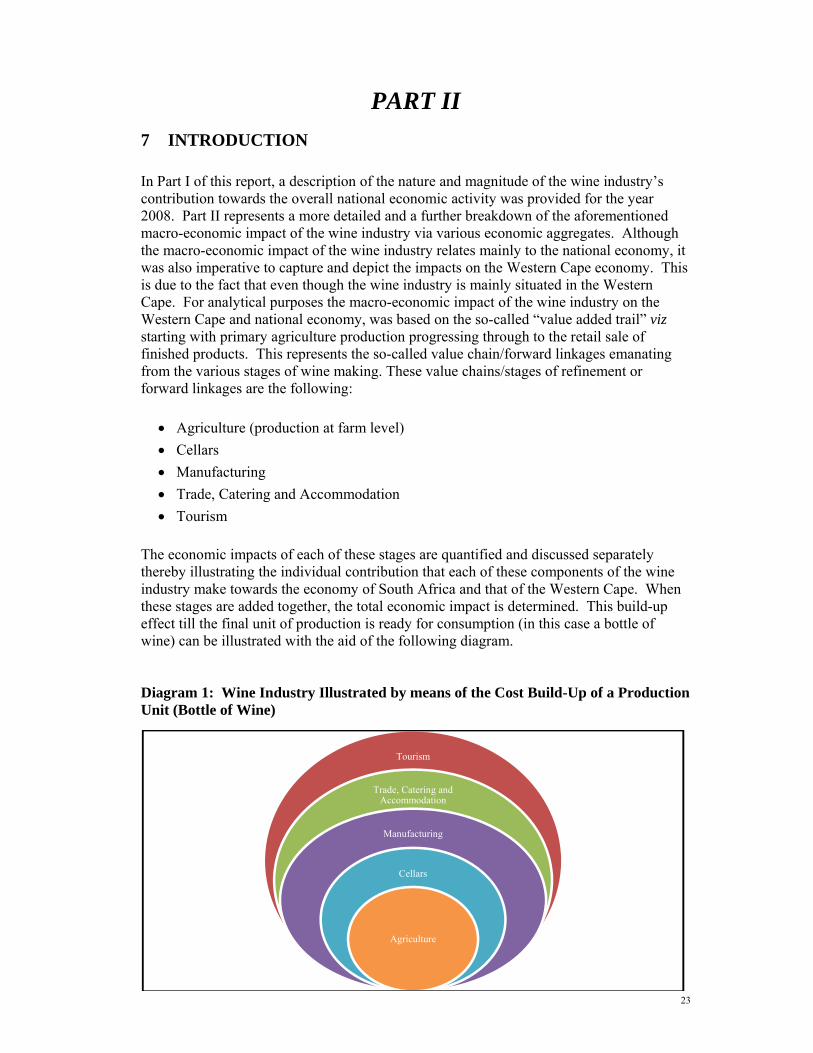
The economic impacts of each of these stages are quantified and discussed separately thereby illustrating the individual contribution that each of these components of the wine industry make towards the economy of South Africa and that of the Western Cape. When these stages are added together, the total economic impact is determined. This build-up effect till the final unit of production is ready for consumption (in this case a bottle of wine) can be illustrated with the aid of the following diagram. Diagram 1: Wine Industry Illustrated by means of the Cost Build-Up of a Production Unit (Bottle of Wine)
Tourism
Trade, Catering and Accommodation
Manufacturing
Cellars
Agriculture

24
As indicated before, the total economic impact of each phase of refinement, including packaging, distribution, transport and retail will be quantified by the models (in other words the direct, indirect and induced economic effects will be quantified). Even the secondary tourism effects, i.e. the impacts on industries acting as suppliers of the wine related tourism industries will be calculated. The composition of the total “bottle-of-wine” effect is shown in Table 16 and the previous diagram. The quantified total impact of each value adding activity of the wine industry, as stated above, will be presented in terms of economic aggregates such as Gross Domestic Product (GDP), Employment Creation, Capital Utilisation and Income Distribution. The impacts are not only provided in terms of absolute levels of the macro-economic indicators, such as GDP or employment, but are also presented in terms of the relative efficiency of investment in the wine industry. For instance, how many employment opportunities are expected to be created per R1 million invested in the wine industry – or in a specific part of the beneficiation process? The scope of the macro-economic impact assessment is provided in the subsequent section. 8 SCOPE OF MACRO-ECONOMIC IMPACT ASSESSMENT
The macro-economic impact assessment pertaining to this study was conducted for the 2008 calendar year and in 2008 prices. As was the case with previous studies of this nature, it is important to define in exact terms the geographical dimensions of the study focus area. In this regard the project focus area comprises of the following wine producing regions:
Breedekloof
Little Karoo
Malmesbury
Orange River
Olifants River
Paarl
Robertson
Stellenbosch
Worcester
For this study, the client proposed that nine wine producing regions be identified as part of the analysis, contrary to the previous study (2003) whereby only seven regions were singled out (however, the original total wine producing region under investigation remained intact). By using a general equilibrium economic impact model, with the Social Accounting Matrix (SAM) as basis, the so-called direct, indirect and induced effects on the economy emanating from the various levels of value adding i.e. at primary agriculture, manufacturing, etc. levels are quantified. A more detailed technical description of the Social Accounting Matrix (SAM) and its analytical attributes are provided in Appendix A to Part II.

25
The direct impact occurs in the various wine components for instance through production/turnover, payment of remuneration to employees and profit generation. The indirect impacts refer to impacts on industries that provide inputs to the wine industry components and other backward linkages. The induced effect or income effect refers to a further round of economic activity that takes place in the economy because of additional consumer spending as a result of the additional salaries and wages throughout the economy and also the Western Cape. These impacts are defined in more detail in Appendix B to Part II. The impact analysis will be based on the following standard economic parameters that are also used to calculate so-called performance criteria. The results will be presented under the following headings:
Impact on Gross Domestic Product (GDP)
Impact on Capital Utilisation
Impact on Employment Creation
o Skilled labourers
o Semi-skilled labourers
o Unskilled labourers
Impact on Households Income (Income distribution)
Impact on Balance of Payments, as a result of Imports and Exports
Efficiency Criteria
A brief overview of the definitions of each of these indicators is given in Appendix C to Part II. As indicated before, the impact analyses will mainly focus on the South African economy but the regional impact on the Western Cape economy will also be dealt with. In the following section the methodology employed to conduct the range of macro-economic impact analyses is explained in more detail. 9 METHODOLOGY
9.1 Overall Macro-economic Modelling
As indicated, the purpose of the study is to estimate the impact of the wine industry on the South African economy as well as to give an indication the impact it has on the economy of the Western Cape. For purposes of the analysis Conningarth Economists has compiled an updated SAM for South Africa and the Western Cape which formed the basis of the impact model – viz – a general equilibrium model. This model will quantify the direct, indirect and induced impacts of the wine industry through its various stages of beneficiation based on 2008 levels of production and consumption, shown in Table 5. The compilation of the updated South African and Western Cape SAM were part of a major initiative by the Development Bank of South Africa (DBSA), Department of Provincial and Local Government (DPLG), StatsSA and the South African Reserve Bank to compile nine provincial SAMs that have all been updated to 2006 prices and have been benchmarked with the new RSA SAM of 2006. The Western Cape SAM was only

26
finalized recently (October 2009), and was overseen by an expert group of people from the Western Cape, chaired by the Western Cape Treasury. The benchmarking exercise was necessary to ensure that all control totals add up to the National Account figures as reflected in the SARB Quarterly Bulletin – June 2008 and the relevant figures reflected in the StatsSA publications, especially P0144 that reflects the 2006 Supply and Use Matrix. The provincial SAMs compiled by Conningarth Economists were converted into user-friendly macro-economic impact models which can be used by provinces to calculate the economic impact of “interventions” by way of programmes and projects on the economy of the relevant province. The model makes used of Excel spreadsheets and is driven by a set of “Macros”. For a specific project or intervention, the model provides the size of macro-economic impacts which is then also used to calculate key macro-economic performance (or efficiency) indicators at national, provincial and local government level. The model results, based on key macro-economic performance indicators, can be provided for both the construction and operational phases of a specific project. It is also important to highlight the fact that the macro-economic impact model is robust enough to cater for varying degrees of input data qualities. For instance, if the impacts are required at local government level, the model is tailor-made to adjust relevant provincial coefficients to suit the situation at lower levels.
9.2 Technical Content of the Model
Due to the highly technical nature of the general equilibrium model it was not deemed expedient for the purpose of this study to go into detail regarding this aspect in this part of the report. However, a broad technical outline of the SAM is given in Appendix A to Part II. To apply the macro-economic model based on the SAM, the so-called model (I-A)-1 was necessary to be developed by dividing the SAM into an endogenous and exogenous portion. The model, (I-A)-1, is according to the Input-Output theory known as the Leontief Inverse. This is determined by developing a coefficient matrix (A) by the endogenous portion which is then subtracted from a unity matrix (I). This (I-A) matrix is then inverted to form the model - (I-A)-1. The coefficients matrix inter alia represents the input production structure of the various sectors as well as the expenditure structure of the different household groups defined in the SAM. By multiplying the inverse matrix, (I-A)-1, with the exogenous stimulus the total impact can be calculated. The following formula provides a brief explanation of this process.
I A _ The exogenous stimuli putting the model in motion starts off with the monetary values attached to each of the phases of beneficiation in the wine industry identified in Part I. These values are then further disaggregated into the following three components to facilitate “kicking” the model into motion (also referred to as exogenous inputs):

27
Firstly, the demand for commodities, for example in the case of primary agriculture, its demand for fertiliser, fuel and pesticides which serve as inputs to its production process.
The second component refers to the paying of salaries and wages. Also part of the cost of production at every stage of beneficiation. This component is further divided into various race and occupation groups.
The third component is the Gross Operating Surplus (GOS) generated by a specific economic activity. GOS consists of depreciation, interest paid and net profit which comprises the cost of capital.
In practical terms it was necessary to determine the monetary values (for 2008) of each of the three exogenous stimuli and for each of the five stages of value added (beneficiation), namely Primary Agriculture; Cellars; Manufacturing; Trade, Catering and Accommodation and Tourism, on a wine region basis. This translates into 45 exogenous vectors (i.e. 9 regions per component). An example of one of these exogenous vectors, for primary agriculture in Stellenbosch, is given in Appendix F to Part II. Therefore, to put the model in motion, the total wine industry (including tourism) was stimulated from outside the model as final demand components, as mentioned above. The implication of this is that a final demand vector for every detail aspect of the model had to be compiled. Each of these components had to be disaggregated on a detail basis, such as turnover, intermediate demand on a product basis, salaries and wages, gross operating surplus, number of workers per skill level, portion of goods and services to be exported, etc. For purposes of this detailed analysis the data supplied by SAWIS was heavily relied upon. The data used includes farming cost structures of each of the wine regions, cost structures of selected cellars and also the producer income for various wine products on a wine region basis. For certain of the input structures, such as manufacturing and trade, catering and accommodation, the Western Cape SAM input structures were used. This is given in more detail on a detailed basis in Appendix G to Part II. 10 PRIMARY DATA AND DATA SOURCES
The main data source that was used by Conningarth Economist for inputs into the model was South African Wine Industry Statistics published by SAWIS. Very important data that needed to structure the model onto the levels of the wine producing regions is shown in the table below. These are the geographic distribution of South African wine grape vineyards per wine region during 2008 as well as the total tonnage of wine produced in each of the wine regions.

28
Table 10: Geographic Distribution of Wine Grape Vineyards and Wine Tonnage per Wine Region during 2008
Wine Region Area Hectares Tonnage
Breedekloof 12 361 223 366 Little Karoo 2 956 40 980 Malmesbury 14 567 131 049 Orange River 5 029 171 664 Olifants River 9 996 220 703 Paarl 16 891 156 015 Robertson 13 898 204 619 Stellenbosch 17 137 121 346 Worcester 8 490 155 871 Total 101 325 1 425 612 Source: SAWIS Report; Table 5.2 page 8 and Table 6.4(b) page 16
11 MACRO-ECONOMIC IMPACT RESULTS
11.1 Total Economic Impacts on South African and the Western Cape Economies
As mentioned before, the macro-economic impacts emanating from the wine industry in South Africa have been measured in terms of a number of standard macro-economic performance indicators. The tables below show the total impacts on the Gross Domestic Product, Employment Creation, Capital Utilisation, Income Distribution, the Fiscal Impact and the Balance of Payments for both South Africa as well as for the Western Cape. Table 11: Total Macro-economic Impact of the Wine Industry on South Africa [Rand millions; 2008 prices]
Macroeconomic Indicators Rand millions Impact on GDP 26 223 Impact on Capital Investment 49 768 Impact on Household Income 17 124 Low Income 2 908 Medium Income 3 598 High Income 10 618 Fiscal Impact 8 517 National Government 7 945 Provincial Government 76 Local Government 496 Impact on Balance of Payments 12 704 Numbers Impact on Employment 275 606 Impact on Skilled Employment 36 551 Impact on Semi-Skilled Employment 78 310 Impact on Unskilled Employment 160 745

29
Table 12: Total Macro-economic Impact of the Wine Industry on the Western Cape [Rand millions; 2008 prices]
Macroeconomic Indicators Rand millions Impact on GDP 14 214 Impact on Capital Investment 29 055 Impact on Household Income 8 478 Low Income 1 528 Medium Income 1 852 High Income 5 098 Fiscal Impact 3 566 National Government 3 273 Provincial Government 51 Local Government 242 Impact on Balance of Payments 5 256
Numbers Impact on Employment 168 102 Impact on Skilled Employment 19 427 Impact on Semi-Skilled Employment 48 392 Impact on Unskilled Employment 100 283
Even though the main focus of this study is directed at the wine industry’s impact on South Africa as a whole the impact on the Western Cape as such should not be disregarded. This is because the wine industry per se is mainly located within the Western Cape. In the rest of this section the impact of the wine industry on the Western Cape economy as such is discussed and compared with the rest of South Africa. The impact of the wine industry on the Western Cape and RSA differs for three reasons, namely:
The Orange River region does not form part of the Western Cape Province. Its impact has for this study’s purposes been included in the total RSA impact;
A major portion of the trade, catering and accommodation activities involving wine, falls outside the Western Cape area; and
A significant portion of the indirect and induced impacts occur is the rest of South Africa due to import leakages from the Western Cape as well as the fact that the major portion of the market for wine is outside the Western Cape.
Some of the salient features of the macro-economic impact measured in terms of GDP, Capital Utilisation and Employment Creation of the wine industry are presented below. The detailed macro-economic impacts originating from the various wine producing areas of the Western Cape are depicted in Appendix D to Part II.
11.1.1 Impact on Gross Domestic Product (GDP)
According to the above tables, in 2008, the wine industry ultimately added R14 214 million to the Western Cape economy. This amounted to approximately 7.3% of the total provincial GDP of the Western Cape10. When assessing the contribution that was made to the national economy’s GDP, an amount of R26 223 million or 1.95% was added to the South African economy11.
10 Provincial GDP for the Western Cape = R193 418 million. 11 GDP for South Africa = R1 343 056 million

30
11.1.2 Impact on Capital Utilization
Productive capital assets are required to support or generate any given amount of economic activity (i.e. GDP). These capital assets, together with labour and entrepreneurship, form the basic productive factors needed for production. Obviously the effectiveness and efficiency with which these factors are combined will determine the overall level of productivity and profitability of such assets. The latter will in turn depend on a whole array of factors, of which the appropriate technology and skills content of the labour force are important. The above tables indicate the following:
The overall capital base needed to sustain the present level of wine production in the Western Cape amounted to R29 055 million, of which, R5 214 million, R902 million and R4 881 million are directly invested in primary agriculture, cellars and the manufacturing process, respectively.
R49 768 million is needed in the rest of the South African economy to sustain the present level of wine production at all the value chain stages.
11.1.3 Impact on Employment Creation
As indicated previously, capital together with labour and entrepreneurship form the primary productive factors needed for wine production. The manpower requirements (man years, also providing for seasonal workers), in terms of people employed in the wine industry are shown in the tables above. The model provided for the total impacts for every level of beneficiation as well as for each production area from which it originates. From the tables above it can be seen that the wine industry’s operations are sustaining of about 168 102 and 275 606 jobs in the Western Cape and South Africa, respectively. This employment impact represents about 8.8% of the total employment in the Western Cape and about 2.2% of the total employment in the rest of South Africa12. It is important to note that these percentages are higher than those of GDP mainly because of variations in capital intensities of production processes between the two regions.
11.1.4 Comparison between Impacts on the Western Cape and Rest of South Africa
About 54% of the impacts of the wine industry, taking into account all forward and backward linkages, falls in the Western Cape and the 46% fall within the rest of South Africa. The results for the various components are shown in the table below. Table 13: Impact of Different Phases of the Wine Producing and Selling Chain Inside the Western Cape and Outside the Region (GDP)
Economic Western Rest of Sector Cape South Africa Total
Primary Agriculture 64% 36% 100% Cellars 52% 48% 100% Manufacturing 71% 29% 100% Wholesale and Retail Trade 39% 61% 100% Tourism 53% 47% 100% Total 54% 46% 100%
12 Total number of jobs in the Western Cape is 1 909 729 and in South Africa is 12 364 243. Data Source: Community Survey 2007, by Province, Populations Group and Employment.

31
Table 14: Impact of Different Phases of the Wine Producing and Selling Chain Inside the Western Cape and Outside the Region (Labour)
Economic Western Rest of Sector Cape South Africa Total
Primary Agriculture 83% 17% 100% Cellars 65% 35% 100% Manufacturing 72% 28% 100% Wholesale and Retail Trade 51% 49% 100% Tourism 58% 42% 100% Total 61% 39% 100%
It is interesting to note that the impact on the rest of South Africa of the wine industry is more or less the same than in the Western Cape itself which again demonstrates the high levels of “leakages” that the Western Cape has to endure viz a viz the rest of the RSA. It is also interesting to note that when looking at the GDP impacts in particular in the Western Cape compared to the rest of South Africa, the impact on the Western Cape is higher.
11.1.5 Comparison of Impact between Provinces
As already explained the wine industry makes use of various inputs directly and indirectly such as fertilizer, fuel and even inputs that are being consumed by labourers involved in one or other way in the value chain of the wine industry. Some of these inputs will originate from the Western Cape however; several of these inputs will be sourced from outside of the Western Cape. This additional demand outside the Western Cape will prompt economic activity in the various provinces of South Africa. In this section an estimation is done of the provincial impact of the total wine industry (total “bottle-of-wine” as described previously). The table below estimates the impact that the wine industry will have on the various provinces through its backward linkages taking into account all the components of the wine industry. Table 15: Provincial Impacts
Province Rand millions Number Percentage
GDP Labour GDP Labour Eastern Cape 2 379 20 837 9% 8% Free State 1 063 9 909 4% 4% Gauteng 3 723 34 276 14% 12% KwaZulu-Natal 1 694 16 340 6% 6% Limpopo 450 3 962 2% 1% Mpumalanga 474 4 399 2% 2% Northern Cape 1 987 15 442 8% 6% North-West 238 2 340 1% 1% Western Cape 14 214 168 102 54% 61% Total 26 223 275 606 100% 100%

32
The above table indicates that, in 2008/09, with regard to the wine industry’s impact on the rest of South Africa, Gauteng drew the largest portion, followed by the Eastern Cape. The provincial impacts were done by making use of a gravity model on a commodity basis with regard to the intermediate demand for certain products. A gravity model is based on two variables, namely size of an industry as well as the distance between the origin of the product demand, and the possible supplier of the product. 12 COMPONENTS OF THE DIFFERENT STAGES OF
BENEFICIATION OF THE WINE INDUSTRY IN SOUTH AFRICA
The analyses of the components of the wine industry actually focuses on the value chain, which constitutes the production, distribution and selling of wine locally and abroad. Although a major portion of actual economic value added through the process of beneficiation takes place in the Western Cape, a substantial part thereof will occur in other parts of the country, mainly through the trade and accommodation components. At the retail level a large portion of the sale of alcoholic beverages is directed at the organised leisure market, i.e. people visiting restaurants, hotels, clubs, etc. This is also where the tourism market is becoming increasingly important. Chart 1: Value Chain of Wine Dependent GDP in South Africa
Primary Agriculture
13%
Cellars5%
Distilling28%
Trade, Catering and
Accommodation37%
Tourism17%

33
Chart 2: Value Chain of Wine Dependent Employment in South Africa
From these pie-charts a few interesting deductions can be made, namely:
Although the impact at farm level is important, the largest impact on GDP and even more on employment is from the higher levels of value added such as trade, catering and accommodation and to a lesser extent tourism.
On the other hand, the relative importance of the primary sector in terms of employment creation is also visible if the importance of the primary sector in terms of employment creation is compared to GDP, 18% and 13% respectively.
The manufacturing sector also plays an important role when looking at employment creation compared to GDP, 14% and 28% respectively.
13 BACKWARD LINKAGES OF THE WINE INDUSTRY IN SOUTH
AFRICA BASED ON THE KIND IMPACT
The figure below presents a proportional breakdown of the wine industry’s direct, indirect and induced impacts.
Primary Agriculture
18%
Cellars4%
Distilling14%
Trade, Catering and
Accommodation54%
Tourism10%

34
Chart 3: Wine Industry’s Direct, Indirect and Induced GDP Impact
The importance of the multiplier effects through its linkages with other sectors in the economy in terms of the buying of materials, the paying of salaries and wages and the resulting expenditure on consumer goods are evident from the above chart. The direct effect constitutes about 32% of its overall contribution relative to the 68% that resulted from the indirect and induced effects combined. 14 SECTORAL IMPACT OF THE WINE INDUSTRY IN SOUTH
AFRICA
The sectoral impact analysis measures the nature and magnitude of the wine industry’s impact on all other economic sectors in the South African economy such as the agricultural sector, mining, manufacturing, etc. The table given below shows the impact in terms of GDP for the 9 main sectors in the economy. More detailed information is given in Appendix E to Part II. These tables reflect how the GDP in each sector is impacted upon by production activities in the wine industry in South Africa. A few aspects with regard to the sectoral impacts need to be noted, and are as follows:
Primary Agriculture
The primary agriculture impact depicts the impact that will occur on the farm itself as well as in the industries which supply inputs directly and indirectly to the wine farmers. This refers to products like fertilizer; electricity; fuel, etc. as well as consumption by labourers working on the wine farms. Consumption by labourers will directly and indirectly effect people that work in bakeries, clothing factories that are indirectly impacted upon by the primary agriculture through the payment of salaries.
Direct Impact32%
Indirect Impact30%
Induced Impact38%

35
Cellars
Cellars also have a big intra impact, reflecting the process of the beneficiation of wine “in-house”.
Manufacturing
The manufacturing part of the wine industry has a more evenly spread backward linkage structure than cellars, reflecting a more specialised process of wine making and manufacturing (more capital intensive and technology driven). As can be expected, the largest impact is on the manufacturing sector itself, again reflecting the large measure of value added that takes place within the wine making process itself (packaging, labelling, bottling, distribution, etc.).
Trade, Catering and Accommodation
The sector’s impact structure portrays the classic business activity relating to trade. For example, 67% of the GDP impact is within the sector itself, again reflecting the whole range of “in-house” value added activities (including some of the activities listed under manufacturing) that take place in the trade and accommodation sectors.
Tourism
The tourism GDP impact is much more widespread over the sectoral range in the economy, the largest impact being on trade and accommodation activities as well as transport, which is understandable.
Total
In its totality, the wine industry’s sectoral impact structure reflects the “weighted average” of all the sub-sectors combined. It is important to note that the GDP impact coefficients make allowance for import “leakages” from overseas. The sectoral impacts therefore only reflect the impacts on the domestic production of the supplying sectors.

36
Table 16: GDP: Sectoral Impact on South Africa [Rand millions; 2008 prices]
Rand Millions Percentages Primary Trade, Catering Primary Trade, Catering
Agriculture Cellars Manufacturing and Accommodation Tourism Total Agriculture Cellars Manufacturing and Accommodation Tourism Total Agriculture 1 412 388 3 197 3 694 166 8 857 42% 28% 44% 38% 4% 34% Mining 58 28 70 100 71 327 2% 2% 1% 1% 2% 1% Manufacturing 449 206 931 956 780 3 322 13% 15% 13% 10% 17% 13% Electricity and Water 114 42 122 167 133 578 3% 3% 2% 2% 3% 2% Construction 99 22 103 150 62 436 3% 2% 1% 2% 1% 2% Trade and Accommodation 292 129 739 967 959 3 087 9% 9% 10% 10% 21% 12% Transport and Communication 199 99 481 969 844 2 592 6% 7% 7% 10% 19% 10% Financial and Business Services 583 382 1 311 2 231 1 127 5 634 17% 28% 18% 23% 25% 21% Community Services 166 73 336 476 339 1 389 5% 5% 5% 5% 8% 5% Total 3 373 1 368 7 291 9 709 4 481 26 223 100% 100% 100% 100% 100% 100%

37
15 EMPLOYMENT IMPACT PER SKILL CATEGORY OF THE WINE INDUSTRY IN SOUTH AFRICA
Table 11 shows that the wine industry’s activities in South Africa sustained about 275 606 employment opportunities during 2008. The figure below reflects a breakdown of these employment opportunities by skill category. Chart 4: Employment Creation by Skill Category, 2008
The figure above indicates that more than half of the employment created as a result of the wine industry’s impact on the South African economy were in the unskilled category, with a further 29% being in the semi-skilled category, and the remaining 13% in the skilled category. The high impact that the wine industry has on unskilled labour should be viewed positively given the high unemployment rate in South Africa, especially with regard to unskilled people. The main reason for this is the large number of unskilled farm workers involved, as well as the salaries generated at all levels of the economy and the indirect impact this again has on sectors that are relatively labour intensive. 16 CAPITAL INVESTMENT IN SOUTH AFRICA SUPPORTING
ALL THE LEVELS OF THE WINE INDUSTRY (VALUE - AND SUPPLY CHAIN)
An aspect that has to be well understood when the effectiveness and efficiency of investment in a particular sector is considered is that an additional amount of capital has to be invested by other sectors in the economy to sustain the supply of materials and other goods and services to the sector in question (in this case the wine industry). The primary agriculture sector’s required investment is estimated at about R5 214 million, to sustain the entire downstream system of sectors that is dependent on the agriculture sector. Through the value and supply chain a total capital investment of about R49 768 million is necessary, which translates to a multiplier of almost 10.
Skilled13%
Semi-Skilled29%
Unskilled58%
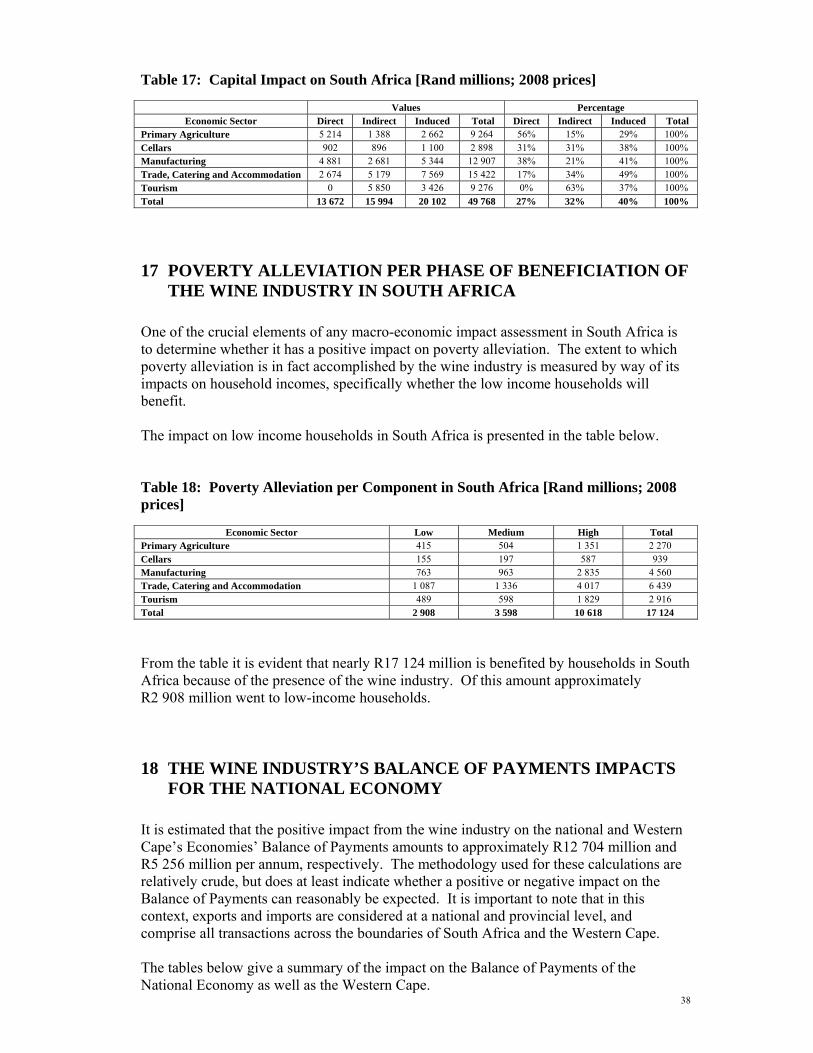
38
Table 17: Capital Impact on South Africa [Rand millions; 2008 prices]
Values Percentage Economic Sector Direct Indirect Induced Total Direct Indirect Induced Total
Primary Agriculture 5 214 1 388 2 662 9 264 56% 15% 29% 100% Cellars 902 896 1 100 2 898 31% 31% 38% 100% Manufacturing 4 881 2 681 5 344 12 907 38% 21% 41% 100% Trade, Catering and Accommodation 2 674 5 179 7 569 15 422 17% 34% 49% 100% Tourism 0 5 850 3 426 9 276 0% 63% 37% 100% Total 13 672 15 994 20 102 49 768 27% 32% 40% 100%
17 POVERTY ALLEVIATION PER PHASE OF BENEFICIATION OF
THE WINE INDUSTRY IN SOUTH AFRICA
One of the crucial elements of any macro-economic impact assessment in South Africa is to determine whether it has a positive impact on poverty alleviation. The extent to which poverty alleviation is in fact accomplished by the wine industry is measured by way of its impacts on household incomes, specifically whether the low income households will benefit. The impact on low income households in South Africa is presented in the table below. Table 18: Poverty Alleviation per Component in South Africa [Rand millions; 2008 prices]
Economic Sector Low Medium High Total Primary Agriculture 415 504 1 351 2 270 Cellars 155 197 587 939 Manufacturing 763 963 2 835 4 560 Trade, Catering and Accommodation 1 087 1 336 4 017 6 439 Tourism 489 598 1 829 2 916 Total 2 908 3 598 10 618 17 124
From the table it is evident that nearly R17 124 million is benefited by households in South Africa because of the presence of the wine industry. Of this amount approximately R2 908 million went to low-income households. 18 THE WINE INDUSTRY’S BALANCE OF PAYMENTS IMPACTS
FOR THE NATIONAL ECONOMY
It is estimated that the positive impact from the wine industry on the national and Western Cape’s Economies’ Balance of Payments amounts to approximately R12 704 million and R5 256 million per annum, respectively. The methodology used for these calculations are relatively crude, but does at least indicate whether a positive or negative impact on the Balance of Payments can reasonably be expected. It is important to note that in this context, exports and imports are considered at a national and provincial level, and comprise all transactions across the boundaries of South Africa and the Western Cape. The tables below give a summary of the impact on the Balance of Payments of the National Economy as well as the Western Cape.
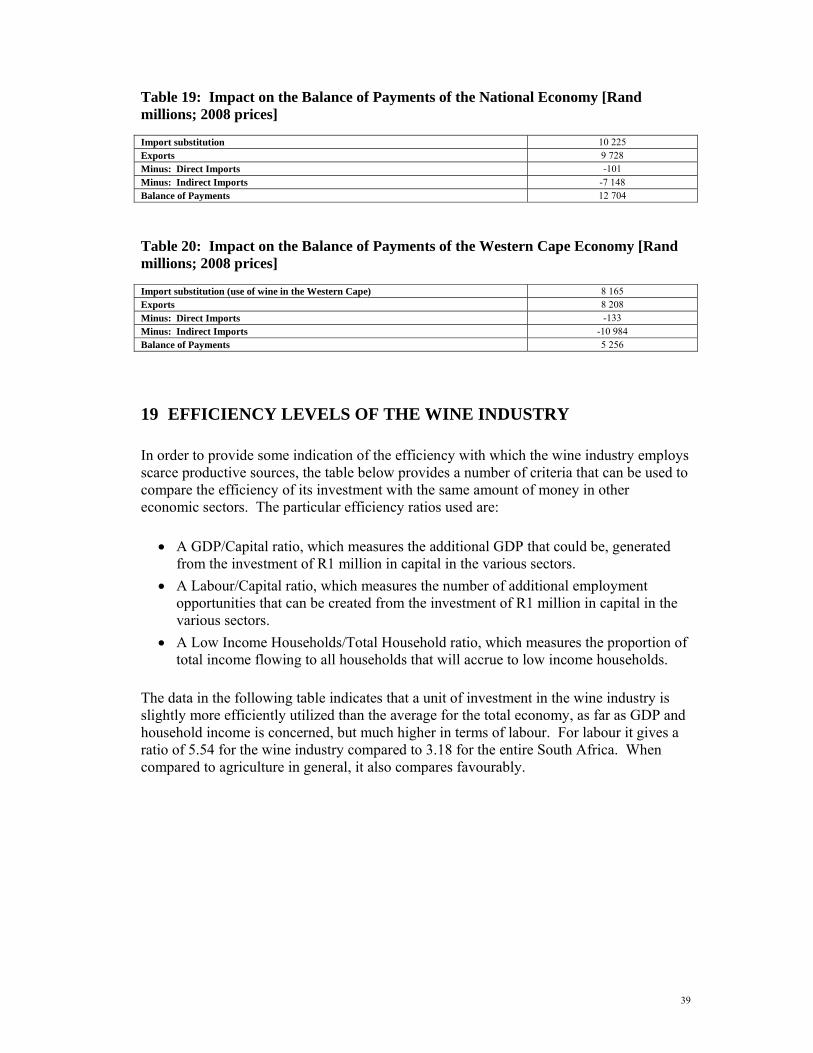
39
Table 19: Impact on the Balance of Payments of the National Economy [Rand millions; 2008 prices]
Import substitution 10 225 Exports 9 728 Minus: Direct Imports -101 Minus: Indirect Imports -7 148 Balance of Payments 12 704
Table 20: Impact on the Balance of Payments of the Western Cape Economy [Rand millions; 2008 prices]
Import substitution (use of wine in the Western Cape) 8 165 Exports 8 208 Minus: Direct Imports -133 Minus: Indirect Imports -10 984 Balance of Payments 5 256
19 EFFICIENCY LEVELS OF THE WINE INDUSTRY
In order to provide some indication of the efficiency with which the wine industry employs scarce productive sources, the table below provides a number of criteria that can be used to compare the efficiency of its investment with the same amount of money in other economic sectors. The particular efficiency ratios used are:
A GDP/Capital ratio, which measures the additional GDP that could be, generated from the investment of R1 million in capital in the various sectors.
A Labour/Capital ratio, which measures the number of additional employment opportunities that can be created from the investment of R1 million in capital in the various sectors.
A Low Income Households/Total Household ratio, which measures the proportion of total income flowing to all households that will accrue to low income households.
The data in the following table indicates that a unit of investment in the wine industry is slightly more efficiently utilized than the average for the total economy, as far as GDP and household income is concerned, but much higher in terms of labour. For labour it gives a ratio of 5.54 for the wine industry compared to 3.18 for the entire South Africa. When compared to agriculture in general, it also compares favourably.

40
Table 21: Efficiency of the Impact of the Wine Industry on the National Economy in terms of Capital Utilization and Poverty Alleviation
Low Income GDP/Capital Labour/Capital Households/Total
Ratio Ratio Household Ratio Total Wine Industry Impact on South Africa 0.53 5.54 0.17
Impact in the invent that a similar amount, as invested in the wine industry, is invested in the main sectors Agriculture, Hunting, Forestry and Fishing 0.39 4.48 0.18 Mining and Quarrying 0.41 3.40 0.18 Manufacturing 0.44 2.98 0.17 Electricity, Gas and Water 0.19 0.93 0.17 Construction 0.63 7.57 0.17 Wholesale and Retail Trade 0.59 5.09 0.17 Transport, Storage and Communication 0.30 1.69 0.16 Financial, Insurance, Real Estate and Business Services 0.40 1.87 0.15 Community, Social and Personal Services 0.80 4.19 0.14 Total Western Cape Economy 0.46 3.18 0.16
20 CONCLUSION
20.1 Overall Developments
A number of important developments played themselves out over the period 2003 – 2008 in the wine industry. As was foreseen in the previous study (2003) that a major surge in red wine production occurred. In fact as percentage of total plantings it increased from 18% in 2003 to 44% in 2008. In Part I it was also indicated that the local demand for red wine did not increase to the same extend that was foreseen earlier. This led to downward pressures on producer’s prices especially received for red wine grapes which compounded the financial bind that producers found themselves in. Fortunately, for the wine industry white wine prices held up well and exports of white wine nearly doubled in volume terms between 2003 and 2008. Nevertheless, as far as the red wine production position is concerned, all indications are that a more balanced situation has been reached and that the surplus stocks have been worked down to more acceptable levels. The export part of the winemaking business continuously has to contend with strong competition from other “new world” exporters who find themselves in much the same position. In addition, South African producers also have to content with volatile exchange rates. Except for the latter part of 2008 over to 2009 the Rand/Pound exchange rate worked in favour of local producers. Tourism still plays an important role in an indirect way supporting the wine industry. Indications are that this will increase in future. Especially from the side of foreign tourists who not only stay longer in the Western Cape than local tourists, but also spend a lot more. However, more research is needed to actually unlock this potential income source to its maximum concerning the wine industry.
20.2 Impact Results
In this study the consultants made use of a new general equilibrium macro-economic model that is believed to be more suitable for impact analyses. The model is also based on

41
the new South African and Western Cape Social Accounting Matrices (SAMs) compiled for 2006. Together with the National SAM and SAM’s for all the other provinces, it was in a much better position to measure impacts on South Africa and the Western Cape’s economy. Important impacts on the Western Cape and the national economy:
The total capital asset base (directly, indirectly and induced) of the wine industry is estimated at R49 768 million. The corresponding number of employment opportunities sustained by the wine industry amounts to a significant 275 606. The major part of course to be found in the trade, catering and accommodation and transport sectors.
In terms of GDP, the annual total impact (direct, indirect and induces) of the wine industry in the Western Cape amounts to R14 214 million, which is 7.3% of the Western Cape’s GDP in 2008.
The wine industry generates an amount of R17 124 million private disposable income, of which about 17% is destined for the low income.
A unit of investment in the wine industry is slightly more efficiently utilized than the average for the total economy, as far as GDP is concerned, but much higher in terms of labour. For labour it gives a ratio of 5.54 for the wine industry compared to 3.18 for South Africa. When compared to agriculture in general, it also compares favourably.
Lastly, concerning the regional distribution of the wine industry’s economic impact it was interesting to find that as far as the GDP is concerned, the Western Cape/South Africa economy ratio is 54:46. In the labour field the ratio is more in the region of 60:40.
In summary one can say that the impact study again demonstrates the ability of the wine industry to adapt to a fast changing production and marketing environment and to survive financially. The major export drive was essential in this regard. However, there are signs already that conditions will still be tough ahead and that the industry would need extra drive and vision to maintain its competitive edge locally and overseas.

42
APPENDICES TO PART II
21 APPENDIX A: SOCIAL ACCOUNTING MATRIX
21.1 The Social Accounting Matrix
A Social Accounting Matrix (SAM) is a comprehensive, economy-wide database, which contains information ON the flow of resources that take place between the different economic agents that exist within an economy (i.e. business enterprises, households, government, etc) during a given period of time – usually one calendar year. When economic agents in an economy are involved in transactions, financial resources change hands. The SAM provides a complete database of all transactions that take place between these agents in a given period, thereby presenting a “snapshot” of the structure of the economy for that time period. As a system for organising information, a SAM presents a powerful tool in terms of which the economy can be described in a complete and consistent way:
Complete in the sense that it provides a comprehensive accounting of all economic transactions for the entity being represented (i.e. country, region/province, city, etc.), and
Consistent in that all incomes and expenditures are matched.
Consequently, a SAM can provide a unifying structure within which the statistical authorities can compile and present the national accounts. Like the traditional Input-Output Table, the SAM reflects the inter-sectoral linkages in terms of sales and purchases of goods and services, as well as the remuneration of production factors that forms the essence of any economy’s functioning. What is also of importance is that a SAM reflects the economic related activities of households in some detail. Households are responsible for decisions that have a direct and indirect effect on important economic variables such as private consumption expenditures and savings. These economic aggregates are important drivers of the economic growth processes and ultimately the creation of employment opportunities and wealth. Private consumption expenditure, for example, comprises approximately 60 percent of total gross final domestic spending in the economy. By combining households into meaningful categories, such as a range of income levels, the impact on these households’ welfare of a changing economic environment is made possible by the SAM. It is clear from the above that because of the intrinsic characteristics of the SAM, once compiled, it renders itself as a useful tool for analytical purposes. Especially, based on the mathematical traits of the matrix notations that describe its structure, a SAM can be transformed into a powerful econometric tool/model. For example, the model can be used to quantify the probable impact on the economy of a new infrastructural project such as a new power station – both the construction phase and the operational phase will be modelled. Thus apart from serving as an extension to a country’s National Accounts, the SAM in its model form opens up many opportunities for the economic analyst to conduct rigorous

43
policy and other impact analyses for the purpose of ensuring optimal benefit to the stakeholders concerned.
21.2 Application of the SAM
The development of the SAM is very significant as it provides a framework within the context of the International System of National Accounts (SNA) in which the activities of all economic agents are accentuated and prominently distinguished. By combining these agents into meaningful groups, the SAM makes it possible to clearly distinguish between groups, to research the effects of interaction between groups, and to measure the economic welfare of each group. There are two key reasons for compiling a SAM:
Firstly, a SAM provides a framework for organising information about the economic and social structure of a particular geographical entity (i.e. a country, region or province) for a particular time period (usually one calendar year), and
Secondly, to provide a database that can be used by any one of a number of different macro-economic modelling tools for evaluating the impact of different economic decisions and/or economic development programmes.
Because the SAM is a comprehensive, disaggregated, consistent, and complete data system of economic entities that captures the interdependence that exists within a socio-economic system, it can be used as a conceptual framework for exploring the impact of exogenous changes in such variables as exports, certain categories of government expenditure, and investment on the entire interdependent socio-economic system. In this regard, sophisticated macro-econometric models, such as the Computable General Equilibrium models (CGEs). The SAM, because of its finer disaggregation of private household expenditure into relatively homogenous socio-economic categories that are recognisable for policy purposes, has been used to explore issues related to income distribution. The SAM’s main contribution in the field of economic policy planning and impact analysis is divided into two categories:
a. As a Primary Source of Economic Information
As a detailed and integrated national and regional accounting framework consistent with officially published socio-economic data, a SAM instantly projects a picture of the nature of a country or region’s economy. It lends itself to both descriptive and structural analysis.
b. As a Planning Tool
Due to its mathematical/statistical underpinnings it can be transformed into a macro-econometric model that can be used to:
Conduct economic forecasting exercises/scenario building.
Conduct economic impact analysis both for policy adjustments at a national and provincial level and for large project evaluation.
Conduct self-sufficiency analysis i.e. gap analysis to determine, with the help of the inter industry and commodity flows contained in the provincial SAM, where possible investment opportunities exist, and

44
Calculate the inflationary impacts on provincial level of price changes instigated at national level (i.e. administered prices, VAT, etc.).
To summarise, the SAM mechanism provides a universally acceptable framework within which the economic impact of development projects and policy adjustments can be reviewed and assessed at both national and provincial/regional levels. It serves as an extension to the official National Accounts of a country’s economy and, therefore, provides a wealth of additional information, especially when disaggregated to more detailed levels.

45
22 APPENDIX B: MAGNITUDE OF LINKAGES
Formally, economists distinguish between direct, indirect and induced economic effects. Indirect and induced effects are sometimes collectively called secondary effects. The total economic impact is the sum of direct, indirect and induced effects within a region. Any of these impacts may be measured in terms of gross output or sales, income, employment or value added.
Direct Impacts
The direct impacts refer to the effect of the activities that take place in the wine industry. It refers to the income and expenditure that is associated with the everyday operation of each of the components of the wine industry. For instance if the cellar component is taken as an example the direct impacts refer to the total production/turnover of the cellars; the intermediate goods bought by the cellars; the salaries and wages paid by the cellars; the profits generated by the cellars.
Indirect Impacts
The indirect impacts refer to economic activities that arise in the sectors that provide inputs to the wine industry components and other backward linked industries. For example, if the primary agriculture sector uses fertilizer, the indirect impacts refer to the activity (paying of salaries and wages; and profit generation) that occurs in the fertilizer sector as well as the sectors that provide materials to the fertilizer sector.
Induced Impacts
Induced impacts refer, inter alia, to the economic impacts that result from the payment of salaries and wages to people who are (directly) employed at the various consecutive stages of beneficiation of the wine industry. In additional the induced impact also includes the salaries and wages paid by businesses operating in the sectors indirectly linked to the wine industry through the supply of inputs. These additional salaries and wages lead to an increased demand for various consumable goods that need to be supplied by other sectors of the economy who then have to raise their productions in tandem with the demand for their products and services. These induced impacts can then be expressed in terms of their contributions to GDP, employment creation and investment or other useful macro-economic variables. Added together, the direct, indirect and induced impacts provide the total impact that the wine industry will have on the RSA and Western Cape economies.

46
23 APPENDIX C: DEFINITIONS OF MACRO-ECONOMIC AGGREGATES
Impact analysis will be based on a number of standard economic parameters and the results will be presented under the following headings:
Impact on Gross Domestic Product (GDP)
Impact on Capital Utilisation
Impact on Employment Creation
o Skilled labourers
o Semi-skilled labourers
o Unskilled labourers
Impact on Households Income (Income distribution)
Impact on Balance of Payments, as a result of Imports and Exports
Efficiency Criteria
The following is a brief overview of the definition of each of these economic parameters.
A. Impact on Gross Domestic Product (GDP)
The impact on GDP reflects the magnitude of the values added to the wine industry from activities within the industry. Value added is made up of three elements, namely:
Remuneration of employees,
Gross operating surplus (which includes profit and depreciation), and
Net indirect taxes
B. Impact on Capital Utilisation
For an economy to operate at a specific level of activity, investment in capital assets (i.e. buildings, machinery, equipment, etc.) is needed. Capital, together with labour and entrepreneurship, are the basic factors needed for production in an economy. The effectiveness and efficiency with which these factors are combined influence the overall level of productivity/profitability processes, bearing in mind that productivity is affected by an array of factors of which appropriate technology and skill level of the labour force are two important elements.
C. Impact on Employment Creation
Labour is a key element of the production process. The study will determine the number of new employment opportunities that will be created by investment in the wine industry. These employment opportunities will be broken down into those created directly by a particular project and those indirectly created and induced throughout the broader economy. Furthermore, a distinction will be made between skilled, semi-skilled and unskilled labourers.

47
D. Impact on Household Income
One of the elements of the additional value added (i.e. GDP) which will result from the proposed expansion is remuneration of employees, which, in turn, affects households income. The SAM measures the magnitude of changes that will occur to both household income and spending/savings pattern. As such, the study will highlight the impact of the wine industry on the low-income households as this can be used as an indicator of the extent to which the wine industry contributed to poverty alleviation throughout the economy.
E. Impact on the Current Account of the Balance of Payments
The wine industry will have direct, indirect and induced impacts on the exports and imports of goods and services that will take place across all of the various economic sectors that are affected by the wine industry. Imports consist of direct and indirect material imports, as well as goods consumed by households that are imported as a result of the induced impact.
F. Effectiveness Criteria
The macro-economic impact of a project is evaluated in terms of effectiveness criteria that measure the extent to which the project utilises resources efficiently. Since capital is a scarce resource in the Western Cape and South Africa, the effectiveness of the utilisation of capital in terms of labour (i.e. new job opportunities) and GDP creation in relation to the total South African economy, is used as a measure of economic effectiveness. These effectiveness criteria are the most reliable indicators as to whether the wine industry is effective or not. In order to make these comparisons, two key multipliers/ratios are calculated i.e.
The Gross Domestic Product (GDP)/Capital ratio (GDP/Capital ratio), and
The Labour/Capital ratio.
Using these ratios, the contribution towards economic growth and job creation relative to the capital employed in the process can be established. If the decision maker considers continuous, long-term economic growth to be more important than job creation in the short-term, then the GDP/Capital ratio is the more important one of the two measures of macro-economic effectiveness. On the other hand, if job creation, particularly in the short-term, has priority, the Labour/Capital ratio is more important.

48
24 APPENDIX D: DETAILED MACRO-ECONOMIC IMPACT OF WINE INDUSTRY
Table 22: GDP Generated in the Western Cape through Forward and Backward Linkages of the Wine Industry of the Western Cape [Rand millions; 2008 prices]
Little Olifants Orange Current Breedekloof Karoo Malmesbury River River Paarl Robertson Stellenbosch Worcester Total Percentage
A. Primary Agriculture
Direct GDP Impact 166 41 142 141 0 242 187 321 120 1 360 Indirect GDP Impact 45 13 33 48 0 57 53 78 35 362 Induced GDP Impact 55 14 45 48 0 78 62 106 41 448 Total GDP Impact 266 67 221 236 0 377 302 505 195 2 170 15%
B. Cellars
Direct GDP Impact 42 11 38 65 0 46 55 36 29 322 Indirect GDP Impact 26 7 28 46 0 33 37 26 18 221 Induced GDP Impact 20 6 20 34 0 24 28 19 14 165 Total GDP Impact 89 24 86 145 0 103 119 80 62 707 5%
C. Manufacturing
Direct GDP Impact 241 120 226 178 0 770 369 800 278 2 982 Indirect GDP Impact 100 50 94 74 0 319 153 332 116 1 237 Induced GDP Impact 80 40 75 59 0 254 122 265 92 986 Total GDP Impact 421 209 395 310 0 1 343 644 1 397 486 5 205 37%
D. Trade, Catering and Accommodation
Direct GDP Impact 164 82 155 122 0 527 253 548 190 2 041 Indirect GDP Impact 69 34 65 51 0 221 106 230 80 856 Induced GDP Impact 68 34 64 51 0 219 105 228 79 849 Total GDP Impact 302 150 284 223 0 968 463 1 006 348 3 746 26%
E. Wine Industry = (A+B+C+D)
Direct GDP Impact 614 253 562 505 0 1 585 864 1 705 617 6 705 Indirect GDP Impact 240 104 220 219 0 630 349 665 248 2 675 Induced GDP Impact 223 93 205 191 0 576 316 618 226 2 448 Total GDP Impact 1 078 450 986 915 0 2 791 1 529 2 988 1 091 11 828 83%
F. Tourism13
Direct GDP Impact 0 0 0 0 0 0 0 0 0 0 Indirect GDP Impact 148 74 140 110 0 476 228 495 171 1 841 Induced GDP Impact 44 22 41 33 0 141 67 147 51 545 Total GDP Impact 192 96 181 142 0 617 295 641 222 2 386 17%
G. Grand Total = (E+F)
Direct GDP Impact 614 253 562 505 0 1 585 864 1 705 617 6 705 Indirect GDP Impact 389 178 359 329 0 1 106 577 1 160 419 4 516 Induced GDP Impact 267 115 246 224 0 717 384 764 277 2 994 Total GDP Impact 1 270 546 1 167 1 057 0 3 408 1 824 3 629 1 313 14 214 100%
13 The direct impact of tourism is included as part of the indirect impact.

49
Table 23: GDP Generated in South Africa through Forward and Backward Linkages of the Wine Industry of the Western Cape [Rand millions; 2008 prices]
Little Olifants Orange Current Breedekloof Karoo Malmesbury River River Paarl Robertson Stellenbosch Worcester Total Percentage
A. Primary Agriculture
Direct GDP Impact 167 41 143 141 73 243 188 322 120 1 438 Indirect GDP Impact 74 20 54 75 31 94 87 127 56 619 Induced GDP Impact 152 38 128 131 66 219 172 300 112 1 316 Total GDP Impact 393 99 325 347 170 555 447 749 288 3 373 13%
B. Cellars
Direct GDP Impact 42 11 38 65 50 46 55 36 29 373 Indirect GDP Impact 46 12 49 82 64 58 62 45 32 451 Induced GDP Impact 58 16 58 97 75 68 78 53 40 544 Total GDP Impact 146 39 145 244 190 172 196 134 102 1 368 5%
C. Manufacturing
Direct GDP Impact 242 120 227 178 140 771 370 802 279 3 127 Indirect GDP Impact 118 58 110 87 68 375 180 390 137 1 524 Induced GDP Impact 205 101 191 150 118 651 312 676 236 2 640 Total GDP Impact 564 279 528 415 327 1 797 862 1 868 651 7 291 28%
D. Trade, Catering and Accommodation
Direct GDP Impact 274 137 258 203 160 879 421 914 317 3 563 Indirect GDP Impact 185 92 174 137 108 592 284 616 213 2 401 Induced GDP Impact 288 144 272 213 168 924 443 961 333 3 745 Total GDP Impact 747 372 704 553 436 2 396 1 147 2 491 862 9 709 37%
E. Wine Industry = (A+B+C+D)
Direct GDP Impact 725 308 666 587 424 1 940 1 034 2 073 745 8 502 Indirect GDP Impact 424 183 387 381 271 1 119 613 1 178 438 4 995 Induced GDP Impact 702 298 648 591 427 1 862 1 005 1 991 721 8 245 Total GDP Impact 1 851 790 1 702 1 559 1 122 4 921 2 652 5 242 1 904 21 742 83%
F. Tourism14
Direct GDP Impact 0 0 0 0 0 0 0 0 0 0 Indirect GDP Impact 214 107 202 159 125 688 329 715 247 2 786 Induced GDP Impact 130 65 123 97 76 418 200 435 151 1 695 Total GDP Impact 345 172 325 255 201 1 106 530 1 150 398 4 481 17%
G. Grand Total = (E+F)
Direct GDP Impact 725 308 666 587 424 1 940 1 034 2 073 745 8 502 Indirect GDP Impact 638 290 589 539 396 1 807 943 1 893 685 7 781 Induced GDP Impact 833 363 771 688 503 2 280 1 205 2 426 871 9 940 Total GDP Impact 2 196 961 2 026 1 814 1 323 6 027 3 181 6 392 2 302 26 223 100%
14 The direct impact of tourism is included as part of the indirect impact.

50
Table 24: Capital Needed in the Western Cape to Support Forward and Backward Linkages of the Wine Industry of the Western Cape [Rand millions; 2008 prices]
Little Olifants Orange Current Breedekloof Karoo Malmesbury River River Paarl Robertson Stellenbosch Worcester Total Percentage
A. Primary Agriculture
Direct Capital Impact 639 168 504 611 0 842 740 984 440 4 929 Indirect Capital Impact 120 37 83 143 0 154 145 203 97 980 Induced Capital Impact 124 31 102 108 0 176 140 240 92 1 013 Total Capital Impact 882 236 689 862 0 1 172 1 024 1 428 629 6 922 24%
B. Cellars
Direct Capital Impact 112 26 91 153 0 108 128 84 78 781 Indirect Capital Impact 70 20 73 124 0 87 101 68 49 593 Induced Capital Impact 46 12 46 77 0 54 62 42 32 373 Total Capital Impact 228 58 210 354 0 250 291 195 159 1 747 6%
C. Manufacturing
Direct Capital Impact 441 188 338 266 0 1 150 579 1 196 509 4 666 Indirect Capital Impact 182 90 171 134 0 580 278 603 210 2 250 Induced Capital Impact 181 90 169 133 0 576 276 599 209 2 232 Total Capital Impact 804 368 678 532 0 2 307 1 134 2 398 928 9 148 31%
D. Trade, Catering and Accommodation
Direct Capital Impact 123 61 116 91 0 396 189 411 142 1 531 Indirect Capital Impact 183 91 173 136 0 587 281 610 211 2 273 Induced Capital Impact 155 77 146 115 0 498 238 518 179 1 927 Total Capital Impact 462 230 435 342 0 1 481 709 1 539 533 5 731 20%
E. Wine Industry = (A+B+C+D)
Direct Capital Impact 1 315 443 1 049 1 122 0 2 496 1 637 2 676 1 169 11 907 Indirect Capital Impact 555 239 499 536 0 1 409 805 1 485 567 6 095 Induced Capital Impact 506 210 463 433 0 1 305 717 1 399 512 5 546 Total Capital Impact 2 377 892 2 012 2 091 0 5 210 3 158 5 560 2 249 23 548 81%
F. Tourism15
Direct Capital Impact 0 0 0 0 0 0 0 0 0 0 Indirect Capital Impact 344 171 324 255 0 1 103 528 1 147 397 4 270 Induced Capital Impact 100 50 94 74 0 320 153 332 115 1 237 Total Capital Impact 444 221 418 328 0 1 423 681 1 479 512 5 507 19%
G. Grand Total = (E+F)
Direct Capital Impact 1 315 443 1 049 1 122 0 2 496 1 637 2 676 1 169 11 907 Indirect Capital Impact 899 410 823 791 0 2 512 1 333 2 632 964 10 365 Induced Capital Impact 606 260 557 507 0 1 624 870 1 732 627 6 783 Total Capital Impact 2 820 1 113 2 430 2 419 0 6 632 3 840 7 040 2 761 29 055 100%
15 The direct impact of tourism is included as part of the indirect impact.

51
Table 25: Capital needed in South Africa to support forward and backward linkages of the wine industry of the Western Cape [Rand millions; 2008 prices]
Little Olifants Orange Current Breedekloof Karoo Malmesbury River River Paarl Robertson Stellenbosch Worcester Total Percentage
A. Primary Agriculture
Direct Capital Impact 640 168 505 612 279 843 741 986 441 5 214 Indirect Capital Impact 166 47 116 179 70 209 196 276 127 1 388 Induced Capital Impact 307 76 258 264 133 442 347 608 226 2 662 Total Capital Impact 1 113 292 879 1 056 482 1 495 1 284 1 870 794 9 264 19%
B. Cellars
Direct Capital Impact 112 26 91 154 119 109 128 84 78 902 Indirect Capital Impact 91 26 96 161 126 114 129 89 64 896 Induced Capital Impact 117 32 116 196 153 139 158 108 82 1 100 Total Capital Impact 321 83 303 511 398 361 416 281 224 2 898 6%
C. Manufacturing
Direct Capital Impact 441 188 338 266 209 1 152 580 1 197 509 4 881 Indirect Capital Impact 208 103 194 152 120 660 317 686 240 2 681 Induced Capital Impact 414 205 387 304 239 1 317 632 1 369 478 5 344 Total Capital Impact 1 064 496 919 722 569 3 129 1 529 3 253 1 227 12 907 26%
D. Trade, Catering and Accommodation
Direct Capital Impact 206 102 194 152 120 660 316 686 238 2 674 Indirect Capital Impact 399 198 375 295 232 1 278 612 1 329 460 5 179 Induced Capital Impact 583 290 549 431 340 1 868 894 1 942 672 7 569 Total Capital Impact 1 187 591 1 118 879 692 3 806 1 822 3 957 1 370 15 422 31%
E. Wine Industry = (A+B+C+D)
Direct Capital Impact 1 399 485 1 128 1 184 728 2 763 1 765 2 954 1 266 13 672 Indirect Capital Impact 865 374 781 788 548 2 262 1 255 2 380 891 10 144 Induced Capital Impact 1 421 603 1 310 1 195 864 3 766 2 032 4 027 1 458 16 676 Total Capital Impact 3 685 1 462 3 219 3 168 2 140 8 791 5 052 9 360 3 615 40 492 81%
F. Tourism16
Direct Capital Impact 0 0 0 0 0 0 0 0 0 0 Indirect Capital Impact 450 224 424 333 262 1 444 691 1 501 520 5 850 Induced Capital Impact 264 131 248 195 154 845 405 879 304 3 426 Total Capital Impact 714 355 673 528 416 2 289 1 096 2 380 824 9 276 19%
G. Grand Total = (E+F)
Direct Capital Impact 1 399 485 1 128 1 184 728 2 763 1 765 2 954 1 266 13 672 Indirect Capital Impact 1 315 599 1 205 1 122 811 3 705 1 946 3 881 1 411 15 994 Induced Capital Impact 1 685 734 1 559 1 391 1 018 4 611 2 437 4 906 1 762 20 102 Total Capital Impact 4 399 1 817 3 892 3 696 2 557 11 080 6 148 11 740 4 439 49 768 100%
16 The direct impact of tourism is included as part of the indirect impact.

52
Table 26: Labour Needed in the Western Cape to Support Forward and Backward Linkages of the Wine Industry of the Western Cape [Rand millions; 2008 prices]
Little Olifants Orange Current Breedekloof Karoo Malmesbury River River Paarl Robertson Stellenbosch Worcester Total Percentage
A. Primary Agriculture
Direct Labour Impact 4 084 918 3 852 2 914 0 6 602 4 425 9 771 3 092 35 659 Indirect Labour Impact 278 76 210 271 0 354 322 510 204 2 226 Induced Labour Impact 406 102 336 354 0 580 458 791 300 3 327 Total Labour Impact 4 768 1 096 4 398 3 539 0 7 536 5 205 11 071 3 596 41 211 25%
B. Cellars
Direct Labour Impact 587 160 551 928 0 656 798 510 410 4 600 Indirect Labour Impact 166 45 175 294 0 208 225 162 116 1 391 Induced Labour Impact 151 41 149 251 0 177 204 138 105 1 216 Total Labour Impact 904 246 875 1 474 0 1 042 1 227 810 631 7 207 4%
C. Manufacturing
Direct Labour Impact 843 415 784 616 0 2 668 1 281 2 773 973 10 353 Indirect Labour Impact 757 375 709 557 0 2 412 1 156 2 508 873 9 347 Induced Labour Impact 591 292 552 434 0 1 880 902 1 955 682 7 288 Total Labour Impact 2 190 1 083 2 045 1 607 0 6 960 3 339 7 236 2 527 26 987 16%
D. Trade, Catering and Accommodation
Direct Labour Impact 5 175 2 576 4 874 3 830 0 16 592 7 945 17 250 5 971 64 213 Indirect Labour Impact 465 232 438 344 0 1 492 714 1 551 537 5 775 Induced Labour Impact 499 248 470 369 0 1 599 766 1 662 575 6 188 Total Labour Impact 6 139 3 056 5 782 4 543 0 19 683 9 424 20 463 7 084 76 175 45%
E. Wine Industry = (A+B+C+D)
Direct Labour Impact 10 690 4 069 10 061 8 288 0 26 518 14 448 30 305 10 446 114 824 Indirect Labour Impact 1 666 728 1 532 1 467 0 4 467 2 418 4 731 1 730 18 738 Induced Labour Impact 1 646 683 1 507 1 409 0 4 236 2 329 4 546 1 663 18 018 Total Labour Impact 14 001 5 480 13 100 11 163 0 35 220 19 196 39 581 13 838 151 581 90%
F. Tourism17
Direct Labour Impact 0 0 0 0 0 0 0 0 0 0 Indirect Labour Impact 1 011 503 953 748 0 3 242 1 553 3 371 1 167 12 549 Induced Labour Impact 320 159 302 237 0 1 026 491 1 067 369 3 973 Total Labour Impact 1 332 663 1 254 985 0 4 269 2 044 4 438 1 536 16 521 10%
G. Grand Total = (E+F)
Direct Labour Impact 10 690 4 069 10 061 8 288 0 26 518 14 448 30 305 10 446 114 824 Indirect Labour Impact 2 677 1 231 2 484 2 215 0 7 709 3 971 8 102 2 897 31 287 Induced Labour Impact 1 966 842 1 809 1 645 0 5 263 2 820 5 613 2 032 21 991 Total Labour Impact 15 333 6 143 14 354 12 149 0 39 489 21 240 44 020 15 374 168 102 100%
17 The direct impact of tourism is included as part of the indirect impact.

53
Table 27: Labour Needed in South Africa to Support Forward and Backward Linkages of the Wine Industry of the Western Cape [Rand millions; 2008 prices]
Little Olifants Orange Current Breedekloof Karoo Malmesbury River River Paarl Robertson Stellenbosch Worcester Total Percentage
A. Primary Agriculture
Direct Labour Impact 4 088 919 3 855 2 917 1 808 6 607 4 429 9 776 3 094 37 493 Indirect Labour Impact 449 122 331 434 185 571 526 814 327 3 758 Induced Labour Impact 944 235 797 812 410 1 362 1 068 1 870 696 8 193 Total Labour Impact 5 481 1 276 4 982 4 164 2 402 8 539 6 022 12 460 4 117 49 444 18%
B. Cellars
Direct Labour Impact 588 160 552 929 723 657 799 511 410 5 328 Indirect Labour Impact 243 66 257 432 336 306 330 238 170 2 379 Induced Labour Impact 359 97 357 601 467 425 486 330 250 3 371 Total Labour Impact 1 190 323 1 165 1 962 1 526 1 387 1 615 1 079 830 11 078 4%
C. Manufacturing
Direct Labour Impact 846 417 786 618 486 2 675 1 285 2 781 976 10 869 Indirect Labour Impact 786 388 733 576 453 2 494 1 197 2 593 907 10 128 Induced Labour Impact 1 270 628 1 187 932 734 4 039 1 937 4 199 1 465 16 392 Total Labour Impact 2 902 1 433 2 705 2 126 1 674 9 208 4 419 9 574 3 348 37 389 14%
D. Trade, Catering and Accommodation
Direct Labour Impact 8 626 4 294 8 125 6 384 5 028 27 656 13 242 28 753 9 954 112 063 Indirect Labour Impact 1 085 540 1 022 803 632 3 478 1 666 3 616 1 252 14 095 Induced Labour Impact 1 784 888 1 681 1 321 1 040 5 721 2 739 5 948 2 059 23 181 Total Labour Impact 11 496 5 722 10 828 8 508 6 701 36 856 17 647 38 318 13 264 149 339 54%
E. Wine Industry = (A+B+C+D)
Direct Labour Impact 14 148 5 790 13 317 10 848 8 045 37 595 19 755 41 822 14 434 165 753 Indirect Labour Impact 2 563 1 116 2 342 2 245 1 607 6 849 3 719 7 262 2 656 30 360 Induced Labour Impact 4 357 1 848 4 021 3 666 2 651 11 546 6 230 12 347 4 470 51 136 Total Labour Impact 21 068 8 754 19 680 16 759 12 303 55 990 29 703 61 431 21 560 247 249 90%
F. Tourism18
Direct Labour Impact 0 0 0 0 0 0 0 0 0 0 Indirect Labour Impact 1 375 685 1 296 1 018 802 4 410 2 112 4 585 1 587 17 869 Induced Labour Impact 807 402 760 597 471 2 588 1 239 2 691 932 10 488 Total Labour Impact 2 183 1 087 2 056 1 615 1 272 6 998 3 351 7 276 2 519 28 357 10%
G. Grand Total = (E+F)
Direct Labour Impact 14 148 5 790 13 317 10 848 8 045 37 595 19 755 41 822 14 434 165 753 Indirect Labour Impact 3 939 1 801 3 638 3 263 2 409 11 259 5 830 11 846 4 243 48 228 Induced Labour Impact 5 164 2 250 4 781 4 263 3 122 14 135 7 469 15 039 5 401 61 625 Total Labour Impact 23 251 9 841 21 736 18 375 13 576 62 989 33 054 68 707 24 078 275 606 100%
18 The direct impact of tourism is included as part of the indirect impact.

54
25 APPENDIX E: DETAILED SECTORAL IMPACT
Table 28: Sectoral Impact of GDP on detailed sectors [Rand millions; 2008 prices]
Rand Millions Percentages
Primary Agriculture Cellars
Manufacturing
Trade Catering and Accommodation Tourism Total
Primary Agriculture Cellars
Manufacturing
Trade, Catering and
Accommodation Tourism Total Agriculture 1 412 388 3 197 3 694 166 8 857 42% 28% 44% 38% 4% 34% Mining 58 28 70 100 71 327 2% 2% 1% 1% 2% 1% Meat, Fish, Fruit, Vegetables, Oils and Fat Products 21 9 43 59 89 220 1% 1% 1% 1% 2% 1% Dairy products 6 2 12 16 24 60 0% 0% 0% 0% 1% 0% Grain Mill, Bakery and Animal Feed Products 13 5 27 37 55 137 0% 0% 0% 0% 1% 1% Other food products 8 3 21 21 24 76 0% 0% 0% 0% 1% 0% Beverages and tobacco products 24 10 300 65 94 493 1% 1% 4% 1% 2% 2% Textiles, Clothing, Leather Products and Footwear 14 6 29 42 49 141 0% 0% 0% 0% 1% 1% Wood and Wood Products 6 3 14 20 12 56 0% 0% 0% 0% 0% 0% Furniture 9 4 22 33 23 92 0% 0% 0% 0% 1% 0% Paper and Paper Products 17 11 43 58 35 163 0% 1% 1% 1% 1% 1% Publishing and Printing 9 4 24 67 17 122 0% 0% 0% 1% 0% 0% Chemicals & Chemical Products (incl. Plastic Products) 161 92 158 239 164 813 5% 7% 2% 2% 4% 3% Rubber Products 3 2 7 11 7 30 0% 0% 0% 0% 0% 0% Non-Metallic Mineral Products 17 6 35 38 24 119 1% 0% 0% 0% 1% 0% Basic Metal Products 25 9 35 37 19 125 1% 1% 0% 0% 0% 0% Structural Metal Products 6 2 9 9 3 28 0% 0% 0% 0% 0% 0% Other Fabricated Metal Products 13 5 26 22 16 83 0% 0% 0% 0% 0% 0% Machinery & Equipment 47 12 34 42 27 162 1% 1% 0% 0% 1% 1% Electrical Machinery & Apparatus 9 4 16 24 13 65 0% 0% 0% 0% 0% 0% Communication, Medical and other Electronic Equipment 3 1 6 12 5 27 0% 0% 0% 0% 0% 0% Manufacturing of Transport Equipment 21 10 43 62 33 169 1% 1% 1% 1% 1% 1% Other Manufacturing & Recycling 17 6 30 42 47 141 0% 0% 0% 0% 1% 1% Electricity 81 29 92 134 111 448 2% 2% 1% 1% 2% 2% Water 33 13 30 33 22 131 1% 1% 0% 0% 0% 0% Building & Construction 99 22 103 150 62 436 3% 2% 1% 2% 1% 2% Trade 274 121 698 888 672 2 654 8% 9% 10% 9% 15% 10%

55
Accommodation 18 8 41 79 287 434 1% 1% 1% 1% 6% 2% Transport 106 53 276 377 646 1 457 3% 4% 4% 4% 14% 6% Communication 93 46 205 592 199 1 135 3% 3% 3% 6% 4% 4% Finance & Insurance 283 119 583 848 405 2 239 8% 9% 8% 9% 9% 9% Real Estate 175 79 465 733 366 1 818 5% 6% 6% 8% 8% 7% Business Services 124 184 263 650 356 1 577 4% 13% 4% 7% 8% 6% Community, Social and Personal Services 166 73 336 476 339 1 389 5% 5% 5% 5% 8% 5% Total 3 373 1 368 7 291 9 709 4 481 26 223 100% 100% 100% 100% 100% 100%

56
26 APPENDIX F: EXOGENOUS VECTOR FOR PRIMARY AGRICULTURE IN STELLENBOSCH
The table below gives an example of the exogenous vector for the primary agriculture in Stellenbosch. These figures are used as the inputs for the operational phase of the model. Table 29: Exogenous Vector for Primary Agriculture in Stellenbosch
Values Percentages 1. Production/Turnover per annum (Rand millions; 2008 prices) 495.62
2. Number of Labourers (Numbers, 2008) Skilled Labourers 272 Semi-skilled Labourers 2 361 Unskilled Labourers 6 989
3. Apportionment of Production Total Production in terms of: Domestic Sales 29.84 60% Exports 19.85 40% Total 49.69 100%
4. Split of Production between Economic Entities Intermediate Demand 191.27 39% Labour Remuneration 176.65 36% Gross Operating Surplus 124.79 25% Total 492.71 100%
5. Split of Intermediate Demand between Commodities Agriculture 12.56 7% Mining 0.49 0% Meat, Fish, Fruit, Vegetables, Oils & Fat Products 0.68 0% Dairy Products 0.12 0% Grain Mill, Bakery & Animal Feed Products 0.08 0% Other Food Products 0.04 0% Beverages & Tobacco Products 0.00 0% Textiles, Clothing, Leather Products & Footwear 0.39 0% Wood & Wood Products 0.40 0% Furniture 0.00 0% Paper & Paper Products 3.30 2% Publishing & Printing 0.21 0% Chemicals & Chemical Products (incl. Plastic Products) 86.99 45% Rubber Products 0.41 0% Non-Metallic Mineral Products 2.24 1% Basic Metal Products 0.22 0% Structural Metal Products 0.83 0% Other Fabricated Metal Products 0.48 0% Machinery & Equipment 40.20 21% Electrical Machinery & Apparatus 0.00 0% Communication, Medical & Other Electronic Equipment 0.00 0% Manufacturing of Transport Equipment 1.95 1% Other Manufacturing & Recycling 2.09 1% Electricity 10.71 6% Water 12.03 6% Buildings and Other Construction 2.02 1% Trade 1.37 1% Accommodation 0.00 0% Transport Services 2.01 1% Communications 0.11 0% Insurance 8.59 4% Real Estate 0.00 0% Business Activities 0.19 0% Community, Social and Personal Services 0.54 0% Total 191.27 100%
6. Split of Labour Remuneration between Labourers Africans - Skilled 3.57 2% Africans - Semi-Skilled 28.64 16% Africans - Unskilled 17.60 10% Coloureds - Skilled 7.38 4%

57
Coloureds - Semi-Skilled 32.93 19% Coloureds - Unskilled 31.82 18% Asians/Indians - Skilled 0.42 0% Asians/Indians - Semi-Skilled 0.52 0% Asians/Indians - Unskilled 0.02 0% Whites - Skilled 21.46 12% Whites - Semi-Skilled 29.56 17% Whites - Unskilled 2.72 2% Total 176.65 100%

58
27 APPENDIX G: PRIMARY DATA
Table 30: Farming Production Cost for Wine Grapes for each of the Wine Regions for 2008 (Cost Items as Rand per Hectare)
Breedekloof Little Karoo Malmesbury Olifants River Orange River Paarl Robertson Stellenbosch Worcester Total
A. Direct Costs
- Seed 71 197 76 1 15 61 5 113 54 593 - Fertilizer 715 931 556 1 299 831 543 891 504 932 7 202 - Organic Material 483 245 86 119 118 67 224 26 379 1 747 - Pesticide Control 1 453 1 049 1 076 921 962 1 132 1 309 1 572 1 271 10 745 - Herbicide Control 508 182 249 261 381 368 500 445 578 3 472 - Repair and Building Material 155 114 59 159 113 83 138 301 169 1 291 Total Direct Costs 3 385 2 718 2 102 2 760 2 420 2 254 3 067 2 961 3 383 25 050
B. Labour Cost
- Supervision 1 081 741 332 509 583 1 027 811 2 219 1 261 8 564 - Permanent Labour 3 953 3 424 2 316 3 782 2 982 3 880 3 892 5 045 4 954 34 228 - Seasonal Labour and Contract Work 883 1 378 2 097 872 2 857 2 166 1 017 3 044 343 14 657 Total Labour Cost 5 917 5 543 4 745 5 163 6 422 7 073 5 720 10 308 6 558 57 449
C. Mechanization
- Fuel 1 308 1 545 1 111 1 687 1 826 1 365 1 204 1 561 1 461 13 068 - Repair, Parts and Maintenance 1 354 1 698 731 2 041 1 180 1 362 1 660 1 881 1 515 13 422 - License and Insurance 338 340 168 431 470 254 281 316 406 3 004 - Transport Hired 130 196 511 143 164 311 17 117 54 1 643 Total Mechanization Cost 3 130 3 779 2 521 4 302 3 640 3 292 3 162 3 875 3 436 31 137
D. Fixed Improvements - Repair and Maintenance 456 298 246 171 313 475 725 465 369 3 518 - Insurance 161 200 92 194 340 127 112 217 194 1 637 Total Fixed Improvement Cost 617 498 338 365 653 602 837 682 563 5 155
E. General Expenditure
- Electricity 1 092 775 273 1 037 419 756 1 031 625 910 6 918 - Water Costs 86 1 206 42 1 509 899 368 503 702 767 6 082 - Land, Property and Municipal Taxes 148 130 65 134 72 126 86 170 134 1 065 - Administration 754 928 429 791 1 002 921 819 2 316 662 8 622 Total General Expenditure 2 080 3 039 809 3 471 2 392 2 171 2 439 3 813 2 473 22 687
F. Provision for Renewal
- Vineyards 3 632 3 675 2 873 3 505 3 855 3 608 3 717 3 525 3 668 32 058 - Fixed Improvements 624 523 362 659 394 523 553 933 618 5 189 - Loose Assets or Production Means 2 299 3 009 1 151 3 589 2 775 2 187 2 477 2 824 2 287 22 598 Total Renewal Cost 6 555 7 207 4 386 7 753 7 024 6 318 6 747 7 282 6 573 59 845
Total Expenditure (Rand per ha) 21 684 22 784 14 901 23 814 22 551 21 710 21 972 28 921 22 986 201 323 Source: http://www.sawis.co.za/info/download/Produksiekoste_Breedekloof.pdf
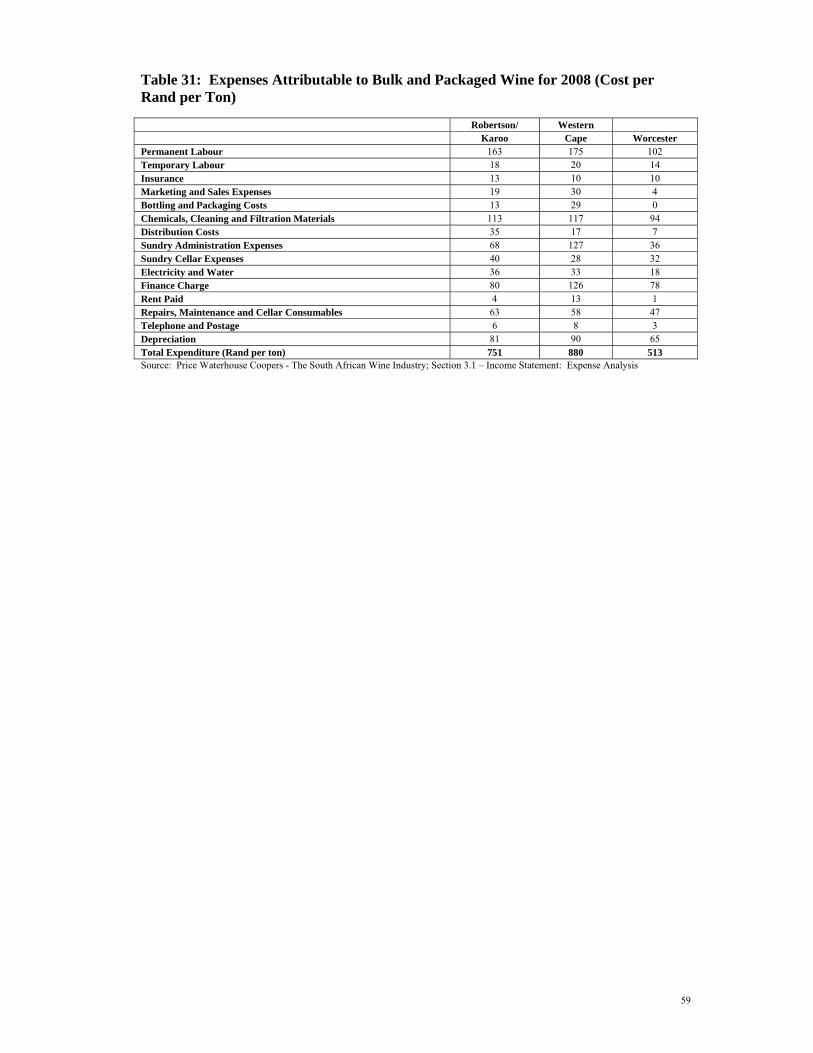
59
Table 31: Expenses Attributable to Bulk and Packaged Wine for 2008 (Cost per Rand per Ton)
Robertson/ Western Karoo Cape Worcester
Permanent Labour 163 175 102 Temporary Labour 18 20 14 Insurance 13 10 10 Marketing and Sales Expenses 19 30 4 Bottling and Packaging Costs 13 29 0 Chemicals, Cleaning and Filtration Materials 113 117 94 Distribution Costs 35 17 7 Sundry Administration Expenses 68 127 36 Sundry Cellar Expenses 40 28 32 Electricity and Water 36 33 18 Finance Charge 80 126 78 Rent Paid 4 13 1 Repairs, Maintenance and Cellar Consumables 63 58 47 Telephone and Postage 6 8 3 Depreciation 81 90 65 Total Expenditure (Rand per ton) 751 880 513 Source: Price Waterhouse Coopers - The South African Wine Industry; Section 3.1 – Income Statement: Expense Analysis
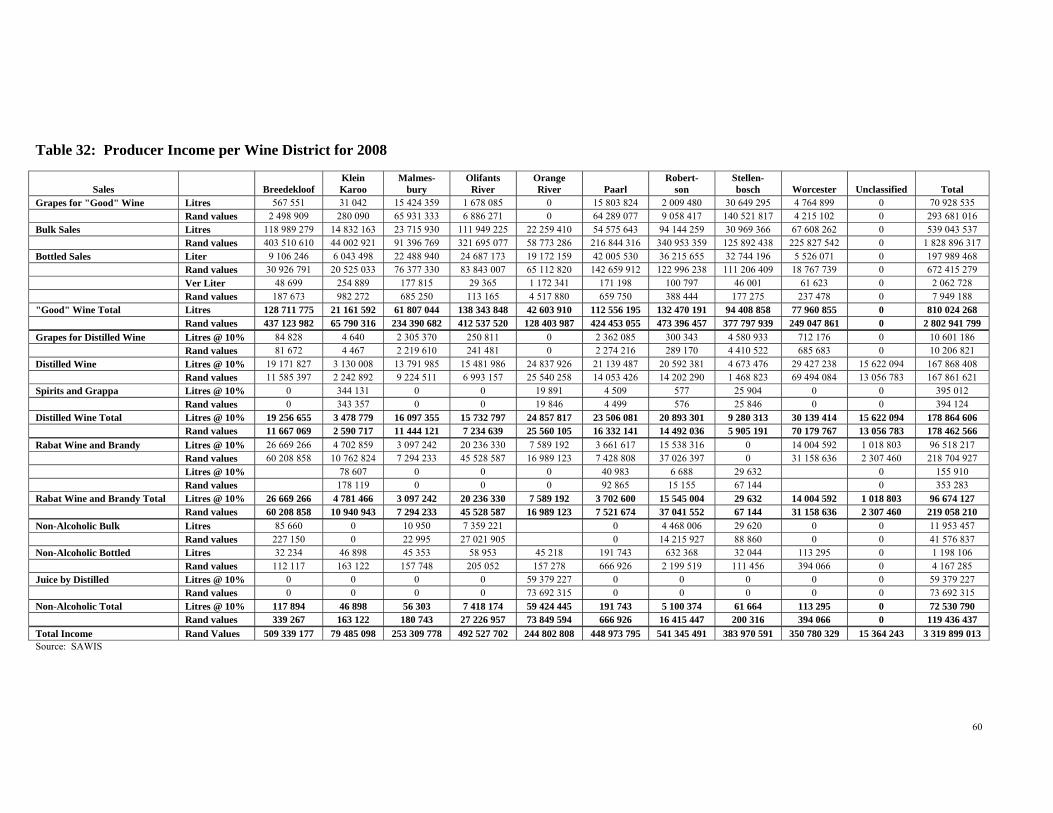
60
Table 32: Producer Income per Wine District for 2008
Sales Breedekloof Klein Karoo
Malmes- bury
Olifants River
Orange River Paarl
Robert- son
Stellen- bosch Worcester Unclassified Total
Grapes for "Good" Wine Litres 567 551 31 042 15 424 359 1 678 085 0 15 803 824 2 009 480 30 649 295 4 764 899 0 70 928 535 Rand values 2 498 909 280 090 65 931 333 6 886 271 0 64 289 077 9 058 417 140 521 817 4 215 102 0 293 681 016
Bulk Sales Litres 118 989 279 14 832 163 23 715 930 111 949 225 22 259 410 54 575 643 94 144 259 30 969 366 67 608 262 0 539 043 537 Rand values 403 510 610 44 002 921 91 396 769 321 695 077 58 773 286 216 844 316 340 953 359 125 892 438 225 827 542 0 1 828 896 317
Bottled Sales Liter 9 106 246 6 043 498 22 488 940 24 687 173 19 172 159 42 005 530 36 215 655 32 744 196 5 526 071 0 197 989 468 Rand values 30 926 791 20 525 033 76 377 330 83 843 007 65 112 820 142 659 912 122 996 238 111 206 409 18 767 739 0 672 415 279 Ver Liter 48 699 254 889 177 815 29 365 1 172 341 171 198 100 797 46 001 61 623 0 2 062 728 Rand values 187 673 982 272 685 250 113 165 4 517 880 659 750 388 444 177 275 237 478 0 7 949 188
"Good" Wine Total Litres 128 711 775 21 161 592 61 807 044 138 343 848 42 603 910 112 556 195 132 470 191 94 408 858 77 960 855 0 810 024 268 Rand values 437 123 982 65 790 316 234 390 682 412 537 520 128 403 987 424 453 055 473 396 457 377 797 939 249 047 861 0 2 802 941 799
Grapes for Distilled Wine Litres @ 10% 84 828 4 640 2 305 370 250 811 0 2 362 085 300 343 4 580 933 712 176 0 10 601 186 Rand values 81 672 4 467 2 219 610 241 481 0 2 274 216 289 170 4 410 522 685 683 0 10 206 821
Distilled Wine Litres @ 10% 19 171 827 3 130 008 13 791 985 15 481 986 24 837 926 21 139 487 20 592 381 4 673 476 29 427 238 15 622 094 167 868 408 Rand values 11 585 397 2 242 892 9 224 511 6 993 157 25 540 258 14 053 426 14 202 290 1 468 823 69 494 084 13 056 783 167 861 621
Spirits and Grappa Litres @ 10% 0 344 131 0 0 19 891 4 509 577 25 904 0 0 395 012 Rand values 0 343 357 0 0 19 846 4 499 576 25 846 0 0 394 124
Distilled Wine Total Litres @ 10% 19 256 655 3 478 779 16 097 355 15 732 797 24 857 817 23 506 081 20 893 301 9 280 313 30 139 414 15 622 094 178 864 606 Rand values 11 667 069 2 590 717 11 444 121 7 234 639 25 560 105 16 332 141 14 492 036 5 905 191 70 179 767 13 056 783 178 462 566
Rabat Wine and Brandy Litres @ 10% 26 669 266 4 702 859 3 097 242 20 236 330 7 589 192 3 661 617 15 538 316 0 14 004 592 1 018 803 96 518 217 Rand values 60 208 858 10 762 824 7 294 233 45 528 587 16 989 123 7 428 808 37 026 397 0 31 158 636 2 307 460 218 704 927 Litres @ 10% 78 607 0 0 0 40 983 6 688 29 632 0 155 910 Rand values 178 119 0 0 0 92 865 15 155 67 144 0 353 283
Rabat Wine and Brandy Total Litres @ 10% 26 669 266 4 781 466 3 097 242 20 236 330 7 589 192 3 702 600 15 545 004 29 632 14 004 592 1 018 803 96 674 127 Rand values 60 208 858 10 940 943 7 294 233 45 528 587 16 989 123 7 521 674 37 041 552 67 144 31 158 636 2 307 460 219 058 210
Non-Alcoholic Bulk Litres 85 660 0 10 950 7 359 221 0 4 468 006 29 620 0 0 11 953 457 Rand values 227 150 0 22 995 27 021 905 0 14 215 927 88 860 0 0 41 576 837
Non-Alcoholic Bottled Litres 32 234 46 898 45 353 58 953 45 218 191 743 632 368 32 044 113 295 0 1 198 106 Rand values 112 117 163 122 157 748 205 052 157 278 666 926 2 199 519 111 456 394 066 0 4 167 285
Juice by Distilled Litres @ 10% 0 0 0 0 59 379 227 0 0 0 0 0 59 379 227 Rand values 0 0 0 0 73 692 315 0 0 0 0 0 73 692 315
Non-Alcoholic Total Litres @ 10% 117 894 46 898 56 303 7 418 174 59 424 445 191 743 5 100 374 61 664 113 295 0 72 530 790 Rand values 339 267 163 122 180 743 27 226 957 73 849 594 666 926 16 415 447 200 316 394 066 0 119 436 437
Total Income Rand Values 509 339 177 79 485 098 253 309 778 492 527 702 244 802 808 448 973 795 541 345 491 383 970 591 350 780 329 15 364 243 3 319 899 013 Source: SAWIS
61
28 BIBLIOGRAPHY
JANA DU TOIT (2009). Wine Land. September 2009.
PRICE WATERHOUSE COOPERS (2009). The South African Wine Industry, August 2009.
SAWIS (2008). South African Wine Industry Statistics.
SOUTH AFRICAN RESERVE BANK (2008). Quarterly Bulletin, No. 249, June 2009.
SOUTH AFRICAN TOURISM (2005). 2010 Soccer World Cup Tourism Organising Plan.
SOUTH AFRICAN TOURISM (2008). 2008 Annual Tourism Report, South African Tourism Strategic Research Unit, July 2008.
STATISTICS SOUTH AFRICA (STATSSA) (2008). Gross Domestic Product, Annual estimates 1993 – 2007, Third Quarter: 2008.
VINPRO AND SAWIS (2009). South African Wine Harvest Report, 2009.

62
29 LIST OF INFORMATION SOURCES
Alcohol and Beverage Review – 2008
New Zealand Herald, May 23, 2009
Price Waterhouse Coopers: Benchmarking Survey, July 2008
South African Tourism: Strategic Research Unit
o Annual Tourism Report – 2008
o Domestic Tourism Reports – 2008
o Sports Tourism Special Report on Soccer 2010 – 2005
South African Wine Industry Directory, 2009/10
Statistics South Africa; Publication no. P6241-1
SAWIS; South African Wine Industry Statistics – 2008
Wineland Magazine (incorporating Wine farmer); Wineland; September 2009
Die Burger
o Sake Burger; 23 July 2009
o Sake Burger; 08 September 2009
Websites used for information retrieved
o Vinpro: www.vinpro.co.za
o Wines of South Africa (WOSA): www.wosa.co.za
o South African Tourism: www.southafrica.net/research
o StatsSA interactive data retrieval: www.statssa.gov.za
o SAWIS: www.sawis.co.za/statistics
o Wynboer: www.wynboer.co.za/recentarticles
www.agriworldsa.com