SOUTH AFRICAN INNOVATION SCORECARD FRAMEWORK
83
1 SOUTH AFRICAN INNOVATION SCORECARD FRAMEWORK Report to National Advisory Council on Innovation Professor Anastassios Pouris Director: Institute for Technological Innovation University of Pretoria South Africa February 2016
Transcript of SOUTH AFRICAN INNOVATION SCORECARD FRAMEWORK

1
SOUTHAFRICANINNOVATIONSCORECARDFRAMEWORK
Report to National Advisory Council on Innovation
Professor Anastassios Pouris Director: Institute for Technological Innovation
University of Pretoria South Africa
February 2016

2
Contents
Tables ................................................................................................................................. 4
Figures ................................................................................................................................ 4
Glossary.............................................................................................................................. 5
Executive Summary ............................................................................................................ 6
1. Towards the development of Composite Innovation Indicators for South Africa ........ 11
1.1 Introduction ........................................................................................................... 11
1.2 Overview ................................................................................................................ 12
2. Composite International Innovation Indices Covering South Africa and partial
Indicators ................................................................................................................... 21
2.1 Introduction ........................................................................................................... 21
2.2 The Global Innovation Index ................................................................................. 21
2.3 Innovation Union Scoreboard ............................................................................... 24
2.4 The Abu Dhabi Innovation Index ........................................................................... 29
2.5 Bloomberg Innovation Index (2015) ...................................................................... 32
2.6 Global Talent Index ................................................................................................ 33
2.7 Composite Indicator for Knowledge Transfer ....................................................... 36
2.8 Composite Indicator for Knowledge Intensive Economy ...................................... 39
2.9 Global Competitiveness Index ............................................................................... 41
2.10 Recommendations ................................................................................................. 44
3. Knowledge Based Economy‐ SA Indicators ................................................................. 47
3.1 Introduction ........................................................................................................... 47
3.2 The Importance of Knowledge for Growth ........................................................... 48
3.3 Measuring the Knowledge Economy ..................................................................... 50
3.4 The Size and Growth of the South African Knowledge Economy ......................... 51
3.5 Recommendations ................................................................................................. 56
4. South Africa Innovation Scoreboard 2010‐14 ............................................................. 57
4.1 Introduction ........................................................................................................... 57
4.2 Measurement Framework ..................................................................................... 57
4.3 Data Sources and Approach .................................................................................. 59

3
4.4 South African Performance ................................................................................... 61
4.5 Discussion and Recommendations ........................................................................ 63
Appendice ........................................................................................................................ 65
Appendix 1: South Africa‐ Detailed Profile 2013 GII ......................................................... 65
Appendix 2: Rankings of resource rich economies according to five pillars (Capacities
and Performance) ‐ Abu Dhabi Innovation Index ............................................................. 68
Appendix 3: Detailed values of SA innovation indicators‐Abu Dhabi Innovation Index .. 73
Appendix 4: Global Competitiveness Indicator‐South Africa ........................................... 76
Appendix 5: Economic gains from Research and Development ....................................... 79
References........................................................................................................................ 81

4
Tables
Table 1: Composite indicators in various areas (OECD 2003) ................................................. 12
Table 2: GII: main scores for South Africa 2014 ...................................................................... 23
Table 3: South Africa‐ Global Innovation Index 2009‐2014 ..................................................... 23
Table 4: IUS values and performance of international competitors of EU (including SA) ...... 27
Table 5: Capacity and performance indicators Abu Dhabi Innovation Index .......................... 30
Table 6: South African rankings in capacity and performance ‐ Abu Dhabi Innovation Index 32
Table 7: SA Rankings in Bloomberg Innovation Index ............................................................. 33
Table 8: Indicators and Sources‐Global Talent Index .............................................................. 34
Table 9: South African scores‐Global Talent Index .................................................................. 35
Table 10: Proposed component indicators for knowledge transfer ........................................ 37
Table 11: Indicators on the size of knowledge economy ........................................................ 41
Table 12: Number of indicators, number of pillars and SA ranking ........................................ 43
Table 13: Value added of Knowledge and Technology Intensive industries in South Africa’s
GDP .......................................................................................................................................... 52
Table 14: Value added of KTI industries to GDP. Selected countries 2012 ............................. 52
Table 15: Indicators used in the development of the South Africa Innovation Scoreboard ... 59
Table 16: Performance Score per Indicator ............................................................................. 61
Figures
Figure 1: SA Innovation rankings in Global Innovation Index .................................................. 15
Figure 2: System of Innovation Framework ............................................................................. 16
Figure 3: Indicators of the System of Innovation Framework ................................................. 17
Figure 4: The Structure of Global Innovation Index ................................................................ 22
Figure 5: Measurement Framework of the Innovation Union Scoreboard ............................. 26
Figure 6: Performance comparisons IUS: EU‐SA indicators ..................................................... 28
Figure 7: Comparisons IUS: EU and competing economies ..................................................... 29
Figure 8: Diagrammatic exposition of composite indicator technology transfer .................... 38
Figure 9: Architecture of composite indicator knowledge based economy ........................... 41
Figure 10: Radar Diagram of pillars of SACKI 2014 .................................................................. 55
Figure 11: Radar Diagram of Indicators of SACKI 2014 ............................................................ 55
Figure 12: Summary Innovation Index (SII) .............................................................................. 58
Figure 13: Performance of Innovation dimensions 2010‐14 ................................................... 62

5
Glossary
BRIC Brazil, Russia, India, China CIA Central Intelligence Agency DST Department of Science and Technology EC European Commission EFTA European Free Trade Association EIU Economist Intelligence Unit EPO European Patent Office EU European Union FDI Foreign Direct Investment GDP Gross Domestic Product GII Global Innovation Index GTI Global Talent Index HEI Higher Education Institution ICT Information and Communication Technologies INSEAD Institut Européen d'Administration des Affaires IUS Innovation Union Scoreboard JRC Joint Research Center KTI knowledge and technology intensive KWh Kilo Watt hour NACI National Advisory Council on Innovation OECD Organisation for Economic Cooperation and Development PRO Public Research Organisation QS Quacquarelli Symonds R&D Research and Development SA South Africa SACKI South African Composite Knowledge Index SET Science, Engineering and Technology UNDP United Nations Development Program UNESCO United Nations Educational, Scientific and Cultural Organization USPTO United States Patents and Trademark Office US$ United States Dollar VA Value added WIPO World Intellectual Property Organisation

6
ExecutiveSummary
This report has been developed on the request of the National Advisory Council on Innovation
with the objective of developing composite innovation indicators for South Africa. Composite
indicators are synthetic indices used for the monitoring and performance assessment of
complex phenomena internationally. They are also valued for the opportunities they provide
to get insights in the driving forces of the composite indicators and for setting innovation in
the political agenda.
The report consists of three chapters. The first chapter “Towards the development of
composite innovation indicators for South Africa” provides an overview of the issues
surrounding composite indicators; it provides information related to the evolution of
composite indicators; their strengths and challenges; it describes a South African relevant
effort and discusses the methodological approaches used in the development of composite
indicators.
A number of composite indices are described as well. The indices described have been chosen
on the basis of their reputation, representativeness, currency and possible usefulness for
South Africa policy. The indices are the Global Innovation Index produced by Johnson Cornell
University, INSEAD and World Intellectual Property Organisation (WIPO); the Innovation
Union Scoreboard produced by the European Commission; the Abu Dhabi Innovation Index
produced by the Department of Economic Development, Abu Dhabi and the Bloomberg
Innovation Index produced by Bloomberg LP.
A number of indicators covering partially the innovation process (partial composite
innovation indicators) are outlined. Partial indicators have the advantage that they can focus
in a particular component of the innovation system and provide in depth understanding and
coverage. Examples are the Global Talent Index produced by the Economist Intelligence Unit,
the Composite Indicator for Knowledge Transfer produced by the expert group of the
European Commission and the composite indicator of the Size of Knowledge Based Economy
produced by the Joint Research Center of the European Commission. The Global
Competitiveness Indicator is also described as a number of its pillars are innovation related.
The chapter concludes that composite innovation indicators are used internationally as they
provide valuable insights in the innovation process and that NACI can benefit from the use of
such indicators. The chapter recommends the development of South African partial
innovation indicators and inter‐temporal ones.
Chapter 2 “Knowledge based Economy‐SA Indicators” elaborates on the knowledge economy
and it develops a number of indicators measuring the size of the South African knowledge

7
economy. One definition states that a knowledge‐based economy is one that has an economic
incentive and institutional regime that stimulates the acquisition, creation, dissemination and
use of knowledge and information to improve its growth and welfare, as well as effective
systems of education and skills, information and communication technology, research and
development (R&D) and innovation. It is argued that both theoretical and empirical evidence
points to the fact that knowledge based factors affect economic growth.
For the purposes of this investigation two approaches are used. In the first approach the
industry‐based approach of OECD is used in order to measure the size of the South African
knowledge economy, changes of its size over time and its comparison with other countries.
The approach involves the estimation of the value addition of the knowledge and technology
intensive industries and services in the country’s GDP. Knowledge Intensive services include
education, health, business, financial and communications services. High technology
manufacturing industries include aerospace, communications and semiconductors,
computers and office machinery, pharmaceuticals and scientific instruments and measuring
equipment.
The ratio of value added of knowledge and technology intensive industries to GDP in South
Africa moved from 0.16 in 1997 to 0.20 during 2007 and has been stabilised to 0.19 during
the most recent years. However, the ratio does not compare favourably with those of a
number of other countries. The indicator is half of the relevant contribution of the index in
the USA and below that of other countries like Korea, China and Turkey.
The second approach involves the development of a composite indicator of the knowledge
based economy for South Africa. The Index is based on the World Bank methodology (basic
scorecard) and the normalisation of the constituent indicators is such that comparisons are
valid over time.
Figure I shows the performance of the three pillars of the South African Composite Knowledge
Index for 2014. The pillars show that the improvements are highest in ICT infrastructure and
lowest in education and training.
The South African Composite Knowledge Index for 2014 with base 2010 is 28.5 which can be
interpreted as an improvement in the indicator of 28.5% over the 5 year period.
The chapter suggest that these indicators make a contribution to the understanding of the
knowledge economy in South Africa and it is recommended that NACI monitors them
regularly (e.g. annually). Furthermore, it is suggested that a relevant indicator with policy
implications is “investments in the knowledge economy”. The indicator has been
recommended by the European Commission (2003). It monitors investments in research and

8
development (including tax investments); embodied technology; investment in information
technology; funding of higher education, venture capital and others. It is recommended that
NACI includes the development of that indicator in the set of indicators monitoring the
knowledge based economy.
Figure I: Radar Diagram of Pillars of SACKI 2014
The third chapter, “SA Innovation Scoreboard 2014”, develops a composite innovation
indicator for SA which provides an overtime assessment of the research and innovation
performance of the country and the relative strengths and weaknesses of its research and
innovation system. It aims to help decision makers to assess areas in which they need to
concentrate their efforts in order to boost the country’s innovation performance.
Innovation performance is measured using a composite indicator which summarizes the
performance of a range of different indicators. The SA Innovation Scoreboard distinguishes
between 3 main types of indicators – Enablers, Firm Activities and Outputs – and 7 innovation
dimensions (i.e. human resources; open excellent research system; finance and support; firm
investments; linkages & entrepreneurship; intellectual assets and economic effects). The total
of 15 indicators (with completed data) is used.
Figure II shows the performance of the three innovation dimensions: “Outputs” exhibits
higher growth than the “Enablers” and the “Firm Activities” shows a negative growth. The SA
composite innovation indicator 2014 with base 2010 is 0.11.
0
10
20
30
40
50ICT
EducationInnovation
SACKI Pillars 2014
Pillars
9
Figure II: Performance of Innovation dimensions 2014
At this level attention is required in the performance of firm activities.
The main findings and recommendations of the report are as follows:
1. International composite indicators are used internationally and can be utilised in
order to inform NACI about the country’s relevant innovation position over time and
internationally. The Global Innovation Index and the Innovation Union Scoreboard
are important in the international context. A document focused on South Africa
should be produced regularly describing the country’s performance in those
indicators together with clarifications and the possible shortcomings of the indices.
The document should be written in a way that can be understood by non experts in
the field of innovation and indicators.
2. The “South African Composite Indicator” has been developed in order to monitor the
performance of the national system of innovation over time. The Indicator has been
developed in accordance with the international standards taking care that the
normalization process maintains comparability over time. The indicator should be
expanded to cover a period of at least ten years (since 2000) and use the currently
available variables in the country. Similarly the indicator should be updated regularly.
3. The “South African Composite Indicator” should be expanded in order to fulfil the
monitoring needs of the country and NACI. Suggested additions include:
a sub‐pillar under “Outputs” covering “social effects”;
a variable under “open, excellent research systems” covering non SA doctorate
students;
a variable under “linkages and entrepreneurship” covering business support for
university research;
‐0.050
0.050.1
0.150.2Enablers
Firm ActivitiesOutputs
South African Innovation Performance Growth 2010‐2014

10
addition of USPTO patents as their statistics are updated faster than PCT statistics.
4. Partial innovation indicators are particularly useful for addressing issues of priority in
the policy community and the decision makers. In this document we have described
selectively indicators related to Knowledge Intensive Economy; to Technology
Transfer from the universities and research organisations and related to Human
Talent. In this context a composite indicator related to the knowledge based economy
for South Africa has been developed. The development of additional partial indicators
should follow (e.g. for technology transfer; human talent; manufacturing
competitiveness etc) as they can provide valuable insights for policy development.
5. A number of international composite indicators include South Africa. However, often
the developers do not have access to all South African data. NACI should monitor
these efforts and offer to provide the missing indicators. Similarly, the locally
developed indicators can be improved with the addition of variables which are not
currently available. For example, the SA innovation surveys are not currently
available. NACI should monitor and advice that efforts to provide relevant
information should be available and up to date.

11
1. TowardsthedevelopmentofCompositeInnovationIndicatorsforSouthAfrica
1.1 Introduction
Composite indicators are synthetic indices of individual variables and are increasingly being
used to rank countries in various performance and policy domains. Probably the most well
known composite indicator is the Gross Domestic Product (GDP). Composite indicators are
useful as they are able to integrate large amounts of information into easily understood
formats and are valued as a communication and political tools.
This report has been developed on the request of the National Advisory Council on
Innovation. It aims to set the scene for the development and monitoring of composite
indicators assisting NACI’s efforts to assess and provide advice related to the national system
of innovation.
The first chapter provides an overview of the issues surrounding composite indicators The
Overview provides information related to the evolution of composite indicators; their
strengths and challenges; it describes a South African relevant effort and discusses the
methodological approaches used in the development of composite indicators.
A number of composite indices are described in the second section “Composite Innovation
Indices”. The indices described have been chosen on the basis of their reputation,
representativeness, currency and possible usefulness for South Africa policy. The indices are
the Global Innovation Index produced by Johnson Cornell University, INSEAD and WIPO; the
Innovation Union Scoreboard produced by the European Commission; the Abu Dhabi
Innovation Index produced by the Department of Economic Development Abu Dhabi and the
Bloomberg Innovation Index produced by Bloomberg LP. There are a number of other
indicators covering partially the innovation process. In this section we also describe the Global
Talent Index produced by the Economist Intelligence Unit, the Composite Indicator for
Knowledge Transfer produced by the expert group of the European Commission and the
composite indicator of the Size of Knowledge Based Economy produced by the Joint Research
Center of the European Commission. The Global Competitiveness Indicator is also described
as a number of its pillars are innovation related.
It should be emphasised that this is a selection of indicators and that a variety of other
indicators exist in the literature. Examples include the Knowledge Economy Index of the
World Bank (KAM 2012); the UNDP Technology Achievement Index (Desai et al 2001) and
12
others. The chapter ends with a summary and findings related of the indicators described.
The final section develops a number of recommendations for the way ahead.
1.2 Overview
The development of composite indicators is a relatively recent phenomenon even though the
measurement of science and technology has a relatively long history. Godin (2007) suggests
that from its very first edition (OECD 1963), the Frascati manual suggested that a complete
set of statistics and indicators, covering both input and output, was necessary to properly
measure science. The two output indicators suggested were patents and payments for
patents, licensing and technical know‐how. From 1981, the manual discussed five indicators:
(1) Outputs: innovation, patents;
(2) Impacts: technological receipts and payments, high technology trade, and productivity.
A search in the Web of Knowledge for articles with the words “composite indicator”in the title
identified that there were only a couple of relevant articles annually during the eighties. This
number increased to 20 per year in the more recent years. The majority of the articles
published are related to business economics (McGillivray M 1991; Tkacova, A. 2012) and
environmental sciences (Otoiu, A; Titan, E; Dumitrescu, R. 2014; Powell, H; Lee, D. 2014).
Table 1 provides a list of composite indicators in the various areas as was compiled by OECD
(2003).
Innovation as a complex phenomenon has also attracted the attention of researchers
(Archibugi 2004; Grupp 2010). Innovation has a multidimensional character and cannot be
measured with a simple variable. For example, how a country with high number of research
publications and low number of patents can be assessed? To put it differently innovation
indicators are statistics that describe various aspects of innovation. Individual indicators such
as money spend on research and development; number of publications produced; number of
patents; value of high technology exports etc are generally partial, that is, they do not
measure innovation as a whole.
Table 1: Composite indicators in various areas (OECD 2003)

13
Composite indicators can combine (aggregate) a number of variables into a single valued
metric. During 2008 the OECD (2008) produced the “Handbook on constructing composite
indicators – methodology and user guide” providing guidance for the development of relevant
indicators.
It should be emphasised that the development of composite indicators arise from the need
to measure innovation and its multidimensional character. As it is widely believed that
technological Innovation is one of the main drivers of sustained economic growth, if not the
single most important driver, governments develop relevant policies and strategies. In order
to design and evaluate policies that are effective and efficient in stimulating innovation, it is
necessary to have adequate knowledge of the subject (i.e. innovation) that is being
addressed.

14
Relevant questions often asked include: how innovative is a country and how it compares
with other countries? Are the innovation inputs adequately transformed into outputs
(transformation efficiency)? Which innovation components need further support? And so on.
These types of questions can be answered only if innovation can be measured.
The composite indicators can measure multidimensional concepts which cannot be captured
by a single indicator, e.g. competitiveness, industrialisation, sustainability, single market
integration, knowledge‐based society, etc. Composite indicators are not without their
shortcomings. OECD has summarised their advantages and shortcomings as in Box 1.
BOX 1. Pros and Cons of Composite indicators
Pros: Cons:
• Can summarise complex, multi‐dimensional realities with a view to supporting decision makers. • Are easier to interpret than a battery of many separate indicators. • Can assess progress of countries over time. • Reduce the visible size of a set of indicators without dropping the underlying information base. • Thus make it possible to include more information within the existing size limit. • Place issues of country performance and progress at the centre of the policy arena. • Facilitate communication with general public (i.e. citizens, media, etc.) and promote accountability. • Help to construct/underpin narratives for lay and literate audiences. • Enable users to compare complex dimensions effectively.
• May send misleading policy messages if poorly constructed or misinterpreted. • May invite simplistic policy conclusions. • May be misused, e.g. to support a desired policy, if the construction process is not transparent and/or lacks sound statistical or conceptual principles. • The selection of indicators and weights could be the subject of political dispute. • May disguise serious failings in some dimensions and increase the difficulty of identifying proper remedial action, if the construction process is not transparent. • May lead to inappropriate policies if dimensions of performance that are difficult to measure are ignored.
Source: OECD 2008
A number of researchers (Grupp et al 2010) have argued that more information can be
provided if the utmost aggregation level is a “spider” diagram which brings indexed indicator
scores from various countries or components into one picture.

15
Figure 1: SA Innovation rankings in Global Innovation Index
For example, figure 1 shows the South African country rankings according to main innovation
pillars (sub indices) in the Global Innovation Index (2013). The figure shows that South Africa
is ranked 16th in the World in the pillar “market sophistication” and 44th in the pillar
“institutions”. However, the country is ranked 102 in the pillar “Human capital and Research”;
83rd in “infrastructure” and 79th in “knowledge and technology outputs”. It should be
mentioned that South Africa is ranked 58th (out of 142 countries) overall in the Global
Innovation Index.
It should be emphasised that country rankings do not necessary reflect changes in the
underlying forces in a particular country. Changes may have occurred because of variations
in the indicators in the comparator countries. However, such rankings have value on a
comparative basis.
Of importance in the development of composite indicators are the concepts of theoretical
framework underpinning the indicator; the normalisation procedure; the aggregation
approach and the weighs to be utilised.
121416181
101121141
human capital
creativeoutput
businesssophistication
knowledgeand tech
institutions
market soph
Infrastructure
Spider Diagram Rankings
Ranking

16
A theoretical framework is required in order to clarify the multidimensional phenomenon to
be measured, identify the sub‐groups of the phenomenon and provide the basis for the
selection and combination of single indicators into a meaningful composite indicator under a
fitness‐for‐purpose principle.
A possible framework appears in figure 2. The framework shows that SET human capital,
current R&D capacity and imported know‐how combine to create “technical progress” which
in turn improves business performance, creates wealth and improves quality of life.
Figure 2: System of innovation framework
(Source: DST 2002)
For each of the driving blocks (pillars) in figure 1, individual indicators/variables should be
identified. For example, imported know‐how can be imported through foreign direct
investments; leasing and/or acquisition of foreign know how (e.g. patents); foreign
consultants; emigration of specialists into the country; modern equipment from abroad and
similar.

17
Figure 3: Indicators of the System of Innovation Framework
(Source: DST 2002)
Figure 3 shows the indicators proposed in the DST (2002). It interesting to note that for the
quality of life measurement was proposed the Technology Achievement Index1 – a composite
1 The Technology Achievement Index originally was proposed in 2002 (Desai et al 2002) in order to assess the national technological capability of a country. It is a relatively simple composite indicator. The Index has four dimensions and each dimension is specified by two sub‐indicators. The four dimensions and sub‐indicators are as follows:
Creation of Technology: patents granted to residents (per million people)
Receipts of royalties and license fee (US $ per person)
Diffusion of recent innovations: Internet users (per 1000 people)
High technology exports (% of manufacturing exports)
Diffusion of old technologies: Electric power consumption (KWh/ capita)
Telephone mainlines and cellular subscribers (per 1000 people)
Human skills development: Gross enrolment ratio at all levels (except pre‐primary)

18
indicator. The R&D Strategy further refers to comparisons with Australia, South Korea and
Malaysia. The Strategy does not mention an indicator for “technology based growth”
although technology based GDP may be measured as a sub‐indicator of GDP (also a composite
indicator). Simialrly the report does not set relative weights and does not refer to aggregation
of the variables.
Giampietro et al. (2004) notice that in complex issues the ‘quality’ of the theoretical
framework depends on “three crucial challenges for the scientific community”:
1. “the feasibility of the effect of the proposed [framework] in relation to different
dimensions (technical, economic, social, political, cultural) and different scales: local
(e.g. technical coefficients), medium (e.g. aggregate characteristics of large units) and
large scales (e.g. trend analysis and benchmarks to compare trajectories of
development)….
2. Address several legitimate (and often contrasting) perspectives found among
stakeholders on how to structure the problem….
3. Handle in a credible way the unavoidable degree of uncertainty, or even worst,
genuine ignorance associated to any multi‐scale, multi‐dimensional analysis of
complex adaptive systems.”
Normalization serves primarily the necessity to bring the various indicators to the same unit,
in order to avoid adding up apples and pears. Indicators in a dataset are incommensurate with
each other and/or have different measurement units hence, the need for normalization.
Through normalization all variables are transformed into pure, dimensionless numbers. There
are a number of normalization methods available, such as ranking, standardization, re‐scaling,
distance to reference country/year, categorical scales, cyclical indicators; balance of opinions;
percentage of annual differences over consecutive years etc.
Aggregation refers to the way the sub‐indicators are combined to create a composite
indicator. There is a variety of aggregation techniques utilised in the literature. The most often
used are additive techniques that range from summing up country ranking in each sub‐
indicator to aggregating weighted transformations of the original sub‐indicators. Other
techniques used include multiplicative or geometric aggregations or non linear aggregations.
Gross enrolment ratio in science, engineering, manufacturing
and construction (tertiary)

19
The simplest additive aggregation method entails the calculation of the ranking of each
country according to each sub‐indicator and the summation of resulting ranking. Its
advantages are simplicity and the independence to outliers. Its disadvantage is that the
method loses the absolute value information.
By far the most widespread linear aggregation is the summation of weighted and normalized
sub‐indicators.
It should be emphasised that the normalisation across the various indicators and across the
various countries has the result that the numerical values of the composite indicators are not
directly comparable from one year to the next. This means that time series of the composite
score are not directly comparable within each country; however, countries can use the
composite scores to compare their own performance over time with that of other countries.
Different approaches (one stage normalisation) are used when comparisons over time are
required.
Variables which are aggregated in a composite indicator have first to be weighted. The
weights given to different variables influence the outcomes of the composite indicator. As
theoretical frameworks for deriving coherent weighting approaches are difficult to construct,
in many composite indicators, all variables are given common weights largely for reasons of
simplicity. Allocating equal weights to all sub‐indices or sub‐components implies that each
grouping of indicators has the same impact on the performance being measured.
OECD (2003) suggests that “Greater weight should be given to components which are
considered to be more significant in the context of the particular composite indicator.”
There is a variety of approaches for identifying weight. For example economic theory and/or
empirical analysis could be used in order to determine weights. Weights can also be set based
on correlation coefficients between indicators and a dependent variable such as economic
growth. Another approach is to give less weight to variables that suffer most from missing
values in the attempt to partially correct for data problems.
Weights can also be decided based on the opinions of experts who understand the strengths
and weaknesses of the indicators within a given theoretical framework (e.g. EC 2004; ONS
2002). Weights based on expert opinion are likely to increase the legitimacy of the composite
indicator and create a forum of discussion around which to form a consensus for policy action.
Weights based on expert opinions have certain shortcomings. For example, weights will
reflect national conditions and there will not be valid for other countries. Simialrly, the
weights may not measure the importance of each sub‐indicator but they may measure the
urgency or need for political intervention.

20
An issue that should be taken into consideration is the understanding of implicit shadow
prices. A shadow price is a price of one good in terms of the other. A shadow price in the case
of a composite indicator would have an interpretation as a compensating variation (Munda
et al 2009). In other words the issue is if one indicator e.g. SA patents decreases by one unit
how much extra R&D expenditures are required to increase in order to keep the value of the
composite indicator unchanged. Grupp et al (2010) discuss the issue of shadow prices and
their economic plausibility. They provide examples by estimating the number of additional
people with tertiary education needed in order to compensate the loss of 1 US patent per
annum in the European Innovation Scoreboard 2005. Both variables ‐ US patents and the
number of population with tertiary education ‐ are constituents of the selected composites.
The former is the number of US patents per million of inhabitants. The latter measures the
number of people with tertiary education per 100 inhabitants aged between 25 and 64. The
authors use as an example Spain and they estimate that Spain will need 1725 additional
academic people to compensate for the loss of one US patent. Obviously it will be cheaper to
protect the patents than try to replace them with additional academics.
In summary, composite indicators are used internationally to measure complex phenomena.
Composite indicators are valued for their ability to rank countries and for the opportunities
they provide to get insights in the driving forces of the composite indicators.
The South Africa’s “National Research and Development Strategy” during 2002 provided an
innovation framework and included implicitly two composite indicators – the technology
achievement index and a subcomponent of the GDP (technology based growth).
The development of composite indicators requires a theoretical framework underpinning the
indicator; a normalisation procedure; an aggregation approach and the estimation of weighs
to be utilised. Each of the above issues represents particular technical challenges and
interpretations.
Policy makers have to make decisions related to the phenomenon within the innovation chain
that they would like to monitor (scope of indicator e.g. progress towards a knowledge
intensive society; technology transfer; talent development etc.) and they may need to assist
in the development of weights in the level of pillars and individual indicators.

21
2. CompositeInternationalInnovationIndicesCoveringSouthAfricaandpartialIndicators
2.1 Introduction
This chapter describes a number of composite indicators and positions South Africa when
available. The indicators can be distinguished in complete composite indicators and partial
ones. The partial indicators describe a particular component/phenomenon (e.g. technology
transfer from the science base to industry/private sector) within the innovation system. The
Global Competitiveness Indicator produced by The World Economic Forum is also described.
The Global Competitiveness Indicators is a competitiveness indicator. However four of its 12
pillars are innovation related.
2.2 The Global Innovation Index
The Global Innovation Index (Johnson Cornell University, INSEAD, WIPO 2014) was launched
by INSEAD in 2007. Its objective was to find metrics and approaches that capture the richness
of innovation better than the single indicators do. During 2015 the GII covered 143 countries.
The Global Innovation Index 2015 (GII), in its 8th edition, is co‐published by Cornell University,
INSEAD, and the World Intellectual Property Organization (WIPO), an agency of the United
Nations.
GII conceptual framework is encapsulated in two sub‐indices – the “Innovation Input sub
Index” and the “Innovation Output sub Index” (Figure 4). The input Index is made out of four
pillars: institutions (political, regulatory, business); human capital research (education,
tertiary education; R&D); infrastructure (ICT, general infrastructure; ecological sustainability);
and market sophistication (knowledge workers; innovation linkages; knowledge absorption).
The innovation output sub‐index is made out of two pillars: knowledge and technology
outputs (knowledge creation; knowledge impact; knowledge diffusion) and creative outputs
(intangible assets; creative goods and services; online creativity). A total of 56 variables are
hard (quantitative) data; 20 are composite indicators from international agencies and 5 are
survey questions from the World Economic Forum’s
Executive Opinion Survey (81 variables). Candidate indicators were selected for their
relevance to a specific innovation pillar on the basis of literature review, expert opinion,
country coverage, and timeliness.

22
Figure 4: The Structure of Global Innovation Index
(Source: Johnson Cornell University, INSEAD, and WIPO 2014)
The GII is presented as three indices and one ratio:
1. The Innovation Input Sub‐Index is the simple average of the first five pillar scores.
2. The Innovation Output Sub Index is the simple average of the last two pillar scores.
3. The Global Innovation Index is the simple average of the Input and Output Sub‐
Indices.
4. The Innovation Efficiency Ratio is the ratio of the Output Sub Index over the Input
Sub‐Index.
The overall GII score is the simple average of the Input and Output Sub‐Indices.
The 84 indicators were normalized into the [0, 100] range, with higher scores representing
better outcomes. Normalization was made according to the min‐max method, where the min
and max values were given by the minimum and maximum indicator sample values
respectively, except for index and survey data, for which the original series’ range of values
was kept as min and max values.

23
Table 2: GII: main scores for South Africa 2014
Indicators Score Rank (out of 143)
Global Innovation Index 38.2 53
Innovation Input sub index 30.9 63
Innovation Output sub Index 45.6 47
Innovation Efficiency Ratio 0.70 93
Global Innovation Index 2013 37.6 58
Institutions 69.9 44
Human capital & research 28.7 70
Infrastructure 32.9 84
Market Sophistication 63.8 18
Business Sophistication 32.7 68
Knowledge & technology outputs 29.1 62
Creative Outputs 32.7 70
The table 2 shows South Africa’s scores and rankings during 2014 Table 3: South Africa‐ Global Innovation Index 2009‐2014
Year South Africa Ranking
2014 53
2013 58
2012 54
2011 59
2010 51
2009 43
Table 2 shows the scores received by South Africa and the country’s ranking for each
component. The country ranks 53 (2014) in the Global Innovation Index. In the output sub‐
index the country ranks better (47) than in the input sub‐index (63) indicating that the country
is able to transform successfully inputs into outputs. It should be emphasised that the country
ranking ratios inputs/outputs may be different than the innovation efficiency ratio as
different countries may have different propensities to transform inputs into outputs and/or
different emphasis in inputs and outputs. In “human capital and research” South Africa is
ranked 70th out of 143 countries.
Table 3 shows the South African ranking for the period 2009 to 2014. The country’s ranking
ranges from 43rd during 2009 to 59th during 2011.

24
Appendix 1 provides detailed information related to South Africa. Five indicators in the
beginning of the table aim to put the country into perspective. The next section provides the
economy’s scores and rankings on the Global Innovation Index, the Innovation Input Sub‐
Index, the Innovation Output Sub Index, and the Innovation Efficiency Ratio. Pillars are
identified by single digit numbers, sub‐pillars by two digit numbers, and indicators by three‐
digit numbers. The 2013 GII includes 84 indicators and three types of data. Composite
indicators are identified with an asterisk (*), survey questions from the World Economic
Forum’s Execu ve Opinion Survey are iden fied with a dagger (†), and the remaining
indicators are all hard data series.
The following indicators were missing from the South African data:
Public expenditure/pupil, % GDP/cap
School life expectancy , years
PISA scales in reading, maths, & science
Tertiary enrolment, % gross
Graduates in science & engineering,
Tertiary inbound mobility, %
Madrid trademark registrations/bn PPP$ GDP
Domestic res utility model ap/bn PPP$ GDP
Audio ‐visual & related services exports, %
2.3 Innovation Union Scoreboard
The Innovation Union Scoreboard is an instrument of the European Commission developed
under the Lisbon Strategy (2001) and revised after the adoption of the Europe 2020 Strategy
to provide a comparative assessment of the innovation performance of EU Member States.
Together with the Regional Innovation Scoreboard and the pilot European Public Sector
Innovation Scoreboard, it forms a benchmarking and monitoring system of research and
innovation trends and activities in Europe.
The Innovation Union Scoreboard gives a comparative assessment of the innovation
performance of the EU27 Member States and the relative strengths and weaknesses of their
research and innovation systems. It monitors innovation trends across the EU27 Member
States, as well as Croatia, Iceland, the Former Yugoslav Republic of Macedonia, Norway,

25
Serbia, Switzerland and Turkey. It also includes comparisons between the EU27 and 10 global
competitors (including South Africa).
Originally a list of 29 indicators was used. The list used in EIS 2009 has been replaced with a
new list of 25 indicators (Hollanders et al 2011).
The measurement framework used in the Innovation Union Scoreboard distinguishes
between 3 main types of indicators and 8 innovation dimensions, capturing in total 25
different indicators (figure 5)
The Enablers capture the main drivers of innovation performance external to the firm and
cover 3 innovation dimensions: Human resources, Open, excellent and attractive research
systems as well as Finance and support. Firm activities capture the innovation efforts at the
level of the firm, grouped in 3 innovation dimensions: Firm investments, linkages &
entrepreneurship and Intellectual assets. Outputs cover the effects of firms’ innovation
activities in 2 innovation dimensions: Innovators and Economic effects.
For the international comparison of the EU27 with the global competitors (including South
Africa) a more restricted set of 12 indicators (Table 4) is used. Most of the indicators are nearly
identical to those used in the section for comparing the performance of the EU Member
States. Most of these indicators focus on performance related to R&D activities (R&D
expenditures, publications, patents) and there are no indicators using innovation survey data
as such data are not available for all countries or are not directly comparable with the
European CIS data.

26
Figure 5: Measurement framework of the Innovation Union Scoreboard
(Source: EC 2014)
27
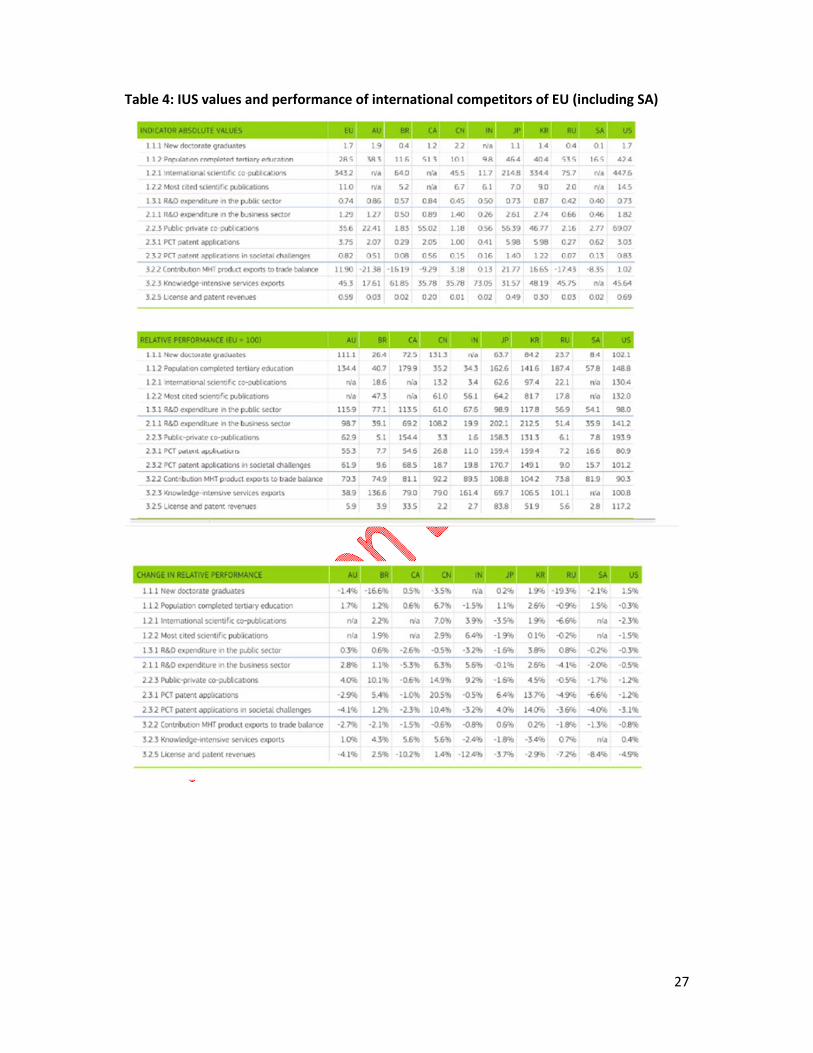
Table 4: IUS values and performance of international competitors of EU (including SA)
28
Table 4 shows the absolute values, the relative performance and the changes in relative
performance of 10 competitor countries with the EU. South Africa has the lowest values in
most indicators.
The 2014 Indicators (EC 2014) identifies that “the innovation performance of South Africa is
lagging behind that of the EU and is slowly declining. Relative performance was about 20%
for 2006‐2009 of the EU level and then declined to 17% in 2013. South Africa is performing
worse than the EU for all indicators, particularly on license and patent revenues from abroad,
Doctorate graduates, Public private co‐publications and Patent applications.
Looking at the relative growth performance reveals that for almost all indicators South
Africa’s growth performance is below that of the EU explaining the divergence process in
innovation performance relative to the EU. Growth is only above that of the EU for the
“population with completed tertiary education”. The performance gap therefore has
worsened for almost all indicators especially for “license and patent revenues from abroad
and patent applications”. The performance gap has only decreased for the “population with
completed tertiary education” (p 32).
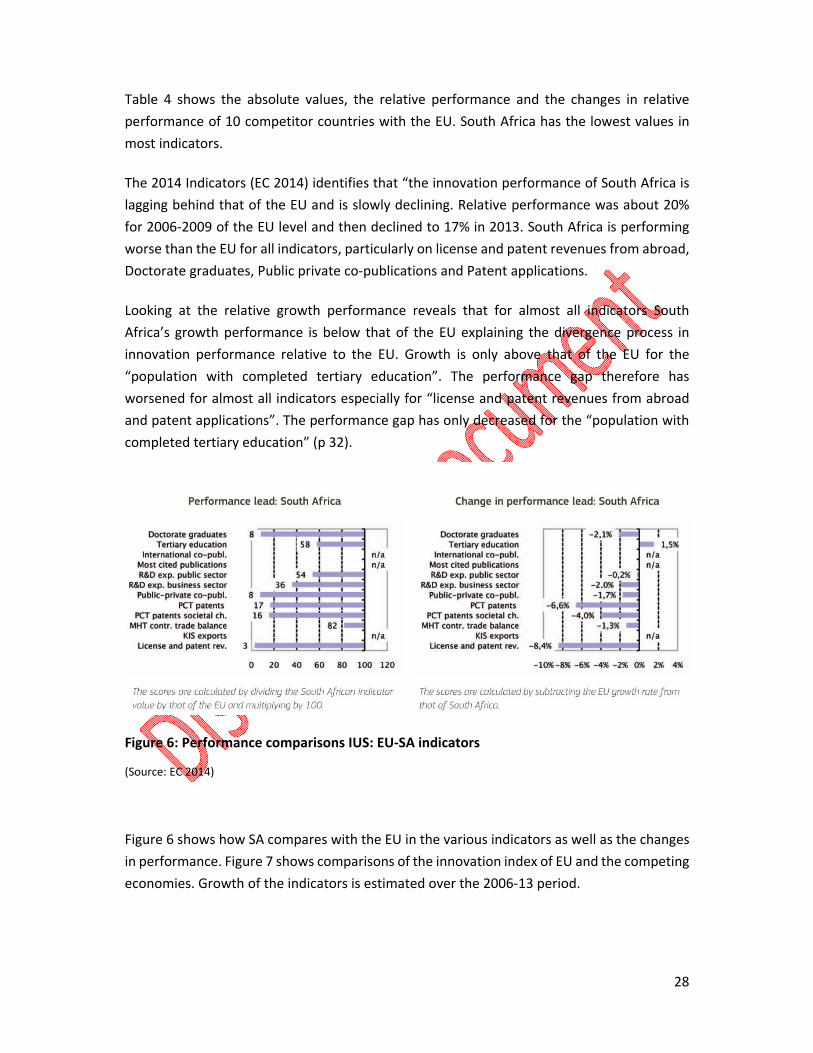
Figure 6: Performance comparisons IUS: EU‐SA indicators
(Source: EC 2014)
Figure 6 shows how SA compares with the EU in the various indicators as well as the changes
in performance. Figure 7 shows comparisons of the innovation index of EU and the competing
economies. Growth of the indicators is estimated over the 2006‐13 period.

29
Figure 7: Comparisons IUS: EU and competing economies
(Source: EC 2014)
The following indicators did not have data for South Africa:
Knowledge intensive services exports
International scientific co‐publications
Most cited scientific publications
2.4 The Abu Dhabi Innovation Index
The ‘Abu Dhabi Innovation Index’, was developed in order to assess the various factors that
contribute to innovation in the Emirate and to examine the results relative to how other
natural resource‐rich economies (NREs) are performing on the various dimensions.
A core premise of the Abu Dhabi Innovation Index is thus that the innovation capabilities of
an economy can be mapped and measured along five key functions that typically lead to value
creation and which, individually or collectively, contribute to new value creation. The five
functions are:
Accessing Knowledge
Anchoring Knowledge
Diffusing Knowledge
Creating Knowledge
Exploiting Knowledge
“Knowledge Access” is interpreted as the capabilities in an economy to connect and link to
local and international networks of knowledge and innovation.

30
“Knowledge Anchoring” is generated by the capabilities existing within an economy to
domesticate external sources of knowledge. Anchoring is manifested in the capacity of an
economy to attract sources of knowledge such as international talent, foreign investment and
foreign firms into relocating to its region.
“Knowledge Diffusion” is the collective capability of an economy to adopt, adapt and
assimilate new innovations, practices and technologies. Knowledge diffusion is a critical
capacity for innovation performance because it is a good indicator of the success of the first
two capacities.
“Knowledge Creation” can be understood as the ability to generate and bring in new
knowledge in the form of ideas, discoveries, designs and inventions to the world.
“Knowledge Exploitation” is the ability to utilise new knowledge for social and commercial
purposes in order to create value from it.
The index distinguishes between the capacities of an economy to innovate from its actual
innovation performance. A country might possess a potentially strong innovation capacity
but, due to structural and other problems may fail to exploit that potential. Table 5 shows the
capacity indicators and the performance ones. The five pillars appear on top of each set of
capacity indicators.
Table 5: Capacity and performance indicators Abu Dhabi Innovation Index
Capacity Indicators Performance Indicators
ACCESS
Internet Users per 100 people Value Chain Presence
Total Broadband per 100 people Breadth of International Markets
Extent of Business Internet Use
Extent of Trade Barriers
Quality of Infrastructure
ANCHOR
Days for Starting a Business Inward FDI Flow
Number of Procedures FDI and Technology Transfer
Cost of Starting Business Foreign Born Immigrants
Political Stability
Protecting Investors
Foreign Ownership Restrictions
DIFFUSION
Literacy Rates Firm Level Technology Adoption

31
Quality of Education System Buyer Sophistication
Availability of Scientists and Engineers Production Process Sophistication
Extent of Staff Training ICT Goods Imports
Local Availability of Specialised Research and Training Services
Gross Capital Formation
CREATION
Gross Domestic Expenditure on R&D Scientific Publications per capita
Company Spend on R&D Patent Filings per capita
Intellectual Property Protection
Quality of Scientific Research Institutions
EXPLOITATION
Venture Capital Availability Creative Goods
Local Equity Market Access Industry Value Added
Government Procurement of Advanced
Technology Products Services Value Added
The report draws primarily on internationally available data such as those collated and
produced by the World Bank, the OECD, and the World Economic Forum among others.
Total capacity and total performance give an aggregate score for the five dimensions. Within
each capacity/performance pillar, the scoring is a non‐weighted average with a possible
maximum of seven. Total capacity and total performance are scored as a sum of individual
pillars, giving a maximum possible score of 35 each for capacity and performance.
South Africa is ranked 45th in terms of capacity and 39th in terms of performance.
The report compares and contrasts the innovation characteristics of 23 natural resource rich
economies. The countries are classified in four groups
High Capacity/High Performance
High Capacity/Low Performance
Low Capacity/High Performance
Low Capacity/Low Performance
South Africa is classified in the category high capacity/low performance as its total value
capacity is higher that its aggregate value performance and is ranked 21st out of 23
economies. Table 6 summarises the SA ranking in each pillar, capacity and performance.

32
Appendix 2 shows the rankings of the included countries according to pillars, capacities and
performance. SA is ranked higher in performance than in capacity in general (in contrast to
its classification high capacity/low performance).
Table 6: South African rankings in capacity and performance ‐ Abu Dhabi Innovation Index
Type
Access Capacity
Access Performance
Anchor Capacity
Anchor Performance
Diffusion Capacity
Diffusion Performance
Creation Capacity
Creation Performance
Exploitation Capacity
Exploitation Performance
SA Rank
17
15
8
8
19
13
9
11
13
8
The SA detailed assessment appears in Appendix 3.
2.5 Bloomberg Innovation Index (2015)
Bloomberg (2015) ranked countries and sovereigns based on their overall ability to innovate
and identified the top 50. Six equally weighted metrics were considered and their scores
combined to provide an overall score for each country from zero to 100.
The Index consists of the following 6 pillars:
1. Research & Development: Research and development expenditure as a percentage
of GDP
2. Manufacturing: Manufacturing value‐added per capita
3. High‐tech companies: Number of domestically domiciled high‐tech public
companies—such as aerospace and defence, biotechnology, hardware, software,
semiconductors, Internet software and services, and renewable energy companies ‐‐
as a share of world's total high‐tech public companies
4. Postsecondary education: Number of secondary graduates enrolled in postsecondary
institutions as a percentage of cohort; percentage of labour force with tertiary
degrees; annual science and engineering graduates as a percentage of the labour
force and as a percentage of total tertiary graduates (four measures).
33
5. Research personnel: Professionals, including Ph.D. students, engaged in R&D per 1
million population.
6. Patents: Resident utility patent filings per 1 million population and per $1 million of
R&D spent; utility patents granted as a percentage of world total.
Of the more than 200 countries and sovereigns evaluated, 69 had data for all six metrics.
Postsecondary education and patent activity consisted of multiple factors that were weighted
equally. Weights were rescaled for countries with some but not all of the factors in those two
metrics. The ranking shows only those countries included in the top 50. Most recent data
available were used.
Data sources include: Bloomberg, International Monetary Fund, World Bank, Organisation for
Economic Co‐operation and Development, World Intellectual Property Organization, United
Nations Educational, Scientific and Cultural Organization.
Other sources: Samsung, Swiss Federal Statistical Office and Unified Patents
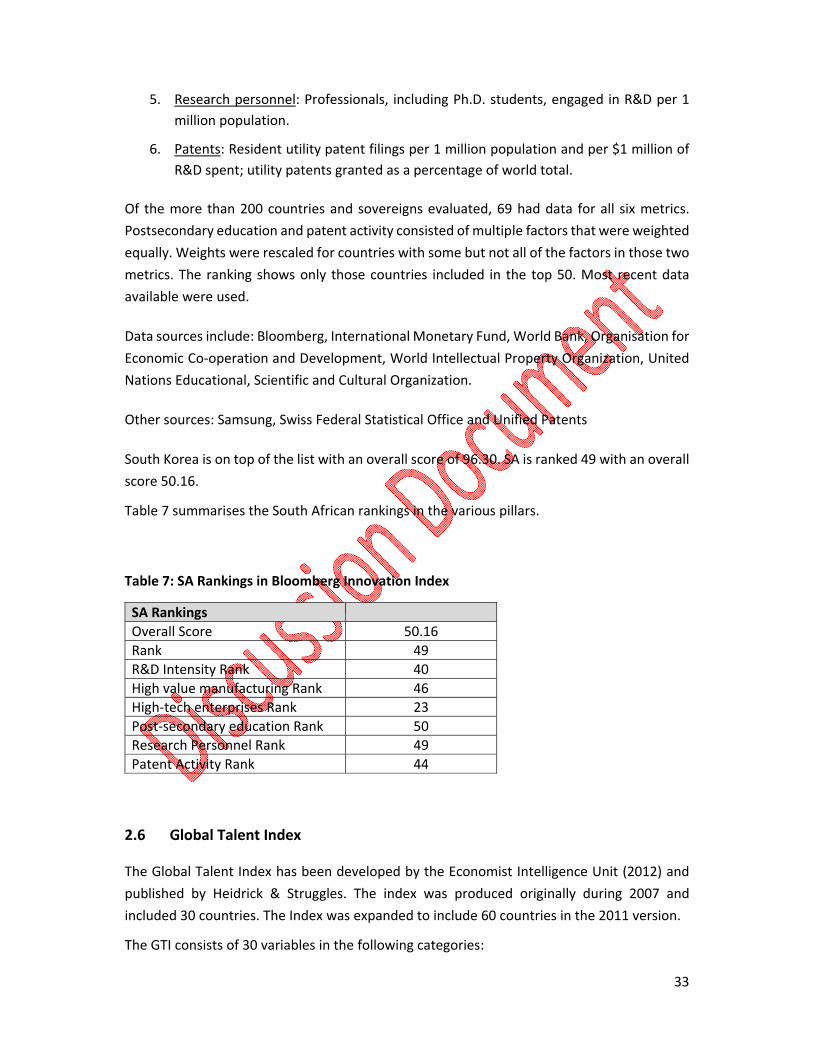
South Korea is on top of the list with an overall score of 96.30. SA is ranked 49 with an overall
score 50.16.
Table 7 summarises the South African rankings in the various pillars.
Table 7: SA Rankings in Bloomberg Innovation Index
SA Rankings
Overall Score 50.16
Rank 49
R&D Intensity Rank 40
High value manufacturing Rank 46
High‐tech enterprises Rank 23
Post‐secondary education Rank 50
Research Personnel Rank 49
Patent Activity Rank 44
2.6 Global Talent Index
The Global Talent Index has been developed by the Economist Intelligence Unit (2012) and
published by Heidrick & Struggles. The index was produced originally during 2007 and
included 30 countries. The Index was expanded to include 60 countries in the 2011 version.
The GTI consists of 30 variables in the following categories:
34
Demographics
Compulsory education
University education
Quality of the labour force
Talent environment
Openness
Proclivity to attracting talent
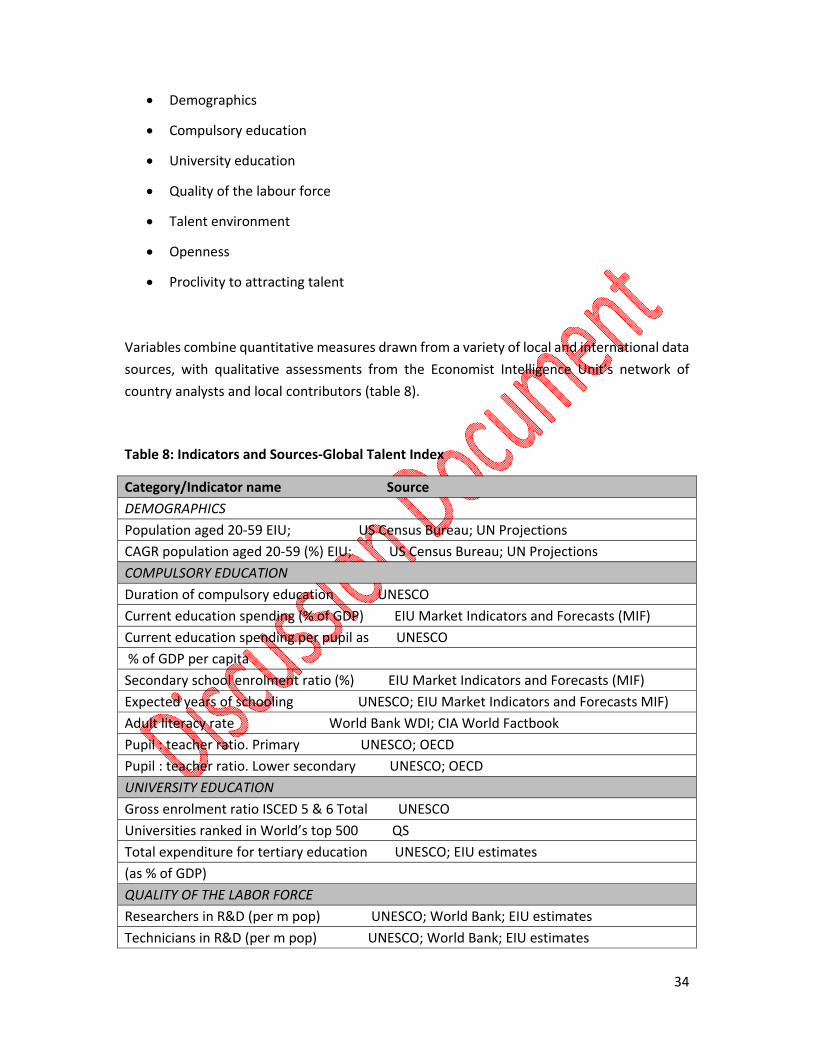
Variables combine quantitative measures drawn from a variety of local and international data
sources, with qualitative assessments from the Economist Intelligence Unit’s network of
country analysts and local contributors (table 8).
Table 8: Indicators and Sources‐Global Talent Index
Category/Indicator name Source
DEMOGRAPHICS
Population aged 20‐59 EIU; US Census Bureau; UN Projections
CAGR population aged 20‐59 (%) EIU; US Census Bureau; UN Projections
COMPULSORY EDUCATION
Duration of compulsory education UNESCO
Current education spending (% of GDP) EIU Market Indicators and Forecasts (MIF)
Current education spending per pupil as UNESCO
% of GDP per capita
Secondary school enrolment ratio (%) EIU Market Indicators and Forecasts (MIF)
Expected years of schooling UNESCO; EIU Market Indicators and Forecasts MIF)
Adult literacy rate World Bank WDI; CIA World Factbook
Pupil : teacher ratio. Primary UNESCO; OECD
Pupil : teacher ratio. Lower secondary UNESCO; OECD
UNIVERSITY EDUCATION
Gross enrolment ratio ISCED 5 & 6 Total UNESCO
Universities ranked in World’s top 500 QS
Total expenditure for tertiary education UNESCO; EIU estimates
(as % of GDP)
QUALITY OF THE LABOR FORCE
Researchers in R&D (per m pop) UNESCO; World Bank; EIU estimates
Technicians in R&D (per m pop) UNESCO; World Bank; EIU estimates

35
Quality of work force EIU Business Environment Rankings
Language skills of the labour force EIU Business Environment Rankings
Technical skills of the workforce EIU Business Environment Rankings
Local managers EIU Business Environment Rankings
TALENT ENVIRONMENT
R&D as % of GDP EIU Business Environment Rankings
Degree of restrictiveness of labour laws EIU Business Environment Rankings
Wage regulation EIU Business Environment Rankings
Protection of intellectual property EIU Risk Briefing
Protection of private property EIU Risk Briefing
Meritocratic remuneration EIU Risk Briefing
OPENNESS
Hiring of foreign nationals EIU Business Environment Rankings
Average stock of FDI (% of GDP) EIU Market Indicators and Forecasts (MIF)
Openness of trade (% of GDP) EIU Market Indicators and Forecasts (MIF)
PROCLIVITY TO ATTRACTING TALENT
Personal disposable income per capita EIU Market Indicators and Forecasts (MIF)
Employment growth EIU Market Indicators and Forecasts (MIF)
University education and quality of labour force receive weights 22.2% while all other
categories get 11.1% in terms of weights.
All raw data in the index is transformed so that it appears on a 0‐100 scale, where 0=worst
and 100=best. Once raw data has been normalized, the 0‐100 scores are aggregated across
categories to enable a comparison of broader concepts across countries. All qualitative
indicators have been scored on an integer scale and have been assigned by country experts.
This scale ranges from 0‐4 or 1‐5; scores are assigned by the research managers and the
Economist Intelligence Unit’s team of country analysts according to the scoring criteria. The
integer scores are then transformed to a 0‐100 score to make them comparable with the
quantitative indicators in the index.
South Africa received the following scores (table 9):
Table 9: South African scores‐Global Talent Index
Overall Score 37.4
Demographics 20.6
Compulsory Education 62.2
University Education 21.1
Quality of labour force 45.2
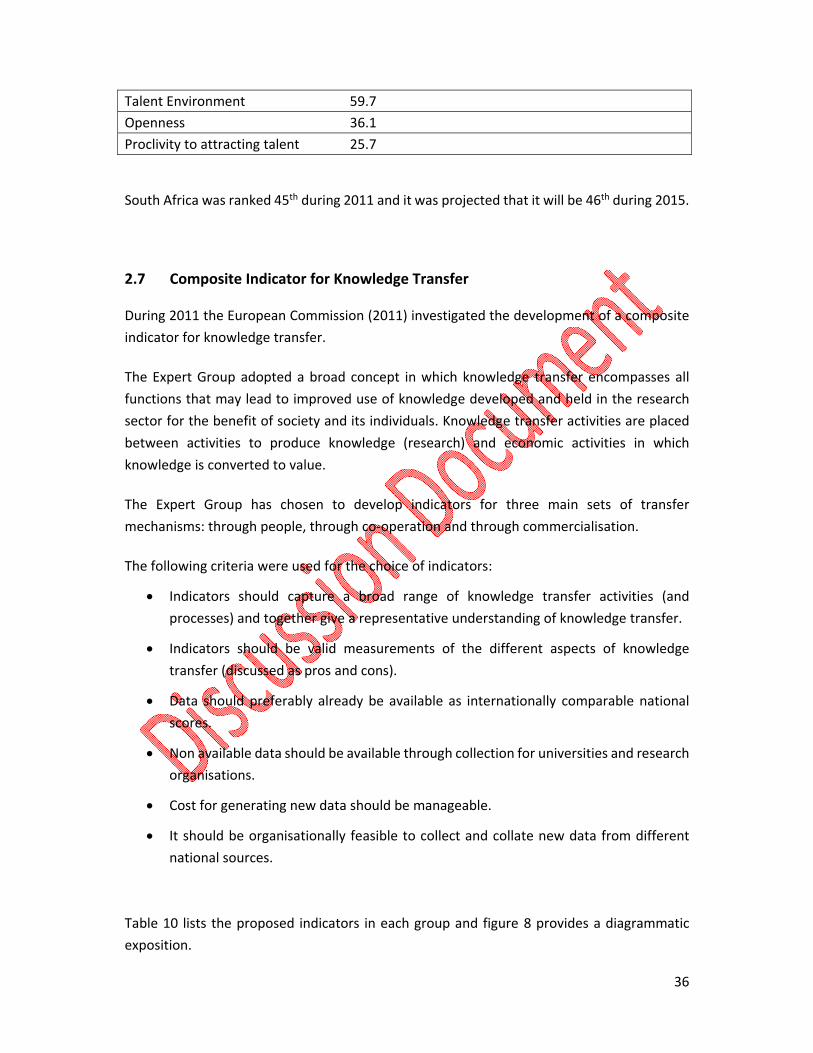
36
Talent Environment 59.7
Openness 36.1
Proclivity to attracting talent 25.7
South Africa was ranked 45th during 2011 and it was projected that it will be 46th during 2015.
2.7 Composite Indicator for Knowledge Transfer
During 2011 the European Commission (2011) investigated the development of a composite
indicator for knowledge transfer.
The Expert Group adopted a broad concept in which knowledge transfer encompasses all
functions that may lead to improved use of knowledge developed and held in the research
sector for the benefit of society and its individuals. Knowledge transfer activities are placed
between activities to produce knowledge (research) and economic activities in which
knowledge is converted to value.
The Expert Group has chosen to develop indicators for three main sets of transfer
mechanisms: through people, through co‐operation and through commercialisation.
The following criteria were used for the choice of indicators:
Indicators should capture a broad range of knowledge transfer activities (and
processes) and together give a representative understanding of knowledge transfer.
Indicators should be valid measurements of the different aspects of knowledge
transfer (discussed as pros and cons).
Data should preferably already be available as internationally comparable national
scores.
Non available data should be available through collection for universities and research
organisations.
Cost for generating new data should be manageable.
It should be organisationally feasible to collect and collate new data from different
national sources.
Table 10 lists the proposed indicators in each group and figure 8 provides a diagrammatic
exposition.

37
Table 10: Proposed component indicators for knowledge transfer
Knowledge transfer through trained people
1.1 Stock of HEI graduates employed in business enterprise sector
1.2 Stock of doctorate holders employed in business enterprise sector
1.3 Continuing professional development revenue for HEIs
1.4 Employed adults (age 25‐64) engaged in university level training or education
1.5 Teaching in HEIs performed by people with their primary job outside the HEI/PRO sector
1.6 Entrepreneurship propensity among HEI students
Institutional co‐operation in R&D and other phases of innovation
2.1 Number of R&D contracts in HEIs/PROs with firms and other users
2.2 Number of consultancy contracts in HEIs/PROs with firms and other users
2.3 Revenue to HEIs/PROs from R&D contracts with firms and other users
2.4 Revenue to HEIs/PROs from consultancy contracts with firms and other users
2.5 Firms co‐operating with HEIs
2.6 Firms co‐operating with PROs
2.7 R&D in HEIs/PROs funded by business
2.8 Co‐publications between private and public authors
Commercialisation of research
3.1 Invention disclosures from HEI/PRO employees
3.2 Priority patent applications submitted from HEIs/PROs
3.3 Patent applications submitted from public sector actors to EPO
3.4 Patents granted to HEIs and PROs
3.5 New licensing agreements
3.6 Licensing revenue to HEIs and PROs
3.7 International licensing trade from HEIs and PROs
3.8 Number of new spin‐offs

38
Figure 8: Diagrammatic exposition of composite indicator technology transfer
(Source: EC 2011)
The expert group investigated the availability of relevant data for European countries. Existing
multi‐year datasets have been found for 15 of the 22 component indicators. The coverage
was identified to be best in the areas of knowledge transfer through people and through
institutional co‐operation. It was smallest in the core area of commercialisation backed by IP
management, which is the main area of concern. As it was, EPO patent applications from the
public sector were the only indicator covering a wide range of countries.

39
2.8 Composite Indicator for Knowledge Intensive Economy
The concept of knowledge society was first developed by Drucker (1969). During 2010, The
European Commission developed a strategy entitled “Europe 2020 – EU Strategy for Smart,
Sustainable and Inclusive Growth”‖ (European Commission 2010). The top three priorities are:
Smart growth: economic development based on knowledge and innovation;
Sustainable growth: promoting a resource efficient, greener and more competitive
economy;
Inclusive growth: providing a high‐employment economy delivering economic, social
and territorial cohesion.
A number of non European countries (including South Africa) have accepted the importance
of supporting and moving society towards a knowledge base.
A number of relevant composite indicators have been published (Milken Institute 2001; the
World Bank 2008). However, most of them are once off or irregular studies.
The relevant variables for the knowledge economy include among others statistics related to
knowledge and technology intensive industries (value added, imports‐exports; employment;
patents etc).
OECD has defined the knowledge economy to include high‐ and medium‐technology
manufacturing, high value‐added service industries (finance and insurance,
telecommunications, business services), and the education and health sectors (Brinkley
2006).
Probably the most often quoted indicator in the field is the World Bank knowledge economy
index. The World Bank developed the Knowledge Economy Index using a four‐pillar
framework (World Bank 2012):
1. An economic incentive and institutional regime to provide incentives for the efficient
use of new and existing knowledge and the flourishing of entrepreneurship
2. An educated and skilled population to create, share, and use knowledge well
3. An efficient innovation and technological adoption system of firms, research centres,
universities, consultants, and other organizations to tap into the growing stock of
global knowledge, assimilate and adapt it to local needs, and create new technology
4. Information and communication technology to facilitate the effective creation,
dissemination, and processing of information

40
The Bank states in their web that there are no plans to update the effort.
The Joint Research Center of the European Commission has produced recently the report
“Update on the Composite Indicators of Structural Change towards a More Knowledge‐
Intensive Economy” (JRC 2013). The report builds on and updates the results of a previous
feasibility study on the development of composite indicators of structural change (Vertesy et
al., 2012).
The report measures the size of the knowledge economy in five dimensions with nine
indicators. The five dimensions (figure 9) express different characteristics of a knowledge‐
based economy. These are:
Increased research intensity in the private sector and the emergence and growth of
R&D as a specialized sector of the economy (R&D indicators).
Increased demand for highly qualified human resources in the economy (skills
indicators).
Increased economic value creation in sectors relying on highly qualified human
resources (sectoral specialization indicators).
Increased specialization of countries in the development of high technologies and in
exporting (medium‐ and) high‐tech products (International specialization indicators).
Increased openness of economies in terms of foreign investments
(internationalization indicators).
Each of the five dimensions are populated by one or two indicators, and measured at three
time points in order to express change over time: 2000, 2005 and 2011. Figure 9 shows the
architecture of the composite indicator. Data was collected for 40 countries, including all
EU27 member states, members of EFTA and key international benchmark countries (OECD
member states or BRIC countries), such as the USA, Japan, China, Israel, Brazil, India, Russia
and the Republic of Korea. South Africa was not included in the chosen countries.

41
Figure 9: Architecture of composite indicator knowledge based economy
(Source: JRC 2013)
Table 11: Indicators on the size of knowledge economy
2.9 Global Competitiveness Index
The Global Competitiveness Index is produced by the World Economic Forum. We briefly
describe it here as a number of the pillars used are innovation related.

42
The Index was published for first time during 2005. Competitiveness is defined as the set of
institutions, policies, and factors that determine the level of productivity of a country.
Competitive economies are expected to have high economic growth.
The Index consists of 12 pillars. These are:
Institutions
Infrastructure
Macroeconomic Environment
Health and Primary Education
Higher Education and Training
Goods Market Efficiency
Labor Market Efficiency
Financial Market Development
Technological Readiness
Market Size
Business Sophistication
Innovation
The pillars “higher education and training”, “technological readiness” and “innovation” are
directly related to innovation. The pillar “Financial Market Development” is also related to
innovation as it includes R&D expenditures. The authors emphasize that innovation is also
affected by other pillars.
Data are obtained from internationally agencies, such as the United Nations Educational,
Scientific and Cultural Organization (UNESCO), the International Monetary Fund (IMF), and
the World Health Organization (WHO). Furthermore, the index uses data from the World
Economic Forum’s annual Executive Opinion Survey to capture concepts that require a more
qualitative assessment.
The indicators are converted to a 1‐to‐7 scale in order to align them with the Survey results
and to make the aggregation possible. Then a min‐max transformation is applied which
preserves the order of, and the relative distance between, country scores.
The Index takes the stages of development into account by attributing higher relative weights
to those pillars that are more relevant for an economy given its particular stage of
43
development. To implement this concept, the pillars are organized into three sub‐indices,
according to a particular stage of development. GDP/capita is the indicator that determines
the level of development. The three sub‐indices are basic requirements; efficiency enhancers;
and innovation and sophistication factors. Their weights appear in appendix 4.
South Africa is ranked 56th (out of 144 countries) overall during 2014‐15. It is ranked 7th in the
pillar “financial market development” and 25th in the pillar “market size”. The worst rankings
are at “health and primary education” rank 132 and “labor market efficiency” rank 113. South
Africa is ranked 43rd in the pillar “innovation”; 66th in “technological readiness” and 86th in
“higher education and training” (Appendix 4).
In summary in this section are described seven composite indicators. Four of them cover
national innovation systems and among others include South Africa. Three indicators cover
specific aspects of the innovation systems i.e. human talent; technology transfer and
knowledge intensity in the economy. The Global Competitiveness Index is also described as a
number of its pillars are related to innovation.
It should be emphasised that a number of indicators are published for a short period and then
they are suspended (e.g. the Technology Achievement Index). Similarly a number of indicators
use proprietary data which are not available publicly for further analysis.
The metrics are used—on the level of the index, the sub‐indices, or the actual raw data of
individual variables—to monitor performance over time and to benchmark developments
against countries in the same region or of the same income class or the rest of the World.
The identified indices use hard quantitative data or a mix of quantitative and qualitative data.
The scarcity of “objective” quantitative data leads to use of subjective or opinion based data
too (which may be more variable than objective quantitative metrics). It should be
emphasised that most of the quantitative data are produced by national authorities and they
may suffer from local deficiencies and may not be comparable with each other.
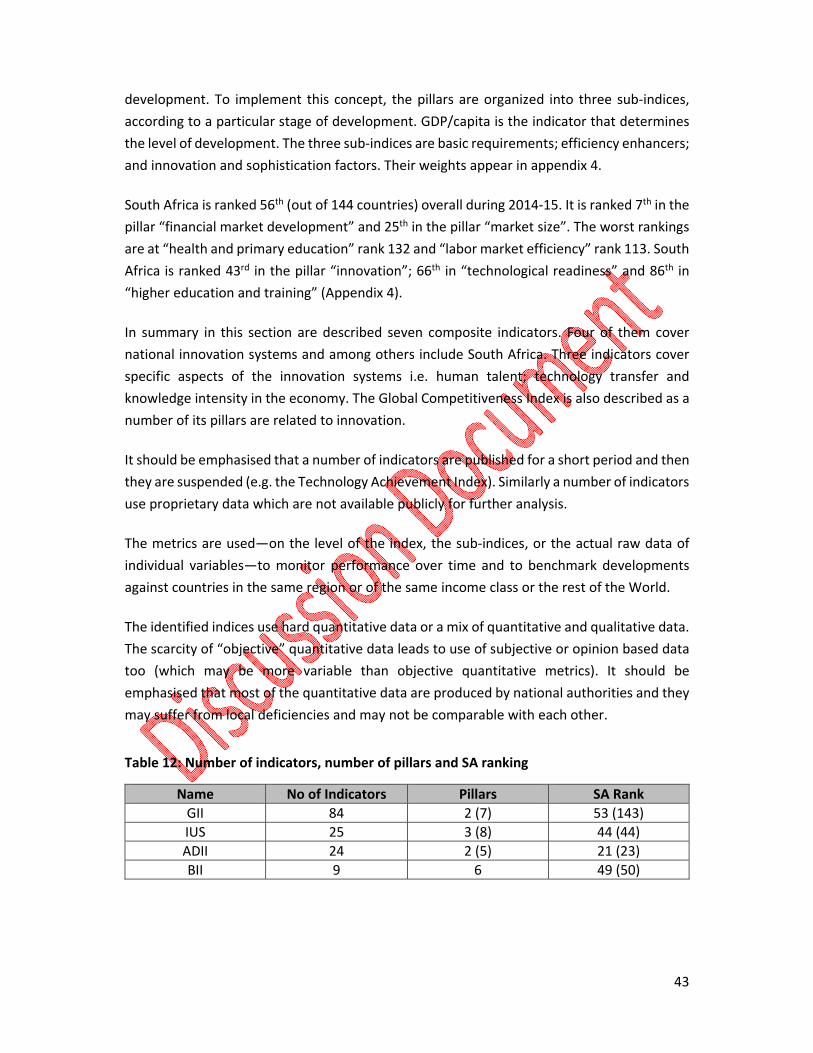
Table 12: Number of indicators, number of pillars and SA ranking
Name No of Indicators Pillars SA Rank
GII 84 2 (7) 53 (143)
IUS 25 3 (8) 44 (44)
ADII 24 2 (5) 21 (23)
BII 9 6 49 (50)

44
Table 12 shows the name of indicators and pillars used in the various composite indicators.
The number of indicators ranges from 84 in the Global Innovation Index to 9 in the Bloomberg
Innovation Index. Pillars may have sub‐pillars. The sub‐pillars range from 5 to 8.
The table also shows the South African ranking. South Africa in general is not ranked high in
all indices.
It is interesting to note that the South African rankings remain approximately the same across
the different indices even though the indices may cover different breaths of variables and
even different types of variables (e.g. objective and subjective ones).
The following indicators/variables were missing from the South African data in the various
composite indicators:
Public expenditure/pupil, % GDP/cap
School life expectancy , years
PISA scales in reading, maths, & science
Tertiary enrolment, % gross
Graduates in science & engineering,
Tertiary inbound mobility, %
Madrid trademark registrations/bn PPP$ GDP
Domestic res utility model ap/bn PPP$ GDP
Audio ‐visual & related services exports, %
Knowledge intensive services exports
International scientific co‐publications
Most cited scientific publications
2.10 Recommendations
This document aims to set the background for the development of composite innovation
indicators for South Africa. The review identifies that there is a multitude of composite
indicators covering the whole system of innovation and a number of composite indicators
covering specific topics within innovation systems.

45
Composite indicators have the capability to aggregate a variety of variables into one metric
which in turn can be compared with similar metrics of other countries/regions or they can
indicate performance over time. OECD (2008) argues that this type of statistic is extremely
useful in garnering media interest and hence, the attention of policy makers.
Composite indicators are not without their challenges. Probably the most often discussed
issue is the development of a composite indicator based on a theoretical framework.
However, theoretical limitations and lack of adequate metric variables lead almost always to
a compromise. The use of the off‐the‐shelf indicators (indicators produced by international
bodies; research organisations etc) has also its challenges. Indicators are developed,
published and often they are suspended. Simialrly organisations may use composite
indicators as a marketing tool for their activities collecting relevant data. In these cases the
original data are not easily available which limit any in depth analysis/validity of the
developed indicator. Hence, the adoption of particular indicators for policy purposes should
be guided by the expected longevity and transparency of the relevant indicator.
As the majority of composite indicators are developed in order to rank countries usually are
“normalised” (rectifying incommensurability) before the aggregation process. This process
has the result that the composite indicator values for a particular country are not comparable
over time.
Based on the above the following recommendations are developed.
1. There are a number of international composite innovation indicators covering South
Africa. These indicators can be utilised in order to inform NACI about the country’s
relevant innovation position internationally. The Global Innovation Index and the
Innovation Union Scoreboard are important in the above context. As the Innovation
Union Scoreboard does not emphasise to the same degree South Africa (as the
European countries); it is recommended that NACI should adopt the Global
Innovation Index. A document focused on South Africa should be produced regularly
describing the country’s performance together with clarifications and the possible
shortcomings of the index. The document should be written in a way that can be
understood by non experts in the field of innovation and indicators.
2. A “South African Composite Indicator” should be developed in order to monitor the
performance national system of innovation over time. The Indicator should be
developed in accordance with the international standards taking care that the
normalization process maintains comparability over time. The indicator should cover
a period of at least ten years and use the currently available variables in the country.
3. Partial innovation indicators are particularly useful for addressing issues of priority in
the policy community. In this document we have described selectively indicators
related to Knowledge Intensive Economy; to Technology Transfer from the

46
universities and research organisations and related to Human Talent. We suggest that
priority should be attached in developing a composite indicator related to the
knowledge based economy. The development of additional partial indicators should
follow.
4. A number of international composite indicators include South Africa. However, often
the developers do not have access to all South African data. NACI should monitor
these efforts and offer to provide the missing indicators.

47
3. KnowledgeBasedEconomy‐SAIndicators
3.1 Introduction
Strengthening the knowledge‐based economy is both an imperative and an opportunity for
developing South Africa. It is an imperative to sustain high rates of growth into the future and
to avoid the middle‐income trap. This requires productivity‐led growth arising from
innovation. Furthermore, it is also an opportunity for developing countries to tap beneficial
global technology trends and to step up competitiveness and move up in global value chains.
New knowledge‐based paradigms of growth can also help redress income inequality and
rural‐urban disparities. Science and innovation can support inclusive growth through job
creation or through access to improved medicines, seeds or clean water.
A knowledge‐based economy describes an economy that uses information resources
(technologies, skills, and processes) to achieve and accelerate economic growth potential.
The Asian Development Bank in a recent report (ADB 2014) defined it as follows: “A
knowledge‐based economy is one that has an economic incentive and institutional regime
that stimulates the acquisition, creation, dissemination, and use of knowledge and
information to improve its growth and welfare, as well as effective systems of education and
skills, information and communication technology (ICT), research and development (R&D),
and innovation”.
A number of countries recognise the importance of knowledge based economy and develop
metrics to monitor their efforts and policies to accelerate the transition of their economies.
Some of the early investigations include the following:
1. “The Knowledge‐Based Economy: A Set of Facts and Figures”, OECD (1999)
2. “Australia as a Modern Economy: Some Statistical Indicators” 2002, Department of
Industry, Tourism and Resources (2002)
3. “Towards a European Research Area: Science, Technology and Innovation: Key
Figures” 2000, Eurostat (2000)
4. “Index of the Massachusetts Innovation Economy”, Massachusetts Technology
Collaborative (1999)
5. “The New Economy Index: Understanding America's Economic Transformation”,
Progressive Policy Institute (1998)
More recent investigations include:

48
1. “An overview of the knowledge economy with a focus on Arizona” (2011) Center of
Competitiveness and Prosperity Research
2. “EUROPE 2020: A Strategy for Smart, Sustainable and Inclusive Growth”, 2010
European Commission: Brussels
3. “Moving Toward Knowledge‐Based Economies: Asian Experiences”, Asian 2007
Development Bank
4. “The Innovation Index Measuring the UK’s Investment in Innovation and Its Effects”,
2009 National Endowment for Science Technology and the Arts,
5. “The Knowledge Economy & the Knowledge Assessment Methodology (The case
study of Iran & Some other Countries)” Iranian Economic Review, Vol.15, No.29,
Spring 2011
The cited literature indicates that the interest related to knowledge economy is widespread
internationally.
Next we discuss the importance of knowledge for economic growth; we elaborate on
measuring the knowledge economy and we develop a number of indicators measuring the
size of the South African knowledge economy. The brief ends with recommendations.
3.2 The Importance of Knowledge for Growth
There is both theoretical and empirical evidence that knowledge affects positively economic
growth.
The traditional model of economic growth is based on the well‐known concept of the
production function in which the two primary economic inputs — labour and capital — are
combined in a production process with known techniques. In the context of a national or
regional economy, the analysis is framed in terms of a so‐called “aggregate” production
function in which an economy’s productive capacity is a function of three variables: its labour force, its stock of capital equipment and its level of technology. Based on such an economic
model, three sources of growth are apparent:
1. Growth of the labour force;
2. Growth of the stock of capital;
3. Improvements in technology.

49
In this traditional model of economic growth, two of these three factors — labour and capital
— are subject to what is known as “diminishing returns.” This concept refers to the fact that,
with fixed technology, incremental additions of more workers or more capital will produce
smaller and smaller additional amounts of output and at the limit further additional inputs
will produce no additional output. Thus, the traditional model of economic growth implies
that without technological change, the economy would tend to grow at a slower and slower
rate and ultimately reach a long‐run equilibrium level of output with no further growth
potential.
However, technological progress is not subject to diminishing returns in the same way as the
other two factors. Thus, the traditional model of economic growth demonstrates that
technological progress is the key to sustaining economic growth over time.
In addition to theoretical argumentation a large body of empirical literature finds evidence of
the growing importance of knowledge‐related factors for economic growth (Appendix 5).
Jones (2002) estimated that the production of new knowledge (measured by research and
development activity) and increased educational attainment accounted for more than 80
percent of U.S. economic growth over the 1950‐to‐1993 period. Jorgenson (2005) found that
for the 1948‐to‐2002 period as a whole about 60 percent of economic growth in the USA
stemmed from increases in the quantities of capital and labour and 40 percent from increases
in the qualities of the factors of production and improvements in technology. For the period
1995‐to‐2002, however, he found that these percentages were essentially reversed, with a little less than 30 percent explained by increases in quantities of the factors of production and 70 percent due to improvements in factor quality and technology – indicating an
increasing importance of technology.
In a cross‐country study of 22 advanced economies Aghion et al (2007) estimated that on
average nearly 70 percent of recent economic growth was the result of technological change.
For the South African case, Fedderke (2005) found that the quality of human capital is the
most important aspect for economic growth. Simialrly Inglesi‐Lotz et al (2013) using the
autoregressive distributed lag method, investigate the relationship between South African
GDP and the comparative research performance of the country in relation to the rest of the
world for the period 1980‐2008. They conclude that the comparative performance of the
research output can be considered as a factor affecting the economic growth of the country.

50
3.3 Measuring the Knowledge Economy
Definitions of the knowledge economy have been developed by analysts and organizations
for their own purposes, but they are not consistent and frequently data based on such ad hoc
definitions are not reported on an ongoing basis.
Three approaches defining the knowledge economy have been used internationally: by
industry (an output‐based measure); by occupation (an input‐based measure) and by
composite indicators.
An industry‐based approach defines the knowledge economy as either (a) those industries
that are involved in the production or creation of knowledge, or more often (b) in terms of
those industries determined to be “knowledge intensive” or “knowledge based.”
Various methods have been used to define the degree of knowledge intensity, often in terms
of the educational attainment of its workers or by first defining “high‐knowledge”
occupations. The knowledge intensity of an industry is then defined in terms of the proportion
of its labour force in those “high‐knowledge” occupations.
Based on this approach, the OECD has defined the knowledge economy to include high‐ and
medium‐technology manufacturing, high value‐added service industries (finance and
insurance, telecommunications, business services), and the education and health sectors. Ten
knowledge and technology intensive industries, consisting of five service industries and five
high‐technology manufacturing industries, represented 27% of world GDP in 2012
Using this definition and the concept of gross value added, the size of the knowledge economy
can be estimated. Gross value added is a measure in economics of the value of goods and
services produced in an area, industry or sector of an economy. Gross domestic product (GDP)
is calculated as gross value added plus taxes on products less subsidies on products.
The second approach is to measure the knowledge economy directly in terms of the number
of “knowledge workers.” This approach has the advantage over the industry‐based approach
in recognizing that knowledge workers may be employed across all sectors of the economy
and that not all workers in knowledge‐intensive industries are knowledge workers.
Conceptually, a knowledge worker might be defined as someone who works at the tasks of
developing or using knowledge, but in practice it is usually defined in terms of “high‐
knowledge” occupations.
However, there is no single accepted definition of “high‐knowledge” occupations. While some
organizations have engaged in detailed analyses based on multiple criteria to categorize an

51
occupation’s skill and complexity level most often knowledge workers are defined as workers
in the managerial, professional and technical occupations.
Finally the third approach is using composite indicators in order to measure the knowledge
based economy. The use of composite indicators to assess progress towards the knowledge‐
based economy is an emerging field. Such indicators have already been successfully used at
both national and international level in a number of different policy fields where it is
necessary to summarise complex multidimensional phenomena. By aggregating a number of
different variables, composite indicators are able to summarise the big picture in relation to
a complex issue with many dimensions.
There is a variety of indicators that are used for the development of a composite indicator
related to the knowledge economy (Arundel et al 2008). Probably the most well known
“Knowledge Economy Index” is the one developed by the World Bank (2012).
The index measures country performance on four knowledge economy pillars: Economic
Incentive and Institutional Regime (an economic pillar) and three knowledge pillars ‐
Education, Innovation, and Information and Communications Technologies.
Each pillar is based on three indicators that serve as proxies for the performance of that pillar.
The World Bank defines the Knowledge Economy Index (KEI) as measuring a country's ability
to generate, adopt and diffuse knowledge and also whether the environment is conducive for
knowledge to be used effectively for economic development. The KEI is constructed as the
simple average of the 4 pillar indexes.
3.4 The Size and Growth of the South African Knowledge Economy
In this chapter we use the industry‐based approach of OECD in order to measure the size of
the South African knowledge economy, changes of its size over time and its comparison with
other countries.
The approach involves the estimation of the value addition of the knowledge and technology
intensive industries and services in the country’s GDP. Knowledge Intensive services include
education, health, business, financial, and communications services. High technology
manufacturing industries include aerospace, communications and semiconductors,
computers and office machinery, pharmaceuticals, and scientific instruments and measuring
equipment.

52
Table 13: Value added of knowledge and technology intensive industries in South Africa’s GDP
Year VA KTI/GDP
1997 0.16
1999 0.17
2000 0.17
2001 0.18
2002 0.18
2003 0.19
2004 0.19
2005 0.19
2006 0.19
2007 0.20
2008 0.19
2009 0.19
2010 0.19
2011 0.19
2012 0.19
SOURCE: Data from IHS Global Insight, special tabulations
Table 13 shows the ratio of value added of knowledge and technology intensive industries to
GDP in South Africa. The ratio moved from 0.16 in 1997 to 0.20 during 2007 and has been
stabilised to 0.19 during the most recent years.
Table 14 shows the relevant ratios for a number of selected countries and South Africa. South
Africa with a ratio of 0.19 is in the bottom of the list. It is interesting to note, that the Chinese
government has set as objective to increase the contribution of the knowledge and
technology intensive industries to 30% by 2020.
Table 14: Value added of KTI industries to GDP. Selected countries 2012
Countries VA KTI/GDP
United States 0.40
United Kingdom 0.35
South Korea 0.29
Turkey 0.23
China 0.20
South Africa 0.19
SOURCE: Data from IHS Global Insight, special tabulations
53
The knowledge and technology intensive industries represented 27% of world GDP in 2012.
Among the KTI industries, the commercial knowledge‐intensive services—business, financial,
and communications—have the highest share (16% of GDP). The public KI services, education
and health, have a share of 9% and the high technology manufacturing industries have a share
of 2%.
In South Africa the major contributors are financial services and business services with value
added $34088 m and $18645 m respectively during 2012. Among the knowledge intensive
industries pharmaceuticals makes the highest contribution with $811 m during 2012.
Next we develop a composite indicator of the knowledge based economy for South Africa.
The Index is based on the World Bank methodology2 (basic scorecard) and the normalisation
of the constituent indicators is such that comparisons are valid over time.
The World Bank published rankings of countries based on their methodology. During the 2012
rankings South Africa was ranked 67th (down from 52nd during 2000). Sweden and Finland
were on top of the list.
The rankings of the South African pillars were: innovation 44th; education 81st and ICT 98TH.
The South African Composite Knowledge Index (SACKI) is based on three pillars:
1. Innovation and Technological Adoption
2. Education and Training
3. Information and Communications Technologies Infrastructure
The variables in each pillar are as follows:
1. Innovation and Technological Adoption
a) Royalty and License Fees Payments and Receipts
b) Scientific and Technical Journal Articles
c) Patent Applications Granted by the USPTO
2. Education and Training
a) Secondary Enrolment ratio
2 The World Bank Index was preferred over the European Union JRC (2013) as the former provides international comparative statistics for South Africa up to 2012.

54
b) Tertiary Enrolment ratio
c) Adult literacy rate
3. Information and Communications Technologies Infrastructure
a) Telephones Per 100 People (telephone mainlines + mobile phones)
b) Percent households with computers
c) Percent households with internet
The data are normalised using the following formula
It= ( Xt‐j ‐ Xt )/ Xt
where It is the normalised variable for period t and t‐j is the base year.
In other words the approach is to consider the country itself as the reference country and
calculate the distance in terms of an initial time point.
For this analysis the base year is 2010 and the estimated composite indicator is for 2014 (t‐
5)3.
The estimated values for the three pillars and the composite index are:
Innovation and Technological Adoption (2014) 25.1
Education and Training (2014) 11.6
ICT Infrastructure (2014) 47.2
SACKI (2014) 28.5
The pillars show that the improvements are highest in ICT infrastructure and lowest in
education and training.
3 The same approach can be used annually (t‐1). For purposes of this analysis a 5 year period has been used in order to capture growth over the most recent 5 years.

55
Figure 10: Radar Diagram of pillars of SACKI 2014
Figure 11: Radar Diagram of Indicators of SACKI 2014
Figures 10 and 11 show the performance of the pillars and individual indicators constituting
the SA Composite Knowledge Indicator. The indicator percent of households with internet (fig
2) exhibit the highest growth over the period.
0
10
20
30
40
50ICT
EducationInnovation
SACKI Pillars 2014
Pillars
0
20
40
60
80Telephones
Computers
Internet
Secondary
TertiaryLiteracy
Articles
Patents
TBP
SACKI Indicators 2014
Indicators

56
3.5 Recommendations
The knowledge based economy indicators are critical for the country’s economic and social
development. By monitoring appropriate the knowledge based economy NACI has the
potentials to make a valuable contribution to the country’s development and government
objectives.
In this document we discussed the concept of knowledge based economy and the various
approaches utilised internationally in order to monitor its growth and success. Two different
approaches used in order to estimate the knowledge economy and its growth. The first
approach involves the estimation of the value addition of the knowledge and technology
intensive industries and services in the country’s GDP. It is identified that the knowledge and
technology intensive industries and services contribute less than 20% in the country’s GDP.
This is half of the relevant contribution in the USA and below that of other countries like
Korea, China and Turkey.
The second indicator is a composite indicator monitoring the growth of the knowledge based
economy based on the World Bank’s indicator. It consists of three pillars ‐ Innovation and
Technological Adoption; Education and Training and ICT Infrastructure. Analysis of the pillars
shows that the ICT pillar made the highest contribution to the index over the period 2010‐
2014.
We suggest that these indicators make a contribution to the understanding of the knowledge
economy in South Africa and it is recommended that NACI monitors them regularly (e.g.
annually)
A relevant indicator with policy implications is “investments in the knowledge economy”. The
indicator has been recommended by the European Commission (2003). It monitors
investments in research and development (including tax investments); embodied technology;
investment in information technology; funding of higher education, venture capital and
others. It is recommended that NACI includes the development of that indicator in the set of
indicators monitoring the knowledge based economy.

57
4. SouthAfricaInnovationScoreboard2010‐14
4.1 Introduction
The South Africa Innovation Scoreboard provides an overtime assessment of the research and
innovation performance of the country and the relative strengths and weaknesses of its
research and innovation system. It aims to help decision makers to assess areas in which they
need to concentrate their efforts in order to boost the country’s innovation performance.
4.2 Measurement Framework
The South African Innovation Scoreboard is following as measurement framework the
Innovation Union Scoreboard (EC various).
Innovation performance is measured using a composite indicator which summarizes the
performance of a range of different indicators. The SA Innovation Scoreboard distinguishes
between 3 main types of indicators – Enablers, Firm activities and Outputs – and 7 innovation
dimensions (i.e. human resources; open excellent research system; finance and support; firm
investments; linkages & entrepreneurship; intellectual assets and economic effects). The total
of 16 indicators (with completed data)4 is used.
The enablers capture the main drivers of innovation performance external to the firm and
differentiate between 3 innovation dimensions ‐ human resources, open, excellent and
attractive research systems and finance and support.
Firm activities capture the innovation efforts at the level of the firm and differentiate between
3 innovation dimensions ‐firm investments, linkages and entrepreneurship, and intellectual
assets.
Outputs capture the effects of firms’ innovation activities i.e. economic effects.
Figure 12 shows the measurement framework of the SA Innovation Scoreboard.
4 The Innovation Union Scoreboard uses 12 indicators for international comparisons. For South Africa the completed with data indicators are nine.

58
` Figure 12: Summary Innovation Index (SII)
Human
Resources
Open,
Excellent
Research
Systems
Finance
and
Support
New
doctorate
graduates
Population
with
tertiary
education
International
scientific co‐
publications
In top 10%
most cited
scientific
publications
R&D exp. in
the public
sector
Venture
capital
investments
OUTPUTS
SA
Innovation
Index (SII)
ENABLERS FIRM ACTIVITIES
Economic
Effects
Medium high
tech product
exports
High tech
product
License and
patent
revenues from
abroad
Exports in
commercial
Services
Firm
Investments
Linkage &
Entrepreneurship
Intellectual
Assets
R&D
expenditure
in the
business
sector
Public –
private co‐
publications
PCT patent
applications
PCT patent
applications
in societal
challenges ICT
investments

59
4.3 Data Sources and Approach
The South Africa Innovation Scoreboard uses the most recent statistics from local sources and
internationally recognised organisations such as the World Trade Organisation and OECD.
The data in this report relates to statistics for 2014 for 11 of the 15 indicators. Three indicators
use data for 2013 and two indicators for 2012. While the use of dated indicators is common
practise internationally, the issue becomes of particular importance for composite indicators
focused on inter‐temporal comparisons.
Table 1 provides more information on the indicators used and their sources.
Table 15: Indicators used in the development of the South Africa Innovation Scoreboard
Type/Indicators Data Sources Comments
ENABLERS
New Doctorates per 1000 population aged 25‐34
Department of Higher Education and Training “Higher Education Information Management System” and Statistics South Africa
No of PhDs extrapolated. Actual most recent year 2013
% population aged 20‐64 having completed tertiary education
Statistics South Africa “Population Census 2011”
Estimates from population censuses
International scientific co publications per million population
“World of Knowledge” Thomson Reuters and Statistics South Africa
Data for 2010 and 2015
Scientific publications among the top10% most cited publications worldwide as % of total scientific publications in the country
“In Cites Essential Science Indicators” Thomson Reuters
Data for 5 year periods, 2006‐10 and 2011‐15
R&D expenditure in the public sector (% of GDP)
Department of Science and Technology
Public sector is estimated as government and higher education (most recent data 2013 for 2014)
Venture capital (% of GDP) Southern Africa Venture Capital and
Data for 2014

60
Private Equity Association
FIRM ACTIVITIES
R&D expenditure in the business sector (% of GDP)
Department of Science and Technology
Data for 2013 for 2014
Public Private co‐publications per million population
“World of Knowledge” Thomson Reuters and Statistics South Africa
Data for 2 year periods, 2009‐2010 and 2014‐15
PCT Patent *applications per billion GDP
OECD Databases 2013 for 2014 in PPP
PCT Patent applications IN SOCIETAL CHALLENGES per billion GDP
OECD Databases 2012 for 2014 IN PPP
ICT Investments as % of GDP Statistics South Africa “National Accounts”
Data for 2012 for 2014
OUTPUTS
Licence and patent revenues from abroad as % of GDP
Reserve Bank Data for 2014
Contribution of High Tech product exports to total exports
World Trade Organisation databases
Data for 2014
Contribution of Medium High Tech product exports to total exports
World Trade Organisation databases
Data for 2014
Contribution of exports in commercial services to total exports
World Trade Organisation databases
Data for 2014
The data are normalised using the following formula:
It= ( Xt‐j ‐ Xt )/ Xt‐j
Where It is the normalised variable for period t and t‐j is the base year.
In other words the approach is to consider the country itself as the reference country and
calculate the distance in terms of an initial time point.
The normalised indicators are aggregated with equal weights to create the innovation
dimensions. The three dimensions are further aggregated in the composite indicator. All
dimensions are allocated equal weights.
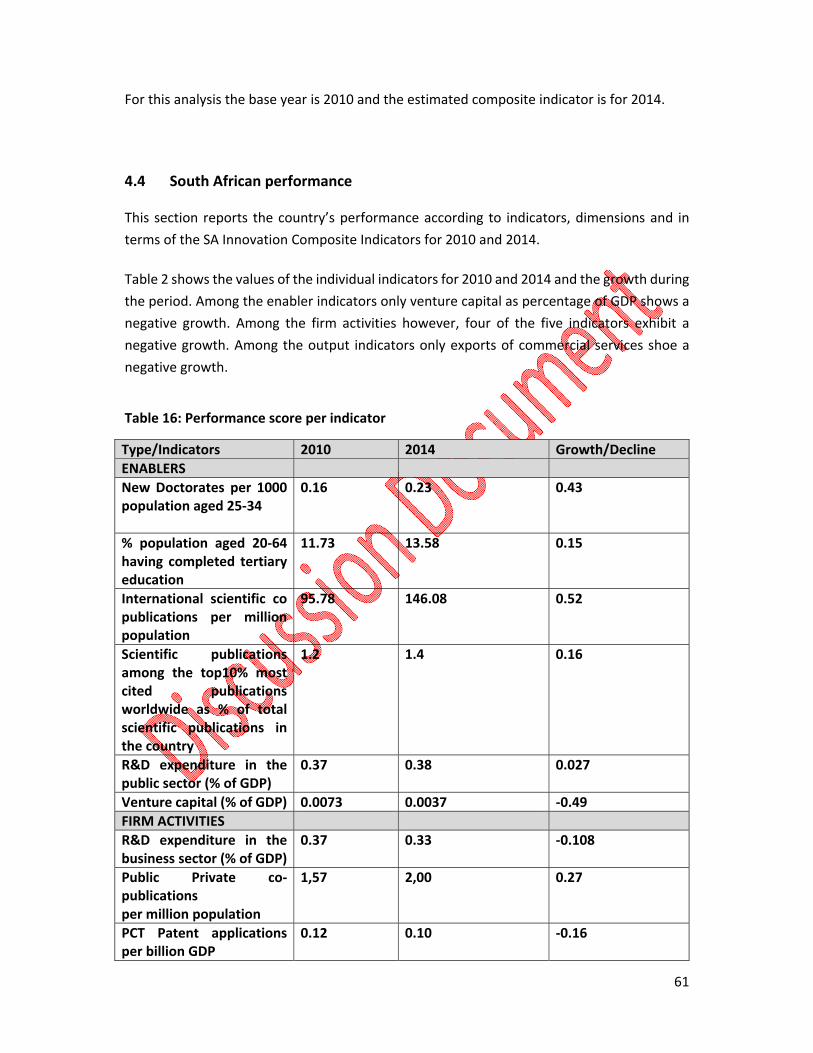
61
For this analysis the base year is 2010 and the estimated composite indicator is for 2014.
4.4 South African performance
This section reports the country’s performance according to indicators, dimensions and in
terms of the SA Innovation Composite Indicators for 2010 and 2014.
Table 2 shows the values of the individual indicators for 2010 and 2014 and the growth during
the period. Among the enabler indicators only venture capital as percentage of GDP shows a
negative growth. Among the firm activities however, four of the five indicators exhibit a
negative growth. Among the output indicators only exports of commercial services shoe a
negative growth.
Table 16: Performance score per indicator
Type/Indicators 2010 2014 Growth/Decline
ENABLERS
New Doctorates per 1000 population aged 25‐34
0.16 0.23 0.43
% population aged 20‐64 having completed tertiary education
11.73 13.58 0.15
International scientific co publications per million population
95.78 146.08 0.52
Scientific publications among the top10% most cited publications worldwide as % of total scientific publications in the country
1.2 1.4 0.16
R&D expenditure in the public sector (% of GDP)
0.37 0.38 0.027
Venture capital (% of GDP) 0.0073 0.0037 ‐0.49
FIRM ACTIVITIES
R&D expenditure in the business sector (% of GDP)
0.37 0.33 ‐0.108
Public Private co‐publications per million population
1,57 2,00 0.27
PCT Patent applications per billion GDP
0.12 0.10 ‐0.16

62
PCT Patent applications IN SOCIETAL CHALLENGES per billion GDP
0.03 0.028 ‐0.06
ICT Investments as % of GDP
3.2 2.9 ‐0.09
OUTPUTS
Licence and patent revenues from abroad as % of GDP
0.31 0.47 0.51
Contribution of High Tech product exports to total exports
0.028 0.037 0.32
MH Tech product exports to total Exports
0.0249 0.251 0.009
Contribution of exports in commercial services to total exports
0.189 0.181 ‐0.038
Figure 13 shows the performance of the three innovation dimensions during the period.
Outputs exhibit a higher growth than the enablers and the firm activities show a negative
growth. The policy implication is that government should take action to encourage businesses
to undertake innovation.
Figure 13: Performance of Innovation dimensions 2010‐14
The SA composite innovation indicator 2014 with base 2010 is 0.11. The index shows a growth
even though the firm activities were contracting during the period.
‐0.05
0
0.05
0.1
0.15
0.2Enablers
Firm ActivitiesOutputs
South African Innovation Performance Growth 2010‐2014

63
4.5 Discussion and Recommendations
This section develops the SA composite innovation indicator. The indicator can provide inter‐
temporal information for the performance of the country’s innovation system.
The measurement framework used is that of the Innovation Union Scoreboard developed and
used by the European Commission to monitor the performance of the European countries.
The European effort provides comparative information of the European countries and South
Africa and hence, the two composite indicators complement each other. The one provides
information related to the country’s performance over time and the other in comparison to
the rest of the world.
The Innovation Union Scoreboard is using 12 indicators for the non European comparisons
mainly because additional data are not available. South Africa is covered by nine indicators
because of non availability of data.
The SA composite innovation indicator utilises 15 indicators including values for the three
indicators not included in the European effort.
The SA composite indicator does not include a number of indicators related to innovation as
the SA Innovation Surveys are currently behind schedule. Provided that the innovation
surveys will provide reliable information the composite indicators can be expanded with
additional indicators (e.g. SMMEs innovating in house; non R&D innovation expenditures etc).
An important issue related to the SA Composite Innovation Indicator is the timely availability
of raw data. The international efforts focus on inter country comparisons and they use most
recent data that may be a few years old. The obvious solution for the inter‐temporal indicator
is firstly to use equivalent data that become available on time. For example, USPTO patents
statistics are becoming available a lot sooner than the PCT statistics. Hence, it is
recommended that the PCT statistics are replaced with USPTO data.
Simialrly NACI should request the early development and publishing of the SA Innovation
Surveys.
The main findings and recommendations of the report are as follows:
1. International composite indicators are used internationally and can be utilised in
order to inform NACI about the country’s relevant innovation position over time and
internationally. The Global Innovation Index and the Innovation Union Scoreboard
are important in the international context. A document focused on South Africa
should be produced regularly describing the country’s performance together with
clarifications and the possible shortcomings of the indices. The document should be

64
written in a way that can be understood by non experts in the field of innovation and
indicators.
2. The “South African Composite Indicator” has been developed in order to monitor the
performance of the national system of innovation over time. The Indicator has been
developed in accordance with the international standards taking care that the
normalization process maintains comparability over time. The indicator should be
expanded to cover a period of at least ten years (since 2000) and use the currently
available variables in the country. Similarly the indicator should be updated regularly.
3. The “South African Composite Indicator” should be expanded in order to fulfil the
monitoring needs of the country and NACI. Suggested additions include: a sub‐pillar
under “outputs” covering “social effects”; a variable under “open, excellent research
systems” covering non SA doctorate students; a variable under “linkages and
entrepreneurship” covering business support for university research.
4. Partial innovation indicators are particularly useful for addressing issues of priority in
the policy community and the decision makers. In this document we have described
selectively indicators related to Knowledge Intensive Economy; to Technology
Transfer from the universities and research organisations and related to Human
Talent. In this context a composite indicator related to the knowledge based economy
has been developed. The development of additional partial indicators should follow
(e.g. for technology transfer; human talent etc).
5. A number of international composite indicators include South Africa. However, often
the developers do not have access to all South African data. NACI should monitor
these efforts and offer to provide the missing indicators. Similarly, the locally
developed indicators can be improved with the addition of variables which are not
currently available. For example, the SA innovation surveys are not currently
available. NACI should monitor and advice that efforts to provide relevant
information should be available and up to date.

65
Appendice
Appendix 1: South Africa‐ Detailed Profile 2013 GII
Key indicators Population (millions) ........................................................................................................ 51.1 GDP (US$ billions) ............................................................................................................ 390.9 GDP per capita, PPP$ .................................................................................................. 11,302.2 Income group ......................................................................................... Upper‐middle income Region.......................................................................................................... Sub‐Saharan Africa
Score (0–100) or Value (hard data) Rank
Global Innovation Index (out of 142) .................................. 37.6 58 Innovation Output Sub‐Index .................................................................................. 31.3 71 Innovation Input Sub‐Index................................................................................ 43.9 51 Innovation Efficiency Ratio.................................................................................. 0.7 99 Global Innovation Index 2012 (based on GII 2012 framework) ........................... 37.4 54 1 Institutions .................................................... 70.1 44 1.1 Political environment.......................................................................... 63.5 51 1.1.1 Political stability*.................................................................................... 66.6 68 1.1.2 Government effectiveness* ............................................................ 48.5 52 1.1.3 Press freedom* ........................................................................................ 75.4 43 1.2 Regulator y environment .................................................................. 76.4 42 1.2.1 Regulatory quality* .............................................................................. 61.0 53 1.2.2 Rule of law*............................................................................................... 49.9 55 1.2.3 Cost of redundancy dismissal, salary weeks #........................... 9.3 33 1.3 Business environment ........................................................................ 70.4 45 1.3.1 Ease of star ting a business* ............................................................ 89.0 35 1.3.2 Ease of resolving insolvency*........................................................ 38.2 75 1.3.3 Ease of paying taxes*#.......................................................................... 83.9 25 2 Human capital & research.......................... 23.7 102 2.1 Education ................................................................................................... 48.6 82 2.1.1 Current expenditure on education, % GNI .............................. 5.5 30 2.1.2 Public expenditure/pupil, % GDP/cap ....................................... n/a n/a 2.1.3 School life expectancy, years.................................................... n/a n/a 2.1.4 PISA scales in reading, maths, & science .................................. n/a n/a 2.1.5 Pupil‐teacher ratio, secondary ...................................................... 25.0 107 2.2 Tertiary education .................................................................................... 0.6 141 2.2.1 Tertiary enrolment, % gross............................................................... n/a n/a 2.2.2 Graduates in science & engineering, % .................................... n/a n/a 2.2.3 Tertiary inbound mobility, % ............................................................. n/a n/a 2.2.4 Gross tertiary outbound enrolment, %...................................... 0.1 135

66
2.3 Research & development (R&D)................................................... 21.8 38 2.3.1 Researchers, headcounts/mn pop. ......................................... 820.0 57 2.3.2 Gross expenditure on R&D, % GDP............................................... 0.9 36 2.3.3 QS university ranking, average score top 3*# ........................ 39.5 33 3 Infrastructure................................................ 28.5 83 3.1 Information & communication technologies (ICTs)........ 28.5 87 3.1.1 IC T access* ................................................................................................. 37.9 86 3.1.2 IC T use* ....................................................................................................... 14.6 86 3.1.3 Government’s online service* ............................................................ 45.8 81 3.1.4 E‐participation*....................................................................................... 15.8 79 3.2 General infrastructure........................................................................... 36.6 39 3.2.1 Electricity output, kWh/cap..................................................... .......... 5,134.0 41 3.2.2 Electricity consumption, kWh/cap...................................... ....................... 4,802.6 40 3.2.3 Logistics performance* #..................................................................... 66.8 22 3.2.4 Gross capital formation, % GDP ................................................... 21.0 84 3.3 Ecological sustainability.................................................................... 20.3 114 3.3.1 GDP/unit of energy use, 2000 PPP$/k g oil eq........................ 3.5 105 3.3.2 Environmental performance*........................................................ 34.5 120 3.3.3 ISO 14001 environmental certificates/bn PPP$ GDP........ 1.5 48 4 Market sophistication #................................. 66.0 16 4.1 Credit #............................................................................................................. 56.9 31 4.1.1 Ease of getting credit*#.................................................................... 100.0 1 4.1.2 Domestic credit to private sector, % GDP.#............................ 135.0 16 4.1.3 Micro finance gross loans, % GDP.................................................. 0.6 47 4.2 Investment #................................................................................................ 63.9 10 4.2.1 Ease of protecting investors* #......................................................... 83.0 10 4.2.2 Market capitalization, % GDP#...................................................... 209.6 1 4.2.3 Total value of stocks traded, % GDP #.......................................... 91.2 10 4.2.4 Venture capital deals/tr PPP$ GDP ................................................ 0.0 71 4.3 Trade & competition ........................................................................... 77.1 65 4.3.1 Applied tariff rate, weighted mean, % ........................................ 4.4 75 4.3.2 Non‐agricultural mkt access weighted tariff, %.................... 1.3 82 4.3.3 Intensity of local compe on†..................................................... 67.8 51 5 Business sophistication .............................. 31.5 71 5.1 Knowledge workers............................................................................... 37.9 90 5.1.1 Knowledge ‐intensive employment, % .................................... 15.2 82 5.1.2 Firms offerring formal training, % firms.................................... 36.8 47 5.1.3 R&D per formed by business, % GDP ........................................... 0.5 34 5.1.4 R&D financed by business, %........................................................ 42.5 38 5.1.5 GMAT mean score .............................................................................. 472.7 94 5.1.6 GMAT test takers/mn pop. 20–34............................................... 60.6 75 5.2 Innovation link ages.............................................................................. 28.3 59 5.2.1 University/industry research collabora on†# ........................ 58.5 29 5.2.2 State of cluster development†..................................................... 50.1 47 5.2.3 R&D financed by abroad, % ............................................................ 12.1 29

67
5.2.4 JV–strategic alliance deals/try PPP$ GDP .................................... 0.0 51 5.2.5 Patent families filed in 3+ offices/bn PPP$ GDP .................. 0.0 53 5.3 Knowledge absorption ...................................................................... 28.2 61 5.3.1 Royalty & license fees payments, % service imports #...... 10.8 6 5.3.2 High‐tech imports less re ‐imports, %...................................... 11.0 40 5.3.3 Comm., computer & info. Services imports, %....................... 2.6 95 5.3.4 FDI net inflows, % GDP ......................................................................... 1.4 114 6 Knowledge & technology outputs........... 24.7 79 6.1 Knowledge creation............................................................................. . 17.4 52 6.1.1 Domestic resident patent ap/bn PPP$ GDP ........................... 1.2 64 6.1.2 PC T resident patent ap/bn PPP$ GDP ........................................ 0.5 38 6.1.3 Domestic res utility model ap/bn PPP$ GDP ........................ n/a n/a 6.1.4 Scientific & technical articles/bn PPP$ GDP ......................... 15.0 55 6.1.5 Citable documents H index #......................................................... 216.0 33 6.2 Knowledge impact................................................................................. 34.1 68 6.2.1 Growth rate of PPP$ GDP/worker, % ........................................... 3.5 31 6.2.2 Ne w businesses/th pop. 15–64 ....................................................... 0.8 75 6.2.3 Computer soft ware spending, % GDP ........................................ 0.4 26 6.2.4 ISO 9001 quality certificates/bn PPP$ GDP............................. 6.1 60 6.2.5 High‐ & medium‐high‐tech manufactures, %.................... 26.2 38 6.3 Knowledge diffusion ........................................................................... 19.1 103 6.3.1 Royalty & license fees receipts, % service exports................ 0.4 56 6.3.2 High‐tech exports less re ‐ exports, %........................................... 2.5 56 6.3.3 Comm., computer & info. Services exports, %....................... 3.6 100 6.3.4 FDI net outflows, % GDP .................................................................. –0.1 117 7 Creative outputs .......................................... 37.8 68 7.1 Intangible assets .................................................................................... 45.9 54 7.1.1 Domestic res trademark reg/bn PPP$ GDP........................... 31.9 50 7.1.2 Madrid trademark registrations/bn PPP$ GDP ..................... n/a n/a 7.1.3 IC T & business model crea on†................................................... 63.3 43 7.1.4 IC T & organiza onal model crea on†...................................... 56.4 52 7.2 Creative goods & services ................................................................ 33.2 75 7.2.1 Audio ‐visual & related services exports, %.............................. n/a n/a 7.2.2 National feature films/mn pop. 15–69........................................ 0.6 86 7.2.3 Paid‐for dailies, circulation, % pop. 15–69................................ 4.5 87 7.2.4 Printing & publishing manufactures, %...................................... 2.3 33 7.2.5 Creative goods exports, % .................................................................. 0.7 62 7.3 Online creativity ..................................................................................... 26.2 75 7.3.1 Generic top ‐level domains (TLDs)/Th pop. 15–69 ............... 4.5 64 7.3.2 Country‐ code TLDs/th pop. 15–69............................................ 44.7 42 7.3.3 Wikipedia monthly edits/mn pop. 15–69 ........................... 313.9 101 7.3.4 Video uploads on YouTube/pop. 15–69 ................................. 53.7 107 * denotes index value †Survey based value #indicates strength
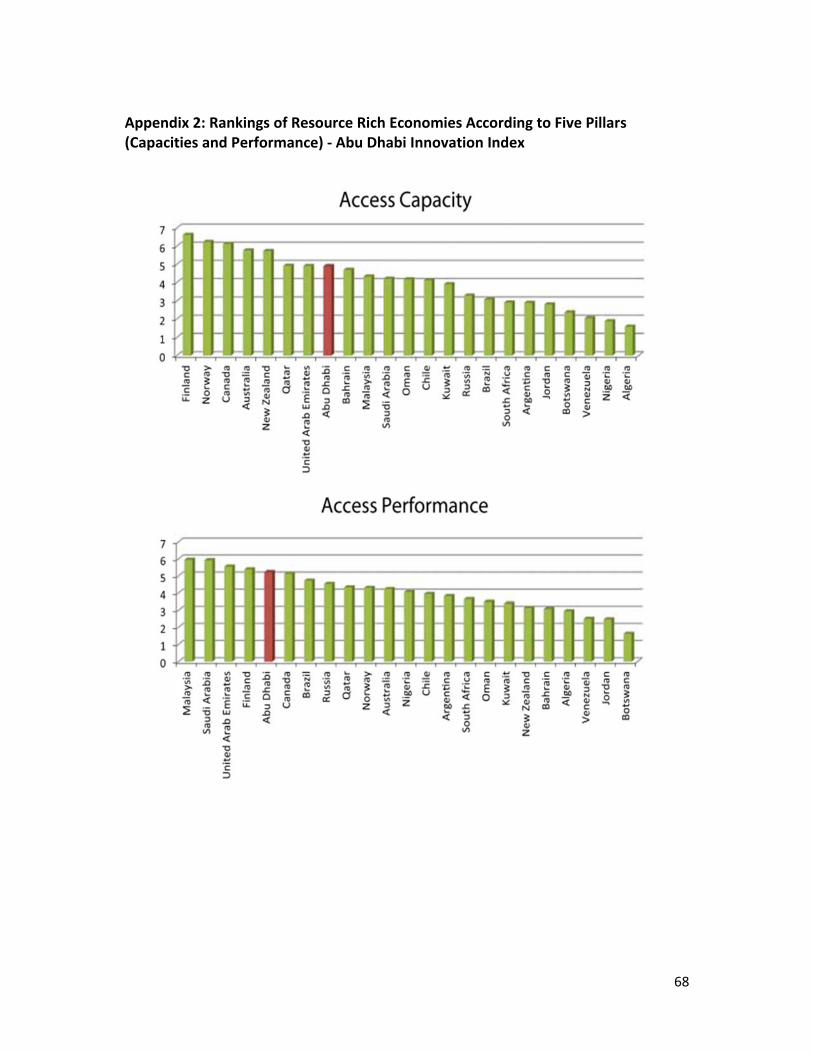
68
Appendix 2: Rankings of Resource Rich Economies According to Five Pillars (Capacities and Performance) ‐ Abu Dhabi Innovation Index

69

70
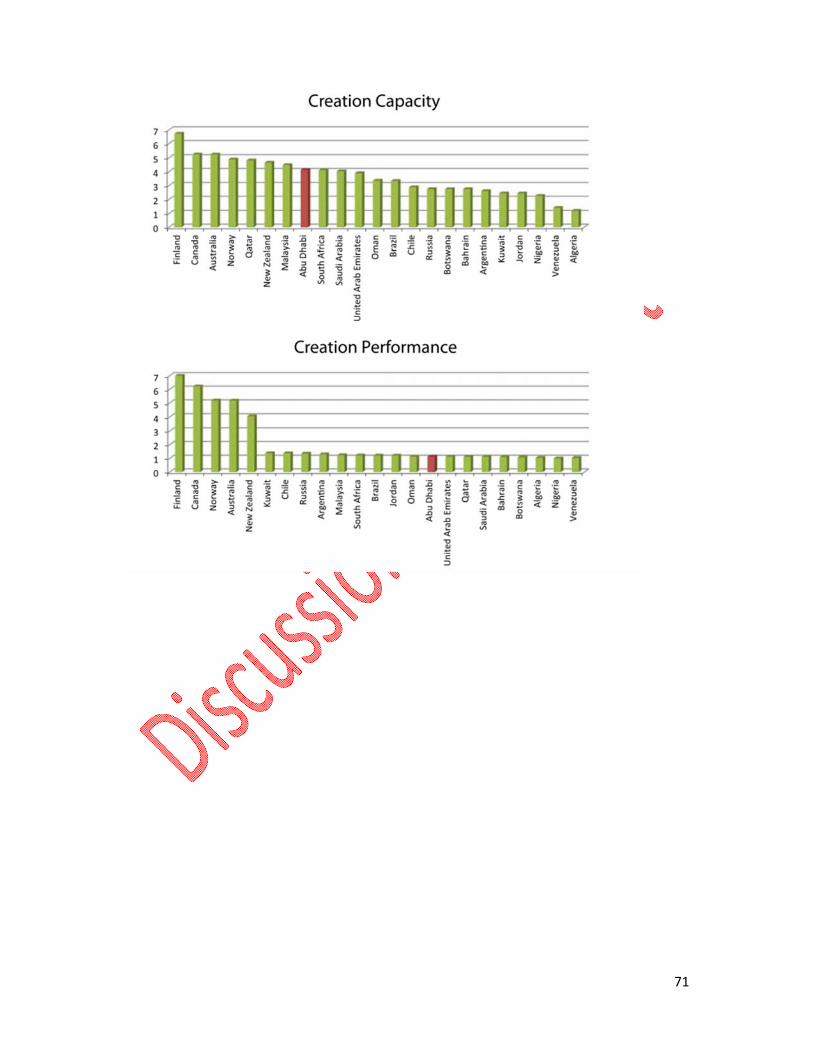
71

72
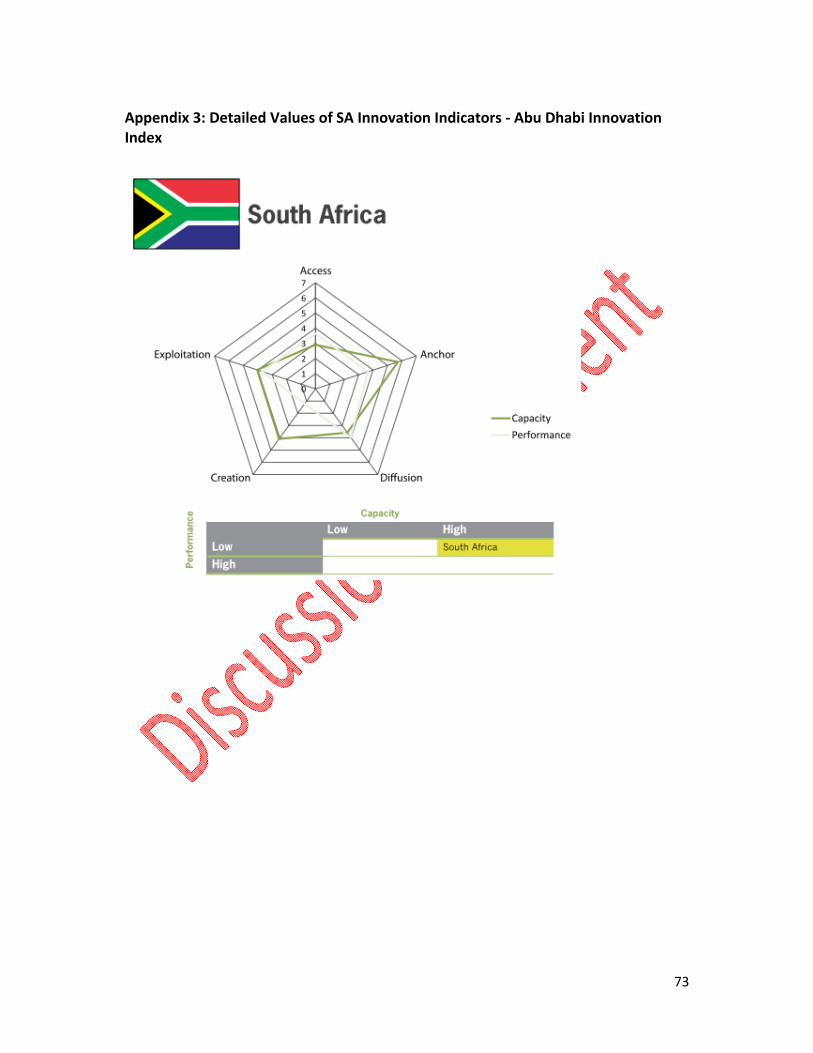
73
Appendix 3: Detailed Values of SA Innovation Indicators ‐ Abu Dhabi Innovation Index
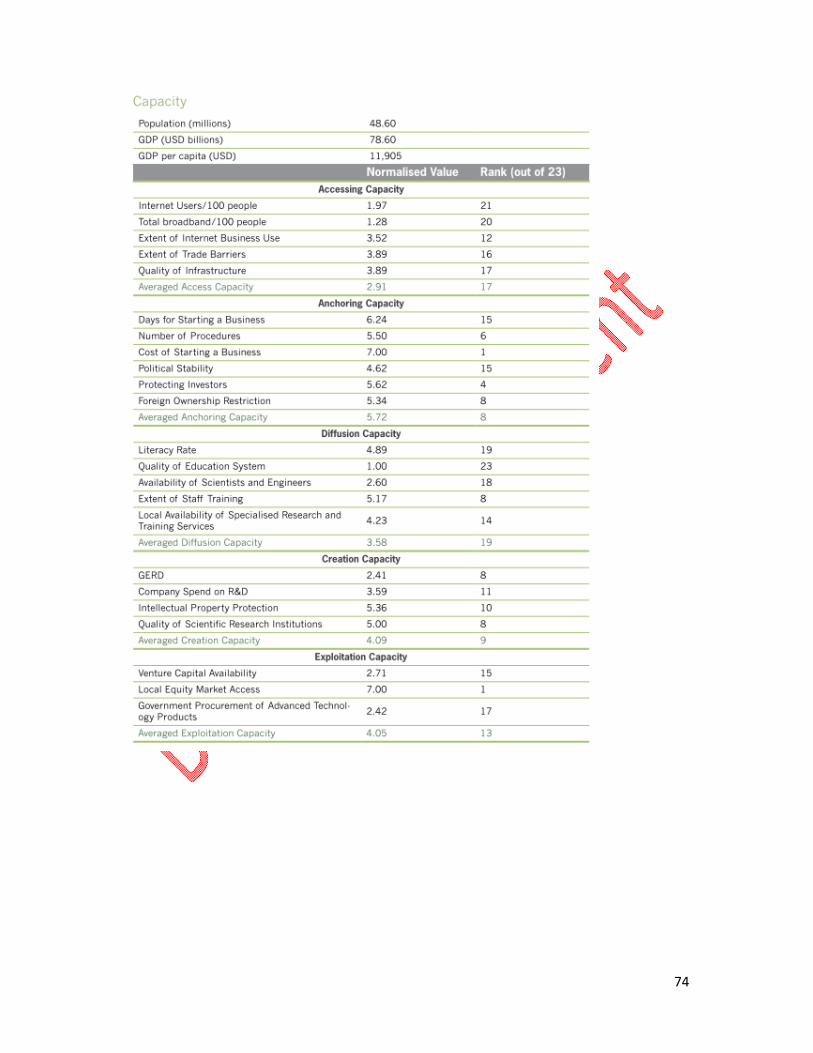
74
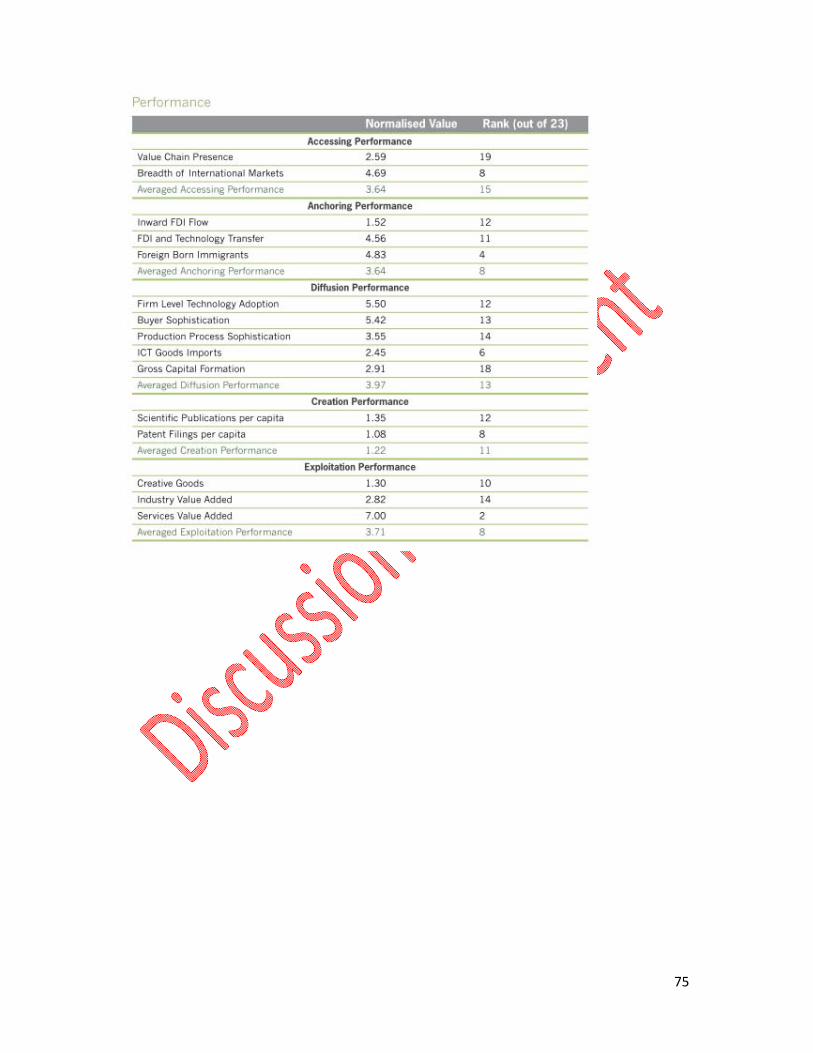
75

76
Appendix 4: Global Competitiveness Indicator‐South Africa
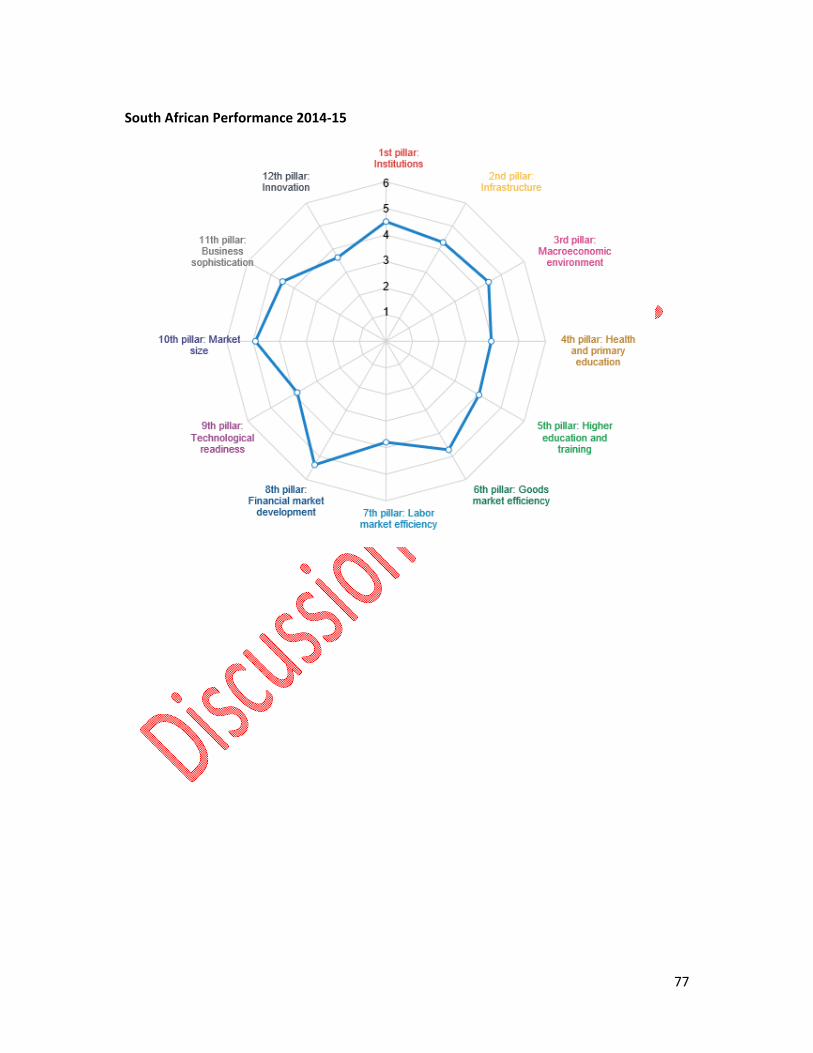
77
South African Performance 2014‐15

78

79
Appendix 5: Economic Gains from Research and Development
Economic Gains from R&D
The importance of R&D and of the associated innovations, for growth and employment, is well established in the economic literature. Estimates from both the firm and industry levels indicate that the social rate of return to R&D ranges from 20 to 100% depending on the sector and averages approximately 50%. By comparison, the net private rate of return to R&D varies from 20 to 30%. This difference justifies government involvement in order to improve social benefits.
Some of the most often cited studies on the field are the following:
Solow (1957) identified the factors that underlay the doubling in gross output per hour of work that the USA enjoyed between 1909 and 1949. He estimated that of all factors (capital, labour, savings, etc.) technical change had contributed seven eighths of the improvement in economic growth. Solow won the Nobel Prize in economics in 1987 for his studies.
Terleckyj found that Griliches rate of return to be quite comparable to his own value for the manufacturing industries of 37% return on private R&D when only direct R&D inputs were considered.
Zvi Griliches (1985), in a study of 883 companies representing more than 80% of the entire
industrial R&D conducted in the USA, found a 17% rate of return to total R&D, private plus
government funded, for the period 1957‐65. There was a wide range in the rate of return
by industry, with the chemical industry at the top at 93%; electric equipment and aircraft
and missiles at the bottom at 3‐5%; and metals, machinery, and motor vehicles in the
middle at 23 to 25%. For privately financed R&D alone, Griliches found a substantially
higher average return of 32 to 40%.
Chand (1978) examined the performance of 19 Canadian industries according to the amount they invested in R&D. He estimated that research‐intensive industries over a period of 13 years had a 50% higher growth in output, 29% higher growth in productivity and 56% lower growth in prices than other industries. In comparison with industries that did not undertake research, employment in the research‐intensive industries grew by 231% more, output expanded by 66% more, there was a 43% higher growth in productivity and 57% lower growth in prices.
Edwin Mansfield (1980) refined Terleckyj’s work on the 20 manufacturing industries by dividing R&D into its basic and applied components. He found a “strong relationship between the amount of basic research carried out by an industry and the industry’s rate of productivity increase during 1948‐1966”. In a further study of 37 innovations Mansfield (1982) compared the return on R&D for those innovations to the firm making the investment (the “private return”) with the return to society as a whole (the “social return”). He found a median private rate of return of about 25%, but a median social return of close to 70%.

80
The Office of Technology Assessment (OTA) (1986) in reviewing the productivity return to agricultural research concluded that all but one of the studies has shown a very high internal rate of return on public sector agricultural research… The rate of return varies from a low of 21% to a high of 110%, with the vast majority of the 33 to 66% range.
Coe et al (1995) of the Centre for Economic Policy Research examined the links between R&D and productivity gains in OECD countries from 1970 to 1990. They concluded that an increase in business R&D increases total factor productivity (TFP ‐ the output for a given input of labour and capital) with a response which was related to the total “stock” of R&D from domestic and foreign sources. The rate of return on industrial R&D was over 100% at the national level.
Bernstein (1996) estimated the rates of return to R&D in the Canadian communications equipment industry and the Canadian manufacturing sector. The estimated social rates of return were found to be 22.5% and 24% greater than the private rates of return respectively.
The OECD (1986) found that R&D is beneficial to the creation of employment. A country that lags behind in innovation tends to lose jobs to those countries that lead in the introduction of new technology.
Finally, the National Association of Manufacturers (NAM 1998) in their 1998 report identify that tax incentives offered by governments to industrial establishment have a substantial positive effect on the economy.
Econometric simulations run by NAM to assess the benefits of a 20% tax credit show that the economy will be 203% or US$28 billion higher after 20 years than it would be in the absence of the tax credit. Further, NAM examines the impact of a full 10% credit allowed on annual R&D investments made by companies instead of the incremental credit. The result is that GDP increases by US174 billion over 20 years. The study, which was submitted to the Congress concludes that increasing the credit will lower the cost of R&D even more, leading to more investment in research, faster gains in productivity and significantly larger gains in GDP.
More recent research (Kafouros 2007) identifies that R&D also drives significant organizational adaptations that favour business performance.

81
References
ADB (2014) “Innovative Asia: Advancing the Knowledge Based Economy‐The Next Policy Agenda” Asian Development Bank; Mandaluyong City, Philippines Aghion, P. and Howitt, P. (2007) “Capital, Innovation, and Growth Accounting,” Oxford Review of Economic Policy; Vol. 23, No. 1: 79‐93 Archibugi, D., Coco, A., (2004) “A New Indicator of Technological Capabilities for Developed and Developing Countries (ArCo)” World Development 4 (2004), 629–654 Arundel a., Hansen W., Kanerva M., (2008) “Knowledge based Economy” MERIT for the European Commission Bloomberg (2015) “The Bloomberg Innovation Index” available at http://www.bloomberg.com/visual‐data/best‐and‐worst//most‐innovative‐countries Brinkley, I. (2006) “Defining the Knowledge Economy” The Work Foundation Department of Economic Development Abu Dhabi (2014) “The Abu Dhabi Innovation Index” http://centres.insead.edu/innovation‐policy/publications/documents/En_IndexReport.pdf Desai M., Fukuda Parr S., Johansson C. Sagasti F. (2001) Measuring Technology Achievement of Nations and the Capacity of Participate in the Network Age” available at http://hdr.undp.org/sites/default/files/ip_desai‐2.pdf Desai M; Fukuda‐Parr S, Johansson C. Sagasti F (2002) “Measuring the Technology Achievement of Nations and the Capacity to Participate in the Network Age” Journal of Human Development 3(1): 95‐122 Drucker P. (1969) “The Age of Discontinuity, Guidelines to Our Changing Society” Harper & Row: New York DST (2002) “South Africa’s National Research and Development Strategy” Department of Science and Technology, Pretoria EC (2011) “Composite Indicator for Knowledge transfer” Report from the European Commission’s Expert Group on Knowledge Transfer Indicators; Luxembourg: Office for official publications of the European Communities EC (2014) “Innovation Union Scoreboards 2014” European Commission; Brussels Economist Intelligence Unit (2012) “The Global Index Report: the outlook to 2015” available at http://www.globaltalentindex.com/pdf/Heidrick_Struggles_Global_Talent_Report.pdf European Commission (2003) “Third European Report on Science & Technology Indicators 2003: Towards a knowledge‐based economy” European Commission, Brussels

82
European Commission (2004)”Composite Indicator on e‐business Readiness” DG JRC, European Commission, Brussels Fedderke, J.W. (2005). “Technology, human capital and growth” University of Cape Town, School of Economics; Working paper No 27 Giampietro M., Mayumi K., Munda G., (2004), “Integrated Assessment and Energy Analysis: Qualitative Assurance in Multi‐Criteria Analysis of Sustainability” quoted in EC (2005) “Tools for Composite Indicators Building” EUR 21682 EN available at http://farmweb.jrc.cec.eu.int/ci/bibliography.htm Godin B (2007) “Science, Accounting and Statistics: the Input‐Output Framework” Research Policy 36: 1388‐1403 Grupp H., Schubert T (2010) “Review and New Evidence on Composite Innovation Indicators for Evaluating National Performance” Research Policy 39: 67‐78 Hollanders H and Tarantola S. (2011) “Innovation Union Scoreboard 2010‐Methodology Report” accessed September 2015 at http://ec.europa.eu/enterprise/policies/innovation/files/ius‐methodology‐report_en.pdf Inglesi‐Lotz R. and Pouris A. (2013) “The influence of scientific research output of academics on economic growth in South Africa: an autoregressive distributed lag (ARDL) application” Scientometrics Volume 95, Issue 1 (2013), Page 129‐139 Jones, C. (2002) “Sources of U.S. Economic Growth in a World of Ideas,” American Economic Review; Vol. 92, No. 1: 220‐239 Johnson Cornell University, INSEAD, WIPO (2014) “The Global Innovation Index 2014: The human factor in Innovation” Fontainebleau Ithaca and Geneva available at http://www.globalinnovationindex.org/content.aspx?page=gii‐full‐report‐2014 Jorgenson, D. (2005) “Accounting for Growth in the Information Age,” Chapter 10 in Aghion, P and Durlauf, S. (editors) Handbook of Economic Growth 743‐815 JRC (2013) “Update on the Composite Indicators of Structural Change towards a More Knowledge‐Intensive Economy” Joint Research Center Scientific and Policy Reports; Luxembourg: Publications Office of the European Union KAM (2012) “Knowledge Economy Index” World Bank available at http://siteresources.worldbank.org/INTUNIKAM/Resources/2012.pdf McGillivray M (1991) “The Human Development Index‐ Yet another Redundant Composite Development Indicator” World Development 19 (10): 1461‐1468

83
Milken Institute (2001) “Knowledge‐based Economy Index” available at https://www.milkeninstitute.org Munda, G., Nardo, M., (2009) “Non‐compensatory/non‐linear Composite Indicators for Ranking Countries: a Defensible Setting”. Applied Economics 41, 1513–1523 OECD (1963) “Frascati Manual: Proposed Standard Practice for Surveys on Research and Experimental Development” Organisation for Economic Cooperation and Development, Paris OECD (2003) “Composite Indicators of Country Performance: A Critical Assessment” Organisation for Economic Cooperation and Development, Paris OECD (2008) “Handbook on Constructing Composite Indicators – Methodology and User Guide” Organisation for Economic Cooperation and Development, Paris ONS (2002) “Towards a Measurement Framework for International e‐Commerce Benchmarking” Office for National Statistics; London Otoiu, A; Titan, E; Dumitrescu, R. (2014) “Are the Variables used in Building Composite Indicators of Well Being Relevant? Validating composite indexes of well being” Ecological Indicators 46: 575‐585 Powell, H; Lee, D. (2014) “Modelling Spatial Variability in Concentrations of Single Pollutants and Composite Air Quality Indicators in Health Effects Studies” Journal of the Royal Statistical Society Series A‐ Statistics in Society 177 (3): 607‐623 Tkacova, A. (2012) “Composite Leading Indicators of Czech Business Cycle” Politica Economie 60(5):590‐613 Vertesy, D., Albrecht, D., Tarantola, S. (2012) ‘Composite Indicators measuring structural change, to monitor the progress towards a more knowledge‐intensive economy in Europe’, European Commission (EUR 25279 EN) World Bank (2008) “Knowledge for Development Program in the World’s Economies Measuring Knowledge, Knowledge Assessment Methodology and Knowledge Economy Index” The World Bank Institute’s Knowledge for Development Program (K4D) available at www.worldbank.org/kam, 2008 World Bank (2012) “Knowledge Assessment Methodology” Available at http://web.worldbank.org/WBSITE/EXTERNAL/WBI/WBIPROGRAMS/KFDLP/EXTUNIKAM/0,,contentMDK:20584278~menuPK:1433216~pagePK:64168445~piPK:64168309~theSitePK:1414721,00. html World Bank (2012) “Knowledge Economy Index” available at http://data.worldbank.org/data‐catalog/KEI World Economic Forum (2015) “Methodology: The 12 Pillars of Competitiveness” available at http://reports.weforum.org/global‐competitiveness‐report‐2014‐2015/methodology/