SOUTH AFRICA GREENHOUSE GAS (GHG) …...9.6 8 South Africa G20 average GREENHOUSE GAS (GHG)...
15
8 9.6 South Africa G20 average GREENHOUSE GAS (GHG) EMISSIONS (INCL. FORESTRY) PER CAPITA (tCO2e/capita) 1 SOUTH AFRICA Country Facts 2018 Source: CAT 2018 Based on implemented policies, South Africa’s GHG emissions are expected to increase to 658 MtCO2e by 2030 (excl. forestry). This emission pathway is not compatible with the Paris Agreement. 1 The less ambitious end of South Africa’s NDC is not consistent with the Paris Agreement‘s temperature limit but would lead to a warming of between 3°C and 4°C if all other governments would follow a similar level of ambition. The more ambitious end of the range would actually be rated “2°C compatible”. 2 South Africa’s sectoral policies still fall short of being consistent with the Paris Agreement, especially on coal power and energy efficiency in industry, but the country’s policy on renewable energy is promising. 3 Although South Africa aims to decrease coal power in the long run, the government decided to build additional coal power plants until 2024. The 2018 Integrated Resource Plan envisages a boost for renewable energy until 2030, and the government recommenced the stalled renewables programme in 2018 by signing outstanding contracts with independent power producers. The government announced in the 2018 Budget Speech that a long-delayed carbon tax, covering at least 75% of GHG emissions, would be implemented in January 2019. This country profile is part of the Brown to Green 2018 report. The full report and other G20 country profiles can be downloaded at: http://www.climate-transparency.org/g20-climate-performance/g20report2018 BROWN TO GREEN : THE G20 TRANSITION TO A LOW-CARBON ECONOMY | 2018 Data from 2017 | Source: Enerdata 2018 Source: Oil Change International 2017 SOUTH AFRICA ? ? ? The gap: Is South Africa on track to stay below the Paris Agreement temperature limit? Recent developments: What has happened since the Paris conference? Brown and green performance: Where does South Africa lead or lag compared to G20 countries? Data from 2017 | Source: Enerdata 2018 + 4° + 3° + 2° + 1.5° + 1.3° Current NDC 2 Data from 2015 | Source: PRIMAP 2018 SHARE OF GREEN PUBLIC FINANCE TO POWER % (2013-2015 annual average) ENERGY INTENSITY OF THE ECONOMY (Total Primary Energy Supply in TJ per GDP in million US$2015 (PPP)) G20 average: 4.72 SHARE OF COAL IN ENERGY SUPPLY % G20 average: 10% G20 average: 32% 7.98 42 % 68 % South Africa
Transcript of SOUTH AFRICA GREENHOUSE GAS (GHG) …...9.6 8 South Africa G20 average GREENHOUSE GAS (GHG)...

89.6South Africa G20 average
GREENHOUSE GAS (GHG) EMISSIONS (INCL. FORESTRY) PER CAPITA (tCO2e/capita)
1
SOUTH AFRICA Country Facts 2018
Source: CAT 2018
Based on implemented policies, South Africa’s GHG emissions are expected to increase to 658 MtCO2e by 2030 (excl. forestry). This emission pathway is not compatible with the Paris Agreement.1
The less ambitious end of South Africa’s NDC is not consistent with the Paris Agreement‘s temperature limit but would lead to a warming of between 3°C and 4°C if all other governments would follow a similar level of ambition. The more ambitious end of the range would actually be rated “2°C compatible”.2
South Africa’s sectoral policies still fall short of being consistent with the Paris Agreement, especially on coal power and energy effi ciency in industry, but the country’s policy on renewable energy is promising.3
Although South Africa aims to decrease coal power in the long run, the government decided to build additional coal power plants until 2024.
The 2018 Integrated Resource Plan envisages a boost for renewable energy until 2030, and the government recommenced the stalled renewables programme in 2018 by signing outstanding contracts with independent power producers.
The government announced in the 2018 Budget Speech that a long-delayed carbon tax, covering at least 75% of GHG emissions, would be implemented in January 2019.
This country profi le is part of the Brown to Green 2018 report. The full report and other G20 country profi les can be downloaded at: http://www.climate-transparency.org/g20-climate-performance/g20report2018
BROWN TO GREEN: THE G20 TRANSITION TO A LOW-CARBON ECONOMY | 2018
Data from 2017 | Source: Enerdata 2018 Source: Oil Change International 2017
SOUTH AFRICA
???
The gap: Is South Africa on track to stay below the Paris Agreement temperature limit?
Recent developments: What has happened since the Paris conference?
Brown and green performance: Where does South Africa lead or lag compared to G20 countries?
Data from 2017 | Source: Enerdata 2018
+ 4°
+ 3°
+ 2°
+ 1.5°+ 1.3°
Current NDC2
Data from 2015 | Source: PRIMAP 2018
SHARE OF GREEN PUBLIC FINANCE TO POWER% (2013-2015 annual average)
ENERGY INTENSITY OF THE ECONOMY(Total Primary Energy Supply in TJ per GDP in million US$2015 (PPP))
G20 average: 4.72
SHARE OF COAL IN ENERGY SUPPLY%
G20 average: 10%G20 average: 32%
7.98 42%68%
South Africa

SOUTH AFRICA Country Facts 2018
2
BROWN TO GREEN: THE G20 TRANSITION TO A LOW-CARBON ECONOMY | 2018
BACKGROUND INDICATORS: SOUTH AFRICA
SOUTH AFRICA’S EXPOSURE TO CLIMATE IMPACTS6
This indicator shows the extent to which human society and its supporting sectors are aff ected by the future changing climate conditions based on an approximately 2°C scenario. This sectoral exposure will be even higher given that the eff orts depicted in current NDCs will lead to an approximately 3°C scenario.
Own composition based on ND-GAIN 2017 (based on data for 2016)
Projected climate impacts on cereal yields
Projected climate impacts on annual run-off
Projected climate impacts on a spread of malnutrition and diarrhoeal diseases
Projected climate impacts on biomes occupying the countries
Projected climate impacts on frequency of high temperature periods
Projected climate impacts on hydropower generation capacity
low
low
low
low
low
low
high
high
high
high
high
high
G20 country range
G20 country range
G20 country range G20
G20
G20 country range
G20
G20
G20
G20
G20
low
low
low
low
low
low
high
high
high
high
high
Projected increase of food demand due to population growth
Projected climate impacts on annual groundwater recharge
Projected climate impacts on spread of vector-borne diseases
Projected climate impacts on marine biodiversity
Projected climate impacts on frequency and severity of fl oods
Proportion of coastline impacted by sea level rise
FOOD
WATER
HEALTH
ECOSYSTEM SERVICE
HUMAN HABITAT
INFRASTRUCTURE
G20 country range
Source: World Bank 2017 Data from 2017 | Source: UNDP 2018
20,79013,092G20 averageSouth Africa
0.70GDP PER CAPITA4 (PPP US$ const. 2015, international)
HUMAN DEVELOPMENT INDEX5
lowlow very high
high
GREENHOUSE GAS (GHG) EMISSIONS
SOUTH AFRICA Country Facts 2018
3
BROWN TO GREEN: THE G20 TRANSITION TO A LOW-CARBON ECONOMY | 2018
CCPI PERFORMANCE RATING OF GHG EMISSIONS PER CAPITA 8
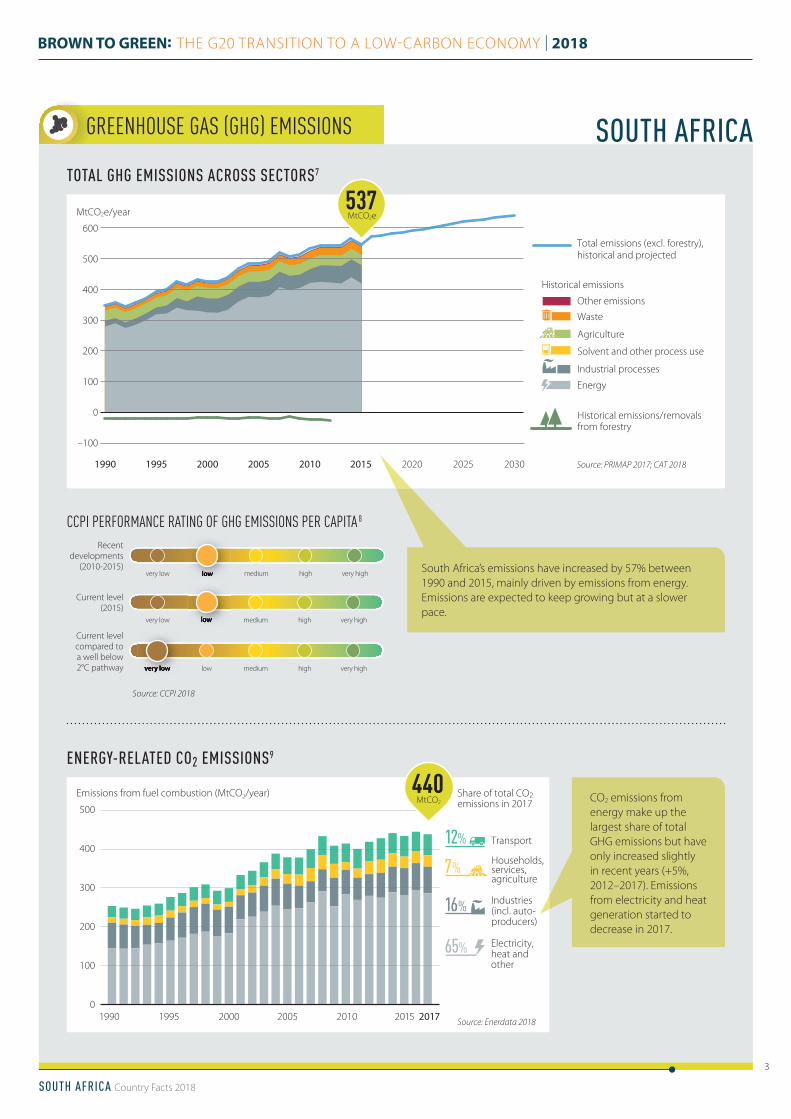
South Africa’s emissions have increased by 57% between 1990 and 2015, mainly driven by emissions from energy. Emissions are expected to keep growing but at a slower pace.
Source: CCPI 2018
Source: PRIMAP 2017; CAT 2018
Recent developments
(2010-2015)very low low medium high very high
very low low medium high very high
very low low medium high very high
Current level (2015)
Current level compared to a well below 2°C pathway
ENERGY-RELATED CO2 EMISSIONS9
TOTAL GHG EMISSIONS ACROSS SECTORS7
Source: Enerdata 2018
low
low
very low
SOUTH AFRICA
CO2 emissions from energy make up the largest share of total GHG emissions but have only increased slightly in recent years (+5%, 2012–2017). Emissions from electricity and heat generation started to decrease in 2017.
Agriculture
Industrial processes
Energy
Total emissions (excl. forestry), historical and projected
Historical emissions/removals from forestry
Waste
Other emissions
Historical emissions
Solvent and other process use
600
500
400
300
200
100
0
–100
MtCO2e/year
1990 1995 2000 2005 2010 2015 2020 2025 2030
MtCO2e537
Emissions from fuel combustion (MtCO2/year)
1990 1995 2000 2005 2010 2015 2017
Share of total CO2 emissions in 2017
Industries (incl. auto-producers)
Electricity, heat and other
Transport
Households, services,agriculture
12%
7 %
16 %
65%
500
400
300
200
100
0
MtCO2
440

DECARBONISATIONDECARBONISATION
SOUTH AFRICA Country Facts 2018
4
BROWN TO GREEN: THE G20 TRANSITION TO A LOW-CARBON ECONOMY | 2018
very low low medium high very high
ENERGY MIX 10
Share in 2017
68 %
15 %
3 %5 %
3 % Gas
Renewables(incl. hydro and excl.residential biomass)
Nuclear
Oil
Coal
7 % Other
Total primary energy supply (PJ)
1990 1995 2000 2005 20152010 20170
1,000
2,000
3,000
4,000
5,000
6,000
7,000
Fossil
New renewables
'Zero-carbon'(excl. new renewables)
Others (traditional biomass in residential)
New renewables
Nuclear
Hydro
Total 'Zero-carbon'
Share of fossil, 'zero-carbon', new renewables and others in energy supply (%)
1990 1995 2000 2005 20152010 2017
37%66%3 % 22 % 38 %
41%
SOUTHAFRICA
'ZERO-CARBON' SHARES
G20
0
20 %
40 %
60 %
80 %
100 %
Source: own evaluation
Source: Enerdata 2018
Source: Enerdata 2018
SHARE OF FOSSIL FUELS AND ’ZERO-CARBON’ FUELS IN ENERGY SUPPLY 11
Note: Traditional biomass in residential use is excluded from the share of renewables and refl ected as „Others“. The share of renewables in power generation (incl. large hydro) shown on p.7 is 4%, increasing due to wind and solar.
PERFORMANCE RATING OF SHARE OF FOSSIL FUELS12
PERFORMANCE RATING OF SHARE OF ZERO-CARBON TECHNOLOGY12
very low low medium high very high
very low low medium high very high
very low low medium high very high
Recent developments (2012-2017)
Recent developments (2012-2017)
Current level (2017)
Current level (2017)
Source: own evaluation
Zero-carbon fuels include nuclear, hydropower, new renewables. These sources account for 7% of South Africa’s energy supply, below the G20 average (14%), but the share increased by 17% (2012–2017).
medium high
very low low medium
very low low medium
SOUTH AFRICA
high very high

DECARBONISATIONDECARBONISATION
SOUTH AFRICA Country Facts 2018
5
BROWN TO GREEN: THE G20 TRANSITION TO A LOW-CARBON ECONOMY | 2018
Source: Enerdata 2018
NEW RENEWABLES13
Source: Enerdata 2018
PERFORMANCE RATING OFENERGY USE PER CAPITA12
PERFORMANCE RATING OFNEW RENEWABLES12
very low low medium high very high
very low low medium high very high
very low low medium high very high
very low low medium high very high
7AENERGY USE PER CAPITA 14
Recent developments (2012-2017)
Recent developments (2012-2017)
Current level (2017)
Current level (2017)
Source: own evaluation
Source: own evaluation
“New renewables” excludes unsustainable renewable sources such as large hydropower. New renewables make up 5% of South Africa’s energy mix, like the G20 average. Total production from new renewables only increased by 14% (2012–2017), which is well below the average G20 trend of +35%.
4.5%
Share of TPES in 2017
Biomass (excl. traditionalbiomass in residential)
0.0% Geothermal
0.2% Solar
0.2% Wind
0
50
100
150
200
250
300
Total primary energy supply (TPES) from new renewables (PJ)
1990 1995 2000 2005 20152010 2017
of totalPJ
5%
Total primary energy supply (TPES) per capita (GJ/capita)
1990 1995 2000 2005 20152010 2017
50
0
25
75
125
100
SOUTH AFRICA G20
GJ/capita103
Energy use per capita in South Africa has decreased by 7% (2012–2017), contrary to a slight increase in the G20 (1%).
high very high
medium high
medium high
low medium
SOUTH AFRICA

DECARBONISATIONDECARBONISATION
SOUTH AFRICA G20
0
10
20
30
40
50
60
70
80
Tonnes of CO2 per unit of
total primary energy supply (tCO2/TJ)
1990 1995 2000 2005 20152010 2017
tCO275
SOUTH AFRICA Country Facts 2018
6
BROWN TO GREEN: THE G20 TRANSITION TO A LOW-CARBON ECONOMY | 2018
PERFORMANCE RATING OF CARBON INTENSITY 12
ENERGY INTENSITY OF THE ECONOMY15
CARBON INTENSITY OF THE ENERGY SECTOR16
Total primary energy supply (TPES) per unit of GDP (PPP)(TJ/million US$ 2015)
1990 1995 2000 2005 20152010 2017
2
0
4
6
8
10
12
SOUTH AFRICA G20
TJ/million$8.0
Source: Enerdata 2018
Source: own evaluation
PERFORMANCE RATING OF ENERGY INTENSITY12
This indicator quantifi es how much energy is used for each unit of GDP. South Africa is among the G20 countries with the highest energy intensity, and the intensity is decreasing at a slower pace (-5%, 2012–2017) than in the G20 (-11%).
South Africa‘s energy sector is among those G20 countries with the highest carbon intensity, refl ecting the high share of coal in the energy mix. South Africa also has one of the highest growth rates (+4%, 2012–2017).
Source: Enerdata 2018
Source: own evaluation
Recent developments
(2012-2017)
Current level (2017)
very low low medium high very high very low low medium high very highvery low very low
Recent developments
(2012-2017)
Current level (2017)
very low low medium high very high very low low medium high very highmedium very low
SOUTH AFRICA

DECARBONISATIONDECARBONISATION
SOUTH AFRICA Country Facts 2018
7
BROWN TO GREEN: THE G20 TRANSITION TO A LOW-CARBON ECONOMY | 2018
0.97
SOUTH AFRICA
SECTOR-SPECIFIC INDICATORS
POWER SECTOR
TRANSPORT SECTOR
BUILDING SECTOR
MARKET SHARE OF ELECTRIC VEHICLES IN NEW CAR SALES (%)
SHARE OF RENEWABLES IN POWER GENERATION (incl. large hydro)
SHARE OF POPULATION WITH ACCESS TO ELECTRICITY
SHARE OF POPULATION WITH BIOMASS DEPENDENCY
Data from 2017Source: Enerdata 2018
Data from 2017Source: Enerdata 2018
Data from 2017Source: IEA 2018
Data from 2014 | Source: Agora Verkehrswende 2018
Data from 2014/2006 | Source: Agora Verkehrswende 2018 Source: Agora Verkehrswende 2018
Data from 2016Source: Enerdata 2018
Data from 2017Source: Enerdata 2018
Data from 2016Source: World Bank 2018
Data from 2014Source: IEA 2016
EMISSIONS INTENSITY OF THE POWER SECTOR(gCO2/kWh)
10%G20 South Africa
Trend:
Trend:
Trend:
Trend:
Trend:
Trend:
Trend:
3,920 3,675
OF THE POWER SECTOR/kWh)
962
G20 average
MOTORISATION RATE(Vehicles per 1000 inhabitants)
TRANSPORT EMISSIONS PER CAPITA(tCO2/capita)
Data from 2015Source: PRIMAP 2018
INDUSTRY EMISSIONS INTENSITY (tCO2e/thousand US$2015 sectoral GDP (PPP))
0.60
Data from 2015Source: PRIMAP 2018
100%
Data from 2015Source: PRIMAP 2018
AGRICULTURE EMISSIONS INTENSITY (tCO2e/thousand US$2015 sectoral GDP (PPP))
2.28
FOREST SECTORAGRICULTURE SECTORINDUSTRY SECTOR
G20 average: 24%
Data from 2016Source: Enerdata 2018
G20 average G20 average: 0.357 G20 average: 0.95
0.48
BUILDING EMISSIONS PER CAPITA(tCO2/capita)
84%
+ 12%
- 1%
+ 94%
- 17%
- 12%
- 3%
roadrailinland waterways
airpipeline
Legend for trend: negative positive
120
4%
Trend: + 10%
ELECTRICITY DEMAND PER CAPITA(kWh/capita)
The trend number shows developments over the past � ve years, where data is available
FREIGHT TRANSPORT(modal split in % of tonne-km)
PASSENGER TRANSPORT(modal split in % of passenger-km)
FOREST AREA COMPARED TO 1990 LEVEL (%)
G20 average
962490
1.13
0.41
carbusrail
- 1%
n.a. n.a.

CLIMATE POLICY
Source: own compilation based on UNFCCC 2018
MITIGATIONTargets Overall targets
Emissions by 2025 and 2030 will be in a range between 398 MtCO2e and 614 MtCO2e, as defi ned in national policy
Coverage100% of emissions covered (all sectors and six gases, material focus on three)
Actions Actions specifi ed (sectors not mentioned)
ADAPTATIONTargets Six targets specifi ed (develop national
adaptation plan; mainstream adaptation into development; build institutional capacity; develop early warning systems; develop vulnerability assessment and needs framework; communicate investments)
Actions Actions specifi ed (sectors not mentioned)
FINANCEConditio-nality
Not specifi ed
Investment needs
Adaptation investment needs of US$31.5 billion between 2020 and 2030 (pers. comm. UNFCCC Secretariat)
Actions National actions to align fi nancial fl ows mentioned (fi scal levers)
International market mechanisms
Not mentioned
SOUTH AFRICA Country Facts 2018
8
BROWN TO GREEN: THE G20 TRANSITION TO A LOW-CARBON ECONOMY | 2018
COMPATIBILITY OF CLIMATE TARGETS WITH THE PARIS AGREEMENT2
NATIONALLY DETERMINED CONTRIBUTION (NDC)
CLIMATE ACTION TRACKER (CAT) EVALUATION OF NDC2
critically insuffi cient
highly insuffi cient
insuffi cient 2°C compatible 1.5°C Paris Agreement compatible
role model
The CAT rates South Africa’s NDC target “highly insuffi cient” as it is not ambitious enough to limit warming to below 2°C, let alone to 1.5°C. This rating is based on the less ambitious end of the NDC range because South Africa could be considered to have reached its NDC target if its emissions in 2030 were below this limit. Meeting the more ambitious end of the range would be rated “2°C compatible”. In 2018, the government released the draft of its Integrated Resource Plan, which includes a shift away from coal, increased renewables and gas, and an end to the expansion of nuclear power.
-100
0
100
200
300
400
500
600
700
800
Total emissions across sectors (MtCO2e/year)
Total emissions (excl. forestry), historic and projected
Historical emissions/removals from forestry
Climate Action Tracker's 2°C compatible and 1.5°C Paris Agreement compatible emissions range
Max. emissions level under mitigation targets
Min. emissions level under mitigation targets
1990 1995 2000 2005 2010 2015 2020 2025 2030
Source: CAT 2018
Source: CAT 2018
highly insuffi cient
SOUTH AFRICA

CLIMATE POLICY
SOUTH AFRICA Country Facts 2018
9
BROWN TO GREEN: THE G20 TRANSITION TO A LOW-CARBON ECONOMY | 2018
low medium high frontrunner
GHG emissions target for 2050 or beyond
Long-term low emissions development strategy
Near-zero energy new
buildings low medium high frontrunner
Net zero deforestation
!Renewable
energy in power sector
Phase-out fossil fuel light duty
vehicles
!Low-carbon
new industry installations
POLICY EVALUATION17
high
The ratings evaluate a selection of policies that are essential pre-conditions for the longer-term transformation required to meet the 1.5°C limit. They do not represent a complete picture of what is necessary.
According to the draft Integrated Resources Plan (as yet unadopted) South Africa plans to expand renewable energy from 3.3 GW currently to above 25 GW installed capacity by 2030. This would equal about 26% of the electricity production by 2030, with the main share from wind and photovoltaic. No 2050 renewables target has been adopted so far. A programme to support renewable energy through power purchase agreements for independent power producers was put on ice in 2016 but kick-started again in 2018.
South Africa relies heavily on coal power. The draft electricity plan from 2018 envisages the construction of new coal power plants until 2024 but also assumes that the share of coal will be reduced to 20% of the energy supply by 2050.
South Africa’s last energy effi ciency strategy expired in 2015. The follow-up Draft Post-2015 Energy Effi ciency Strategy (as yet unadopted) envisaged reducing energy use in transport by 39% by 2030 from 2015 levels. The country has no fuel economy or emission standards for LDVs in place, and no strategy to phase out fossil fuel LDVs.
South Africa sets a goal for zero-emissions buildings by 2030 in its National Development Plan. This is in conjunction with an energy effi ciency strategy to inform policy and regulation on promoting better use of energy within buildings.
South Africa’s Draft Post-2015 Energy Effi ciency Strategy (as yet unadopted) envisaged reducing energy consumption in industry by 16% by 2030 compared to 2015 levels but has no targets for new installations to be built as low-carbon. Support schemes mainly include voluntary energy audits and trainings.
The Forestry 2030 Roadmap aims to promote sustainable forest management but does not contain a zero-deforestation goal.
low medium high frontrunner
low medium high frontrunner
low medium high frontrunnerlow medium high frontrunner
most important measures based on share of emissions and political relevance!
low No action medium Some action high Signifi cant action and a long-term vision frontrunner Signifi cant action, and a long-term vision that is compatible with 1.5°C
Legend:
South Africa adopted a Climate Change white paper in 2011, outlining the emission pathway towards 212 to 428 MtCO2e per year in 2050. The draft climate change bill, expected to be adopted
in 2019, will set the legal basis for establishing long-term emission trajectories and carbon budgets.
TRANSPORT BUILDINGS
INDUSTRY FORESTS
PO WER
! Coal phase-outlow medium high frontrunnermedium
Source: own evaluation
SOUTH AFRICA
medium

CLIMATE POLICY
SOUTH AFRICA Country Facts 2018
10
BROWN TO GREEN: THE G20 TRANSITION TO A LOW-CARBON ECONOMY | 2018
CCPI EXPERTS’ POLICY EVALUATION18
JUST TRANSITION19
South Africa’s experts say that the country’s 2030 GHG emission target and the 2030 renewables target are insuffi cient, and that national planning documents are outdated. They particularly criticise the lack of support for renewables, and thus rate the national climate policy performance as low. They rate South Africa’s performance in international policy as medium, as it performs well in international negotiations but lacks ambition and implementation of policies at home. This evaluation is based on the status of policies in early 2018 and does not account for recent policy developments, especially on renewable energy.
South Africa’s economy is highly coal-dependent, and the coal mining sector employs 80,000 workers. South Africa also has high levels of poverty and unemployment; ensuring a just transition has therefore been explicitly recognised as a priority in national policy. Moreover, South Africa is the only country to directly refer to “an inclusive and just transition” in its NDC. Currently a social dialogue process has been launched by South Africa’s National Planning Commission to develop just transition sustainable development pathways, but explicit transition policies for workers and communities are not yet in place. Implementation of a large-
scale renewable energy programme has begun to transition the electricity sector away from fossil fuels (mostly coal). This is seen by coal-dependent workers and communities as a potential threat and has led, for example, to a recent court case by unions to prevent the state-owned electricity utility from buying more renewable energy.
very high
high
medium
low
very low
CCPI 2008
CCPI 2009
CCPI 2007
CCPI 2010
CCPI 2011
CCPI 2012
CCPI 2013
CCPI 2014
CCPI 2015
CCPI 2016
CCPI 2017
CCPI 2018
Evaluation of international climate policy
Evaluation of national climate policy
CCPI EVALUATION OF CLIMATE POLICY (2018)
Source: CCPI 2018
SOUTH AFRICA

FINANCING THE TRANSITION
SOUTH AFRICA Country Facts 2018
11
BROWN TO GREEN: THE G20 TRANSITION TO A LOW-CARBON ECONOMY | 2018
■ FINANCIAL POLICIES AND REGULATIONS
■ FISCAL POLICY LEVERS
APPROACHES TO IMPLEMENTING THE RECOMMENDATIONS OF THE TASK FORCE ON CLIMATE-RELATED FINANCIAL DISCLOSURES (TCFD)20
FOSSIL FUEL SUBSIDIES
Through policy and regulation governments can overcome challenges to mobilising green fi nance, including: real and perceived risks, insuffi cient returns on investment, capacity and information gaps.
This indicator establishes the degree of government engagement with the recommendations of the G20 Financial Stability Board‘s Task Force on Climate-Related Financial Disclosure.
Fiscal policy levers raise public revenues and direct public resources. Critically, they can shift investment decisions and consumer behaviour towards low-carbon, climate-resilient activities by refl ecting externalities in prices.
In 2016, South Africa’s fossil fuel subsidies reached US$2.4bn, from US$0.8bn in 2007. From 2007 and 2016, subsidies were lower (US$0.002) than the G20 average (US$0.003) per unit of GDP. Subsidies primarily targeted production (96%), through direct budget support and tax exemptions. The largest subsidy is the value-added tax exemptions for gasoline, diesel and kerosene through broad objectives to support businesses (US$1.2bn in 2016). 0.0
0.5
1.0
1.5
2.0
2.5
Fossil fuel subsidies (US$ billions)
2007 2010 2013 2016
No formal engagement
with TCFD
Political and regulatory
engagement
Formal engagement with
private sector
Publication of guidance and action plans
Encoding into law
Source: CISL 2018
Source: OECD/IEA 2018
CARBON REVENUES
South Africa does not have a national carbon tax or emissions trading scheme. In 2019, there is a draft legislation to introduce a national carbon tax that would cover 75% of domestic emissions, including all types of fossil fuels. This will charge emissions at approximately US$3 to US$10 per tonne of CO2.
The fi nancial regulatory body of South Africa, the South African Financial Services Board (FSB), welcomed and called for the implementation of TCFD recommendations in 2017. That year, South Africa’s National Treasury also convened fi nancial sector regulatory agencies and industry associations to develop a sustainable fi nance roadmap, engaging private sector actors in TCFD relevant forums.
SOUTH AFRICA
Source: I4CE 2018
CO2NO EXPLICIT CARBON PRICING SCHEME FROM 2007 TO 2017

FINANCING THE TRANSITION
SOUTH AFRICA Country Facts 2018
12
BROWN TO GREEN: THE G20 TRANSITION TO A LOW-CARBON ECONOMY | 2018
NATIONAL AND INTERNATIONAL PUBLIC FINANCE IN THE POWER SECTOR21
PROVISION OF INTERNATIONAL PUBLIC SUPPORT
CONTRIBUTIONS THROUGH THE MAJOR MULTILATERAL CLIMATE FUNDS22
BILATERAL CLIMATE FINANCE CONTRIBUTIONS23
■ PUBLIC FINANCE Governments steer investments through their public fi nance institutions including via development banks, both at home and overseas, and green investment banks. Developed G20 countries also have an obligation to provide fi nance to developing countries and public sources are a key aspect of these obligations under the UNFCCC.
From 2013 to 2015, South Africa’s public fi nance institutions spent an annual average of US$0.4bn on brown, US$0.3bn on green and US$0.01bn on grey fi nancing in the power sector, domestically and internationally. The largest transactions were the Development Bank of Southern Africa loan (US$227m) to the Kilwa natural gas power plant in Tanzania, and the loan (US$206m) to the Northern Cape wind farms in South Africa.
South Africa is not listed in Annex II of the UNFCCC and is therefore not formally obliged to provide climate fi nance. While South Africa may channel international public fi nance towards climate change via multilateral and other development banks, this has not been included in this report.
2013-2015 annual average of power finance (US$ billions) Proportion of total public finance to power
0.00
0.05
0.10
0.15
0.20
0.25
0.30
0.35
Brown Green Grey
SOUTHAFRICA 56%
42%42%2%2%
10%10%
67%67%23%23%
G20
Source: Oil Change International 2017
Source: Climate Funds Update 2017
Source: Country reporting to UNFCCC
Note: See Technical Note for multilateral climate funds
included and method to attribute amounts to countries
OBLIGATION TO PROVIDE CLIMATE FINANCEUNDER UNFCCC
Annual average contribution
(mn US$, 2015-2016)
n.a.
Theme of support
Mitigation Adaptation Cross-cutting Other
n.a. n.a. n.a. n.a.
Annual average contribution
(mn US$, 2015-2016)
Theme of support
Adaptation Mitigation Cross-cutting
n.a. n.a. n.a. n.a.
coal, oil and gas projects(and associated infrastructure)
brown
large-scale hydropower, biofuels, biomass, nuclear, incineration, transmission,
distribution, storage, energy effi ciency, other general electricity support
grey
renewable energy projects (excluding grey fi nancing)
green
SOUTH AFRICA
NOYES

SOUTH AFRICA Country Facts 2018
13
BROWN TO GREEN: THE G20 TRANSITION TO A LOW-CARBON ECONOMY | 2018
ANNEX G20
1) The 2030 projections of the future development of greenhouse gas (GHG) emissions under current policies are based on the Climate Action Tracker (CAT) estimates.
2) The CAT is an independent scientific analysis that tracks progress towards the globally agreed aim of holding warming to well below 2°C, and pursuing efforts to limit warming to 1.5°C. The CAT ”Effort Sharing“ assessment methodology applies state-of-the-art scientific literature on how to compare the fairness of government efforts and (Intended) Nationally Determined Contribution ((I)NDC) proposals against the level and timing of emission reductions consistent with the Paris Agreement. The assessment of the temperature implications of a country’s NDC is based on the assumption that all other governments would follow a similar level of ambition.
3) This assessment is based on the policy evaluation on page 9 of this Country Profile.
4) Gross Domestic Product (GDP) per capita is calculated by dividing GDP with mid-year population figures. GDP is the value of all final goods and services produced within a country in a given year. Here GDP figures at purchasing power parity (PPP) are used. Data for 2017.
5) The Human Development Index (HDI) is a composite index published by the United Nations Development Programme (UNDP). It is a summary measure of average achievement in key dimensions of human development. A country scores higher when the lifespan is higher, the education level is higher, and GDP per capita is higher.
6) The ND-GAIN index summarises a country’s vulnerability to climate change and other global challenges in combination with its readiness to improve resilience. This report looks only at the exposure indicators as part of the vulnerability component of the ND-GAIN index for six sectors. It displays the exposure scores provided by the ND-GAIN on a scale from low (score: 0) to high (score: 1).
7) The indicator covers all Kyoto gases showing historic emissions in each of the IPCC source categories (energy, industrial processes, agriculture, etc.). Emissions projections (excl. forestry) under a current policy scenario until 2030 are taken from the Climate Action Tracker and scaled to the historical emissions from PRIMAP (see Brown to Green Report 2018 Technical Note).
8) The ratings on GHG emissions are taken from the Climate Change Performance Index (CCPI) 2018. The rating of “current level compared to a well below 2°C pathway” is based on a global scenario of GHG neutrality in the second half of the century and a common but differentiated convergence approach.
9) CO2 emissions cover only the emissions from fossil fuels combustion (coal, oil and gas) by sector. They are calculated according to the UNFCCC methodology (in line with the 2006 IPCC Guidelines for National Greenhouse Gas Inventories).
10) Total primary energy supply data displayed in this Country Profile does not include non-energy use values. Solid fuel biomass in residential use has negative environmental and social impacts and is shown in the category “other”.
11) Zero-carbon fuels include nuclear, hydropower and new renewables (non-residential biomass, geothermal, wind, solar).
12) Climate Transparency ratings assess the relative performance across the G20. A high scoring reflects a good effort from a climate protection perspective but is not necessarily 1.5°C compatible.
13) New renewables include non-residential biomass, geothermal, wind and solar energy. Hydropower and solid fuel biomass in residential use are excluded due to their negative environmental and social impacts.
14) Total primary energy supply (TPES) per capita displays the historical, current and projected energy supply in relation to a country’s population. Alongside the intensity indicators (TPES/GDP and CO2/TPES), TPES per capita gives an indication on the energy efficiency of a country’s economy. In line with a well-below 2˚C limit, TPES per capita should not grow above current global average levels. This means that developing countries are still allowed to expand their energy use to the current global average, while developed countries have to simultaneously reduce it to that same number.
15) TPES per GDP describes the energy intensity of a country’s economy. This indicator illustrates the efficiency of energy usage by calculating the energy needed to produce one unit of GDP. Here GDP figures at PPP are used. A decrease in this indicator can mean an increase in efficiency but also reflects structural economic changes.
16) The carbon intensity of a country’s energy sector describes the CO2 emissions per unit of total primary energy supply and gives an indication of the share of fossil fuels in the energy supply.
For more detail on sources and methodologies, please refer to the Technical Note at: https://www.climate-transparency.org/wp-content/uploads/2018/11/Technical-Note_data-sources-and-methodology.pdf

SOUTH AFRICA Country Facts 2018
14
BROWN TO GREEN: THE G20 TRANSITION TO A LOW-CARBON ECONOMY | 2018
ANNEX (continued) G20
On endnote 17) Criteria description Low Medium High Frontrunner
GHG emissions target for 2050 or beyond
No emissions reduction target for 2050 or beyond
Existing emissions reduction target for 2050 or beyond
Existing emissions reduction target for 2050 or beyond and clear interim steps
Emissions reduction target to bring GHG emissions to at least net zero by 2050
Long-term low emissions development strategy
No long-term low emissions strategy
Existing long-term low emissions strategy
Long-term low emissions strategy includes interim steps and/or sectoral targets
Long-term low emissions strategy towards full decarbonisation in the second half of the century; includes interim steps and/or sectoral targets, plus institutions and measures in place to implement and/or regularly review the strategy
Renewable energy in power sector
Allianz Monitor 2018 Category 1.2 (targets) and 2 (policies), average 0-25
Allianz Monitor 2018 Category 1.2 (targets) and 2 (policies), average 26-60
Allianz Monitor 2018 Category 1.2 (targets) and 2 (policies), average 61-100
Allianz Monitor 2018 Category 1.2 (targets) and 2 (policies), 61-100 plus 100% renewables in the power sector by 2050 in place
Coal phase-out No consideration or policy in place for phasing out coal
Signifi cant action to reduce coal use implemented or coal phase-out under consideration
Coal phase-out decided and under implementation
Coal phase-out date compatible with 1.5°C
Phase-out of fossil fuel light duty vehicles (LDVs)
No policy or emissions performance standards for LDVs in place
Energy/emissions performance standards or support for effi cient LDVs
National target to phase out fossil fuel LDVs in place
Ban on new fossil-based LDVs by 2025/30
Near zero-energy new buildings
No policy or low emissions building codes and standards in place
Building codes, standards or fi scal/fi nancial incentives for low emissions options in place
National strategy for near zero-energy buildings (at least for all new buildings)
National strategy for near zero-energy buildings by 2020/25 (at least for all new buildings)
Low-carbon new industry installations
No policy or support for energy effi ciency in industrial production in place
Support for energy effi ciency in industrial production (covering at least two of the country’s sub-sectors (e.g. cement and steel production))
Target for new installations in emissions-intensive sectors to be low-carbon
Target for new installations in emissions-intensive sectors to be low-carbon after 2020, maximising effi ciency
Net zero deforestation
No policy or incentive to reduce deforestation in place
Incentives to reduce deforestation or support schemes for aff orestation /reforestation in place
National target for reaching zero deforestation
National target for reaching zero deforestation by 2020s or for increasing forest coverage
17) The selection of policies rated and the assessment of 1.5°C compatibility are informed by the Paris Agreement and the Climate Action Tracker (2016): “The ten most important short-term steps to limit warming to 1.5°C”. The table below displays the criteria used to assess a country’s policy performance. See the Brown to Green Report 2018 Technical Note for the sources used for this assessment.
18) The CCPI evaluates a country’s performance in national climate policy, as well as international climate diplomacy through feedback from national experts from non-governmental organisations to a standardised questionnaire.
19) See the Brown to Green 2018 Technical Note for the sources used for this assessment.
20) The University of Cambridge Institute for Sustainability Leadership (CISL) in early 2018 reviewed the progress made by the national regulatory agencies of G20 members in making the Task Force on Climate-related Financial Disclosures (TCFD) recommendations relevant to their national contexts. See the Brown to Green Report 2018 Technical Note for more information on the assessment.
21) This data includes bilateral public fi nance institutions such as national development banks and other development fi nance institutions, overseas aid agencies, export credit agencies, as well as key multilateral development banks. The analysis omits most fi nance delivered through fi nancial intermediaries and signifi cant volumes of multilateral development bank (MDB) development policy fi nance (due to a lack of clarity on power fi nance volumes). Given a lack of transparency, other important multilateral institutions in which G20 governments participate are not covered. See the Brown to Green Report 2018 Technical Note for further details.
22) Finance delivered through multilateral climate funds comes from Climate Funds Update, a joint ODI/Heinrich Boell Foundation database that tracks spending through major multilateral climate funds. See the Brown to Green Report 2018 Technical Note for multilateral climate funds included and method to attribute approved amounts to countries.
23) Bilateral fi nance commitments are sourced from Biennial Party reporting to the UNFCCC. Financial instrument reporting is sourced from the OECD-DAC; refer to the Brown to Green Report 2018 Technical Note for more detail. Figures represent commitments of Offi cial Development Assistance (ODA) funds to projects or programmes, as opposed to actual disbursements.

SOUTH AFRICA Country Facts 2018
15
BROWN TO GREEN: THE G20 TRANSITION TO A LOW-CARBON ECONOMY | 2018
Contact point in South Africa:
Dr. Andrew MarquardEnergy Research Centre – University of Cape [email protected]
Bryce McCallEnergy Research Centre – University of Cape [email protected]
CLIMATE TRANSPARENCY
http://www.climate-transparency.org/g20-climate-performance/g20report2018
Funders:
Partners:
Data Partners:
Supported by:
based on a decision of the German Bundestag

![GHG INVENTORY FOR SOUTH AFRICA · GHG INVENTORY FOR SOUTH AFRICA 2000 - 2010 11 3.3.6.4.1 Commercial/ Institutional [1A4a] 109 3.3.6.4.2 Residential [1A4b] 109 3.3.6.4.3 Agriculture](https://static.fdocuments.in/doc/165x107/60401f3664fcc03b421a882e/ghg-inventory-for-south-africa-ghg-inventory-for-south-africa-2000-2010-11-33641.jpg)