
Sources of contaminants in domestic wastewater: …...Sources of contaminants in domestic...
118
Grace Tjandraatmadja, Chris Pollard, Chris Sheedy and Yesim Gozukara February 2010 Sources of contaminants in domestic wastewater: nutrients and additional elements from household products
Transcript of Sources of contaminants in domestic wastewater: …...Sources of contaminants in domestic...

Grace Tjandraatmadja, Chris Pollard, Chris Sheedy and Yesim Gozukara
February 2010
Sources of contaminants in domestic wastewater: nutrients and additional elements from household products

Water for a Healthy Country Flagship Report series ISSN: 1835-095X
Australia is founding its future on science and innovation. Its national science agency, CSIRO, is a powerhouse of ideas, technologies and skills.
CSIRO initiated the National Research Flagships to address Australia’s major research challenges and opportunities. They apply large scale, long term, multidisciplinary science and aim for widespread adoption of solutions. The Flagship Collaboration Fund supports the best and brightest researchers to address these complex challenges through partnerships between CSIRO, universities, research agencies and industry.
The Water for a Healthy Country Flagship aims to provide Australia with solutions for water resource management, creating economic gains of $3 billion per annum by 2030, while protecting or restoring our major water ecosystems. The work contained in this report is collaboration between CSIRO and Smart Water Fund.
For more information about Water for a Healthy Country Flagship or the National Research Flagship Initiative visit www.csiro.au/org/HealthyCountry.html
Citation: Tjandraatmadja G, Pollard C, Sheedy C, Gozukara Y 2010. Sources of contaminants in domestic wastewater: nutrients and additional elements from household products. CSIRO: Water for a Healthy Country National Research Flagship
Copyright and Disclaimer
© Commonwealth of Australia 2009 All rights reserved. This work is copyright. Apart from any use as permitted under the Copyright Act 1968, no part may be reproduced by any process without prior written permission from the Commonwealth.
Important Disclaimer:
CSIRO advises that the information contained in this publication comprises general statements based on scientific research. The reader is advised and needs to be aware that such information may be incomplete or unable to be used in any specific situation. No reliance or actions must therefore be made on that information without seeking prior expert professional, scientific and technical advice. To the extent permitted by law, CSIRO (including its employees and consultants) excludes all liability to any person for any consequences, including but not limited to all losses, damages, costs, expenses and any other compensation, arising directly or indirectly from using this publication (in part or in whole) and any information or material contained in it. Cover Photograph: From CSIRO’s ScienceImage: www.scienceimage.csiro.au File: BUR6243.jpg Description: Algal scum on treated wastewater at Perth treatment works.Perth, WA. CSIRO Land and Water Photographer: Willem van Aken © 2010 CSIRO
Sources of priority contaminants in domestic wastewater: nutrients and additional elements iii
TABLE OF CONTENTS
LIST OF FIGURES.............................................................................................................................................. V LIST OF TABLES............................................................................................................................................. VII ACKNOWLEDGMENTS...................................................................................................................................IX ABBREVIATIONS .............................................................................................................................................. X EXECUTIVE SUMMARY............................................................................................................................... XII 1. INTRODUCTION ........................................................................................................................................ 1 2. CONTAMINANTS OF INTEREST ........................................................................................................... 4
2.1. ANTIMONY ............................................................................................................................................. 5 2.2. CHLORIDE............................................................................................................................................... 6 2.3. COBALT .................................................................................................................................................. 7 2.4. CHROMIUM ............................................................................................................................................. 8 2.5. FLUORIDE ............................................................................................................................................... 9 2.6. MOLYBDENUM ..................................................................................................................................... 10 2.7. SELENIUM............................................................................................................................................. 11 2.8. NITROGEN............................................................................................................................................. 12 2.9. PHOSPHORUS ........................................................................................................................................ 13 2.10. SOURCES OF POLLUTANTS TO DOMESTIC SEWAGE ................................................................................ 13
3. METHODOLOGY ..................................................................................................................................... 17 3.1. PRODUCT SELECTION ............................................................................................................................ 17
3.1.1. Cleaning products ....................................................................................................................... 17 3.1.2. Dishwashing products ................................................................................................................. 17 3.1.3. Laundry products ........................................................................................................................ 17 3.1.4. Personal care products ............................................................................................................... 17
3.2. ANALYTICAL METHODOLOGY............................................................................................................... 18 3.2.1. Metal analysis ............................................................................................................................. 18 3.2.2. Chloride ...................................................................................................................................... 18 3.2.3. Fluoride....................................................................................................................................... 18 3.2.4. Nutrients...................................................................................................................................... 19 3.2.5. Concentration in product ............................................................................................................ 19 3.2.6. Frequency of use ......................................................................................................................... 20
4. RESULTS AND DISCUSSION ................................................................................................................. 21 4.1. ELEMENTS IN PRODUCTS....................................................................................................................... 21
4.1.1. Antimony ..................................................................................................................................... 22 4.1.2. Chloride ...................................................................................................................................... 23 4.1.3. Cobalt.......................................................................................................................................... 25 4.1.4. Chromium.................................................................................................................................... 27 4.1.5. Fluoride....................................................................................................................................... 29 4.1.6. Molybdenum................................................................................................................................ 31 4.1.7. Selenium...................................................................................................................................... 33 4.1.8. Nitrogen ...................................................................................................................................... 35 4.1.9. Phosphorus.................................................................................................................................. 38
5. ELEMENTAL LOADS IN HOUSEHOLD STREAMS.......................................................................... 43 5.1. METHODOLOGY.................................................................................................................................... 43
5.1.1. Household wastewater ................................................................................................................ 44 5.2. ANALYSIS ............................................................................................................................................. 44
5.2.1. Antimony ..................................................................................................................................... 46
Sources of priority contaminants in domestic wastewater: nutrients and additional elements iv
5.2.2. Cobalt.......................................................................................................................................... 47 5.2.3. Chloride ...................................................................................................................................... 48 5.2.4. Chromium.................................................................................................................................... 50 5.2.5. Fluoride....................................................................................................................................... 51 5.2.6. Molybdenum................................................................................................................................ 52 5.2.7. Selenium...................................................................................................................................... 53 5.2.8. Nitrogen ...................................................................................................................................... 54 5.2.9. Phosphorus.................................................................................................................................. 56
6. IMPACT ON WASTEWATER LOADS.................................................................................................. 57 7. CONCLUSIONS AND RECOMMENDATIONS.................................................................................... 60 8. REFERENCES ........................................................................................................................................... 63 APPENDIX 1 – ELEMENTS IN PRODUCTS ................................................................................................. 69 APPENDIX 2 – PRODUCT CONTRIBUTION TO ELEMENTAL LOADS FROM A SINGLE PERSON HOUSEHOLD ..................................................................................................................................................... 94 APPENDIX 3 – COMPARISON OF HOUSEHOLD LOAD SCENARIOS ................................................ 100
Sources of priority contaminants in domestic wastewater: nutrients and additional elements v
LIST OF FIGURES Figure 1: Summary of “Sources of contaminants in domestic wastewater” project................................................ 2
Figure 2: Frequency of element detection in household products analysed. ......................................................... 21
Figure 3: Antimony loads estimated from product use.......................................................................................... 23
Figure 4: Chloride loads estimated from product use............................................................................................ 24
Figure 5: Cobalt loads estimated from product use ............................................................................................... 27
Figure 6: Chromium loads estimated from product use ........................................................................................ 29
Figure 7: Fluoride loads estimated from product use ............................................................................................ 31
Figure 8: Molybdenum loads estimated from product use .................................................................................... 33
Figure 9: Selenium loads estimated from product use........................................................................................... 34
Figure 10: Total Kjeldahl nitrogen loads estimated from product use .................................................................. 38
Figure 11: Phosphorus loads estimated from product use ..................................................................................... 42
Figure 12: Antimony load from use of products with environmental labels, median and maximum antimony
concentration products in household streams. ....................................................................................................... 47
Figure 13: Cobalt load from use of environmental label, median and maximum cobalt concentration products in
household streams. ................................................................................................................................................ 48
Figure 14: Chloride load from use of environmental label, median and maximum chloride products in household
streams................................................................................................................................................................... 49
Figure 15: Chromium load from use of environmental label, median and maximum chromium concentration
products in household streams............................................................................................................................... 51
Figure 16: Fluoride load from use of environmental label, median and maximum fluoride concentration products
in household streams. ............................................................................................................................................ 52
Figure 17: Molybdenum load from use of environmental label, median and maximum molybdenum products in
household streams. ................................................................................................................................................ 53
Figure 18: Selenium load from use of environmental label, median and maximum selenium concentration
products in household streams............................................................................................................................... 54
Figure 19: Nitrogen load from use of environmental label, median and maximum nitrogen concentrations
products in household streams............................................................................................................................... 55
Figure 20: Phosphorus load from use of environmental label, median and maximum phosphorus loads products
in household streams. ............................................................................................................................................ 57
Figure 21: Relative contribution to elemental loads for scenario WW1. The toilet load includes human excreta.
Laundry powder detergent and manual dishwashing are used. ............................................................................. 59
Figure 22: Relative contribution to elemental loads for scenario WW2. The toilet load includes human excreta.
Liquid laundry detergent and dishwasher powder are used................................................................................... 59
Figure 23: Relative contribution to elemental loads when green products are used. The toilet load includes
human excreta........................................................................................................................................................ 59
Figure 24: Antimony loads generated by household product use in a household................................................ 100
Figure 25: Chloride loads generated by household product use in a household................................................. 100
Sources of priority contaminants in domestic wastewater: nutrients and additional elements vi
Figure 26: Chromium loads generated by household product use in a household............................................... 101
Figure 27: Cobalt loads generated by household product use in a household. .................................................... 101
Figure 28: Molybdenum loads generated by household product use in a 1 person household............................ 102
Figure 29: Selenium loads generated by household product use in a 1 person household. ............................... 102
Figure 30: Total Kjeldahl nitrogen loads generated by household product use in 1 person household............... 103
Figure 31: Total phosphorus loads generated by household product use in a 1 person household...................... 103

Sources of priority contaminants in domestic wastewater: nutrients and additional elements vii
LIST OF TABLES Table 1: Recommend water quality parameters for water used in irrigation and general use
(ANZECC/ARMCANZ 2001) ............................................................................................................................... 4
Table 2: Domestic sources of elements in urban wastewater (adapted from Icon 2001)....................................... 14
Table 3: Typical amounts secreted by human body .............................................................................................. 15
Table 4: Detection limits for test methods............................................................................................................. 19
Table 5: Assumptions for product dosages for household and personal care products for a single person
household .............................................................................................................................................................. 20
Table 6: Concentration of Sb in household products............................................................................................. 22
Table 7: Chloride concentration in household products ........................................................................................ 24
Table 8: Cobalt concentration in household products ........................................................................................... 26
Table 9: Chromium concentration in household products..................................................................................... 28
Table 11: Fluoride concentration in household products....................................................................................... 30
Table 12: Molybdenum concentration in household products............................................................................... 32
Table 13: Selenium concentration in household products ..................................................................................... 34
Table 14: Total nitrogen concentration in household products ............................................................................. 37
Table 15: Total phosphorus concentration in household products ........................................................................ 41
Table 16: Household streams adopted in the household wastewater load simulation ........................................... 44
Table 17: Major sources of contaminants in a household...................................................................................... 45
Table 18: Frequency of element detection in household products analysed.......................................................... 69
Table 19: Elements in cleaning products............................................................................................................... 70
Table 20: Elements in laundry products ................................................................................................................ 72
Table 21: Elements in toilet paper......................................................................................................................... 75
Table 22: Elements in sunscreen and other skincare ............................................................................................. 76
Table 23: Elements in deodorants ......................................................................................................................... 78
Table 24: Elements in oral care products .............................................................................................................. 79
Table 25: Elements in shower and bathroom products......................................................................................... 81
Table 26: Elements in dishwashing products ........................................................................................................ 84
Table 27: Summary of element concentration in products .................................................................................... 86
Table 28: Major antimony loads from household products ................................................................................... 94
Table 29: Major chloride loads from household products ..................................................................................... 94
Table 30: Major cobalt loads from household products ........................................................................................ 95
Table 31: Major chromium loads from household products.................................................................................. 95
Table 32: Major fluoride loads from household products ..................................................................................... 96
Table 33: Major molybdenum loads from household products ............................................................................. 97
Table 34: Major selenium loads from household products.................................................................................... 97
Table 35: Major total Kjeldahl nitrogen loads from household products .............................................................. 98
Sources of priority contaminants in domestic wastewater: nutrients and additional elements viii
Table 36: Major phosphorus loads from household products................................................................................ 99

Sources of priority contaminants in domestic wastewater: nutrients and additional elements ix
ACKNOWLEDGMENTS
The authors would like to thank:
• the Smart Water Fund and water authorities from the Source control strategy group for sponsoring this project,
• the members of the Reference group, Lidia Harvey, John Dennis, Adam Kazi, Michelle Carsen, Mick Anderson, Hieu Dang, and Robina Westblade for their input and guidance.
.

Sources of priority contaminants in domestic wastewater: nutrients and additional elements x
ABBREVIATIONS
CCL Cumulative contaminant loading
Cl Chloride
Co Cobalt
Concmeasured Concentration of element determined experimentally
Concproduct Concentration of element in product
Cr Chromium
f Frequency of use per week
F Fluoride
IC In-cistern
ICP-AES Inductively coupled plasma with atomic emission spectroscopy
ICP-MS Inductively coupled plasma mass spectroscopy
K Potassium
L Litre
LOD Limit of detection
LTV Maximum concentration for long term irrigation (100 years)
μg microgram
M(i)week Weekly mass load for element I for a selected product category
Mproduct Mass of product tested
Mo Molybdenum
N Nitrogen
na Not applicable
Na Sodium
NaHClO3 Sodium hypochlorite
nd Not determined
ng nanogram

Sources of priority contaminants in domestic wastewater: nutrients and additional elements xi
pe person
PET Poly(ethylene terephthalate)
Sb Antimony
Sb2O3 Antimony trioxide
Se Selenium
STV Maximum concentration for short-term irrigation (20 years)
TF Toilet freshener
TKN Total Kjeldahl nitrogen
TP Total phosphorus
Vs Sample volume analysed
WWi Combined wastewater stream for household

Sources of priority contaminants in domestic wastewater: nutrients and additional elements xii
EXECUTIVE SUMMARY
Context and purpose
Understanding the origin of contaminants in wastewater is important in developing strategies for sustainable wastewater treatment and reuse of water and biosolids. However, limited information exists on the contribution that households make towards contaminants other than nitrogen (N), phosphorus (P) and carbon (solids), and how they are generated. In an earlier report, the contribution of household products to the quantity of heavy metals and inorganic elements discharged into wastewater, and, thus subsequently impacting effluent and biosolids reuse, was evaluated (Tjandraatmadja et al 2008). In this report, the evaluation is extended to additional elements: antimony (Sb), chloride ions (Cl), chromium (Cr), cobalt (Co), fluoride ions (F), molybdenum (Mo), nitrogen (N), phosphorus (P) and selenium (Se), all of which are of interest to water authorities because of their chronic public health or environmental impact.
This report is part of the Smart Water Fund project Round 3 – Project 5 Household sources of priority contaminants in domestic wastewater. The overall project aims to understand the origins of contaminants in domestic wastewater and to evaluate strategies for their reduction at source.
The aim of this report is to evaluate the contribution that household and personal care products make to Sb, Cl, Cr, Co, F, Mo, N, P and Se in domestic wastewater and the implications to source control and wastewater management.
Research method
A range of 156 household and personal care products used in the bathroom, laundry, kitchen and toilet were analysed using standard water and wastewater analytical methods (APHA/AWWA 2008) to determine:
(a) The concentration of antimony, cobalt, chromium, chloride, fluoride, molybdenum, selenium, nitrogen (as total Kjeldahl nitrogen) and phosphorus (as total phosphorus), and
(b) The loads and distribution of such elements within the wastewater streams (bathroom, laundry, kitchen and toilet) in a household. The loads of household products were evaluated for a one person household and an average frequency of product use (Roberts 2005) and compared to the typical elemental load from human excreta.
For each product category, when possible a “private” or “supermarket” brand and a brand with an “environmental friendly” label were included in the analysis.
Key findings
Frequency of detection
The elements most frequently detected in household products were phosphorus, nitrogen, chloride and chromium, which were respectively detected in 97%, 84%, 80% and 64% of the products analysed. Molybdenum, fluoride, cobalt and selenium were detected in less than 30% of the products and antimony was detected in less than 10% of household products.
Phosphorus, nitrogen, chloride, fluoride and selenium were part of compounds disclosed in a number of product formulations, whilst the other elements, detected in trace amounts

Sources of priority contaminants in domestic wastewater: nutrients and additional elements xiii
originate from contaminants in the raw materials, through the manufacturing or packaging process.
Traces of fluoride were also detected in some brands of hair colouring, dishwashing and laundry detergents although they had not been disclosed in the product formulation, and most probably originate from raw materials and/or contamination during manufacturing.
Elemental Loads in households
Household products contribute to the overall elemental load in residential wastewater, with the actual mass load contribution partly influenced by the product category, specific brand formulation, and the amount of product used.
Elemental concentration varied markedly within product categories and among brands within the same category. For instance, a large difference was verified between the median and the maximum concentrations for brands within a product category for elements such as phosphorus and selenium. Environmental label brands analysed typically had a low concentration of phosphorus compared to the mean of a product category, but the same was not always true for the other elements.
The adoption of “environmental label” brands and products of low element concentration assisted in reducing the load of chromium, cobalt, chloride, fluoride, selenium and particularly phosphorus discharged by a household.
However, the impact of their adoption was less significant when the contribution from the product category to the overall household load was small, as in the case of antimony and molybdenum, which were often below detection in household products, or when non-product sources have a more significant contribution, such as nitrogen which comes mainly from human excreta or fluoride which is also supplied by fluoridated tap water.
Source identification
Within a household individual wastewater streams, such as laundry, kitchen, bathroom shower and sinks, and toilets contributed different amounts to the overall element load.
Chromium and cobalt were discharged in all household wastewater streams (kitchen, laundry, bathroom and toilet). However, most elements had one or two dominant sources responsible for the majority of the load within the household. The laundry and the bathroom were each major sources for six of the elements of interest, including Cl, F and Se, whilst the toilet and the laundry were each major sources for two elements, P and Mo.
The mass load from product use was compared to the load from human excreta (anthropogenic load) for a one person household:
• Nitrogen: household products have a limited influence on the load of nitrogen; their load was equivalent to less than 7% of the anthropogenic load. The largest loads were discharged from the bathroom and the laundry.
• Phosphorus: the product load ranged between less than 1% to up to 80% more than the anthropogenic load. The major loads from products were discharged from the laundry, the kitchen and the bathroom.
• Selenium: the product load was up to 60% of the anthropogenic load. The major loads were discharged from the bathroom and the laundry.
• Molybdenum: the product load was up to 97% of the anthropogenic load. The major loads were discharged from the laundry and the toilet.
Sources of priority contaminants in domestic wastewater: nutrients and additional elements xiv
• Fluoride: the product load ranged from less than 9% to approximately 6 times the anthropogenic load. The load originated mainly from the bathroom and were determined by the type and brands of product used.
• Chromium: products generated a load that much larger than the anthropogenic load. Depending on the product type and brands adopted, loads from products were equivalent to less than 50% to 276 times the anthropogenic load. Loads were distributed across the various household sources and varied with product type and brand. The load from selected product brands was comparable to that from human excreta, being for instance approximately 50% higher. Whilst for other products the load from human excreta was insignificant compared to the load derived from product use.
• Chloride: products created a load ranging from less than one third to five times the anthropogenic load and median loads were equivalent to a third of the anthropogenic load. The load was dependent on the products used for each household activity and originated either from the bathroom, the laundry or the toilet. The products with the highest Cl concentration were laundry products.
• Cobalt: products could contribute between less than one quarter to thirteen times the anthropogenic load. Their origin within the household was dependent on the brands adopted for each activity.
• Antimony: the product contribution varied markedly, ranging from nil to 95 times the anthropogenic load. The median load from products was equivalent to 9% of the anthropogenic load. The laundry or the kitchen were responsible for the largest product loads.
Implications to contaminant management
Source control through product selection has potential to change the amount of contaminants discharged into the sewer or the concentrations in greywater diverted into gardens in residential areas. This control strategy is feasible for contaminants, such as phosphorus, chloride, fluoride and selenium, which are sourced predominantly from products; but less effective for nitrogen, molybdenum and cobalt; as their main source is anthropogenic waste.
Elements which are in the formulation of a product can be more easily traced and quantified. However, most of the elements of interest were not disclosed in the product formulation and were also present in trace amounts; hence identifying the source of contamination would require more extensive investigation.
Householders could change the quality of wastewater by using products with low elemental content. However, product selection by householders is limited by access to information and knowledge about product formulation. Labels typically used in products such as “biodegradable”, “low P” or “environmentally friendly” are typically based on biodegradability and the environmental impact of phosphorus on surface waters, and do not provide sufficient information on the environmental impacts associated with current patterns of greywater and wastewater reuse, which are based on land application, impacting soil and plant health.
The data presented here will fill a current gap in the understanding of contaminants in wastewater. The data from the analysis of elemental content in the products can be used by water authorities and researchers to simulate a wide range of product combinations, demand management or source control strategies and to evaluate their impact on wastewater quality both at single property scale or for larger catchments. In addition this work could be furthered to evaluate the potential impacts on other aspects of the systems, such as infrastructure, treatment, etc.
Sources of priority contaminants in domestic wastewater II: nutrients and additional elements
1
1. INTRODUCTION
Traditionally the onus of wastewater treatment in urban areas has been relegated to a sewage treatment plant located remotely, followed by disposal of effluent to sea and biosolids to landfill. However, the challenges of urban population growth are leading to the realisation that reuse of water streams for different end purposes is necessary to fulfil the demand in urban centres and that biosolids stockpiling is unsustainable as a long-term strategy.
Interest in wastewater management strategies other than the sole reliance on end-of-line solutions is growing. As reuse strategies such as greywater diversion at households and effluent recycling for irrigation and non-potable water supply are implemented, the quality of wastewater, the type and amount of contaminants it carries, play a significant role on the cost of treatment and the fate of effluent and biosolids.
In this new context, pollution management focuses on understanding the ingress of pollution into the water cycle and in particular on the identification of sources of contaminants, before streams are mixed or diluted, to identify effective strategies for pollution control. Whilst trade waste monitoring is a routine activity for water authorities and the focus of regular monitoring, less information is available on domestic wastewater, in particular the origin of contaminants in it.
The Smart Water Fund project Round 3 – Project 5 Household sources of priority contaminants in domestic wastewater aimed to identify residential sources and their contribution to contaminants in wastewater. The knowledge generated is expected to assist in the development of effective contaminant reduction strategies.
To achieve such objectives, the project focused on understanding the various contaminant sources, estimated loads and their release pattern in residential settings through (i) review of the scientific literature, (ii) assessment of typical wastewater discharge patterns by household appliances, (iii) characterisation of wastewater inputs and streams within a household and (iv) modelling of source control scenarios. The summary of the project structure is shown in Figure 1.
Outcomes from the project include the following reports:
• Sources of critical contaminants in domestic wastewater: a literature review (Tjandraatmadja and Diaper 2006);
• Sources of priority contaminants in domestic wastewater: contaminant loads from household products (Tjandraatmadja et al 2008);
• Sources of emerging organic contaminants in wastewater: an assessment based on the literature review (Shareef et al 2008);
• Sources of contaminants in domestic wastewater: contaminant loads from household appliances (Diaper et al 2008);
• Characterisation of priority contaminants in residential wastewater (Tjandraatmadja et al 2009a);
• Investigation of seasonality effects on domestic wastewater quality (Tjandraatmadja et al 2009b);
• Impact of source management strategies on quality and loads in residential wastewater: scenario analysis (Cook et al 2010).

Sources of priority contaminants in domestic wastewater: nutrients and additional elements 2
Figure 1: Summary of “Sources of contaminants in domestic wastewater” project
In an earlier report in this series, the contribution of household and personal care products to priority contaminants (arsenic, boron, cadmium, copper, iron, lead, manganese, mercury, nickel, sodium, tin, zinc, total dissolved solids and colour) was evaluated and loads to wastewater streams were estimated (Tjandraatmadja et al 2008). The data generated was used to model contaminant loads associated with selected product consumption patterns.
In that particular report the data was used to identify the potential loads derived from different wastewater streams in a household and to compare the load contribution of different products towards each stream.
In this report, the analysis of household products is extended to a new range of parameters identified by water authorities. The new parameters are:
(a) Nitrogen (N) and phosphorus (P), which are essential nutrients to biological metabolism and parameters regulated in sewage treatment plant discharges by the EPA;
(b) Antimony (Sb), which is present in low concentrations in the environment, and its presence in wastewater is attributed mainly to human related activities;
(c) Chloride (Cl): when effluent is used for irrigation, high concentrations of Cl can increase the uptake of Cd by plants, cause foliage burns and impact soil health;
(d) Cobalt (Co) and molybdenum (Mo) are micro-nutrients which can impact the growth of plants;
(e) Chromium (Cr), which is toxic at relatively low concentrations, can be detrimental to aquatic and land vegetation.
Status of knowledge
Characterisation of sources
Load reduction strategies
Literature review1
Householdproducts2
Appliance operation3
Human input4
Model for source breakdown
Source management strategies 5 Verification7Scenario assessment6
Status of knowledge
Characterisation of sources
Load reduction strategies
Literature review
Householdproducts
Appliance operation
Human input
Model for source breakdown
Source management strategies VerificationScenario assessment

Sources of priority contaminants in domestic wastewater: nutrients and additional elements 3
(f) Fluoride (F), is typically added to the water supply in urban areas, however, the contribution from households is expected to be minimal, but high concentrations can cause fluoridosis.
(g) Selenium (Se), is an essential element in small doses, but it can be toxic to plants and animals at high concentrations.
With the exception of nitrogen and phosphorus, there is limited data on the distribution of these other elements in residential wastewater streams.
This report aims to evaluate:
(a) The concentration of antimony (Sb), cobalt (Co), chloride (Cl), chromium (Cr), fluoride (F), molybdenum (Mo), nitrogen (N) and phosphorus (P) in common household and personal care products.
(b) The potential loads derived from the typical use of such products and their sources in residential households.
The data generated is intended to assist water authorities to understand the origins of such elements in domestic wastewater in the current Australian context thereby allowing them to better manage the treatment process, or generate policies that may influence guidelines on the use and disposal of certain products.
Sources of priority contaminants in domestic wastewater: nutrients and additional elements 4
2. CONTAMINANTS OF INTEREST
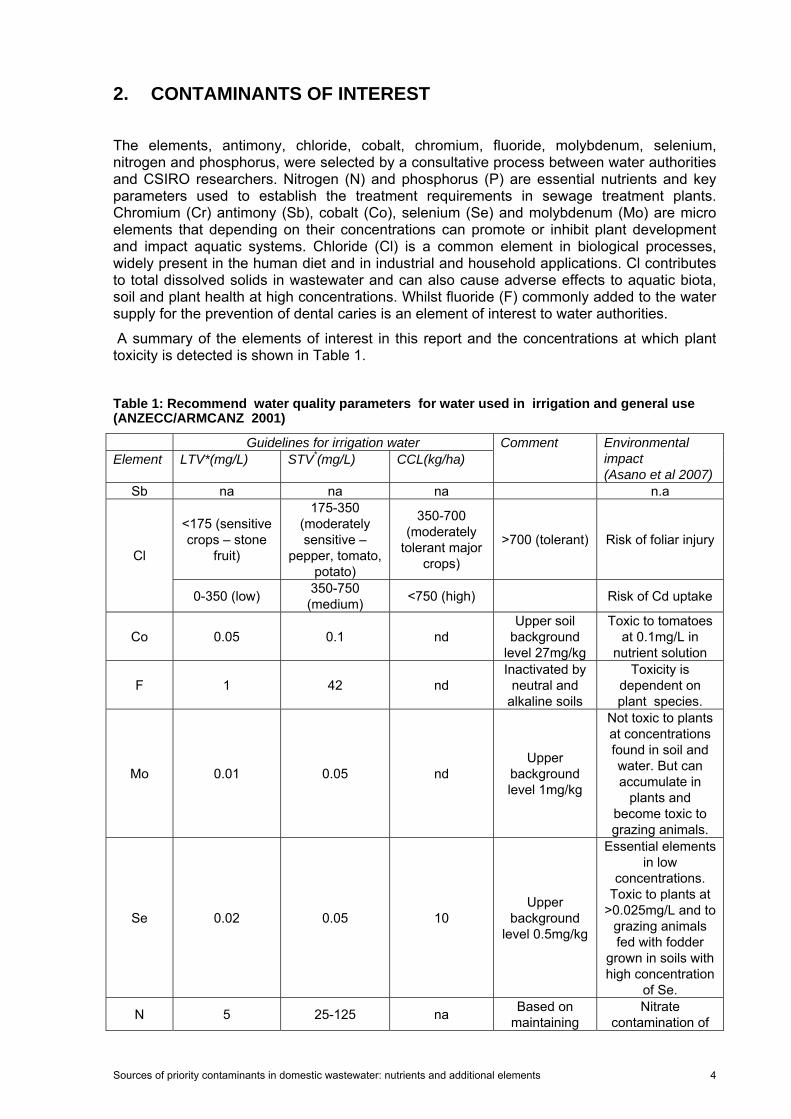
The elements, antimony, chloride, cobalt, chromium, fluoride, molybdenum, selenium, nitrogen and phosphorus, were selected by a consultative process between water authorities and CSIRO researchers. Nitrogen (N) and phosphorus (P) are essential nutrients and key parameters used to establish the treatment requirements in sewage treatment plants. Chromium (Cr) antimony (Sb), cobalt (Co), selenium (Se) and molybdenum (Mo) are micro elements that depending on their concentrations can promote or inhibit plant development and impact aquatic systems. Chloride (Cl) is a common element in biological processes, widely present in the human diet and in industrial and household applications. Cl contributes to total dissolved solids in wastewater and can also cause adverse effects to aquatic biota, soil and plant health at high concentrations. Whilst fluoride (F) commonly added to the water supply for the prevention of dental caries is an element of interest to water authorities.
A summary of the elements of interest in this report and the concentrations at which plant toxicity is detected is shown in Table 1.
Table 1: Recommend water quality parameters for water used in irrigation and general use (ANZECC/ARMCANZ 2001)
Guidelines for irrigation water Element LTV*(mg/L) STV*(mg/L) CCL(kg/ha)
Comment Environmental impact (Asano et al 2007)
Sb na na na n.a
<175 (sensitive crops – stone
fruit)
175-350 (moderately sensitive –
pepper, tomato, potato)
350-700 (moderately
tolerant major crops)
>700 (tolerant) Risk of foliar injury Cl
0-350 (low) 350-750 (medium) <750 (high) Risk of Cd uptake
Co 0.05 0.1 nd Upper soil
background level 27mg/kg
Toxic to tomatoes at 0.1mg/L in
nutrient solution
F 1 42 nd Inactivated by
neutral and alkaline soils
Toxicity is dependent on plant species.
Mo 0.01 0.05 nd Upper
background level 1mg/kg
Not toxic to plants at concentrations found in soil and water. But can accumulate in
plants and become toxic to grazing animals.
Se 0.02 0.05 10 Upper
background level 0.5mg/kg
Essential elements in low
concentrations. Toxic to plants at
>0.025mg/L and to grazing animals fed with fodder
grown in soils with high concentration
of Se.
N 5 25-125 na Based on maintaining
Nitrate contamination of

Sources of priority contaminants in domestic wastewater: nutrients and additional elements 5
crop yield, minimising off-
site impacts
groundwater supply
P 0.05 0.8-12 na Based on
minimising off-site impacts
Run-off can cause excess algae
growth Note: * STV is the maximum concentration of a contaminant that can be allowed in the irrigation water assuming 20 years of irrigation and LTV is the maximum concentration of contaminant that can be allowed in the irrigation water assuming 100 years of irrigation. Both limits assume an annual application of 1000 mm water, retention of inorganic contaminants in the top 150 mm of soil, and a soil bulk density of 1300 kg/m
3. Cumulative contaminant
loading limit (CCL) is the maximum element loading for a heavy metal in soil. Na – not applicable, nd – not determined.
2.1. Antimony Antimony (Sb) is a metalloid from the same group and period as As, P and N. Sb as a naturally occurring compound is found in parts per billion (ppb) levels in the environment (air, water and soil). Sb in soil is usually bound to iron, manganese and aluminium particles and frequently found in association with As (Ashley et al 2003).
Sb is used in the manufacture of lead alloys, including metal and cable sheeting, solder, pipes, brake linings (Maher 2009), metal bearings, ammunition, semi-conductors, ceramic enamels, pottery, glass, lead-acid batteries in automotives and as a catalyst in the production of PET bottles (Westerhoff et al 2008). Antimony trioxide (Sb2O3) is widely used as a fire retardant in plastics, textiles, rubbers, paper, adhesives and pigments (Stephenson 1987, Maher 2009, US EPA 2009). Sb is also used in the treatment of parasitic diseases and it is emitted into the air by coal and fuel combustion.
Sb has no biological function, but interest on its impact on the environment has increased in recent years, due to the increase of its concentration in the environment associated with human activity since the industrial revolution, and also due to the limited scientific knowledge available on its chemistry and its long term environmental impact.
Typical concentrations of Sb in the environment range between less than 1ng/m3 to 170ng/m3 in the air, and between 0.3 to 8.6 mg/kg in soil (USEPA 2009, Tschan et al 2009), in sea water the average concentration is 0. 2μg/kg (Tschan et al 2009) and less than 2 to 25 mg/kg dry weight for sediment (ANZECC and ARMCANZ 2001). A maximum concentration for Sb in fresh water has not been established (ANZECC and ARMCANZ 2001, Ashley et al 2003).
Sb concentrations in drinking water range between 0.6 to 4.0μg/L, with a mean of 1.87 μg/L (USA data) (Health Canada 1997). The Australian drinking water recommended guideline for Sb is a maximum of 3 μg/L (NHMRC and NRMMC 2008). Overseas studies reported 0.01 μg/L Sb in domestic wastewater (Palmquist and Hanaeus 2005). In drinking water and wastewater sampled from Melbourne suburbs in 1994 and in 2006, Sb was below the respective detection limits of 1μg/L and 5μg/L in majority of samples from each of the respective studies (Connor and Wilkie 1995, CWW 2006).
In urban areas, the major sources of Sb to the environment are attributed to air pollution from human activities, particularly to the wear of brake linings (Månsson et al 2009, Ijima et al 2009 in Maher 2009), in addition waste incineration (e.g. in Japan) (Ijima et al 2009 in Maher 2009) and flame-retarded goods have also been identified as potentially important sources (Månsson et al 2009 in Maher 2009). Surface run-off is considered a predominant source of Sb to the wastewater stream in urban environments, particularly in combined sewers (Patriarca et al 1999).

Sources of priority contaminants in domestic wastewater: nutrients and additional elements 6
There is limited data on Sb within households. Palmquist and Hanæus reported Sb concentrations ranging from 0.28 to 0.68 μg/L and 0.22 to 0.33 μg/L for greywater and blackwater sampled from Swedish households (Palmquist and Hanæus 2005). In Canada, Le Blanc and colleagues measured concentrations of less than 1 μg/L to 16 μg/L Sb in shampoos and conditioners, with less than 1 μg/L in the majority of products (LeBlanc et al 1999).
Toxicity The toxicity of Sb is not well understood (Maher 2009). Sb has a similar chemical behaviour as arsenic (As), but it displays less toxicity on a molar basis (Maher 2009). Evidence of Sb bioaccummulation in plants and toxicity to animals has been reported in the literature, e.g. animals fed on forage grown in Sb contaminated soil (Tschan et al 2009, Westerhoff et al 2008) and for plants cultured in nutrient solution (Foy et al 1978). Tschan et al have also shown that plant uptake of Sb increases as the concentration of Sb in a solution increases and with the soluble Sb portion in soil. Mutagenic activity was evidenced on bacteria and cultured mammalian cells exposed to pentavalent and trivalent ammonium salts (NHMRC and NRMMC 2008). Carcinogenicity of some Sb compounds is suspected, but it has not been confirmed (USEPA 2009).
Evidence of direct toxicity to humans at current concentrations is limited (USEPA 2009). Acute toxicity effects occur generally by inhalation or skin contact (USEPA 2009). However, oral absorption has also been shown to affect the gastrointestinal tract following short-term chronic exposure, and, the nervous systems in the long-term in animal studies (Westerhoff et al 2008).
2.2. Chloride Chloride (Cl-) is an anion that originates from the dissolution of natural salt deposits or from contamination by human activity.
Cl is widely used in industrial, commercial and domestic applications. Industrial applications include the manufacture of food (NaCl), fertilisers (KCl), water treatment (FeCl3), disinfection (NaHClO3), chemicals (solvents, degreasing agents, adhesives, insecticides, herbicides), detergent industry, plastic manufacture (vinyl chloride), including pipes, flooring, medical supplies, personal care products, cosmetics, etc.
Chloride is found in food and water, including vegetables and processed food.
Surface waters in Australia typically contain less than 10mg/L Cl, but concentrations vary depending on location and pollution (NHMRC and NRMMC 2008). Reticulated water typically contains less than 350mg/L, with the Australian Drinking Water Guidelines (ADWG) value of 250mg/L based on the human taste threshold (NHMRC and NRMMC 2008). Domestic wastewater reaching the treatment plant has on average between 30 and 90mg/L Cl, but concentrations can be much higher for industrial wastewater (Metcalf and Eddy 2003)
In mixed greywater a wide range of Cl concentrations, from 31 to 136mg/L, have been reported in the literature (Hypes 1974, Rose et al 1991, NRMMC/EPHC/AHMC 2006). Concentrations for domestic wastewater reported in the literature vary, partly because of differences in tap water quality and household habits across the globe. For instance, in Israel, which is supplied by high salinity groundwater, Friedler reported concentrations ranging from 166 to 450 mg/L for the bathroom and laundry greywater, whilst, in Melbourne, which is characterised by soft water, Christova-Boal et al reported concentrations of 9 to 88 mg/L for greywater from those same sources (Friedler 2004, Christova-Boal et al 1996).
Sources of priority contaminants in domestic wastewater: nutrients and additional elements 7
Toxicity Chloride is an essential element for human beings and animals. It is non-toxic at the typical concentrations found in the environment, however at elevated concentrations it can have adverse effects on biota in freshwater environments (NRMMC/EPHC/AHMC 2006). High levels of chloride in irrigation water (30 - 100 mg/L) can increase salinity of soil. Irrigation with concentrations greater than 140 mg/L can cause decline in plant yield depending on soil characteristics and irrigation frequency (ANZECC and ARMCANZ 2001). In addition, water with more than 400 mg/L Cl increases the concentration of CdCln 2-n complexes in soil, which is more labile resulting in greater overall uptake of Cd from the soil by plants (McLaughlin et al 1997 in ANZECC and ARMCANZ 2000). Foliar injury to crops also results when solutions containing high chloride levels are sprayed directly onto leaves. Concentration thresholds vary with plant species. Tobacco leaves, for instance, have a threshold of 40 mg/L (ANZECC and ARMCANZ 2001). High chloride concentrations in water can also cause corrosion of metal pipes and water distribution infrastructure (NRMMC/EPHC/AHMC 2006). In humans, chloride is absorbed via the gastrointestinal tract mainly via the ingestion of NaCl from food. There is no evidence of carcinogenic or genotoxic effects and limited evidence of adverse effects following the prolonged intake of large amounts of chloride (NRMMC/EPHC/ AHMC 2006).
2.3. Cobalt Cobalt (Co) is a common element found in 0.0025% of the earth’s crust. It is often found in combination with sulfides, arsenides, sulfoarsenides, hydrates and oxides, and in association with copper or nickel (Kim et al 2006).
The major industrial application of Co is in the manufacture of alloys (steel, welding material, magnets). Co is also used as a catalyst in the petrochemical, plastic and detergent industry (Kim et al 2006), in the manufacture of pigments, inks and glass production (Stephenson 1987), in phosphate fertilisers, petrol, coal and fuel oil at concentrations of less than 0.001 mg/kg, 5 mg/kg and between 0.001 - 10 mg/kg, respectively.
Co is found in the air, in surface waters, in soil, in groundwater, in wastewater sludge and in leachate from landfill. It is released to the environment by a number of diffuse sources, such as burning of fossil fuels, sewage sludge, phosphate fertilisers, pollution from mining and smelting and by industries that use cobalt compounds in their processing. Typically it settles in sediment and has low uptake by plants remaining mainly in the root zone.
Co is naturally found in sea and surface waters, soil and rocks. Surface water and ground water contain less than 1-10 μg/L in urban areas. Unpolluted surface waters typically contain less than 1μg/L. The concentration in drinking water ranges from <1 to 2μg/L and in rainwater from 0.3 to 0.7 μg/L. The Australian guidelines recommend a long term concentration value of 0.05 mg/L and a short term value of 0.1 mg/L for irrigation water. As there is limited data on soil toxicity, no CCL values have been established (ANZECC and ARMCANZ 2001). There is limited data on Co concentrations in wastewater. In 1995 Melbourne’s wastewater had an average of 1.28μg Co/L, but concentrations ranged from less than 1 to 3μg/L (Wilkie et al 1996). Palmquist and Hanaeus reported grey and blackwater concentrations in the ranges of 1.19 to 1.59 μg/L and 0.48 to 1.20 μg/L, respectively, in Sweden (Palmquist and Hanaeus 2005). LeBlanc verified that shampoos and conditioners in the UK also contributed to the Co content in wastewater, with concentrations up to 12 μg/L verified in certain brands

Sources of priority contaminants in domestic wastewater: nutrients and additional elements 8
(Le Blanc 1999). However, detection in wastewater was often rare even close to the point of discharge, as reported by the number of studies that reported Co to be either at or below the limit of detection (maximum 1.5 μg/L) in greywater (Hargelius et al 1996, NRMMC/EPHC/ AHMC 2006).
Toxicity Cobalt is a non-essential micronutrient for most plants, but it is essential in the nitrogen fixation process for legumes. Evidence of direct toxicity to microorganisms and plants in soil is scarce, as Co tends to bind with soil particles into stable compounds. However plant toxicity has been verified in nutrient solutions, with concentrations greater than 0.06 mg/L reported to hinder plant growth (Kim et al 2006). Co released into water tends to be adsorbed into particles or sediment and settle into the soil. However, in polluted waters, soluble organic complexes of Co are formed, these are bioavailable to plants and other organisms. Yet there is no evidence of biomagnification of cobalt in the food chain (Smith and Carson, 1981 in Kim et al 2006).
Concentrations of 0.08-0.5 mg/L Co have been verified to exert an inhibitory effect on pure cultures of Nitrosomas sp (Henze et al 2002), hence inhibition of the nitrification process during wastewater treatment could occur at specific Co concentrations.
Cobalt toxicity in aquatic systems has been verified for a range of species, at exposure limits ranging from 0.01 mg/L (EC50 for Daphnia magna 21d) to 1.1 mg/L (LC50(24-96h) for freshwater invertebrates) (WHO 2006). Adverse impact on higher order organisms requires much higher concentrations, for instance, earthworm and springtail reproduction are only affected at concentrations of 300-400mgCo/kg dry weight soil (WHO 2006).
Human toxicity has been verified at doses of 150 mg/day for periods of at least 22 days (Kim et al 2006). Toxicity symptoms include polycythaemia, increased hemoglobin and reduced lung capacity. Mortality is generally associated with occupational exposure, such as entry via the respiratory system with the onset of lung disease in the hard metal industry (Kim et al 2006).
2.4. Chromium Chromium (Cr) is a naturally occurring element found in the soil, rocks, plants, living beings and volcanic emissions (EPA 1998). Soils typically contain 100 mg Cr/kg soil, but the concentration can range between 5 to 3,000 mg/kg (Asano et al 2007). Chromium concentrations in surface water depend on the degree of pollution of the water body.
Cr is widely used in the manufacture of alloys for industrial equipment, machinery and building construction, in electroplating, in rust inhibitors, inks, pigments, preservatives (fungicides), glass manufacture, dyeing of textiles and tanning (Stephenson 1987, Icon 2001).
In Europe, commercial sources contribute between 30 – 60% of the total load reaching wastewater treatment plants, whilst domestic sources are assumed to contribute between 20-40% (Icon 2001). In Melbourne, 45.8% of the Cr load reaching the Eastern Treatment plant is estimated to come from trade waste (URS 2004). Among commercial sources, car washes have been identified as the major potential source in Europe (Sörme and Langkvist 2002).
Reticulated water in Australia may contain up to 0.03 mg/L Cr (ADWG 2008). In Melbourne the concentration in tap water was below the detection limit of 1 μg/L in the 1995 study by Wilkie et al (1996). Concentrations of Cr in Melbourne’s residential wastewater were reported

Sources of priority contaminants in domestic wastewater: nutrients and additional elements 9
to range up to 8 μg/L, with an average of 3.2 μg/L according to the same study (Wilkie et al 1996).
Closer to the point of generation higher concentrations have been observed. Chromium concentrations for grey and blackwater range between 2.06 to 36 μg/L and up to 3.7 μg/L respectively (Palmquist and Hanaeus 2005, Eriksson et al 2002).
Toxicity Chromium is present in the environment as a metal, in trivalent (III) or hexavalent (VI) states.
Cr (VI) in the soil is absorbed by plants, whilst Cr (III) remains immobile in the soil. Cr (VI) is toxic at concentrations ranging from 50 to 5,000 mg/kg, dependent on plant species and soil conditions (NRCC 1976 in ANZECC and ARMCANZ 2001). In biosolids Cr is typically present as Cr (III) which is immobile. Yet specific soil conditions can result in reduction of Cr (III) to Cr (VI).
Studies using nutrient solutions have shown lower crop yields at concentrations of 1-10 mg/L Cr (ANZECC and ARMCANZ 2001).
Trivalent Cr is an essential element for microorganisms, animals and human beings. On the other hand, hexavalent Cr is carcinogenic when inhaled, mutagenic to bacterial assays and corrosive on tissue, leading to long-term skin sensitisation and kidney damage (Metcalf and Eddy 2003).
Carcinogenic effects due to oral ingestion by humans have not been verified, although in mice dosages of 250-700 ppm Cr in drinking water impair foetus development.
Toxicity to heterotrophic microorganisms at treatment plants has also been verified at concentrations of 10 mg/L (Metcalf & Eddy 2003) and more than 0.25 mg/L for pure cultures of nitrosomas sp (Henze et al 2002).
Toxicity to zooplankton has been verified at concentrations from 0.016 to 0.70 mg/L Cr (Hart 1974).
2.5. Fluoride Fluoride (F) is found in 0.07% of the earth’s crust, mainly bound to metalloids. Concentrations found in the environment include: between less than 200 to 7,000 mg/kg in soil, 2 mg/L in freshwater (WHO 1970 in AANZMCC and ARMCANZ 2001), average of 1.4 mg/L in seawater and less than 2 mg/L in irrigation water.
Typical concentrations in soil are less than 400 ppm. In surface waters the concentration ranges from less than 0.1 to 0.5 mg/L, however higher content can be found in groundwater due to leaching from mineral rocks with high F content in certain parts of the world. Agricultural soil averages range from 150 to 360 mg/kg soil (McLaughlin et al 1996).
Trace amounts of F are also found in most food stuff, with specific food groups, such as tea leaves having high concentrations.
Inorganic F is used in aluminium production, in the manufacture of steel and glass fibre, in the production bricks, tiles and ceramics. Fluoride is also used in insecticides, rodenticides, floor polishes, petroleum, glass etching, timber preservatives, dietary supplements and toothpaste. Hydrogen fluoride/hydrofluoric acid is used in the semiconductor industry, manufacture of chemicals, solvents and plastics (WHO 2009). Fluoride is also found as a contaminant in phosphate rock, which is used in fertilisers and in some laundry powder formulations.
Fluoride in air is mainly caused by emissions, particularly in the proximity of industries such as steel, superphosphate, coal burning, glassworks and oil refineries. Typical concentrations in air are less than1.89 μg/m3 (USA/Europe).

Sources of priority contaminants in domestic wastewater: nutrients and additional elements 10
The Australian drinking water guidelines sets a maximum guideline value of 1.5 mg/L F (NHMRCC and NRMMC 2008). Fluoridated drinking water concentrations in Melbourne range between less than 0.05 to 1.1 mg/L, with annual averages of less than 1 mg/L. (YVW 2009, CWW 2009, SEWL 2009). Fluoride is not commonly analysed in household wastewater, but concentrations between 0.49 to 1.6 mg/L have been reported for greywater in the literature (NRMMC/EPHC/AHMC 2006).
Toxicity Fluoride is an essential trace element to mammals, however at high concentrations toxicity has been verified.
In soil F is typically bound to soil particles and inert. Contamination of groundwater through irrigation and plant toxicity by fluoride from soil has not been evidenced (ANZECC and ARMCANZ 2001). However, uptake and toxicity to plants in nutrient solution has been observed at concentrations ranging between 1 mg/L to more than 100 mg/L, dependent on the ionic species and the plant species. The Australian irrigation guidelines recommend concentrations of 1.0 mg/L for long-term and 2.0 mg/L for short tem values (ANZECC and ARMCANZ 2001).
Fluoride is also absorbed by plants through deposition of airborne particles onto leaves, with long-term injury to plants resulting from concentrations greater than 0.2 μg/m3. A detailed description of fluoride’s impact on crops can be found in McLaughlin et al (1996).
Concentrations of more than 1.5 mg/L have been shown to have negative impact on tooth mineralisation in children (NHMRCC and NRMMC 2008). Ingestion of 5 to 10 mg/kg body weight results in acute toxicity, and doses of more than 16 mg/kg may lead to death. Skeletal fluorosis has been verified at concentrations of more than 5 mg/d for sensitive human subjects (WHO 2000).
2.6. Molybdenum Molybdenum (Mo) is used in the manufacture of steel and non-ferrous alloys, chemicals and ceramics, in catalysts, pigments, electrical contacts, screens, radio valves and lamp filaments, fertilisers and lubricants (Stephenson 1987, NHMRCC and NRMMC 2008).
Mo occurs naturally in Australian soils at concentrations ranging between 0.2 to 20 mg/kg with a median concentration of 1.0 mg/kg soil (ANZECC and ARMCANZ 2001). Concentrations in surface waters range between 0.03 and 10 μg/L in unpolluted freshwater (ANZECC and ARMCANZ 2001). The Australian drinking water guidelines for Mo recommend a maximum concentration of 0.05 mg/L. Mo is also present in most foods.
Information on Mo in wastewater is scarce (Icon 2001, Eriksson et al 2002). Wilkie et al (1996) analysed Melbourne’s wastewater and detected less than 1 μg/L Mo in domestic wastewater catchments and an average of 3 μg/L for wastewater at the treatment plant. There is also limited data on Mo sources. In Canada, Le Blanc et al (1999) measured between 1 to 27 μg/L Mo in the formulation of shampoos and conditioners.
Toxicity Molybdenum (Mo) is an essential trace element for living organisms in small concentrations. Plants in soil have a high tolerance to Mo, with no adverse effects verified for soil concentrations greater than 100 mg/kg. There is also no evidence of phytotoxicity to crops

Sources of priority contaminants in domestic wastewater: nutrients and additional elements 11
from Mo in irrigation waters, but toxicity to plants grown in aqueous solution has been observed at concentrations larger than 0.5 mg/L Mo (ANZECC and ARMCANZ 2001). Often, toxicity to livestock is evidenced before plant toxicity is observed. Livestock fed a daily intake of forage containing more than 5 mg/kg for cattle and more than 10 mg Mo/kg for sheep experience Cu deficiency (Dye 1962 in ANZECC and ARMCANZ 2001). Cattle fed on vegetables irrigated with water containing 0.01 mg/L Mo have also shown signs of molybdenosis (DWAF 1996a in ANZECC and ARMCANZ 2001). Thus, long and short term concentrations of 0.01 mg/L and 0.05 mg/L are specified for irrigation waters (ANZECC and ARMCANZ 2001). For aquatic life, data on Mo toxicity is contradictory (Davies et al 2005). Acute toxicity has been reported for concentrations ranging from 0.73 to more than 90 mg/L for fish eggs and alevins and between 70 to 2,000 mg/L for various fish species, however results could not be confirmed in later studies (Davies et al 2005). In Canada a maximum concentration of 1mg/L is adopted for protection of aquatic life (Davies et al 2005). Whilst in Australia trigger values for aquatic ecosystems have not been set because of insufficient data. There is insufficient evidence of toxicity to humans (NHMRCC and NRMMC 2008).
2.7. Selenium Selenium (Se) is widely found in the environment, often in association with sulphide ores of copper, iron, zinc and in natural coal deposits. An essential trace element to humans and animals, it is also found in foodstuff (Icon 2001).
Industrial applications of Se include the electrical and electronics industry, the manufacture of semiconductors, rectifiers, ceramics, glass and pigments, alloys, catalysts, deodorants, lubricants, pesticides, anti-dandruff shampoo, cosmetics, pharmaceuticals, food supplements, animal feed and rubber industry (Stephenson 1987, Icon 2001, NHMRCC and NRMMC 2008). Release of Se into the air is most commonly attributed to the burning of coal and the production of alumina.
Selenium content in Australian soils ranges from 0.05 to 3.2 mg/kg, yet many Australian soils are Se defficient (ANZMCC 2000). In unpolluted waters concentrations are less than 0.1 μg/L. Australian reticulated water supplies contain in general less than 0.005 mg/L (NHMRCC and NRMMC 2008), which is also the trigger value for protection of 99% freshwater aquatic systems (ANZECC and ARMCANZ 2001).
In a 1995 study conducted in Melbourne by Wilkie et al Se was below the detection limit of 10 μg/L in domestic wastewater and at the treatment plant (Wilkie et al 1996). Studies of Se in household wastewater have also been few (Eriksson et al 2002), with reported concentrations mainly below detection in greywater (Christova-Boal et al 1996, Hypes 1974).
Toxicity Se is recognised as a potentially toxic compound at low concentrations, but information on its long term effects is limited (Icon 2001).
Se is highly mobile and bioavailable. Toxicity is dependent on the specific Se compounds and on their concentration (NHMRCC and NRMMC 2008, O’Connor et al 2001). Phytotoxicity is dependent on plant species (Terry et al 2000). Some plants, which are known to be Se accumulators, can absorb large amounts of Se with low phytotoxicity, whilst non-accumulators, experience stunted growth at a range of concentrations. Australian phytotoxicity was verified for Se at 1 mg/kg in soil and 0.7 mg/L in nutrient solution (Will and Suter 1994 in ANZECC and ARMCANZ 2001).

Sources of priority contaminants in domestic wastewater: nutrients and additional elements 12
Aquatic toxicity has been evidenced mainly in environments polluted by industrial discharges, resulting in teratogenic and developmental defects in freshwater fish and in the cycling and accumulation of Se in aquatic environments, particularly in lakes (Lemly 2002).
Cattle requires between 0.03-0.1 mg/kg of Se as dietary supply. However domestic animals fed more than 5mg Se/kg feed can suffer from toxic effects such as “blind staggers” which results in paralysis and death due to respiratory failure. The maximum recommended Se concentrations for waters used for growing feed for livestock are respectively 0.05 mg/L and 0.02 mg/L Se for short and long term irrigation. The CCL for Se is 10kg/ha (ANZECC and ARMCANZ 2001). Selenium sulphide and selenite have been shown to cause tumours in mice and chromosome damage to mammalian cells (NHMRCC and NRMMC 2008). However, carcinogenicity to humans and animals has not been proven. Se deficiency in humans is suspected to be associated with chronic heart disease and cancer, with the typical adult requiring on average 70 μg/d Se (Francesconi and Pannier 2004). Excess intake of Se, more than 1 mg/d over extended periods, is reported to cause nail deformities, gastrointestinal disturbance, dermatitis, dizziness, mental tiredness and breath odour (NHMRCC and NRMMC 2008). However, toxicity in humans is most often caused by occupational exposure.
2.8. Nitrogen Nitrogen (N) is an essential nutrient for biological development of all major organisms.
Wastewater typically contains between 20 to 85 mg/L total nitrogen (WHO 2006). In Melbourne, concentrations up to 122 mg/L have been reported in domestic wastewater reaching sewage treatment plants (Wilkie et al 1996), whilst concentrations up to 500 mg/L have been reported in the trade waste of specific industries (Fox et al 2006).
In a household, over 85% of the nitrogen load originates from blackwater, with typical concentrations of total nitrogen in blackwater ranging between 130 to 180 mg/L (Palmquist and Hanæus 2005). Concentrations of TKN in greywater range from 1 to 5 0 mg/L in the literature (Eriksson et al 2002, Palmquist and Hanæus 2005, Tunaley et al 2004).
Toxicity
Nitrogen is reported as organic nitrogen, nitrate salts, and ammonium (NH4+). Nitrate, the
end product of the oxidation of ammonium and organic nitrogen, is soluble in water and can be toxic to humans at high concentrations.

Sources of priority contaminants in domestic wastewater: nutrients and additional elements 13
Excess nitrate (more than 50 mg /L NO3) in drinking water causes methemoglobinemia in infants less than 3 months old and in animals, leading to asphyxiation. Conversion of nitrate into nitrosamine, a carcinogenic, in the human digestive tract has also been reported in the literature (NHMRCC and NRMMC 2008).
Excess nitrogen, at concentrations ranging from 0.1 to more than 1.6 mg/L, in surface waters can cause excessive algae growth (euthrophication), which depletes dissolved oxygen in water and impacts other aquatic species.
Ammonium is rapidly absorbed by the soil and available to plants. For irrigation waters, the maximum recommended concentration of nitrogen was established to protect groundwater and surface waters, with 5 mg/L and 25 to 125 mg/L as the short and long term maximum recommended concentrations for irrigation (ANZECC and ARMCANZ 2001).
2.9. Phosphorus Phosphorus (P) is an essential nutrient for plant growth and for biological metabolism. In the environment, it is found as mineral phosphate deposits of tricalcium phosphate.
Industrial applications of phosphorous include the manufacture of fertiliser, food (including soft drinks, cheese processing, baking powder), flame-proofing chemicals, water conditioning, anti-corrosion agents for metals, detergent manufacture, insecticides, rodenticides, matches, as an additive in alloy manufacture, additives to gasoline and lubricating oil, plasticisers in plastic manufacture and more (Encyclopaedia Britannica 2009).
Toxicity Phosphorus is not toxic. However excessive discharge into aquatic environments can result in excessive algae growth, eutrophication and the depletion of oxygen in water bodies, impacting aquatic life. The recommended STV and LTV for irrigation waters are 0.8 to 12 mg/L and 0.05 mg/L, respectively (ANZECC and ARMCANZ 2001).
2.10. Sources of pollutants to domestic sewage
A number of sources have the potential to contribute to the element loads in wastewater. Some of these are illustrated in Table 2. Nutrients such as nitrogen and phosphorus originate primarily from human excretion (Metcalf and Eddy 2003, Gray and Becker 2002). Information on the origin of other contaminants in domestic settings is more limited. Selenium, cobalt and molybdenum are also sourced from food, ending in human excreta. However a number of the elements can be found in common household products either as residual contaminants or as ingredients in product formulations.

Sources of priority contaminants in domestic wastewater: nutrients and additional elements 14
Table 2: Domestic sources of elements in urban wastewater (adapted from Icon 2001)
Product type Co* Cr* Se* Cl F Sb Mo N P
Cleaning products
√ √ √ √
Cosmetics, medicated shampoos
√ √ √
Fire extinguishers
√
Inks √
Lubricants √
Medicines and ointments
√ √ √
Health supplements
√ √ √ √ √ √
Food products √ √ √ √ √
Paints and pigments
√ √ √
Faeces and urine
√ √ √ √ √
Tap water √ √
Metal fittings √ √
Note: * potentially toxic
Human excreta has traces of all the contaminants detailed in this report, as elements are often ingested via daily food intake or via respiration. The rates of human intake and excretion reported in the literature vary depending on the characteristics of the sample population, including their age, gender, geographical location, diet and environmental pollution. A summary of the elemental loads in human urine and faeces reported in the literature is shown in Table 3.
.

Sources of priority contaminants in domestic wastewater II: nutrients and additional elements
15
Table 3: Typical amounts secreted by human body
Element Daily excretion
(mg. pe-1 .d-1 or as stated)
Concentration in Faeces (range)
(μg. pe-1.d-1 or as stated)
Concentration in Urine (range)
(μg. pe-1.day-1 or as stated)
Perspiration or other
(μg.pe-1. d-1 or as stated)
Antimony 2.51(m) 0.3-0.9 (a) Sb (III)
1.61 (b) (Germany)
(1.2-3.6)(a) Sb (VI)
0.063 (LOD – 0.57) (c)
Chloride
210-500 μg.kg body wt -1.d-1 [(5) in (c)]
4400 (m)
210-500 μg. kg body wt -1. d-1
(c) 20 to 250 mEq. d-1 (c)
115 mEq. d-1 or 4.21g/L(f)
360-4680mg. L-1 (c)
Chromium 0.02 (m)
20 (f)
10.1(e) Sweden
0.16+ 0.02 (e)
0.158 (LOD – 1.0)(n)
Cobalt
0.002-0.020 [(19) in (c)]
0.161 (d)
0.023 (m)
0.04-2μg.L -1 (p)
0.387 (0.02-3.3) μg.L -1 (n)
Fluoride 3.14 (m) 74.56 (h) 671+373 (156-1990) (Spain 250 pe) (g) 100
Molybdenum 87+11μg. pe-1.d -1 (j) (87 -187) (USA) (c)
38 (4-357) μg.L -1 (Germany) (n)
20 (i)
Hair (0.01μg/g hair) (i)
Selenium
1.4-14 for healthy adults(k)
0.085 (m)
14(3-60) μg.L -1 (n)

Sources of priority contaminants in domestic wastewater: nutrients and additional elements 16
Element Daily excretion
(mg. pe-1 .d-1 or as stated)
Concentration in Faeces (range)
(μg. pe-1.d-1 or as stated)
Concentration in Urine (range)
(μg. pe-1.day-1 or as stated)
Perspiration or other
(μg.pe-1. d-1 or as stated)
Phosphorus
9.9 (7.1-20.0) μg.kg body wt -1.d-1 [(10) in (c)]
2,700-4,500 (dry weight basis) (l)
3,200 (m)
0.7(0.1-1.7) g .pe-1 .d-1 (USA)(o)
1 g .pe-1 .d-1 (Sweden)(f)
1,500 (f)
32 mg/100mL saliva
Total nitrogen
0.8-2.5 g.pe-1.d-1 [(20) in (c)]
Average 13g .pe-1 .d-1 (l)
Range 9-21.7g. pe-1.d-1 (dry weight basis)(USA) (l)
2 (0.25-4.2) g. pe-1. d-1 (USA) (o) 11 g. pe-1. d-1 (f)
(a) Health Canada (1997), (b)(Gebel et al (1998), (c) Alltman and Dittmer (1972-74)1, (d)Kim et al (2006), (e)Anderson et al (1997), (f) Vinneras, B (2001), (g)Yadav et al (2007), (h) Based on Gropper et al (2008), (i)Gropper et al (2008), (j) Van Cauwenbergh et al (1997), (k) Adapted from Alaejos and Romero (1993) assuming a body weight of 70kg, (l)Metcalf and Eddy (2003), (m) Estimated from literature, (n) Heitland and Köster (2006), (o) Del Porto et al 2000 in Crockett et al 2003, (p)Ichikawa et al (1985) and Alexandersson (1988) in (d), (q) Fittschen and Hahn (1998) in (f) .
1 Based on a dietary intake of 10g N per day and a body weight of 70kg.

Sources of priority contaminants in domestic wastewater II: nutrients and additional elements
17
3. METHODOLOGY
3.1. Product selection
A total of 156 products were purchased from major supermarkets in Melbourne, Australia, during the period of February to March 2008. For each brand, a single product sample was purchased. When available a private brand, a market leader brand and a brand with an “environmental friendly” or “natural“ label were included in the product category.
3.1.1. Cleaning products
The range of cleaning products selected included:
• 4 brands of toilet cleaner
• 4 brands of floor cleaners
• 7 brands of general purpose cleaners which included 4 disinfectants (including 1 bleach), 2 multi-purpose cleaners and 1 cream cleanser
• 3 brands of toilet bowl fresheners and 4 brands of in-cistern cleansers
• 8 brands of toilet paper, including 2 made of recycled paper.
3.1.2. Dishwashing products
The range of dishwashing products selected included:
• manual dishwashing: 6 brands of liquid detergent
• automatic dishwashers: 4 brands of dishwasher tablets and 5 brands of dishwasher powder detergents (the environment label detergent was only available as a powder in sachets)
• Rinse aid: 1 brand.
3.1.3. Laundry products
The range of laundry products selected included:
• 7 brands of fabric softener
• 13 brands of concentrate powder detergent
• 11 brands of liquid detergent (including 1 brand of wool wash liquid detergent)
• 2 brands of soakers.
3.1.4. Personal care products
The range of personal care products included:
• 4 brands of facial care creams/lotion

Sources of priority contaminants in domestic wastewater: nutrients and additional elements 18
• 5 brands of body lotion
• 5 brands of deodorant in aerosol form
• 4 brands of deodorant in roll-on form
• 7 brands of sunscreen SPF30+
• 5 brands of mouthwash
• 9 brands of toothpaste
• 6 brands of hair colouring
• 5 brands of shaving foam (including 1 shaving stick)
• 10 brands of shampoo, including 2 anti-dandruff formulations
• 3 brands of conditioner
• 4 brands of shower gel, 6 brands of soap bars and 5 brands of hand wash
• 1 brand of facial cleanser, 1 brand of facial scrub and 1 brand of depilatory cream.
3.2. Analytical methodology
3.2.1. Metal analysis Metal analysis was conducted using a Varian Liberty Series II ICP-AES with a 40 MHz free running RF generator and a 0.75 m Czerny- Turner monochromator and a Thermo X series ICP-MS for detection of antimony, cobalt, molybdenum and selenium. The limits of detection for the instruments are shown in Table 4.
Samples of low organic content were prepared by acid digestion of each product as received or diluted to 1:10v/v in deionised water. For products of high organic content, e.g. toilet paper, a 5-g sample was ashed prior to digestion and analysed in duplicate. Ashing was performed in covered crucibles in a muffle furnace at 450°C for 1 hour or until the sample weight had stabilised.
Acid digestion was conducted using high purity nitric acid (Fluka TraceSelect) and hydrochloric acid (BDH AnalaR) at 95°C. Acid was added in 5 mL increments as per method 3030E (APHA/AWWA 1998). The digested sample was transferred to a 100 mL volumetric flask and the volume completed with deionised water. Blanks were also prepared for each batch of 20 samples.
3.2.2. Chloride Samples for chloride analysis were prepared as 100% aqueous solutions (5-10 g product in 100mL) with deionised water or as a 10% v/v isopropanol (analytical grade) solution for hydrophobic products and sent for analysis in a NATA accredited external lab using method WSL115.
3.2.3. Fluoride Samples for fluoride analysis were prepared as a 100% aqueous solutions (2.5-10 g product per 100mL) with deionised water or as a 10%v/v isopropanol solution for hydrophobic products and sent for analysis in a NATA accredited external lab. Fluoride was analysed using method APHA 4500-F C (ion selective electrode) at a NATA accredited laboratory (APHA/AWWA 2008). The detection limit for the fluoride test was 0.1 mg/L for samples in aqueous solution.

Sources of priority contaminants in domestic wastewater: nutrients and additional elements 19
3.2.4. Nutrients Liquid products were analysed in their original state. Solid and viscous samples were diluted in deionised water for analysis.
Total Kjeldahl Nitrogen (TKN) was analysed using APHA method 4500-N Org, B (APHA/AWWA 2008) at a NATA accredited laboratory.
Total phosphorus (TP) was analysed using APHA method 4500 (APHA/AWWA 2008) at the CSIRO Highett laboratories.
Table 4 provides a summary of the detection limits of the methodology adopted.
Table 4: Detection limits for test methods
Element Standard LOD (mg/L or *μg/L)
Antimony 5*
Chloride 1
Cobalt 0.5*
Fluoride 0.1
Molybdenum 0.5*
Selenium 4*
TKN 0.1
TP 0.05
3.2.5. Concentration in product The concentration of an element in a product was determined using equation (1).
Concproduct = Conc.measured x Vs x Mproduct -1 x 10³ (equation 1)
Where: Concproduct = concentration of element in product (mg/kg product)
Concmeasured = concentration of element determined experimentally (mg/L)
Vs = volume analysed (L)
Mproduct = Mass of product tested (g)
The geometric mean and median concentrations for each category of products, e.g. shampoos, were determined as the geometric mean and median of the concentration of all brands tested in a product group.
Conc( average) product group = ∑=
n
1 i Concproduct i (equation 2)

Sources of priority contaminants in domestic wastewater: nutrients and additional elements 20
3.2.6. Frequency of use The frequency of product use and the amount of product adopted in each application were estimated for a single person household based on the average frequency of appliance use (Roberts 2005) and average product dosages for each category based on manufacturer’s recommendations (Tjandraatmadja et al 2008). The assumed frequencies are shown in Table 5.
These assumptions were used to estimate the weekly mass load generated from product use.
M(i)week = f x dose x Concproduct
Where: M(i)week = Weekly mass load for element I for a selected product category (mg/pe/wk);
f = frequency of use per week (times/week);
dose = typical product dose for the product category (kg)
Table 5: Assumptions for product dosages for household and personal care products for a single person household
Category Product type Assumed dose per use (g)
Frequency of use per week
Conditioner 10 5.3*
Shampoo 5 5.3*
Body wash 7 5.3*
Handwash/ Soap 2 42
Shaving foam 3 7
Hair colorant 60 0.3
Toothpaste 3 14
Mouthwash 17 14
Deodorant 0.2 7
Sunscreen 10 7
Body Lotion 10 7
Bathroom
Facial cleanser 5 7
Dishwashing liquid 7 10.5
Dishwasher tablet 20 1.8*
Dishwasher powder 60 1.8*
Kitchen
Rinse aid 1 1.8*
Fabric softener 75 3*
Laundry Powder 126 3*
Laundry Powder concentrate 80 3*
Laundry
Laundry Liquid 90 3*
Toilet paper 1 8.4 Toilet
Toilet freshener or in-cistern freshener
1 29.4*
Note: *Based on Roberts (2005).
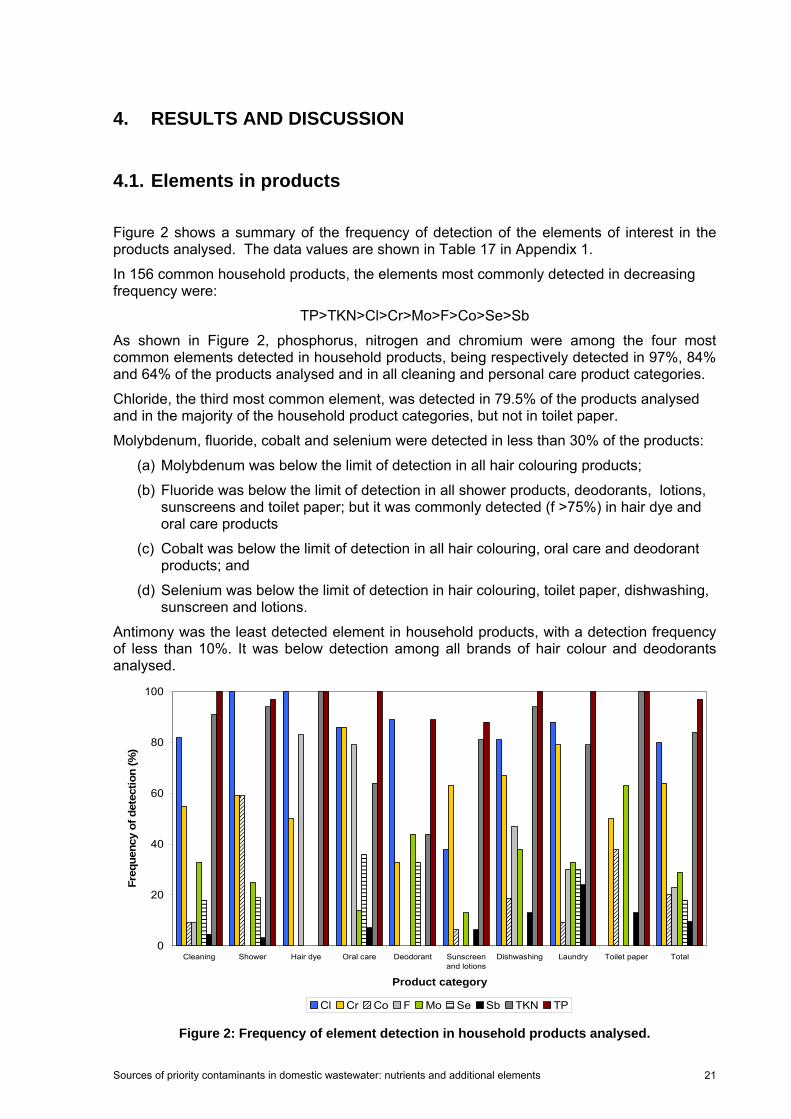
Sources of priority contaminants in domestic wastewater: nutrients and additional elements 21
4. RESULTS AND DISCUSSION
4.1. Elements in products
Figure 2 shows a summary of the frequency of detection of the elements of interest in the products analysed. The data values are shown in Table 17 in Appendix 1.
In 156 common household products, the elements most commonly detected in decreasing frequency were:
TP>TKN>Cl>Cr>Mo>F>Co>Se>Sb
As shown in Figure 2, phosphorus, nitrogen and chromium were among the four most common elements detected in household products, being respectively detected in 97%, 84% and 64% of the products analysed and in all cleaning and personal care product categories.
Chloride, the third most common element, was detected in 79.5% of the products analysed and in the majority of the household product categories, but not in toilet paper.
Molybdenum, fluoride, cobalt and selenium were detected in less than 30% of the products:
(a) Molybdenum was below the limit of detection in all hair colouring products;
(b) Fluoride was below the limit of detection in all shower products, deodorants, lotions, sunscreens and toilet paper; but it was commonly detected (f >75%) in hair dye and oral care products
(c) Cobalt was below the limit of detection in all hair colouring, oral care and deodorant products; and
(d) Selenium was below the limit of detection in hair colouring, toilet paper, dishwashing, sunscreen and lotions.
Antimony was the least detected element in household products, with a detection frequency of less than 10%. It was below detection among all brands of hair colour and deodorants analysed.
0
20
40
60
80
100
Cleaning Shower Hair dye Oral care Deodorant Sunscreenand lotions
Dishwashing Laundry Toilet paper Total
Product category
Freq
uenc
y of
det
ectio
n (%
)
Cl Cr Co F Mo Se Sb TKN TP Figure 2: Frequency of element detection in household products analysed.

Sources of priority contaminants in domestic wastewater: nutrients and additional elements 22
4.1.1. Antimony Traces of Antimony (Sb) were detected in 9.6% of the 156 products analysed. Sb was detected in individual product brands, but not detected consistently in any class of products analysed.
The concentrations in products and the comparison of the corresponding loads from product use are shown in Table 6 and Figure 3, respectively. Antimony was below the detection limit in majority of the cleaning products and personal care products (toilet cleaners, disinfectants, sunscreen, soap, handwash, laundry powder, shampoo, soap, etc).
Among the laundry products that contained Sb, the concentration range varied from 0.04 to 0.82 mg/kg product. The highest concentration, 0.82 mg/kg, was for a brand of dishwashing powder. The second highest concentration, 0.47 mg/kg, was for a brand of laundry powder.
Among the product categories, antimony was:
(a) detected in only two of four brands of dishwasher powders, and it was below detection in all brands of dishwashing liquids, tablets and in the rinse aid, and
(b) detected in 46% and 20% of the brands of washing powders and liquids, respectively, but it was below detection in all the remainder of washing aids (fabric softeners, soakers and wool wash).
Other individual products that contained Sb included one brand of floor cleaner (0.016 mg/kg), one brand of toilet paper (0.069 mg/kg) and one brand of toothpaste (0.147mg/kg).
The low Sb concentrations in the products would result in weekly loads of less than 0.18 mg/pe/wk per product assuming that the brand with the highest concentration was used as shown in Figure 3. The estimated mass loads are shown in Table 27 in Appendix 2.
In summary, Sb is a minor contaminant in household products.
Table 6: Concentration of Sb in household products
Product (number of brands) Concentration (mg/kg product)
Toilet paper (1) 0.02
Floor cleaner (1) 0.07
Toothpaste (1) 0.15
Laundry detergent (8) 0.04, 0.12, 0.13, 0.19,
0.2 (x2), 0.41, 0.47
Dishwashing powder (2) 0.82, 0.10

Sources of priority contaminants in domestic wastewater: nutrients and additional elements 23
Maximum Sb load (mg/pe/wk)
0.000 0.005 0.010 0.050 0.100 0.150 0.200
Pro
duct
Toilet paper
Floor cleaner
Facial lotion
Conditioner
Toothpaste
Dishwashing powder
Laundry liquid
Laundry powder
Figure 3: Antimony loads estimated from product use
4.1.2. Chloride Chloride was the third most common element in this group detected in 79.5% of the household products analysed. The concentrations in products are shown in Table 7 and the corresponding loads from product use are compared in Figure 4. Table 28 in Appendix 2 shows the major Cl loads for each product category.
The concentrations in products ranged from below detection to 225 g/kg. Chloride was below the detection limit in toilet paper and body lotions, but it was detected in every other product category.
The highest chloride concentration in products was observed in the categories of soaps, deodorant and toilet freshener with means of 89, 67 and 53 g/kg for each product category, respectively (Table 7).
In cleaning products, chloride was detected in 86% of fourteen brands of cleaning products and concentrations ranged from 0.07 to 43 g/kg product. The highest concentrations were for two brands of disinfectants at 43 g/kg and 393 g/kg product.
In personal care products, which includes products used in the shower and bathroom, chloride was present in every product, with the exception of a few brands of creams, sunscreens and lotions.
Among dishwashing products, the highest median concentration in a product type was observed in liquid detergent at 6 g/kg product compared to 1.4 mg/kg and 2.4 g/kg for dishwasher tablets and powders. However, when individual brands were considered, the highest concentration (46 g/kg) was for a laundry powder.
In laundry products, the concentration of chloride ranged from 0.05 to 27 g/kg product, with fabric softeners and liquid detergents containing the lowest concentrations in the group and median concentrations equivalent to 6% and 58% of the median concentration for powder concentrates and soakers (Table 7).

Sources of priority contaminants in domestic wastewater: nutrients and additional elements 24
The three largest weekly loads, 85, 34 and 16 g/pe/wk, from product use are expected to be generated from the use of laundry powder, toilet fresheners and bar soap (Figure 4). Loads derived from the remainder of products including the deodorants would release less than 2 g/pe/week into the sewer (Figure 4).
No trends were verified among the market leader, private and enviro label brands regarding the concentration of Cl.
Maximum Cl load (g/pe/wk)
0 1 2 3 4 5 20 40 60 80
Pro
duct
Cream cleanserDepilatory
MouthwashFloor cleaner
Hair colouringFacial lotionToothpaste
Multi-purposeRoll-on deodorant
Facial CleanserToilet cleaner
ConditionerDishwashing tabletAerosol deodorant
ShampooShaving foam
DisinfectantSunscreen
Laundry soakerDishwashing liquid
Dishwashing powderToilet freshener
Body washFabric softener
Hand washLaundry liquid
SoapIn-cistern
Laundry powder
Figure 4: Chloride loads estimated from product use
Table 7: Chloride concentration in household products
Concentration Cl (g/kg product)
Product type
Number of brands
with detectable
Cl
Minimum Maximum Median Average Leader Enviro Private
Body wash 4/4 0.015 29 6.9 10.7 - 29 -
Conditioner 3/3 0.4 1.8 0.5 0.9 0.4 - -
Cream cleanser 1/1 0.6
Depilatory product 1/1 8.9 - - -
Hand wash 5/5 2.7 21.8 6.7 9.5 2.7 - 21.8
Multi-purpose 1/2
5.6 -
Disinfectant 4/4 1.0 42.9 20.5 21.2 39.3 1.0

Sources of priority contaminants in domestic wastewater: nutrients and additional elements 25
Toilet cleaner 3/4 0.07 5.6 0.2 1.5 0.3 5.6 <0.5
Floor and surface 4/4 0.7 3.1 0.3 1.75 1.5 3.1 -
Toilet fresheners 5/7 5.5 166 6.8 52.7 6.8(TF) -
5.5(IC)
5.8(TF)
Shampoo 11/11 1.8 11.5
5.4
5.9
1.8 5.4 7.1
Soap bar 6/6 1.6 187 104 89.5 18.6 93 121
Face cleanser 1/2 <0.001 3.8 - - -
Shaving foam 5/5 0.2 16.8 4.4 7.9 0.2 - 4.4
Hair colouring 6/6 0.1 3.5 1.3 1.5 - - -
Mouth wash 5/5 0.02 0.19 0.08 0.08 0.02 0.19
Toothpaste 2/9 0.005 1.3 0.18 0.5 0.005 0.18 <0.03
Deodorant 8/9 0.09 210 52 67.4 126.2 - 210.5
Sunscreen 3/6 0.41 8.2 0.4 1.5 1.3 - <0.025
Facial cream/lotion 2/4 0.007 0.77 0.004 0.19 0.77 - <0.04
Dishwashing liquid 5/6 0.08 10.8 6.1 5.6 10.9 6.06 <0.02
Dishwasher tablet 3/4 1.2 3.9 1.4 1.7 <0.05 - 3.9
Dishwasher powder 5/5 0.2 46.6 2.3 12.9 2.7 0.18 46.6
Fabric softener 4/7 0.1 5.7 0.1 0.9 0.2 <0.2 0.1
Laundry powder 13/13 0.07 27.3 2.0 27.3 0.07 1.3 13.7
Laundry liquid 10/11 0.06 5.5 1.2 2.2 0.06 0.07 3.3
Soaker 2/2 2.0 2.3 2.1 2.1 2.0 - -
4.1.3. Cobalt
A summary of the Co concentration in household products and the corresponding weekly mass loads are shown in Table 8 and Figure 5.

Sources of priority contaminants in domestic wastewater: nutrients and additional elements 26
Cobalt was below detection in the majority of household products analysed. Cobalt was below detection in laundry powder, soaker and dishwasher detergents.
It was detected at low concentrations (in mg/kg product) in a few brands of cleaning products, shower and bathroom soap, dishwashing liquid and toilet paper (Table 8).
Personal care products used in the bathroom contained Co more often than any of the other product categories.
Cobalt was detected, in 67%, 73%, 80% and 100% of the brands of conditioners, shampoos, hand wash and body wash, respectively. Despite the high frequency of detection, the concentrations were low, ranging from 0.03 to 8 mg/kg product.
The resulting loads from individual products would have been less than 0.8 mg/pe/week as shown in Figure 5 and also in Table 29 in Appendix 2. The three largest product loads were 0.8, 0.56 and 0.49 mg/pe/week for a brand of in-cistern freshener, dishwashing and laundry liquid (Figure 5).
Table 8: Cobalt concentration in household products
Concentration Co (mg/kg product)
Product type Number of brands
with detectable
Cl
Minimum Maximum Median Average Leader Enviro Private
Toilet fresheners
1/7 3.9 <0.02 3.9
Multi-purpose 1/2 0.12 <0.04
Shampoo 8/11 0.03 1.4 0.26 0.51 0.26 0.43 <0.005
Conditioner 2/3 0.28 0.39 0.28 0.22 <0.005 - -
Hand wash 4/5 0.33 2.5 0.36 0.81 <0.08 - 2.5
Body wash 4/4 0.35 4.9 3.35 2.99 2.2
Sunscreen 1/7 0.20 <0.02 <0.01
Dishwashing liquid detergent
3/6 0.05 7.6 0.01 0.06 0.05 <0.005 1.4
Fabric softener
1/7 0.09 <0.01 0.09
Laundry liquid 2/11 0.10 1.8 0 0.17 <0.005 <0.01 1.8
Toilet paper 3/8 0.06 0.24 <0.005 0.24
<0.005
<0.005

Sources of priority contaminants in domestic wastewater: nutrients and additional elements 27
Maximum weekly Co load (mg/pe/wk)
0.0 0.2 0.4 0.6 0.8 1.0
Pro
duct
Multi-purpose
Toilet paper
Sunscreen
Facial Cleanser
Fabric softener
Shampoo
Body wash
Conditioner
Hand wash
Laundry liquid
Dishwashing liquid
In-cistern freshener
Figure 5: Cobalt loads estimated from product use
4.1.4. Chromium
A summary of the Cr concentration in household products and the estimated weekly mass loads are shown in Table 9 and Figure 6. Chromium was detected at concentrations ranging from 0.002 to 6.2 mg/kg in 64% of the products analysed. In shaving foam, soap bars, toilet cleaners and one brand of depilatory product, Cr was below the limit of detection. In other product categories, Cr was detected in individual brands, but not necessarily across all products within the category. Majority of the products contained less than 0.5 mg/kg product. But concentrations could vary markedly across brands. For instance, concentrations in toilet fresheners ranged from 0.26 to 174 mg/kg. The highest median concentrations were recorded in dishwashing powder, hair conditioners and laundry powder at 0.90, 0.88 and 0.57 mg/kg, respectively (Table 9). When considering the frequency of use, the highest weekly load among all the household products, 35.8 mg/pe/week, was estimated from the use of a brand of in-cistern toilet freshener as seen in Figure 6. The remainder of the products were estimated to generate less than 0.95 mg/pe/week (Table 30 in Appendix 2).
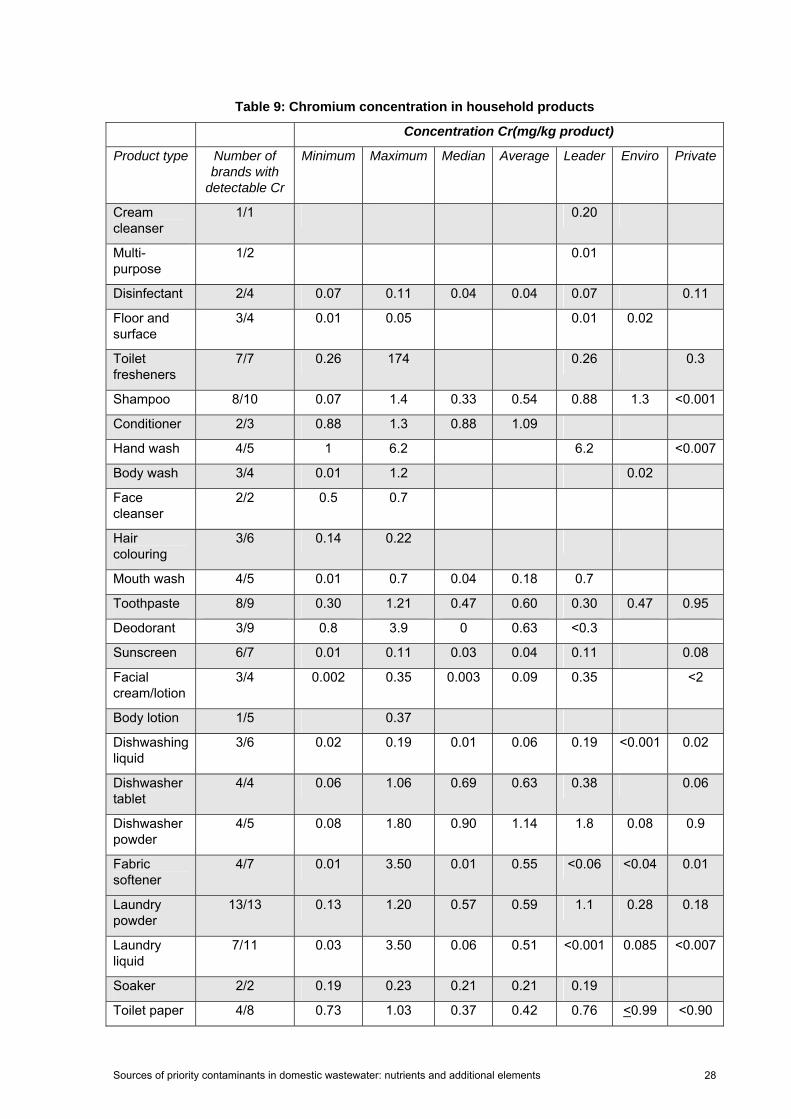
Sources of priority contaminants in domestic wastewater: nutrients and additional elements 28
Table 9: Chromium concentration in household products
Concentration Cr(mg/kg product)
Product type Number of brands with
detectable Cr
Minimum Maximum Median Average Leader Enviro Private
Cream cleanser
1/1 0.20
Multi-purpose
1/2 0.01
Disinfectant 2/4 0.07 0.11 0.04 0.04 0.07 0.11
Floor and surface
3/4 0.01 0.05 0.01 0.02
Toilet fresheners
7/7 0.26 174 0.26 0.3
Shampoo 8/10 0.07 1.4 0.33 0.54 0.88 1.3 <0.001
Conditioner 2/3 0.88 1.3 0.88 1.09
Hand wash 4/5 1 6.2 6.2 <0.007
Body wash 3/4 0.01 1.2 0.02
Face cleanser
2/2 0.5 0.7
Hair colouring
3/6 0.14 0.22
Mouth wash 4/5 0.01 0.7 0.04 0.18 0.7
Toothpaste 8/9 0.30 1.21 0.47 0.60 0.30 0.47 0.95
Deodorant 3/9 0.8 3.9 0 0.63 <0.3
Sunscreen 6/7 0.01 0.11 0.03 0.04 0.11 0.08
Facial cream/lotion
3/4 0.002 0.35 0.003 0.09 0.35 <2
Body lotion 1/5 0.37
Dishwashing liquid
3/6 0.02 0.19 0.01 0.06 0.19 <0.001 0.02
Dishwasher tablet
4/4 0.06 1.06 0.69 0.63 0.38 0.06
Dishwasher powder
4/5 0.08 1.80 0.90 1.14 1.8 0.08 0.9
Fabric softener
4/7 0.01 3.50 0.01 0.55 <0.06 <0.04 0.01
Laundry powder
13/13 0.13 1.20 0.57 0.59 1.1 0.28 0.18
Laundry liquid
7/11 0.03 3.50 0.06 0.51 <0.001 0.085 <0.007
Soaker 2/2 0.19 0.23 0.21 0.21 0.19
Toilet paper 4/8 0.73 1.03 0.37 0.42 0.76 <0.99 <0.90

Sources of priority contaminants in domestic wastewater: nutrients and additional elements 29
Maximum Cr load (mg/pe/wk)
0.0 0.2 0.4 0.6 0.8 1.0 35.0 36.0 37.0 38.0
Prod
uct
Multi-purposeFloor cleanerToilet cleaner
DisinfectantRoll-on deodorant
Hair colouringAerosol deodorant
SunscreenToilet paper
ShampooFacial Cleanser
Dishwashing liquidCream cleanser
Facial lotionBody lotionBody wash
Laundry soakerHand washToothpasteConditioner
Dishwashing tabletMouthwash
Dishwashing powderToilet freshenerLaundry powderFabric softenerLaundry liquid
In-cistern
Figure 6: Chromium loads estimated from product use
4.1.5. Fluoride Fluoride was detected in 22.7% of the household products analysed. The range of concentrations recorded and the estimated weekly loads are shown in Table 10 and Figure 6.
Fluoride in toothpaste and in some of the mouthwash formulations was detected at concentrations up to 1,098 mg/kg. In such products, fluoride originated from ingredients added to combat dental decay, such as sodium fluoride or sodium monofluorophosphate.
Fluoride was also detected in products used in the dishwasher and in the laundry and in hair colouring agents.
In laundry soakers and detergent powders fluoride concentrations ranged from 0.5 to 15 mg/kg. In laundry powder formulations the median and mean concentrations were 8 mg/kg and 6.5 mg/kg, whilst soakers had a mean of 0.8mg/kg (only two brands analysed).
For dishwasher tablets and powders median concentrations of 14.6 mg/kg and 11 mg/kg were recorded. The market leader tablet brand had 41 mg/kg. As mentioned in section 2.5,

Sources of priority contaminants in domestic wastewater: nutrients and additional elements 30
mineral phosphate can sometimes contain fluoride as a trace contaminant and F could also be introduced during the manufacture process through use of fluoridated water.
Five of the six hair colouring agents analysed contained fluoride, with concentrations ranging between 2.5 to 26.5 mg/kg and a median of 7.9 mg/kg.
The only other products with traces of F included one brand of floor cleaner that contained 5.5 mg/kg and one brand of toilet freshener that contained 39 mg/kg in its formulation.
The largest loads from product use would be expected to be generated through the consumption of toothpaste and mouthwash, resulting in a maximum combined load (toothpaste and mouthwash) of approximately 114 mg/pe/wk as shown in Figure 6. The other products generated weekly loads that were equivalent to less than 10% of that produced by oral products. For example, loads of 8 mg/pe/wk, 3.5 mg/pe/wk and between 1.5 to 1.7 mg/pe/wk would be generated from use of toilet freshener, laundry powder and the dishwasher detergents with the highest F concentrations (Table 31 in Appendix 2).
Table 10: Fluoride concentration in household products
Concentration F (mg/kg product)
Product type
Number of brands with
detectable Cl
Minimum Maximum Median Average Leader Enviro Private
Floor and surface
1/4 5.5
Toilet fresheners
1/7 39
Hair colouring
5/6 2.5 27 8 10
Mouth wash
3/5 0.8 287 0.8 101 <1 0.81
Toothpaste 8/9 0.3 1,098 180 415 1,098 <4.5 202
Dishwasher tablet
3/4 0.7 41 15 18 41 28
Dishwasher powder
4/4 0.5 17 11 9.8 5.6 0.5 17
Laundry powder
7/13 8.0 15 8.0 6.5 15 8 <87
Soaker 2/2 0.5 1.1 0.8 0.8 1.1

Sources of priority contaminants in domestic wastewater: nutrients and additional elements 31
Maximum F load (mg/pe/wk)
0 20 40 60 80
Pro
duct
Floor cleaner
Laundry soaker
Hair colouring
Dishwashing tablet
Dishwashing powder
Laundry powder
Toilet freshener
Toothpaste
Mouthwash
Figure 7: Fluoride loads estimated from product use
4.1.6. Molybdenum
The concentrations and maximum weekly mass loads from household products are shown in Table 10 and Figure 8. Molybdenum was detected in 29% of the products analysed. Mass loads of less than 0.33 mg/pe/week would have been generated from the use of such products as seen in Figure 8.
Molybdenum was detected in:
(a) 86% of toilet fresheners;
(b) 62.5% of toilet paper brands, including the two brands of recycled toilet paper;
(c) 62% of laundry powder concentrates;
(d) 50% of dishwasher products;
(e) 45% of shampoo and deodorant brands; and
(f) In individual brands of soaker, laundry liquid, fabric softener, conditioner, hand and body wash, toothpaste, sunscreen.
Loads from 0.001 to 0.34 mg/pe/wk were estimated from the use of individual products (Table 32 in Appendix 2). The three largest loads combined would release 0.74 mg/pe/wk into sewage, and would be caused by laundry powder concentrates and toilet fresheners (Figure 8). No trends were verified among market leader, private and enviro brands regarding Mo concentrations (Table 11).

Sources of priority contaminants in domestic wastewater: nutrients and additional elements 32
Table 11: Molybdenum concentration in household products
Concentration Mo (mg/kg product)
Product type Number of brands with detectable
Minimum Maximum Median Average Leader Enviro Private
Toilet cleaner
2/4 0.05 4 0.25 1.01 <0.01 0.05 4
Toilet fresheners
6/7 0.06 1 0.11 0.38 <0.03 0.09mg/L
Conditioner 1/3 0.05 0.05
Hand wash 1/5 0.02 <0.08 <0.02
Body wash 1/4 0.02 <0.01
Toothpaste 2/9 0.12 0.62 0 0.02 <0.15 <0.45 0.12
Deodorant 4/9 0.51 1.62 0 0.14 <2.7 <3.09
Sunscreen 2/7 0.03 0.13 0 0.02 0.13 <0.02
Shampoo 5/11 0.02 0.4 0.05 0.10 0.06 0.02 0.05
Dishwashing liquid detergent
2/6 0.08 0.21 0 0.05 <0.002 <0.03 0.21
Dishwasher tablet
2/4 0.16 0.47 0.08 0.16 <0.94 0.47
Dishwasher powder
2/4 0.16 0.2 0.08 0.09 0.16 <0.002 0.2
Fabric softener
1/7 0.05 <0.06 <0.04 <0.03
Laundry powder
8/13 0.54 1.35 0.56 0.52 0.54 <0.002 <0.001
Laundry liquid
1/11 0.05 <0.03 <0.002 <0.001
Soaker 1/2 0.06 <0.08
Toilet paper 5/8 0.02 0.29 0.03 0.05 0.05 0.04
0.29
0.04

Sources of priority contaminants in domestic wastewater: nutrients and additional elements 33
Maximum Mo load (mg/pe/wk)
0.0 0.1 0.2 0.3 0.4
Pro
duct
Aerosol deodorantHand wash
Toilet paperRoll-on deodorant
ConditionerToothpasteBody washSunscreenShampoo
Fabric softenerLaundry liquid
Dishwashing liquidLaundry soaker
Dishwashing tabletDishwashing powder
Toilet cleanerToilet freshener
In-cistern freshenerLaundry powder
Figure 8: Molybdenum loads estimated from product use
4.1.7. Selenium
The concentrations and maximum mass loads for Se are summarised in Table 12 and Figure 9. Only 18% of the products analysed contained Se within the limit of detection. Se was detected in 30 of the 156 products analysed within the range of 0.01 to 4.6 mg/kg.
The highest concentration, 4.6 mg/kg, was in an anti-dandruff shampoo. Selenium compounds are used in some anti-dandruff shampoo formulations.
Se was detected in specific brands of cream cleanser, multi-purpose, floor and surface cleaners, soaps, oral care products, deodorant, dishwasher powder and laundry detergents. Concentrations were typically less than 1 mg/kg and the corresponding loads were less than 0.04 mg/pe/wk for each of those products.
The three largest weekly loads were attributed to laundry liquids, anti-dandruff shampoos and laundry powders and were respectively 0.15, 0.12 and 0.09 mg/pe/wk (Figure 9 and Table 33 in Appendix 2).
No correlations were verified among market leader, private and enviro brands regarding Se concentrations.
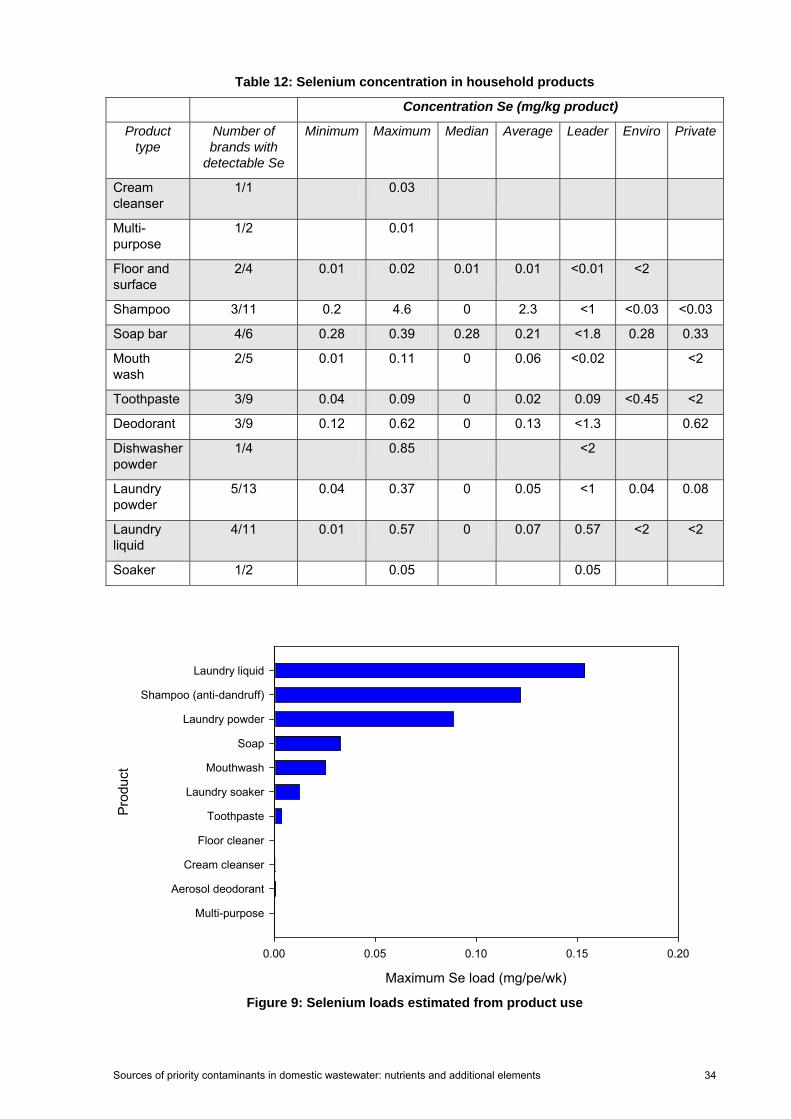
Sources of priority contaminants in domestic wastewater: nutrients and additional elements 34
Table 12: Selenium concentration in household products
Concentration Se (mg/kg product)
Product type
Number of brands with
detectable Se
Minimum Maximum Median Average Leader Enviro Private
Cream cleanser
1/1 0.03
Multi-purpose
1/2 0.01
Floor and surface
2/4 0.01 0.02 0.01 0.01 <0.01 <2
Shampoo 3/11 0.2 4.6 0 2.3 <1 <0.03 <0.03
Soap bar 4/6 0.28 0.39 0.28 0.21 <1.8 0.28 0.33
Mouth wash
2/5 0.01 0.11 0 0.06 <0.02 <2
Toothpaste 3/9 0.04 0.09 0 0.02 0.09 <0.45 <2
Deodorant 3/9 0.12 0.62 0 0.13 <1.3 0.62
Dishwasher powder
1/4 0.85 <2
Laundry powder
5/13 0.04 0.37 0 0.05 <1 0.04 0.08
Laundry liquid
4/11 0.01 0.57 0 0.07 0.57 <2 <2
Soaker 1/2 0.05 0.05
Maximum Se load (mg/pe/wk)
0.00 0.05 0.10 0.15 0.20
Prod
uct
Multi-purpose
Aerosol deodorant
Cream cleanser
Floor cleaner
Toothpaste
Laundry soaker
Mouthwash
Soap
Laundry powder
Shampoo (anti-dandruff)
Laundry liquid
Figure 9: Selenium loads estimated from product use
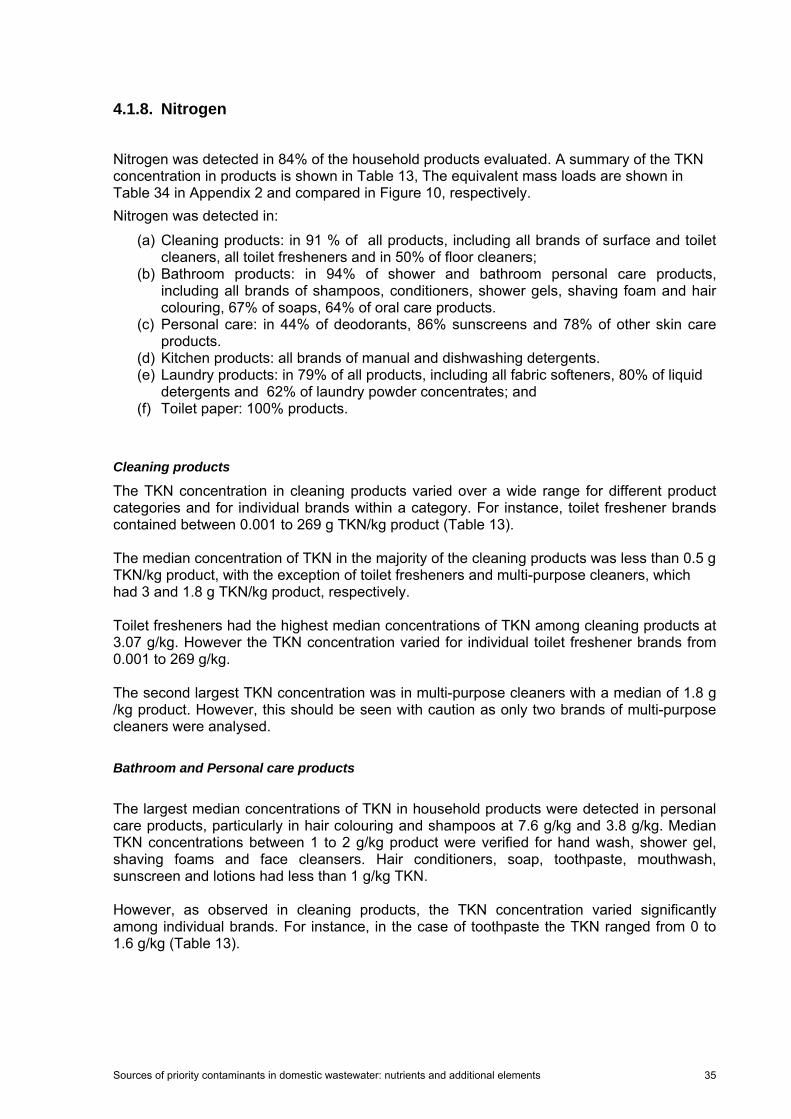
Sources of priority contaminants in domestic wastewater: nutrients and additional elements 35
4.1.8. Nitrogen
Nitrogen was detected in 84% of the household products evaluated. A summary of the TKN concentration in products is shown in Table 13, The equivalent mass loads are shown in Table 34 in Appendix 2 and compared in Figure 10, respectively. Nitrogen was detected in:
(a) Cleaning products: in 91 % of all products, including all brands of surface and toilet cleaners, all toilet fresheners and in 50% of floor cleaners;
(b) Bathroom products: in 94% of shower and bathroom personal care products, including all brands of shampoos, conditioners, shower gels, shaving foam and hair colouring, 67% of soaps, 64% of oral care products.
(c) Personal care: in 44% of deodorants, 86% sunscreens and 78% of other skin care products.
(d) Kitchen products: all brands of manual and dishwashing detergents. (e) Laundry products: in 79% of all products, including all fabric softeners, 80% of liquid
detergents and 62% of laundry powder concentrates; and (f) Toilet paper: 100% products.
Cleaning products
The TKN concentration in cleaning products varied over a wide range for different product categories and for individual brands within a category. For instance, toilet freshener brands contained between 0.001 to 269 g TKN/kg product (Table 13). The median concentration of TKN in the majority of the cleaning products was less than 0.5 g TKN/kg product, with the exception of toilet fresheners and multi-purpose cleaners, which had 3 and 1.8 g TKN/kg product, respectively. Toilet fresheners had the highest median concentrations of TKN among cleaning products at 3.07 g/kg. However the TKN concentration varied for individual toilet freshener brands from 0.001 to 269 g/kg. The second largest TKN concentration was in multi-purpose cleaners with a median of 1.8 g /kg product. However, this should be seen with caution as only two brands of multi-purpose cleaners were analysed.
Bathroom and Personal care products
The largest median concentrations of TKN in household products were detected in personal care products, particularly in hair colouring and shampoos at 7.6 g/kg and 3.8 g/kg. Median TKN concentrations between 1 to 2 g/kg product were verified for hand wash, shower gel, shaving foams and face cleansers. Hair conditioners, soap, toothpaste, mouthwash, sunscreen and lotions had less than 1 g/kg TKN. However, as observed in cleaning products, the TKN concentration varied significantly among individual brands. For instance, in the case of toothpaste the TKN ranged from 0 to 1.6 g/kg (Table 13).
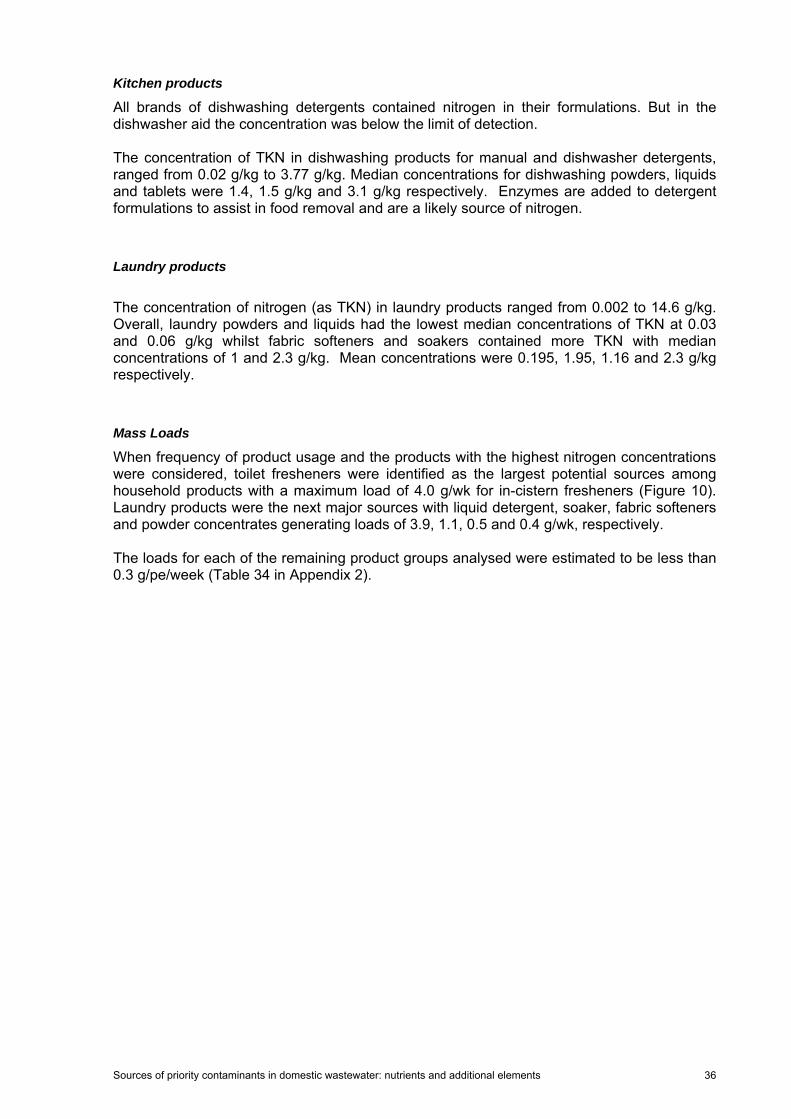
Sources of priority contaminants in domestic wastewater: nutrients and additional elements 36
Kitchen products
All brands of dishwashing detergents contained nitrogen in their formulations. But in the dishwasher aid the concentration was below the limit of detection. The concentration of TKN in dishwashing products for manual and dishwasher detergents, ranged from 0.02 g/kg to 3.77 g/kg. Median concentrations for dishwashing powders, liquids and tablets were 1.4, 1.5 g/kg and 3.1 g/kg respectively. Enzymes are added to detergent formulations to assist in food removal and are a likely source of nitrogen.
Laundry products
The concentration of nitrogen (as TKN) in laundry products ranged from 0.002 to 14.6 g/kg. Overall, laundry powders and liquids had the lowest median concentrations of TKN at 0.03 and 0.06 g/kg whilst fabric softeners and soakers contained more TKN with median concentrations of 1 and 2.3 g/kg. Mean concentrations were 0.195, 1.95, 1.16 and 2.3 g/kg respectively.
Mass Loads
When frequency of product usage and the products with the highest nitrogen concentrations were considered, toilet fresheners were identified as the largest potential sources among household products with a maximum load of 4.0 g/wk for in-cistern fresheners (Figure 10). Laundry products were the next major sources with liquid detergent, soaker, fabric softeners and powder concentrates generating loads of 3.9, 1.1, 0.5 and 0.4 g/wk, respectively. The loads for each of the remaining product groups analysed were estimated to be less than 0.3 g/pe/week (Table 34 in Appendix 2).

Sources of priority contaminants in domestic wastewater: nutrients and additional elements 37
Table 13: Total nitrogen concentration in household products
Concentration TKN (g/kg product)
Product type Number of brands
with detectable
TKN
Minimum Maximum Median Average Leader Enviro Private
Cream cleanser
1/1 0.08
Multi-purpose
2/2 0.4 3.1 1.8 1.8 3.2
Disinfectant 4/4 0.25 0.7 0.34 0.4 0.25 0.4
Toilet cleaner
4/4 0.15 0.86 0.13 3.03 0.1
Floor and surface
2/3 0.10 1.97 0.10 0.69 <0.04 1.97
Toilet fresheners
7/7 0.001 268.8 3.07 45.76 0.32 3.1(TF)
268.8(IC)
Depilatory product
1/1 38.2
Shampoo 11/11 1.0 9.0 3.8 3.8 7.4 3.8 4.9
Conditioner 3/3 0.3 1.3 0.5 0.7 1.3
Soap bar 4/6 0.03 0.10 0.04 0.04 <0.0001 0.1 0.05
Hand wash 5/5 0.7 3.1 1.8 0.02 3.1 1.7
Body wash 4/4 1.7 3.4 2.2 2.4 3.4
Face cleanser
1/2 1.8
Shaving foam
5/5 0.09 9.0 2.1 3.0 4.2 2.0
Hair colouring
6/6 1.4 11.5 7.6 8.0
Mouth wash 2/5 0.03 0.05 0 0.016 <0.025 <0.01
Toothpaste 7/9 0.16 1.6 0.36 0.5 <0.09 0.6 0.16
Deodorant 4/9 0.08 3.8 0 0.9 <0.003 0.08
Sunscreen 6/7 0.02 1.0 0.2 0.4 0.6 0.9
Facial cream/lotion
3/4 0.4 3.7 1.4 1.6 2.4 <0.0001
Body lotion 4/5 0.08 0.98 0.12 0.28 0.08 0.22
Dishwashing liquid detergent
6/6 0.27 3.7 0.84 1.47 0.27 3.70 0.84
Dishwasher tablet
4/4 0.02 3.77 3.09 2.40 3.77 3.22
Dishwasher powder
4/4 0.03 3.69 0.94 1.40 0.95 3.69 0.03

Sources of priority contaminants in domestic wastewater: nutrients and additional elements 38
Fabric softener
7/7 0.47 2.35 1.03 1.16 2.35 1.30 0.47
Laundry powder
8/13 0.002 1.83 0.03 0.20 0.002 0.03 <0.03
Laundry liquid
9/11 0.01 14.57 0.06 1.95 0.09 2.78 14.57
Soaker 2/2 0.27 4.26 2.27 2.27 4.26
Toilet paper 8/8 0.16 0.61 0.36 0.37 0.25 0.34/0.38 0.20
Maximum TKN load (mg/pe/wk)
0 1000 2000 3000 4000 5000
Pro
duct
Aerosol deodorantCream cleanser
Toilet paperRoll-on deodorant
DisinfectantSoap
MouthwashHair colouringFloor cleanerMulti-purpose
Facial CleanserToilet cleaner
ToothpasteBody lotionSunscreen
ConditionerShaving foam
DepilatoryBody wash
Facial lotionDishwashing powder
Dishwashing tabletShampoo
Dishwashing liquidHand wash
Laundry powderFabric softenerToilet freshenerLaundry soaker
Laundry liquidIn-cistern
Figure 10: Total Kjeldahl nitrogen loads estimated from product use
4.1.9. Phosphorus
Phosphorus (as total phosphorus, TP) was detected in 97% of the household products evaluated, and is thus the most common element in this group of household products.
Phosphorus was detected in:
(a) All cleaning products, including all brands of surface and toilet cleaners, all toilet fresheners and floor cleaners;
(b) Bathroom products: 97% of shower and bathroom personal care products, including all brands of shampoos, conditioners, shower gels, shaving foam, soaps, hair colouring, oral care products and 75% of other personal care products,
(c) Personal care: 89% of deodorants, 71% sunscreens and all brands of other skin care products.

Sources of priority contaminants in domestic wastewater: nutrients and additional elements 39
(d) Kitchen products: all brands of manual and dishwashing detergents. (e) Laundry products: all products, including fabric softeners, liquid detergents and
laundry powder concentrates. A summary of the TP concentrations and the equivalent mass loads are shown in Table 14 and Figure 20, respectively. The highest median concentrations of TP in household products were detected in dishwasher products, laundry powders, toothpaste and toilet paper (Table 14). Most “enviro label” products had lower TP concentrations than the market leader brands (Table 14).
Cleaning products
TP in individual brands of cleaning products ranged from less than 0.001 g/kg to 7.4 g/kg product (Table 14). However, the overall concentration of TP in the cleaning product category was low, with mean and median concentrations of less than 1.9 g/kg and 0.3 g/kg product. Median concentrations for disinfectants, toilet cleaners, floor and surface and toilet fresheners were respectively 0.036 g/kg, 0.013 g/kg, 0.010 mg/kg and 0.291 mg/kg. The product categories with the largest spread in concentrations were floor and surface cleaners (range 0.4 to 7,428 mg/kg) and toilet fresheners (range 5 to 3,084 mg/kg). A load of less than 0.11 g/pe/wk was estimated for individual product categories within this group based on the typical product usage by a single person household (Table 35 in Appendix 2). The largest mass loads from product use were attributed to floor cleaners, toilet fresheners and disinfectants at 0.11, 0.06 and 0.013 g/pe/wk, respectively. Mass loads of TP from all other products would be less than 0.001 g/pe/wk (Figure 20).
Bathroom and Personal care products
Concentrations of TP in personal care products range from nil to 78.5 g/kg product, with the highest concentrations detected in toothpaste (Table 14). Toothpaste has the highest median concentration in this group, at 10.3 g/kg product. It was also the 4th highest in TP content among all products analysed. Soaps, deodorants and shampoo had median TP concentrations of 0.90, 0.45 and 0.15 g/kg product. The remaining products in this category contained less than 0.1 g/kg product. TP concentrations varied markedly for individual brands within each product category, particularly for shampoos, conditioners, soaps, hand wash, toothpaste, deodorant and sunscreen. For example, hand wash had minimum and maximum concentrations of 0.004 g/kg and 75 g/kg.
Kitchen products
All dishwashing detergents contained phosphorus in their formulations. The concentration range varied with the product category and with individual brands.
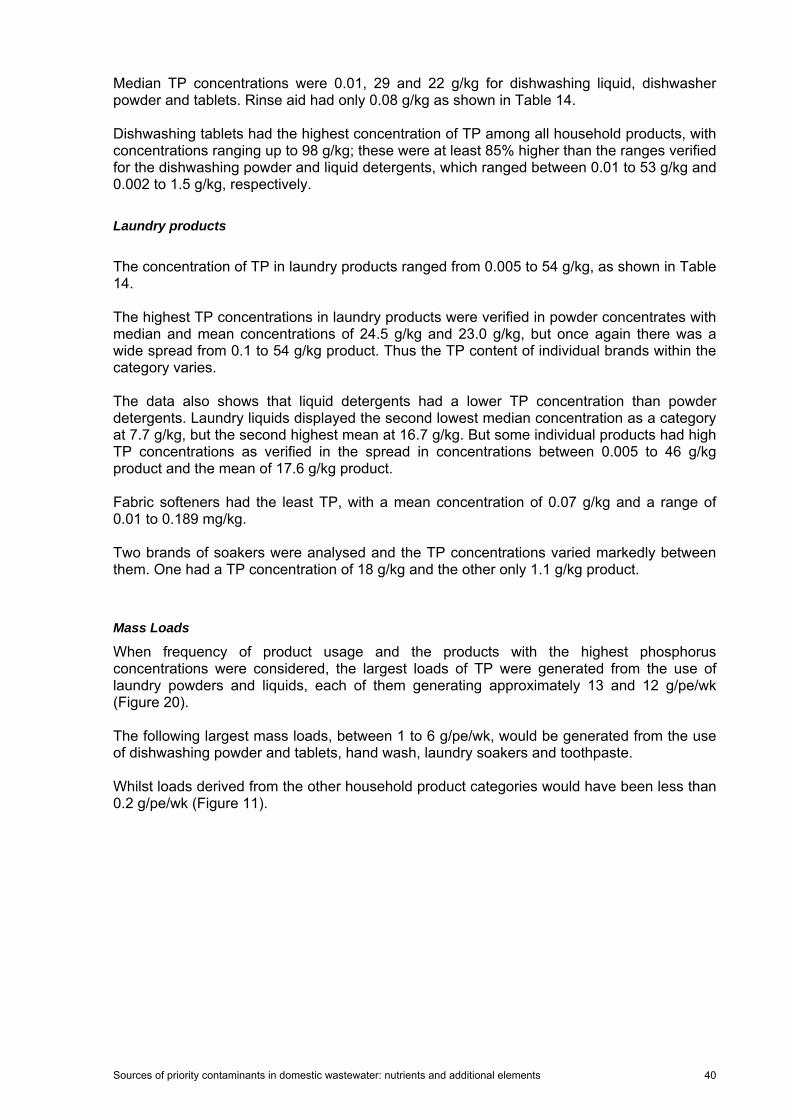
Sources of priority contaminants in domestic wastewater: nutrients and additional elements 40
Median TP concentrations were 0.01, 29 and 22 g/kg for dishwashing liquid, dishwasher powder and tablets. Rinse aid had only 0.08 g/kg as shown in Table 14. Dishwashing tablets had the highest concentration of TP among all household products, with concentrations ranging up to 98 g/kg; these were at least 85% higher than the ranges verified for the dishwashing powder and liquid detergents, which ranged between 0.01 to 53 g/kg and 0.002 to 1.5 g/kg, respectively.
Laundry products
The concentration of TP in laundry products ranged from 0.005 to 54 g/kg, as shown in Table 14. The highest TP concentrations in laundry products were verified in powder concentrates with median and mean concentrations of 24.5 g/kg and 23.0 g/kg, but once again there was a wide spread from 0.1 to 54 g/kg product. Thus the TP content of individual brands within the category varies. The data also shows that liquid detergents had a lower TP concentration than powder detergents. Laundry liquids displayed the second lowest median concentration as a category at 7.7 g/kg, but the second highest mean at 16.7 g/kg. But some individual products had high TP concentrations as verified in the spread in concentrations between 0.005 to 46 g/kg product and the mean of 17.6 g/kg product. Fabric softeners had the least TP, with a mean concentration of 0.07 g/kg and a range of 0.01 to 0.189 mg/kg. Two brands of soakers were analysed and the TP concentrations varied markedly between them. One had a TP concentration of 18 g/kg and the other only 1.1 g/kg product.
Mass Loads
When frequency of product usage and the products with the highest phosphorus concentrations were considered, the largest loads of TP were generated from the use of laundry powders and liquids, each of them generating approximately 13 and 12 g/pe/wk (Figure 20). The following largest mass loads, between 1 to 6 g/pe/wk, would be generated from the use of dishwashing powder and tablets, hand wash, laundry soakers and toothpaste. Whilst loads derived from the other household product categories would have been less than 0.2 g/pe/wk (Figure 11).

Sources of priority contaminants in domestic wastewater: nutrients and additional elements 41
Table 14: Total phosphorus concentration in household products
Concentration TP (g/kg product)
Product type Number of brands
with detectable
Cl
Minimum Maximum Median Average Leader Enviro Private
Cream cleanser
1/1 0.10
Multi-purpose
1/2 0.004 0.08
Disinfectant 4/4 0.01 1.30 0.04 0.35 0.03 0.013
Toilet cleaner
4/4 0.0007 0.03 0.01 0.015 0.001 0.03 0.009
Floor and surface
4/4 0.0004 7.43 0.01 1.86 7.43 0.006
Toilet fresheners
7/7 0.005 3.08 0.29 1.17 0.19 0.005(F)
3.08(I)
Shampoo 11/11 0.001 1.73 0.15 0.45 0.01 0.198 0.001
Conditioner 3/3 0.006 1.93 0.019 0.65 0.006
Soap bar 5/6 0.4 2.5 0.9 1.2 0.8 <0.001 1.0
Hand wash 5/5 0.004 75.0 0.06 15.0 75.0 0.1
Body wash 4/4 0.0001 0.040 0.006 0.013 0.002
Face cleanser
1/2 0.12
Shaving foam
5/5 0.006 0.08 0.02 0.03 0.006 0.022
Hair colouring
6/6 0.04 1.02 0.09 0.37
Mouth wash 5/5 0.0 0.02 0.0001 0.005 0.003 0.0001
Toothpaste 9/9 0 78.5 10.3 19.6 78.5 0.05 0.86
Deodorant 8/9 3 1.1 0.35 0.45 0.08 0.59
Sunscreen 5/7 0.001 0.90 0.002 0.18 0.002 <0.0001
Facial cream/lotion
4/4 0.05 0.38 0.07 0.15 0.38 0.18
Body lotion 5/5 0.007 0.14 0.07 0.07 0.02 0.08
Dishwashing liquid detergent
6/6 0.002 1.45 0.01 0.25 0.002 0.02 1.45
Dishwasher tablet
4/4 0.0005 97.7 21.8 43.1 0.0005 95.7(brand 1)
97.7(brand 2)

Sources of priority contaminants in domestic wastewater: nutrients and additional elements 42
Dishwasher powder
6/4 0.01 53.4 28.8 27.8 53.4 0.01 8.3
Fabric softener
7/7 0.01 0.19 0.04 0.07 0.05 0.02 0.01
Laundry powder
13/13 0.1 54.5 24.6 23.0 2.1 0.1 1.0
Laundry liquid
11/11 0.004 46.2 7.7 16.7 0.13 0.15 0.01
Soaker 2/2 1.1 18.2 9.6 9.6 1.1
Toilet paper 8/8 0.001 0.03 0.01 0.01 0.02 0.001
(brand a)
0.017
(brand b)
0.03
Maximum TP load (g/pe/wk)
0.00 0.05 0.10 0.15 0.20 0.25 2.50 5.00 7.50 10.00 12.50
Pro
duct
Depilatory & Facial CleanserShaving foam
Toilet paperToilet cleanerMulti-purpose
Cream cleanserDeodorantBody wash
Facial lotionDisinfectant
Hair colouringMouthwash
Fabric softenerShampooIn-cistern
Toilet freshenerSunscreen
ConditionerDishwashing liquid
Floor cleanerSoap
ToothpasteDishwashing tablet
Laundry soakerDishwashing powder
Hand washLaundry liquid
Laundry powder
Figure 11: Phosphorus loads estimated from product use

Sources of priority contaminants in domestic wastewater: nutrients and additional elements 43
5. ELEMENTAL LOADS IN HOUSEHOLD STREAMS
5.1. Methodology The contribution of products to the contaminants in wastewater was examined by estimating the typical loads that would be discharged from various household outlets (bathroom, toilet, laundry and kitchen) in a one person household.
The wastewater mass loads for each outlet represent the load derived from combining all products that would typically be adopted by a householder at each location. The assumed product dosages and the frequency of product use were shown in Table 5. The estimates do not consider the contribution from tap water or human waste.
Thus it was assumed that (i) the bathroom discharged greywater from the shower and vanity unit, (ii) the toilet wastewater discharge contains toilet paper and toilet fresheners, but excludes urine and faecal matter, (iii) the kitchen wastewater contains either greywater from the kitchen sink or dishwasher, and that the laundry discharged greywater from the washing machine.
Variation in stream composition due to interchange of products was also considered. For instance, streams were calculated for either liquid hand wash or soap; laundry liquid or powder; toilet bowl freshener or in-cistern freshener; aerosol or roll-on deodorant and dishwashing powder, tablet or liquid.
The streams’ were comprised of:
• Bathroom 1: soap, shampoo, conditioner, sunscreen, lotion, cleanser, shaving foam, toothpaste, mouthwash and aerosol deodorant;
• Bathroom 2: hand wash, body wash, shampoo, conditioner, sunscreen, lotion, cleanser, shaving foam, toothpaste, mouthwash and roll-on deodorant;
• Kitchen 1: liquid dishwashing detergent;
• Kitchen 2: dishwasher tablet and rinse aid;
• Kitchen 3: dishwasher powder and rinse aid;
• Laundry 1: powder detergent concentrate and fabric softener;
• Laundry 2: liquid detergent concentrate and fabric softener;
• Toilet 1: toilet paper and toilet bowl freshener
• Toilet 2: toilet paper and in-cistern freshener.
Loads derived from other cleaning products were not included in the evaluation because of their low frequency of use compared to the other products.
The individual stream loads were estimated under three scenarios. These assumed that a one person household adopted:
(a) Maximum: Product brands with the highest concentration of each element, thus providing a conservative or worst case scenario load;
(b) Median: The median concentration for each product category for comparison, to reflect the typical outcome from that category;
(c) Enviro: “Environmental label” products, or if not available, the brand with the lowest element concentration.
These loads were compared to those derived from anthropogenic waste (faeces and urine) reported in the literature.
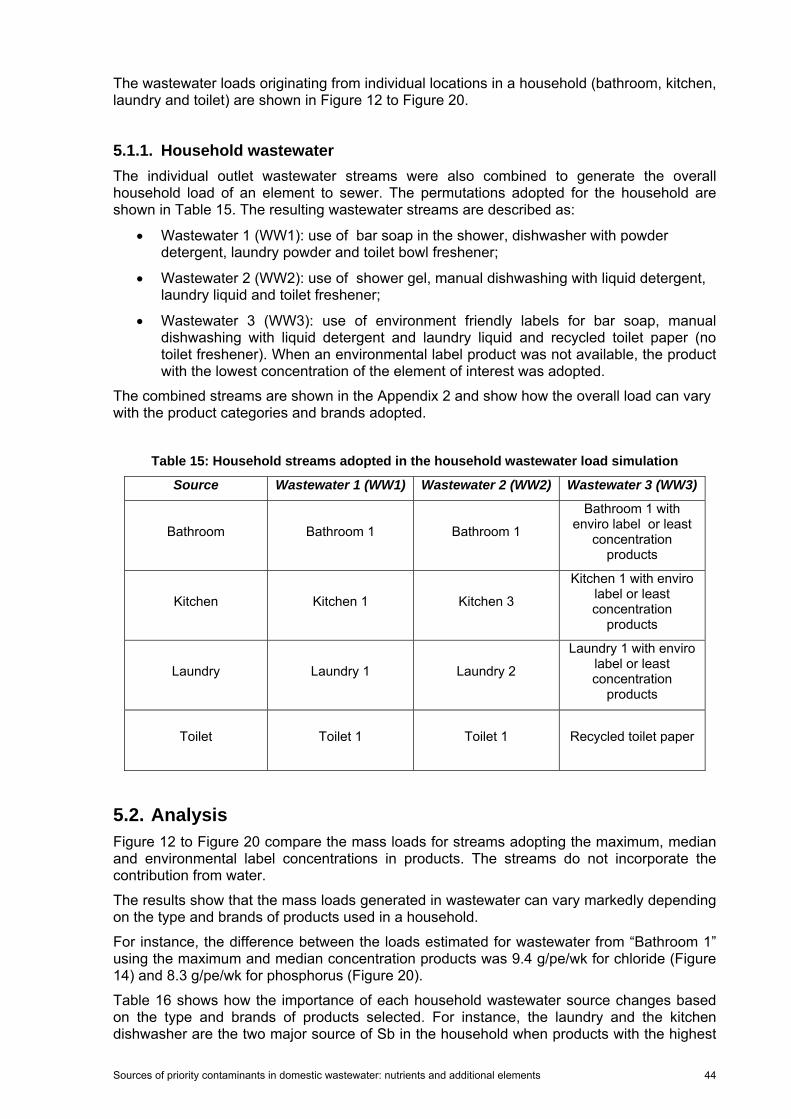
Sources of priority contaminants in domestic wastewater: nutrients and additional elements 44
The wastewater loads originating from individual locations in a household (bathroom, kitchen, laundry and toilet) are shown in Figure 12 to Figure 20.
5.1.1. Household wastewater The individual outlet wastewater streams were also combined to generate the overall household load of an element to sewer. The permutations adopted for the household are shown in Table 15. The resulting wastewater streams are described as:
• Wastewater 1 (WW1): use of bar soap in the shower, dishwasher with powder detergent, laundry powder and toilet bowl freshener;
• Wastewater 2 (WW2): use of shower gel, manual dishwashing with liquid detergent, laundry liquid and toilet freshener;
• Wastewater 3 (WW3): use of environment friendly labels for bar soap, manual dishwashing with liquid detergent and laundry liquid and recycled toilet paper (no toilet freshener). When an environmental label product was not available, the product with the lowest concentration of the element of interest was adopted.
The combined streams are shown in the Appendix 2 and show how the overall load can vary with the product categories and brands adopted.
Table 15: Household streams adopted in the household wastewater load simulation
Source Wastewater 1 (WW1) Wastewater 2 (WW2) Wastewater 3 (WW3)
Bathroom Bathroom 1 Bathroom 1
Bathroom 1 with enviro label or least
concentration products
Kitchen Kitchen 1 Kitchen 3
Kitchen 1 with enviro label or least concentration
products
Laundry Laundry 1 Laundry 2
Laundry 1 with enviro label or least concentration
products
Toilet Toilet 1 Toilet 1 Recycled toilet paper
5.2. Analysis Figure 12 to Figure 20 compare the mass loads for streams adopting the maximum, median and environmental label concentrations in products. The streams do not incorporate the contribution from water.
The results show that the mass loads generated in wastewater can vary markedly depending on the type and brands of products used in a household.
For instance, the difference between the loads estimated for wastewater from “Bathroom 1” using the maximum and median concentration products was 9.4 g/pe/wk for chloride (Figure 14) and 8.3 g/pe/wk for phosphorus (Figure 20).
Table 16 shows how the importance of each household wastewater source changes based on the type and brands of products selected. For instance, the laundry and the kitchen dishwasher are the two major source of Sb in the household when products with the highest

Sources of priority contaminants in domestic wastewater: nutrients and additional elements 45
Sb concentrations are used, but when products of median Sb concentration are used, loads from products are much smaller and human excreta becomes the predominant source of Sb.
Each individual element in discussed in detail in the following sections.
Table 16: Major sources of contaminants in a household
Element Element concentration in products
Major sources
Maximum Laundry> Kitchen (powder) > Human > Bathroom> Toilet
Median Human> Bathroom=Toilet> Laundry(powder)> Dishwasher
Antimony
Enviro Human
Maximum Laundry (powder)> Toilet (in-cistern freshener)> Human> Bathroom > Laundry (liquid) >Kitchen (powder>manual>tablet)
Chloride
Median and Enviro
Human> Bathroom > Laundry (powder)> Kitchen(liquid)> Laundry(liquid) > Toilet
Maximum Toilet (In-cistern freshener) > Laundry > Bathroom > Toilet (freshener) > Kitchen > Human
Median Bathroom> Laundry(powder)> Kitchen (powder)>Toilet> Kitchen (tablet) > Laundry (liquid)> Human> kitchen(liquid)
Chromium
Enviro Toilet> Laundry>bathroom> Human> kitchen(liquid)
Maximum Toilet>Kitchen(liquid)>Laundry(liquid)>Bathroom>Human>Laundry (powder)
Median Human>Bathroom>Kitchen
Cobalt
Enviro Human>Bathroom
Maximum Bathroom > Toilet > Human > Laundry (powder)> kitchen (powder and tablet)
Median Human>Bathroom>Toilet>Laundry (powder)>Kitchen(dishwasher)
Fluoride
Enviro Human>Laundry (powder)
Maximum Human > Laundry(powder) > Toilet > Bathroom > Kitchen
Median Human > Laundry (powder)> Toilet (in-cistern)>Kitchen (tablet)
Molybdenum
Enviro Human>Laundry (powder)
Maximum Human > Bathroom (shampoo) > Laundry > Bathroom (Shower gel) > Toilet
Selenium
Median and Enviro
Human>Bathroom
Maximum Human > Laundry > Bathroom > Toilet (freshener) > Kitchen
Median Human>Bathroom>Laundry>Kitchen>Toilet
Nitrogen
Enviro Human>Laundry>Bathroom≈kitchen
Maximum Human > Laundry > Bathroom > Kitchen (powder/tablet) >Toilet>kitchen (liquid)
Median Human>Laundry(powder)>Kitchen(dishwasher)>Bathroom>Toilet> Laundry(liquid)> Kitchen (liquid)
Phosphorus
Enviro Human>Toilet>Laundry>Bathroom>Kitchen

Sources of priority contaminants in domestic wastewater: nutrients and additional elements 46
5.2.1. Antimony Figure 12 compares the mass of antimony (Sb) generated through product use in wastewater to the average mass load from urine and faeces.
The load of Sb from human excretion was assumed to be 0.02 mg/pe/wk (adapted from Health Canada 1997).
The largest Sb loads were produced in the laundry (maximum 0.18 mg/pe/wk for powder detergent) and in the kitchen when dishwasher powder was used (maximum 0.09 mg/pe/wk). These loads were 350% larger than the anthropogenic load (Figure 12).
In the bathroom, the maximum loads were equivalent to 50% or less of the anthropogenic load as seen in Figure 12.
When products of median concentration were adopted, the median loads generated were negligible. The one exception was the mass load discharged from the laundry (Laundry 1). In that stream the load generated, 0.002 mg/pe/wk, was equivalent to 10% of the anthropogenic load.
As mentioned in section 4.1.1, the majority of household products contained only trace amounts of Sb, which often amounted to less than 1 ppm Sb. Hence, for Sb loads from products to be noteworthy, would require the use of large amounts of product as was the case for washing powder.
Figure 12 also shows that the adoption of “enviro” and minimum concentration products resulted in Sb below detection in wastewater, even in the laundry. However, given the low concentrations in most products, adoption of enviro products had limited impact compared to the median.
The total Sb household load from products was equivalent to 0, 9 and 950% of the anthropogenic load when enviro label, median and maximum concentration products were adopted.
In summary, anthropogenic sources are expected to be a more important source of Sb in household wastewater compared to the majority of household products. However there are specific brands of laundry and dishwasher products that can generate loads at least four times larger than the anthropogenic load.
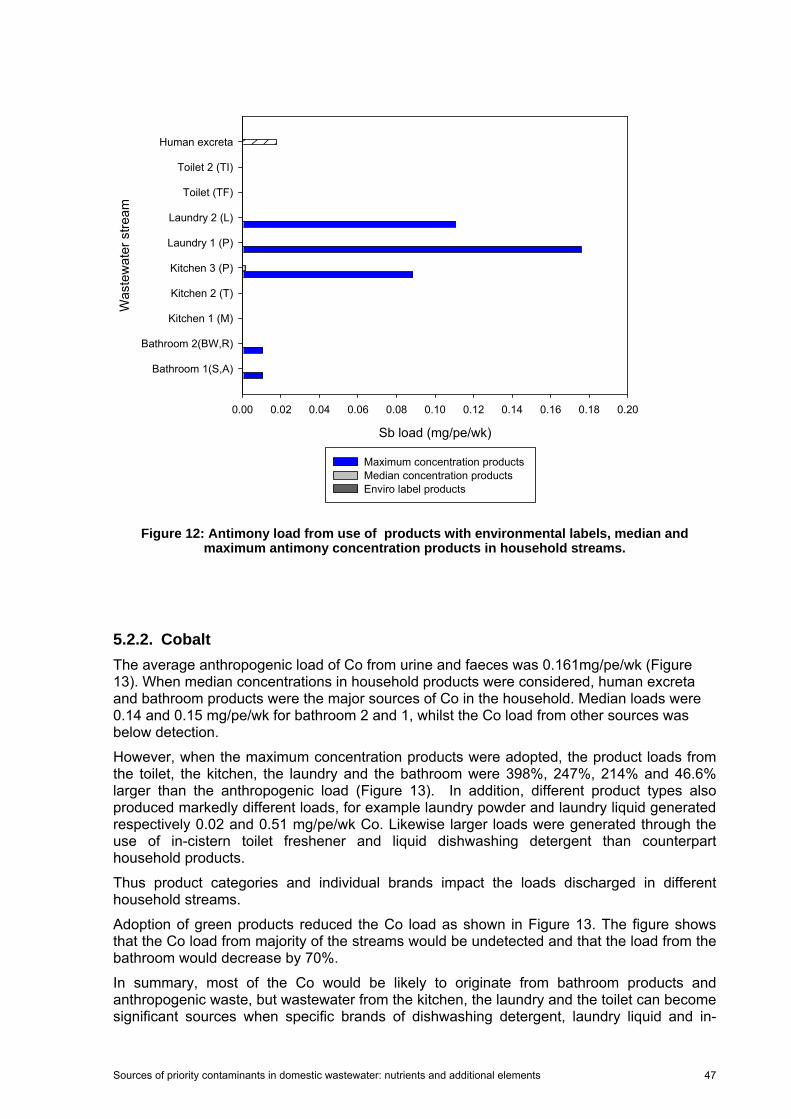
Sources of priority contaminants in domestic wastewater: nutrients and additional elements 47
Maximum concentration products Median concentration products Enviro label products
Sb load (mg/pe/wk)
0.00 0.02 0.04 0.06 0.08 0.10 0.12 0.14 0.16 0.18 0.20
Was
tew
ater
stre
am
Bathroom 1(S,A)
Bathroom 2(BW,R)
Kitchen 1 (M)
Kitchen 2 (T)
Kitchen 3 (P)
Laundry 1 (P)
Laundry 2 (L)
Toilet (TF)
Toilet 2 (TI)
Human excreta
Maximum concentration products Median concentration productsEnviro label products
Figure 12: Antimony load from use of products with environmental labels, median and
maximum antimony concentration products in household streams.
5.2.2. Cobalt The average anthropogenic load of Co from urine and faeces was 0.161mg/pe/wk (Figure 13). When median concentrations in household products were considered, human excreta and bathroom products were the major sources of Co in the household. Median loads were 0.14 and 0.15 mg/pe/wk for bathroom 2 and 1, whilst the Co load from other sources was below detection.
However, when the maximum concentration products were adopted, the product loads from the toilet, the kitchen, the laundry and the bathroom were 398%, 247%, 214% and 46.6% larger than the anthropogenic load (Figure 13). In addition, different product types also produced markedly different loads, for example laundry powder and laundry liquid generated respectively 0.02 and 0.51 mg/pe/wk Co. Likewise larger loads were generated through the use of in-cistern toilet freshener and liquid dishwashing detergent than counterpart household products.
Thus product categories and individual brands impact the loads discharged in different household streams.
Adoption of green products reduced the Co load as shown in Figure 13. The figure shows that the Co load from majority of the streams would be undetected and that the load from the bathroom would decrease by 70%.
In summary, most of the Co would be likely to originate from bathroom products and anthropogenic waste, but wastewater from the kitchen, the laundry and the toilet can become significant sources when specific brands of dishwashing detergent, laundry liquid and in-
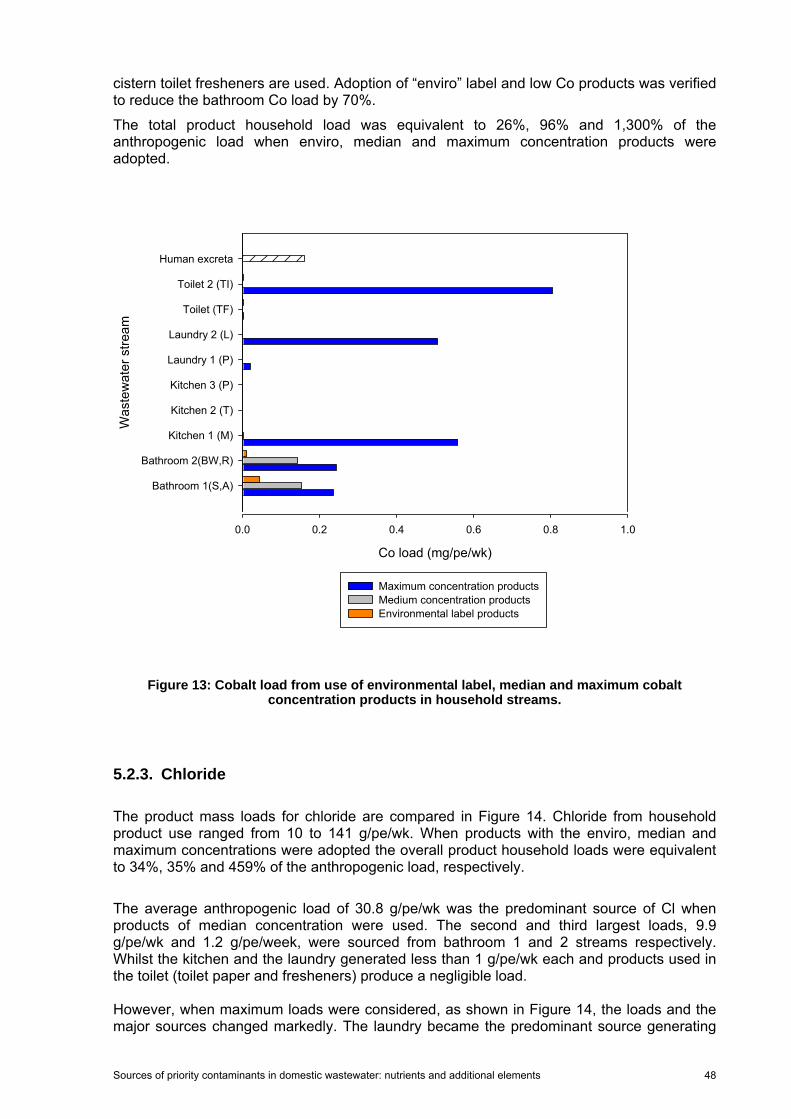
Sources of priority contaminants in domestic wastewater: nutrients and additional elements 48
cistern toilet fresheners are used. Adoption of “enviro” label and low Co products was verified to reduce the bathroom Co load by 70%.
The total product household load was equivalent to 26%, 96% and 1,300% of the anthropogenic load when enviro, median and maximum concentration products were adopted.
Co load (mg/pe/wk)
0.0 0.2 0.4 0.6 0.8 1.0
Was
tew
ater
stre
am
Bathroom 1(S,A)
Bathroom 2(BW,R)
Kitchen 1 (M)
Kitchen 2 (T)
Kitchen 3 (P)
Laundry 1 (P)
Laundry 2 (L)
Toilet (TF)
Toilet 2 (TI)
Human excreta
Maximum concentration productsMedium concentration productsEnvironmental label products
Figure 13: Cobalt load from use of environmental label, median and maximum cobalt
concentration products in household streams.
5.2.3. Chloride The product mass loads for chloride are compared in Figure 14. Chloride from household product use ranged from 10 to 141 g/pe/wk. When products with the enviro, median and maximum concentrations were adopted the overall product household loads were equivalent to 34%, 35% and 459% of the anthropogenic load, respectively.
The average anthropogenic load of 30.8 g/pe/wk was the predominant source of Cl when products of median concentration were used. The second and third largest loads, 9.9 g/pe/wk and 1.2 g/pe/week, were sourced from bathroom 1 and 2 streams respectively. Whilst the kitchen and the laundry generated less than 1 g/pe/wk each and products used in the toilet (toilet paper and fresheners) produce a negligible load. However, when maximum loads were considered, as shown in Figure 14, the loads and the major sources changed markedly. The laundry became the predominant source generating

Sources of priority contaminants in domestic wastewater: nutrients and additional elements 49
86 g/pe/wk (Laundry 1). The next largest loads originated from the toilet (with in-cistern freshener) at 34 g/pe/wk. This was comparable to the load of 31 g/pe/wk from human excreta. Furthermore, the maximum loads for the other streams were larger by 80% (for kitchen 1) to 570% (for kitchen 3) than the loads derived from median product concentrations (Figure 14).
The use of environment friendly label and low Cl products reduced the loads of some sources and increased the loads of others (Figure 14). The variation in loads for kitchen 1, bathroom 1 and 2, was -1%, -11% and +9% from the median loads. But, in the laundry a load reduction of -65% and -98% of laundry 1 and 2 median loads was achieved. On the other hand, the load from kitchen 2 (dishwasher tablets) could decrease by 87% with selection of the tablet with the lowest Cl content (no environmental friendly tablets are available in the market). But for kitchen 3 the load increased by 24% with the adoption of “enviro label” product compared to the median. In summary, product selection can have a significant effect on the loads of Cl in wastewater, being able to increase and decrease the loads significantly. Either way, the anthropogenic load is also a major source of Cl in domestic wastewater.
Cl load (mg/pe/wk)
0 1e+4 2e+4 3e+4 4e+4 8e+4 9e+4 1e+5
Was
tew
ater
stre
am
Bathroom 1(S,A)
Bathroom 2(BW,R)
Kitchen 1 (M)
Kitchen 2 (T)
Kitchen 3 (P)
Laundry 1 (P)
Laundry 2 (L)
Toilet (TF)
Toilet 2 (TI)
Human excreta
Maximum concentration products Medium concentration products Enviro label products
Figure 14: Chloride load from use of environmental label, median and maximum chloride
products in household streams.

Sources of priority contaminants in domestic wastewater: nutrients and additional elements 50
5.2.4. Chromium The loads of Cr derived from product use at various locations in household are shown in Figure 15. The figures show that majority of the sources within a household contribute to the overall Cr load and that median and maximum loads in individual wastewater streams would range from 0.001 to 0.184 mg/pe/wk and from 0.014 to 35.8 mg/pe/wk, respectively. The load derived from human excreta, 0.14mg/pe/wk, was of the same magnitude as the loads from product use (Figure 15). When median loads are considered the sources of Cr were ranked in decreasing order of priority as: Bathroom (1 and 2) >Human>Laundry 1 >Kitchen 3 >toilet (1 and 2) > Kitchen 2 > Laundry 2 > kitchen 1. In Figure 15, when median loads are considered, the bathroom, human excreta, the laundry and the dishwasher were the major sources of Cr contributing 0.184, 0.140, 0.123 and 0.113 mg/pe/wk. The smallest load came from the kitchen when liquid dishwashing detergent was used. However, the maximum loads from the laundry, bathroom, kitchen (using dishwasher powder) and particularly the toilet could surpass the anthropogenic load. In such case, the largest load, 35.8 mg/pe/wk was generated when a specific brand of in-cistern toilet freshener was adopted, but this value was not necessarily representative of the typical output expected from such products as the Cr concentration in that brand was much larger than in any of the other toilet freshener products tested. Environment label products and products with low Cr content reduce the Cr loads significantly as shown in Figure 15. The combined product household load was equivalent to 146%, 363% and 27 times the anthropogenic load when products of enviro label, median and maximum concentrations were adopted respectively.

Sources of priority contaminants in domestic wastewater: nutrients and additional elements 51
Cr load (mg/pe/wk)
0.0 0.5 1.0 1.5 2.0 30.0 35.0
Was
tew
ater
stre
am
Bathroom 1(S,A)
Bathroom 2(BW,R)
Kitchen 1 (M)
Kitchen 2 (T)
Kitchen 3 (P)
Laundry 1 (P)
Laundry 2 (L)
Toilet (TF)
Toilet 2 (TI)
Human excreta
Maximum concentration productsMedian concentration products Enviro label products
Figure 15: Chromium load from use of environmental label, median and maximum chromium concentration products in household streams.
5.2.5. Fluoride The loads of fluoride (F) derived from product use at various locations in a household are shown in Figure 16.
Household products were an important source of F compared to the mean anthropogenic load. The anthropogenic load was 22 mg/pe/wk whilst the combined load from household products could be much larger, being up to 6 times the anthropogenic load when products with the maximum F concentration were considered.
Adoption of median concentration and environmental label products reduced the combined loads to 73% and 9% of the anthropogenic loads.
In Figure 16, the median and maximum loads for individual sources and products combinations vary markedly. The bathroom was a major source of F, but it was also subject to the largest variation in load from products, where a difference of approximately 100 mg/pe/wk was observed between the median and maximum loads.
Median loads from the different sources, including the bathroom, were lower than the load derived from human excreta, 22 mg/pe/wk. Likewise the adoption of environment label and low F products further reduced the F load for most streams, but for Laundry 1.
Tap water was not considered in this assessment, but as it contains 1 mg/L F, and it will be a predominant F source in a household.

Sources of priority contaminants in domestic wastewater: nutrients and additional elements 52
F load (mg/pe/wk)
0 10 20 30 110 120
Was
tew
ater
stre
am
Bathroom 1(S,A)
Bathroom 2(BW,R)
Kitchen 1 (M)
Kitchen 2 (T)
Kitchen 3 (P)
Laundry 1 (P)
Laundry 2 (L)
Toilet (TF)
Toilet 2 (TI)
Human excreta
Maximum concentration products Median concentration products Enviro labels products
Figure 16: Fluoride load from use of environmental label, median and maximum fluoride concentration products in household streams.
5.2.6. Molybdenum
Figure 17 shows the mass loads derived from the use of household products with maximum and median molybdenum concentrations, and from use of a combination of “enviro” and low Mo content products in a household. The maximum molybdenum (Mo) loads derived from household product use were less than 0.33mg/pe/wk for individual household wastewater streams shown in Figure 17. Median loads were less than 0.14 mg/pe/wk for each of the streams. Majority of the loads decreased by less than 5μg/pe/wk with the adoption of “environment” label and low Mo products. But loads for laundry 1 and toilet 2 increased to 0.26 mg/pe/wk and 0.13 mg/pe/wk, respectively. When the loads for the household combined streams were evaluated, the maximum load for the household was equivalent to 97% of the human load (0.61 mg/pe/wk). Adoption of median and enviro label products produced the equivalent of 26% and 44% of the anthropogenic load respectively.

Sources of priority contaminants in domestic wastewater: nutrients and additional elements 53
In summary, Mo loads from household products in individual streams were less than loads from anthropogenic waste. The largest loads from product use came from the laundry when powder concentrate was used (0.33 mg/pe/wk) and from the toilet (0.21 mg/pe/wk). Product selection did not affect the ranking of individual sources within a household, but it could reduce the overall household load from product use by as much of 71%. Results also show that environmental label products may not cause significant load reduction for an individual wastewater stream compared to the median loads as both produced similar loads. The only exception was Laundry 1, where the load from “enviro label” products was larger than the median load, in which case the loads were respectively 0.26 and 0.14 mg/pe/wk (Figure 17).
Maximum concentration products Median concentration products Enviro label products
Mo load (mg/pe/wk)
0.0 0.1 0.2 0.3 0.4 0.5 0.6 0.7
Was
tew
ater
stre
am
Bathroom 1(S,A)
Bathroom 2(BW,R)
Kitchen 1 (M)
Kitchen 2 (T)
Kitchen 3 (P)
Laundry 1 (P)
Laundry 2 (L)
Toilet (TF)
Toilet 2 (TI)
Human excreta
Maximum concentration products Median concentration productsEnvironmental label products
Figure 17: Molybdenum load from use of environmental label, median and maximum molybdenum products in household streams.
5.2.7. Selenium Selenium loads from product use in individual wastewater streams ranged from nil to 0.185 mg/pe/wk and are shown in Figure 18. The bathroom and the laundry generated the largest loads from household products at 0.185 mg/pe/wk and 0.154 mg/pe/wk for bathroom 1 and laundry 2 respectively. Loads from the toilet and the kitchen were negligible. Each individual wastewater source produced the equivalent to less than 1/3 of the anthropogenic load of 0.595 mg/pe/wk. However, all household products combined generated a maximum load of 0.339 mg/pe/wk, equivalent to 57% of the anthropogenic load.

Sources of priority contaminants in domestic wastewater: nutrients and additional elements 54
Product selection affected the load values. Median loads were lower than the maximum loads. For instance, as shown in Figure 18, bathroom 1 had maximum and median loads of 0.185 mg/pe/wk and 0.024 mg/pe/wk, respectively. Using products of median concentration the household load from product use was reduced from 47% to 4% of the anthropogenic load. On the other hand, the adoption of environmental label products had a lesser impact in reducing the loads from the median values. The reduction differed for each stream as shown in Figure 18. For bathroom 1 the median and enviro loads were the same, 0.024 mg/pe/wk, whilst for kitchen 2 and 3 the Se load decreased from 0.5 mg/pe/wk and 0.6 mg/pe/wk to nil, and for Laundry 1 the enviro load increased to 0.009 mg/pe/wk. In summary, the anthropogenic load was considered a more important source of Se compared to the household products evaluated. Yet, product selection can contribute to a significant load reduction, as products loads can be equivalent to up to 57% of the anthropogenic load.
Se load (mg/pe/wk)
0.0 0.2 0.4 0.6 0.8
Was
tew
ater
stre
am
Bathroom 1(S,A)
Bathroom 2(BW,R)
Kitchen 1 (M)
Kitchen 2 (T)
Kitchen 3 (P)
Laundry 1 (P)
Laundry 2 (L)
Toilet (TF)
Toilet 2 (TI)
Human excreta
Maximum concentration products Median concentration products Enviro label products
Figure 18: Selenium load from use of environmental label, median and maximum selenium concentration products in household streams.
5.2.8. Nitrogen The anthropogenic load is the major source of nitrogen in wastewater, being responsible for at least 75% of all the nitrogen (Metcalf and Eddy 2003, Larsen and Gujer 1996).

Sources of priority contaminants in domestic wastewater: nutrients and additional elements 55
As seen in Figure 19, nitrogen (TKN) was discharged in every stream. However, loads generated by product use were small compared to the anthropogenic load.
The maximum load from product use for the combined household streams was equivalent to only 7% of the anthropogenic load. When products of median and enviro label concentrations were adopted the load was further reduced to 0.85% and 1.8% of the anthropogenic load.
When considering TKN from products only, the laundry and the bathroom produced the two highest nitrogen loads, with maxima of 4.4 g/pe/wk and 1 g/pe/wk respectively
Products used in the toilet (toilet paper and fresheners) had the lowest load contribution.
Adoption of environmental label products does not necessarily result in the reduction of the nitrogen load in wastewater when compared to products with median concentrations for laundry streams.
In summary, products have a very limited impact on nitrogen in wastewater; the load generated was less than 7% of the TKN load from human excreta. Hence, product selection whilst reducing loads has little effect on the overall nitrogen load of the household. Adoption of environment label and low TKN content products had no significant reduction in loads. Instead TKN in some streams increased.
Traditionally nitrogen has not been a parameter of concern in household products for environmental purposes.
Maximum conc entrati on products Med ian c oncentration products Enviro label products
TKN load (g/pe/wk)
0.0 0.5 1.0 20.0 40.0 60.0 80.0
Was
tew
ater
stre
am
Bathroom 1(S,A)
Bathroom 2(BW,R)
Kitchen 1 (M)
Kitchen 2 (T)
Kitchen 3 (P)
Laundry 1 (P)
Laundry 2 (L)
Toilet (TF)
Toilet 2 (TI)
Human excreta
Maximum concentration productsMedium concentration productsEnviro label products
Figure 19: Nitrogen load from use of environmental label, median and maximum nitrogen
concentrations products in household streams.
Sources of priority contaminants in domestic wastewater: nutrients and additional elements 56
5.2.9. Phosphorus The loads of phosphorus (TP) generated in the various sources within a household are shown in Figure 20. Product selection could either halve or increase by two thirds the load of P into the sewer. The average anthropogenic load of phosphorus adopted was 22.4 g/pe/wk, but values ranging from 0.7 to 31.5 g/pe/wk have also been reported in the literature (Metcalf and Eddy 2003). Loads from household product use were 40.4 g/pe/wk, 9.8 g/pe/wk and 0.1 g/pe/wk for maximum, median and environment label concentrations. Analysis of individual streams identified the laundry as the major non-anthropogenic source of phosphorus among the household streams (Figure 20). However, loads varied with the brand and type of products adopted in each stream as evidenced for the laundry, the kitchen and the toilet in Figure 20 for the median, maximum and environmental product concentrations. The ranking of household sources based on load also changed when maximum or median product concentrations were evaluated as previously shown in Table 16:
• Maximum concentrations: Laundry>Bathroom>Kitchen>Toilet • Median concentrations: Laundry>Kitchen> Bathroom>Toilet
In summary, household products can be a significant contributor to the TP load in wastewater. The contribution can range from less than 0.5% to more than 180% of the anthropogenic load depending on the type, brands and combination of household products adopted. Environmental label and low P products were effective in reducing the load of P to 0.5% of the anthropogenic load. The laundry was the major non-anthropogenic source of phosphorus in a household, followed by either the kitchen or the bathroom depending on the products adopted.

Sources of priority contaminants in domestic wastewater: nutrients and additional elements 57
TP load (mg/pe/wk)
0 250 500 5000 10000 15000 20000
Was
tew
ater
stre
am
Bathroom 1(S,A)
Bathroom 2(BW,R)
Kitchen 1 (M)
Kitchen 2 (T)
Kitchen 3 (P)
Laundry 1 (P)
Laundry 2 (L)
Toilet (TF)
Toilet 2 (TI)
Human excreta
Maximum concentration productsMedium concentration productsEnviro label products
Figure 20: Phosphorus load from use of environmental label, median and maximum
phosphorus loads products in household streams.
6. IMPACT ON WASTEWATER LOADS
The contribution of household products to the overall load discharged by a household into sewer is determined by a range of factors:
(a) The type of element considered:
(b) The type of products adopted (e.g. powder or liquid detergents) ,
(c) The brands of products adopted.
(d) Household habits.
Figure 21 to Figure 23 illustrate the contribution from each household outlet to the total household load with product selection (scenarios WW1, WW2 and WW3). In the figures, the toilet stream includes loads from both products and human excreta. The load from human excreta is assumed to be the same in all three scenarios. The other household streams represent the load from product use only. The load from tap water was not included in any of the scenarios.
The detailed descriptions for scenarios WW1, WW2 and WW3 were given previously in section 5.1. The wastewater streams for the household are also shown as mass loads in Appendix 2.

Sources of priority contaminants in domestic wastewater: nutrients and additional elements 58
WW1 used the products with the maximum concentration of each element in each product category adopted; it included the use of laundry powder and dishwashing liquid (no dishwasher).
WW2 also adopted products with maximum concentration, but the type of products adopted differed. It included for instance laundry liquid and dishwasher powder.
Finally, WW3 assumed the use of environmental label products or products with the least element concentration when no enviro label product was available.
The overall mass load for each scenario is not shown as this was covered in section (5); instead this section aims to look at the relative importance of the sources for each scenario.
The importance of each household source was dependent on the elements and the scenario adopted.
In all three scenarios, loads from the kitchen had a lesser impact on the overall load to sewer compared to the other streams (toilet, bathroom and laundry) and the toilet was the major source of nitrogen and phosphorus in the household.
The laundry and the bathroom were also important sources for most contaminants as seen in Figure 21 and Figure 22.
WW1 represents the most common scenario expected in households, under that scenario the greywater from the bath and the laundry can contribute up to 80% of the load of Cr, Cl and F, up to 64% and 61% of Sb and Co, respectively. Whilst, the toilet was the major source of Mo and Se.
In WW2, the change in product type, such as from powder to liquid detergent, resulted in a lesser contribution from the laundry and the bath to the overall Cl and Mo household loads.
Under scenario WW3, in Figure 23, the adoption of products of low elemental content, significantly reduced the contribution of greywater to the overall loads in wastewater, making the toilet the major source of all elements in the household.
In summary, this illustrates how the contribution of the different household sources can change with product selection and how this can also impact the effectiveness of adopting at source control measures such as greywater diversion, when managing the overall wastewater discharge to sewer.
Kitchen and toilet wastewater are typically discharged to sewer whilst laundry and bathroom wastewater can be diverted to garden.
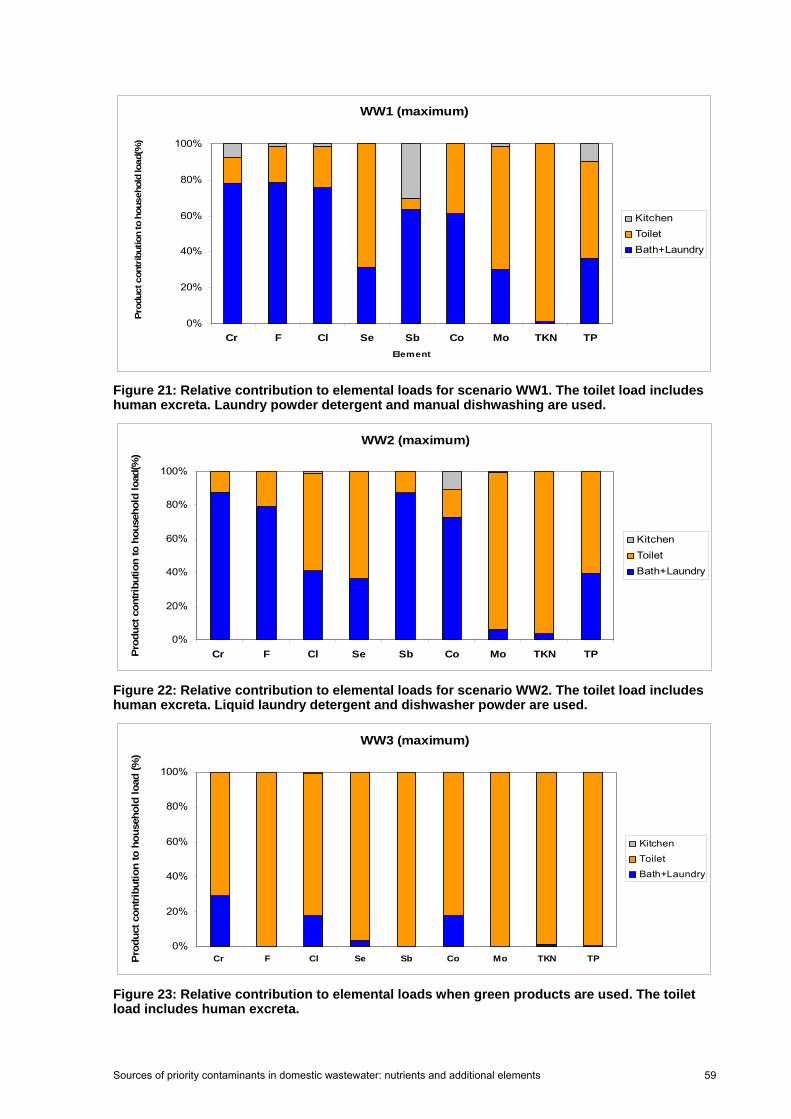
Sources of priority contaminants in domestic wastewater: nutrients and additional elements 59
WW1 (maximum)
0%
20%
40%
60%
80%
100%
Cr F Cl Se Sb Co Mo TKN TPElement
Prod
uct c
ontr
ibut
ion
to h
ouse
hold
load
(%)
KitchenToiletBath+Laundry
Figure 21: Relative contribution to elemental loads for scenario WW1. The toilet load includes human excreta. Laundry powder detergent and manual dishwashing are used.
WW2 (maximum)
0%
20%
40%
60%
80%
100%
Cr F Cl Se Sb Co Mo TKN TPProd
uct c
ontri
butio
n to
hou
seho
ld lo
ad(%
)
KitchenToiletBath+Laundry
Figure 22: Relative contribution to elemental loads for scenario WW2. The toilet load includes human excreta. Liquid laundry detergent and dishwasher powder are used.
WW3 (maximum)
0%
20%
40%
60%
80%
100%
Cr F Cl Se Sb Co Mo TKN TPPro
duct
con
trib
utio
n to
hou
seho
ld lo
ad (%
)
KitchenToiletBath+Laundry
Figure 23: Relative contribution to elemental loads when green products are used. The toilet load includes human excreta.
Sources of priority contaminants in domestic wastewater: nutrients and additional elements 60
7. CONCLUSIONS AND RECOMMENDATIONS
A range of 156 household products commonly used in the bathroom, laundry, kitchen and toilet were analysed to determine:
(a) Their content of antimony, cobalt, chromium, chloride, fluoride, molybdenum, selenium, nitrogen (as total Kjeldahl nitrogen) and phosphorus (as total phosphorus), and
(b) The loads and distribution of such elements within household wastewater streams.
The data gathered in this report was used to simulate the effect of a range of strategies on the quality of wastewater. The data generated could be used to evaluate a larger range of scenarios for future research.
Frequency of detection
Phosphorus, nitrogen, chloride and chromium were the most common elements among household products. They were detected in 97%, 84%, 80% and 64% of the products analysed. Phosphorus, nitrogen and chromium were detected in all cleaning and personal care product categories. Chloride, detected in most products, was below detection in toilet paper.
Molybdenum, fluoride, cobalt and selenium were detected in less than 30% of the products:
Antimony was detected in less than 10% of household products.
Phosphorus, nitrogen, chloride, fluoride and selenium are part of compounds used in the formulation of a range of household products. Fluoride is added to toothpaste and to some mouthwash formulations for caries prevention, whilst selenium is incorporated into the formulation of some medicated shampoos, e.g. as selenium sulphide, to combat dandruff. Interestingly, traces of fluoride were also detected in some brands of hair colouring, dishwashing and laundry detergents although it was not listed as an ingredient.
The other elements, antimony, chromium, cobalt and molybdenum, were generally detected in parts per million concentrations, and often only in selected products within a category. This suggests that they are more likely contaminants derived from raw materials, manufacturing process or packaging used for the products.
Elemental Loads in households
The contribution of household products to the elemental load in a household was evaluated assuming a one-person household and an average frequency of product use. The loads were compared to the load derived from human excreta.
Household products contributed to the overall element load to sewer. However, the size of the contribution depends on the element in question, the product categories and brands adopted by the household.
• Nitrogen: products have a minimal impact on the load of nitrogen. Loads were estimated to correspond to only 0.9% to 7% of the anthropogenic load. The bathroom and the laundry were the major sources for product loads.
• Phosphorus: products can be a significant load contributor, but the contribution varies significantly with brands. The contribution could be equivalent to 0.5% to 180% of the anthropogenic load. The laundry, the kitchen and the bathroom were the top 3 major sources when products are concerned.
• Selenium: products’ load could be equivalent to up to 57% of the anthropogenic load. Contaminants originated mainly from the bathroom and the laundry.

Sources of priority contaminants in domestic wastewater: nutrients and additional elements 61
• Molybdenum: selected products can be a significant load contributor. The contribution from selected products could be equivalent to up to 97% of the anthropogenic load, but median product concentrations generated a contribution of 26% only. Contaminants originated mainly from the laundry and the toilet.
• Fluoride: products can be a significant load contributor. The potential contribution ranged from the equivalent to less than 9% up to 586% of the anthropogenic load depending on the type and brands of products used in a household. Median product concentrations generated a contribution of 73%.The bathroom was the major point of origin.
• Chromium: products are a significant load contributor. The potential contribution ranged from 146% to 362% of the anthropogenic load for most products. However, loads were dependent on the type and brands of products used and one particular brand of toilet freshener with an extremely high Cr content generated loads 275 times larger than the anthropogenic load. Most commonly, sources were distributed across the household.
• Chloride: products are a significant load contributor. The potential contribution ranged from less than 34% up to 459% of the anthropogenic load depending on the type and brands of products adopted in a household. Median product concentrations generated a contribution of 35%. The major source was determined by the brands adopted and could be either the bathroom, the laundry or the toilet.
• Cobalt: products can be a significant load contributor, but their Co content varied markedly across products and brands within a same product type. The potential household product contribution ranged from less than 25% to up to thirteen times the anthropogenic load depending on the type and brands of products adopted. The major source was determined by the brands adopted.
• Antimony: the product contribution can vary markedly, ranging from nil to 950% of the anthropogenic load. The median was 9%. Major product sources were either the laundry or the kitchen.
Overall, the loads from household products are determined by the type and brand of products used, the dose and frequency of use in the household. Analysis of the products has shown that the elemental concentration among products varies widely between product categories and within brands.
There are specific brands that have markedly higher element concentrations than the majority of products within a category. This was observed in the comparison of the loads derived from the maximum, median and enviro label concentrations for each product category. The adoption of median concentration and enviro label/low concentration products resulted in a marked load reduction compared to the maximum concentrations.
However, the adoption of enviro label products and the associated load reduction was in some cases not much lower than what was already achieved by the median load. This was the case for antimony (because of concentrations at the detection limit), molybdenum, and nitrogen. However, for chromium, cobalt, chloride, fluoride, selenium and phosphorus the adoption of environmental label and selected products of low elemental concentrations will cause a reduction of contaminant loads.
Not all enviro label products had lower elemental concentrations than other products, with the exception of phosphorus. As a result the resulting loads may not necessarily be lower than other products, particularly for individual streams. This can have a bearing on the quality of greywater streams diverted to garden for instance.

Sources of priority contaminants in domestic wastewater: nutrients and additional elements 62
Implications to contaminant management
Product selection has potential to reduce the loads of contaminants entering wastewater in residential areas. This is a useful strategy for some contaminants, such as phosphorus, chloride and selenium, but less effective for others such as nitrogen, molybdenum and cobalt due to either the low contribution of products to the overall household load compared to other inputs as in the case of nitrogen or the overall small load in wastewater as for antimony, molybdenum and cobalt.
Elements which are part of the formulation of a product, such as phosphorus, nitrogen, chloride, fluoride and selenium, can generally have their entry into the product traced and quantified. However, for other contaminants, present in trace amounts and not part of the formulation identifying the source of contamination would require further investigation of manufacture processes and raw materials.
Product selection would also be useful to householders trying to reduce the loads of contaminants diverted either to sewer or into the garden, as in the case of greywater.
However, access to information and knowledge about product formulation to householders is limited. Often the householder is neither concerned nor aware of the ingredients in products adopted in the household, and relies on advice from the manufacturer of from other sources.
Labels typically used in products such as “biodegradable”, “low P” or “environmentally friendly” generally refer to a single environmental aspect, most often P content in regards to surface water discharge or persistence in aquatic environments. Such labels do not provide sufficient relevant information to reflect the current patterns of water treatment and reuse, e.g. water treatment and recycling, nor the associated environmental impacts, for instance on soil and plant health in case of land application.

Sources of priority contaminants in domestic wastewater: nutrients and additional elements 63
8. REFERENCES
Alaejos, MS and Romero, CD (1993) Urinary selenium concentrations, Clinical Chemistry
39(10), 2040-2052.
Altmann, PL and Dittmer, DS (1972-1974) Biology Data book, Second Edition, Federation of
American Societies for Experimental Biology, 1489.
Anderson, R.A (1997) Chromium as an essential nutrient for humans, Regulatory Toxicology
and Pharmacology, 26(1), 35-41.
Asano, T (2007) Water Reuse, McGraw-Hill.
Ashley, P.M, Craw, D., Graham, B.P., Chappell, D.A.(2003) Environmental mobility of
antimony around mesothermal stibnite deposits, New South Wales, Australia and southern
New Zealand, Journal of Geochemical Exploration, 77, 1-14.
ANZECC and ARMCANZ (2001) Australian and New Zealand Guidelines for Fresh and
Marine Water Quality, Chapter 4, Primary Industries, Australian and New Zealand
Environment and Conservation Council and Agriculture Resource Management Council of
Australia and New Zealand.
ANZECC and ARMCANZ (2000) Australian and New Zealand Guidelines for Fresh and
Marine Water Quality, Volume 3, Primary Industries –Rationale and Background
information, Australian and New Zealand Environment and Conservation Council and
Agriculture Resource Management Council of Australia and New Zealand.
Encyclopedia Britannica (2009) “Chemical industry” Encyclopedia Britannica Online.Web 24
Nov. 2009, http://www.search.eb.com/eb/article-82227, last accessed 15/10/2009.
Bügel, S, Larsen, EH, Sloth, JJ, Flytlie, K, Overvad, K, Steenberg, LC and Moesgaard, S.
(2008) Absorption, excretion, and retention os selenium from a high selenium yeast in men
with a high intake of selenium, Food Nutrition Research, 52 10.3402/fnr.v52i0.1642.,
http://www.pubmedcentral.nih.gov/picrender.fcgi?artid=2596749&blobtype=pdf, last
accessed 02/10/2009.
Christova- Boal, D, Eden, RE, McFarlane, S (1996) An investigation into greywater reuse for
residential properties, Desalination, 106, 391-397.
Connor, M.A. and Wilkie, P.J. (1995) Domestic contributions to levels of key organics and
inorganic pollutants in Melbourne sewage, University of Melbourne, June 1995
Cook, S, Tjandraatmadja, G, Marleni, N (2010) Impact of source management strategies on
quality and loads in residential wastewater: scenario analysis, Water for a Healthy Country
National Research flagship, CSIRO.
Crockett, J. (2003), Feasibility study for a dry composting toilet and urine separation
demonstration project,
Sources of priority contaminants in domestic wastewater: nutrients and additional elements 64
http://www.ghd.com.au/aptrixpublishing.nsf/AttachmentsByTitle/PP+CompostingToiletStud
y+PDF/$FILE/e4215.pdf
CWW (2006) Personal communication, City West Water.
CWW (2009) Drinking Water quality Report 2009, City West Water.
Davies, T. D, Pickard, J. and Hall, K. J. (2005) Acute molybdenum toxicity to rainbow trout
and other fish, J. Environ. Eng. Sci, 4: 481–485
Diaper, C, Tjandraatmadja, G, Pollard, C, Tusseau, A.C, Price, G, Burch, L, Gozukara, Y,
Sheedy, C and Moglia, M (2008), Sources of critical contaminants in domestic wastewater:
Contaminant loads from household appliances, Water for a Healthy Country report series,
CSIRO Publishing.
Eriksson E., Auffarth K., Henze M. and Ledin A. (2002) Characteristics of grey wastewater,
Urban Water, 4, 85-104
Francesconi, KA and Pannier, F (2004) Selenium metabolites in urine: a critical overview of
past work and current status, Clinical Chemistry, 50(12), 2240-2253.
Friedler, E. (2004) Quality of individual domestic greywater streams and its implication for on-
site treatment and reuse possibilities, Experimental Technology, 25, 997-1008.
Foy, CD, Chaney, R.L. and White, M.C. (1978), The physiology of metal toxicity in plants.
Annu. Rev. Plant Physiol, 29, 511–566.
Fox, D, Molloy, R, Rixon, A., Tjandraatmadja, G and Carey, J (2006) Review and statistical
assessment of Trade Waste Data in Victoria, Report to the Department of Sustainability
and Environment, University of Melbourne.
Gebel, T., Claussen, K. and Dunkelberg, H.(1998) Human biomonitoring of antimony,
International Archives of Occupational and Environmental Health. 71(3), 221-224.
Gray S.R. and Becker N.S.C Becker (2002) Contaminant flows in urban residential water
systems. Urban Water, 4, 331-346
Grevatt, PC (1998) Toxicological review of hexavalent Chromium, August 1998, USEPA,
http://www.epa.gov/iris/toxreviews/0144-tr.pdf, last accessed 02/10/2009.
Gropper, SS, Smith, JL and Groff, JL (2008) Advanced nutrition and human metabolism, 5th
Edition, Wadsworth CENGAGE Learning.
Hargelius et al., (1995) Hushållsspillvatten Framtagende av nya schablonvården för BDT-
vatten. In Vad innehåller avlopp från hushåll?. Stockolm: Swedish EPA
Hart, B.T (1974) A compilation of Australian water quality criteria”, Australian Water
Resources Council Technical Paper number 7.
Heitland, P and Köster, H.D. (2005) Biomonitoring of 30 trace elements in urine of children
and adults by ICP-MS, Clinica Chimica Acta, 365, 310-318
Sources of priority contaminants in domestic wastewater: nutrients and additional elements 65
Henze, , M, Harremoës, P, Jansen,J.laC., Arvin, E. (2002) Wastewater treatment –Biological
and chemical processes, Springer-Verlag, 97.
Hypes, W.D (1974) Characterisation of typical household water greater. On J.H.T.
Winnerberger (ed.) Manual of Greywater Treatment Practice, 79-88.
Health Canada (1997) Water quality and health - Antimony, May 1997, http://www.hc-
sc.gc.ca/ewh-semt/pubs/water-eau/antimony-antimoine/index-eng.php, last accessed 02
October 2009.
Hypes W.D. (1974) Characterisation of typical household greywater. In J.H.T. Winneberger
(Ed) Manual of greywater treatment practice, 79-88
Icon (2001) Pollutants in Urban Waste and Sewage Sludge – Final Report, IC Consultants
Ltd.
Kim, J.H, Gibb, H.J, and Howe, P.D. (2006) Cobalt and inorganic cobalt compounds,
Concise International Chemical Assessment Document 69, World Health Organisation,
http://www.who.int/ipcs/publications/cicad/cicad69%20.pdf, last accessed 02 October 2009.
Larsen, T.A. and Gujer, W. (1996) Separate management of anthropogenic nutrient solutions
(human urine), Wat.Sci.Tech, 34(3-4), 87-94.
LeBlanc, A, Dumas, P. and Lefebvre, L.(1999), Trace element content of commercial
shampoos, The Science of the Total Environment, 229, 121-124.
Lemly, A.D. (2002) Symptoms and implications of selenium toxicity in fish: the Belews Lake
case example, Aquatic Toxicology, 57, 39-49.
Maher, WA.( 2009), Antimony in the environment – the new global puzzle, Environ. Chem, 6,
93–94.
McLaughlin, MJ, Tiller, KG, Naidu, R and Stevens, DP (1996) Review: the behaviour and
environmental impact of contaminants in fertilizers, Australian Journal of Soil Research, 34,
1-54.
McLaughlin, MJ,, Tiller, KG, and Smart, MK (1997) Speciation of cadmium in soil solution of
saline/sodic soils and relationship with cadmium concentrations in potato tubers. Australian
Journal of Soil Research, 35, 1–17
Metcalf and Eddy (2003) Wastewater Engineering, Treatment and reuse, Ed G.
Tchobanoglous, F.L.Burton and H.D. Stensel, Mc-Graw-Hill, 4th Edition.
Michalke, K.,Schmidt, A.,Huber, B.,Meyer, J.,Sulkowski, M.,Hirner, A. V.,Boertz, J.,Mosel,
F.,Dammann, P., Hilken, G., Hedrich, H. J., Dorsch, M., Rettenmeier, A. W., Hensel, R.
(2008) Role of intestinal microbiota in transformation of bismuth and other metals and
metalloids into volatile methyl and hydride derivatives in humans and mice, Applied and
Environmental Microbiology, 74(10),3069-3075.
Sources of priority contaminants in domestic wastewater: nutrients and additional elements 66
NHMRCC and NRMMC (2008) Australian Drinking Water guidelines, Chapter 6, National
Health and Medical Research Council and Natural Resource Management Ministerial
Council, http://www.nhmrc.gov.au/publications/synopses/_files/adwg_11_06.pdf, last
accessed 02 October 2009.
NRMMC/EPHC/AHMC (2006) Australian Guidelines for Water Recycling:Managing Health
and Environmental Risks (Phase 1), National Water Quality Management Strategy, Natural
Resource Management Ministerial Council, Environment Protection and Heritage Council
and Australian Health Ministers’ Conference, November 2006, 149,
http://www.ephc.gov.au/sites/default/files/WQ_AGWR_GL__Managing_Health_Environme
ntal_Risks_Phase1_Final_200611.pdf, last assessed 26 October 2009.
O’Connor et al (2001) A modified risk assessment to establish molybdenum standards for
land application of biosolids, Journal of Environmental Quality, 30, 1490-1507.
Palmquist, H. and Hanæus, J (2005) Hazardous substances in separately collected grey-
and blackwater from ordinary Swedish households, Science of the Total Environment,
348,1-3, 151-163.
Patriarca, M., Menditto, A.,Rossi, B.,Lyon, T. D. B. and Fell, G. S. (1999) Environmental
exposure to metals of newborns, infants and young children, IXth Italian-Hungarian
Conference in Spectrochemistry - Analytical Techniques in Environmental Chemistry,
Siena, Italy, 351-361.
Rose, JB, Sun, G, Gerba, CP, Sinclair, NA ( 1991) Microbial quality and persistence of
enteric pathogens in graywater from various household sources, Water Research, 25(1),
37-42.
Rule, K.L., Comber, S.D.W., Ross, D.,Thornton, A., Makropoulos, C.K. and Rautiu, R.,
(2006) Diffuse sources of heavy metals entering an urban wastewater catchment,
Chemosphere, 63, 64-72.
SEWL (2009) South East Water 2008/09 Drinking Water quality report, South East Water
Limited.
Shareef, A, Kookana, R, Kumar,A and Tjandraatmadja, G (2008)Sources of Emerging
Organic Contaminants in Domestic Wastewater, Water for a Healthy Country National
Research flagship, CSIRO Publishing.
Shotyk, W., Krachler, M., Chen, B., (2006) Contamination of Canadian and European bottled
waters with antimony from PET containers. J. Environmental Monitoring, 8 (2), 288–292.
Sörme L. and Lagerkvist R. (2002) Sources of heavy metals in urban wastewater in
Stockholm. The Science of the Total Environment, 298, 131-145
Stephenson,T (1987) Sources of Heavy Metals, Chapter 1, in Heavy metals in wastewater
and sludge treatment proceses, Ed. J.N. Lester, 47-64.

Sources of priority contaminants in domestic wastewater: nutrients and additional elements 67
Terry, M, Zayed, A.M., de Souza, M.P., Tarun, A.S (2000) Selenium in higher plants, annual
Review of Plant Molecular Biology, 51, 401-432.
Tjandraatmadja, G and Diaper, C (2007) Sources of critical contaminants in domestic
wastewater: a literature review, Water for a Healthy Country National Research flagship,
CSIRO Publishing.
Tjandraatmadja, G, Diaper, C, Gozukara,Y, Burch, L,Sheedy,C and Price, G (2008) Sources
of priority contaminants in domestic wastewater:contaminant loads from household
products, Water for a Healthy Country National Research flagship, CSIRO Publishing.
Tjandraatmadja, G, Pollard, C, Gozukara,Y and Sheedy,C (2009a) Characterisation of
priority contaminants in residential wastewater, Water for a Healthy Country National
Research flagship, CSIRO Publishing.
Tjandraatmadja, G, Pollard, C, Gozukara,Y and Sheedy,C (2009b) Investigation of
seasonality effects on domestic wastewater quality, Water for a Healthy Country National
Research flagship, CSIRO Publishing.
Tschan, M, Robinson, B.H and Schulin, R (2009) Antimony in the soil-plant system – a
review, Environmental Science, 6, 106-115.
Tunaley J. (2004) An assessment of a domestic sand filter for greywater treatment. Bachelor
or Applied Science, Environmental Science (Hons) Thesis, School of Applied Sciences,
RMIT University.
USEPA (2009), Antimony compounds, US Environmental Protection Agency,
http://www.epa.gov/ttn/atw/hlthef/antimony.html, last accessed 15/10/2009.
Van Cauwenbergh , R. Hendrix, P, Robberecht, H, Deelstra, H (1997) Daily dietary
molybdenum intake in Belgium using duplicate portion sampling, S. Lebensm Unster
Forsch A, 205, 1-4.
Vinneras, B. (2001) Report 244 - Licentiate thesis: Faecal separation and urine diversion for
nutrient management of household biodegradable waste and wastewater, Swedish
University of Agricultural Science, Uppsala.
Westerhoff, P, Prapaipong, P, Shock, E and Hillaireau, A (2008) Antimony leaching from
polyethylene terephthalate (PET) plastic used for bottled drinking water, Water Research,
42, 551-556.
WHO (2000) Fluorides, Chapter 6.5, World Health Organisation Regional Office,
http://www.euro.who.int/document/aiq/6_5fluorides.pdf, last accessed 12 October 2009.
WHO (2006) Cobalt and inorganic cobalt compounds-concise international assessment
document, no.69, World Health Organisation.

Sources of priority contaminants in domestic wastewater: nutrients and additional elements 68
Yadav, AK, Kaushik, CP, Haritash,AK,Singh, B, Raghuvanshi, S.P, Kansal,A (2007)
Determiantion and probable ingestion of fluoride through tea, toothpaste, tobacco and pan
masala, Journal of Hazardous Materials, 142 (1-2), 77-80.
YVW (2009) Drinking Water Quality Annual Report 2008/09, Yarra Valley Water.

Sources of priority contaminants in domestic wastewater II: nutrients and additional elements
69
APPENDIX 1 – ELEMENTS IN PRODUCTS Table 17: Frequency of element detection in household products analysed
Frequency of detection (%) Product category Number of products tested
Cl Cr Co F Mo Se Sb TKN TP
Cleaning 22 82 55 9.1 9.1 33 18 4.6 91 100
Shower 32 100 59 59 0 25 19 3.1 94 97
Hair dye 6 100 50 0 83 0 0 0 100 100
Oral care 14 86 86 0 79 14 36 7.1 64 100
Deodorant 9 89 33 0 0 44 33 0 44 89
Sunscreen and lotions 16 38 63 6.3 0 13 0 6.3 81 88
Dishwashing 16 81 67 18.8 47 38 0 13 94 100
Laundry 33 88 79 9.1 30 33 30 24 79 100
Toilet paper 8 0 50 38 0 63 0 13 100 100
Total 156 80 64 20 23 29 18 9.6 84 97

Sources of priority contaminants in domestic wastewater: nutrients and additional elements 70
Table 18: Elements in cleaning products
Concentration in product (mg/kg or as stated) Function
Product
ID
Description F
Cl
(g/kg)
Se
Sb
Cr
Co
Mo
TKN (g/kg)
TP (g/kg)
CGE1* Cream Cleanser <34 0.57 0.03 <0.14 0.196 <0.01 <0.15 0.080 0.10
CGE2 Multi-purpose <37 5.58 0.01 <0.04 <0.04 <0.04 <0.04 3.12 0.08
CGE3 Multi-purpose <36 <0.12 <0.1 <0.005 0.01 0.12 <0.005 0.43 0.004
CGE4* Disinfectant <10 39.30 <2 <0.3 0.069 <0.01 <0.02 0.25 0.03
CGE5 Disinfectant <117 42.90 <0.01 <0.01 <0.12 <0.12 <0.12 0.27 0.04
CGE6p Disinfectant <76 1.01 <0.01 <0.01 <0.01 <0.01 <0.01 0.40 0.01
Surface cleaning
CGE7 Disinfectant <11 1.69 <0.01 <0.01 <0.001 <0.127 <0.03 0.69 1.14
CTO1 Toilet Cleaner <22 0.07 <2 <0.3 <0.001 <0.06 <0.03 0.17 0.02
CTO2* Toilet Cleaner <22 0.30 <2 <0.3 0.03 <0.07 <0.01 0.13 0.001
CTO3g Toilet cleaner <1 5.58 <2 <0.3 1.50 <0.005 0.05 3.03 0.06
Toilet cleaning
CTO4p Toilet Cleaner <154 <0.52 <2 <0.3 0.06 <0.02 4 0.10 0.009
CFL1* Floor cleaner 5.5 1.53 <0.006 <0.06 0.01 <0.06 <0.06 <0.04 6.49
CFL3 Floor Cleaner <12 0.73 0.016 <0.05 0.050 <0.005 <0.02 0.10 0.0004
Floor and Surface cleaning
CFL4g Floor and Surface <13 3.15 <2 <0.3 0.017 <3 <0.02 1.97 0.006

Sources of priority contaminants in domestic wastewater: nutrients and additional elements 71
Concentration in product (mg/kg or as stated) Function
Product
ID
Description F
Cl
(g/kg)
Se
Sb
Cr
Co
Mo
TKN (g/kg)
TP (g/kg)
CFL5 Floor cleaner <35 1.62 0.014 0.07 0.069 <0.07 <0.07 nd 0.01
Toilet freshener CTF1* Toilet freshener 38.6 <0.35 <2 <0.3 0.99 <0.02 1 0.001 0.29
CTF2 Toilet freshener <51 6.79 <2 <0.3 0.26 <0.02 <0.03 0.32 0.19
CTF3p Toilet freshener <41 5.84 <0.025mg/L <0.002mg/L 0.33 <0.02 0.09mg/L 3.07 3.00
In cistern freshener CTC1 In cistern toilet
freshener <1,721 166.0 <2 <0.3 0.37 <0.02 0.07 11.20 2.90
CTC2 In cistern toilet freshener <37 <0.37 <2 <0.3 174 <0.04 0.06 1.06 2.57
CTC3 In cistern toilet freshener <32 79.40 <2 <0.3 0.48 <0.02 0.15 35.80 2.00
CTC4p In cistern toilet freshener <4 5.51 <2 <0.3 0.30 3.9 1 268.84 3.08
Note: * market leader, p – private label, g –environmental friendly label, nd – not determined

Sources of priority contaminants in domestic wastewater: nutrients and additional elements 72
Table 19: Elements in laundry products
Concentration in product (mg/kg or as stated) Function
Product ID
Description F
Cl (g/kg)
Se
Sb
Cr
Co
Mo
TKN (g/kg)
TP( g/kg)
LFS1* Fabric softener <8 0.21 <0.006 <0.06 <0.06 <0.01 <0.06 2.35 0.04
LFS2 Fabric softener <0.9 <0.21 <0.9 <0.9 0.32 <0.88 <0.03 1.15 0.17
LFS3 Fabric softener <10 0.13 <2.0 <0.3 <0.01 <0.006 <0.001 0.93 0.04
LFS4p Fabric softener <5 0.13 <0.1mg/L <0.005mg/L 0.01 0.09 <0.03 0.47 0.01
LFS5 Fabric softener <0.3 <0.0001 <0.005 <0.05 3.5 <0.005 0.047 1.03 0.19
LFS6g Fabric softener <61 <0.21 <0.004 <0.04 <0.04 <0.01 <0.04 1.30 0.02
Fabric softener
LFS7 Fabric softener <1.5 5.73 <0.004 <0.04 0.03 <0.01 <0.04 0.87 0.02
LPC1 Top loader concentrate 15 0.07 <1.0 0.2 1.1 <0.005 0.54 0.002 2.10
LPC2 Top loader concentrate 10 2.69 0.37 0.13 0.4 <0.005 <0.03 <0.007 27.60
LPC3* Top loader concentrate 0.5 0.82 <1.0 <0.1 0.21 <0.005 <0.03 0.07 13.05
LPC4 Top loader concentrate 8 1.31 <1.0 <0.3 1.1 <0.005 0.58 0.04 42.31
LPC5 Top loader concentrate 10 1.12 <1.0 <0.1 0.61 <0.005 1 <0.002 24.46
LPC6p Top loader concentrate <87 13.73 0.08 <0.06 0.18 <0.01 <0.06 <0.03 0.96
Laundry powder
LPC7 Top & Front loader concentrate 10 2.00 <1.0 0.2 0.87 <0.005 0.6 0.26 38.05

Sources of priority contaminants in domestic wastewater: nutrients and additional elements 73
Concentration in product (mg/kg or as stated) Function
Product ID
Description F
Cl (g/kg)
Se
Sb
Cr
Co
Mo
TKN (g/kg)
TP( g/kg)
LPC8g Top & Front loader concentrate. 8 1.31 0.037 <0.09 0.28 <0.01 1.065 0.03 0.11
LPC9 Front concentrate <96 6.34 0.046 0.186 1.2 <0.005 1.2 1.83 43.97
LPC10 Front concentrate
14 2.82 <0.09 0.12 0.57 <0.005 0.94 <0.006 34.50
LPC11 Front concentrate
<7 97.03 <1.0 <0.1 0.78 <0.005 1.35 0.03 54.47
LPC12 Front concentrate
<90 1.50 <1.0 <0.1 0.13 <0.01 <0.2 <0.15 12.02
LPC13 Top loader powder <133 224.61 0.056 0.465 0.28 <0.01 <0.47 0.27 5.76
LL1* Laundry liquid <9 0.06 0.57 <0.3 <0.3 <0.005 <0.03 0.09 0.13
LL2 Laundry Liquid <10 0.47 <1.0 <0.3 0.55 0.103 <0.03 0.02 15.30
LL3 Laundry Liquid <9 0.36 <0.025mg/L <0.002mg/L <0.001 <0.005 0.047 1.67 0.16
LL4 Laundry liquid <0.3 3.87 0.057 0.410 0.25 <0.01 <0.04 <0.02 42.53
LL5 Laundry Liquid <0.3 <0.003 0.007 <0.034 0.03 <0.01 <0.03 0.31 0.005
LL6 Laundry Liquid <0.3 7.05 0.08 0.04 0.04 <0.01 <0.04 0.01 39.54
LL7 Laundry Liquid <55 5.47 <0.9 <0.3 3.5 <0.89 <0.03 0.02 46.24
LL8 Laundry Liquid <106 2.13 <0.13 <0.134 0.13 <0.01 <0.134 <0.04 22.72
Laundry liquid
LL11g Laundry Liquid <0.3 0.67 <2.0 <0.3 0.09 <0.01 <0.002 2.78 0.15
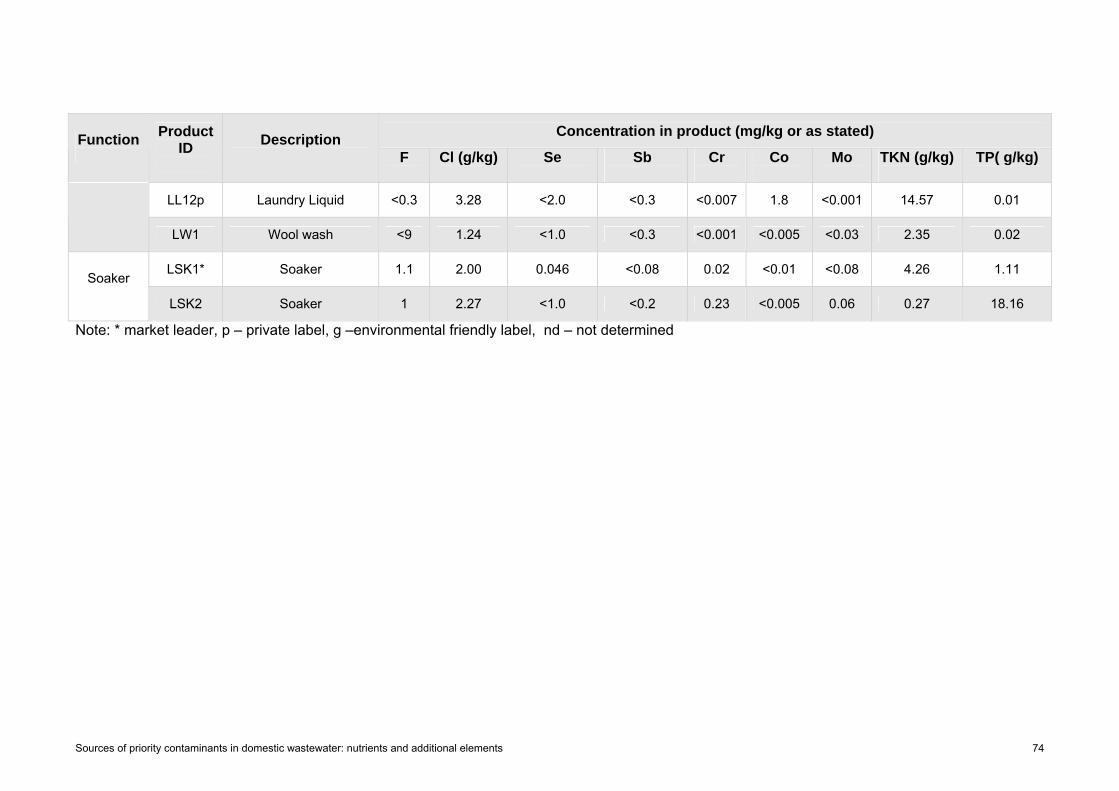
Sources of priority contaminants in domestic wastewater: nutrients and additional elements 74
Concentration in product (mg/kg or as stated) Function
Product ID
Description F
Cl (g/kg)
Se
Sb
Cr
Co
Mo
TKN (g/kg)
TP( g/kg)
LL12p Laundry Liquid <0.3 3.28 <2.0 <0.3 <0.007 1.8 <0.001 14.57 0.01
LW1 Wool wash <9 1.24 <1.0 <0.3 <0.001 <0.005 <0.03 2.35 0.02
LSK1* Soaker 1.1 2.00 0.046 <0.08 0.02 <0.01 <0.08 4.26 1.11 Soaker
LSK2 Soaker 1 2.27 <1.0 <0.2 0.23 <0.005 0.06 0.27 18.16
Note: * market leader, p – private label, g –environmental friendly label, nd – not determined

Sources of priority contaminants in domestic wastewater: nutrients and additional elements 75
Table 20: Elements in toilet paper
Concentration in product (mg/kg or as stated) Function
Product
ID
Description F
Cl
(g/kg)
Se
Sb
Cr
Co
Mo
TKN (g/kg)
TP (g/kg)
TOI1* Toilet paper <13 <0.13 <2.0 <0.4 0.76 <0.005 0.046 0.25 0.019
TOI2 Toilet paper <23 <0.24 <1.0 <0.3 <0.001 <0.005 <0.03 0.43 0.013
TOI3 Toilet paper <13 <0.13 <3.0 <0.5 0.73 <0.005 <0.03 0.61 0.005
TOI4 Toilet paper <12 <0.12 <4.0 <0.6 0.18 0.060 <0.03 0.16 0.006
TOI5p Toilet paper <13 <0.13 <5.0 <0.7 1.8 <0.005 0.035 0.20 0.031
TOI6g Toilet paper recycled <12 <0.11 <6.0 <0.8 1.03 0.242 0.036 0.38 0.017
TOI7g Toilet paper recycled <11 <0.14 <7.0 <0.9 0.8 <0.005 0.29 0.34 0.001
Toilet paper
TOI8 Toilet paper <14 <0.14 <0.08 0.016 0.824 0.085 0.018 0.56 0.011
Note: * market leader, p – private label, g –environmental friendly label, nd – not determined

Sources of priority contaminants in domestic wastewater: nutrients and additional elements 76
Table 21: Elements in sunscreen and other skincare
Concentration in product (mg/kg or as stated) Function
Product
ID
Description F
Cl
(g/kg)
Se
Sb
Cr
Co
Mo
TKN (g/kg)
TP (g/kg)
FCL1 Face Cleanser <0.3 3.85 <0.18 <0.18 0.70 <0.2 <0.18 1.84 0.12 Personal care
FCL2 Face cleanser <0.3 <0.001 <0.1 <0.1 0.47 <0.1 <0.1 <0.0002 <0.0005
SUN1* Sunscreen 30+ <19.8 1.35 <2.0 <0.3 0.11 <0.02 0.13 0.61 0.002
SUN2 Sunscreen 30+ <4.6 0.41 <2.0 <0.3 0.02 <0.01 <0.02 0.02 0.001
SUN3 Sunscreen 30+ <10 Nd <0.37 <0.37 <0.37 <0.37 <0.37 1.01 0.90
SUN4 Sunscreen 30+ <9.8 0.54 <2.0 <0.3 0.06 0.204 0.028 <0.00003 <0.0001
SUN5 Sunscreen 30+ <3.4 <0.03 <2.0 <0.3 0.006 <0.02 <0.04 0.19 0.02
SUN6 Sunscreen 30+ <3.6 8.16 <2.0 <0.3 0.03 <0.01 <0.02 0.21 0.002
Sunscreen
SUN7p Sunscreen 30+ <2.5 <0.03 <2.0 <0.3 0.08 <0.005 <0.02 0.91 <0.0001
CRF1 Face cream <0.3 <0.001 <2.0 <0.3 0.003 <0.03 <0.05 0.39 0.05
CRF2 Face cream <0.3 0.007 <1.0 <0.3 0.002 <0.02 <0.06 3.74 0.07
CRF3p Face cream <4 <0.04 <2.0 <0.3 <2.00 <0.9 <0.02 <0.0001 0.0002
Face cream
CRF4 Face cream <7.1 0.77 <0.4 0.05 0.35 <0.39 <0.4 2.40 0.38
Body and Hand lotion CRB1* Hand and body <3 <0.03 <0.37 <0.37 <0.37 <0.37 <0.37 0.08 0.02

Sources of priority contaminants in domestic wastewater: nutrients and additional elements 77
Concentration in product (mg/kg or as stated) Function
Product
ID
Description F
Cl
(g/kg)
Se
Sb
Cr
Co
Mo
TKN (g/kg)
TP (g/kg)
CRB2 Hand and body <0.3 <0.001 <0.39 <0.39 <0.40 <0.39 <0.39 0.98 0.07
CRB3 Hand and body <0.3 <0.001 <0.3 <0.3 <0.30 <0.3 <0.3 <0.01 0.007
CRB4 Hand and body <1.5 <0.015 <1 <0.3 <0.001 <0.005 <0.03 0.12 0.07
CRB5p Hand and body <3.2 <0.032 <0.4 <0.40 <0.40 <0.4 <0.4 0.22 0.08
Note: * market leader, p – private label, g –environmental friendly label, nd – not determined

Sources of priority contaminants in domestic wastewater: nutrients and additional elements 78
Table 22: Elements in deodorants
Concentration in product (mg/kg or as stated) Function
Product
ID
Description F
Cl (g/kg)
Se
Sb
Cr
Co
Mo
TKN (g/kg)
TP (g/kg)
DEO1A* Aerosol <2.5 126.22 <1.3 <1.3 <2.6 <3.00 <1.3 <0.003 0.08
DEO2A Aerosol <1.0 58.02 0.124 <0.62 <0.62 <0.6 <0.6 0.09 0.18
DEO5Ap Aerosol <8.5 210.40 0.62 <3.09 <3.09 <3.0 <3.09 0.08 0.59
DEO10A Aerosol <7.2 84.14 <0.31 <0.31 1.88 <0.4 0.62 <0.53 1.10
DEO11A Aerosol <1.8 0.09 0.45 <0.3 3.9 <0.6 <0.3 <0.33 <0.13
DER1 Roll-on <4.1 52.12 <0.4 <0.4 <0.4 <0.4 1.18 3.72 0.003
DER2 Roll-on <8.9 27.34 <2.0 <0.3 1.00 <0.04 0.51 <0.39 0.35
DER3 Roll-on <941 <0.0002 <0.32 <0.03 <0.03 <0.3 1.62 3.77 0.35
Deodorant
DER4 Roll-on <2.9 48.2 <2.0 <0.3 0.79 <0.01 <0.02 <0.54 0.96
Note: * market leader, p – private label, g –environmental friendly label, nd – not determined
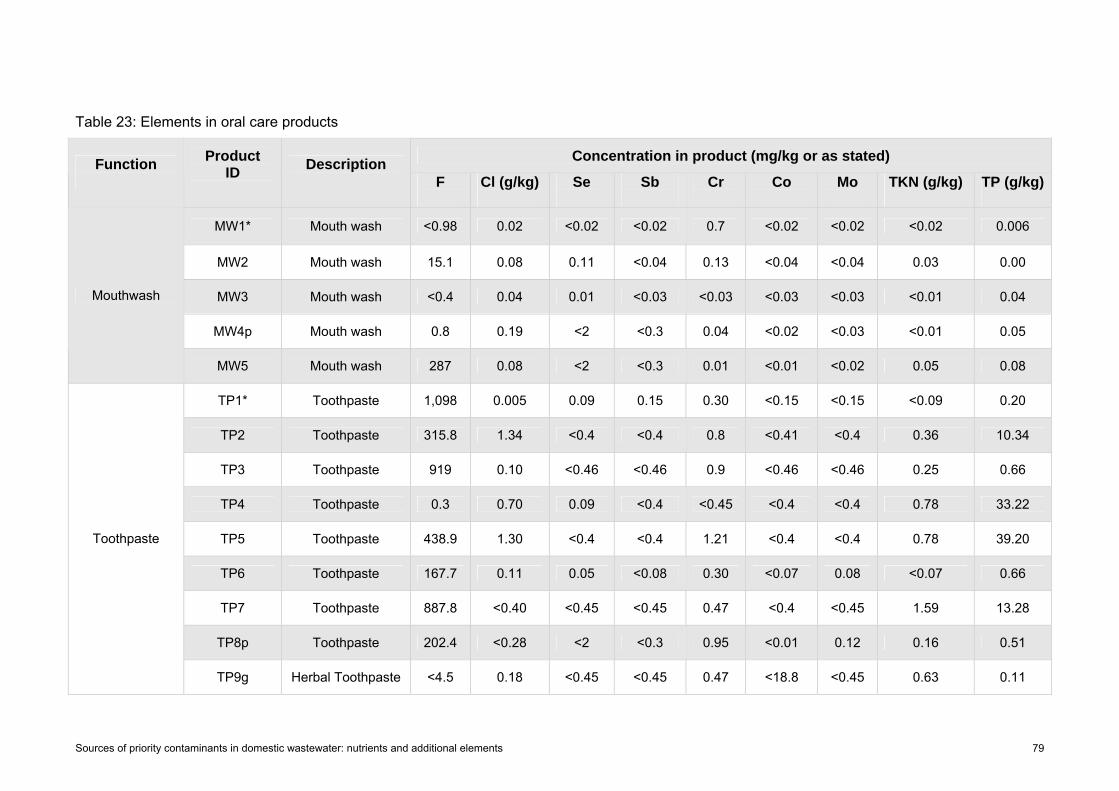
Sources of priority contaminants in domestic wastewater: nutrients and additional elements 79
Table 23: Elements in oral care products
Concentration in product (mg/kg or as stated) Function
Product ID
Description F
Cl (g/kg)
Se
Sb
Cr
Co
Mo
TKN (g/kg)
TP (g/kg)
MW1* Mouth wash <0.98 0.02 <0.02 <0.02 0.7 <0.02 <0.02 <0.02 0.006
MW2 Mouth wash 15.1 0.08 0.11 <0.04 0.13 <0.04 <0.04 0.03 0.00
MW3 Mouth wash <0.4 0.04 0.01 <0.03 <0.03 <0.03 <0.03 <0.01 0.04
MW4p Mouth wash 0.8 0.19 <2 <0.3 0.04 <0.02 <0.03 <0.01 0.05
Mouthwash
MW5 Mouth wash 287 0.08 <2 <0.3 0.01 <0.01 <0.02 0.05 0.08
TP1* Toothpaste 1,098 0.005 0.09 0.15 0.30 <0.15 <0.15 <0.09 0.20
TP2 Toothpaste 315.8 1.34 <0.4 <0.4 0.8 <0.41 <0.4 0.36 10.34
TP3 Toothpaste 919 0.10 <0.46 <0.46 0.9 <0.46 <0.46 0.25 0.66
TP4 Toothpaste 0.3 0.70 0.09 <0.4 <0.45 <0.4 <0.4 0.78 33.22
TP5 Toothpaste 438.9 1.30 <0.4 <0.4 1.21 <0.4 <0.4 0.78 39.20
TP6 Toothpaste 167.7 0.11 0.05 <0.08 0.30 <0.07 0.08 <0.07 0.66
TP7 Toothpaste 887.8 <0.40 <0.45 <0.45 0.47 <0.4 <0.45 1.59 13.28
TP8p Toothpaste 202.4 <0.28 <2 <0.3 0.95 <0.01 0.12 0.16 0.51
Toothpaste
TP9g Herbal Toothpaste <4.5 0.18 <0.45 <0.45 0.47 <18.8 <0.45 0.63 0.11

Sources of priority contaminants in domestic wastewater: nutrients and additional elements 80
Note: * market leader, p – private label, g –environmental friendly label, nd – not determined
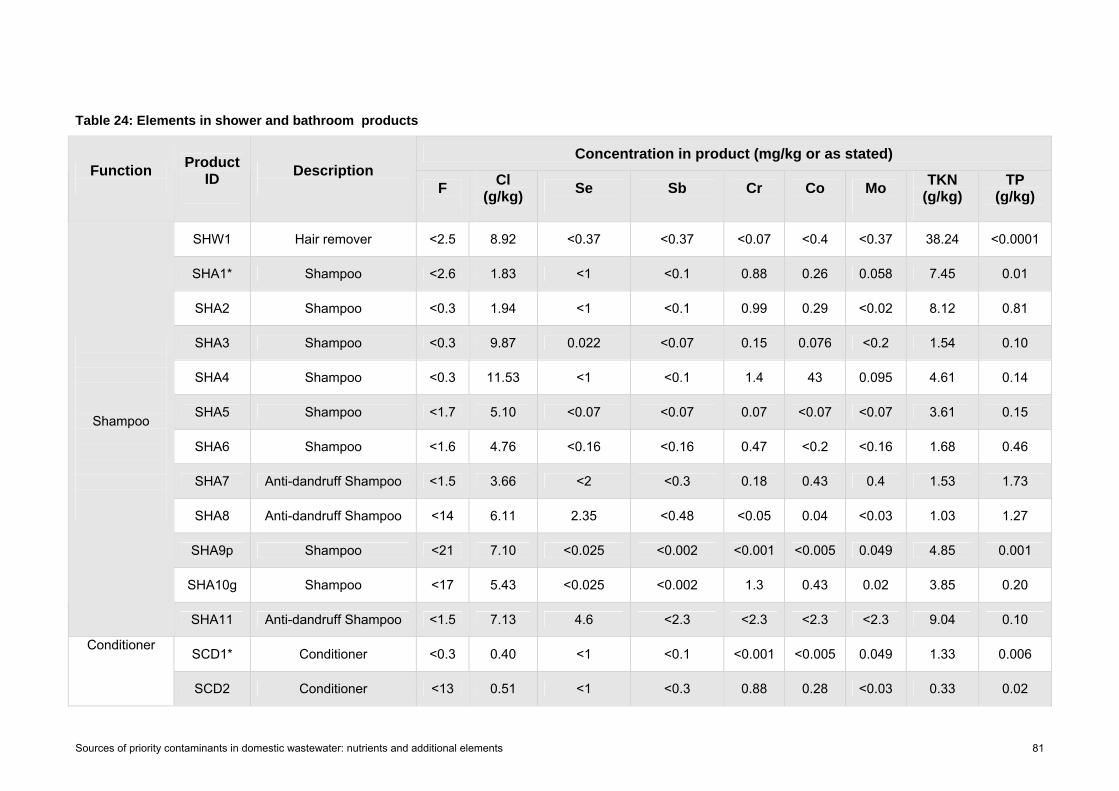
Sources of priority contaminants in domestic wastewater: nutrients and additional elements 81
Table 24: Elements in shower and bathroom products
Concentration in product (mg/kg or as stated) Function
Product
ID
Description F
Cl
(g/kg)
Se
Sb
Cr
Co
Mo
TKN (g/kg)
TP (g/kg)
SHW1 Hair remover <2.5 8.92 <0.37 <0.37 <0.07 <0.4 <0.37 38.24 <0.0001
SHA1* Shampoo <2.6 1.83 <1 <0.1 0.88 0.26 0.058 7.45 0.01
SHA2 Shampoo <0.3 1.94 <1 <0.1 0.99 0.29 <0.02 8.12 0.81
SHA3 Shampoo <0.3 9.87 0.022 <0.07 0.15 0.076 <0.2 1.54 0.10
SHA4 Shampoo <0.3 11.53 <1 <0.1 1.4 43 0.095 4.61 0.14
SHA5 Shampoo <1.7 5.10 <0.07 <0.07 0.07 <0.07 <0.07 3.61 0.15
SHA6 Shampoo <1.6 4.76 <0.16 <0.16 0.47 <0.2 <0.16 1.68 0.46
SHA7 Anti-dandruff Shampoo <1.5 3.66 <2 <0.3 0.18 0.43 0.4 1.53 1.73
SHA8 Anti-dandruff Shampoo <14 6.11 2.35 <0.48 <0.05 0.04 <0.03 1.03 1.27
SHA9p Shampoo <21 7.10 <0.025 <0.002 <0.001 <0.005 0.049 4.85 0.001
SHA10g Shampoo <17 5.43 <0.025 <0.002 1.3 0.43 0.02 3.85 0.20
Shampoo
SHA11 Anti-dandruff Shampoo <1.5 7.13 4.6 <2.3 <2.3 <2.3 <2.3 9.04 0.10
SCD1* Conditioner <0.3 0.40 <1 <0.1 <0.001 <0.005 0.049 1.33 0.006 Conditioner
SCD2 Conditioner <13 0.51 <1 <0.3 0.88 0.28 <0.03 0.33 0.02

Sources of priority contaminants in domestic wastewater: nutrients and additional elements 82
Concentration in product (mg/kg or as stated) Function
Product
ID
Description F
Cl
(g/kg)
Se
Sb
Cr
Co
Mo
TKN (g/kg)
TP (g/kg)
SCD3 Conditioner <20 1.77 <1 0.05 1.3 0.39 <0.03 0.46 1.93
SOB1 Soap bar <66 187.06 <0.9 <0.9 <0.9 <0.9 <0.9 0.06 0.37
SOB2* Soap bar <5.4 18.6 <1.76 <1.76 <1.76 <1.76 <1.76 <0.0001 0.79
SOB3 Soap bar <0.3 1.63 0.280 <0.93 <0.93 <0.9 <0.93 <0.0001 0.38
SOB4 Soap bar <4 115.4 0.39 <1.95 <1.9 <1.9 <1.95 0.03 2.52
SOB5g Soap bar <6 92.59 0.280 <0.124 <1.24 <1.2 <1.24 0.10 0.0003
Soap bar
SOB6p Soap bar <6 121.49 0.327 <1.95 <1.95 <1.95 <1.95 0.05 1.02
SOC1 Hand wash <2 8.56 <0.025mg/L <0.002mg/L 1 0.33 <0.03 1.85 0.06
SOC2* Hand wash <2.2 2.71 <2 <0.3 1.2 <0.08 <0.08 3.14 75.03
SOC3 Hand wash <0.3 4.82 <1 <0.3 1.2 0.39 <0.03 0.66 0.004
SOC4p Hand wash <2.5 21.85 <2 <0.3 <0.02 2.5 <0.02 1.72 0.10
Hand wash
SOC5 Handwash <3 8.79 <0.025mg/L <0.002mg/L 1 0.32 0.02 1.83 0.03
SOG1 Body wash <1.5 0.03 <2 <0.3 0.011 4.9 <0.04 1.70 0.01 Body wash
gel SOG2 Body wash <1.5 0.02 <2 <0.3 <0.02 4.5 <0.03 2.01 0.0001

Sources of priority contaminants in domestic wastewater: nutrients and additional elements 83
Concentration in product (mg/kg or as stated) Function
Product
ID
Description F
Cl
(g/kg)
Se
Sb
Cr
Co
Mo
TKN (g/kg)
TP (g/kg)
SOG3 Body wash <13 13.75 <1 <0.3 1.2 0.35 0.02 2.37 0.04
SOG4g Body wash <2.2 29.08 <2 <0.3 0.02 2.2 <0.01 3.41 0.002
FCL1 Face Cleanser <0.3 3.85 <0.18 <0.18 0.7 <0.2 <0.18 1.84 0.12 Personal care
FCL2 Face cleanser <0.3 <0.001 <0.1 <0.1 0.47 <0.1 <0.1 <0.0002 <0.0005
SHV1p Shave Foam <1.8 4.43 <2 <0.3 <0.01 <0.005 <0.001 2.16 0.02
SHV2* Shave foam <0.3 0.19 <2 <0.3 <0.01 <0.005 <0.001 4.19 0.02
SHV3p Shave foam <7.6 1.38 <1.2 <1.2 <1.2 <1.2 <1.2 1.99 0.01
SHV4 Shave stick <74.9 16.48 <15 <15 <15 <15 <15 0.45 0.08
Shaving products
SHV5 Shave foam <3.4 16.84 <3 <3 <3 <3 <3 0.09 <0.02
HAI5 Hair dye 16 2.70 <0.19 <0.19 0.19 <0.19 <0.19 10.03 1.02
HAI6 Hair dye 13.2 1.29 <0.22 <0.22 0.22 <0.22 <0.22 7.00 0.78
HAI7 Hair dye 26.5 1.38 <0.14 <0.14 0.14 <0.14 <0.14 11.48 0.09
HAI8 Hair dye 2.5 0.10 <2.2 <2.2 <2.2 <2.2 <5.1 7.56 0.04
Hair colour
HAI9 Hair dye 2.7 3.56 <6.6 <6.6 <6.6 <6.6 <6.6 10.77 0.20
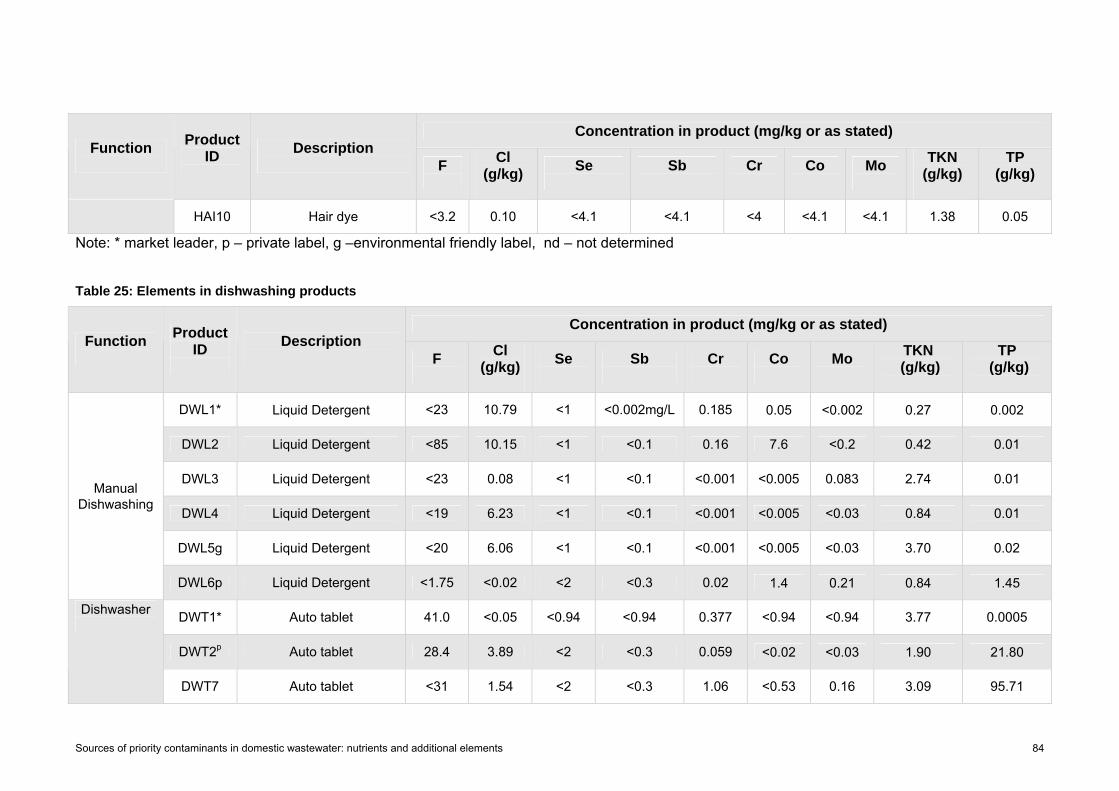
Sources of priority contaminants in domestic wastewater: nutrients and additional elements 84
Concentration in product (mg/kg or as stated) Function
Product
ID
Description F
Cl
(g/kg)
Se
Sb
Cr
Co
Mo
TKN (g/kg)
TP (g/kg)
HAI10 Hair dye <3.2 0.10 <4.1 <4.1 <4 <4.1 <4.1 1.38 0.05
Note: * market leader, p – private label, g –environmental friendly label, nd – not determined
Table 25: Elements in dishwashing products
Concentration in product (mg/kg or as stated) Function
Product
ID
Description F
Cl
(g/kg)
Se
Sb
Cr
Co
Mo
TKN (g/kg)
TP (g/kg)
DWL1* Liquid Detergent <23 10.79 <1 <0.002mg/L 0.185 0.05 <0.002 0.27 0.002
DWL2 Liquid Detergent <85 10.15 <1 <0.1 0.16 7.6 <0.2 0.42 0.01
DWL3 Liquid Detergent <23 0.08 <1 <0.1 <0.001 <0.005 0.083 2.74 0.01
DWL4 Liquid Detergent <19 6.23 <1 <0.1 <0.001 <0.005 <0.03 0.84 0.01
DWL5g Liquid Detergent <20 6.06 <1 <0.1 <0.001 <0.005 <0.03 3.70 0.02
Manual Dishwashing
DWL6p Liquid Detergent <1.75 <0.02 <2 <0.3 0.02 1.4 0.21 0.84 1.45
DWT1* Auto tablet 41.0 <0.05 <0.94 <0.94 0.377 <0.94 <0.94 3.77 0.0005
DWT2p Auto tablet 28.4 3.89 <2 <0.3 0.059 <0.02 <0.03 1.90 21.80
Dishwasher
DWT7 Auto tablet <31 1.54 <2 <0.3 1.06 <0.53 0.16 3.09 95.71

Sources of priority contaminants in domestic wastewater: nutrients and additional elements 85
Concentration in product (mg/kg or as stated) Function
Product
ID
Description F
Cl
(g/kg)
Se
Sb
Cr
Co
Mo
TKN (g/kg)
TP (g/kg)
DWT3p Auto tablet 0.7 1.21 <1 <0.1 1 <0.005 0.47 3.22 97.70
DWT4 Auto powder 5.6 2.67 <2 <0.3 <4.6 <4.6 0.16 0.95 53.39
DWT5 Auto powder 16 2.03 0.85 0.82 0.55 <0.01 <0.03 0.93 49.31
DWT6g Auto powder 0.5 0.18 <2 <0.3 0.11 <0.01 <0.002 3.69 0.01
DWT8p Auto powder 17.12 46.64 <1 0.1 0.9 <0.1 0.2 0.03 8.34
Rinse aid DWA1 Rinse aid <0.3 0.07 <2 <0.3 <0.03 <0.01 <0.02 <0.02 0.08
Note: * market leader, p – private label, g –environmental friendly label, nd – not determined

Sources of priority contaminants in domestic wastewater: nutrients and additional elements 86
Table 26: Summary of element concentration in products
Element Function
Summary statistics
Units F
Cl
(g/kg)
Se
Sb
Cr
Co
Mo
TKN (g/kg)
TP (g/kg)
Surface cleaning Mean mg/kg<117 13.01 0.006 <0.3 0.039 0.017 <0.15 0.75 0.20
SD mg/kg0 19.31 0.011 0 0.074 0.045 0 1.06 0.41
Median mg/kg<35.5 1.69 <2 <0.1 <0.04 <0.04 <0.03 0.40 0.04
Number of brands
7 7 7 7 7 7 7 7 7
Toilet cleaning Mean mg/kg<154 1.49 <2 <0.3 0.398 <0.07 1.01 0.86 0.02
SD mg/kg0 2.73 0 0 0.735 0 1.99 1.45 0.03
Median mg/kg<22 0.18 <2 <0.3 0.045 <0.04 0.03 0.15 0.01
Number of brands
4 4 4 4 4 4 4 4 4
Floor and surface cleaning Mean mg/kg1.4 1.42 0.58 0.58 0.704 0.571 0.86 0.61 0.94
SD mg/kg2.4 1.21 1.51 1.51 1.48 1.512 1.57 0.87 2.45
Median mg/kg<13 1.53 <0.01 <0.06 0.05 <0.06 <0.06 0.13 0.01
Number of brands
4 4 4 4 4 4 4 3 4
Toilet fresheners Mean mg/kg5.5 37.65 <2 <0.3 25.3 0.557 0.34 45.76 2.01
SD mg/kg14.6 63.31 0 0 65.6 1.474 0.45 99.20 1.26

Sources of priority contaminants in domestic wastewater: nutrients and additional elements 87
Element Function
Summary statistics
Units F
Cl
(g/kg)
Se
Sb
Cr
Co
Mo
TKN (g/kg)
TP (g/kg)
Median mg/kg<39 5.84 <2 <0.3 0.37 <0.2 0.09 3.07 2.57
Number of brands
7 7 7 7 7 7 7 7 7
Fabric softeners Mean mg/kg<61 0.89 <2 <0.9 0.55 0.01 0.01 1.16 0.07
SD mg/kg0 2.14 0 0 1.31 0.03 0.02 0.59 0.08
Median mg/kg<5 0.13 <0.006 <0.05 0.01 <0.01 <0.04 1.03 0.04
Number of brands
7 7 7 7 7 7 7 7 7
Laundry liquid Mean mg/kg<19 2.34 0.071 0.05 0.46 0.19 0.0047 1.95 16.68
SD mg/kg0 2.50 0.178 0.13 1.08 0.57 0.015 4.53 19.66
Median mg/kg<5 1.40 <0.35 <0.30 0.06 <0.01 <0.030 0.06 7.73
Number of brands
10 10 10 10 10 10 10 10 10
Laundry powder Mean mg/kg5.8 27.34 0.05 0.10 0.60 0 0.56 0.20 23.03
SD mg/kg5.9 64.81 0.10 0.14 0.38 0 0.52 0.50 18.59
Median mg/kg8 2.00 0 0 0.57 0 0.58 0.03 0.03
Number of brands
13 13 13 13 13 13 13 13 13

Sources of priority contaminants in domestic wastewater: nutrients and additional elements 88
Element Function
Summary statistics
Units F
Cl
(g/kg)
Se
Sb
Cr
Co
Mo
TKN (g/kg)
TP (g/kg)
Soaker Mean mg/kg1.05 2.13 0.023 <0.14 0.13 <0.01 0.03 2.27 9.63
SD mg/kg0.1 0.19 0.032 0 0.15 0 0.04 2.82 12.06
Median mg/kg1.05 2.13 0.023 <0.14 0.13 <0.008 0.03 2.27 9.63
Number of brands
2 2 2 2 2 2 2 2 2
Toilet paper Mean mg/kg<23 <0.24 <7 0.002 0.77 0.05 0.053 0.37 0.01
SD mg/kg0 0 0 0.006 0.54 0.085 0.097 0.16 0.001
Median mg/kg<13 <0.13 <4 <0.6 0.78 <0.01 0.03 0.36 0.01
Number of brands
8 8 8 8 8 8 8 8 8
Sunscreen Mean mg/kg<7.7 1.74 <1.8 <0.3 0.04 0.029 0.023 0.42 0.13
SD mg/kg0 3.18 0 0 0.04 0.077 0.049 0.419 0.337
Median mg/kg<4.6 0.48 <2 <0.3 0.03 <0.02 <0.03 0.21 0.002
Number of brands
7 6 7 7 7 7 7 7 7
Face cream Mean mg/kg<7.7 0.19 <1.8 0.013 0.089 0.03 <0.13 1.63 0.13
SD mg/kg0 0.383 0 0.025 0.174 0 0 1.756 0.171

Sources of priority contaminants in domestic wastewater: nutrients and additional elements 89
Element Function
Summary statistics
Units F
Cl
(g/kg)
Se
Sb
Cr
Co
Mo
TKN (g/kg)
TP (g/kg)
Median mg/kg<4.6 0.004 <2 <0.3 0.003 <0.02 <0.06 1.40 0.06
Number of brands
4 4 4 4 4 4 4 4 4
Hand & body lotion Mean mg/kg<1.7 <0.03 <1 <0.4 <0.4 <0.4 <0.4 0.28 0.05
SD mg/kg0 0 0 0 0 0 0 0.399 0.034
Median mg/kg<1.5 <0.015 <0.4 <0.4 <0.4 <0.4 <0.4 0.12 0.068
Number of brands
5 5 5 5 5 5 5 5 5
Deodorant Mean mg/kg<941 67.39 0.13 <0.7 0.84 <3 0.44 0.85 0.40
SD mg/kg0 66.67 0.24 0 1.32 0 0.61 1.64 0.407
Median mg/kg<4.1 52.12 <0.3 <0.3 <1 <0.4 <0.6 <0.39 0.35
Number of brands
9 9 9 9 9 9 9 9 9
Toothpaste Mean mg/kg448 0.42 0.02 0.02 1 <19 0.02 0.51 10.91
SD mg/kg417.7 0.556 0.04 0.05 0.39 0 0.04 0.508 15.22
Median mg/kg316 0.11 <0.4 <0.4 <0.5 <0.4 <0.4 0.36 0.66
Number of brands
9 9 9 9 9 9 9 9 9

Sources of priority contaminants in domestic wastewater: nutrients and additional elements 90
Element Function
Summary statistics
Units F
Cl
(g/kg)
Se
Sb
Cr
Co
Mo
TKN (g/kg)
TP (g/kg)
Mouthwash Mean mg/kg60.6 0.08 0.023 <0.04 0.177 <0.7 <0.04 0.02 0.04
SD mg/kg126.7 0.065 0.047 0 0.296 0 0 0.022 0.032
Median mg/kg0.8 0.08 <0.1 <0.04 0.044 <0.03 <0.03 <0.01 0.04
Number of brands
5 5 5 5 5 5 5 5 5
Shampoo Mean mg/kg<21 5.86 0.63 <0.5 0.49 4.05 0.06 4.30 0.45
SD mg/kg0 2.999 1.49 0 0.55 12.92 0.12 2.8 5 0.576
Median mg/kg<2 5.43 <1 <0.1 0.18 0.076 <0.06 3.85 0.15
Number of brands
11 11 11 11 11 11 11 11 11
Conditioner Mean mg/kg<20 0.90 <1 0.02 0.73 0.22 0.02 0.70 0.65
SD mg/kg0 0.762 0 0.03 0.66 0.20 0.03 0.54 1.11
Median mg/kg<13 0.51 <1 <0.1 0.88 0.28 <0.03 0.46 0.02
Number of brands
3 3 3 3 3 3 3 3 3
Soap bar Mean mg/kg<66 89.48 0.21 <2 <2 <2 <2 0.041 0.85
SD mg/kg0 69.23 0.17 0 0 0 0 0.038 0.895

Sources of priority contaminants in domestic wastewater: nutrients and additional elements 91
Element Function
Summary statistics
Units F
Cl
(g/kg)
Se
Sb
Cr
Co
Mo
TKN (g/kg)
TP (g/kg)
Median mg/kg<15 104.01 0.28 <1.4 <1.5 <1.5 <1.1 0.041 0.58
Number of brands
6 6 6 6 6 6 6 6 6
Hand wash Mean mg/kg<3 9.35 <2 <0.3 0.88 0.71 0.004 1.84 15.05
SD mg/kg0 7.45 0 0 0.50 1.01 0.009 0.88 33.53
Median mg/kg<2.2 8.56 <2 <0.3 1 0.33 <0.03 1.83 0.06
Number of brands
5 5 5 5 5 5 5 5 5
Body wash Mean mg/kg<13 10.72 <2 0.3 0.31 2.99 0.005 2.37 0.01
SD mg/kg0 13.85 0 0 0.59 2.12 0.01 0.75 0.02
Median mg/kg<2 6.89 <2 <0.3 0.02 3.35 0 2.19 0.006
Number of brands
4 4 4 4 4 4 4 4 4
Shaving Mean mg/kg<75 7.86 <5 <1.2 <15 <15 <15 1.78 0.03
SD mg/kg0 8.18 0 0 0 0 0 1.63 0.03
Median mg/kg<8 4.43 <2 <0.3 <1.2 <1.2 <1.2 1.99 0.02
Number of brands
5 5 5 5 5 5 5 5 5
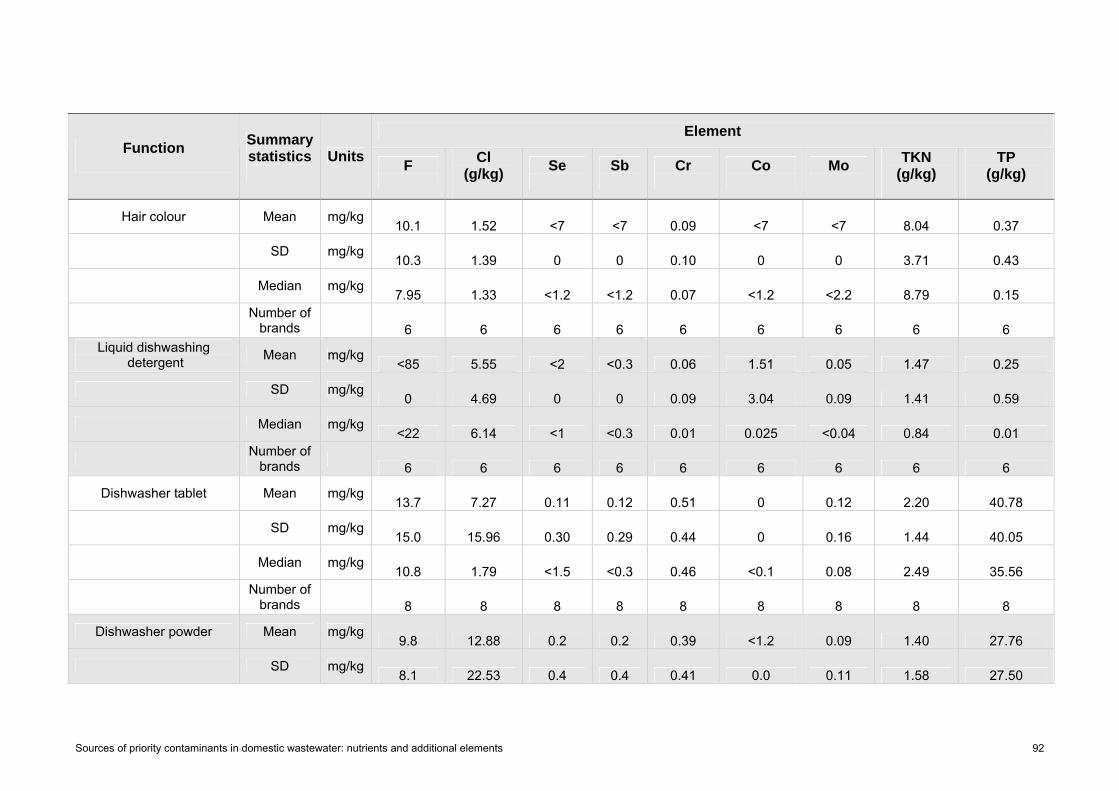
Sources of priority contaminants in domestic wastewater: nutrients and additional elements 92
Element Function
Summary statistics
Units F
Cl
(g/kg)
Se
Sb
Cr
Co
Mo
TKN (g/kg)
TP (g/kg)
Hair colour Mean mg/kg10.1 1.52 <7 <7 0.09 <7 <7 8.04 0.37
SD mg/kg10.3 1.39 0 0 0.10 0 0 3.71 0.43
Median mg/kg7.95 1.33 <1.2 <1.2 0.07 <1.2 <2.2 8.79 0.15
Number of brands
6 6 6 6 6 6 6 6 6 Liquid dishwashing
detergent Mean mg/kg<85 5.55 <2 <0.3 0.06 1.51 0.05 1.47 0.25
SD mg/kg0 4.69 0 0 0.09 3.04 0.09 1.41 0.59
Median mg/kg<22 6.14 <1 <0.3 0.01 0.025 <0.04 0.84 0.01
Number of brands
6 6 6 6 6 6 6 6 6
Dishwasher tablet Mean mg/kg13.7 7.27 0.11 0.12 0.51 0 0.12 2.20 40.78
SD mg/kg15.0 15.96 0.30 0.29 0.44 0 0.16 1.44 40.05
Median mg/kg10.8 1.79 <1.5 <0.3 0.46 <0.1 0.08 2.49 35.56
Number of brands
8 8 8 8 8 8 8 8 8
Dishwasher powder Mean mg/kg9.8 12.88 0.2 0.2 0.39 <1.2 0.09 1.40 27.76
SD mg/kg8.1 22.53 0.4 0.4 0.41 0.0 0.11 1.58 27.50

Sources of priority contaminants in domestic wastewater: nutrients and additional elements 93
Element Function
Summary statistics
Units F
Cl
(g/kg)
Se
Sb
Cr
Co
Mo
TKN (g/kg)
TP (g/kg)
Median mg/kg10.8 2.35 0.0 0.1 0.33 <0.1 0.08 0.94 28.83
Number of brands
4 4 4 4 4 4 4 4 4

Sources of priority contaminants in domestic wastewater II: nutrients and additional elements
94
APPENDIX 2 – PRODUCT CONTRIBUTION TO ELEMENTAL LOADS FROM A SINGLE PERSON HOUSEHOLD
The elemental mass loads shown in this section were estimated from the typical product consumption for a single person household in Melbourne, as specified in section 3.2.6.
Table 27: Major antimony loads from household products
Product type Maximum Sb weekly load (mg/pe/week)
Toilet paper 0.0001
Floor cleaner 0.001
Facial lotion 0.002
Conditioner 0.003
Toothpaste 0.006
Dishwashing powder 0.088
Laundry liquid 0.111
Laundry powder 0.176
Table 28: Major chloride loads from household products
Product type Maximum Cl weekly load (mg/pe/week)
Cream cleanser 6
Depilatory 27
Mouthwash 45
Floor cleaner 47
Hair colouring 53
Facial lotion 54
Toothpaste 56
Multi-purpose 56
Roll-on deodorant 73
Facial Cleanser 81
Toilet cleaner 84
Conditioner 94
Dishwashing tablet 140
Aerosol deodorant 294
Shampoo 307
Shaving foam 354
Disinfectant 429
Sunscreen 571
Laundry soaker 611
Dishwashing liquid 793

Sources of priority contaminants in domestic wastewater: nutrients and additional elements 95
Product type Maximum Cl weekly load (mg/pe/week)
Dishwashing powder 1,678
Toilet freshener 1,396
Body wash 1,083
Fabric softener 1,290
Hand wash 1,835
Laundry liquid 1,904
Soap 15,713
In-cistern 34,162
Laundry powder 84,901
Table 29: Major cobalt loads from household products
Product type Maximum Co weekly load (mg/pe/week)
Multi-purpose 0.001
Toilet paper 0.002
Sunscreen 0.014
Facial Cleanser 0.015
Fabric softener 0.020
Shampoo 0.037
Body wash 0.045
Conditioner 0.069
Hand wash 0.10
Laundry liquid 0.49
Dishwashing liquid 0.56
In-cistern 0.80
Table 30: Major chromium loads from household products
Product type Maximum weekly Cr load (mg/pe/week)
Multi-purpose 0.0001
Floor cleaner 0.0008
Toilet cleaner 0.012
Disinfectant 0.001
Roll-on deodorant 0.001
Hair colouring 0.003
Aerosol deodorant 0.005
Sunscreen 0.008
Toilet paper 0.009
Shampoo 0.037

Sources of priority contaminants in domestic wastewater: nutrients and additional elements 96
Product type Maximum weekly Cr load (mg/pe/week)
Toilet cleaner 0.012
Facial Cleanser 0.045
Dishwashing liquid 0.014
Cream cleanser 0.015
Facial lotion 0.025
Body lotion 0.026
Body wash 0.045
Laundry soaker 0.062
Hand wash 0.051
Toothpaste 0.051
Conditioner 0.069
Dishwashing tablet 0.038
Mouthwash 0.167
Dishwashing powder 0.194
Toilet freshener 0.204
Laundry powder 0.288
Fabric softener 0.788
Laundry liquid 0.945
In-cistern 35.8
Table 31: Major fluoride loads from household products
Product type Maximum weekly F load (mg/pe/week)
Floor cleaner 0.08
Laundry soaker 0.3
Hair colouring 0.4
Dishwashing tablet 1.5
Dishwashing powder 1.7
Laundry powder 3.5
Toilet freshener 7.9
Toothpaste 46.1
Mouthwash 68.3

Sources of priority contaminants in domestic wastewater: nutrients and additional elements 97
Table 32: Major molybdenum loads from household products
Product type Maximum Mo weekly load (mg/pe/week)
Aerosol deodorant 0.001
Hand wash 0.002
Toilet paper 0.002
Roll-on deodorant 0.002
Conditioner 0.003
Toothpaste 0.005
Body wash 0.007
Sunscreen 0.009
Shampoo 0.011
Toilet cleaner 0.060
Fabric softener 0.011
Laundry liquid 0.013
Dishwashing liquid 0.015
Laundry soaker 0.016
Dishwashing tablet 0.017
Dishwashing powder 0.017
Toilet freshener 0.206
In-cistern 0.206
Laundry powder 0.323
Table 33: Major selenium loads from household products
Product type Maximum Se weekly load (mg/pe/week)
Multi-purpose 0.0001
Aerosol deodorant 0.0009
Laundry soaker 0.0124
Cream cleanser 0.0003
Floor cleaner 0.0002
Toothpaste 0.0037
Mouthwash 0.0256
Soap 0.0328
Laundry powder 0.0887
Shampoo 0.122 (anti-dandruff)
Laundry liquid 0.1539

Sources of priority contaminants in domestic wastewater: nutrients and additional elements 98
Table 34: Major total Kjeldahl nitrogen loads from household products
Product type Maximum TKN weekly load (mg/pe/week)
Aerosol deodorant 0.1
Cream cleanser 0.8
Toilet paper 5.1
Roll-on deodorant 5.3
Disinfectant 6.9
Soap 8.3
Mouthwash 11.1
Hair colouring 15.3
Floor cleaner 29.5
Multi-purpose 31.2
Facial Cleanser 38.6
Toilet cleaner 45.5
Toothpaste 66.9
Body lotion 68.6
Sunscreen 70.4
Conditioner 70.6
Shaving foam 88
Depilatory 115
Body wash 127
Facial lotion 131
Dishwashing powder 133
Dishwashing tablet 136
Shampoo 216
Dishwashing liquid 212
Hand wash 264
Laundry powder 438
Fabric softener 529
Toilet freshener 633
Laundry soaker 1,150
Laundry liquid 3,933
In-cistern 4,033
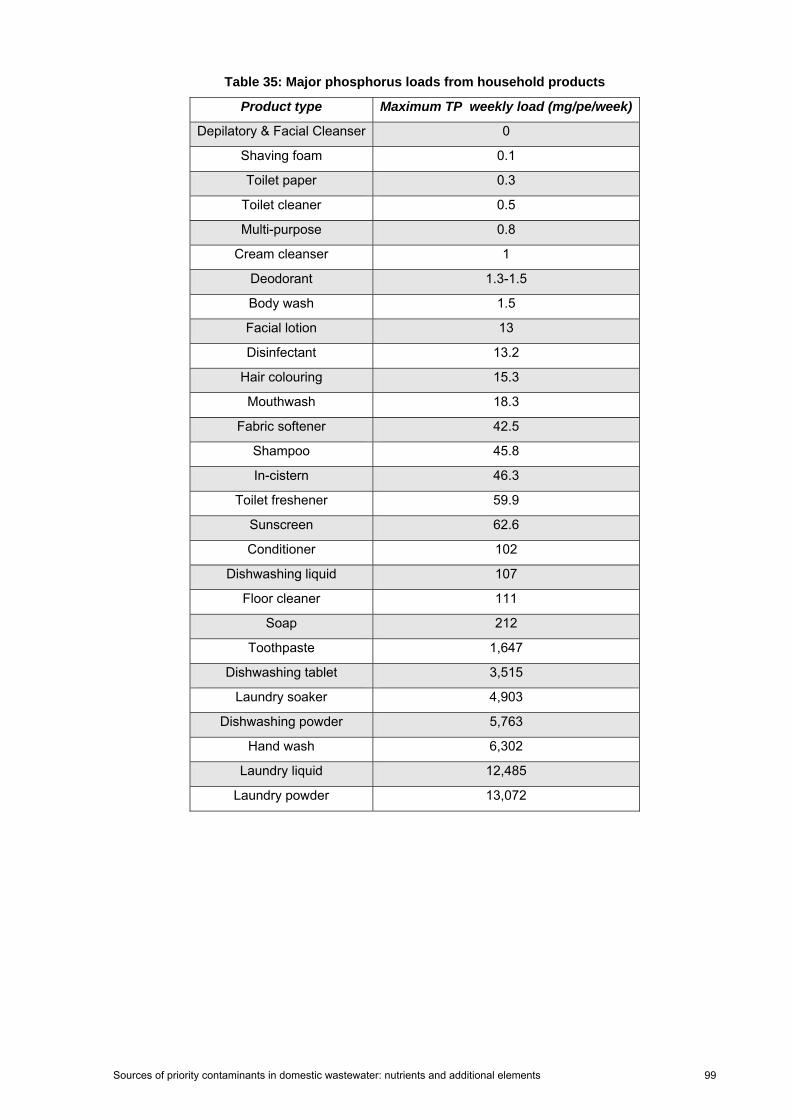
Sources of priority contaminants in domestic wastewater: nutrients and additional elements 99
Table 35: Major phosphorus loads from household products
Product type Maximum TP weekly load (mg/pe/week)
Depilatory & Facial Cleanser 0
Shaving foam 0.1
Toilet paper 0.3
Toilet cleaner 0.5
Multi-purpose 0.8
Cream cleanser 1
Deodorant 1.3-1.5
Body wash 1.5
Facial lotion 13
Disinfectant 13.2
Hair colouring 15.3
Mouthwash 18.3
Fabric softener 42.5
Shampoo 45.8
In-cistern 46.3
Toilet freshener 59.9
Sunscreen 62.6
Conditioner 102
Dishwashing liquid 107
Floor cleaner 111
Soap 212
Toothpaste 1,647
Dishwashing tablet 3,515
Laundry soaker 4,903
Dishwashing powder 5,763
Hand wash 6,302
Laundry liquid 12,485
Laundry powder 13,072

Sources of priority contaminants in domestic wastewater: nutrients and additional elements 100
APPENDIX 3 – COMPARISON OF HOUSEHOLD LOAD SCENARIOS
0.00
0.10
0.20
0.30
0.40
WW1(m
ax)
WW1(m
ed)
WW2(m
ax)
WW2(m
ed)
WW3(e
nv)
Was
tew
ater
load
(mg/
pe/w
k)
Sb
Figure 24: Antimony loads generated by household product use in a 1 person household.
0
50,000
100,000
150,000
WW1(m
ax)
WW1(m
ed)
WW2(m
ax)
WW2(m
ed)
WW3(e
nv)
Was
tew
ater
load
(mg/
pe/w
k)
Cl
Figure 25: Chloride loads generated by household product use in a 1 person household.
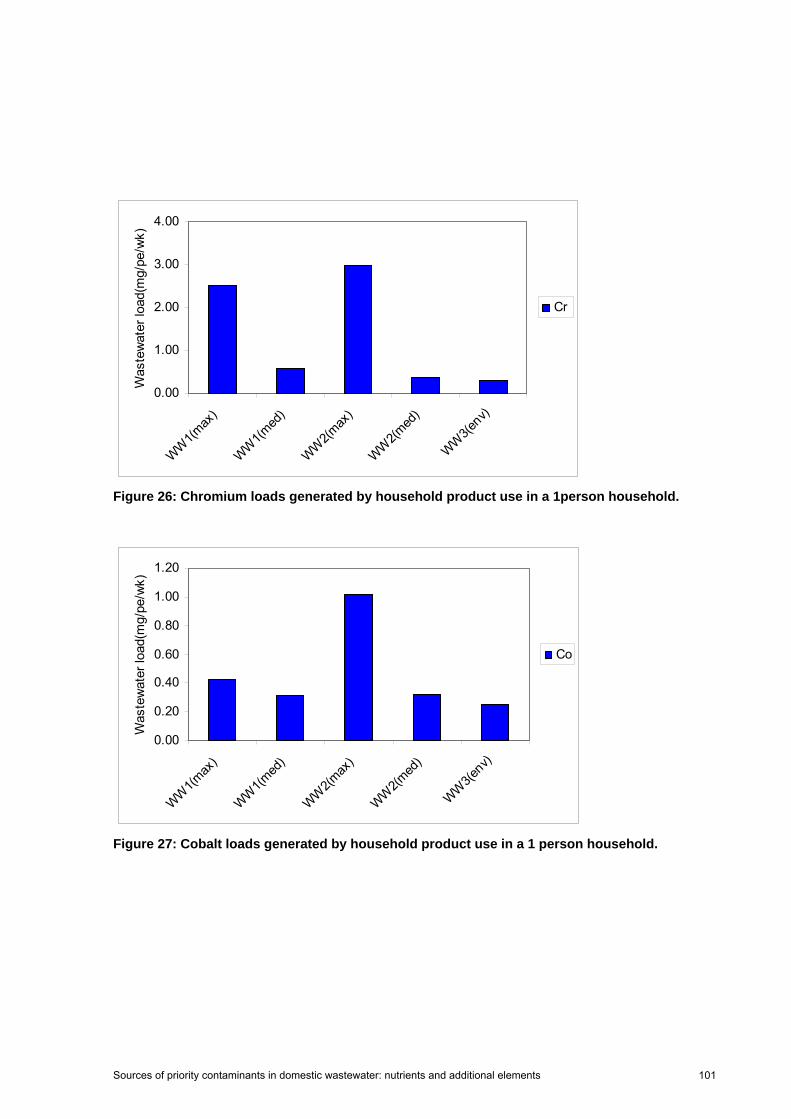
Sources of priority contaminants in domestic wastewater: nutrients and additional elements 101
0.00
1.00
2.00
3.00
4.00
WW1(m
ax)
WW1(m
ed)
WW2(m
ax)
WW2(m
ed)
WW3(e
nv)
Was
tew
ater
load
(mg/
pe/w
k)
Cr
Figure 26: Chromium loads generated by household product use in a 1person household.
0.00
0.20
0.40
0.60
0.80
1.00
1.20
WW1(m
ax)
WW1(m
ed)
WW2(m
ax)
WW2(m
ed)
WW3(e
nv)
Was
tew
ater
load
(mg/
pe/w
k)
Co
Figure 27: Cobalt loads generated by household product use in a 1 person household.

Sources of priority contaminants in domestic wastewater: nutrients and additional elements 102
0.00
0.50
1.00
1.50
WW1(m
ax)
WW1(m
ed)
WW2(m
ax)
WW2(m
ed)
WW3(e
nv)
Was
tew
ater
load
(mg/
pe/w
k)
Mo
y
Figure 28: Molybdenum loads generated by household product use in a 1 person household.
0.00
0.20
0.40
0.60
0.80
1.00
WW1(max) WW1(med) WW2(max) WW2(med) WW3(env)
Was
tew
ater
load
(mg/
pe/w
k)
Se
Figure 29: Selenium loads generated by household product use in a 1 person household.
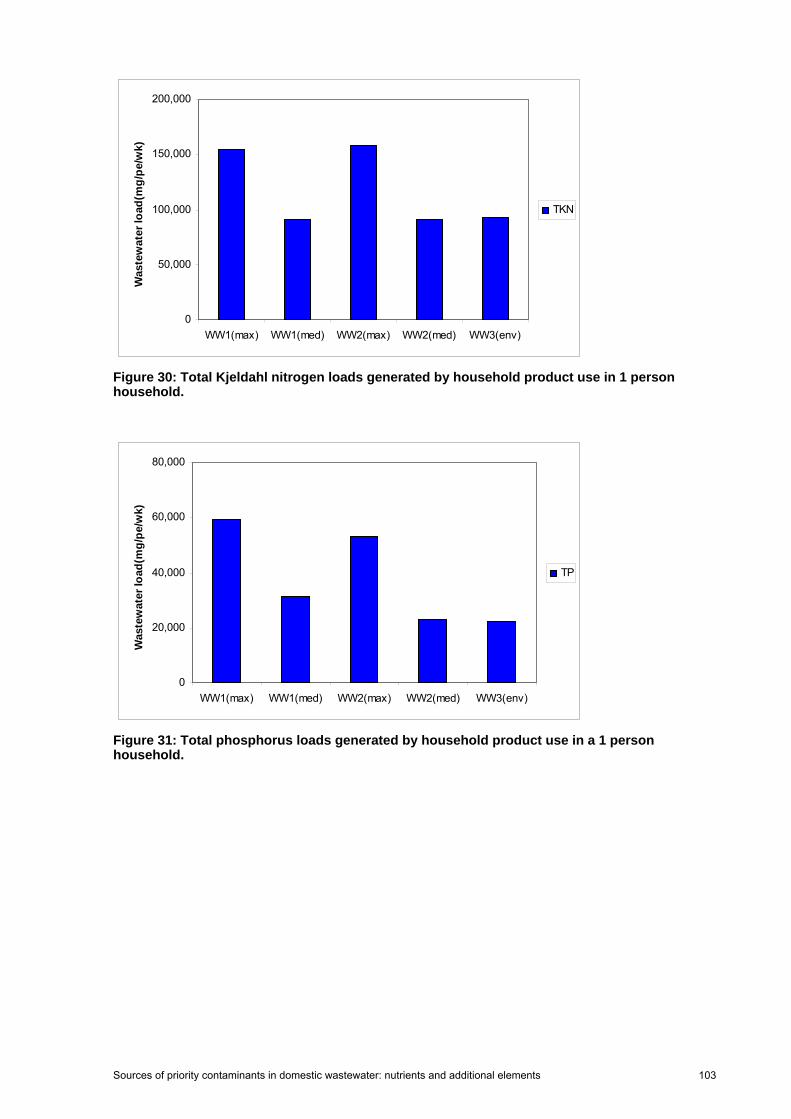
Sources of priority contaminants in domestic wastewater: nutrients and additional elements 103
0
50,000
100,000
150,000
200,000
WW1(max) WW1(med) WW2(max) WW2(med) WW3(env)
Was
tew
ater
load
(mg/
pe/w
k)
TKN
Figure 30: Total Kjeldahl nitrogen loads generated by household product use in 1 person household.
0
20,000
40,000
60,000
80,000
WW1(max) WW1(med) WW2(max) WW2(med) WW3(env)
Was
tew
ater
load
(mg/
pe/w
k)
TP
Figure 31: Total phosphorus loads generated by household product use in a 1 person household.