Sources of backscatter at 5.3GHz from a superimposed ice ... · PDF fileusing the software...
11
Sources of backscatter at 5.3 GHz from a superimposed ice and firn area revealed by multi-frequency GPR and cores Kirsty LANGLEY, 1* Pascal LACROIX, 2 Svein-Erik HAMRAN, 1 Ola BRANDT 3{ 1 University of Oslo, PO Box 1042, Blindern, NO-0316 Oslo, Norway E-mail: [email protected] 2 Legos, 14 av. Edouard Belin, 31400 Toulouse Cedex, France 3 Norwegian Polar Institute, Polar Environmental Centre, NO-9296 Tromsø, Norway ABSTRACT. We investigate the major sources of backscatter at 5.3GHz, within the superimposed ice and firn areas of a polythermal glacier. Two ground-penetrating radar systems, an 800MHz impulse system and a polarimetric 5.3 GHz frequency-modulated continuous-wave system, are used to acquire along-glacier profiles in the accumulation area of Kongsvegen, Svalbard. The 800 MHz response is used to map reflection horizons in the glacier. Using cores from the superimposed ice and firn areas, the causes of these reflection horizons, in terms of snow, firn and ice layers, are investigated. Superimposing the reflection horizons on the co-polarized and cross-polarized 5.3 GHz profile, we are able to determine how the 5.3GHz frequency responds to the different media. Scattering at rough interfaces and volume scattering occur in the superimposed ice area and are apparently caused by air-bubble number, size and distribution. In the firn the strongest return originates from below the previous summer surface, consistent with previous findings. At approximately the same depth, strong incoherent scattering begins. The rapid decrease in coherent reflections indicates the significance of scattering in the firn. INTRODUCTION Monitoring of the world’s glaciers to assess any climate signature they may provide is a key concern in the field of glaciology. This effort is greatly aided by the use of satellite remote sensors, and in particular by those operating in the microwave frequency range (Bamber and Kwok, 2004). Using such frequencies, the resulting images show not only surface reflectivity but also backscatter from properties at depth. This leads to uncertainty as to where, within the depth profile, the main contribution to the backscatter signal originates. Penetration and scattering of the electromagnetic (EM) waves is an important factor for satellite-borne synthetic aperture radars (SARs) and altimeters (e.g. Envisat, RADAR- SAT, the Advanced Land Observing Satellite (ALOS) and the planned CryoSat-2). Returns from the subsurface can, for example, cause digital elevation model errors (Berthier and others, 2006), loss of coherence in the interferometric process (Rignot and others, 2001) and biasing of altimeter measurements (Helm and others, 2007). The induced height difference differs from Ku- to S-bands (Legre ´sy and others, 2005) due to the difference in radar sensitivity to the snow scattering properties (Lacroix and others, 2007). Studies to assess this subsurface effect are important for proper interpretation of satellite data. Ground-penetrating radar (GPR) is a common tool for glaciological investigations (Daniels, 2004). Whilst side-looking satellite SAR instru- ments give two-dimensional images with a single back- scatter value per pixel (which is the sum of all contributions to the depth of penetration), the GPR time window is subdivided to give backscatter at different depths. GPR instruments are commonly operated in single polarization mode, although interest in polarization effects has increased as polarimetric capabilities become a more common feature of satellite SARs (Stebler and others, 2005). We are concerned with linear polarization where the orientation of the electric field component of the EM wave is forced by the transmit and receive antennas to be either the same (co- polarized) or perpendicular (cross-polarized). It is instructive to consider how the response of the two polarizations will differ. A strong co-polarized response will occur at a flat dielectric interface. The greater the dielectric contrast, the greater the backscatter. Once the surface is no longer flat with respect to the radar wavelength, scattering will occur at the interface, with possible depolarization of the wave. This will reduce the proportion of energy backscattered in the co-polarized plane and increase it in the cross-polarized plane. Hence we can expect a co- polarized response from both a smooth and a rough interface, although for the former the peak amplitude will be greater and width of the response narrower. A cross- polarized response will only occur when depolarized scattering is involved. This requires either a rough dielectric interface, or scattering from inhomogeneities within a volume. The magnitude of the polarized responses is linked since the incident energy is finite and is the input to both responses. The cross-polarized backscatter response is less than the co-polarized response. The exception to this is when the illuminated medium is such that all incoming energy is scattered homogeneously in all directions, in which case the co- and cross-polarized responses will be equal. Ulaby and others (1981) provide a more in-depth discussion on polarization and scattering. The use of ground-based radars (Jezek and others, 1994; Scott and others, 2006a; Langley and others, 2007) and airborne systems (Hawley and others, 2006; Helm and others, 2007) allows the investigation of scattering with depth, an aspect integrated into the satellite response. Journal of Glaciology, Vol. 55, No. 190, 2009 *Present addresses: Norwegian Polar Institute, Polar Environmental Centre, NO-9296 Tromsø, Norway; Institute of Physics and Technology, University of Tromsø, NO-9037 Tromsø, Norway. {Present address: Norwegian Mapping Authority, Fylkeshuset, Todenskjolds- gate 65, NO-4614 Kristiansand, Norway. 373
Transcript of Sources of backscatter at 5.3GHz from a superimposed ice ... · PDF fileusing the software...

Sources of backscatter at 5.3GHz from a superimposed ice andfirn area revealed by multi-frequency GPR and cores
Kirsty LANGLEY,1* Pascal LACROIX,2 Svein-Erik HAMRAN,1 Ola BRANDT3{
1University of Oslo, PO Box 1042, Blindern, NO-0316 Oslo, NorwayE-mail: [email protected]
2Legos, 14 av. Edouard Belin, 31400 Toulouse Cedex, France3Norwegian Polar Institute, Polar Environmental Centre, NO-9296 Tromsø, Norway
ABSTRACT. We investigate the major sources of backscatter at 5.3GHz, within the superimposed iceand firn areas of a polythermal glacier. Two ground-penetrating radar systems, an 800MHz impulsesystem and a polarimetric 5.3GHz frequency-modulated continuous-wave system, are used to acquirealong-glacier profiles in the accumulation area of Kongsvegen, Svalbard. The 800MHz response is used tomap reflection horizons in the glacier. Using cores from the superimposed ice and firn areas, the causes ofthese reflection horizons, in terms of snow, firn and ice layers, are investigated. Superimposing thereflection horizons on the co-polarized and cross-polarized 5.3GHz profile, we are able to determinehow the 5.3GHz frequency responds to the different media. Scattering at rough interfaces and volumescattering occur in the superimposed ice area and are apparently caused by air-bubble number, size anddistribution. In the firn the strongest return originates from below the previous summer surface,consistent with previous findings. At approximately the same depth, strong incoherent scattering begins.The rapid decrease in coherent reflections indicates the significance of scattering in the firn.
INTRODUCTIONMonitoring of the world’s glaciers to assess any climatesignature they may provide is a key concern in the field ofglaciology. This effort is greatly aided by the use of satelliteremote sensors, and in particular by those operating in themicrowave frequency range (Bamber and Kwok, 2004).Using such frequencies, the resulting images show not onlysurface reflectivity but also backscatter from properties atdepth. This leads to uncertainty as to where, within thedepth profile, the main contribution to the backscatter signaloriginates.
Penetration and scattering of the electromagnetic (EM)waves is an important factor for satellite-borne syntheticaperture radars (SARs) and altimeters (e.g. Envisat, RADAR-SAT, the Advanced Land Observing Satellite (ALOS) and theplanned CryoSat-2). Returns from the subsurface can, forexample, cause digital elevation model errors (Berthier andothers, 2006), loss of coherence in the interferometricprocess (Rignot and others, 2001) and biasing of altimetermeasurements (Helm and others, 2007). The induced heightdifference differs from Ku- to S-bands (Legresy and others,2005) due to the difference in radar sensitivity to the snowscattering properties (Lacroix and others, 2007). Studies toassess this subsurface effect are important for properinterpretation of satellite data. Ground-penetrating radar(GPR) is a common tool for glaciological investigations(Daniels, 2004). Whilst side-looking satellite SAR instru-ments give two-dimensional images with a single back-scatter value per pixel (which is the sum of all contributionsto the depth of penetration), the GPR time window issubdivided to give backscatter at different depths. GPR
instruments are commonly operated in single polarizationmode, although interest in polarization effects has increasedas polarimetric capabilities become a more common featureof satellite SARs (Stebler and others, 2005). We areconcerned with linear polarization where the orientationof the electric field component of the EM wave is forced bythe transmit and receive antennas to be either the same (co-polarized) or perpendicular (cross-polarized).
It is instructive to consider how the response of the twopolarizations will differ. A strong co-polarized response willoccur at a flat dielectric interface. The greater the dielectriccontrast, the greater the backscatter. Once the surface is nolonger flat with respect to the radar wavelength, scatteringwill occur at the interface, with possible depolarization ofthe wave. This will reduce the proportion of energybackscattered in the co-polarized plane and increase it inthe cross-polarized plane. Hence we can expect a co-polarized response from both a smooth and a roughinterface, although for the former the peak amplitude willbe greater and width of the response narrower. A cross-polarized response will only occur when depolarizedscattering is involved. This requires either a rough dielectricinterface, or scattering from inhomogeneities within avolume. The magnitude of the polarized responses is linkedsince the incident energy is finite and is the input to bothresponses. The cross-polarized backscatter response is lessthan the co-polarized response. The exception to this iswhen the illuminated medium is such that all incomingenergy is scattered homogeneously in all directions, inwhich case the co- and cross-polarized responses will beequal. Ulaby and others (1981) provide a more in-depthdiscussion on polarization and scattering. The use ofground-based radars (Jezek and others, 1994; Scott andothers, 2006a; Langley and others, 2007) and airbornesystems (Hawley and others, 2006; Helm and others, 2007)allows the investigation of scattering with depth, an aspectintegrated into the satellite response.
Journal of Glaciology, Vol. 55, No. 190, 2009
*Present addresses: Norwegian Polar Institute, Polar Environmental Centre,NO-9296 Tromsø, Norway; Institute of Physics and Technology, Universityof Tromsø, NO-9037 Tromsø, Norway.{Present address: Norwegian Mapping Authority, Fylkeshuset, Todenskjolds-gate 65, NO-4614 Kristiansand, Norway.
373

Recent work in Greenland targets the percolation facies.This is considered to be an important zone for the storage ofwater (Bøggild and others, 2005). For the higher-frequencyaltimeter system, it has been shown that during spring theprevious summer surface (PSS) at the base of the wintersnowpack gives the strongest return (Scott and others, 2006b;Helm and others, 2007). Higher-density features within thesnowpack, such as wind crusts and ice layers, also give astrong backscatter contribution, as do thin ice layers at or justbelow the PSS. At C-band, similar results were obtained byJezek and others (1994), although they identify an ice layerzone as being the major backscatter source.
On Svalbard, the accumulation area of glaciers com-monly consists of superimposed ice and firn. Superimposedice is formed when saturated snow and firn facies or pondedmeltwater freeze (Paterson, 1994). This constitutes an oftenunknown, but in some cases significant, component of theannual accumulation (Wadham and Nuttall, 2002). Localtopography plays an important role in the formation of thesuperimposed ice since lower-gradient slopes allow pondingof meltwater (Obleitner and Lehning, 2004) while drainagechannels effectively remove the meltwater, limiting super-imposed ice formation (Brandt and others, 2008). The timeof superimposed ice formation (spring or autumn) influencesthe number and size of air bubbles trapped in the ice(Wadham and Nuttall, 2002; Obleitner and Lehning, 2004).Variations in the number of bubbles over depth are inferred
to be the cause of subsurface radar reflections (Konig andothers, 2002; Wadham and others, 2006). Since meltingoccurs at all elevations at our study site, the glacierKongsvegen, the firn area is exposed to meltwater whichforms ice layers, lenses, pipes and lower-density depth-hoarlayers in the firn and the winter snowpack. Their presencestrongly influences the radar response (Jezek and others,1994; Arcone, 2002; Wadham and others, 2006).
In this study, we investigate the major sources ofbackscatter at 5.3GHz, within the superimposed ice andfirn areas of a polythermal glacier. To do this we present aqualitative comparison between GPR profiles acquired witha 5.3GHz polarimetric frequency-modulated continuous-wave (FMCW) radar and an 800MHz impulse radarrespectively. With the impulse system, we identify andmap individual reflection horizons. Cores taken in thesuperimposed ice and firn areas provide a link to the causeof the reflections seen in the radar profile. By superimposingthe mapped horizons onto the C-band profile and compar-ing the location of the greatest backscatter response, we areable to locate the causes of backscatter at 5.3GHz in termsof the snow, ice and firn properties.
FIELD SITEOur field site is the 25 km long, polythermal, surge-typeglacier, Kongsvegen, situated at �798N on the northwest of
Fig. 1. Lower left inset: location of Kongsvegen in Svalbard. Main panel: upper section of Kongsvegen. The red crosses mark the mass-balance stakes along the centre line of the glacier. An along-glacier radar profile was measured between stakes 6 and 8, indicated by theblack curve. The blue dot shows the location of a superimposed ice core. Upper inset: The location of firn cores at stake 8, along with aschematic of radar lines measured within the grid (grey dashed lines).
Langley and others: Sources of backscatter at 5.3GHz374

the Spitsbergen archipelago (Fig. 1) (Liestøl, 1988; Bjorns-son and others, 1996; Melvold and Hagen, 1998). Theglacier has a low surface slope of 0.5–28. It covers an areaof approximately 100 km2, draining northwestwards from800ma.s.l. to sea level. The equilibrium line lies atapproximately 500ma.s.l. (Melvold and Hagen, 1998).The accumulation area is composed of a superimposed icezone and a firn area at higher altitude. There is no dry-snow zone on Kongsvegen. Melting or rain events canoccur year-round in Svalbard, and, during summer, airtemperatures typically remain above freezing. Subsequentrefreezing of meltwater results in the formation of icelayers, lenses and pipes. These structures can be ofvarious shapes, sizes and orientation, and alter the com-position of the snow and firn, resulting in a variable densitydistribution.
DATA AND PROCESSINGOur field data consist of GPR profiles at 5.3GHz and800MHz, an ice core from the superimposed ice area andfive firn cores from the firn area. The fieldwork was carriedout during April–May 2005. The air temperature for theduration of the field campaign was below 08C.
Radar profiles were collected along the centre line of theglacier from the ablation area to the accumulation area,following an existing stake network (Fig. 1). We discuss the5 km section of the profile from stake 6 in the superimposedice area to stake 8 in the firn area. The two radars wereoperated simultaneously from a single snow scooter (Fig. 2).We observed no interference between the instruments. Adifferential global positioning system (GPS) with a horizontalaccuracy of 10 cm was used to locate the profiles. Thepositions of traces were obtained by matching time stampsin the GPR and GPS.
800MHz impulse radarThe 800MHz radar was a Mala Geoscience RAMAC systemwith 800MHz shielded antennas (essentially a ground-coupled bowtie). The antennas were placed on a plasticsledge and dragged behind the snow-scooter sledge (Fig. 2).Pulses were triggered at a rate of 4 traces s–1. At our averagedriving speed of 8 kmh–1 this corresponds to 2 tracesm–1.Each trace was resolved with 1024 samples at 16 bits over atime window of 186 ns so that one wavelength (in air) isresolved by seven samples. Most commercial GPRs are builtwith a bandwidth approximately equal to the centrefrequency; the resolution of the radar is therefore approxi-mately 19 cm in air or 10 cm in ice (using an average relativepermittivity, "r ¼ 3.15 for ice). Processing was performedusing the software ReflexW (http://www.sandmeier-geo.de)and included a dewow filter (removing low-frequencysignals within each trace) and background removal (toremove horizontally constant signals which are mainlyinstrumental noise). The system noise, calculated as themean signal level before the direct wave, normalized to thepeak direct wave power, is –26 dB.
5.3GHz frequency-modulated continuous-wave(FMCW) radarThe radar used to acquire the 5.3 GHz data was apolarimetric FMCW radar (Hamran and Langley, 2006).The antennas are dual-ridged horns with a gain of6.6–7.4 dB and a 3 dB beamwidth of 70–658 in both planesover the bandwidth used. They are contained in a boxsuspended 30 cm above the snow surface on an armprotruding from the side of the snow-scooter sledge(Fig. 2). The frequency sweep is 4.8–5.8GHz, giving acentre frequency of 5.3GHz and a bandwidth of 1GHz. Weacquired 2 tracesm–1, although the sweep itself only takes20ms.
Fig. 2. Field set-up of the radars and GPS. The 5.3GHz antennas are in the black box protruding to the right of the sledge. The 800MHzantennas are dragged behind on a plastic sledge.
Langley and others: Sources of backscatter at 5.3GHz 375

We refer to polarization in terms of X and Y, whereby theX plane is aligned in the direction of the GPR travel (i.e.along glacier) and the Y plane is perpendicular to thedirection of travel (i.e. across glacier). The data werecollected and processed in the frequency domain. AHamming window was applied to reduce the side lobes,followed by conversion to the time domain with a fastFourier transform algorithm. The bandwidth of 1GHz shouldyield a resolution of 0.15 cm in air (Daniels, 2004).However, a side effect of the Hamming window is abroadening of the main lobe, which influences the obtain-able resolution. Inspection of the data suggests that the filtercauses a 25% broadening of the main lobe. Resolution istherefore reduced to 1.25 ns, equal to 19 cm in air or 10 cmin ice ("r ¼ 3.15).
The data were calibrated using a technique proposed bySarabandi and others (1990) for field calibration of polari-metric radars. The method determines the phase andamplitude deviations in the antennas from the nominal gainvalues. These field transfer functions were obtained usingtwo reference targets: a sphere with radar cross-section0.1m2 and a diplane, which has a strong cross-polarizedradar cross-section. This method is particularly applicable tofield operations, as it does not require accurate alignment ofthe calibration targets or knowledge of the radar cross-section of the depolarizing target (i.e. the diplane) (Sar-abandi and others, 1990). For the calibration measurements,the calibration targets were placed at a horizontal distanceof 1m from the radar. To improve the signal-to-noise ratio, ameasurement was also made without the targets, allowingthe background signal to be removed.
Comparison of the different polarizations shows that theco-polarized channels YY and XX are approximately equal,as are the cross-polarized channels YX and XY. Thus we limitourselves to the presentation of the YY and YX data asrepresentation of the co- and cross-polarized responsesrespectively. There is some noise (system artifacts) in the Xchannel, which is noticeable in the figures as a horizontalbanding. The system noise, calculated as the mean signallevel after the direct wave for a shot in air, and normalized tothe maximum profile value, is –28 dB for the co-polarizedchannel and –8 dB for the cross-polarized channel.
Radar backscatter using the radar equationIn order to compare the two radar systems we convert theradar response to a scattering cross-section, �M, �YY and �YX
(where the subscript M denotes the 800MHz frequency, andYY and YX the co-and cross-polarized channels of theFMCW 5.3GHz radar). �q (where q ¼ M, YY or YX) wascalculated according to the standard radar equation (Ulabyand others, 1981),
�qðRÞ ¼ PrR4ð4�Þ3Pt�2G2Vs
e4�R, ð1Þ
where Pt and Pr are the transmitted and received power, G is
the antenna gain, � is the wavelength, Vs is the scatteringvolume, R is distance from the radar, and � is attenuation.
Wavelength is dependent on the velocity profile of themedium, as is the scattering volume which also includes raybending at interfaces. Velocity profiles are based on densitymeasurements in snow pits and common-midpoint (CMP)measurements taken at stakes 6–8. An average velocity of231m ms–1 is used for the snowpack. For ice and firn, bulkvelocities derived from the CMPmeasurements of 190m ms–1
and 220m ms–1 respectively are used. These are constant overdepth.
Radar-specific parameters such as antenna gain andbeamwidth (necessary for the calculation of the scatteringvolume) are unknown for the 800MHz radar, and arbitraryvalues were assigned (gain of 7 dB, beamwidth of 608). Thisis justified since these parameters are constants and areapplied to each trace, resulting in a constant trace offset.
Attenuation, �, is a combination of the absorption andscattering losses experienced by the wave as it travelsthrough the medium. In ice, the absorption is frequency-dependent (Robin and others, 1969). Extrapolating from thegraphs provided by Robin and others (1969), loss due toabsorption in ice at –18C is on the order of 0.08 dBm–1 at800MHz and 0.32 dBm–1 at 5.3GHz. In addition, the lossdue to scattering from air bubbles will be greater at 5.3GHzthan at 800MHz, but is an unknown quantity. In the firn,attenuation is estimated from dielectric profiling of the firncores (described below). An average conductivity of 7 msm–1
was measured, giving a loss tangent very much lower than 1(i.e. "00="0 � 1), indicating this to be a very low-lossmedium. Absorption losses are therefore assumed to befrequency-independent and much lower than in the ice.According to our assumptions, attenuation in the firn is thusdue to scattering losses, which are very much greater at5.3GHz than at 800MHz, but again undetermined. Sincethe actual attenuation is unknown, this term remains a factorin our calculated scattering cross-section, and the valuespresented here are weighted scattering cross-sections, �wq:
�wq ¼ �qe�4�R : ð2Þ
From �wq, the backscatter coefficient �0wq is calculated as the
sum of all scattering responses over the length of each trace:
�0wq ¼
Z R
0�wqðRÞ dR: ð3Þ
This integration is performed from 0 to the depth equivalentof 100 ns so that the same time window is applied to bothradar systems. Changing the integration time windowbeyond 50ns does not significantly alter the pattern ofbackscatter along the radar profiles.
Our use of �wq and �0wq is for a relative comparison of
backscatter along the profile as measured by the two radarsystems. The focus is therefore on the relative changes ratherthan the absolute values.
Fig. 3. Top 117 cm of the superimposed ice core, taken 1 km up-glacier from stake 6; 0 cm is at the previous summer surface. The differenttextures seen are due to varying air-bubble content (air bubbles are dark).
Langley and others: Sources of backscatter at 5.3GHz376

Superimposed ice coreA single 5m long core was taken in the superimposed icearea (location indicated in Fig. 1). Digital images withbelow and side lighting were taken of the whole corelength. The images (9m–1) were stitched together to form asingle image of the core (Sjogren and others, 2007),illustrating the variability and range of structures withinthe ice (Fig. 3). Due to the lighting, clear ice is white,whereas bubbles show up as black. An attempt was madeto weigh representative sections within the core to obtaindensity estimates, but this was unsuccessful. Instead, toobtain a measure of the variability of the bubble contentalong the core, we integrate the digital image pixel valuesacross the core. The values are then normalized, smoothedand thresholded at 70% to highlight where the highest andlowest bubble concentrations are.
Firn coreFive firn cores, each approximately 10m long, wererecovered in a 10m grid in the firn area (Fig. 1). The coreswere analysed with a dielectric profiler (DEP) instrument(Wilhelms and others, 1998) and digital imagery for visualinterpretation. The digital imagery was done using a similarset-up to that for the superimposed ice core but using sidelighting (Sjogren and others, 2007). In this case, firn appearsbright and ice dark (Fig. 4). The DEP instrument measuresthe capacitance, C, and conductance, G, of the ice and firnat 250 kHz in 5mm steps along the cores. The electrodes are10mm long and the measurements are influenced by thematerial properties over approximately a 30mm window, sodata close to cracks in the ice/firn have been excluded.
The DEP measurements are converted to relative permit-tivity, "r (non-dimensional), and conductivity, cond (Sm–1),according to (Kohler and others, 2003):
"r ¼ CCair
, cond ¼ "airGCair
, ð4Þ
where "air ¼ 8.854187�10–12 Fm–1 is the permittivity invacuum and Cair ¼ 64.5�10–15 F is the free-air capaci-tance, a constant obtained by taking a reading with anempty instrumental set-up. Density (in kgm–3) is then cal-culated from (Kovacs and others, 1995; Eisen and others,2002):
� ¼ffiffiffiffi"r
p � 10:000845
: ð5Þ
The density differences within the core (i.e. firn or ice) aremuch larger than the absolute accuracy of the measure-ments, thereby justifying the relatively simple conversionmade with Equation (5).
Due to the smoothing nature of the sample window(approximately 30 cm), abrupt changes in density, transitionsthat are not horizontally flat, and very thin layers areprobably not correctly resolved. This is problematic for GPRcomparisons since the nature of an interface (with respect tothe radar wavelength) is important for determining how thewave will be reflected. It is for this reason that wecomplement the DEP record with digital images.
The winter snowpack at the time of data collection wasnearly 2m deep. Since this snow is less consolidated andthus not suitable for transportation, the actual DEP measure-ments start at approximately 1.8m depth, the top of the firn.The permittivity profile of the snowpack was obtained fromdensity measurements in snow pits about 10m away from
the core sites, and by bulk weight/volume measurements ofthe upper core pieces that were not transportable.
These processing steps give a density vs depth profile foreach core. To compare these profiles with the GPR profiles,the depth scale is converted to two-way travel time, TWT,using:
TWT ¼XZz¼0
2�zffiffiffiffi"r
p=�air, ð6Þ
where �z is the depth interval, Z is the total depth andvair ¼ 3� 108m s–1. The profiles (examples in Fig. 4) areinterpreted visually where high values indicate ice and lowvalues indicate firn.
RESULTS AND DISCUSSIONFigure 5 gives an overview of the radar profiles discussed.For display purposes, the radar profiles (displaying nor-malized radar cross-section) have been stacked (ten-tracestack). The cross-polarized profile (Fig. 5c) has beennormalized to the maximum co-polarized value to allowthe difference in backscatter level to be seen. In the profileswe see the winter snowpack, from 0ns to approximately15 ns, overlaying the PSS, which is the first continuousinterface. The normalized integrated backscatter coefficient�0wq is given in Figure 5d. The 800MHz curve, �0wM, has
been shifted down by 3 dB for ease of comparison, whilst thecross-polarized curve is normalized to the maximum co-polarized value. It is the fluctuations in dB, not the absolutevalues, that are important here. Any comparison we makerefers to their respective relative changes up-glacier fromstake 6 (0 km).
We use the 800MHz radar profile to identify clearlayering in the superimposed ice and firn. At this wavelengththe response is less influenced by scattering and more theresult of coherent reflections at dielectric interfaces. This isseen by the continuity of interfaces over tens to hundreds of
Fig. 4. Digital imagery of the upper sections of firn cores 1 and 2,along with the DEP-derived permittivity profiles. Firn appears whiteand ice dark. The depth scale starts at the previous year’s summersurface.
Langley and others: Sources of backscatter at 5.3GHz 377

metres. Interfaces digitized on the 800MHz profile aresuperimposed on the radargrams, giving a reference bywhich to judge the 5.3GHz response (Fig. 5).
Radar response to superimposed iceThe superimposed ice area extends up-glacier from 0 to2.5 km. It has a clearly different radar signature compared tothe firn for both frequencies and polarizations shown(Fig. 5a–c). The undulations are caused by variable rates ofsuperimposed ice accumulation influenced by topography,as discussed above. The cause of the layering and reflectionsis discussed below.
The superimposed ice core revealed that bubbles of theorder of 1–5mm predominate at this location in thesuperimposed ice, but larger bubbles of the order of10mm and smaller bubbles are also seen. Comparison ofthe processed digital imagery of the superimposed ice corewith the radargram (Fig. 6a) indicates that the areas of high
bubble content (red) correspond well with the bands ofhigher backscatter. The exact vertical positioning of the corewithin the radargram is dependent on the velocity profileused to convert the core depth axis to time and also thepositioning of the core with respect to the PSS. To addressthe former, we show the core with time axes converted using�10% of our CMP velocity (Fig. 6b and c). The relationshipof high bubble content and high backscatter holds well forthe lower velocity, but breaks down at depth for the highervelocity. Still, the fit is good enough to suggest that, in thesuperimposed ice, the reflection horizons in the radarprofiles are the result of density contrasts caused by varyingbubble content.
The cores and radar data thus show that, using 800MHz,the greatest reflection occurs at the PSS due to the relativelyhigh permittivity contrast there (snow to ice). Below the PSS,the density contrast between the layers is relatively small,hence the lower backscatter compared to firn (discussed
Fig. 5. (a–c) Normalized scattering cross-section, �wq, at (a) 800MHz, (b) 5.3GHz YY and (c) 5.3GHz YX (normalized with respect to YY).Colour bar shows scale in dB. Horizons digitized on the 800MHz profile in the snow (S1), previous summer surface (PSS), superimposed ice(I1, I2), and firn (F1–F4) are shown as black curves. At the right end of each radargram, a profile of the average permittivity of the five firncores is shown with the approximate time location of the digitized horizons at stake 8. The points marked tr.1–5 correspond to the locationsof the traces in Figure 7. (d) Normalized backscatter coefficient, �0
wq , along the profile. The 5.3GHz cross-polarized response is normalizedwith respect to the co-polarized response, and the 800MHz profile has been shifted down by 3dB for ease of comparison.
Langley and others: Sources of backscatter at 5.3GHz378

later). The evolution of �0wM through the superimposed ice
area (Fig. 5d; 0–2.5 km) is a consequence of both thenumber of layers per metre depth and the overall depth ofthe superimposed ice. More interfaces over a given depthresult in more reflections and thus a higher �0
wM. An increasein the vertical extent of the superimposed ice leads to anincrease in the number of potential reflection horizons,leading to an increase in �0
wM down to the penetration limitof the radar system (which is at least as great as the timewindow here).
At 5.3GHz the PSS induces both a co- and a cross-polarized response (Fig. 7a), and is therefore probably arough interface. Within the ice below, relatively strongreflections at layer interfaces dominate the co-polarizedresponse, as at 800MHz, giving the clear layered structure(Fig. 5b). Scattering also occurs at the interfaces and to alesser extent between them (Fig. 5c). With a wavelength of�3 cm in ice, the scattering is probably due to the size anddistribution of the air-bubble inclusions, which are mostlysub-centimetre size, rather than individual air bubbles. Theareas of very low backscatter, i.e. at �30 ns between 1100and 1600m for both the co- and cross-polarized response,are interpreted as ice with very few or very small airbubbles. Such clear layers are less common in the upper500m of superimposed ice (2000–2500m), which has adifferent structure than the down-glacier superimposed ice(0–2000m). In this upper 0.5 km of the profile, horizons areless distinct and more closely spaced (more layers per unitdepth), resulting in more uniform scattering over depth(Fig. 5b and c). The reason for this difference could berelated to the proximity to the firn line.
In the superimposed ice, a number of isolated patches ofstrong incoherent scattering occur, indicating areas of morecomplex structure. These are labelled ‘a’–‘d’ in Figure 5c. Incases where the increased scattering is aligned along ahorizon, it is attributed to more favourable bubble size/distribution. Patches ‘b’ and ‘c’ are of this sort. Patch ‘a’ lies
below a surface drainage channel clearly seen in the PSS.The relic and existing drainage structures could well bethe cause of the greater scattering. Patch ‘b’ also lies beneathan area of higher drainage (assumed from the anticlinenature of the layers), and thus may also be associated withthis. Patch ‘d’ is composed of a number of isolated patches,not fully resolved by the 5.3GHz radar, but clear at800MHz (Fig. 5a). The cause of these is unknown, butsimilar reflections have been observed with an 800MHzradar on Austfonna, Svalbard (personal communication fromT. Dunse, 2007).
Radar response to firnThe firn area extends up-glacier from 2.5 km and ischaracterized by gently up-glacier-dipping layers. Althoughvisually quite distinct, the transition from superimposed iceto firn is likely to be a zone where the two facies inter-fingersomewhat due to fluctuations of the snowline over time.Indeed horizons can be traced across this transition zone(e.g. the layer marked F4 (Fig. 5a)).
Cores taken in the firn area reveal it to be a highlyvariable medium, with ice lenses varying in thickness frommillimetres to >0.5m over relatively short horizontaldistances. The digital images reveal a degree of hetero-geneity not apparent in the DEP record (due to the across-core averaging in the latter), with layers sloping at 10–158and vertical ice fingers, sometimes present on just one sideof the core slice (the photographed slices are 7.5 cm wide).We observe that features more than 0.15m thick aretraceable between cores (approximately 10m), whilethinner ice features are highly irregular and localized. Werefer to the thicker traceable features as ice layers, and thethinner less extensive features as ice lenses.
Comparison of the cores with the 800MHz radar profileshows that, below the PSS, reflection horizons correspondto firn–ice interfaces. Phase changes at these interfaces arein agreement with the expected permittivity changes,
Fig. 6. Comparison of the 5.3GHz co-polarized radargram with the integrated, normalized, smoothed and thresholded (70%) superimposedice core. Blue represents low bubble content; red represents high bubble content. Depth-to-time conversion of the core was performed witha velocity of (a) 190m ms–1, the bulk CMP velocity, (b) 171m ms–1 and (c) 209m ms–1.
Langley and others: Sources of backscatter at 5.3GHz 379

i.e. incoming wavelet has the same phase polarity as theemitted wavelet if the reflection is caused at an interface oflow to high permittivity, such as firn to ice, and is reversedwhen the interface goes from high to low permittivity, suchas from ice to firn (Fig. 8). To interpret the radargram awayfrom the core sites, we use the phase of the radar reflectionto indicate the ordering of firn/ice layering (Arcone andothers 1995). Layers F1–F4 are associated with the top andbottom of relatively thick ice layers (Fig. 5a). We find that forthick ice layers, the firn–ice interfaces give more continuousreflection horizons whilst the actual ice body is a low-backscatter band in the radar profile (compare the end of theradar profile in Figure 5a with the averaged DEP profile; low-backscatter layers correspond to ice layers, i.e. highpermittivity). Smaller ice lenses that are not so laterallyextensive give a more clutter-rich response where individualice lenses cannot be easily traced. At 800MHz (wavelength37.5 cm in air, 26.5 cm in firn of "r ¼ 2), scattering from firngrains almost certainly does not occur. Depth-hoar layersmay also play a role, but the lower preservation potential ofthese low-density, coarse layers (common in firn exposed toextensive summertime percolation) makes them hard tocapture in the cores.
At 5.3GHz, scattering is much more effective in the firnthan in the superimposed ice. This is seen by themuch greaterincrease in the total relative cross-polarized backscattercompared to co-polarized backscatter (Fig. 5d at �2500m).The wave is attenuated, and strong coherent reflections arelimited to the upper 50 ns of signal penetration.
Low-backscatter areas are apparent for both co- andcross-polarized responses. These were identified as icelayers in the 800MHz profile. The traced interfaces indicatethat, while there is a coherent response at the top andbottom of the ice layers in the final (down-glacier) 1 kmof firn, scattering is not concentrated there (Fig. 5b and c;F1–F4 at 2500–3500m). Rather, scattering tends to bestronger in the areas between the large ice layers where firnis presumably intermixed with thinner, laterally less exten-sive ice lenses and pipes, resulting in clutter-rich radar layersat this frequency.
Particularly notable is the bright layer labelled BL inFigure 5b and c, which, for the co-polarized response, is onaverage 5 dB brighter than the PSS. The narrow width of thereflector and lateral extent suggests that it is associated witha continuous feature. Interestingly, it is approximately at thedepth of BL that strong scattering appears to start andcontinues over depth in the cross-polarized response(Fig. 7b).
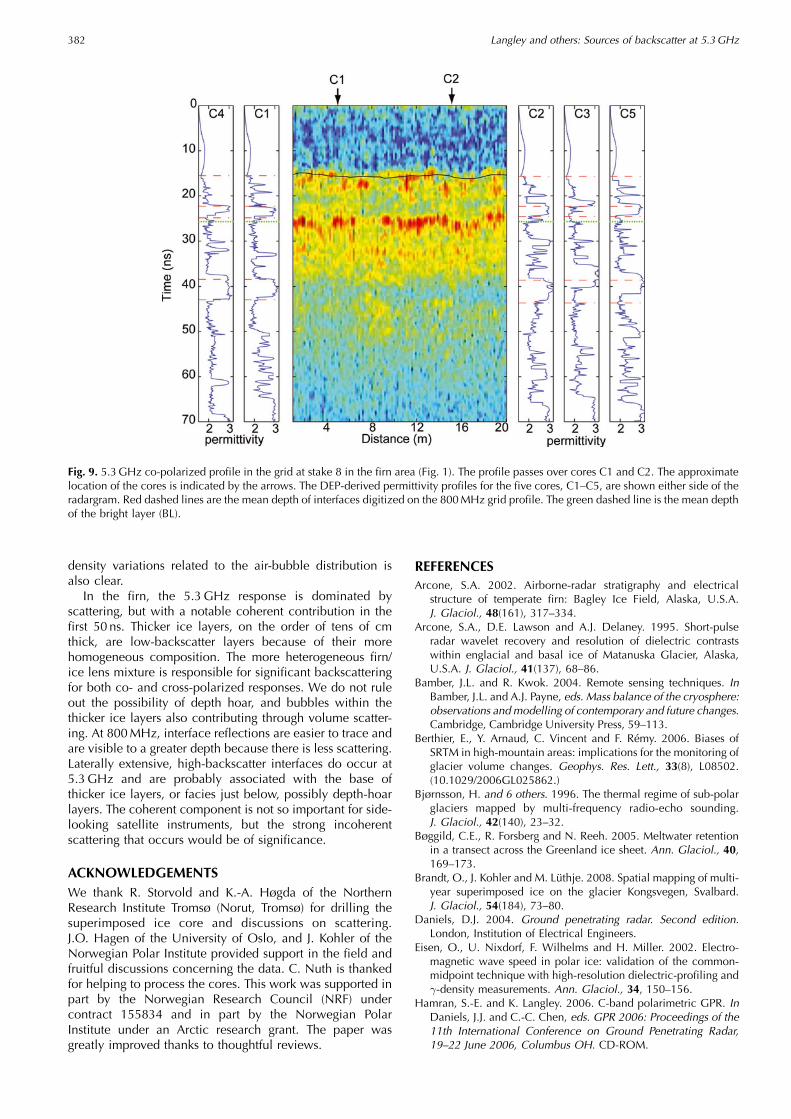
Comparison of the location of this reflection with theDEP core profiles places it approximately 1 ns (approxi-mately 11 cm) below the base of the first sizable ice layer(Fig. 9; ice layer at 23–27ns). This location is in agreementwith the depth of BL at the upstream end of the along-glacier profile (Fig. 5b; compare the end of the radargramwith the permittivity profile, which is an average of all fiveDEP profiles). We believe this reflection is associated withthe base of the ice layer, but there are uncertaintiesincluding: (a) radar resolution (at best 10 cm in ice),
Fig. 7. (a) Traces illustrating the 5.3GHz co-polarized and cross-polarized normalized scattering cross-section extracted from Figure 5. Thecross-polarized response is given in red and the co-polarized response in blue. (b) Co-polarized and cross-polarized backscatter trends overdepth for the superimposed ice and firn areas. Each trace is an average of 100 consecutive traces. The PSS response is indicated by thedashed grey arrows. Reflection horizon at the bright layer (BL in Fig. 5 and text) is marked.
Langley and others: Sources of backscatter at 5.3GHz380
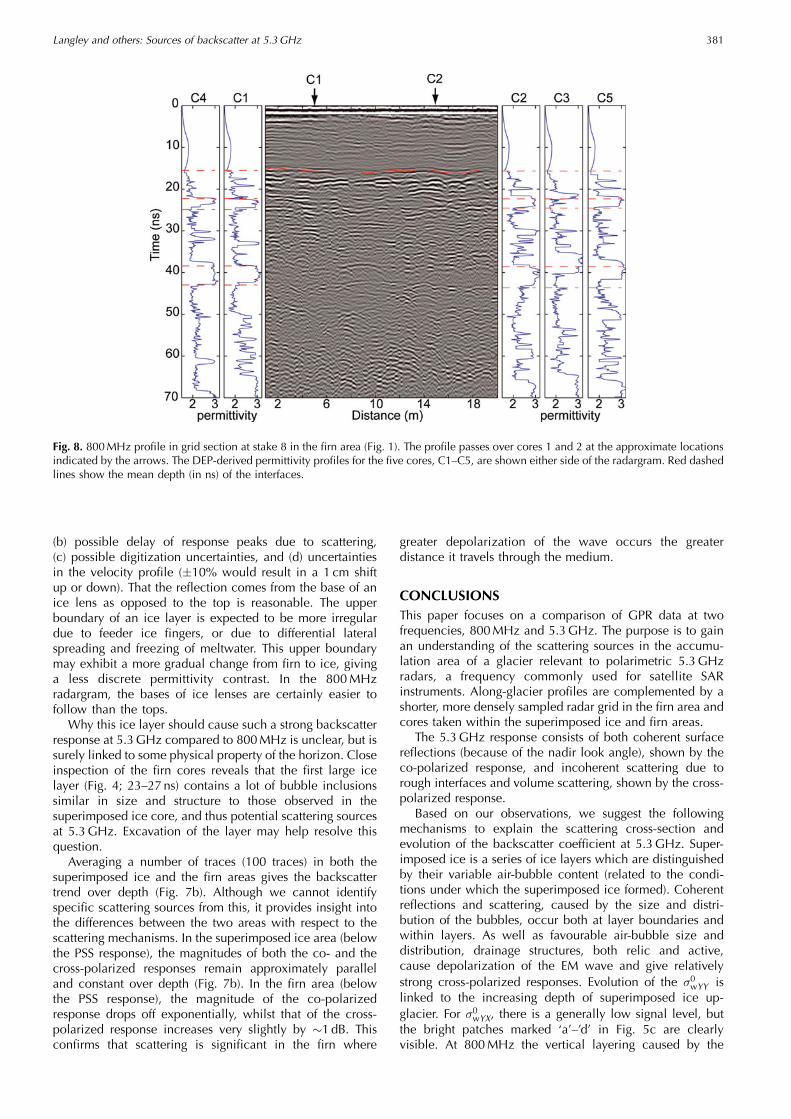
(b) possible delay of response peaks due to scattering,(c) possible digitization uncertainties, and (d) uncertaintiesin the velocity profile (�10% would result in a 1 cm shiftup or down). That the reflection comes from the base of anice lens as opposed to the top is reasonable. The upperboundary of an ice layer is expected to be more irregulardue to feeder ice fingers, or due to differential lateralspreading and freezing of meltwater. This upper boundarymay exhibit a more gradual change from firn to ice, givinga less discrete permittivity contrast. In the 800MHzradargram, the bases of ice lenses are certainly easier tofollow than the tops.
Why this ice layer should cause such a strong backscatterresponse at 5.3GHz compared to 800MHz is unclear, but issurely linked to some physical property of the horizon. Closeinspection of the firn cores reveals that the first large icelayer (Fig. 4; 23–27ns) contains a lot of bubble inclusionssimilar in size and structure to those observed in thesuperimposed ice core, and thus potential scattering sourcesat 5.3GHz. Excavation of the layer may help resolve thisquestion.
Averaging a number of traces (100 traces) in both thesuperimposed ice and the firn areas gives the backscattertrend over depth (Fig. 7b). Although we cannot identifyspecific scattering sources from this, it provides insight intothe differences between the two areas with respect to thescattering mechanisms. In the superimposed ice area (belowthe PSS response), the magnitudes of both the co- and thecross-polarized responses remain approximately paralleland constant over depth (Fig. 7b). In the firn area (belowthe PSS response), the magnitude of the co-polarizedresponse drops off exponentially, whilst that of the cross-polarized response increases very slightly by �1dB. Thisconfirms that scattering is significant in the firn where
greater depolarization of the wave occurs the greaterdistance it travels through the medium.
CONCLUSIONSThis paper focuses on a comparison of GPR data at twofrequencies, 800MHz and 5.3GHz. The purpose is to gainan understanding of the scattering sources in the accumu-lation area of a glacier relevant to polarimetric 5.3GHzradars, a frequency commonly used for satellite SARinstruments. Along-glacier profiles are complemented by ashorter, more densely sampled radar grid in the firn area andcores taken within the superimposed ice and firn areas.
The 5.3GHz response consists of both coherent surfacereflections (because of the nadir look angle), shown by theco-polarized response, and incoherent scattering due torough interfaces and volume scattering, shown by the cross-polarized response.
Based on our observations, we suggest the followingmechanisms to explain the scattering cross-section andevolution of the backscatter coefficient at 5.3GHz. Super-imposed ice is a series of ice layers which are distinguishedby their variable air-bubble content (related to the condi-tions under which the superimposed ice formed). Coherentreflections and scattering, caused by the size and distri-bution of the bubbles, occur both at layer boundaries andwithin layers. As well as favourable air-bubble size anddistribution, drainage structures, both relic and active,cause depolarization of the EM wave and give relativelystrong cross-polarized responses. Evolution of the �0
wYY islinked to the increasing depth of superimposed ice up-glacier. For �0
wYX, there is a generally low signal level, butthe bright patches marked ‘a’–’d’ in Fig. 5c are clearlyvisible. At 800MHz the vertical layering caused by the
Fig. 8. 800MHz profile in grid section at stake 8 in the firn area (Fig. 1). The profile passes over cores 1 and 2 at the approximate locationsindicated by the arrows. The DEP-derived permittivity profiles for the five cores, C1–C5, are shown either side of the radargram. Red dashedlines show the mean depth (in ns) of the interfaces.
Langley and others: Sources of backscatter at 5.3GHz 381
density variations related to the air-bubble distribution isalso clear.
In the firn, the 5.3GHz response is dominated byscattering, but with a notable coherent contribution in thefirst 50 ns. Thicker ice layers, on the order of tens of cmthick, are low-backscatter layers because of their morehomogeneous composition. The more heterogeneous firn/ice lens mixture is responsible for significant backscatteringfor both co- and cross-polarized responses. We do not ruleout the possibility of depth hoar, and bubbles within thethicker ice layers also contributing through volume scatter-ing. At 800MHz, interface reflections are easier to trace andare visible to a greater depth because there is less scattering.Laterally extensive, high-backscatter interfaces do occur at5.3GHz and are probably associated with the base ofthicker ice layers, or facies just below, possibly depth-hoarlayers. The coherent component is not so important for side-looking satellite instruments, but the strong incoherentscattering that occurs would be of significance.
ACKNOWLEDGEMENTSWe thank R. Storvold and K.-A. Høgda of the NorthernResearch Institute Tromsø (Norut, Tromsø) for drilling thesuperimposed ice core and discussions on scattering.J.O. Hagen of the University of Oslo, and J. Kohler of theNorwegian Polar Institute provided support in the field andfruitful discussions concerning the data. C. Nuth is thankedfor helping to process the cores. This work was supported inpart by the Norwegian Research Council (NRF) undercontract 155834 and in part by the Norwegian PolarInstitute under an Arctic research grant. The paper wasgreatly improved thanks to thoughtful reviews.
REFERENCESArcone, S.A. 2002. Airborne-radar stratigraphy and electrical
structure of temperate firn: Bagley Ice Field, Alaska, U.S.A.J. Glaciol., 48(161), 317–334.
Arcone, S.A., D.E. Lawson and A.J. Delaney. 1995. Short-pulseradar wavelet recovery and resolution of dielectric contrastswithin englacial and basal ice of Matanuska Glacier, Alaska,U.S.A. J. Glaciol., 41(137), 68–86.
Bamber, J.L. and R. Kwok. 2004. Remote sensing techniques. InBamber, J.L. and A.J. Payne, eds. Mass balance of the cryosphere:observations and modelling of contemporary and future changes.Cambridge, Cambridge University Press, 59–113.
Berthier, E., Y. Arnaud, C. Vincent and F. Remy. 2006. Biases ofSRTM in high-mountain areas: implications for the monitoring ofglacier volume changes. Geophys. Res. Lett., 33(8), L08502.(10.1029/2006GL025862.)
Bjørnsson, H. and 6 others. 1996. The thermal regime of sub-polarglaciers mapped by multi-frequency radio-echo sounding.J. Glaciol., 42(140), 23–32.
Bøggild, C.E., R. Forsberg and N. Reeh. 2005. Meltwater retentionin a transect across the Greenland ice sheet. Ann. Glaciol., 40,169–173.
Brandt, O., J. Kohler and M. Luthje. 2008. Spatial mapping of multi-year superimposed ice on the glacier Kongsvegen, Svalbard.J. Glaciol., 54(184), 73–80.
Daniels, D.J. 2004. Ground penetrating radar. Second edition.London, Institution of Electrical Engineers.
Eisen, O., U. Nixdorf, F. Wilhelms and H. Miller. 2002. Electro-magnetic wave speed in polar ice: validation of the common-midpoint technique with high-resolution dielectric-profiling and�-density measurements. Ann. Glaciol., 34, 150–156.
Hamran, S.-E. and K. Langley. 2006. C-band polarimetric GPR. InDaniels, J.J. and C.-C. Chen, eds. GPR 2006: Proceedings of the11th International Conference on Ground Penetrating Radar,19–22 June 2006, Columbus OH. CD-ROM.
Fig. 9. 5.3GHz co-polarized profile in the grid at stake 8 in the firn area (Fig. 1). The profile passes over cores C1 and C2. The approximatelocation of the cores is indicated by the arrows. The DEP-derived permittivity profiles for the five cores, C1–C5, are shown either side of theradargram. Red dashed lines are the mean depth of interfaces digitized on the 800MHz grid profile. The green dashed line is the mean depthof the bright layer (BL).
Langley and others: Sources of backscatter at 5.3GHz382

Hawley, R.L., E.M. Morris, R. Cullen, U. Nixdorf, A.P. Shepherd andD.J. Wingham. 2006. ASIRAS airborne radar resolves internalannual layers in the dry-snow zone of Greenland. Geophys. Res.Lett., 33(4), L04502. (10.1029/2005GL025147.)
Helm, V. and 6 others. 2007. Winter accumulation in thepercolation zone of Greenland measured by airborne radaraltimeter. Geophys. Res. Lett., 34(6), L06501. (10.1029/2006GL029185.)
Jezek, K.C., P. Gogineni and M. Shanableh. 1994. Radar measure-ments of melt zones on the Greenland ice sheet. Geophys. Res.Lett., 21(1), 33–36.
Kohler, J., J.C. Moore and E. Isaksson. 2003. Comparison ofmodelled and observed responses of a glacier snowpack toground-penetrating radar. Ann. Glaciol., 37, 293–297.
Konig, M., J. Wadham, J.G. Winther, J. Kohler and A.-M. Nuttall.2002. Detection of superimposed ice on the glaciers Kongs-vegen and midre Lovenbreen, Svalbard, using SAR satelliteimagery. Ann. Glaciol., 34, 335–342.
Kovacs, A., A.J. Gow and R.M. Morey. 1995. The in-situ dielectricconstant of polar firn revisited. Cold Reg. Sci. Technol., 23(3),245–256.
Lacroix, P., B. Legresy, R. Coleman, M. Dechambre and F. Remy.2007. Dual-frequency altimeter signal from Envisat on theAmery ice-shelf. Remote Sens. Environ., 109(3), 285–294.
Langley, K. and 6 others. 2007. Use of C-band ground penetratingradar to determine backscatter sources within glaciers. IEEETrans. Geosci. Remote Sens., 45(5), 1236–1246.
Legresy, B., F. Papa, F. Remy, G. Vinay, M. van den Bosch andO.-Z. Zanife. 2005. ENVISAT radar altimeter measurements overcontinental surfaces and ice caps using the ICE-2 retrackingalgorithm. Remote Sens. Environ., 95(2), 150–163.
Liestøl, O. 1988. The glaciers in the Kongsfjorden area, Spitsbergen.Nor. Geogr. Tidsskr., 42(4), 231–238.
Melvold, K. and J.O. Hagen. 1998. Evolution of a surge-type glacierin its quiescent phase: Kongsvegen, Spitsbergen, 1964–95.J. Glaciol., 44(147), 394–404.
Obleitner, F. and M. Lehning. 2004. Measurement and simulationof snow and superimposed ice at the Kongsvegen glacier,Svalbard (Spitzbergen). J. Geophys. Res., 109(D4), D04106.(10.1029/2003JD003945.)
Paterson, W.S.B. 1994. The physics of glaciers. Third edition.Oxford, etc., Elsevier.
Rignot, E., K. Echelmeyer and W. Krabill. 2001. Penetration depthof interferometric synthetic-aperture radar signals in snow andice. Geophys. Res. Lett., 28(18), 3501–3504.
Robin, G.de Q., S. Evans and J.T. Bailey. 1969. Interpretation ofradio echo sounding in polar ice sheets. Philos. Trans. R. Soc.London, Ser. A, 265(1166), 437–505.
Sarabandi, K., F.T. Ulaby and M.A. Tassoudji. 1990. Calibration ofpolarimetric radar systems with good polarization isolation. IEEETrans. Geosci. Remote Sens., 28(1), 70–75.
Scott, J., D. Mair, P. Nienow, V. Parry and E. Morris. 2006a. Aground-based radar backscatter investigation in the percolationzone of the Greenland Ice Sheet. Remote Sens. Environ., 104(4),361–373.
Scott, J., P. Nienow, V. Parry, D. Mair, E. Morris and D. Wingham.2006b. The importance of seasonal and annual layers incontrolling backscattter to radar altimeters across the percola-tion zone of an ice sheet. Geophys. Res. Lett., 33(24), L24502.(10.1029/2006GL027974.)
Sjogren, B. and 6 others. 2007. Determination of firn density in icecores using image analysis. J. Glaciol., 53(182), 413–419.
Stebler, O., A. Schwerzmann, A. Luthi, E. Meier and D.R. Nuesch.2005. Pol-InSAR observations from an Alpine glacier in the coldinfiltration zone at L- and P-band. IEEE Geosci. Remote Sens.Lett., 2(3), 357–361.
Ulaby, F.T., R.K. Moore and A.K. Fung. 1981. Microwave remotesensing, active and passive. Vol. 1. Fundamentals and radiom-etry. Reading, MA, Addison-Wesley Publishing Co.
Wadham, J.L. and A.-M. Nuttall. 2002. Multiphase formation ofsuperimposed ice during a mass-balance year at a maritimehigh-Arctic glacier. J. Glaciol., 48(163), 545–551.
Wadham, J., J. Kohler, A. Hubbard, A.-M. Nuttall and D. Rippin.2006. Superimposed ice regime of a high Arctic glacier inferredusing ground-penetrating radar, flow modeling, and ice cores.J. Geophys. Res., 111(F1), F01007. (10.1029/2004JF000144.)
Wilhelms, F., J. Kipfstuhl, H. Miller, K. Heinloth and J. Firestone.1998. Precise dielectric profiling of ice cores: a new devicewith improved guarding and its theory. J. Glaciol., 44(146),171–174
MS received 2 July 2007 and accepted in revised form 3 October 2008
Langley and others: Sources of backscatter at 5.3GHz 383