SOURCES, EFFECTS AND RISKS OF IONIZING RADIATION · General Assembly, Seventy‑second Session,...
113
SOURCES, EFFECTS AND RISKS OF IONIZING RADIATION United Nations Scientific Committee on the Effects of Atomic Radiation UNSCEAR 2017 Report to the General Assembly, with Scientific Annexes UNITED NATIONS New York, 2018
Transcript of SOURCES, EFFECTS AND RISKS OF IONIZING RADIATION · General Assembly, Seventy‑second Session,...

SOURCES, EFFECTS AND RISKS OF IONIZING RADIATION
United Nations Scientific Committee on the Effects of Atomic Radiation
UNSCEAR 2017 Report to the General Assembly,
with Scientific Annexes
UNITED NATIONSNew York, 2018

NOTE
The report of the Committee without its annexes appears as Official Records of the General Assembly, Seventy‑second Session, Supplement No. 46* (A/72/46*).
The designations employed and the presentation of material in this publication do not imply the expression of any opinion whatsoever on the part of the Secretariat of the United Nations con‑cerning the legal status of any country, territory, city or area, or of its authorities, or concerning the delimitation of its frontiers or boundaries.
The country names used in this document are, in most cases, those that were in use at the time the data were collected or the text prepared. In other cases, however, the names have been updated, where this was possible and appropriate, to reflect political changes.
© United Nations, March 2018. All rights reserved, worldwide.
This publication has not been formally edited.
Information on uniform resource locators and links to Internet sites contained in the present publication are provided for the convenience of the reader and are correct at the time of issue. The United Nations takes no responsibility for the continued accuracy of that information or for the content of any external website.
UNITED NATIONS PUBLICATIONSales No. E.18.IX.1
ISBN: 978‑92‑1‑142322‑8eISBN: 978‑92‑1‑362680‑1

ANNEX B
EPIDEMIOLOGICAL STUDIES OF CANCER RISK DUE TO LOW-DOSE-RATE RADIATION FROM
ENVIRONMENTAL SOURCES
CONTENTS
I. INTRODUCTION ................................................................................................................................... 67
A. Background and aims ............................................................................................................... 67
B. Scope and study selection....................................................................................................... 68
II. STUDIES ON ENVIRONMENTAL EXPOSURE RESULTING FROM HUMAN ACTIVITIES ... 70
A. The Techa River Cohort studies in the Russian Federation ......................................... 70
1. Setting and sources of exposure ................................................................................... 70
2. Study population and follow-up ................................................................................... 71
3. Dosimetry ............................................................................................................................... 74
4. Cancer incidence and mortality ..................................................................................... 89
B. Studies of residents in 60Co-contaminated buildings in Taiwan, China ............... 96
III. STUDIES OF ENVIRONMENTAL EXPOSURE TO NATURAL RADIATION ............................. 98
A. Studies in Karunagappally, Kerala, India ............................................................................ 99
1. Radiation sources ................................................................................................................ 99
2. Study population ............................................................................................................... 100
3. Dosimetry ............................................................................................................................. 102
4. Cancer incidence ............................................................................................................... 107
B. Studies in Yangjiang, Guandong Province, China ........................................................ 109
1. Radiation sources .............................................................................................................. 109
2. Population characterization and follow-up ............................................................. 110
3. Dosimetry ............................................................................................................................. 110
4. Cancer mortality ................................................................................................................ 114
65
66 UNSCEAR 2017 REPORT
C. Other studies .............................................................................................................................. 116
1. Guarapari, Brazil ................................................................................................................. 116
2. Ramsar, Islamic Republic of Iran .................................................................................. 117
IV. STUDIES ON BACKGROUND RADIATION AND CHILDHOOD LEUKAEMIA .................... 118
A. Studies on natural background radiation ........................................................................ 118
1. Studies in the United Kingdom .................................................................................... 118
2. The Swiss study .................................................................................................................. 120
3. The Finnish study .............................................................................................................. 122
4. The French study ............................................................................................................... 123
B. Studies of environmental exposure from human-made sources ........................... 124
1. The case-control study in Belarus, the Russian Federation and Ukraine .................................................................................................................................. 124
V. BIOLOGICAL DOSIMETRY ............................................................................................................... 126
VI. COMPARATIVE EVALUATIONS OF SELECTED STUDIES ....................................................... 127
A. Studies in areas with elevated environmental radiation levels ............................... 128
1. Review of selected studies ............................................................................................. 128
2. Summary .............................................................................................................................. 138
B. Childhood leukaemia studies ............................................................................................... 140
1. Review of selected studies ............................................................................................. 140
2. Summary .............................................................................................................................. 147
C. Comparison with studies of acute exposure .................................................................. 148
VII. FUTURE RESEARCH NEEDS ............................................................................................................ 152
VIII. CONCLUSIONS ................................................................................................................................... 153
ACKNOWLEDGEMENTS .......................................................................................................................... 155
Members of the Expert Group on Epidemiological Quality ....................................... 155
REFERENCES ............................................................................................................................................... 157
ANNEX B: EPIDEMIOLOGICAL STUDIES OF CANCER RISK DUE TO LOW-DOSE-RATE RADIATION [...] 67
I. INTRODUCTION
A. Background and aims
1. The United Nations Scientific Committee on the Effects of Atomic Radiation (UNSCEAR) defined low dose rates of low-linear-energy-transfer (LET) radiation as those below 0.1 mGy per min averaged over an hour [U4, U12]. The effect of different low dose rates on the magnitude of cancer risk after exposure to ionizing radiation is, as yet, unclear. In the particular case of exposure to high-LET ionizing radiation, such as radon and its progeny inhaled into the lung, an inverse exposure-rate effect (also called a protraction enhancement effect) was detected from high cumulative exposure but was not seen for low cumulative exposure [G8, L9, W3]. In an inverse exposure-rate effect, for equal total dose, a greater risk is incurred by those whose total dose is accumulated at a lower rate over a longer duration than at a higher rate over a shorter duration. Regarding low-LET radiation, as pointed out by the UNSCEAR 1972 Report [U3], animal studies suggested that risks per radiation dose at lower dose rates could be lower than those at higher dose rates. The report also suggested that the risk estimates based on epidemiological studies of groups exposed at high dose rates would be overestimated for doses and dose rates received from environmental sources.
2. The Committee in its UNSCEAR 2000 Report suggested that the cancer risk coefficients per unit dose obtained from human populations exposed to low-LET radiation at low dose rates were not different from those obtained for the Japanese survivors of the atomic bombing, although the estimates have wide confidence intervals*1 [U6]. However, the Committee also pointed out that much still remained to be learned despite extensive knowledge of radiation risk gained through epidemiological investigations [U6]. Since then, new results obtained from various epidemiological studies have been published on low-dose-rate exposure to low-LET radiation from environmental sources, including studies on high natural background radiation (HNBR) areas and other settings.
3. Some populations are exposed to natural background radiation at levels that are several fold higher than the average worldwide [H4, N4, T3]. In addition, some populations have been exposed to low-dose-rate radiation from environmental releases of radioactivity due to human activities [H11, K8, P11, T18]. Epidemiological studies of these populations exposed to radiation delivered at low dose rates over long periods leading to cumulative doses up to several hundred milligrays (mGy) offer an opportunity to investigate the health effects associated with low-dose-rate radiation exposure. The Committee is well aware of the importance of such studies, but past UNSCEAR reports have not fully discussed the direct evidence of health effects due to low-dose-rate exposure [U5, U6, U8].
4. The epidemiological studies of populations exposed to environmental sources of radiation offer an opportunity to obtain risk estimates for the induction of cancer from low-dose-rate radiation exposure up to a cumulative dose of 500 mGy or more [B15]. The interest in the risk of cancer and other health effects in the general population due to radiation exposure at low doses (<100 mGy [U13]) and low dose rates has increased as a consequence of the Fukushima Daiichi nuclear accident on 11 March 2011 [W2]. A systematic examination of the risks associated with radiation exposure at low doses and low dose rates is, therefore, particularly timely.
1 Technical terms are explained in a detailed glossary, and are marked with an asterisk (*) the first time that they appear.
68 UNSCEAR 2017 REPORT
5. The Committee discussed the relevance of the dose and dose-rate effectiveness factor in the context of scientific evaluations of epidemiological studies of cancer risk from low-dose-rate exposure, which is defined as the reduction in effect per unit dose observed at low doses and low dose rates, compared with the effect per unit dose at high doses and high dose rates and first introduced by the International Commission on Radiological Protection (ICRP) [I3] for radiation protection purposes and then used by the Committee in its UNSCEAR 1993 Report [U4] to estimate cancer risk at low-dose and low-dose-rate radiation exposure on the basis of data obtained from high-doses and high-dose-rates.
6. At the time of applying the concept, the Committee defined low doses as those of 200 mGy or less and low dose rates as 0.1 mGy/min (averaged over one hour) or less for low-LET radiations such as X-rays and gamma rays [U4]. Meanwhile, the Committee has defined low dose by doses of less than 100 mGy [U13]. The Committee concluded generally that response functions would depend on a large number of factors that the scientific evidence for a reduction in the radiation-induced effects at low doses and low dose rates relative to acute exposures with moderate or high doses could not be expressed by a single value. Instead, the Committee is evaluating the effect of dose and dose rate by cancer type separately, and continues to review the developments in epidemiological, biological and statistical analyses that contribute to improved inference and estimation of low-dose and low-dose-rate health effects. Further, because radiation protection is not within the remit of the Committee, the use of such a reduction factor concept will not be discussed in this annex.
B. Scope and study selection
7. The present annex reviews epidemiological studies of cancer risk from exposure to low-dose-rate radiation from environmental sources, concentrating on studies with quantitative risk estimates derived from individual dose assessment. All major cohort and case-control studies on environmental exposure to natural and human-made sources of radiation that fulfil this requirement and were published by 2016 are included. The literature search was based on the PubMed database, and also on reference lists of identified reports and studies reported by experts to ensure the inclusion of studies published outside peer-reviewed journals. The review is based on studies that provide quantitative risk estimates per unit dose based on individual exposure estimates. The strengths and weaknesses of these studies, including their design and methods of dose estimation, are considered. Biodosimetric information is also included in order to explain the dosimetric quantities and to clarify any limitations and uncertainties associated with the current estimates of the health risk from low-dose and low-dose-rate environmental radiation exposure.
8. Some ecological (geographical correlation) studies and studies using standardized mortality ratio and/or standardized incidence ratio (SIR) (with the general population as a reference) are also described, but they are not evaluated in detail because of the inherent limitations. They can assess correlations between various population characteristics, and relate average levels of exposure to overall disease occurrence patterns, but cannot assess whether exposure and disease occur in the same individuals (see annex A). Some studies of environmental radiation exposure are not covered here because of their low statistical power (small study size), lack of dose–response analyses, or major methodological limitations. Studies evaluating cancer risk among residents in the vicinities of nuclear power plants, nuclear fuel processing plants and uranium mines or mills, or populations exposed to atmospheric bomb testing fallout were not included, except where substantial environmental exposure resulting in doses well above the normal background level has been documented and quantitative risk estimates reported.
ANNEX B: EPIDEMIOLOGICAL STUDIES OF CANCER RISK DUE TO LOW-DOSE-RATE RADIATION [...] 69
9. The Hanford Thyroid Disease Study [D6] could not evaluate the risk of thyroid cancer due to the small number of malignant cases. Likewise, the studies on cancer risk among residents of Marshall Islands due to fallout from atomic weapons testing did not provide meaningful risk estimates for cancer related to radiation exposure due to the small number of cases [S18]. Studies of residents in Utah and Nevada, United States did not have individual dose estimates or failed to provide quantitative risk estimates per unit dose [G3, S27]. Studies on cancer risk due to fallout from the Semipalatinsk test site in Kazakhstan had methodological shortcomings [A1, B9]. Some case-control studies of leukaemia did not evaluate dose response in a quantitative fashion and therefore failed to provide quantitative risk estimates comparable with other studies [A20].
10. This annex does not cover thyroid cancer risk after the Chernobyl accident because this was thoroughly reviewed by the Committee in its UNSCEAR 2008 Report [U11]. Studies on cancer other than childhood leukaemia in the Russian Federation and Europe after the Chernobyl accident are also excluded. These studies might be considered ecological (geographical correlation) analyses, because the dose estimation relies solely on area-based assignments and not on strictly individual characteristics. Such area-based exposure estimates are regarded as inferior to individual dose estimates, as they have greater uncertainty.* Further, dose levels among residents of areas contaminated by the fallout are very low so that the power to discern an effect is low. However, several important studies on childhood leukaemia in relation to background radiation published in the 2010s are included. These include major studies on natural background radiation, and also a large study in areas with a considerable fallout level from the Chernobyl accident.
11. Further, this annex excludes epidemiological studies of radon exposure because they have already been well documented by the Committee in its UNSCEAR 2006 Report (annex E) [U9] and others (e.g. [T9, W8]). Worker studies, while relevant to effects of low-dose-rate exposure, differ from environmental radiation exposure in the sense that they have a narrower range of exposed populations with limited generalizability, and were also covered in the UNSCEAR 2006 Report [U9]. Hence, they are mentioned only briefly.
12. Epidemiological studies of cancer risk associated with both external and internal exposure to ionizing radiation were the subject of extensive reviews by the Committee in its UNSCEAR 1994, 2000 and 2006 Reports [U5, U6, U8]. The UNSCEAR 2000 Report [U6], described the limitations of statistical power and the possibility of bias* or confounding* frequently constraining the ability to detect small increases in cancer risk. The report also emphasized that not all epidemiological studies were equally informative or of similar quality, and illustrated this point using some examples of dose–response relationships obtained from epidemiological studies and assessed their ability to detect cancer risk at low dose.
13. As noted by the Committee in its UNSCEAR 2006 Report [U8], epidemiological studies always have the possibility of bias or confounding, which may give rise to spurious results. Bias in a study may be defined as any process at any stage in the design or conduct of a study that tends to produce results or conclusions that differ systematically from the truth [S6]. Critical bias can arise in case ascertainment, subject selection and exposure assessment. Confounding is another major cause of erroneous results, and is caused by correlations between radiation exposure and other risk factors of the health outcomes studied [U8]. Thus, it should be noted that, particularly in low-dose studies, even a small degree of bias or confounding can distort study results substantially due to the small true excess risk. Therefore, consideration of methodological issues is especially important in such studies.
14. A detailed outline of procedures and quality criteria for the assessment of epidemiological studies is given in annex A, along the lines of guidance used in past UNSCEAR reports [U6, U8]. Annex A emphasizes a comprehensive selection of studies, with a consistent approach in evaluating the potential

70 UNSCEAR 2017 REPORT
for bias and the contribution to the question being evaluated. These include (a) selection bias* in the study population; (b) information bias* with regard to exposure and outcome; (c) confounding by other risk factors for the health outcome of interest; (d) statistical power (study size relative to dose level, background risk and length of follow-up); (e) availability of dose estimates for the relevant organ at individual level; (f) information on other sources of radiation exposure than that being evaluated, which is needed to avoid exposure misclassification*; and (g) comprehensive assessment of the outcome based on consistent diagnostic criteria. The procedures, as described in annex A, were applied here when reviewing epidemiological studies of cancer risk from exposure to low-dose and low-dose-rate radiation from environmental sources.
15. In accordance with annex A and the Governing Principles2 of the Committee, potential conflict of interest of investigators was evaluated for all studies included in this annex. No conflict of interest jeopardizing impartiality was reported in the studies discussed here, though several lacked explicit statements. Funding sources were reported by most studies and some had received support from sources that may have financial interests.
II. STUDIES ON ENVIRONMENTAL EXPOSURE RESULTING FROM HUMAN ACTIVITIES
A. The Techa River Cohort studies in the Russian Federation
1. Setting and sources of exposure
16. The Techa River is a medium-sized river that flows from a small lake located near the Mayak Production Association, a plutonium production complex, about 100 km northwest of Chelyabinsk City in the Southern Ural Mountains in the Russian Federation. The Techa River flows for about 240 km through rural areas in Chelyabinsk and Kurgan Oblasts in the Ural regions (an oblast corresponds to a province, a large geographical region) before merging with the Iset River. In the early 1950s, there were 41 villages on the river banks (26 in Chelyabinsk Oblast and 15 in Kurgan Oblast) with populations ranging in size from fewer than 100 to slightly more than 3,000 inhabitants. There were only 10 communities with populations of over 1,000 [K11].
17. Doses from background sources of natural radiation for the Techa River communities were the same as for other communities in the region. The average annual external background dose for the rural residents of Chelyabinsk Oblast is about 0.83 mSv a−1 [S20]. The average annual effective dose from 40K is equal to 0.2 mSv a−1. Doses from radon and its daughters in the Techa River region were 1.7–6.2 mSv a−1 [Z8].
18. There were three potential sources of exposure related to the Mayak Production Association in the Ural region: (a) dumping of radioactive waste into the Techa River in the early 1950s; (b) the explosion (non-nuclear) of a storage tank in 1957 (the Kyshtym accident) that created the Eastern Ural
2 http://www.unscear.org/unscear/en/about_us/governingprinciples.html

ANNEX B: EPIDEMIOLOGICAL STUDIES OF CANCER RISK DUE TO LOW-DOSE-RATE RADIATION [...] 71
Radioactive Trace (EURT); and (c) the dispersion of radioactive dust in 1967. The radioactive contamination resulted from the huge accumulation of radioactive waste from atomic weapon production at the Mayak Production Association, which began operating its first atomic reactor and radiochemical plant for plutonium separation in 1948. The process of plutonium separation at this plant resulted in the accumulation of a large amount of liquid waste consisting of mixtures of radionuclides. Beginning in March 1949, when the specially designed tanks that were initially used for storing liquid radioactive waste proved to be of limited capacity, another approach was used which involved releases of liquid waste into the Techa River, and into the Karachay Lake [D9]. Dumping radioactive waste into the river and Kyshtym accident caused contamination by long-lived radionuclides, mainly 90Sr (a half-life of 28.8 years), in a large area in the Ural region.
19. As the nature and extent of the releases became apparent, a number of countermeasures were undertaken. These included application of engineering, administrative and agricultural radiation protection activities and, most importantly, resettlement. Although the efficacy of these measures proved to be low because of the delays in implementation, between 1954 and 1960 up to 8,000 people residing in 19 villages on the upper and middle reaches of the river were resettled. For those who continued living in the Techa riverside villages, restrictions were imposed on use of the river and the floodplain for any purposes. It should be noted that a portion of the Techa riverside residents were once more exposed to radiation due to the waste storage tank explosion in 1957 [A6].
2. Study population and follow-up
(a) Study population
20. The first specialized medical examinations for residents of the Techa riverside villages took place in 1951, two years after the initial releases. The examinations were performed by visiting teams of specialists from the Biophysics Institute, USSR Ministry of Health, and the Mayak Production Association Clinic. Since 1955, the residents of the Techa riverside villages have been followed up by physicians of the clinic of the Urals Research Centre for Radiation Medicine (URCRM) under the Federal Medical-Biological Agency of the Russian Federation [A7, A10, K11]. The URCRM is working closely with local hospitals, specialized oblast health centres and organizations (e.g. Office of Health Statistics, oncology dispensaries), and its clinic is the only health centre specializing in radiation medicine with the goal of rendering medical services to the exposed population of the Ural region. Thus, the exposed people have received specialized medical examinations and treatment at the same health centre for a long period (over six decades).
21. In 1967, the URCRM research staff initiated the process of identifying all people who lived in Techa riverside villages between 1950 and 1960, using five major sources of data: (a) local tax books; (b) medical examination records; (c) population surveys; (d) lists of evacuees resettled in uncontaminated villages; and (e) death certificates (for residents who died in the 1950s). Primarily, the Techa River Cohort (TRC) included residents who were born before 1 January 1950, and lived in a Techa riverside village in the period from 1 January 1950 through 31 December 1952, at the time the highest amounts of radioactive waste were released. The development of the Techa River Dosimetry System (TRDS), which exists in two versions (TRDS-2000 and TRDS-2009) provided a means for the enhancement of the TRC by including residents who had come to live in the Techa riverside area in the period from 1953 through 1960 (late entrants). Thus, the TRC now includes those born before 1 January 1950 who lived in riverside villages at any time during the period from 1 January 1950 through 31 December 1960. As of 2011, the TRC included 29,730 persons. Table 1 shows the
72 UNSCEAR 2017 REPORT
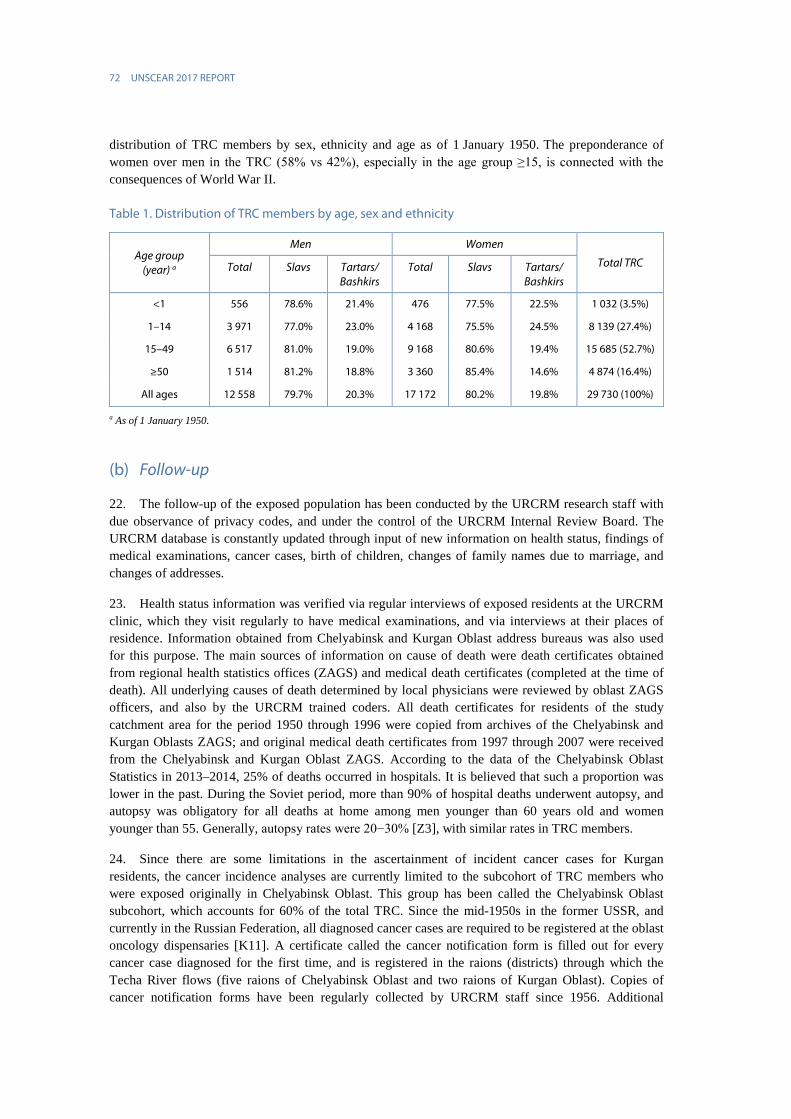
distribution of TRC members by sex, ethnicity and age as of 1 January 1950. The preponderance of women over men in the TRC (58% vs 42%), especially in the age group ≥15, is connected with the consequences of World War II.
Table 1. Distribution of TRC members by age, sex and ethnicity
Age group (year) a
Men Women
Total TRC Total Slavs Tartars/ Bashkirs
Total Slavs Tartars/ Bashkirs
<1 556 78.6% 21.4% 476 77.5% 22.5% 1 032 (3.5%)
1–14 3 971 77.0% 23.0% 4 168 75.5% 24.5% 8 139 (27.4%)
15–49 6 517 81.0% 19.0% 9 168 80.6% 19.4% 15 685 (52.7%)
≥50 1 514 81.2% 18.8% 3 360 85.4% 14.6% 4 874 (16.4%)
All ages 12 558 79.7% 20.3% 17 172 80.2% 19.8% 29 730 (100%)
a As of 1 January 1950.
(b) Follow-up
22. The follow-up of the exposed population has been conducted by the URCRM research staff with due observance of privacy codes, and under the control of the URCRM Internal Review Board. The URCRM database is constantly updated through input of new information on health status, findings of medical examinations, cancer cases, birth of children, changes of family names due to marriage, and changes of addresses.
23. Health status information was verified via regular interviews of exposed residents at the URCRM clinic, which they visit regularly to have medical examinations, and via interviews at their places of residence. Information obtained from Chelyabinsk and Kurgan Oblast address bureaus was also used for this purpose. The main sources of information on cause of death were death certificates obtained from regional health statistics offices (ZAGS) and medical death certificates (completed at the time of death). All underlying causes of death determined by local physicians were reviewed by oblast ZAGS officers, and also by the URCRM trained coders. All death certificates for residents of the study catchment area for the period 1950 through 1996 were copied from archives of the Chelyabinsk and Kurgan Oblasts ZAGS; and original medical death certificates from 1997 through 2007 were received from the Chelyabinsk and Kurgan Oblast ZAGS. According to the data of the Chelyabinsk Oblast Statistics in 2013–2014, 25% of deaths occurred in hospitals. It is believed that such a proportion was lower in the past. During the Soviet period, more than 90% of hospital deaths underwent autopsy, and autopsy was obligatory for all deaths at home among men younger than 60 years old and women younger than 55. Generally, autopsy rates were 20−30% [Z3], with similar rates in TRC members.
24. Since there are some limitations in the ascertainment of incident cancer cases for Kurgan residents, the cancer incidence analyses are currently limited to the subcohort of TRC members who were exposed originally in Chelyabinsk Oblast. This group has been called the Chelyabinsk Oblast subcohort, which accounts for 60% of the total TRC. Since the mid-1950s in the former USSR, and currently in the Russian Federation, all diagnosed cancer cases are required to be registered at the oblast oncology dispensaries [K11]. A certificate called the cancer notification form is filled out for every cancer case diagnosed for the first time, and is registered in the raions (districts) through which the Techa River flows (five raions of Chelyabinsk Oblast and two raions of Kurgan Oblast). Copies of cancer notification forms have been regularly collected by URCRM staff since 1956. Additional
ANNEX B: EPIDEMIOLOGICAL STUDIES OF CANCER RISK DUE TO LOW-DOSE-RATE RADIATION [...] 73
information sources include case histories and outpatient charts retained at the URCRM and other health centres in Chelyabinsk City, interviews with the next of kin, cytology and histology logs kept by the Chelyabinsk Oblast Oncology Dispensary, records of the Oblast Oncology Bureau of the medical-social commission of experts, and the unified computer registry for the exposed South-Ural population. The updated URCRM database contains virtually complete information on cancer diagnoses among the exposed population registered in five regions of Chelyabinsk Oblast and Chelyabinsk City during 1956–2016.
25. Follow-up for leukaemia incidence in Chelyabinsk and Kurgan Oblasts started in 1953. In 1953–1954, the sources of information for leukaemia patients exposed in the Southern Urals were clinical records of the Ozyorsk town hospital and the Clinical Department of the Moscow Biophysics Institute, copies of which are stored in the URCRM archives. Since 1955, the URCRM clinical department has been functioning as a major haematology centre providing treatment and medical assistance to people exposed in all the Techa riverside raions [K15].
26. In the TRC study, a substantial proportion (14%) of cohort members are known to have moved to nearby cities and towns in Chelyabinsk, Sverdlovsk and Kurgan Oblasts, and a small proportion (3−4%) moved to distant areas [K10]. The dates and places of migration have been obtained from address bureaus in the relevant oblast and were included in the MAN-database, which was created in the URCRM to support the follow-up of exposed people [A8]. The loss to follow-up* status was unrelated to dose levels (non-selective). For cohort members living outside the Chelyabinsk or Kurgan Oblasts, the chance of determining current vital status or date and cause of death is small because it is not feasible to send queries to address bureaus throughout the country. Also, URCRM staff do not have access to ZAGS records in other areas [K11]. The catchment area for non-leukaemia malignancies is limited to the five Chelyabinsk raions in the original catchment area and Chelyabinsk City.
27. Descriptive characteristics of the cohort, namely, catchment area, follow-up period, cases included in the mortality and incidence studies in different periods, are presented in table 2. The “lost to follow-up” group includes persons who were excluded from analysis after migration from the catchment area (the exact date of migration is known) or after the latest ascertainment of their vital status in the catchment area (i.e. migrants and persons with unknown status taken together). Migration rates for incidence analysis, especially for solid cancers, were higher than for mortality analysis because the catchment area for solid cancer incidence analysis was limited to five Chelyabinsk Oblast raions and Chelyabinsk City whereas for the mortality analysis, the catchment area included the whole Chelyabinsk and Kurgan Oblasts.

74 UNSCEAR 2017 REPORT
Table 2. Summarized characteristics for TRC studies performed in different periods
Study Cohort size a
Period of follow-up
Person-years
Catchment area b, c
Lost to follow-up d
(%)
Unknown cause of
death (%)
Number of cases
Leukaemia mortality, TRDS-2000 [K16]
29 873 1950–1999 865 811 MCA 23.5 (14.0+9.5)
11 61 (including 12 CLL)
Leukaemia incidence, TRDS-2009 [K18]
28 223e 1953–2007 847 877 MCA 21.5 (14.8+6.7)
9.8 99 (including 27 CLL)
Solid cancer mortality, TRDS-2009 [S3]
29 730 1950–2007 927 743 MCA 22.7 (15.8+6.9)
9.0 2 303 (22 bone cancers excluded)
Solid cancer incidence, TRDS-2009 [D5]
17 435f 1956–2007 472 788 ICA 26.8 (21.1+5.7)
9.2 1 933 (excluding non-melanoma skin cancers)
a Numbers of cohort members differ in different years because periodically duplicates were identified (most of them were women who changed their family names at marriage). b MCA (mortality catchment area) includes two oblasts: Chelyabinsk Oblast+Kurgan Oblast. c ICA (incidence catchment area) includes five raions in Chelyabinsk Oblast+Chelyabinsk City. d % of migrants+% of persons with unknown status at the end of follow-up are indicated in parenthesis. e Number of cohort members excluding those who had died or migrated from MCA before 1 January 1953. f Number of cohort members excluding those who had died or migrated from ICA before 1 January 1956.
3. Dosimetry
(a) Radiation source terms
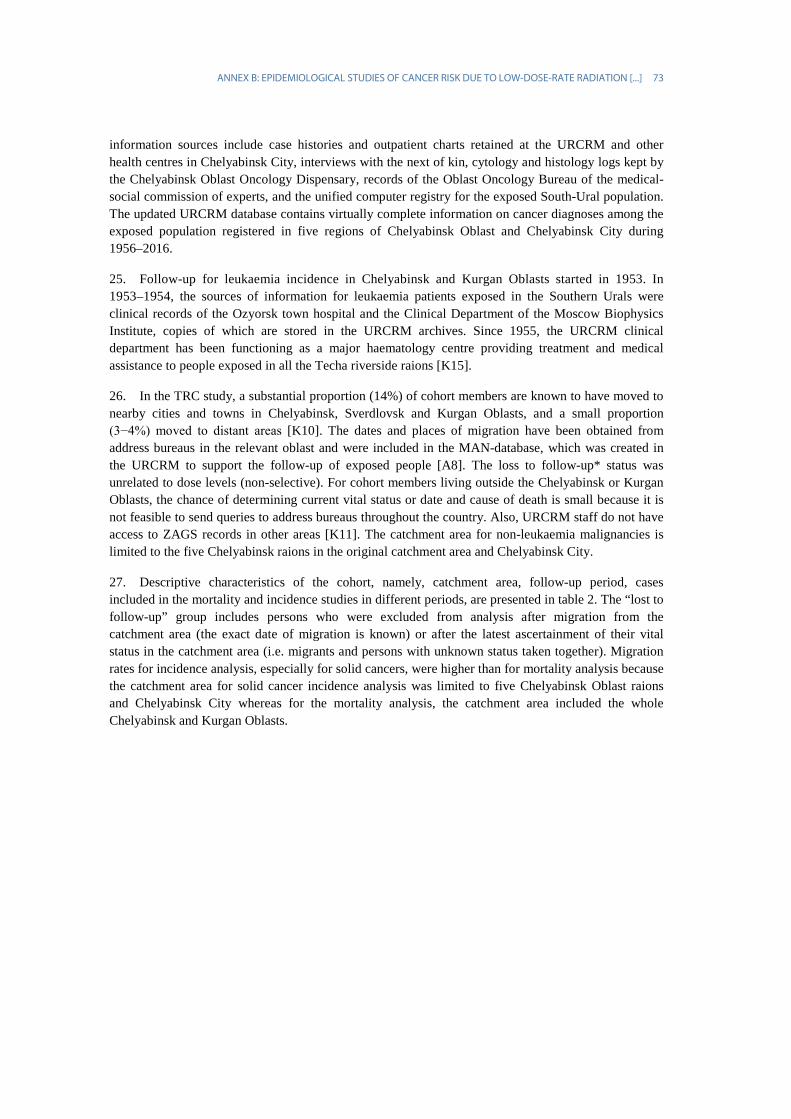
28. The main source of environmental contamination was the release of liquid radioactive waste into the Techa River in 1949–1956. Massive releases started in September 1950 and reached a maximum in October 1951. The TRDS-2000 and TRDS-2009 estimates of the releases are shown in figure I. The total release for 1949–1951 was estimated as 1.14 × 10¹⁷ Bq [D16, S12]. The releases represented a mixture of the radionuclides 89Sr, 90Sr, 137Cs, 95Zr, 95Nb, 103Ru, 106Ru and rare-earth isotopes. About half of the waste was released late in 1951 [D16]. Parameters of the Techa River source term used in TRDS-2000 were taken from the Mayak Production Association reports based on expert estimates [I6, J8]. More reliable estimates were used in TRDS-2009 [D16, G4, G5].
29. There were routine releases from the radiochemical plant and accidental releases due to leaks of high-level waste from the special tank-storage facility [D16]. A major accidental release took place during 8−12 October in 1951. On 28 October 1951, major releases were switched to Karachay Lake, and this resulted in a significant decrease in discharges into the Techa River in the subsequent five years. The releases into the river totalled 3.5 × 10¹⁴ Bq in 1952 and (2–7) × 1013 Bq a−1 in 1953–1956 (figure I). In 1956, the river bed of the upper Techa was dammed, and the penetration of radioactivity to the lower parts of the river decreased to about 7 × 10¹² Bq a−1. The construction of another dam and bypass canals in 1963 effectively isolated the contaminated upper Techa region.
ANNEX B: EPIDEMIOLOGICAL STUDIES OF CANCER RISK DUE TO LOW-DOSE-RATE RADIATION [...] 75
30. The routine and accidental releases differed in characteristics such as radionuclide composition and distribution of activity released in solution and adsorbed on solid particles. The characteristics of typical routine releases and the major accidental release are shown in table 3.
31. In September 1957, a tank with high-level waste exploded and discharged 7.4 × 10¹⁶ Bq into the atmosphere. The fallout from the radioactive plume formed the EURT. About 66% of the activity was 144Ce+144Pr; 25% was 95Zr+95Nb; 5.5% was 90Sr+90Y and 0.04% was 137Cs [A19, B2, J8].
Table 3. Amounts of radionuclides that entered Techa River with routine and accidental releases (in soluble form and adsorbed on solid particles) for particular calendar periods, as reconstructed [S12]
Nuclide
Routine release in TBq d−1 (September 1950–April 1951)
Accidental release in TBq d−1 (8–12 October 1951)
In solution On solid particles Total In solution On solid particles Total
90Sr 2 0.7 2.7 50 200 250
89Sr 18 6 24 30 120 150
137Cs 16 0 16 50 200 250
106Ru 6 11 17 60 240 300
144Ce 0.2 5 5.2 550 2 200 2 750
85Zr 2.5 4 6.5 100 400 500
85Nb 3.7 6 9.7 150 600 750
Figure I. Previous (TRDS-2000) and new (TRDS-2009) estimates of dynamics of total activity of radioactive releases from Mayak Production Association into the Techa River in 1949–1956 (according to [D16])
Averages for one-month periods are given for October 1951–September 1952

76 UNSCEAR 2017 REPORT
(b) Environmental radionuclide levels
32. The first data on environmental contamination in the area adjacent to the Mayak Production Association in the early 1950s had been presented in archived documents, which were later published in peer-reviewed journals [A11, A12, I6]. The level of river water contamination decreased with distance from the point of release due to dilution with non-contaminated water, sedimentation of suspended particles in up-river ponds and sorption of radionuclides by bottom sediments and floodplain soils along the river.
33. Models describing radionuclide transport in the Techa River were developed to evaluate the concentration of particular radionuclides in the water, bottom sediments and flooded soils, for the initial period of contamination (1949–1951) when environmental monitoring data were scarce [M5, S10, S12, V6]. A simple model described in a study by Vorobiova and Degteva [V6] was used in the TRDS-2000 for dose reconstruction purposes. An improved model, developed after the TRDS-2009, correlates the revised parameters of the source term and available historical data on environmental contamination [S12]. The model output provides concentrations of all source-term radionuclides, including short-lived radionuclides in the river water, bottom sediments and floodplain soils at different distances from the site of radioactive releases. The outputs of the model show good agreement with historical measurements (figure II).
Figure II. Specific (total beta) activity of water in relation to distance along free-flowing Techa River in 1951 (according to [S12])
D-4 is the designation of dam number 4 located at 7 km from the release site and separated the free-flowing Techa River from
up-river ponds. Vertical bars indicate standard deviations of measurements

ANNEX B: EPIDEMIOLOGICAL STUDIES OF CANCER RISK DUE TO LOW-DOSE-RATE RADIATION [...] 77
34. Temporal changes that occurred in contaminated areas is described in the scientific literature [B4, M4, V6, V7]. Figure III shows that the specific activity of water decreased with time as a result of reduction and subsequent cessation of discharges and of radioactive decay of radionuclides [T14]. Since the 1970s, river water contamination was predominantly due to 90Sr, and the concentration of 137Cs in water was an order of magnitude less [M4].
35. A fairly rapid decrease in the levels of radioactive contamination was observed in the EURT after 1957 due to decay of 95Zr, 95Nb, 106Ru and 144Ce [A19, B2, J8]. Since the fifth year after the accident, soil contamination was almost completely due to 90Sr.
Figure III. Specific (total beta) activity of water in Techa River measured in different calendar years near the reference settlement Muslyumovo located at 78 km from release site [T14]
(c) The Techa River Dosimetry System (TRDS)
36. The TRDS version created in 2000 (TRDS-2000) was used initially to derive risk coefficients for TRC members [K15, K16, K17]. An improved version, TRDS-2009, introduced in 2009, calculates deterministic values of dose estimates and is currently used to derive risk estimates [D5, K18, P12, S3]. TRDS-2017, under preparation, will incorporate improvements made since 2009, including the use of a two-dimensional Monte-Carlo procedure that will result in the calculation of stochastic dose estimates.
37. Dose reconstruction in the TRDS was based on the use of a large number of measurements of long-lived radionuclides in the human body [K12, K14] and in the environment, and also on the measurements of exposure rates performed directly in places where people lived. The traditional approach of analysing all steps of the pathway of exposure was used as a backup only when other approaches were exhausted, in particular for reconstruction of doses from short- and intermediate-lived radionuclides released into the Techa River in 1949–1951 [D9, D10, D12, D13].

78 UNSCEAR 2017 REPORT
38. The TRDS calculates doses from the major routes of environmental exposure: external exposure from staying (mainly living and working) in the areas along the banks of the Techa River and in the region of the EURT; and internal exposure from intakes acquired along the banks of the Techa River and in EURT villages. Individual residence history data are used for dose calculations. The time of the end of dose accumulation is also determined individually (e.g. date of death or date of emigration).
(d) External exposure
39. The absorbed doses due to external exposure were estimated on the basis of dose measurements of gamma rays (a) along the banks of the river; (b) on the shore within a few hundred metres from the water in specified areas of villages; and (c) inside some of the houses [D8]. Outdoor measurements were conducted periodically at 25 monitoring posts along the shoreline of the river. Dose rates along the river decreased significantly with distance from the discharge point. Measurements were also performed at different distances from the shoreline in a residential area located on the upper part of the Techa River [D12, D13] because substantial external exposure occurred when people were in the contaminated floodplain [D12, D13].
40. The ratios between outdoor and indoor air kerma rates were obtained from a 1954 survey of 10 houses, and were used to estimate the indoor absorbed dose in air. The length of time spent on the river bank and the indoor occupancy factors were derived from observational data obtained in the 1950s. For hours spent at each of those three locations, age-specific values were used [D10]. The occupancy factors are based on limited historical data, and the uncertainty in external dose estimation due to these factors is unlikely to be improved after more than 50 years.
41. The TRDS provides average external dose estimates for groups of subjects of the same age who lived at the same time in the same location on the Techa River. External doses significantly decreased with distance from the site of release (figures IV and V). The external dose rate was highest in 1951, and then it decreased with time.
42. The cumulative absorbed dose to an organ o of a resident who lived at location L on the Techa River in the period from tbegin to tend was calculated according to the following equation:
where:
= absorbed dose of external exposure in organ o accumulated to individual who lived at location L in the period from tbegin to tend;
= absorbed dose rate in air near the river shoreline at location L in year t;
= ratio of dose rate in air outdoors at homes to the dose rate by the river at location L;
= 0.45 - ratio of dose rate indoors to that outdoors (derived from historical exposure- rate measurements);
= conversion factor from absorbed dose in air to organ o (function of age);
( ) ( )[ ] dtATRTRTtPD ageo
ageoutin
ageLrivout
aget
t
Lriv
extLo
end
begin
3/2/1, ++= ∫
extLoD ,
)(tP Lriv
LrivoutR /
outinR /
ageA0
ANNEX B: EPIDEMIOLOGICAL STUDIES OF CANCER RISK DUE TO LOW-DOSE-RATE RADIATION [...] 79
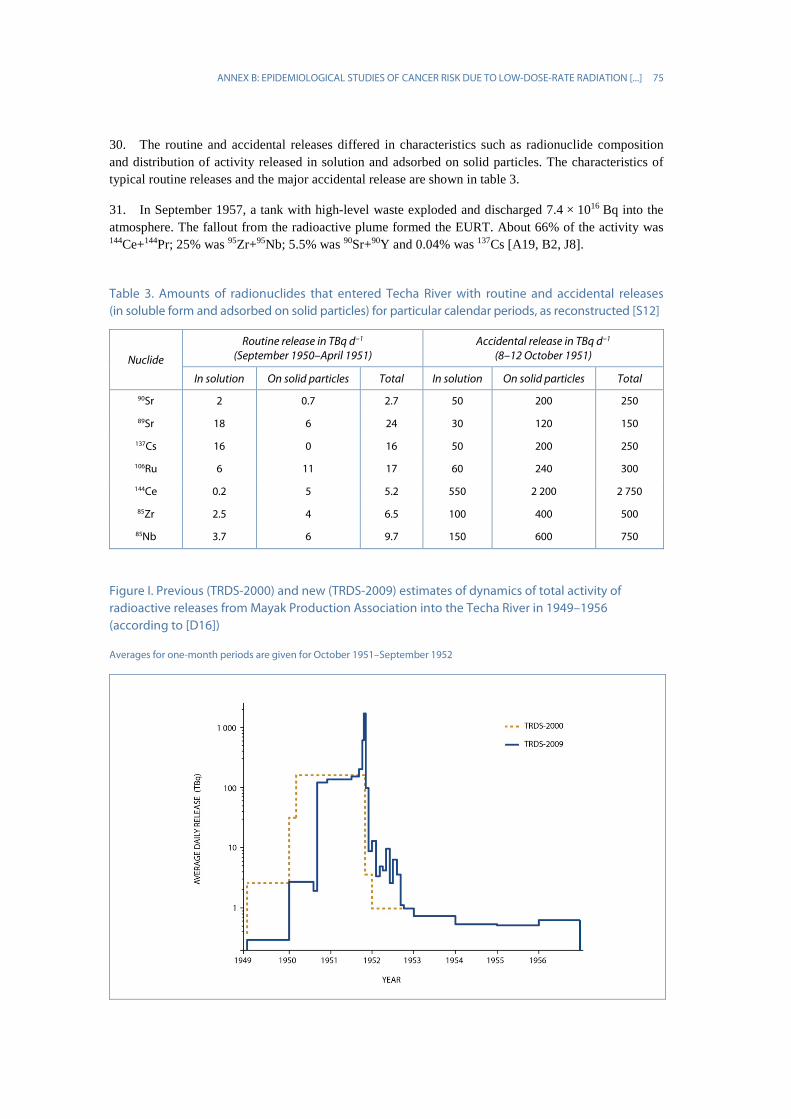
, , = periods of time spent by residents on river bank, outdoors and indoors, respectively (functions of age); TRDS-2009 includes the dose-conversion factors for 23 organs/ tissues [E1, P4, S5, S15].
43. Dose rates in air above the river shoreline are shown in figures IV and V [S10]. The dose
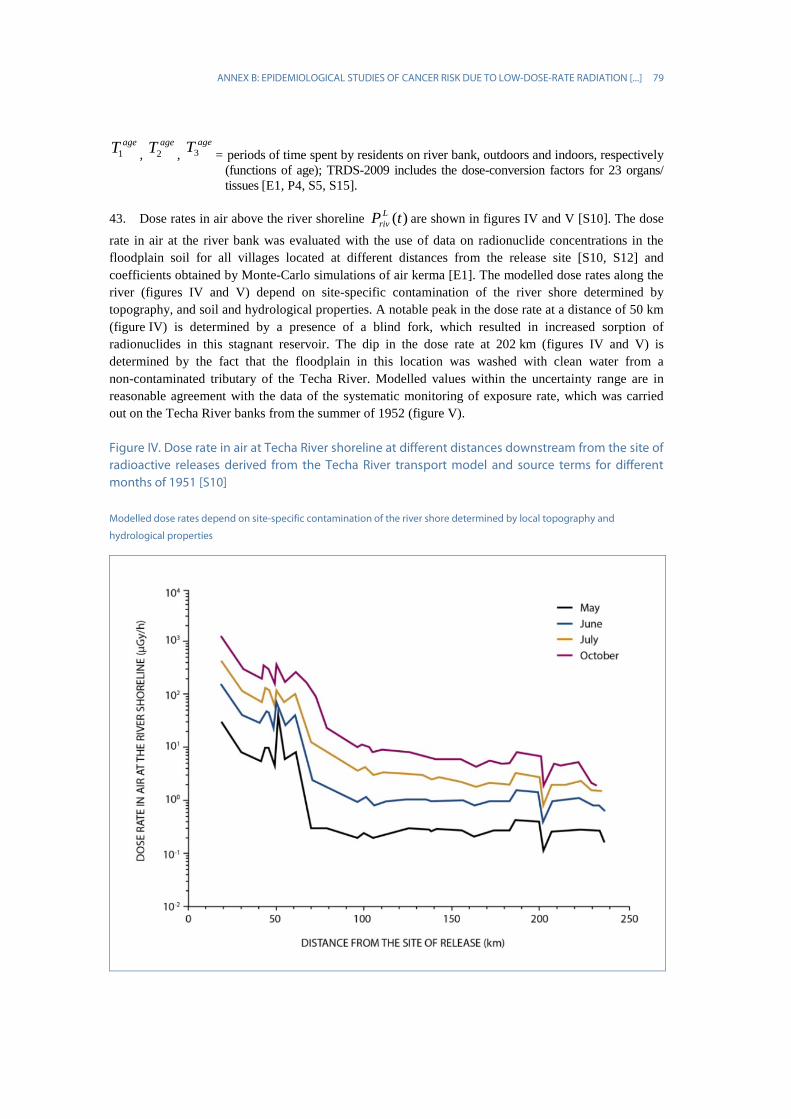
rate in air at the river bank was evaluated with the use of data on radionuclide concentrations in the floodplain soil for all villages located at different distances from the release site [S10, S12] and coefficients obtained by Monte-Carlo simulations of air kerma [E1]. The modelled dose rates along the river (figures IV and V) depend on site-specific contamination of the river shore determined by topography, and soil and hydrological properties. A notable peak in the dose rate at a distance of 50 km (figure IV) is determined by a presence of a blind fork, which resulted in increased sorption of radionuclides in this stagnant reservoir. The dip in the dose rate at 202 km (figures IV and V) is determined by the fact that the floodplain in this location was washed with clean water from a non-contaminated tributary of the Techa River. Modelled values within the uncertainty range are in reasonable agreement with the data of the systematic monitoring of exposure rate, which was carried out on the Techa River banks from the summer of 1952 (figure V).
Figure IV. Dose rate in air at Techa River shoreline at different distances downstream from the site of radioactive releases derived from the Techa River transport model and source terms for different months of 1951 [S10]
Modelled dose rates depend on site-specific contamination of the river shore determined by local topography and
hydrological properties
ageT1ageT2
ageT3
)(tP Lriv
80 UNSCEAR 2017 REPORT
Figure V. Modelled and measured dose rate in air at Techa River shoreline at different distances downstream from site of radioactive releases in 1952–1958 [S10]
Vertical bars indicate standard deviations for repeated measurements, single measurement results are shown without uncertainties
44. Outdoor-to-river bank ratios ( ) were derived from exposure-rate measurements
performed at different distances from the shoreline in different locations [V7]. The village-average values of were used in the TRDS.
45. Parameters , , were derived from data from the 1950s of typical lifestyle patterns
for different age groups of the Techa riverside residents [D13]. Age-dependent conversion factors from absorbed dose in air to absorbed dose in organs ( ) were taken from the literature [E1, P4].
46. Three methods were used for validation of external doses on the Techa River: the luminescence method with bricks [B17, J1, T5, W9]; the electron paramagnetic resonance (EPR) method with human teeth [D11, S14]; and the fluorescence in situ hybridization (FISH) method with human lymphocytes [B8, D11, V9]. Luminescence measurements of anthropogenic dose in bricks from old buildings located on the Techa River banks were converted to cumulated dose in air and the results were found to be consistent with calculations performed using the TRDS parameters [T5, T6, U2]. EPR- and FISH-based estimates of external dose for residents of settlements located in the upper reaches of the Techa River were consistent with the TRDS-based absorbed doses in tooth enamel and muscle [D17].
LrivoutR /
LrivoutR /
ageT1ageT2
ageT3
ageA0

ANNEX B: EPIDEMIOLOGICAL STUDIES OF CANCER RISK DUE TO LOW-DOSE-RATE RADIATION [...] 81
47. For reconstruction of external dose on the EURT, dose rates in air per unit-deposition density of 90Sr were used. These values and data on original soil contamination by 90Sr for different settlements were published by Bakurov et al. [B2].
(e) Internal dose reconstruction
48. Internal exposure was due to ingestion of radionuclides through drinking river water and consuming local foodstuffs. An extraordinarily powerful flood in April to May 1951 led to the radioactive contamination of the land adjacent to the river. The flood-lands were used by some of the inhabitants for cattle breeding and for making hay. Up to this point radionuclides had been ingested mainly with water; now, contaminated food began to play a role, especially milk and vegetables from flooded kitchen gardens.
49. The reconstruction of internal dose relies strongly on the results of measurements of 90Sr in residents of the Urals, which includes the results of nearly 10,000 post-mortem measurements of radionuclide concentration in bone samples obtained in 1951–1993, the results of in vivo measurements of surface-beta activity of anterior teeth for 17,500 persons (1959–1997), and measurements of 90Sr-body burden by means of a unique whole-body counter for 20,500 persons (1974–1997) [D13, K12, K14, T15].
50. According to a basic approach to internal dose estimation, the absorbed dose in organ o accumulated through calendar year Y for a resident who lived at location L on the Techa River in the period from tbegin to tend is calculated as:
where
= absorbed dose of internal exposure in organ o accumulated through calendar year Y by individual i who lived at location L in the period from tbegin to tend;
y = year of intake of radionuclides;
r = identifier of ingested radionuclide (89Sr, 90Sr, 95Zr, 95Nb, 103Ru, 106Ru, 137Cs, 141Ce, 144Ce);
τi = the age of individual i in year y;
I*y,r,L = intake function (Bq) for year y, radionuclide r, and location L (function of age τ,
related to y);
I* = I × ξi, where ξi is a modifier predetermined for individual i equal to 1 or IMRi or HSRi; DFr,o,Y-y = conversion factor (Gy Bq−1) for dose accumulated in organ o in year Y-y from intake of radionuclide r in year y (function of age, related to y); TRDS-2009 includes the dose-conversion factors for 23 organs/tissues [E1, P4, S5, S15].
∑ ∑=
−=end
begin
t
tyiyYor
riLry
YLo DFID )()( ,,
*,,, ττ
YLoD ,

82 UNSCEAR 2017 REPORT
51. The intake function Iy,r,L is a complex, time-dependent function derived from a combination of data from tooth beta counting and the whole-body counter. The village-average intake function Iy,r,L for each year y is calculated as:
, where
= 90Sr intake for adult residents of the reference settlement in year y (Bq);
= 90Sr intake for the other age group tau relative to that for adults living in the reference settlement R;
= ratio of 90Sr intake for location L to 90Sr intake for residents of the reference settlement;
= ratio of radionuclide (r)-to-90Sr intake for location L in year y.
52. The 90Sr intake in the reference settlement R ( ) during the first years (y) after the beginning
of the discharges was reconstructed using the data on 90Sr measurements in teeth, and supplementary data on water consumption and diet composition for adults and children, and measurements of 90Sr-body burden in adults [T15]. A new method of solving an inverse problem was developed by using an integral equation associating 90Sr-intake dynamics with the age-dependency of 90Sr content in teeth. This allowed the assessment of the relative intake function for adult residents of the reference settlements during the period of maximum intake [Z2]. Parameters of the integral equation, describing ratios of semi-annual 90Sr intake for different age groups to that for adults living in the reference settlement, were evaluated on the basis of data on the daily composition of diet [T15].
53. The 90Sr intake depends on the village of residence, which is actually a surrogate for the source of drinking water (contaminated river/wells). The assessment of the village-average 90Sr intake is based on the assumption that the ratio between 90Sr intake in a particular settlement and 90Sr intake in Muslyumovo is equal to the ratio between the average value of 90Sr-body burden for the particular settlement and the corresponding value for Muslyumovo, obtained on the basis of internal radiation dose assessment with whole-body counter.
54. Radionuclides other than 90Sr were also released into the Techa River, including 137Cs and shorter-lived uranium-fission products (89Sr, 95Zr, 95Nb, 103,106Ru, 141,144Ce). Because river water was the main source of internal exposure, ratios of radionuclide concentrations to that of 90Sr, calculated using the Techa River model were used for assessment of their intakes with river water [D9, D10]. In addition, the intake of 137Cs with cows’ milk was considered in TRDS-2009 because it became a major pathway after the flood in April 1951 [T14].
55. Radionuclide intakes normalized per 1 Ci/km2 of 90Sr deposition in the EURT area were derived from measurements of radionuclides in local foodstuffs in reference settlements [T13]. Data on 90Sr deposition for other EURT settlements were used to reconstruct the intake for the residents [B2].
56. Dose-conversion factors representing absorbed dose in organ per unit intake (DFr,o,Y-y) were calculated using biokinetic models (describing time-dependent retention of radionuclide in source-tissues) and dosimetric models (describing energy deposition in target-tissue from radiation emitted by source-tissues). The dosimetric model of bone tissue was used for calculation of dose absorbed in red bone marrow (RBM) from 89,90Sr incorporated in the skeleton [S24]. Dose conversion factors for other radionuclides were based on the models from the ICRP Publication 67 [I4].
LSrry
SrL
SrR
SrRyLry RfII /,
9090,
90,,, )( ×××= τατ
90,
SrRyI
90,
SrRτα
90SrLf
LSrryR /,
90,
SrRyI

ANNEX B: EPIDEMIOLOGICAL STUDIES OF CANCER RISK DUE TO LOW-DOSE-RATE RADIATION [...] 83
57. A special age- and sex-dependent biokinetic model was used for 89,90Sr dose calculation [S8, S13]. This model has a similar structure to the ICRP-67 model (described by Leggett [L3]) and is based on the same approach. The difference is that the model parameters were evaluated separately for men and women in a wider age range (0–80 years). The Techa River data on 90Sr in humans, recent data on age- and sex-dependencies of calcium content in the skeleton, and data on bone remodelling were used for parameter evaluation. Figure VI shows that model calculations, corresponding to intake levels in Muslyumovo, satisfactorily describe 90Sr-body burdens obtained from whole-body counter radiation monitoring. The age peaks in 90Sr-body burden correspond to the maximum in skeletal calcium accretion rate associated with the growth spurt at puberty (13 years for females and 15−17 years for males).
Figure VI. Age-dependencies in 90Sr-body burdens for residents of Muslyumovo 30 years after beginning of intake (according to [S13])
Calculations obtained with the age- and sex-dependent model are compared with whole-body counter data averaged for males
and females; the peak ages correspond to the age at growth spurt at puberty (13 years for females and 15–17 years for males)
58. TRDS-2009 includes different protocols for the calculation of internal dose depending on the quality of individual input data (figure VII). For persons with whole-body counter dosimetry, the value of individual-to-model ratio (IMR) is determined as the average of the ratios of an individual’s whole-body counter radiation measurements to the respective reference-model values. IMRs serve as age- and time-normalized values, which permit reduction in uncertainty in internal dose estimates. The uncertainty in the IMR value depends on the number of measurements with whole-body counter and their dispersion for a particular person. For those who do not have individual measurements, the value of household-specific relationship (HSR) can be determined as the average of IMRs for measured members of a household. The refinement of individual internal dose is based upon IMR and HSR for 27% of the entire TRC [D14, S9].

84 UNSCEAR 2017 REPORT
Figure VII. Probability distributions of estimates indicating uncertainties in RBM internal doses for residents of Muslyumovo: (a) village-average dose estimate used in TRDS-2000; (b) household-specific dose estimates; and (c) individual dose estimates (according to [D14])
HSR: household-specific relationship, IMR: Individual-to-model ratio
ANNEX B: EPIDEMIOLOGICAL STUDIES OF CANCER RISK DUE TO LOW-DOSE-RATE RADIATION [...] 85
(f) Medical exposure
59. TRC members were subjected to routine medical exposure in regional hospitals of rural areas of Chelyabinsk and Kurgan Oblasts similarly to other residents. Routine medical diagnostic X-ray examinations were conducted with a frequency of 570–620 procedures per year per 1,000 persons, and resulted in annual effective doses of 0.6–0.8 mSv per person [P8]. The doses from routine X-ray procedures for TRC members were, on average, the same as for other people in the region.
60. At the same time, TRC members were invited to the URCRM clinic for special surveys, which included X-ray examinations. About 22% of TRC members (6,411 persons) received diagnostic X-ray examinations over the period 1956–2000. Those who were invited to the clinic were more likely to have health problems related to chronic radiation exposure. Therefore, there is a possibility that their cumulative doses of medical exposure dose are related to individual radiation dose from environmental exposure.
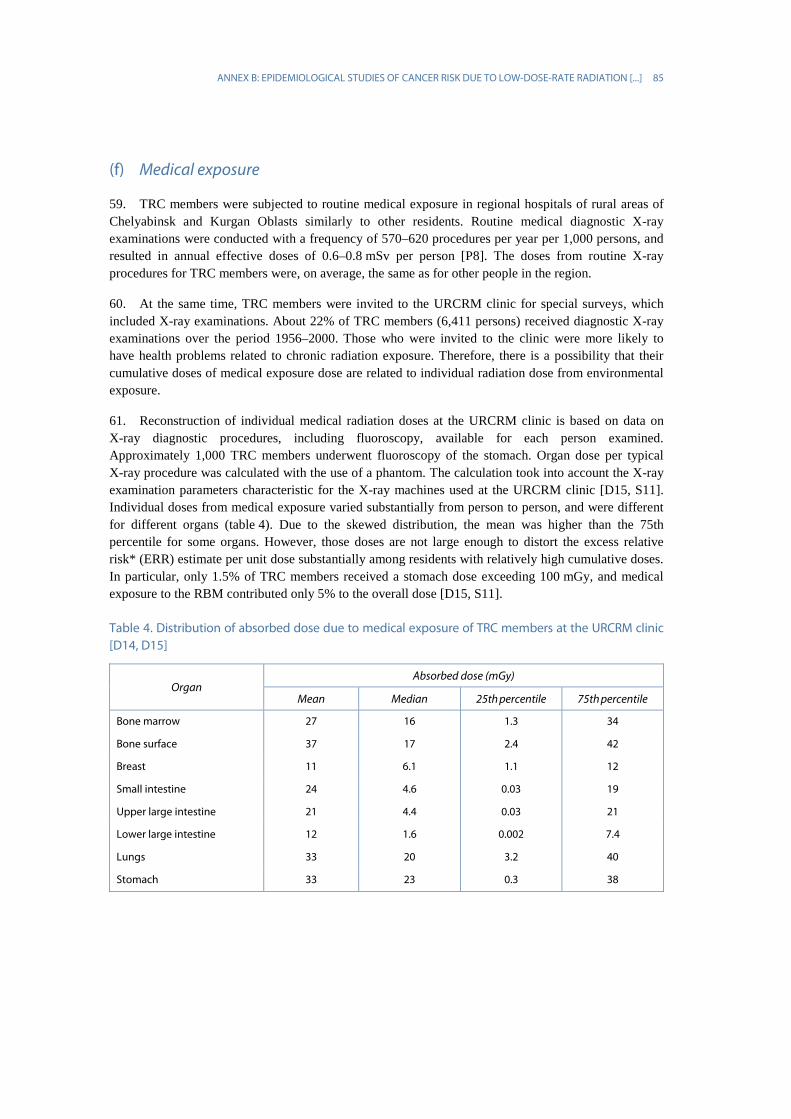
61. Reconstruction of individual medical radiation doses at the URCRM clinic is based on data on X-ray diagnostic procedures, including fluoroscopy, available for each person examined. Approximately 1,000 TRC members underwent fluoroscopy of the stomach. Organ dose per typical X-ray procedure was calculated with the use of a phantom. The calculation took into account the X-ray examination parameters characteristic for the X-ray machines used at the URCRM clinic [D15, S11]. Individual doses from medical exposure varied substantially from person to person, and were different for different organs (table 4). Due to the skewed distribution, the mean was higher than the 75th percentile for some organs. However, those doses are not large enough to distort the excess relative risk* (ERR) estimate per unit dose substantially among residents with relatively high cumulative doses. In particular, only 1.5% of TRC members received a stomach dose exceeding 100 mGy, and medical exposure to the RBM contributed only 5% to the overall dose [D15, S11].
Table 4. Distribution of absorbed dose due to medical exposure of TRC members at the URCRM clinic [D14, D15]
Organ Absorbed dose (mGy)
Mean Median 25th percentile 75th percentile
Bone marrow 27 16 1.3 34
Bone surface 37 17 2.4 42
Breast 11 6.1 1.1 12
Small intestine 24 4.6 0.03 19
Upper large intestine 21 4.4 0.03 21
Lower large intestine 12 1.6 0.002 7.4
Lungs 33 20 3.2 40
Stomach 33 23 0.3 38

86 UNSCEAR 2017 REPORT
(g) Results of dose reconstruction
62. The mean annual stomach dose estimates for the Techa River incidence cohort [D5] based on TRDS-2009 are shown in table 5. The annual stomach dose peaked in 1951 and reached 28 mGy a−1. From 1951 to 1960, the dose rate decreased by two orders of magnitude and the decline continued also after that, at a slower rate. Annual average doses in 1951 decreased with distance from the release site, from approximately 200 mGy a−1 in the upper reaches to about 20 mGy a−1 in the middle course and roughly 4 mGy for the lower parts of the river [P12]. The mean cumulative stomach dose for TRC members was 43 mGy and the median was 12 mGy, with a maximum of approximately 1 Gy [D7].
63. The mean annual RBM doses for the Techa River leukaemia incidence study based on TRDS-2009 are also shown in table 5. The RBM dose rate showed a similar time trend to that of the stomach dose, but the levels were substantially higher, and decreased more slowly with time. In 1951, the annual doses were close to 400 mGy a−1 in the upper reaches, approximately 200 mGy a−1 in the middle course and roughly 50 mGy a−1 for the lower parts of the river [P12]. Although the cumulative doses to some individuals in the TRC are substantial, they were accumulated over many years of exposure. The external and internal dose rates for even the most-exposed individuals were more than two orders of magnitude lower than the current definition of low dose rate of 0.1 mGy/min. The mean cumulative RBM dose for TRC members was 0.43 Gy and the median was 0.27 Gy. The maximum RBM dose in the TRC exceeded 5 Gy [D7].
Table 5. Mean dose rates for the period (1950–1980) of the Techa River incidence studies [D5, K18]
Calendar year Mean absorbed dose rate (mGy a−1)
Stomach RBM
1950 5.9 68
1951 28 135
1952 14 60
1953 9.7 50
1954 5.9 38
1955 1.7 27
1956 1.0 21
1957 0.59 17
1958 0.37 14
1959 0.36 11
1960 0.31 9.4
1970 0.06 2.3
1980 0.02 0.8
64. In RBM dose, the relative contribution of external exposure to the internal exposure was dependent on the distance from the releasing point since 90Sr, the major internal-exposure contributor to RBM dose, reached areas far down the river. In settlements located in the upper Techa region (within about 75 km from the release site), external exposure was the main source of RBM dose. In the lower Techa region, more than 50% of RBM dose was from internal exposure [D12, D13].
ANNEX B: EPIDEMIOLOGICAL STUDIES OF CANCER RISK DUE TO LOW-DOSE-RATE RADIATION [...] 87
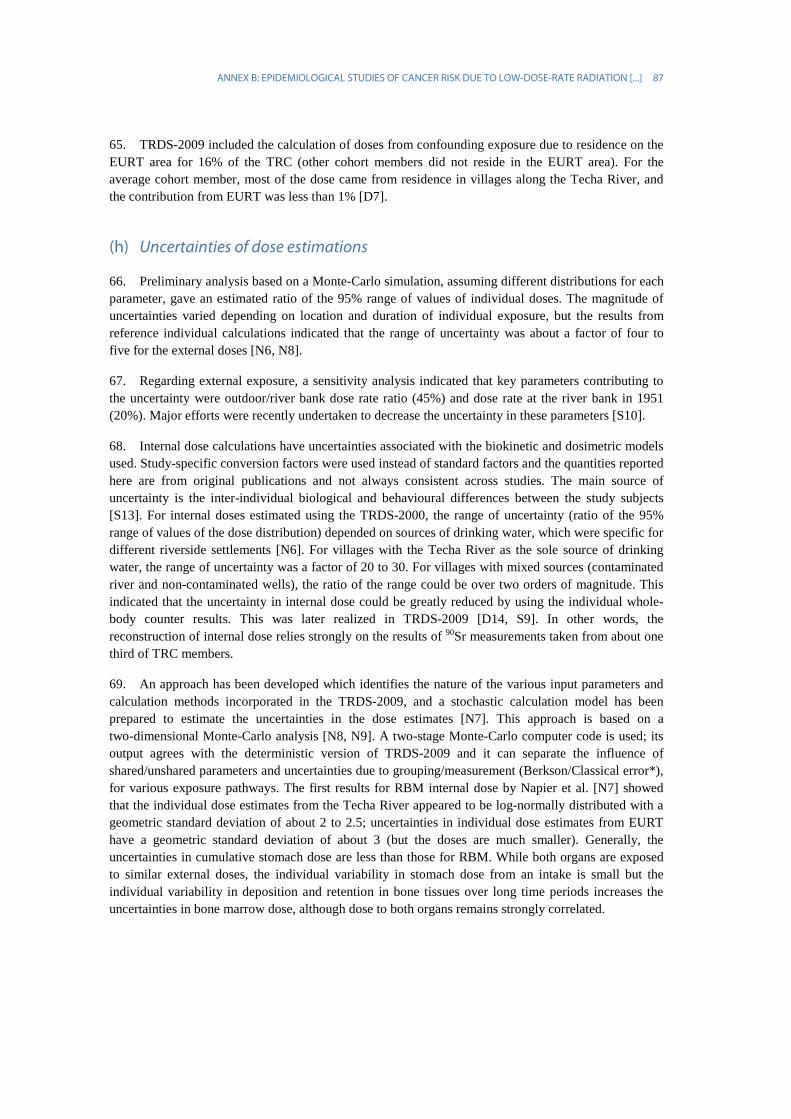
65. TRDS-2009 included the calculation of doses from confounding exposure due to residence on the EURT area for 16% of the TRC (other cohort members did not reside in the EURT area). For the average cohort member, most of the dose came from residence in villages along the Techa River, and the contribution from EURT was less than 1% [D7].
(h) Uncertainties of dose estimations
66. Preliminary analysis based on a Monte-Carlo simulation, assuming different distributions for each parameter, gave an estimated ratio of the 95% range of values of individual doses. The magnitude of uncertainties varied depending on location and duration of individual exposure, but the results from reference individual calculations indicated that the range of uncertainty was about a factor of four to five for the external doses [N6, N8].
67. Regarding external exposure, a sensitivity analysis indicated that key parameters contributing to the uncertainty were outdoor/river bank dose rate ratio (45%) and dose rate at the river bank in 1951 (20%). Major efforts were recently undertaken to decrease the uncertainty in these parameters [S10].
68. Internal dose calculations have uncertainties associated with the biokinetic and dosimetric models used. Study-specific conversion factors were used instead of standard factors and the quantities reported here are from original publications and not always consistent across studies. The main source of uncertainty is the inter-individual biological and behavioural differences between the study subjects [S13]. For internal doses estimated using the TRDS-2000, the range of uncertainty (ratio of the 95% range of values of the dose distribution) depended on sources of drinking water, which were specific for different riverside settlements [N6]. For villages with the Techa River as the sole source of drinking water, the range of uncertainty was a factor of 20 to 30. For villages with mixed sources (contaminated river and non-contaminated wells), the ratio of the range could be over two orders of magnitude. This indicated that the uncertainty in internal dose could be greatly reduced by using the individual whole-body counter results. This was later realized in TRDS-2009 [D14, S9]. In other words, the reconstruction of internal dose relies strongly on the results of 90Sr measurements taken from about one third of TRC members.
69. An approach has been developed which identifies the nature of the various input parameters and calculation methods incorporated in the TRDS-2009, and a stochastic calculation model has been prepared to estimate the uncertainties in the dose estimates [N7]. This approach is based on a two-dimensional Monte-Carlo analysis [N8, N9]. A two-stage Monte-Carlo computer code is used; its output agrees with the deterministic version of TRDS-2009 and it can separate the influence of shared/unshared parameters and uncertainties due to grouping/measurement (Berkson/Classical error*), for various exposure pathways. The first results for RBM internal dose by Napier et al. [N7] showed that the individual dose estimates from the Techa River appeared to be log-normally distributed with a geometric standard deviation of about 2 to 2.5; uncertainties in individual dose estimates from EURT have a geometric standard deviation of about 3 (but the doses are much smaller). Generally, the uncertainties in cumulative stomach dose are less than those for RBM. While both organs are exposed to similar external doses, the individual variability in stomach dose from an intake is small but the individual variability in deposition and retention in bone tissues over long time periods increases the uncertainties in bone marrow dose, although dose to both organs remains strongly correlated.

88 UNSCEAR 2017 REPORT
(i) Biological dosimetry
70. The first cytogenetic studies of the Techa riverside residents were performed 20 years, and then 40–50 years, after the onset of exposure. The findings showed an increased frequency of unstable chromosome aberrations (dicentrics and rings) in peripheral blood lymphocytes of exposed persons compared to unexposed persons of the same sex and age. However, no dependence on the RBM dose was found [A9, P6, V4, V8].
71. The frequency of stable aberrations (translocations) was first estimated in 1993 for residents of the middle and lower Techa regions [A5]. No demonstrable difference was found between 34 exposed and 10 unexposed (control) subjects [A5]. The next study was based on a more representative sample of persons who lived in the upper and middle Techa regions (73 exposed and 39 unexposed participants) and showed a significantly increased mean frequency of translocations among exposed persons compared to the controls (12.8±1.5 and 5.7±1.0, respectively, per 1,000 cells) [B8]. The highest translocation frequency was observed in persons who had lived permanently in the Techa riverside villages during the maximum radioactive release (1950–1951) [B8].
72. In 2009–2012, an international study using the FISH method examined two exposed groups: 18 residents of the middle Techa region, who were exposed predominantly due to ingestion of 89,90Sr; and 20 residents of the upper Techa, who were exposed to both external and internal radiation [V9]. In the first group, a significant linear relationship between translocation frequency and individual RBM dose from incorporated 89,90Sr was found [V9]. The slope of 0.006±0.002 translocations/GE cell/Gy found in this group allowed quantification of the translocations caused by exposure to 89,90Sr. Individual doses from external exposure estimated from the FISH results for the second group ranged up to 2.1 Gy. The average FISH-based dose of external radiation for the second group was estimated as 0.48±0.16 Gy [V9].
73. The main objective of the recent biodosimetry studies was validation and verification of external dose estimates by comparing the TRDS-based doses for TRC members with the results of two independent methods: EPR measurements of tooth enamel (I) and FISH analysis of chromosome translocations in circulating lymphocytes (II). The main issue in the application of the EPR and FISH methods for external dose reconstruction for the Techa riverside residents was the contribution of strontium radioisotopes incorporated in teeth and bones [D11, D17]. A methodology for adjustment for the effects of 89,90Sr on the FISH results was developed [V9]. In order to estimate and subtract doses from incorporated 89,90Sr, the EPR and FISH assay measurements of 90Sr-body burdens were used and 90Sr concentrations in dental tissue estimated by the luminescence method [D17, S14].
74. Comparative analysis of EPR and FISH results in residents of the upper reaches of the Techa River during the period of radioactive discharges (133 persons) was performed in 2015 [D17]. The dose estimates derived from EPR and FISH measurements and adjusted for the confounding strontium were consistent: the mean values tended to decrease with distance along the river from 0.51–0.55 Gy for the villages located close to the site of radioactive release to 0.13–0.16 Gy for the more distant villages. The upper bound of individual estimates for both methods was estimated as 2.2–2.3 Gy [D17].
75. The findings from recent biodosimetry studies were used for validation of the TRDS-2009 [D17]. Individual doses were calculated using a TRDS code for each subject in the EPR and FISH studies on the basis of their age at exposure and residence histories. For correct comparison with the EPR- and FISH-based estimates, two sources of exposure accounted for external exposure and internal exposure from 137Cs incorporated in the subjects’ soft tissue. The EPR- and FISH-based estimates were in agreement within the uncertainty bounds the TRDS-based absorbed doses in tooth enamel and muscles. The agreement supported the validity of external doses calculated with the TRDS-2009 [D17].
ANNEX B: EPIDEMIOLOGICAL STUDIES OF CANCER RISK DUE TO LOW-DOSE-RATE RADIATION [...] 89
4. Cancer incidence and mortality
76. Analyses of cancer and leukaemia risk for TRC members were performed repeatedly over a long period of follow-up of the cohort [D5, E2, E3, K15, K16, K17, K18, P12, S3]. The first studies [K8, K9] covered 32- and 39-year follow-up periods (1950–1982, 1950–1989) and were limited in terms of quality and completeness of information and of dose estimates [D8, K13]. Despite their limitations, the results of these studies suggested that the mortality from leukaemia and solid cancers increased with increasing radiation dose. Also, they implied that the TRC had future potential to provide quantitative estimates of the risk of chronic low-dose-rate radiation exposure for an unselected general population. Over the subsequent period, the TRC was expanded to include the residents in the riverside villages from 1953 through 1960; and the total number of cohort members has reached about 30,000. The information accumulated in the URCRM as of 2013 included data on cancer cases for TRC members in the catchment area for 1956–2012, and deaths in the two-oblast catchment area for 1950–2007 [S3]. A dosimetry system (TRDS-2000) for the TRC with individual dose estimates was developed. The dosimetry system was improved and updated in 2009 (TRDS-2009) owing to availability of new information on exposure sources and radioactive mixture hold-up time, and also to improvements in the model itself (as described before in the dosimetry section). The internal exposure dose estimation in the TRC study has considerable uncertainties. It should be pointed out that those uncertainties are not fully taken into account in cancer risk estimation. Therefore, caution should be exercised when the magnitude of risk estimate per dose unit is discussed.
(a) Solid cancer incidence and mortality
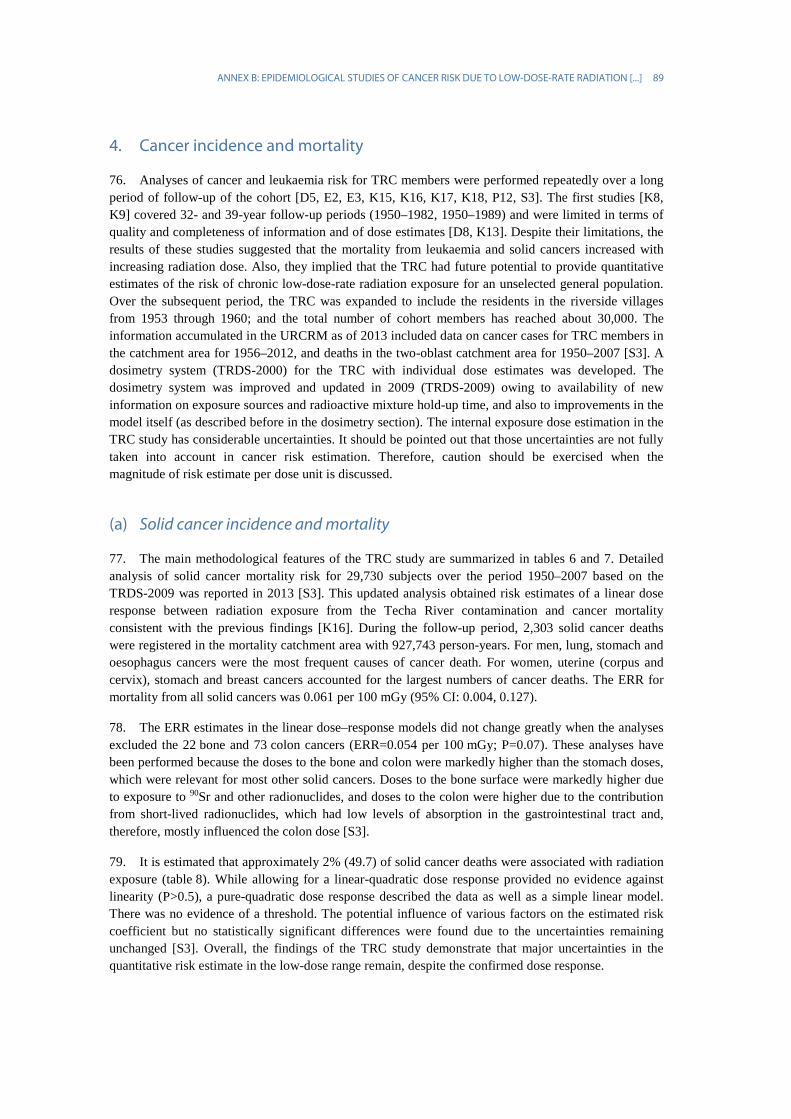
77. The main methodological features of the TRC study are summarized in tables 6 and 7. Detailed analysis of solid cancer mortality risk for 29,730 subjects over the period 1950–2007 based on the TRDS-2009 was reported in 2013 [S3]. This updated analysis obtained risk estimates of a linear dose response between radiation exposure from the Techa River contamination and cancer mortality consistent with the previous findings [K16]. During the follow-up period, 2,303 solid cancer deaths were registered in the mortality catchment area with 927,743 person-years. For men, lung, stomach and oesophagus cancers were the most frequent causes of cancer death. For women, uterine (corpus and cervix), stomach and breast cancers accounted for the largest numbers of cancer deaths. The ERR for mortality from all solid cancers was 0.061 per 100 mGy (95% CI: 0.004, 0.127).
78. The ERR estimates in the linear dose–response models did not change greatly when the analyses excluded the 22 bone and 73 colon cancers (ERR=0.054 per 100 mGy; P=0.07). These analyses have been performed because the doses to the bone and colon were markedly higher than the stomach doses, which were relevant for most other solid cancers. Doses to the bone surface were markedly higher due to exposure to 90Sr and other radionuclides, and doses to the colon were higher due to the contribution from short-lived radionuclides, which had low levels of absorption in the gastrointestinal tract and, therefore, mostly influenced the colon dose [S3].
79. It is estimated that approximately 2% (49.7) of solid cancer deaths were associated with radiation exposure (table 8). While allowing for a linear-quadratic dose response provided no evidence against linearity (P>0.5), a pure-quadratic dose response described the data as well as a simple linear model. There was no evidence of a threshold. The potential influence of various factors on the estimated risk coefficient but no statistically significant differences were found due to the uncertainties remaining unchanged [S3]. Overall, the findings of the TRC study demonstrate that major uncertainties in the quantitative risk estimate in the low-dose range remain, despite the confirmed dose response.
90 U
NSCEA
R 2017 REPORT
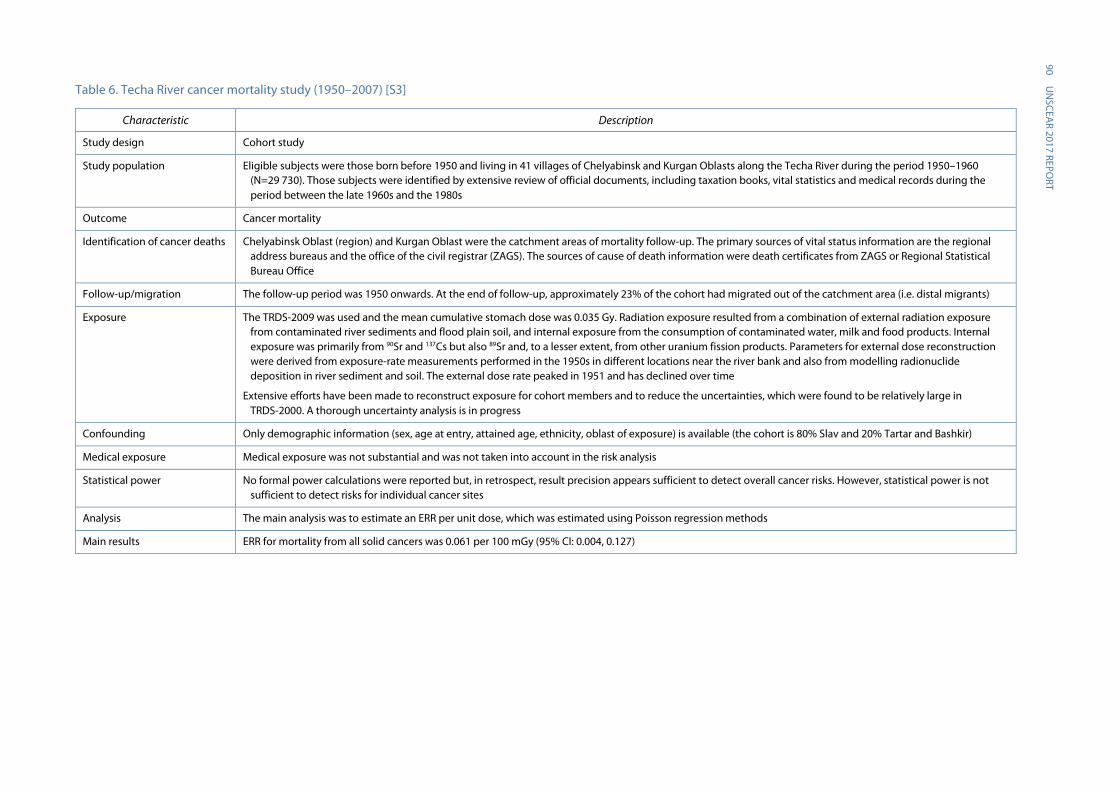
Table 6. Techa River cancer mortality study (1950–2007) [S3]
Characteristic Description
Study design Cohort study
Study population Eligible subjects were those born before 1950 and living in 41 villages of Chelyabinsk and Kurgan Oblasts along the Techa River during the period 1950–1960 (N=29 730). Those subjects were identified by extensive review of official documents, including taxation books, vital statistics and medical records during the period between the late 1960s and the 1980s
Outcome Cancer mortality
Identification of cancer deaths Chelyabinsk Oblast (region) and Kurgan Oblast were the catchment areas of mortality follow-up. The primary sources of vital status information are the regional address bureaus and the office of the civil registrar (ZAGS). The sources of cause of death information were death certificates from ZAGS or Regional Statistical Bureau Office
Follow-up/migration The follow-up period was 1950 onwards. At the end of follow-up, approximately 23% of the cohort had migrated out of the catchment area (i.e. distal migrants)
Exposure The TRDS-2009 was used and the mean cumulative stomach dose was 0.035 Gy. Radiation exposure resulted from a combination of external radiation exposure from contaminated river sediments and flood plain soil, and internal exposure from the consumption of contaminated water, milk and food products. Internal exposure was primarily from 90Sr and 137Cs but also 89Sr and, to a lesser extent, from other uranium fission products. Parameters for external dose reconstruction were derived from exposure-rate measurements performed in the 1950s in different locations near the river bank and also from modelling radionuclide deposition in river sediment and soil. The external dose rate peaked in 1951 and has declined over time
Extensive efforts have been made to reconstruct exposure for cohort members and to reduce the uncertainties, which were found to be relatively large in TRDS-2000. A thorough uncertainty analysis is in progress
Confounding Only demographic information (sex, age at entry, attained age, ethnicity, oblast of exposure) is available (the cohort is 80% Slav and 20% Tartar and Bashkir)
Medical exposure Medical exposure was not substantial and was not taken into account in the risk analysis
Statistical power No formal power calculations were reported but, in retrospect, result precision appears sufficient to detect overall cancer risks. However, statistical power is not sufficient to detect risks for individual cancer sites
Analysis The main analysis was to estimate an ERR per unit dose, which was estimated using Poisson regression methods
Main results ERR for mortality from all solid cancers was 0.061 per 100 mGy (95% CI: 0.004, 0.127)
A
NN
EX B: EPIDEM
IOLO
GICA
L STUD
IES OF CA
NCER RISK D
UE TO
LOW
-DO
SE-RATE RAD
IATIO
N [...]
91
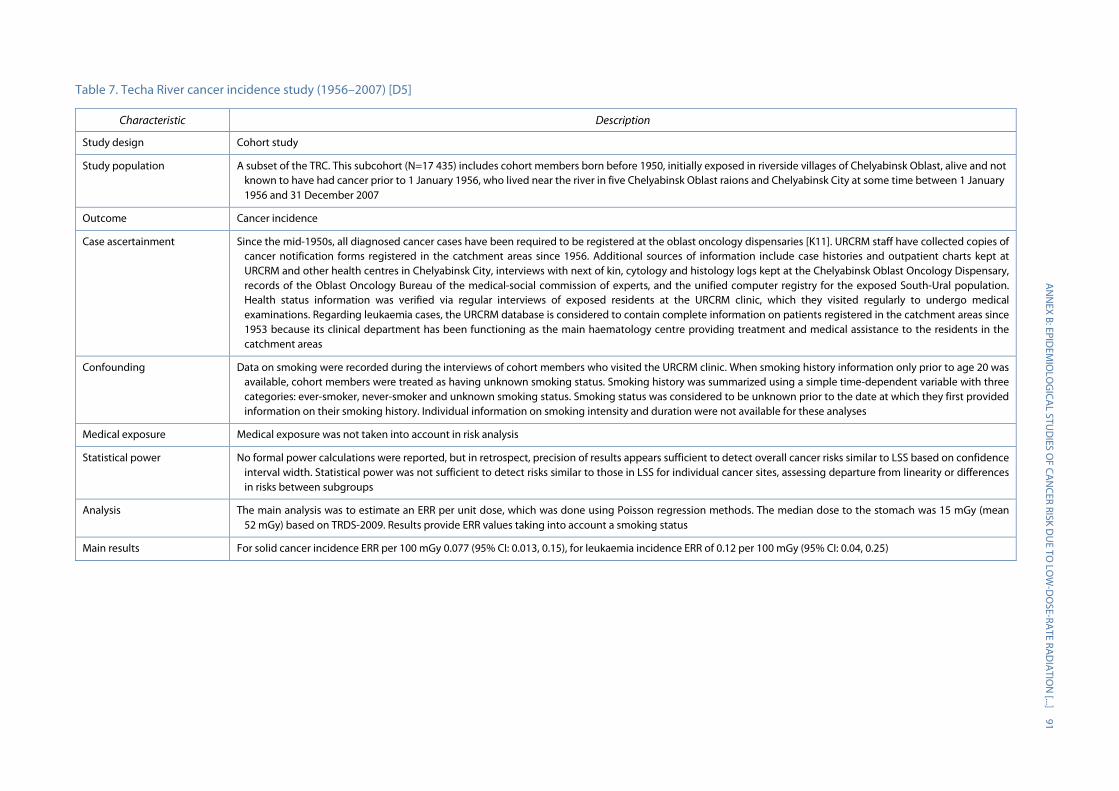
Table 7. Techa River cancer incidence study (1956–2007) [D5]
Characteristic Description
Study design Cohort study
Study population A subset of the TRC. This subcohort (N=17 435) includes cohort members born before 1950, initially exposed in riverside villages of Chelyabinsk Oblast, alive and not known to have had cancer prior to 1 January 1956, who lived near the river in five Chelyabinsk Oblast raions and Chelyabinsk City at some time between 1 January 1956 and 31 December 2007
Outcome Cancer incidence
Case ascertainment Since the mid-1950s, all diagnosed cancer cases have been required to be registered at the oblast oncology dispensaries [K11]. URCRM staff have collected copies of cancer notification forms registered in the catchment areas since 1956. Additional sources of information include case histories and outpatient charts kept at URCRM and other health centres in Chelyabinsk City, interviews with next of kin, cytology and histology logs kept at the Chelyabinsk Oblast Oncology Dispensary, records of the Oblast Oncology Bureau of the medical-social commission of experts, and the unified computer registry for the exposed South-Ural population. Health status information was verified via regular interviews of exposed residents at the URCRM clinic, which they visited regularly to undergo medical examinations. Regarding leukaemia cases, the URCRM database is considered to contain complete information on patients registered in the catchment areas since 1953 because its clinical department has been functioning as the main haematology centre providing treatment and medical assistance to the residents in the catchment areas
Confounding Data on smoking were recorded during the interviews of cohort members who visited the URCRM clinic. When smoking history information only prior to age 20 was available, cohort members were treated as having unknown smoking status. Smoking history was summarized using a simple time-dependent variable with three categories: ever-smoker, never-smoker and unknown smoking status. Smoking status was considered to be unknown prior to the date at which they first provided information on their smoking history. Individual information on smoking intensity and duration were not available for these analyses
Medical exposure Medical exposure was not taken into account in risk analysis
Statistical power No formal power calculations were reported, but in retrospect, precision of results appears sufficient to detect overall cancer risks similar to LSS based on confidence interval width. Statistical power was not sufficient to detect risks similar to those in LSS for individual cancer sites, assessing departure from linearity or differences in risks between subgroups
Analysis The main analysis was to estimate an ERR per unit dose, which was done using Poisson regression methods. The median dose to the stomach was 15 mGy (mean 52 mGy) based on TRDS-2009. Results provide ERR values taking into account a smoking status
Main results For solid cancer incidence ERR per 100 mGy 0.077 (95% CI: 0.013, 0.15), for leukaemia incidence ERR of 0.12 per 100 mGy (95% CI: 0.04, 0.25)

92 UNSCEAR 2017 REPORT
Table 8. Excess solid cancer mortality cases by dose category using TRDS-2009 in TRC [S3]
Dose category (Gy) with 5-year lag period
TRDS-2009
Person-years Background cases Excess cases
0 132 593 149.7 0
<0.01 386 880 951.9 2.9
0.01–<0.05 273 436 777.9 10.2
0.05–<0.1 63 297 174.4 6.8
0.1–<0.15 27 651 80.3 5.8
0.15–<0.3 21 707 51.5 6.5
0.3–<0.5 21 074 63.7 16.1
≥0.5 1 105 4.0 1.4
Total 927 743 2 253.4 49.7
80. The results regarding solid cancer incidence risk analysis for the Chelyabinsk Oblast subcohort of the TRC, based on doses estimated using the TRDS-2009, were published by Davis et al. [D5]. Of the cases, 19% overall were based on death certificate alone (lower proportion after 1990). The values of the ERR for radiogenic solid cancer development estimated for the Techa River subcohort supplement those from the mortality analysis for the total Techa cohort, and present clear evidence of an increased rate of solid cancer with radiation exposure. While incidence and mortality analyses gave comparable ERR estimates, there are several major differences in the analyses. As was indicated above, since comprehensive data on cancer incidence are available only for cohort members initially exposed in Chelyabinsk Oblast, the incidence cohort contains only about 60% of the full TRC and loss to follow-up due to migration was more common than in the mortality analysis.
81. Despite the reduced cohort size and follow-up time (1956–2007) for solid cancer incidence data, the analyses were based on approximately the same number of cases (1,933 cases, excluding non-melanoma skin cancers) as the previous mortality analyses (2,303 deaths). Fifty per cent of the 1,933 solid cancers were diagnosed in men. The most common sites for men were the lung (30%) and the stomach (22%), while the most common sites for women were the uterus (including cervix uteri) (21%), the stomach (16%) and the breasts (12%) [D5].
82. The dose response with adjustment* for ever vs never smoking, was significant (P=0.02) in a linear ERR model. The estimated ERR per 100 mGy was 0.077 (95% CI: 0.013, 0.15). The risk estimate without smoking adjustment was 0.087 per 100 mGy (95% CI: 0.02, 0.16). Table 9 summarizes the distribution of solid cancer incidences, person-years and fitted values in five-year lagged cumulative dose categories. Using a linear dose–response model, it was estimated that 61 of the 1,933 cases (3%) were associated with radiation exposure. There is no indication that a linear-quadratic model fitted better than a simple linear model (P=0.2). A pure-quadratic dose-response model gave an ERR of 0.022 per 100 mGy (95% CI: 0.005, 0.04), which is less than half of that predicted by the linear ERR model. When non-parametric smoothing was used, the results suggested that the response over the low-dose region (<0.1 Gy) falls between the linear- and pure-quadratic models [D5].
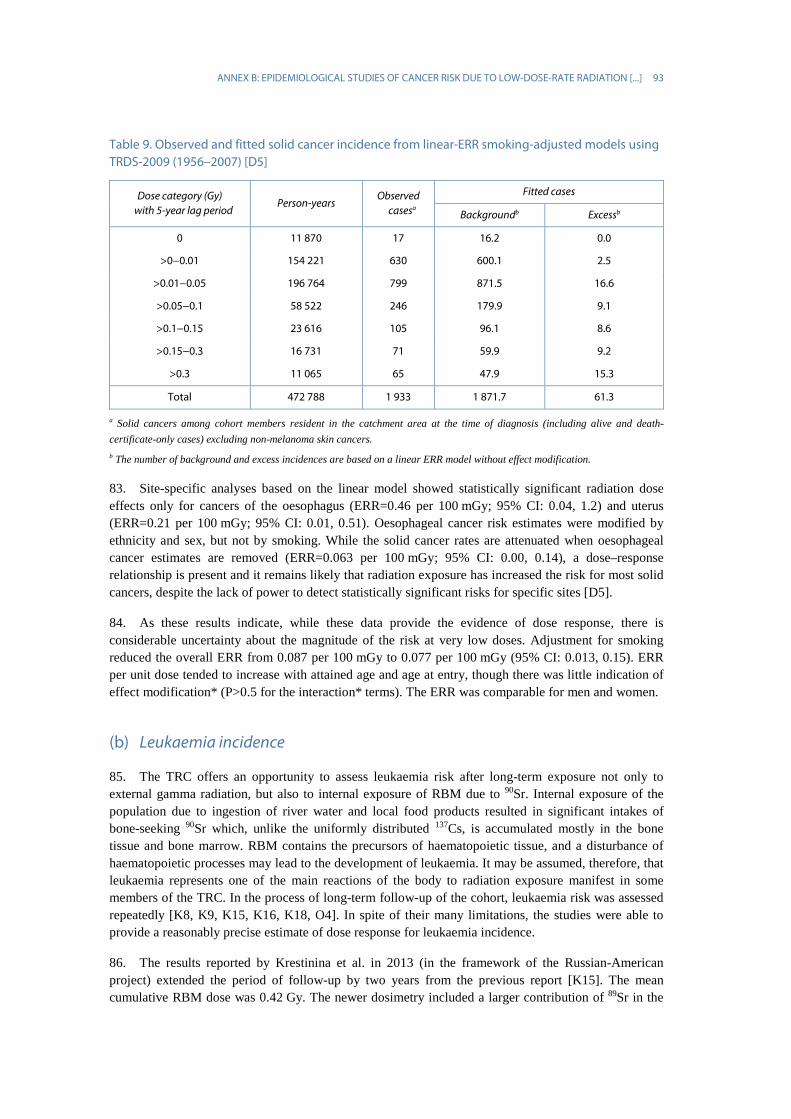
ANNEX B: EPIDEMIOLOGICAL STUDIES OF CANCER RISK DUE TO LOW-DOSE-RATE RADIATION [...] 93
Table 9. Observed and fitted solid cancer incidence from linear-ERR smoking-adjusted models using TRDS-2009 (1956–2007) [D5]
Dose category (Gy) with 5-year lag period
Person-years Observed
casesa
Fitted cases
Backgroundb Excessb
0 11 870 17 16.2 0.0
>0−0.01 154 221 630 600.1 2.5
>0.01−0.05 196 764 799 871.5 16.6
>0.05−0.1 58 522 246 179.9 9.1
>0.1−0.15 23 616 105 96.1 8.6
>0.15−0.3 16 731 71 59.9 9.2
>0.3 11 065 65 47.9 15.3
Total 472 788 1 933 1 871.7 61.3
a Solid cancers among cohort members resident in the catchment area at the time of diagnosis (including alive and death-certificate-only cases) excluding non-melanoma skin cancers. b The number of background and excess incidences are based on a linear ERR model without effect modification.
83. Site-specific analyses based on the linear model showed statistically significant radiation dose effects only for cancers of the oesophagus (ERR=0.46 per 100 mGy; 95% CI: 0.04, 1.2) and uterus (ERR=0.21 per 100 mGy; 95% CI: 0.01, 0.51). Oesophageal cancer risk estimates were modified by ethnicity and sex, but not by smoking. While the solid cancer rates are attenuated when oesophageal cancer estimates are removed (ERR=0.063 per 100 mGy; 95% CI: 0.00, 0.14), a dose–response relationship is present and it remains likely that radiation exposure has increased the risk for most solid cancers, despite the lack of power to detect statistically significant risks for specific sites [D5].
84. As these results indicate, while these data provide the evidence of dose response, there is considerable uncertainty about the magnitude of the risk at very low doses. Adjustment for smoking reduced the overall ERR from 0.087 per 100 mGy to 0.077 per 100 mGy (95% CI: 0.013, 0.15). ERR per unit dose tended to increase with attained age and age at entry, though there was little indication of effect modification* (P>0.5 for the interaction* terms). The ERR was comparable for men and women.
(b) Leukaemia incidence
85. The TRC offers an opportunity to assess leukaemia risk after long-term exposure not only to external gamma radiation, but also to internal exposure of RBM due to 90Sr. Internal exposure of the population due to ingestion of river water and local food products resulted in significant intakes of bone-seeking 90Sr which, unlike the uniformly distributed 137Cs, is accumulated mostly in the bone tissue and bone marrow. RBM contains the precursors of haematopoietic tissue, and a disturbance of haematopoietic processes may lead to the development of leukaemia. It may be assumed, therefore, that leukaemia represents one of the main reactions of the body to radiation exposure manifest in some members of the TRC. In the process of long-term follow-up of the cohort, leukaemia risk was assessed repeatedly [K8, K9, K15, K16, K18, O4]. In spite of their many limitations, the studies were able to provide a reasonably precise estimate of dose response for leukaemia incidence.
86. The results reported by Krestinina et al. in 2013 (in the framework of the Russian-American project) extended the period of follow-up by two years from the previous report [K15]. The mean cumulative RBM dose was 0.42 Gy. The newer dosimetry included a larger contribution of 89Sr in the
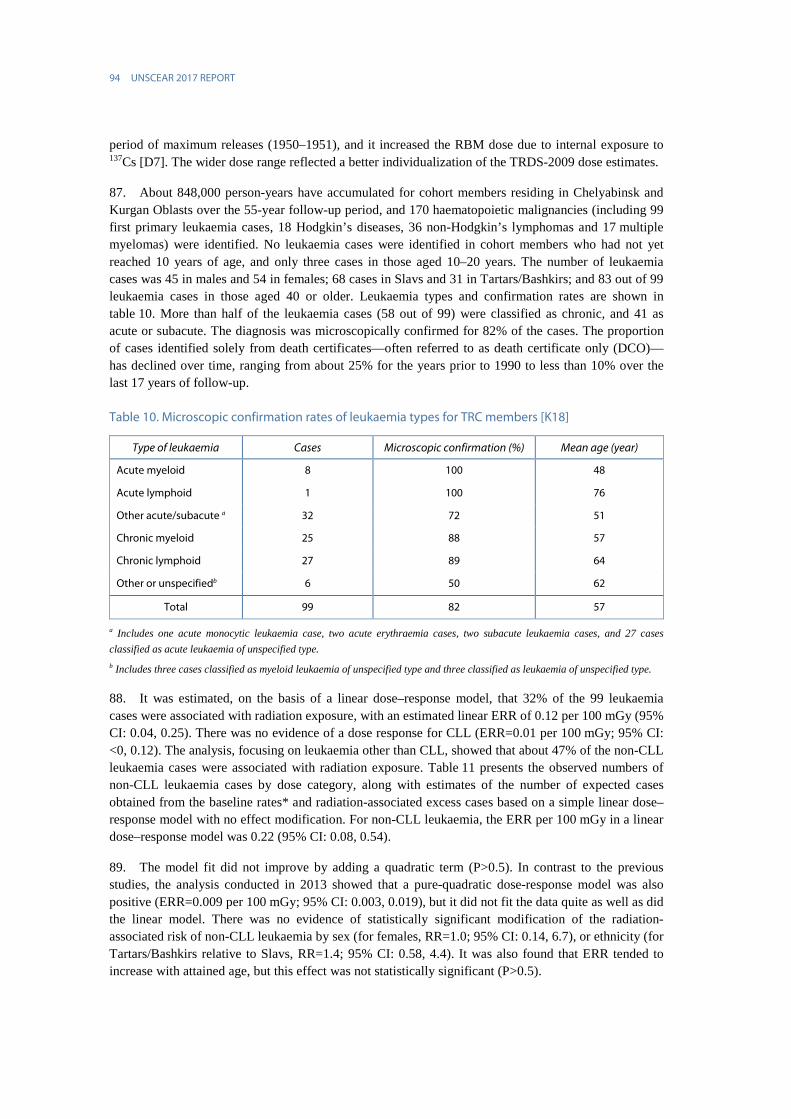
94 UNSCEAR 2017 REPORT
period of maximum releases (1950–1951), and it increased the RBM dose due to internal exposure to 137Cs [D7]. The wider dose range reflected a better individualization of the TRDS-2009 dose estimates.
87. About 848,000 person-years have accumulated for cohort members residing in Chelyabinsk and Kurgan Oblasts over the 55-year follow-up period, and 170 haematopoietic malignancies (including 99 first primary leukaemia cases, 18 Hodgkin’s diseases, 36 non-Hodgkin’s lymphomas and 17 multiple myelomas) were identified. No leukaemia cases were identified in cohort members who had not yet reached 10 years of age, and only three cases in those aged 10–20 years. The number of leukaemia cases was 45 in males and 54 in females; 68 cases in Slavs and 31 in Tartars/Bashkirs; and 83 out of 99 leukaemia cases in those aged 40 or older. Leukaemia types and confirmation rates are shown in table 10. More than half of the leukaemia cases (58 out of 99) were classified as chronic, and 41 as acute or subacute. The diagnosis was microscopically confirmed for 82% of the cases. The proportion of cases identified solely from death certificates—often referred to as death certificate only (DCO)—has declined over time, ranging from about 25% for the years prior to 1990 to less than 10% over the last 17 years of follow-up.
Table 10. Microscopic confirmation rates of leukaemia types for TRC members [K18]
Type of leukaemia Cases Microscopic confirmation (%) Mean age (year)
Acute myeloid 8 100 48
Acute lymphoid 1 100 76
Other acute/subacute a 32 72 51
Chronic myeloid 25 88 57
Chronic lymphoid 27 89 64
Other or unspecifiedb 6 50 62
Total 99 82 57
a Includes one acute monocytic leukaemia case, two acute erythraemia cases, two subacute leukaemia cases, and 27 cases classified as acute leukaemia of unspecified type. b Includes three cases classified as myeloid leukaemia of unspecified type and three classified as leukaemia of unspecified type.
88. It was estimated, on the basis of a linear dose–response model, that 32% of the 99 leukaemia cases were associated with radiation exposure, with an estimated linear ERR of 0.12 per 100 mGy (95% CI: 0.04, 0.25). There was no evidence of a dose response for CLL (ERR=0.01 per 100 mGy; 95% CI: <0, 0.12). The analysis, focusing on leukaemia other than CLL, showed that about 47% of the non-CLL leukaemia cases were associated with radiation exposure. Table 11 presents the observed numbers of non-CLL leukaemia cases by dose category, along with estimates of the number of expected cases obtained from the baseline rates* and radiation-associated excess cases based on a simple linear dose–response model with no effect modification. For non-CLL leukaemia, the ERR per 100 mGy in a linear dose–response model was 0.22 (95% CI: 0.08, 0.54).
89. The model fit did not improve by adding a quadratic term (P>0.5). In contrast to the previous studies, the analysis conducted in 2013 showed that a pure-quadratic dose-response model was also positive (ERR=0.009 per 100 mGy; 95% CI: 0.003, 0.019), but it did not fit the data quite as well as did the linear model. There was no evidence of statistically significant modification of the radiation-associated risk of non-CLL leukaemia by sex (for females, RR=1.0; 95% CI: 0.14, 6.7), or ethnicity (for Tartars/Bashkirs relative to Slavs, RR=1.4; 95% CI: 0.58, 4.4). It was also found that ERR tended to increase with attained age, but this effect was not statistically significant (P>0.5).

ANNEX B: EPIDEMIOLOGICAL STUDIES OF CANCER RISK DUE TO LOW-DOSE-RATE RADIATION [...] 95
Table 11. Observed and fitted cases of leukaemia other than CLL in TRC using TRDS-2009 cumulative dose categories [K18]
Marrow dose (Gy) with a two-year lag
Person-years Observed cases
Calculation based on fitted model
Background cases
Excess cases Attributable fraction (%)
<0.01 100 034 6 4.4 0 0
0.01–0.05 102 300 2 4.7 0.3 6
0.05–0.1 55 077 4 2.5 0.4 13.8
0.1–0.2 109 182 10 5.1 1.5 22.7
0.2–0.5 222 137 13 10.1 6.8 40.2
0.5–1.0 152 752 20 6.9 10.1 59.4
>1.0 106 395 17 4.6 14.7 76
Total 847 877 72 38.3 33.8 46.9
90. Overall, the TRC study has been one of the most important new studies in the past decades and it has contributed to evidence about cancer risk from radiation. While challenges remain to quantify the dose–response relationship at low doses, risk estimates from this study provide important information about cancer risks from long-term whole-body radiation exposure, which can be applicable in other settings with an accident resulting in wide-scale environmental contamination. Results for leukaemia are based on relatively small numbers of cases, but they are unlikely to be affected by confounding or selection bias. The risk estimates from analyses of mortality reported in 2005 [K16] and incidence reported in 2013 [K18] differ more widely than those for solid cancers. Incomplete case ascertainment and diagnostic verification may add misclassification and could bias the risk estimates downward. For solid cancer results, the pattern of site-specific findings, with significant excess risks found only for oesophageal and uterine cancers, is not consistent with other major studies. The patterns of effect modification by age and sex are not similar to the Life Span Study (LSS), but the differences in risk by subgroup are small and should not be overemphasized. Adjustment for incomplete smoking information reduced the risk estimates for solid cancer, which suggests that there may be residual negative confounding. The different exposure modes, including long period of exposure and a marked internal radiation component may also contribute to the differences between the two studies.
91. The strengths of the TRC include a wide range of doses, long follow-up time, and availability of data on both cancer incidence and mortality. Exposure in the TRC population is complex, as it involves both external and internal exposure, and has varied over time, which adds to the uncertainties in estimated doses. However, extensive work on characterization of exposure, including uncertainties, is an advantage. Nevertheless, the uncertainties in dose estimates remain large. Incidence data are not, however, available for the entire cohort, and their quality is suboptimal, particularly for the early period. Furthermore, information on confounding factors is scarce. The proportion of subjects lost to follow-up (>20%) and deceased with unknown cause (roughly 10%) was relatively high.

96 UNSCEAR 2017 REPORT
B. Studies of residents in 60Co-contaminated buildings in Taiwan, China
92. A building constructed with radioactive building material was found in Taipei City in 1992. The source of the radiation was steel contaminated with 60Co, which was suspected to have been obtained illegally with scrap metal [A17]. One of the major steel reprocessing factories in Taiwan, China, mishandled a 60Co-orphan source and melted it during a steel-rod (rebar) manufacturing process during 1982–1983, producing radioactive steel, which was used throughout northern Taiwan, China. By the end of 2000, 1,607 housing units in 181 buildings were found to have radioactive rebar [C4]. All the buildings with radiation contamination were built between 1982 and 1984. Many families had resided in these buildings for various periods, mostly around 10 years. Regarding the method to estimate annual dose received by residents, Chen stated [C4]: “The highest specific point or space dose equivalent rate was taken as the dose equivalent rate for that room or compartment for further calculation”.
93. Chromosome aberrations of peripheral lymphocytes were examined in 30 residents (17 males and 13 females) in radiation-contaminated buildings. The estimated cumulative radiation doses for those residents ranged from 20 to 280 mSv. As a control group, 15 individuals (eight males and seven females) from laboratory personnel were recruited. G-banding was carried out for at least 500 metaphase spreads for each individual with the exception of one sample. All the recognizable structural aberrations of chromosomes or chromatids were recorded. The frequency of cells with aberrant chromosomes in residents of buildings with radiation contamination was non-significantly larger (4.5% vs 3.6%) than that in the control group [C3]. However, Liu et al. [L7] showed dicentric frequencies of 0.69 vs 0.33 in 136 residents compared with 15 non-exposed controls. A study of 90 exposed and 45 non-exposed subjects showed a higher frequency of any structural chromosomal aberration in exposed women (3.9 vs 3.0 per 100 cells), but no significant difference by exposure status in men (3.8 vs 3.5 per 100 cells) [W4]. The time since last exposure was not clearly reported.
94. Another study examined 1,913 exposed residents (average age: 18 years) of the contaminated buildings. Blood samples were taken five–eight years after relocation. The control group of this study consisted of 176 residents in a local community (average age: 30 years). Lymphocytes were cultured for 48 hours and a total of 208,900 metaphases were prepared. Increased frequencies of translocations (2.1 vs 0.2 per 1,000), and also rings and dicentrics (0.6 vs 0 per 1,000 for both) were reported in the exposed group relative to the control group [H7]. The elapsed time since end of exposure may be too long to observe an effect on unstable aberrations (dicentrics and rings). The frequency of stable aberrations (translocations) appears very high, given the dose level. In the interpretation of these results, it should be borne in mind that unstable chromosomal aberrations such as dicentrics are eliminated over time and are not expected to occur any longer when several years have elapsed since the end of radiation exposure.
95. Hwang et al. examined cancer risk in a cohort of 7,271 residents in cobalt-contaminated buildings with a dose assessment system known as the Taiwan cumulative dose (TCD), using questionnaires of house occupancy and building structure [H10]. The average excess cumulative dose was approximately 47.8 mSv (range: <1–2,363 mSv), with incremental annual dose on average 10 mSv a−1 (ranging up to >1,400 mSv a−1), though the distribution was highly skewed with 79% receiving <5 mSv a−1. The subjects were identified from the national household registry and linked to other registries using national identification numbers. A questionnaire survey was conducted, but the data were not used in the analysis. A total of 1,025 persons were excluded due to lack of individual occupancy factors. A follow-up of the cohort for 1983–2002 (on average 16.1 years) accumulated 101,560 person-years at risk. The start of the follow-up was the date of moving into a contaminated building. Deaths in the cohort were ascertained by record linkage with the National Mortality Registry of Taiwan Province of
ANNEX B: EPIDEMIOLOGICAL STUDIES OF CANCER RISK DUE TO LOW-DOSE-RATE RADIATION [...] 97
China, which had been maintained by the Bureau of Health Statistics since the early 1950s. Person-years of follow-up are reported, but not numbers of deaths or people emigrating. Cancer cases were identified through the National Cancer Registry, which was established in 1979 by the Department of Health, and which collects information on all newly diagnosed cancer patients from all health-care sectors in Taiwan, China. The proportion of cases based on death certificate alone was 10% in 1990–1994 and 3% in 1995–1999. Standardized incidence ratios (SIRs), adjusted for age and sex, were calculated with regional reference rates. The latent periods of leukaemia and solid cancers were assumed to be two and ten years, respectively. After the latent period, the follow-up of the cohort ascertained seven leukaemia cases and 88 cases of all cancers excluding leukaemia. The SIR for leukaemia, except for chronic lymphocytic leukaemia (N=7), was 2.2 (95% CI: 0.9, 4.6). The SIRs for all cancers excluding leukaemia were 0.7 (95% CI: 0.5, 0.9) for men and 0.9 (95% CI: 0.7, 1.2) for women. For dose-gradient analyses, only three dose categories were compared (<1, 1–50 and >50 mGy). A non-significant trend was observed for leukaemia and a significant trend reported for breast cancer. The decreased risk for all cancers excluding leukaemia suggests methodological problems with possible explanations including confounding, selection bias and incomplete follow-up or case ascertainment.
96. Extended follow-up of the same cohort reported 117 cancer cases diagnosed during the period between 1983 and 2005, with average follow-up of 19 years. No expected numbers were given to assess the overall cancer risk. In this study, quantitative risk estimates were obtained unlike in the earlier paper. A trend with radiation dose was observed for leukaemia, excluding chronic lymphocytic leukaemia, with an ERR of approximately 1.9 per Gy (90% CI: 0.1, 3.1) on the basis of six cases (one fewer than in the previous report). Breast cancer (N=17) also exhibited a suggestive increase in risk with dose (ERR=0.012 per 100 mGy; 90% CI: −0.01, 0.21). All solid cancers (N=106) showed an ERR of 0.03 per 100 mGy (90% CI: −0.04, 0.09) [H11]. Only linear risk estimates were reported, and no data shown by dose category to allow more detailed assessment of the findings. The authors chose to show 90% confidence interval instead of 95%, presumably based on a one-sided hypothesis test of radiation exposure increasing the cancer risk (see also annex A).
97. The limitations of the study of 60Co-contaminated buildings include uncertainties in exposure assessment, low statistical power and lack of confounder control. Exposure assessment is not described in depth and the dosimetric quantities are not defined in detail. Interviews and questionnaires were used to reconstruct doses retrospectively on the basis of recalled occupancy and time spent in each room of the residence. Such estimates could be obtained for 86% of the cohort members. Dose-rate measurements were not conducted extensively, but rather concentrated on performing large numbers of measurements in a small number of residences and people to provide models for characterizing typical dose rates [H11, L2, T18]. Extensive dose reconstruction efforts were also hampered by subsequently installed shielding and replacement of contaminated rebars. No indicators of data quality for case ascertainment (such as proportion of microscopically verified cases, death certificate only cases, or cases with unknown primary site) were reported. A questionnaire survey was conducted, but no data were reported on any of the major confounders. The confidence intervals seem very narrow, given the sample size, which raises some concerns about the statistical analyses. However, the study was included in this annex, despite the clear methodological limitations and small study size, because it uses individual dose estimates and is able to provide a quantitative risk estimate so that it fulfils the key inclusion criteria. Table 12 summarizes the study of 60Co-contaminated buildings in Taiwan, China. Recently, an update of the study has been published with extended follow-up, larger numbers of cancer cases and some site-specific analyses [H8].

98 UNSCEAR 2017 REPORT
Table 12. Summarized characteristics of the cohort study of residents in 60Co-contaminated buildings in Taiwan, China
Characteristic Description
Study design Partly retrospective and partly prospective cohort study
Study population A cohort of 6 242 residents of approximately 100 buildings constructed using 60Co-contaminated steel (rebars) since 1982
Outcome Cancer incidence
Mortality follow-up Mortality registry by Bureau of Vital Statistics
Cancer case ascertainment Cancer cases ascertained from the population-based cancer registry
Follow-up/migration From the computerized household registration system
Exposure Exposures reconstructed retrospectively from self-reported occupancy by building area. Cumulative doses calculated from time-weighted mean dose rates
Confounding No data on confounding factors reported; questionnaire data on occupation and education mentioned in reports
Medical exposure Information on medical radiation exposure was not collected
Statistical power No formal power calculations reported
Analysis Hazard ratios per 100 mGy reported leukaemia and all solid cancer combined, and also some individual cancer types. Adjustment for gender and year of birth was used. A minimum latency of two years for leukaemia and 10 years for solid cancers was used
Main results For solid cancer incidence ERR of 0.03 per 100 mGy (90% CI: −0.04, 0.09)
III. STUDIES OF ENVIRONMENTAL EXPOSURE TO NATURAL RADIATION
98. Natural background radiation, which originates from the terrestrial environment, varies tremendously worldwide and within countries as well. The average annual dose from external terrestrial radiation is 0.48 mSv, with typical values ranging 0.3–1 mSv a−1 [U10]. The primary radioactive elements in the earth’s crust that lead to human exposure are potassium, uranium, thorium, and their radioactive decay products (e.g. radium, radon). A high natural background radiation (HNBR) area is defined as an area where the total cosmic radiation and natural radioactivity in soil, indoor and outdoor air, water and food lead to chronic external and internal exposure to the public [H4]. The annual effective dose in HNBR areas has been classified into four levels: low (approximately 5 mSv a−1) or about twice the global average of 2.4 mSv a−1 reported by UNSCEAR [U10]; intermediate (5-20 mSv a−1); high (20–50 mSv a−1); and very high (>50 mSv a−1) [S22, S23]. In this chapter, major cancer epidemiological studies in HNBR will be described. They focus on areas where typical annual doses from external terrestrial gamma radiation alone is of the order of magnitude of 2 mSv a−1, and cumulative lifetime doses are in range of 20–50 mSv and higher.

ANNEX B: EPIDEMIOLOGICAL STUDIES OF CANCER RISK DUE TO LOW-DOSE-RATE RADIATION [...] 99
A. Studies in Karunagappally, Kerala, India
1. Radiation sources
99. The mineral monazite, an anhydrous phosphate of the cerium group of the rare earths, was named by Breithaupt [B18]. Monazite sand is an orthophosphate of thorium and rare earths and typically contains thorium oxide (8% on average) and uranium oxide (0.3% on average) along with phosphorous pentoxide, rare earths, titanium oxide, cerium oxide, iron oxide and silicon dioxide [B11, O5, S29]. Most monazite is various shades of yellow. Shades of yellowish brown, brown, reddish brown, red, yellowish green, green, and greenish brown are locally common in detrital monazite from streams and lakes and in accessory monazite in schist, gneiss, granite and, particularly, pegmatite [O5].
100. The large monazite deposits in the coastal belt of Kerala, India, were discovered already in 1909 [K19]. The coastal zone from Chavara-Neendakara in the south to Purakkad in the north, which is flanked by the Arabian Sea in the west and Western Ghats in the east, is known to have thorium-containing monazite sand and a large quantity of other minerals. The radiation dose in terms of air kerma ranges from <1 to 45 mGy a−1. The HNBR area extends from the outlet of the Ashtamudi Lake in the south up to the Kayankulam Lake in the north. There is a canalized lagoon on the eastern side and the Arabian Sea on the west. So this area constitutes an island, which is 55 km long, and 0.5 km wide in the south and 1.5 km wide in the north. It has alternating bands of light and heavy minerals up to a depth of about 15 m [W7].
101. The beach boulders, include khondalites, chamockites, gneiss and granites, are lying in the hinterland granulitic terrain in parts of Tamil Nadu and Kerala. They were brought to the sea by fluvial transportation [P2, S30]. The largest of these streams, the Kallada River, empties into the Ashtamudi Lake, which is separated from the Arabian Sea by the Neendakara bar. The Warkilli series of sedimentary rocks in the lake are further transported to the coast by rivers that drain into the sea. The rocks of the Warkilli series are intermediate host rocks for monazite between the original source rocks and the beach boulders. Three rivers in the south of Kerala, i.e. Neyyar, Karamana and Vamanapuram, are also suspected of transporting more radioactive elements than the larger Kallada River due to higher levels of radioactive minerals in the hinterland rocks [P10].
102. Monazites and other heavy minerals in the beach are considered to be reconcentrated by wind, waves and currents. Ordinarily, monazite makes up less than 10% of the beach sand, possibly about 2–3% of the raw sand [B20, K1, W1]. However, at favourable localities, such as the coastal region of Chavara-Neendakara, tidal currents and waves selectively remove minerals of low specific gravity and leave behind minerals of high specific gravity [O5]. The raw black sand, however, contains 50–90% of ilmenite and 3–30% of monazite, containing 8% of 232Th on average [I7, O5]. Coastal configurations and sea currents in the south of Kerala are also suspected to be factors contributing to the deposition of these elements in the Chavara-Neendakara area [P10].
103. The first report of the WHO’s Expert Committee on Radiation (Effects of Radiation on Human Heredity) was published in 1959 [W7]. It mentioned that “one untapped source of information suggested was the study of populations exposed to relatively large amounts of background radiation, that is, radiation of the order of one ‘rem’ per year”, and that “the Kerala area of India would appear to be the only area now known, which might profitably be investigated”. According to the report, approximately 60,000 people living in the radioactive milieu of the Chavara-Neendakara area were subjected to low-level chronic radiation exposure and presumably have been exposed for generations.
100 UNSCEAR 2017 REPORT
104. The WHO report summarized the population characteristics in the 1950s. The main features were: (a) approximately half the population were Christian and the rest Hindu; (b) the great majority lived from fishing; and (c) the percentage of literacy was high. Consanguineous marriages were fairly common among the Hindus. It was preferred that a man married his full cousin who was his paternal aunt’s daughter (and therefore, would probably be brought up in another village). Among Hindus, full cousin marriage rate was considered to be about 10–20%.
105. The infant mortality rate in this area was higher than 100 per 1,000 live births, indicating that public health conditions in this area were poor, though the situation has improved in Kerala since the 1960s. Twelve deaths per 1,000 births were reported in 2011, while it was as high as 44 deaths in the entire country [O1].
2. Study population
(a) Cohort characterization
106. Baseline survey. The Chavara-Neendakara area is in the coastal belt of the Karunagappally taluk (administrative district). A cohort of all residents in the Karunagappally taluk (population size: 385,103 according to the population census in 1990) was established in the 1990s to evaluate the health effects of HNBR [N4]. From 1990 to 1997, house-to-house visits were conducted to measure indoor and outdoor air kerma rates and to collect personal information using a standardized questionnaire. This included questions on sociodemographic factors, lifestyle, including dietary habits, and tobacco and alcohol use. In total, this household survey collected personal information on 359,619 subjects in 71,674 households, which corresponds to 93% of the population and 94% of households in Karunagappally by the 1990 census. No attempt was made to re-interview the cohort members.
107. Among male adults (aged 30–84 years), 73% were Hindu and 18% Moslem. Only 6% were illiterate. More than 60% of the study subjects said they had smoked bidis in the past or did so currently. Bidi is made of 0.15–0.25 g of sun dried flaked tobacco rolled into a conical shape in a dried rectangular piece of Temburni leaf (Diospyros melanoxylon) and a thread securing the roll [S26]. Among the subjects aged 70 or older at the time of interview, bidi smokers accounted for more than 70%. Tobacco chewing was reported by 24% of the cohort members and, among those aged less than 70 at the time of interview, more than 50% were past or current tobacco chewers. Approximately 50% were past/current alcohol drinkers [J4]. The most popular alcohol beverages in this population are locally produced, including toddy (palm wine) and arrack (a strong liquor made from coconut flowers, sugarcane or other locally grown plants) [J5]. Fishing is the main source of livelihood for the coastal residents. Among men aged 30 years or older, fishermen and farmers accounted for nearly 20% of residents. However, since this group was reported to have 20–30% higher lung cancer incidence than the other occupational groups [J6], it is strongly suspected that smoking is a more common habit than in other occupations.
108. Among adult women (aged 30–84 years), 72% were Hindu and 20% Moslem. Among the female cohort members, fewer than 5% were fisherwomen and farmers, and 17% were illiterate. Tobacco smoking and alcohol drinking are rare among women [J4].
109. In summary, the population in Karunagappally and other areas in Kerala evidently has better public health and education levels than found in other areas in India. The main industry in Karunagappally was agriculture until the late 19th century. Since then, it has been rapidly urbanized.
ANNEX B: EPIDEMIOLOGICAL STUDIES OF CANCER RISK DUE TO LOW-DOSE-RATE RADIATION [...] 101
Fishing is the main source of livelihood for the coastal residents. Further, a regional cancer registry has been in existence since 1990, interviews have been conducted with most of the population, and efforts have been made to obtain dose estimates based on measurements for individuals. However, there is evidence of under-ascertainment of cancer cases. The International Agency for Research on Cancer (IARC) stated in 2002 “However, the percentage of cases with primary site unspecified or ill-defined is very high, as is the proportion of cases registered on the basis of a death certificate alone, suggesting a degree of under-ascertainment” [N2].
110. For radiation risk analysis, six panchayats, including four panchayats with relatively high environmental doses (Alappad, Chavara, Neendakara and Panmana) and two panchayats with relatively low environmental doses (Oachira and Thevalakkara), were chosen in coastal areas. The Kollam area was not included since this area is much more urbanized than the Karunagappally taluk, as pointed out by WHO’s Expert Committee on Radiation [W7]. The control areas in this cohort are Oachira and Thevalakkara panchayats, located in the northern and eastern areas of this taluk. This decision is compatible with the WHO committee’s notion, which is that: “a defined strip of north of Kayamkulam bar would probably be most suitable as a control area”. The population of those six panchayats selected for radiation-related risk analysis consisted of 173,067 individuals. This subcohort will hereinafter be called “the radiation subcohort”.
111. There were 71,399 men and women aged 30–84 in this subcohort. Those younger than 30 were excluded because (a) cancer risk was low in that age group and (b) the cumulative radiation dose was expected to be relatively low. Rare-earth technology workers, who might have been exposed to various types of occupational exposure (N=1,196), and those who had died or had been diagnosed with cancer before the baseline survey were excluded. Thus, there were 69,958 individuals for statistical analysis.
(b) Follow-up
112. Cancer cases in the cohort were ascertained by the cancer registry in Karunagappally, established in 1990. One of the main activities to identify cancer cases was monthly routine visits to the Regional Cancer Centre in Trivandrum, which is situated 70 km south, and is the comprehensive cancer centre in the state of Kerala. More than half of the cancer cases registered in the Karunagappally cancer registry were those who sought medical treatment in the Regional Cancer Centre [J6]. Further, annual visits to the following medical facilities were conducted: (a) Trivandrum Medical College Hospital in Trivandrum; (b) major pathological laboratories in the Karunagappally taluk and its neighbouring areas and in Trivandrum; and (c) all the hospitals and medical practitioners in the Karunagappally taluk. In addition, three to four times a year, the registry workers visited three primary health centres in the taluk, which have cancer screening facilities. Cancer cases were also ascertained by (a) monthly clinics to provide follow-up care for local cancer patients, and (b) the cancer screening camps conducted twice a year on average in all panchayats in the taluk. The registry data have been included in the recent editions of “Cancer Incidence in Five Continents”, which indicates that it fulfils the quality requirements for inclusion in IARC monographs [I2].
113. Death reports were obtained from the death registers kept in the health statistics divisions of the panchayats. Visits to homes of the deceased were made to supplement information on the cause of death. The extent of migration of radiation subcohort members (N=173,067), including control-area residents, was assessed by conducting a door-to-door survey of all the households in 2001. Movement within the panchayat was 9.5% while migration to outside the taluk was 6% in the 13-year study period. Most migration took place for job opportunities in the Gulf countries. Only 0.7% was lost to follow-up.

102 UNSCEAR 2017 REPORT
114. The entry into the cohort was the date of interview, which ranged from 1 January 1990 to 31 December 1997. The follow-up ended on the date of (a) cancer diagnosis; (b) death; (c) migration out of the study area; (d) attainment of 85 years; or (e) the 31 December 2005 (follow-up termination), whichever occurred first. In person-year calculations, the migration that had taken place until the migration survey in 2001 was taken into account.
3. Dosimetry
115. The HNBR in Karunagappally is mainly from thoron progenies and relatively high air kerma rates are found mainly in the coastal zone of Karunagappally taluk. In the Karunagappally study, exposure was mainly from external gamma [N4] and indoor air kerma rate measurements were made at every house in the 1990s. Outdoor dose rates were measured only at the front gate. Air kerma rates at school or at work locations (including sea for fishermen and farmland for farmers) were not measured. Information that would enable an evaluation of the correlation between ambient dose rates at school (or at work) and in the home was not available. Because women tended to stay at home longer than men, the cumulative dose estimates for women seemed more reliable than those for men. Sex- and age-specific house occupancy was determined on the basis of information collected from the survey of randomly selected residents in the study area (N=7,711). No information was available on occupancy at home and other locations for each resident. The indoor and outdoor air kerma rates of those panchayats are shown in table 13.
Table 13. Annual air kerma in six panchayats in Karunagappally, Kerala, India
Annual air kerma (mGy a−1)
Panchayats
Oachira Thevalakkara Panmana Neendakara Alappad Chavara
INDOOR MEASUREMENTS
Median 1.07 1.22 2.29 2.52 3.14 3.90
Maximum 9.18 9.56 21.4 53.6 25.3 42.9
OUTDOOR MEASUREMENTS
Median 0.92 1.07 3.21 4.21 4.51 5.28
Maximum 12.1 29.8 30.6 76.5 43.1 63.0
116. Individual radiation dose (excluding cosmic rays) was estimated from the HNBR area on the basis of outdoor and indoor air kerma rates, taking into account sex- and age-specific occupancy factors. One indoor and one outdoor measurement of air kerma rates from gamma rays were conducted in 71,674 houses, using seven sodium iodide (NaI) detector-based scintillometers and six plastic scintillometers, which were designed and supplied by the Bhabha Atomic Research Centre, Mumbai, India. All these were cross-calibrated every day using a standard 137Cs source in the laboratory before field measurements were made. The mean of three readings was taken for every measurement. For indoor measurement, the room with maximum occupancy was selected and the readings were taken in the centre of the room at a height of 1 m above the ground for five minutes. For outdoor measurement, five-minute readings at a height of 1 m above the ground were taken at a point 3 m away from the main entrance of the house.
117. Information on house occupancy was not collected through the baseline survey. As the population in the radiation cohort was very large, only a sample population was interviewed to obtain information on the fraction of time spent indoors and outdoors [N3]. In 2002, 2% of all houses were randomly
ANNEX B: EPIDEMIOLOGICAL STUDIES OF CANCER RISK DUE TO LOW-DOSE-RATE RADIATION [...] 103
selected and information on occupancy was obtained for 7,711 residents (3,783 males and 3,928 females) in all age groups living in the selected houses. The house occupancy factor varied from 0.5 to 0.89 depending on sex and age, which are comparable with the value of 0.8 cited by UNSCEAR [U7].
118. Assuming the air kerma values for the cosmic ray component of the measured radiation level to be 0.227 mGy a−1 for indoors and 0.252 mGy a−1 for outdoors [A4, B13, U4, U7], the annual absorbed dose for each individual was calculated using the formula:
Annual colon/RBM dose (mGy) = [(Kindoor y−1 – 0.227) × OFindoor + (Koutdoor y−1 – 0.252) × OFoutdoor] × CF
where Kindoor y−1, and Koutdoor y−1 are annual mean indoor and outdoor air kerma rates for the ward or panchayat. OF is the occupancy factor and CF is the conversion factor for air kerma to organ-specific absorbed dose presented in the ICRP Publication 74 [I5]. The CF for 232Th used in the present study was 0.782 for the colon and 0.791 for RBM. The CFs for children aged 1–14 years and infants aged less than one year were increased by 10% and 30%, respectively. Colon dose was used for risk analysis since the LSS reports of cancer risk analysis of atomic bombing survivors also used it [P14]. Assuming that the external radiation from HNBR was whole-body exposure, total body exposure was represented by absorbed dose of the colon. The cosmic ray component (0.252 and 0.227 mGy a−1 outdoors and indoors, respectively) was subtracted from the measured dose in order to estimate the radiation dose from terrestrial radiation exposure. The individual cumulative dose was calculated by adding up the annual dose over time and the average was reported as 161 mGy in the exposed cohort [N4].
119. Information on migration was taken into account when estimating the cumulative dose of the cohort subjects in the following manner. When migration occurred into the Karunagappally taluk, the mean outside and inside radiation doses of the Oachira panchayat (a control area) were assigned to the ages of the immigrants before migration. When a subject moved within the Karunagappally taluk, the average outdoor air kerma rate of the ward in which the house was located and the average indoor air kerma rate of all the houses in the same ward were assigned. If the ward was not known, the mean outdoor air kerma rate of the panchayat was taken.
120. The measurements of scintillometers was compared with thermoluminescent dosimeters (TLD), which showed a good correlation (regression coefficient 0.97) [N4]. It would have been ideal to use TLD for dose measurements but using it for measuring the outdoor and indoor dose of 75,000 houses would have been extremely difficult. In order to calculate the annual dose based on scintillometer spot readings, it was necessary to confirm the correlation between the spot reading and long-term exposure levels. For this purpose, TLD measurements and scintillometer spot readings were conducted for one year in 800 houses, randomly selected from 12 panchayats. Natural calcium fluoride powder was placed inside a brass capsule with a diameter of 3 mm, a length of 8 mm and a wall thickness of 1.5 mm. About 50 mg of the powder was dispensed inside the capsule using a vibrator volume dispenser. Two such capsules were placed inside a plastic locket with a wall thickness of 2 mm. The locket was placed inside the house taped below a cot or table at a height of 50–100 cm above the ground in a room with maximum occupancy. The TLD was read under a constant nitrogen flow of 5 L min−1, using a Harshaw 3,000 reader calibrated with a 137Cs source. The dose was measured in quarterly integrating cycles for the whole year at the same place. A scintillometer reading was taken at the same height in the same house every quarter. The mean of the four spot readings (µR h−1) was converted to the annual dose (mGy a−1), using a conversion factor of 0.0765 (= 8.73 × 24 × 365.25/106) [N3].
121. The study examined the correlation between scintillometer readings converted to annual dose and the annual dose evaluated using TLD. The correlation coefficient was 0.93 and the TLD dose was 0.97 times the scintillometer-based annual dose. The scintillometer measured an outdoor dose at the door and indoor doses at each house, and individual doses had a wide distribution. However, the high

104 UNSCEAR 2017 REPORT
correlation coefficient indicates that the major radiation source of studied subjects are from the residence and areas near the residences. The annual radiation doses (mGy a−1) used in the cancer risk analysis were obtained by converting the scintillometer-based annual dose to TLD equivalent annual dose, multiplying by 0.97.
(a) Internal exposure
122. Indoor radon and thoron concentrations, and also thoron progeny, were measured in 259 dwellings of the Karunagappally taluk: 183 in HNBR areas and 76 in low-background-radiation areas [O3]. Internal doses due to ingested and inhaled radionuclides were not considered in the cumulative dose estimation, but measurements were made to evaluate them. This survey used the passive monitoring device named raduets, which has a twin-cup monitor with two CR-39 solid-state nuclear track detectors to measure indoor thoron and radon gas concentrations separately. Indoor thoron progeny concentrations (equilibrium equivalent thoron concentrations) were also determined, using a passive device with CR-39 solid-state nuclear track detectors to count alpha particles emitted only from deposited thoron progenies. The monitors were deployed for about six months. Indoor radon gas concentrations in the study area were low (table 14), below 10 Bq m−3 in most houses [O3]. Indoor radon gas and thoron gas concentrations had no correlation. Similar results were obtained in the second series of the survey (table 14).
123. The median effective annual dose from indoor radon and its progeny was estimated as 0.1 and that from thoron decay products as 0.4 mSv a−1 (table 15). It is also noted that radon and thoron gas concentrations and thoron progeny concentration were not correlated with the indoor air kerma rate obtained from instantaneous measurements by a semiconductor detector with electrostatic collection, grab sampling of thoron progenies and a CsI (Tl) scintillation survey meter. The absence of significant correlation could be explained with the fact that building material contained uranium decay series nuclides, thorium decay series nuclides and 40K, which are major contributors to air kerma rate in the study area. However, the magnitude of their contributions can vary from house to house. Another explanation may be that the rate of entry of thoron in a dwelling is highly variable according to the building material and to the flooring. Mean indoor concentrations of radon and thoron progeny are also slightly lower in HNBR areas than in other areas.
124. The meals of residents did not contain a large proportion of food grown in their neighbourhood. Therefore, it is unlikely that lifetime radiation doses from internal exposure differed substantially between areas within Karunagappally. The thorium burden of 87 residents in Karunagappally was determined by a thoron-in-breath analysis [N3, N5]. The mean 232Th body burden for 16 subjects from normal background level areas (mean 0.72 mGy a−1) was 6.3 Bq. For 33 subjects from medium background radiation level areas (mean 2.04 mGy a−1), the mean 232Th body burden of 8.9 Bq was estimated and 38 subjects from high-background radiation areas (mean 15.64 mGy a−1) had a mean of 10.91 Bq. These results show that the subjects from high and medium indoor radiation level areas show a significant increase in the thorium body burden (P=0.0094) compared to those from low indoor radiation level areas.

ANNEX B: EPIDEMIOLOGICAL STUDIES OF CANCER RISK DUE TO LOW-DOSE-RATE RADIATION [...] 105
Table 14. Indoor radon and thoron gases and thoron progeny concentrations in Kerala, India [O3]
Survey a Source Houses (NAb) Concentration (Bq m−3)
Mean Median Range
1st survey HNBRc areas
Radon 53 (22) 5±3 4 1–13
Thoron 68 (7) 53±28 46 15–128
Thoron progeny 66 (9) 2.15±1.57 1.48 0.59–6.72
Otherd areas
Radon 37 (13) 8±5 9 1–21
Thoron 48 (2) 47±44 31 11–212
Thoron progeny 44 (6) 2.32±1.51 1.91 0.36–8.00
2nd survey HNBRc areas
Radon 80 (28) 5±4 4 1–30
Thoron 104 (4) 26±20 20 3–151
Thoron progeny 63 (45) 1.56±1.01 1.21 0.52–5.72
Otherd areas
Radon 14 (13) 7±11 4 1–43
Thoron 26 (1) 30±35 16 7–133
Thoron progeny 18 (9) 1.69±1.74 1.22 0.45–7.53
a The first survey was conducted during June 2010–February 2011. The second survey was conducted during December 2010-June 2011. In both studies, raduets were in place for about six months. b NA: data are not available (“below the detectable level” is included). The lower limit of detection for radon and thoron measurements are around 1.0 Bq m−3 and 2–43 Bq m−3, respectively. The lower limit of detection for thoron progeny measurement is 0.003 Bq m−3. c The HNBR areas are Panmana, Neendakara, Alappad and Chavara panchayats in Karunagappally taluk. d Other areas are Oachira and Thevalakkara panchayats in the taluk.
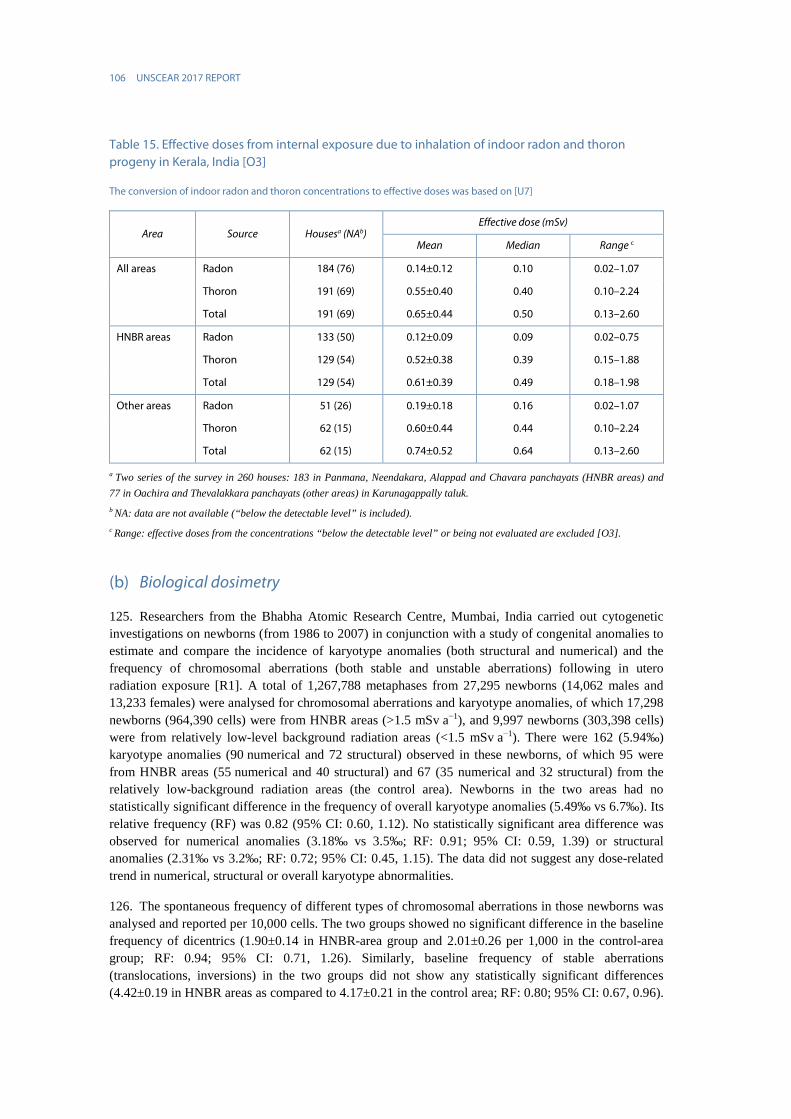
106 UNSCEAR 2017 REPORT
Table 15. Effective doses from internal exposure due to inhalation of indoor radon and thoron progeny in Kerala, India [O3]
The conversion of indoor radon and thoron concentrations to effective doses was based on [U7]
Area Source Housesa (NAb) Effective dose (mSv)
Mean Median Range c
All areas Radon 184 (76) 0.14±0.12 0.10 0.02–1.07
Thoron 191 (69) 0.55±0.40 0.40 0.10–2.24
Total 191 (69) 0.65±0.44 0.50 0.13–2.60
HNBR areas Radon 133 (50) 0.12±0.09 0.09 0.02–0.75
Thoron 129 (54) 0.52±0.38 0.39 0.15–1.88
Total 129 (54) 0.61±0.39 0.49 0.18–1.98
Other areas Radon 51 (26) 0.19±0.18 0.16 0.02–1.07
Thoron 62 (15) 0.60±0.44 0.44 0.10–2.24
Total 62 (15) 0.74±0.52 0.64 0.13–2.60
a Two series of the survey in 260 houses: 183 in Panmana, Neendakara, Alappad and Chavara panchayats (HNBR areas) and 77 in Oachira and Thevalakkara panchayats (other areas) in Karunagappally taluk. b NA: data are not available (“below the detectable level” is included). c Range: effective doses from the concentrations “below the detectable level” or being not evaluated are excluded [O3].
(b) Biological dosimetry
125. Researchers from the Bhabha Atomic Research Centre, Mumbai, India carried out cytogenetic investigations on newborns (from 1986 to 2007) in conjunction with a study of congenital anomalies to estimate and compare the incidence of karyotype anomalies (both structural and numerical) and the frequency of chromosomal aberrations (both stable and unstable aberrations) following in utero radiation exposure [R1]. A total of 1,267,788 metaphases from 27,295 newborns (14,062 males and 13,233 females) were analysed for chromosomal aberrations and karyotype anomalies, of which 17,298 newborns (964,390 cells) were from HNBR areas (>1.5 mSv a−1), and 9,997 newborns (303,398 cells) were from relatively low-level background radiation areas (<1.5 mSv a−1). There were 162 (5.94‰) karyotype anomalies (90 numerical and 72 structural) observed in these newborns, of which 95 were from HNBR areas (55 numerical and 40 structural) and 67 (35 numerical and 32 structural) from the relatively low-background radiation areas (the control area). Newborns in the two areas had no statistically significant difference in the frequency of overall karyotype anomalies (5.49‰ vs 6.7‰). Its relative frequency (RF) was 0.82 (95% CI: 0.60, 1.12). No statistically significant area difference was observed for numerical anomalies (3.18‰ vs 3.5‰; RF: 0.91; 95% CI: 0.59, 1.39) or structural anomalies (2.31‰ vs 3.2‰; RF: 0.72; 95% CI: 0.45, 1.15). The data did not suggest any dose-related trend in numerical, structural or overall karyotype abnormalities.
126. The spontaneous frequency of different types of chromosomal aberrations in those newborns was analysed and reported per 10,000 cells. The two groups showed no significant difference in the baseline frequency of dicentrics (1.90±0.14 in HNBR-area group and 2.01±0.26 per 1,000 in the control-area group; RF: 0.94; 95% CI: 0.71, 1.26). Similarly, baseline frequency of stable aberrations (translocations, inversions) in the two groups did not show any statistically significant differences (4.42±0.19 in HNBR areas as compared to 4.17±0.21 in the control area; RF: 0.80; 95% CI: 0.67, 0.96).

ANNEX B: EPIDEMIOLOGICAL STUDIES OF CANCER RISK DUE TO LOW-DOSE-RATE RADIATION [...] 107
No area difference was found in the frequency of all chromosomal aberrations, which included dicentrics, translocations, inversions, rings, fragments and minutes (8.32±0.29 in HNBR areas and 9.29±0.55 in the control area; RF: 0.89; 95% CI: 0.78, 1.02) [C5, R1].
127. The spontaneous frequency of micronuclei was determined in 271 newborns (61 from the control area and 210 from HNBR area) born to mothers between 17 and 37 years of age (mean maternal age: 24.1±4.2 years). The frequency of micronuclei in newborns was 1.40±0.12 per 1,000 binucleated cells in the control and 1.33±0.04 in HNBR areas. When the samples were categorized into six different groups on the basis of the level of background radiation, no dose response was observed. The spontaneous frequency of micronuclei in newborns in HNBR and control areas showed no statistically significant difference, suggesting that slightly elevated levels of background radiation during the foetal period had no significant effect on induction of micronuclei in the newborns [D2].
128. To assess the effect of HNBR on the adult population, chromosomal aberrations in lymphocytes of adult individuals living in HNBR areas were investigated at the Regional Cancer Centre, Kerala [H2]. Blood samples from the female inhabitants, aged 30–58 years, in the HNBR and control areas were collected and examined for the frequency of dicentric and ring chromosomes in peripheral lymphocytes. The selected subjects had been born and brought up in the HNBR area or in the control area, and had been living there for a minimum of 30 years. A total of 23,673 cells from eight subjects in HNBR areas and 23,718 cells from eight subjects in control areas were examined. The estimated individual cumulative doses in the control area were 12–18.5 mSv (average=15.6 mSv, SD=2.4 mSv) and those in the HNBR area were 16.8–402.6 mSv (average: 187.5±157.7 mSv). The cytogenetic analysis revealed that the average numbers of chromosomal aberrations per 1,000 cells were 0.76±0.77 in control areas and 13.8±6.8 in HNBR areas.
129. No increase in DNA double-strand breaks in terms of gamma-H2AX was found in 61 adult residents of the HNBR areas compared with 30 from the control area in mononuclear cells from peripheral blood (0.095±0.009 and 0.084±0.004 per cell; P=0.22) [J2].
130. In another cytogenetic study, the frequencies of micronuclei were analysed in 94 adult men from the HBNR areas and 47 from control areas [J2, K2]. An average of 1,835 binucleated cells per individual were scored. The mean frequencies of micronuclei in the HBNR (11.7±SD 6.6) and control areas (11.6±6.7) were not statistically significantly different (P=0.59).
131. No differences in telomere length were found in two studies examining adults or newborns in the HNBR area compared with the control area. In the adult study with 233 exposed subjects the mean telomere length was 1.22±0.15 for the lowest and 1.12±0.11 for the highest group [D3]. In the newborn study, the average was 1.03±0.01 in the 128 exposed and 1.10±0.03 in the 43 control infants [D4], however, it is not indicated whether adjustment for age was used in the adult analysis.
4. Cancer incidence
132. In the Karunagappally cohort study of 69,958 subjects [N4], a total of 1,349 cancer cases were reported. The three most common cancers were oropharyngeal, lung and breast cancer (220, 189 and 125 cases, respectively). Of the cancer cases, 13% had an unknown primary site. In addition, there were 30 leukaemia cases (including 10 CLL).
133. Statistical analysis was based on the data in cross-tabulations by sex, attained age (five-year category) and other covariates. The entry into the cohort was the date of the baseline survey (date of interview). Poisson regression analysis of grouped survival data [B19] was conducted. To allow for a

108 UNSCEAR 2017 REPORT
possible latent period between radiation exposure and its consequences, cumulative doses were lagged by 10 years for all cancers except leukaemia where a lag of two years was used. Statistical power was not calculated prior to the establishment of this cohort.
134. Assuming a linear dose response, the ERR of all cancers except leukaemia in relation to cumulative dose was estimated using the following Poisson regression model:
H0(sex, attained age, follow-up interval, bidi smoking, education, occupation) [1 + β D]
where D is cumulative radiation dose calculated over time, and β, the coefficient of D, describes the relative change in rates associated with dose. H0 is the baseline cancer rate, depending on sex, attained age, follow-up intervals and other covariates (sociodemographic factors and bidi smoking). Analysis of cohort data, stratified* by sex, attained age, and follow-up interval, showed no excess cancer risk from exposure to terrestrial gamma radiation.
135. The excess relative risk of all cancers, excluding leukaemia, was estimated to be −0.013 per 100 mGy (95% CI: −0.058, 0.046). In site-specific analysis, no cancer site was significantly related to cumulative radiation dose (ERR=0.03 per 100 mGy for oropharyngeal and 0.01 for digestive tract cancer, lower confidence bounds not defined, upper bounds approximately 0.25). Leukaemia was not significantly related to background radiation (ERR=0.6 per 100 mGy, lower confidence limit not defined, upper limit 34). The follow-up period of the Karunagappally cohort study was recently extended by four years. The major methodological features of the Karunagappally study are summarized in table 16.
136. The Kerala programme of studies has several strengths: (a) the cumulative dose to date, 161 mGy average, is relatively large; (b) potential confounding factors such as tobacco use and socioeconomic status (SES) have been obtained by interview and can be adjusted for in the analysis; and (c) a cancer registry, described in Cancer in Five Continents (IARC), has existed since 1990 and thus data on cancer incidence (but not mortality) are available. Details of smoking adjustment were not, however, reported. The baseline interview covered the amount of both cigarette and bidi smoking, and also smoking status at interview (never, past, current), but the study report mentioned only adjustment for “bidi smoking”. However, there are uncertainties in dose estimates mainly due to exposure outside the residence, lack of exposure data for full residential history, and use of aggregate estimates rather than individual data for occupancy. The numbers of cases for several cancer sites are still relatively small. A quarter of the cases lacked pathological verification of the diagnosis. Furthermore, case ascertainment may be incomplete, given the low health-care level in the area. The primary occupation is fishing and, currently, there are few major environmental pollutants in these coastal regions, but potential differences in lifestyle between the populations of the high exposure area on the coast and the lower exposure area further inland need to be considered. Migration was also taken into account when calculating individual cumulative dose [J3, N1, N2]. In summary, while the findings in this study are reasonably robust, the confidence intervals obtained from the study are still wide and cannot convincingly discount risks similar to those reported from the LSS.
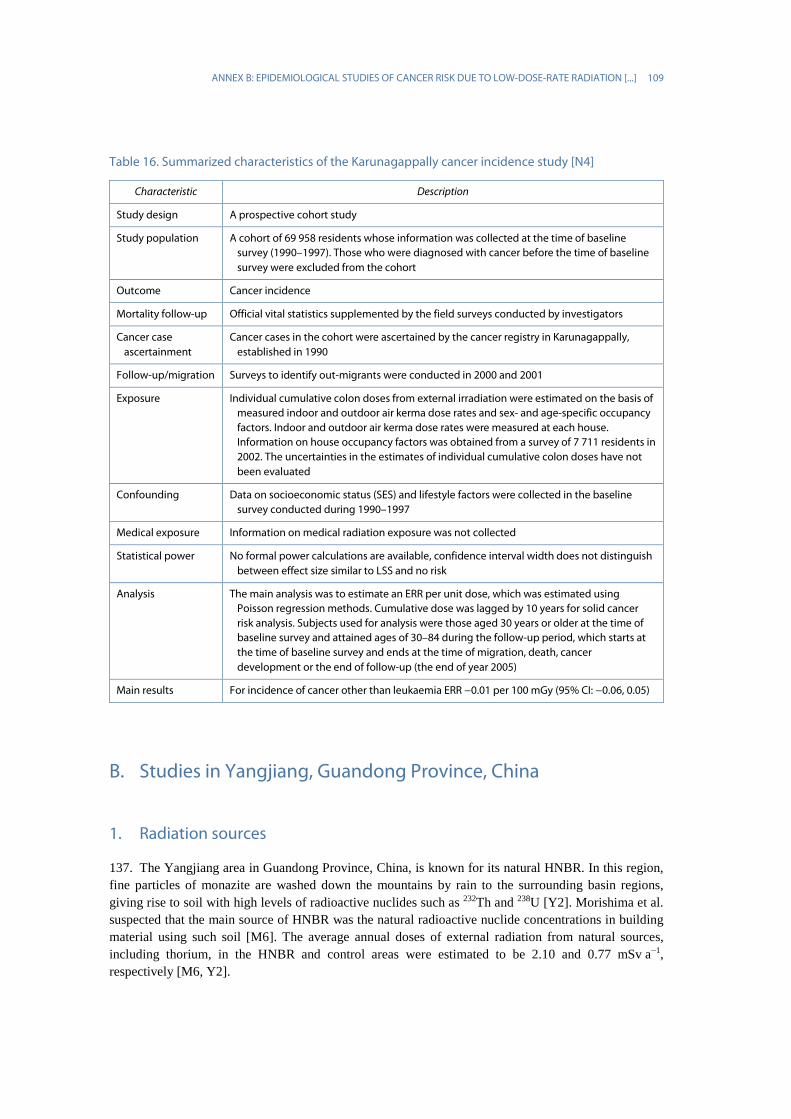
ANNEX B: EPIDEMIOLOGICAL STUDIES OF CANCER RISK DUE TO LOW-DOSE-RATE RADIATION [...] 109
Table 16. Summarized characteristics of the Karunagappally cancer incidence study [N4]
Characteristic Description
Study design A prospective cohort study
Study population A cohort of 69 958 residents whose information was collected at the time of baseline survey (1990–1997). Those who were diagnosed with cancer before the time of baseline survey were excluded from the cohort
Outcome Cancer incidence
Mortality follow-up Official vital statistics supplemented by the field surveys conducted by investigators
Cancer case ascertainment
Cancer cases in the cohort were ascertained by the cancer registry in Karunagappally, established in 1990
Follow-up/migration Surveys to identify out-migrants were conducted in 2000 and 2001
Exposure Individual cumulative colon doses from external irradiation were estimated on the basis of measured indoor and outdoor air kerma dose rates and sex- and age-specific occupancy factors. Indoor and outdoor air kerma dose rates were measured at each house. Information on house occupancy factors was obtained from a survey of 7 711 residents in 2002. The uncertainties in the estimates of individual cumulative colon doses have not been evaluated
Confounding Data on socioeconomic status (SES) and lifestyle factors were collected in the baseline survey conducted during 1990–1997
Medical exposure Information on medical radiation exposure was not collected
Statistical power No formal power calculations are available, confidence interval width does not distinguish between effect size similar to LSS and no risk
Analysis The main analysis was to estimate an ERR per unit dose, which was estimated using Poisson regression methods. Cumulative dose was lagged by 10 years for solid cancer risk analysis. Subjects used for analysis were those aged 30 years or older at the time of baseline survey and attained ages of 30–84 during the follow-up period, which starts at the time of baseline survey and ends at the time of migration, death, cancer development or the end of follow-up (the end of year 2005)
Main results For incidence of cancer other than leukaemia ERR −0.01 per 100 mGy (95% CI: −0.06, 0.05)
B. Studies in Yangjiang, Guandong Province, China
1. Radiation sources
137. The Yangjiang area in Guandong Province, China, is known for its natural HNBR. In this region, fine particles of monazite are washed down the mountains by rain to the surrounding basin regions, giving rise to soil with high levels of radioactive nuclides such as 232Th and 238U [Y2]. Morishima et al. suspected that the main source of HNBR was the natural radioactive nuclide concentrations in building material using such soil [M6]. The average annual doses of external radiation from natural sources, including thorium, in the HNBR and control areas were estimated to be 2.10 and 0.77 mSv a−1, respectively [M6, Y2].

110 UNSCEAR 2017 REPORT
2. Population characterization and follow-up
138. The HNBR area of Yangjiang covering a total area of about 540 km2 [H5], consists of the Dong-anling and Tongyou regions, which had 21,838 and 44,786 residents, respectively, at the time of the national census conducted on 1 January 1979. The residents are of the Han nationality, and 90% of the population had been living in those areas for six or more generations. The control area of the study is the Wudianmeihua region in Enping, located 50 km west of Dong-anling, which is 60 km east of Tongyou. Wudianmeihua had 25,924 residents at the time of the census. The primary occupation is farming, which might involve some exposure to insecticides.
139. The cohort consists of approximately 90,000 residents of the study area, including control areas, who were alive as of 1 January 1979. The most recent study analysed the mortality data of 31,604 men and women who attained the age of 30–74 during the follow-up period of 1979–1998 [T3]. It was decided to exclude those younger than 30 years because: (a) cancer risk was low in that age group; (b) the cumulative radiation dose was expected to be relatively low; and (c) childhood cancer is considered to have aetiological backgrounds different from adult cancer. In addition, cumulative doses remain relatively low for those young age groups. Those aged 75 years or older were also excluded from the analysis, because the elderly were less likely to seek medical care for cancer and chronic non-cancer diseases and, thus, the inclusion of this age group might result in a lower accuracy of diagnosis.
140. In order to compare lifestyles, socioeconomic conditions and other factors in the study areas, Chinese investigators conducted studies on confounding factors including diet and nutrition, drinking water, pesticide residue and aflatoxin B1 in food, medical radiation exposure, tobacco smoking and alcohol consumption. The studies showed that the distribution of those potential confounding factors did not substantially differ in the two areas [T4, Z4]. However, no individual-level data were collected on major cancer risk factors for the cohort members.
141. In order to ascertain deaths in cohort members, trained local census takers surveyed the hamlets of the study areas to collect information on deaths and migration of inhabitants in each hamlet. The collected information was recorded on a demographic survey sheet prepared for each household in the hamlet. The task group on the mortality follow-up survey then visited the study areas and reviewed the survey sheets. In order to ascertain the cause of death, they visited the relevant hospitals in the study areas, reviewed medical records of deceased subjects and extracted relevant information. If necessary, the task group revisited the local village doctors and the family members or next of kin to collect further information on the cause of death. The underlying causes of death were determined on the basis of pathological information for 240 (26%) deaths.
3. Dosimetry
142. The doses from external radiation from HNBR in Yangjiang are due mainly to gamma rays from radionuclides of the 232Th decay series. Indoor air kerma rates were measured at approximately one third of houses at a village selected for indoor dosimetry (measurements available for the analysis covered 8,028 households in total). Therefore, the individual cumulative dose for a resident is based on the average dose in the village of residence. However, inter-house differences were not large [M6]. Indoor and outdoor ambient gamma dose rates were 110–370 and 100–220 nGy h−1, respectively. Doses received from indoor terrestrial radiation were estimated to be 0.6–1.8 mSv a−1 [O2]. Outdoor air kerma rates were measured in most of the locations where a villager spent some time, and were found to be more heterogeneous than indoor absorbed dose rates in air [M6, Y1, Y2]. Although the hours spent in each location in a village differ by sex, age and occupation, whether those points were taken
ANNEX B: EPIDEMIOLOGICAL STUDIES OF CANCER RISK DUE TO LOW-DOSE-RATE RADIATION [...] 111
into account or not is unclear. It should be noted, however, that indoor exposure contributes more to the total dose than outdoor exposure in this study area. House occupancy factors were collected by a survey of approximately 5,291 subjects during 1991–1993 [T3, Y1]. Air kerma rates in schools or workplaces were measured. More detailed descriptions on dosimetry are given below.
143. Individual radiation dose from the HNBR was estimated on the basis of outdoor and indoor air kerma rates and sex- and age-specific occupancy factors. Environmental dose rates were measured with Chinese NaI (TI) scintillation survey-meters, FD71 or FD3013 [Y2]. In every hamlet, indoor measurements were conducted in about one third of all households, and measurements for 8,028 households in total were available for the analysis. Indoor gamma radiation doses were measured in the main bedroom, the sitting room and the kitchen in each of those households. Outdoor doses were measured on main roads, alleys, open recreational areas, rice paddies, areas adjacent to wells, dry land and the banks of ponds for each hamlet.
144. House occupancy factors specific for sex and age were obtained from a questionnaire survey of 5,291 subjects (0–92 years old, mean age=54, SD=22) in over 88 hamlets conducted from 1991 to 1993 [Y1]. Age categories were listed in five-year periods between 30−34 and 70–74. The sex- and age-specific occupancy factors represented the time spent in bed, and at the other indoor places [Y1, Y2].
145. The annual absorbed dose for each individual Dindividual y–1 (mGy) was calculated using:
Dindividual y−1 = [(Kmain bedroom y−1 – CRindoor y−1) × OFmain bedroom + (Kother rooms y−1 – CRindoor y−1) × OFother
rooms + (Koutdoor y−1 – CRoutdoor y−1) × OFoutdoor] × CF
where Kmain bedroom y−1, Kother rooms y−1 and Koutdoor y−1 are annual doses for the main bedroom, for the rooms other than the main bedroom, and for outdoors, respectively; CRindoor y−1 and CRoutdoor y−1 are indoor and outdoor annual cosmic ray doses, respectively; OFmain bedroom, OFother rooms and OFoutdoor are the occupancy factors for the main bedroom, for the rooms other than the main bedroom, and for outdoors, respectively; and CF is the conversion factor for air kerma to organ-specific absorbed dose given in ICRP Publication 74 [I5].
146. The Dmain bedroom is an average gamma radiation dose measured 1 m above the floor in the main bedrooms of ten houses in the hamlet where the study subjects were living at the time of the dosimetry survey. The Dother rooms, the indoor dose for the rooms other than the main bedroom, was also the average dose that was calculated using the same approach as the Dmain bedroom. Doutdoor is the average of gamma radiation dose measured at 1 m above the ground in public places and farmland in the corresponding hamlet. The individual cumulative dose was calculated by integrating the annual dose over time [S28, Y2].
147. Using this formula, colon dose was calculated and was used for risk analysis. Assuming that the external radiation from HNBR was whole-body exposure, this was represented by the absorbed dose of the colon (as in the Indian cohort study). This is the same approach as that used by the LSS of solid cancer risk analysis of the Japanese atomic bombing survivors, which also used colon dose to analyse solid cancer risk [P14]. For leukaemia risk analysis, RBM dose was calculated using this formula. The CF of 232Th used in the present study was 0.627 for the colon and 0.791 for RBM. The CFs of children aged 1–14 years and infants aged less than one year were increased by 10% and 30%, respectively. The cosmic ray component was subtracted from the measured dose in order to estimate the radiation dose from terrestrial radiation exposure by using an air kerma value for the cosmic ray component of the measured dose of 0.259 mGy a−1 for indoors and 0.288 mGy a−1 for outdoors [A4, B13, U4, U7].
148. Morishima et al. measured indoor and outdoor air kerma rates, using a NaI(Tl) scintillation survey meter (Aloka TCS-166) in 200 houses in the Madi hamlet in the HNBR area, and in 22 houses in the control area (Hampizai hamlet) with a dose rate less than 0.1 μGy h−1 [M6]. They also conducted
112 UNSCEAR 2017 REPORT
individual dosimetry, using electronic pocket dosimeters (Aloka PDM-101) and TLDs (National Co. UD-200S), which were set for 24 hours and two months, respectively. The scintillation survey meters could not measure cosmic rays which were outside the scope of detectable energy of the device, so the measured data were corrected accordingly. There was wider variation in dose rates in HNBR areas than in control areas. In the HNBR region, dose rates tended to be higher indoors than outdoor rates due to radiation from building material. Also, the relationship between environmental and individual dose rates was less straightforward.
(a) Internal exposure
149. A small survey (N=215) using radopots was conducted in 2003 to measure indoor radon concentrations [O3]. The average indoor radon concentration was 37 Bq m−3 (SD=44; range=3, 284). In a recent radon and thoron survey, using raduets, of 59 houses in four hamlets in Yangxi and Yangdong counties (HNBR areas) during about six months, indoor radon and thoron concentrations showed wide variations from house to house. The mean indoor radon concentration was 124 Bq m−3 (median 115) and the average indoor thoron concentration was 1,247 Bq m−3 (median 859) [K20]. The radopot and the raduet used in those surveys were passive monitoring devices with CR-39 solid-state nuclear track detectors. The internal dose due to ingested and inhaled radionuclides was not considered in the cumulative dose estimation.
150. Air kerma rate was also measured using a CsI (Tl) scintillation pocket survey meter in the bedrooms of eight houses in the same hamlets. It is noted that the air kerma rate was not correlated with radon and thoron gas concentrations or thoron progeny concentration obtained from instantaneous measurements by a semiconductor detector with electrostatic collection and grab sampling of thoron progenies. The estimated effective doses from internal exposure to radon/thoron and from external exposure are summarized in table 17. Effective doses from internal exposure from indoor radon and thoron and their progenies were larger than those from external exposure. This is contrary to the situation in Karunagappally in Kerala, where the internal exposure from indoor radon and thoron is one order of magnitude smaller than the external exposure. Internal exposure was not considered in risk analysis since the indoor radon and thoron survey covered only a small number of houses in the study area. However, radiation dose from internal exposure can increase lung cancer risk in HNBR areas. Nevertheless, the lung cancer mortality in HNBR areas was smaller than that in the control area, probably reflecting differences in smoking habits [T2].
151. Yukawa et al. measured the concentration of 238U and 232Th in the food samples collected in Yangjiang, using ICP-MS [Y3]. The annual effective doses from radionuclides from 238U and 232Th series through ingestion were estimated to be 0.3 and 1.9 μSv a−1, respectively, in the HNBR area while the corresponding values were 0.01 and 0.2 μSv a−1, respectively, in the control area [W6].
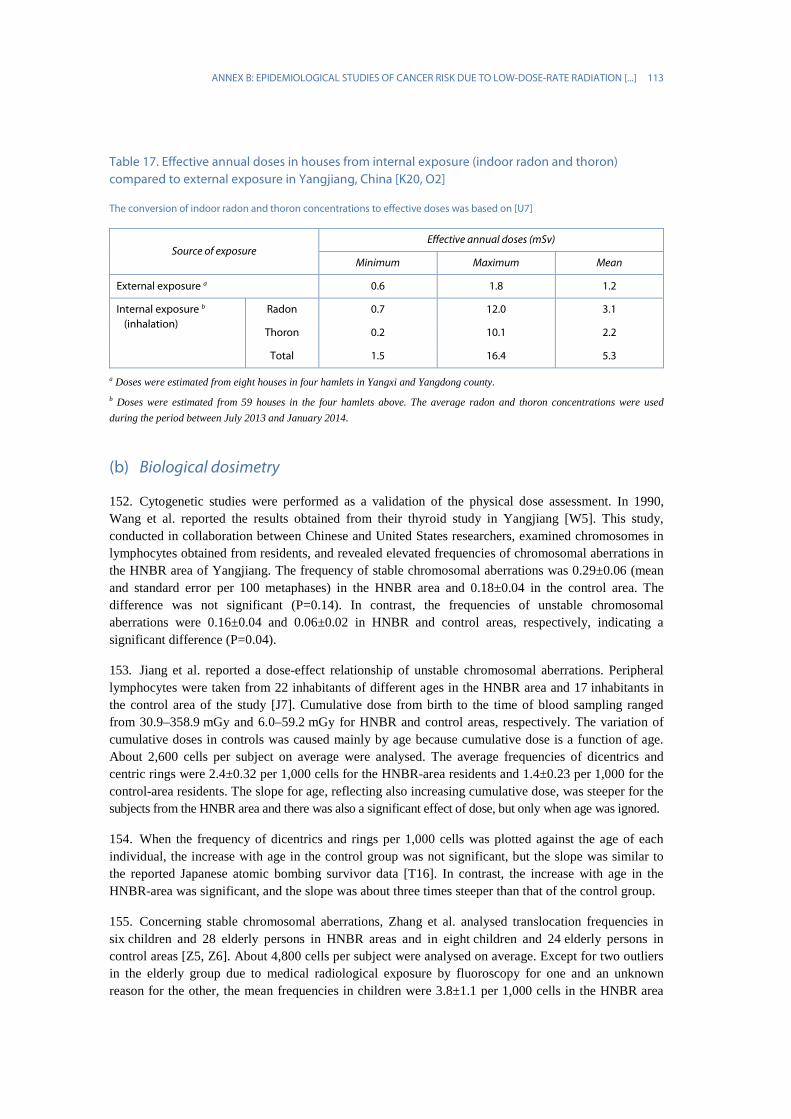
ANNEX B: EPIDEMIOLOGICAL STUDIES OF CANCER RISK DUE TO LOW-DOSE-RATE RADIATION [...] 113
Table 17. Effective annual doses in houses from internal exposure (indoor radon and thoron) compared to external exposure in Yangjiang, China [K20, O2]
The conversion of indoor radon and thoron concentrations to effective doses was based on [U7]
Source of exposure Effective annual doses (mSv)
Minimum Maximum Mean
External exposure a 0.6 1.8 1.2
Internal exposure b (inhalation)
Radon 0.7 12.0 3.1
Thoron 0.2 10.1 2.2
Total 1.5 16.4 5.3
a Doses were estimated from eight houses in four hamlets in Yangxi and Yangdong county. b Doses were estimated from 59 houses in the four hamlets above. The average radon and thoron concentrations were used during the period between July 2013 and January 2014.
(b) Biological dosimetry
152. Cytogenetic studies were performed as a validation of the physical dose assessment. In 1990, Wang et al. reported the results obtained from their thyroid study in Yangjiang [W5]. This study, conducted in collaboration between Chinese and United States researchers, examined chromosomes in lymphocytes obtained from residents, and revealed elevated frequencies of chromosomal aberrations in the HNBR area of Yangjiang. The frequency of stable chromosomal aberrations was 0.29±0.06 (mean and standard error per 100 metaphases) in the HNBR area and 0.18±0.04 in the control area. The difference was not significant (P=0.14). In contrast, the frequencies of unstable chromosomal aberrations were 0.16±0.04 and 0.06±0.02 in HNBR and control areas, respectively, indicating a significant difference (P=0.04).
153. Jiang et al. reported a dose-effect relationship of unstable chromosomal aberrations. Peripheral lymphocytes were taken from 22 inhabitants of different ages in the HNBR area and 17 inhabitants in the control area of the study [J7]. Cumulative dose from birth to the time of blood sampling ranged from 30.9–358.9 mGy and 6.0–59.2 mGy for HNBR and control areas, respectively. The variation of cumulative doses in controls was caused mainly by age because cumulative dose is a function of age. About 2,600 cells per subject on average were analysed. The average frequencies of dicentrics and centric rings were 2.4±0.32 per 1,000 cells for the HNBR-area residents and 1.4±0.23 per 1,000 for the control-area residents. The slope for age, reflecting also increasing cumulative dose, was steeper for the subjects from the HNBR area and there was also a significant effect of dose, but only when age was ignored.
154. When the frequency of dicentrics and rings per 1,000 cells was plotted against the age of each individual, the increase with age in the control group was not significant, but the slope was similar to the reported Japanese atomic bombing survivor data [T16]. In contrast, the increase with age in the HNBR-area was significant, and the slope was about three times steeper than that of the control group.
155. Concerning stable chromosomal aberrations, Zhang et al. analysed translocation frequencies in six children and 28 elderly persons in HNBR areas and in eight children and 24 elderly persons in control areas [Z5, Z6]. About 4,800 cells per subject were analysed on average. Except for two outliers in the elderly group due to medical radiological exposure by fluoroscopy for one and an unknown reason for the other, the mean frequencies in children were 3.8±1.1 per 1,000 cells in the HNBR area
114 UNSCEAR 2017 REPORT
and 3.2±2.0 in the control area. In elderly persons, the values were 11.3±3.6 in the HNBR area and 10.0±3.8 in the control area. Whether the two outliers were excluded or not, no significant difference was found between HNBR and control areas.
4. Cancer mortality
156. The Yangjiang study examined cancer mortality only, and not cancer incidence. However, most cancers other than that of the thyroid and skin were fatal for local farmers, who could not afford expensive cancer treatment. In the most recent study, a cohort of 31,604 men and women aged 30–74 years living in the study area in Guangdong Province, China, was followed during the period 1979–1998 [T3]. The follow-up study accumulated 736,942 person-years at risk, and ascertained 6,005 deaths, including 956 cancer deaths (of which 15 were from leukaemia) and 4,525 non-cancer disease deaths. The number of cancer deaths did not increase in the latest update because the oldest age group (>75 years) was excluded, unlike in the earlier report [S28]. The mean cumulative radiation doses from background radiation in residents were 84.8 mGy in the HNBR and 21.6 mGy in the control areas [T3]. The data for those with attained ages below 30 years were excluded, as in the Indian HNBR study [N4].
157. Statistical analysis was based on the data in cross-tabulation by sex, attained age (five-year category) and follow-up interval. The entry into the cohort was 1 January 1979. The follow-up ended on the date of death or the date of attaining the age of 75 if either occurred before the end of follow-up. Cumulative external radiation dose, lagged by two years for leukaemia and ten years for all other cancers, was estimated for each individual on the basis of hamlet-specific indoor and outdoor air kerma rates, and sex- and age-specific house occupancy factors.
158. The ERR for all cancers, excluding leukaemia, was estimated to be −0.101 per 100 mGy (95% CI: −0.253, 0.095), consistent with, though lower than the estimate of −0.011 per 100 mGy (95% CI: −0.067, 0.069) reported in an earlier study [S28]. This study did not, however, exclude residents with attained ages below 30, and internal doses of 4.273 mSv a−1 and 1.651 mSv a−1 were added to annual doses of HNBR- and control-area residents, respectively.
159. Guangdong Province, including the Yangjiang area, is well known for a high frequency of liver cancer, which is due to a high prevalence of hepatitis B virus (HBV) infection in this area [L10]. The prevalence of the HBV antigen, a marker of HBV carrier state, was 17% in the HNBR area (Tongkou) and 14% in the control area (Enping in Taisha County) [L5]. In site-specific analysis, liver-cancer mortality was related inversely to the cumulative dose (ERR −0.338 per 100 mGy; 95% CI: −0.516, −0.061). However, accurate diagnosis of liver cancer is difficult as the distinction between liver cancer and liver cirrhosis, or primary liver cancer and metastasis from another cancer site can be challenging. Therefore, an analysis was conducted combining liver cancer and other liver diseases. No association with dose was observed and the ERR estimate was 0.025 per 100 mGy (95% CI: −0.203, 0.350) for liver cancer and other liver diseases combined. The ERR for all cancers, excluding leukaemia and liver cancer, was 0.019 per 100 mGy (95% CI: −0.187, 0.304). Non-cancer disease mortality was not related to cumulative radiation dose. The main characteristics and features of the Yangjiang cohort study are summarized in table 18.
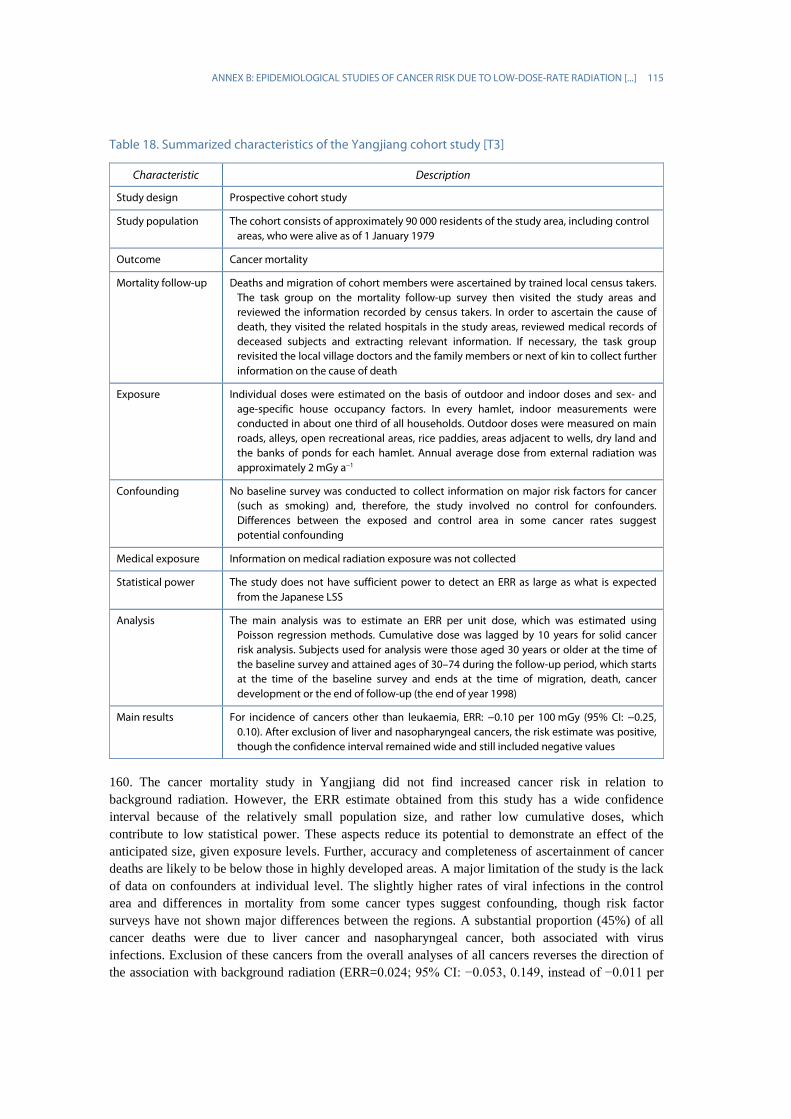
ANNEX B: EPIDEMIOLOGICAL STUDIES OF CANCER RISK DUE TO LOW-DOSE-RATE RADIATION [...] 115
Table 18. Summarized characteristics of the Yangjiang cohort study [T3]
Characteristic Description
Study design Prospective cohort study
Study population The cohort consists of approximately 90 000 residents of the study area, including control areas, who were alive as of 1 January 1979
Outcome Cancer mortality
Mortality follow-up Deaths and migration of cohort members were ascertained by trained local census takers. The task group on the mortality follow-up survey then visited the study areas and reviewed the information recorded by census takers. In order to ascertain the cause of death, they visited the related hospitals in the study areas, reviewed medical records of deceased subjects and extracting relevant information. If necessary, the task group revisited the local village doctors and the family members or next of kin to collect further information on the cause of death
Exposure Individual doses were estimated on the basis of outdoor and indoor doses and sex- and age-specific house occupancy factors. In every hamlet, indoor measurements were conducted in about one third of all households. Outdoor doses were measured on main roads, alleys, open recreational areas, rice paddies, areas adjacent to wells, dry land and the banks of ponds for each hamlet. Annual average dose from external radiation was approximately 2 mGy a−1
Confounding No baseline survey was conducted to collect information on major risk factors for cancer (such as smoking) and, therefore, the study involved no control for confounders. Differences between the exposed and control area in some cancer rates suggest potential confounding
Medical exposure Information on medical radiation exposure was not collected
Statistical power The study does not have sufficient power to detect an ERR as large as what is expected from the Japanese LSS
Analysis The main analysis was to estimate an ERR per unit dose, which was estimated using Poisson regression methods. Cumulative dose was lagged by 10 years for solid cancer risk analysis. Subjects used for analysis were those aged 30 years or older at the time of the baseline survey and attained ages of 30–74 during the follow-up period, which starts at the time of the baseline survey and ends at the time of migration, death, cancer development or the end of follow-up (the end of year 1998)
Main results For incidence of cancers other than leukaemia, ERR: −0.10 per 100 mGy (95% CI: −0.25, 0.10). After exclusion of liver and nasopharyngeal cancers, the risk estimate was positive, though the confidence interval remained wide and still included negative values
160. The cancer mortality study in Yangjiang did not find increased cancer risk in relation to background radiation. However, the ERR estimate obtained from this study has a wide confidence interval because of the relatively small population size, and rather low cumulative doses, which contribute to low statistical power. These aspects reduce its potential to demonstrate an effect of the anticipated size, given exposure levels. Further, accuracy and completeness of ascertainment of cancer deaths are likely to be below those in highly developed areas. A major limitation of the study is the lack of data on confounders at individual level. The slightly higher rates of viral infections in the control area and differences in mortality from some cancer types suggest confounding, though risk factor surveys have not shown major differences between the regions. A substantial proportion (45%) of all cancer deaths were due to liver cancer and nasopharyngeal cancer, both associated with virus infections. Exclusion of these cancers from the overall analyses of all cancers reverses the direction of the association with background radiation (ERR=0.024; 95% CI: −0.053, 0.149, instead of −0.011 per

116 UNSCEAR 2017 REPORT
100 mSv; 95% CI: −0.067, 0.069) [S28]. Similarly, in the updated analysis, the ERR for solid cancer was positive after exclusion of liver cancer (ERR=0.19; 95% CI: −1.87, 3.04) [T3].
161. Advantages of the study include the minimal effect of migration from these areas during the period and also the reasonably good estimates of radiation dose, based on extensive outdoor dose measurements in each village and indoor dosimetry at selected houses (one third of houses in a village) supplemented by personal monitors, but the levels are too low to be able to discern possible radiation effects. There was also meaningful exposure to indoor radon and thoron in HNBR areas. Cytogenetic studies of blood lymphocytes have indicated higher levels of chromosomal aberrations in persons living in HNBR areas, confirming the difference in population exposure observed in physical dosimetry. The doses in the China HNBR areas (annual effective dose from external exposure 2.1 mSv a−1 and from internal exposure 4.3 mSv a−1) [Y1], however, appear too small and the dose distribution too narrow to provide convincing evidence of the presence or absence of radiation effects. At such low doses, even 80,000 subjects can be considered insufficient to detect an excess risk, given that one existed, i.e. the study has low statistical power.
162. In summary, while the strengths of this study include the relatively large population, the careful environmental dosimetry programme and low migration, there are limitations. The weaknesses include the uncertainties in dose estimates actually received by individuals, the low and narrow range of cumulative doses, and the possibility that key demographic and lifestyle factors might differ between the high background and control populations. Better access to medical care could mean more accurate and more frequent diagnosis of cancer and less misattribution of causes of death. Inaccuracies in assigning causes of death would be likely to dilute any differences, assuming that the quality of death certificates is similar for the exposed and control populations, while a difference in the quality between the areas could bias the results in either direction.
C. Other studies
1. Guarapari, Brazil
163. Environmental radiation and residents: Guarapari, the coastal region of Espirito Santo State, is known for HNBR derived from monazite sands along the Atlantic coast [P7]. The principal radionuclides in monazite are from the 232Th series, but some uranium is also present. High levels of external radiation on beach sand and in some major streets of Guarapari were reported in the past [C6]. However, recent assessments found that radiation levels in Guarapari were near the average global level, except at hot spots on the beaches and in the fishing village of Meaipe [S1]. The decrease of radiation levels is due to urbanization, including the paving of streets and the construction of tall buildings in this area over the years, in addition to the removal of monazite-containing black sand from the beaches. Analysis of chromosomal aberrations was conducted using 13,242 lymphocytes from 202 persons in Guarapari and 9,001 lymphocytes from 147 persons in control areas. However, the culture period of lymphocytes in this study was too long (72 hours) for analysing aberrations specific to radiation [B6].
164. Other major HNBR areas in Brazil are Poços de Caldas and Araxá in the State of Minas Gerais. The HNBR area in Poços de Caldas is characterized by a huge alkaline intrusion of uranium and thorium anomalies [B2, P7]. Araxá in State of Minas Gerais is known for its spa area, where several
ANNEX B: EPIDEMIOLOGICAL STUDIES OF CANCER RISK DUE TO LOW-DOSE-RATE RADIATION [...] 117
minerals rich in uranium and thorium are found [C1]. Six thousand people reside in the rural HNBR area in Poços de Caldas (population 120,000). The population size of Araxá is approximately 80,000.
165. The average annual effective dose in the rural residents in Poços de Caldas was estimated to be 13 mSv a−1, with the range of 6–16 mSv a−1 [A14]. In the dose assessments conducted by Veiga et al. in the 2000s, the indoor air kerma rate was 0.2 mSv a−1 (geometric SD=1.3) in the rural area. The average indoor radon concentration in 41 houses was 220 (geometric SD=2.9) of Bq m−3 [V2]. A survey of patients in the Araxá spa estimated the mean annual effective dose due to natural sources. It was reported to be 2.4 mSv a−1.
166. An ecological (geographical correlation) study was conducted of Guarapari and Araxá that showed no excess of cancer mortality compared with national rates [V3]. In contrast, increased mortality from cancer overall, from stomach, lung and breast cancer, and leukaemia was reported for Poço de Caldas. No cancer risk estimates per unit dose could be provided. Interpretation of this ecological study is limited by the lack of individual doses, the problem of migration not being addressed, and the inability to control for potential confounding factors. The SMR analysis does not allow inference on radiation-related cancer risk.
2. Ramsar, Islamic Republic of Iran
167. Ramsar is located 160 km northwest of Tehran on the coast of the Caspian Sea. It contains some HNBR areas of a few square kilometres, caused by 226Ra deposited from water flowing from hot springs. In addition, travertine with elevated levels of thorium was used as a building material inside the walls of some houses. Exceptionally high environmental dose rates are found in buildings with building material rich in travertine and in areas in close proximity to the hot springs [S21].
168. Dosimetry studies indicated that environmental measurements of ambient dose rate levels of gamma radiation, coupled with house occupancy factors gained by interview, would be inadequate to provide accurate estimates of dose for individuals unless they were supplemented with personal dosimetry measurements. The variation of doses in the homes and in the areas near the hot springs seemed too great for accurate estimation of individual doses. However, the size of the exposed population, only about a few thousand in the highest dose rate areas, is manageable and estimates of individual cumulative doses could be made using focused studies, such as screening for thyroid and possible cataract disorders.
169. A study examined chromosomal aberrations, using lymphocytes collected from 50 long-term inhabitants of Ramsar (with annual effective doses between 1.6 and 42 mSv) [G1]. The frequencies of both unstable and stable chromosomal aberrations in lymphocytes were compared with those in 30 age-matched inhabitants of a nearby control area where the mean annual effective dose was 2.3±0.1 mSv. Significantly increased frequencies of both aberration types were observed in the lymphocytes of Ramsar inhabitants as compared with the control area (mean frequencies for stable aberrations 6.0%±2.1 vs 1.5%±0.95 and unstable 4.6%±2.0 vs 1.6%±1.2). In order to further investigate the biological effects of exposure to low-dose radiation and to assess the dose-effect relationship in HNBR-area residents in Ramsar, unstable aberrations were examined, using lymphocytes collected from 15 healthy elderly women in Talesh mahalle, an HNBR area of Ramsar, and in 10 elderly women living in a nearby control area with normal background radiation [Z1]. In total, 77,714 cells were analysed with 48,819 cells from HNBR-area residents and 28,895 cells from control subjects. On average, 3,108 cells per subject were analysed (range 1,475–5,007 cells). Significant differences were found in the frequency per 100 cells of dicentric plus centric rings (0.207±0.103 vs 0.047±0.027; P<0.0005), total
118 UNSCEAR 2017 REPORT
chromosome-type aberrations (0.86±0.44 vs 0.23±0.17; P<0.0005), and chromatid-type aberrations (3.31±2.01 vs 1.66±0.63; P=0.01) between HNBR- and control-area residents. No positive correlation was found between the frequency of dicentric plus centric ring aberrations and the cumulative dose of the inhabitants estimated by direct individual dosimetry.
170. An analysis of population-level cancer mortality rates showed no increase in about 3,000 people in the highest dose areas [M7]. Similar to studies in Brazil, this analysis cannot provide a quantitative estimate of radiation-related cancer risk, as such ecological studies cannot take possible confounding factors into account, including smoking, alcohol, dietary habits and exposure to various chemicals. The statistical power is also low due to the small sample size. Similar ecological studies have also been carried out in areas with lower background radiation level, but they are not covered here as they do not fulfil the inclusion criteria [A13, F1, K7].
IV. STUDIES ON BACKGROUND RADIATION AND CHILDHOOD LEUKAEMIA
A. Studies on natural background radiation
171. The association between environmental exposure to natural background radiation and leukaemia risk in children and young adults has not been addressed in HNBR studies in the past, mainly due to the small number of cases. However, recently, several studies have evaluated this association. In this chapter, the large-scale studies are reviewed.
1. Studies in the United Kingdom
172. The United Kingdom Childhood Cancer Study (UKCCS) was a prospective, interview-based case-control study conducted to examine associations between childhood cancer risk and natural gamma-radiation exposure and other potential aetiological factors [U1]. Eligible children were those born in Great Britain (England, Scotland and Wales) who were not in local authority care. Subjects were ineligible if they themselves or their parents had lived outside Great Britain for the three months leading up to diagnosis. In England and Wales, the UKCCS population was defined as children (0–14 years) registered with one of the 98 family health services authorities (FHSAs). Note that, under the National Health Service, all general practitioners (GPs) and their patients are registered with their local FHSA. This comprises around 98% of the total population. In Scotland, where the system is similar but independent, the study population was defined as children registered with one of the 15 Health Boards (HBs) and has been described separately.
173. Case accrual was conducted during 1991–1994 in Scotland and 1992–1996 in England and Wales. The majority of cases were notified by paediatric oncologists belonging to the study group in regional treatment centres. Crosschecks were made against regional cancer registries and against the National Registry of Childhood Tumours. For leukaemia, the principal diagnostic sources were the Medical Research Council’s treatment trials. Individual haematologists in participating centres diagnosed acute lymphocytic leukaemia (ALL) and acute myeloid leukaemia (AML) based on morphological, standard

ANNEX B: EPIDEMIOLOGICAL STUDIES OF CANCER RISK DUE TO LOW-DOSE-RATE RADIATION [...] 119
staining and immunophenotyping. Central review was performed by a panel of three haematologists as part of the Medical Research Council’s trial protocol. This panel ascribed individual patients to an appropriate French–American–British morphological classification type. To obtain reliable information about the diagnosis of cancers other than leukaemia, a histopathology review database was specially created for the purposes of the study.
174. Two age and sex matched controls were randomly selected from the same (former) FHSA/HB as the case child [U1]. The parents of 3,838 children with cancer (1,736 with leukaemia) and 7,629 children without cancer were interviewed, representing 87% of eligible cases and 64% of eligible controls. The UKCCS investigators found that there was a social class bias in those cases and controls who agreed to participate with more participants in higher socioeconomic groups [U1].
175. At interview, a full residential history for the child was collected with all dwellings inhabited for six months or more targeted for measurement. Indoor gamma-ray levels were measured for six months, using two TLDs, one placed in the main bedroom and one in the main living area. Investigators tried to obtain a complete set of measurements but this proved difficult and, in the final analysis, only the address at diagnosis was used. Measurements were obtained from the home at diagnosis of 2,165 cases (56% of the families interviewed) and 5,086 controls (67% of the families interviewed). Nearly all (97%) estimates were based on readings obtained from both the bedroom and the living room.
176. For the risk analysis, odds ratios (OR) were calculated, using conditional logistic regression modelling. The data were checked for confounding by SES and adjusted using a deprivation score. No evidence was found to support an association between higher background gamma radiation levels and risk of childhood ALL (OR=0.95; 95% CI: 0.66, 1.37 for the highest exposure category with >1 mGy a−1) or other leukaemias (OR=0.68; 95% CI: 0.26, 1.82 for the highest exposure category), and no significant trends emerged across exposure categories. The investigators concluded that “it is unlikely that a relative risk of this magnitude predicted by modelling would be detectable in the present study after its statistical power, modest variations in dose rate and limitations of data collection are taken into account”.
177. The low participation rate of controls (64%) is a concern as are the low proportions of residencies measured (49% of the originally eligible case and 43% of the originally eligible controls). Participation rates were affected by the deprivation score, a SES indicator, which was related to environmental dose. Medical exposure was not considered, nor birth weight or parental age as potential confounders. Exposure from radiation treatment is unlikely since children with prior malignancies were not eligible. Although this study found no association with measured values of gamma-ray exposure in homes, it does not have sufficient power to detect an ERR as large as what is expected from the LSS and the potential for serious participation bias must be considered.
178. A historical, record-based case-control study of childhood cancer examined associations with natural background radiation in Great Britain [K3]. The principal end point of interest in this study was leukaemia, but all types of cancer were included in the cases. This study examined a large number of cases (27,447, including 9,058 with leukaemia), comprising children born and living in Great Britain who were diagnosed before their 15th birthday, during the period 1980–2006. Lymphoid leukaemia accounted for more than 80% of all leukaemia cases. Those cases in children aged less than 15 years were ascertained through the National Registry of Childhood Tumours, which is an essentially complete population-based registry of cancer diagnosed in Great Britain from 1962 onwards. A control was selected for each case from the same birth register, matching on sex and date of birth (within six months). For cases diagnosed in 2000 and later years, a second control was selected in a similar way. Controls, which numbered 11,912 for leukaemia, were cancer-free at the time of diagnosis of their matched cases. There were no differences in SES between cases and controls.

120 UNSCEAR 2017 REPORT
179. Cumulative doses from gamma-ray exposure were calculated, using mean gamma-ray dose rates for county districts where the mothers of cases or controls lived at the time of the child’s birth (generally defined to a few metres). Mean dose rates in county districts were obtained from the National Survey of natural background radiation based on 2,283 measurements of gamma radiation in houses [W10]. There are 459 county districts (or equivalent) in Great Britain with a mean surface area of 500 km2 and the child population ranging from 300 to 213,000 (mean 24,000). About half the cases in the study had moved between birth and diagnosis. In an additional analysis, the effects of mobility on the association between leukaemia risk estimate and natural radiation dose were assessed as likely to be small [K4, K5]. Indoor radon levels were also estimated, using predictive maps based on domestic measurements grouped by geological boundaries, and cumulative radon exposure and RBM doses were calculated. The median gamma dose was 3 mGy among both cases and controls (interquartile range from 1 mGy to 5–6 mGy). ERRs per unit dose were estimated from ORs calculated using logistic models. SES was taken into account either through area-based deprivation measures or paternal occupation from the birth certificate. ERRs for all leukaemia and all cancers excluding leukaemia were 9 per 100 mGy (95% CI: 2, 17) and 2 per 100 mGy (95% CI: −2, 6), respectively. For bone marrow dose from gamma rays, the ERRs for all leukaemia, lymphoid leukaemia and acute myeloid leukaemia were 12 per 100 mGy (95% CI: 3, 22) and 13 per 100 mGy (95% CI: 2, 24) and 5 per 100 mGy (95% CI: −13, 28), respectively.
180. The information for this study was obtained by record linkage, so no interviews were used. The drawback was that neither individual residential histories nor direct radiation measurements of the homes of study subjects could be obtained. The leukaemia cases were identified through the National Registry of Childhood Tumours. The accuracy of leukaemia diagnosis can be considered high. Exposure estimates were based on mean dose rates in county districts, which are relatively large geographical units, of the residence at time of the birth. Interview of study subjects was not sought. The strength of this study is the large number of cases and controls, accurate and virtually complete case ascertainment, and also lack of participation bias. Of concern are uncertainties regarding dose estimates, which were area-based average dose rates at birth place obtained for large area units from a relatively small number of measurements, and lack of full residential history. This ignores house-to-house variability within a geographical unit, reducing the precision of exposure assessment, presumably in direct relation to the size of the unit used in the analysis. A previous report [L6] indicated that the sample of this study should provide reasonable power to detect the risk from natural background gamma radiation predicted by standard risk models. Hence, the study appears to have sufficient power to detect an ERR as large as that expected from the Japanese LSS. Although information on medical exposure is lacking, during the study period (1980–2006) medical exposure is unlikely to have been large enough to materially affect the results of risk analysis unless strongly correlated with natural background radiation. Departure from linearity was not formally examined.
2. The Swiss study
181. In a nationwide, record-based study of a cohort of children identified by the Swiss National Census in 1990 and in 2000, the relationship between the incidence of childhood cancer and background radiation exposure was examined [S25]. Study subjects were residents aged younger than 16 in Switzerland. Follow-up began at the first census in which a child was recorded (entry time) and ended on the earliest of following events: diagnosis, death, emigration, the child’s 16th birthday and administrative censoring on the 31st December 2008. Cases diagnosed during the period 1990–2008 were ascertained by the record linkage through the Swiss Childhood Cancer Registry. From 2,093,660 children included at the census, 530 incident cases of leukaemia were identified.

ANNEX B: EPIDEMIOLOGICAL STUDIES OF CANCER RISK DUE TO LOW-DOSE-RATE RADIATION [...] 121
182. In Switzerland, the central alpine massif has relatively high natural background radiation levels due to the relatively high radioactivity of crystalline rocks when compared to the sedimentary northern alpine foreland (Jura, Molasse Basin) [R8, R9]. Exposure was based on residential location at census. External background radiation levels in children’s homes were estimated from a database of outdoor gamma radiation measurements, using a model which predicted dose rates for each cell of a 2 km × 2 km grid as the sum of cosmic radiation, natural terrestrial gamma radiation, and radiation from human-made sources [R8, R9]. For a child who was found to have lived at different locations in the 1990 and 2000 censuses, the 1990 exposure was updated in 1995 or 2000 depending on whether or not the child lived at the new location five years before the census in 2000 taking the information from census questionnaires. On average, the effective cumulative dose was approximately 9 mSv. Natural terrestrial radiation contributed most with 54 nSv h−1, cosmic radiation 45 nSv h−1 and anthropogenic terrestrial radiation with only 8 nSv h−1.
183. Several factors were considered as potential confounders, including traffic-related air pollution (distance to nearest highway as a proxy), electromagnetic fields from radio and TV transmitters, and from high voltage power lines (distance to nearest 380 kV or 220 kV power line), degree of urbanization of municipality (urban, suburban, rural), SES based on the Swiss neighbourhood index of socioeconomic position (Swiss-SEP), education of the household reference person (compulsory, secondary, tertiary, from the national census) and crowding (the number of persons per room), birth weight and birth order of the child. Information on education and crowding was obtained from national census data. Birth weight and birth order of the child, which were obtained from the birth registry, were available for approximately 60% the study subjects. The Swiss-SEP is an area-based measure of socioeconomic position [P1]. This index is defined for neighbourhoods of 50 households with overlapping boundaries using Census 2000 and road network data, and is based on median rent per square metre, proportion of households headed by a person with primary education or less, proportion headed by a person in manual or unskilled occupation and the mean number of persons per room were analysed in principle component analysis.
184. Cox regression models were used to assess associations of cancer risk with dose rates and cumulative dose since birth. The hazard ratio for the cumulative dose of external radiation was 1.04 per mSv (95% CI: 1.00, 1.08) for leukaemia, corresponding approximately to an ERR per 100 mSv of 4 (95% CI: 0, 8). In this study, the excess leukaemia risk was virtually restricted to children exposed to >200 nGy h−1. Adjustment for a range of potential confounders had little effect on the results.
185. Interview of study subjects was not sought. Information necessary for follow-up and exposure assessment, and on SES was obtained by record linkage. Area-based measures of exposure were used instead of individual estimates and they were estimated for the dwelling of the child at the census. Migration was at least partially taken into account and an analysis restricted to children with stable residence gave higher hazard ratios. Internal exposure was not considered in this analysis (though evaluated in a parallel publication). Besides leukaemia, a similar positive relationship was also found for several other tumour types and it was close to significance for CNS tumours and other CNS and lympho-haematological malignant tumours, unlike in the UKCCS [K3]. The increased risks were largely due to a high risk in the highest exposure category, with little indication of excess in the intermediate exposure groups. The strengths of this study include virtually complete case ascertainment, lack of participation bias and the availability of information on several potential confounders. However, the number of leukaemia cases was relatively small, given the anticipated effect size (and smaller than in some other studies). Of concern are uncertainties regarding area-based dose estimates related to a single welling. Information on medical radiation exposure was not collected. The statistical power was not sufficient for detecting an effect of similar size to the LSS.

122 UNSCEAR 2017 REPORT
3. The Finnish study
186. A nationwide register-based case-control study was conducted to examine childhood leukaemia risk associated with background radiation [N10]. Subjects were children aged 2–15 years in Finland (the entire nation). Cases (N=1,093) were identified through the Finnish Cancer Registry (known for its high quality). Three controls were selected for each case matching on sex and year of birth from the database at the Population Register Centre (N=3,279).
187. Complete residential histories and previously collected survey data of the background gamma radiation in Finland were used to assess the exposure of the study subjects to indoor and outdoor gamma radiation. Outdoor dose was from the data encoded in a map of 8 km × 8 km grids based on a nationwide mobile survey carried out in 1978–1980 obtained from Radiation and Nuclear Safety Authority [A16]. The nationwide average dose rate outdoors was 51 nSv h−1. For the residencies abroad (N=63, 0.8% of all residencies), the world’s average natural background radiation value reported by UNSCEAR (55.3 nSv h−1 effective dose rate) was used [U10]. The indoor doses of gamma radiation were based on measurements in 346 randomly chosen dwellings. The national average dose rate in houses was 41 nSv h−1 and in flats/apartments 70 nSv h−1 [A16]. The difference is due mainly to the concrete used as the building material in blocks of flats. The indoor rates were correlated with local outdoor gamma-radiation levels. These correlations were used for converting local outdoor dose rates to indoor dose rates. The percentage of time spent indoors (indoor occupancy) was modelled according to a Finnish study providing age group specific estimates [M1].
188. The mean annual effective dose from medical radiation in Finland is 0.45 mSv in 2012, but for children it is markedly lower due to strict imaging guidelines especially with CT scans, which constitute the largest contribution to the annual dose from medical exposure [M8, U10]. Furthermore, CT use in Finland is less frequent than in many other industrialized countries and only 1.7% of CT scans in Finland were performed on children [H3]. Since average population doses from medical procedures are relatively small compared to annual doses from background radiation (0.59 mSv to RBM) in this study and no correlation with background radiation was anticipated, medical radiation exposure was judged unlikely to cause confounding.
189. Data on diagnosis of Down’s syndrome were obtained from the Register of Congenital Malformations by the National Institute of Health and Welfare. Data on gestational weeks and birth weights were obtained from the Medical Birth Register for all but 184 (18.6%) cases and 511 (15.6%) controls. Maternal smoking data were obtained from the Medical Birth Register and data were missing for 200 cases (18.3%) and 563 controls (17.2%).
190. Conditional logistic regression analyses were adjusted for Down’s syndrome, birth weight (large for gestational age) and maternal smoking. Investigators stated that this study has sufficient power (≥80%) to detect a linear dose response with OR of 1.06 or greater per 10 nSv h−1 increase in dose rate. This study reported ORs per unit dose rate and ORs per unit cumulative dose. Investigators did not clearly state which leukaemia subtype was the main target of the risk estimate. Regarding dose rate, the overall OR for leukaemia was 1.01 (95% CI: 0.97, 1.05) for each 10 nSv h−1 increase in the equivalent dose rate to RBM. Regarding cumulative dose, the OR was 0.97 (95% CI: 0.89, 1.06) for a 1 mSv increase in cumulative equivalent dose to RBM. In subtype-specific analysis, only the relationship between ALL and dose rate gave an OR larger than 1, which was 1.02 (95% CI: 0.98, 1.07). Cumulative dose was not positively associated with any of the leukaemia subtypes. In age-specific analysis, ORs per 10 nSv h−1 were 1.05 (95% CI: 1.00, 1.10) for ages 2–6 years and 0.93 (95% CI: 0.86, 1.00) for ages 7–15. For cumulative dose, the ORs were 1.27 (95% CI: 1.01, 1.60) and 0.93 (95% CI: 0.85, 1.02) per 1 mSv, respectively. The OR for the younger age group approximately corresponds to ERR per 100 mSv of 27 (95% CI: 1, 60). The increased risk is significant for ages 2–6 years, however,
ANNEX B: EPIDEMIOLOGICAL STUDIES OF CANCER RISK DUE TO LOW-DOSE-RATE RADIATION [...] 123
it may still be a chance finding, given the wide confidence interval. The statistical power presented in the study was low for the effect sizes predicted from LSS.
191. In this study, cases were ascertained through the Finnish Cancer registry, which covers the entire nation, and is known to be of high quality [D1, T8]. Investigators estimated lifetime cumulative doses and average dose rates to RBM from background gamma radiation using information on indoor and outdoor survey data and housing types during the lifespan of the children. One of the advantages of this study in dose estimation is the fact that the residential history of every study subject was collected. A disadvantage was the lack of residential dose rate measurements. Information on medical exposure is also lacking but, as the investigators concluded, medical exposure is unlikely to distort the risk estimate substantially in a country where CT use has been strictly controlled. Information on SES was not obtained (and therefore not adjusted for) in this study.
4. The French study
192. A study combining small-area-based incidence analysis and a case-control study investigated the association between acute leukaemia and location-based estimated exposure to natural background radiation in France [D18]. The incidence study identified 9,056 acute leukaemia cases during the period 1990–2009 through the French National Registry of Childhood Cancer. Complementary analyses used the data obtained from the so-called “GEOlocalisation des CAncers Pédiatriques (GEOCAP) study, which examined 2,763 acute leukaemia cases diagnosed during the subperiod 2002–2007, and 30,000 control children with geocoded addresses randomly sampled by the French National Institute for Statistics and Economic Studies, using the income and council tax databases for households.
193. Since residential history was not available in this study, cumulative exposure to radon or gamma radiation were calculated on the basis of residence at diagnosis or inclusion and the assumption that the same exposure had prevailed since birth. According to an interview-based study [R7], 66% of the children had been living in the same municipality since birth. The correlations between exposure estimates at birth and at diagnosis/inclusion were 0.86 for radon exposure and 0.89 for gamma-radiation exposure.
194. Dose from environmental radiation exposure was estimated on the basis of the 36,326 municipalities in France and geocoded addresses of the residences, which were available at the time of diagnosis (cases, 1990–2009) or inclusion (controls, 2002–2007). Natural background exposure was determined at the town centre for radon, and as the mean exposure over the municipality territory for gamma radiation, in the incidence study, and at the residence address and the town centre, respectively, in the case-control study. The radon domestic exposure was estimated from two datasets: (a) 10,843 measurement results of indoor radon concentration performed by the Institute for Radiological Protection and Nuclear Safety and Health Ministry during a national campaign (1982–2003), and (b) the French map of the geogenic radon potential. A mathematical model using both datasets was developed, enabling estimates of the indoor radon concentration measured in a 1 km × 1 km grid. Exposure to natural background gamma radiation was calculated as the sum of exposures to cosmic gamma radiation and terrestrial gamma radiation. The determination was based on 97,595 measurement results of indoor gamma dose rate conducted by the Institute for Radiological Protection and Nuclear Safety in 17,404 dental surgeries and veterinary clinics throughout France, using radio photo-luminescent dosimeters, exposed for several months in 2011–2012. To estimate the indoor telluric gamma dose rate, multicollocated co-kriging was conducted on 1 km × 1 km grid in a geostatistical model that used two datasets: the indoor terrestrial gamma radiation dose-rate measurement results and the French map of geogenic uranium potential. For the 30,000 GEOCAP controls, the arithmetic mean radon exposure estimated at the place of residence was 67.8 Bq m−3 (SD=45.5), the 5th percentile was

124 UNSCEAR 2017 REPORT
24.9 Bq m−3 and the 95th percentile was 145.3 Bq m−3. The arithmetic mean gamma radiation exposure was 98.2 nSv h−1 (SD=24.9), the 5th percentile was 70.1 nSv h−1 and the 95th percentile was 148.5 nSv h−1.
195. The potential for confounding by SES was taken into account by stratification on the quintiles of the first component in a principal component analysis of four census variables: median income and percentages of baccalaureate holders, labourers and unemployed. This was based on the 1999 census and was strongly correlated with the indicators based on the 1990 and 2006 censuses. In addition, the GEOCAP case-control study was used to evaluate potential confounding by environmental factors available at the address of residence by exclusion (vicinity of nuclear power plants or proximity to high-voltage power lines) or by adjustment (proximity of high-traffic roads). There was no confounding effect of census-based socio-demographic indicators, or environmental factors (road traffic, high voltage power lines, vicinity of nuclear plants) related to acute leukaemia in the GEOCAP study.
196. The power to detect an association between acute leukaemia and dose to RBM in the incidence analysis based on the UNSCEAR 2006 Report [U8] exponential multiplicative model assuming ERR 20 per Gy was 92% for exposure to natural gamma radiation (using simulation with the observed exposure distribution). A standardized incidence ratio (SIR) was calculated as a ratio between the observed and expected numbers of cases by exposure category; the expected number of cases was calculated on the basis of the age-specific incidence rate and number of person-years in that stratum. The power calculation did not consider any attenuation due to exposure misclassification from use of aggregate data instead of individual measurements.
197. Acute leukaemia, irrespective of subtype and age group, was not significantly associated with the municipality-specific gamma radiation exposure level in terms of annual dose at age reached and the cumulative exposure to RBM dose. In the incidence analysis, acute leukaemia risk showed a small increase with gamma dose rate (SIR=1.01 per nSv h−1; 95% CI: 1.00, 1.02), but no association with cumulative gamma dose (SIR=1.00 per mSv; 95% CI: 0.99, 1.01). The results were not changed by incorporating a time lag of 24 months in the analysis. In the case-control analysis, no association with background gamma radiation dose rate was found (OR=1.00 per 10 nSv h−1; 95% CI: 0.98, 1.01).
198. This is a large record-based study using a reliable source of childhood acute leukaemia cases, and the power to detect the predicted effect is high. The number of indoor dose-rate measurements is also large although the exposure range appears quite narrow for evaluating the association between childhood leukaemia risk and background radiation as the third quartile of the cumulative dose was only 50% higher than the first quartile. Municipality-level estimates of radiation exposure and lack of full residential history (a third of the subjects had moved at least once) were other potential weaknesses.
B. Studies of environmental exposure from human-made sources
1. The case-control study in Belarus, the Russian Federation and Ukraine
199. A population-based case–control study of acute leukaemia was conducted in the areas of the former Soviet Union that were contaminated by radioactivity from the Chernobyl accident [I8]. Eligible subjects (cases and controls) were children who were in utero or <6 years of age at the time of the Chernobyl accident and were in contaminated regions of Belarus, the Russian Federation and Ukraine, which were the Gomel’skaya and Mogilevskaya Oblasts in Belarus, the Bryanskaya Oblast in the
ANNEX B: EPIDEMIOLOGICAL STUDIES OF CANCER RISK DUE TO LOW-DOSE-RATE RADIATION [...] 125
Russian Federation (the most contaminated oblast), and the Rovenskaya, Zhytomirskaya, Chernigovskaya, and Cherkasskaya Oblasts in Ukraine (Chernigovskaya and Cherkasskaya Oblasts were on average significantly less contaminated than the Rovenskaya and Zhytomirskaya Oblasts).
200. Eligible for the study were acute leukaemia cases diagnosed in these geographic regions during 26 April 1986 and 31 December 2000. They were identified from records of the Pediatric Oncology Centre in Belarus, the national Belarus Tumour Registry and the Bryansk Oncology Registry in the Russian Federation. In Ukraine, case ascertainment was based on the archival records of regional cancer hospitals. A group of haematological morphologists and haematologists from Belarus, Israel, the Russian Federation, Ukraine and the United States verified the diagnosis of leukaemia on the basis of haematology slide review. In 67 cases, diagnosis was made on the basis of other information, such as the results of laboratory tests, medical records from the diagnosing institution, and patient therapy data. Of 463 identified potential acute leukaemia cases, a diagnosis was made in 95% (442 cases).
201. A total of 20 potential controls were selected from the clinical records for each case and interviews were scheduled for the first two. If the first or second potential controls could not be reached, the next individuals on the list were contacted. Controls were matched to each case on sex, birth year and residence. Eligible controls were those who were alive at the reference date, which was the date of diagnosis of the corresponding case. The protocol of matching on residence differed between republics. Investigators described it as follows: “In Russia, controls were matched to cases on raion of residence of the case at the time of accident. In Ukraine, controls were initially matched on raion of residence of the case at the time of accident (118 or 22% of the controls), and subsequently were to be randomly selected from a raion different from that of the case, but within the same oblast. In Belarus, controls were matched to cases on raion of residence on the reference date and randomly selected from any raion of residence at the time of accident with the selection weighted by raion population”.
202. Trained physicians and dosimetry specialists interviewed the cases and controls to collect information on demography, general health interview, leukaemia risk factors, maternal and paternal occupational history and radiation exposure, using questionnaires. For deceased cases, the interview was administered to substitutes, preferably the subject’s mother or another close relative. The dosimetry questionnaire included questions on the sources, types and consumption of milk; sources and consumption of food; residence and occupation; relocation and migration; personal protective measures after the accident; type of housing; and time spent indoors and outdoors after the accident.
203. Cumulated radiation dose absorbed by the bone marrow was estimated for cases and controls from the time of the accident until the reference date, taking account of dose changes over time. External dose for a particular residence was calculated on the basis of field measurements. Internal dose estimates relied on food, water and milk consumption. For study subjects who were possibly exposed in utero (61 cases), the mother’s residence and dietary history were also obtained in order to estimate the dose received in utero. The uncertainties of individual doses were estimated by Monte-Carlo simulation of the variability of each of the input parameters used for dose calculations. Median estimated radiation dose of participants was 10 mGy.
204. In statistical analysis, logistic analysis adjusted for matching was conducted. A log-linear model used by investigators gave an ERR of 32 per Gy (95% CI: 8.8, 84). An increase in leukaemia risk with increasing radiation dose to the bone marrow was found only in Ukraine (ERR=79 per Gy; 95% CI: 22, 213). Investigators admitted that “the large and statistically significant dose response might be accounted for, at least in part, by an overestimate of risk in Ukraine”.
126 UNSCEAR 2017 REPORT
205. The risk estimate reported is very large and mainly driven by the Ukrainian data (particularly Cherkasskaya Oblast), with a different matching from the other countries. Whether the control series represents the catchment population of the case series or not is unclear. Medical exposure was not considered. The general conclusions of the Committee thus remain that there is little convincing evidence to suggest a measurable increase in the risk of leukaemia among those exposed as children to the radiation resulting from the accident at Chernobyl [U11]. This conclusion is consistent with the earlier cancer registry studies of childhood cancer risk in Europe following the Chernobyl accident [A18, H6, P3, P5].
V. BIOLOGICAL DOSIMETRY
206. In the TRC study, two methods were used for the validation of estimates of external absorbed dose: EPR on human teeth and stable-type chromosomal aberrations in human lymphocytes [D11, V9]. The results of these studies were generally correlated with the estimates of the external absorbed dose calculated for the residents of Metlino. As this is the closest settlement to the discharge point, the residents there received the highest levels of external exposure. In the Yangjiang and Karunagappally studies, the analysis of chromosomal aberrations was also performed in order to validate the physical estimates of absorbed dose. In both areas, increased frequency of unstable chromosomal aberrations (dicentrics and rings) has been demonstrated, but no excess of stable aberrations (translocations) has been shown compared with inhabitants from areas with lower levels of background radiation.
207. While analysis of chromosomal aberrations has contributed to the estimation of absorbed dose, uncertainties and limitations are, nevertheless, involved in their application to the estimation of dose from prolonged low-level radiation exposure [V5], especially from internal emitters [A3]. One of the reasons for the uncertainty is the low number of aberrations induced by chronic low-level radiation exposure and the low cumulative dose. Though unstable chromosomal aberrations are recognized as a sensitive and specific marker for exposure to ionizing radiation, a large number of cells must be scored to minimize the uncertainty when the dose is low. The frequencies of spontaneous translocation were reported to be of the order of one per hundred cells [S17], higher than those of dicentrics and rings, of the order of one per thousand cells [I9]. This is because translocations can be induced by many clastogens in contrast to dicentrics and rings, where induction is relatively specific for radiation exposure. Therefore, this makes it difficult to distinguish translocations induced by radiation from those induced by other clastogens. An increased frequency of dicentrics and centric rings has been reported in vitro at an acute dose of about 20 mGy, but for human biological dosimetry, in practice a detection limit of approximately 0.1 Gy is realistic [I9, L8, S31].
208. The complexity of the elimination rate of aberrant lymphocytes in vivo is another reason for the uncertainty. The elimination of lymphocytes with unstable chromosomal aberrations might be affected by other factors, such as age and elapsed time between exposure (or end of chronic exposure) and blood sampling [S2]. The information available from biological dosimetry studies in the assessment of health effects from low doses of radiation is currently limited because of the low detection limits, the resources required for large studies and incomplete participation. They are, nonetheless, useful markers of exposure and provide some assurance that the estimates of dose are generally consistent. Furthermore, several of the studies are difficult to interpret because of the lack of understanding of the influence of internal radiation on chromosomal aberrations.

ANNEX B: EPIDEMIOLOGICAL STUDIES OF CANCER RISK DUE TO LOW-DOSE-RATE RADIATION [...] 127
209. For stable chromosomal aberrations, which are considered to persist for longer than the unstable type, a significant dose–response relationship has been observed in studies of radiology technologists [B12] and radiation workers [T7]. Because translocations can be introduced by many clastogens other than ionizing radiation, they increase with age [S17], and individual variation is large. This makes it difficult to demonstrate the difference between radiation-induced translocations and those caused by other factors, such as smoking or chemicals. In spite of these uncertainties and limitations, cytogenetic methods could be successful in validating relatively high cumulative doses.
210. The detection threshold for FISH-based analysis of translocations depends on the type of exposure (uniform whole-body vs partial body, radiation quality), number of cells scored, age, and co-exposure such as smoking. Estimates of detection limit have ranged 200–500 mGy and lower doses are detectable for exposed groups (population average) than at individual level. Chromosomal aberrations have been shown to predict subsequent cancer risk, which seems to reflect partly innate DNA repair capacity and partly the influence of external exposure [B14, B16]. Further studies to validate their capacity for predicting cancer risk from low-dose radiation exposure would be important.
211. Unstable and stable aberrations are produced in equal proportions and the latter could lead to cancer [H1]. However, despite an excess of unstable aberrations in the residents of HNBR areas in Yangjiang and Karunagappally, no increase was observed in cancer mortality (Yangjiang, China) or cancer incidence (Karunagappally, India). Studies of newborns do not appear informative, despite the advantage of being free from influence of other exposure. It seems that the potential higher sensitivity of infants is offset by the low in utero exposure levels in HNBR.
VI. COMPARATIVE EVALUATIONS OF SELECTED STUDIES
212. In this chapter, studies on solid cancer and childhood leukaemia will be compared and evaluated further. In addition, the TRC study, unlike other studies reviewed here, has provided reasonably precise and valid risk estimates for adult leukaemia. The main focus here will be to reach a synthesis of available evidence, with assessment of the methodological features of the studies, applying the quality criteria of annex A. The main outcomes of different studies were analysed by all cancer types (except all leukaemia combined) and by childhood leukaemia separately. Combining a variety of cancer types into a single category can result in poor comparability of the findings, which is discussed below. Further, specific cancer types pose less of a problem in this respect, but statistical power is substantially lower. Several studies assigned environmental exposure estimates based on area of residence linked with dose-rate measurements instead of strictly individual measurements. Even in the LSS, individual radiation dose was not measured but estimated retrospectively on the basis of location and shielding. Aggregate level studies without individual data (ecological studies or geographical correlation studies) are not addressed here, as they were judged as not informative enough for risk assessment.
213. Statistical power is an important point for consideration. Most epidemiological studies on low-dose-rate exposure (<0.1 mGy min−1) have relatively low cumulative doses (<200 mGy). The potential cancer risk from such low doses is very small, and can be easily missed or, alternatively, spuriously produced by bias and confounding. In the most recent LSS report on cancer incidence in Japanese atomic bombing survivors, exposure to 1 Gy of gamma radiation at age 30 increased solid cancer incidence at age 70 by 47% [G7]. If we can assume that the ERR per unit dose is proportional to the dose, a radiation dose of 200 mGy increases solid cancer risk in men by approximately 9% (=47/5), which corresponds to a RR of 1.09 and an ERR of 0.09.
128 UNSCEAR 2017 REPORT
A. Studies in areas with elevated environmental radiation levels
1. Review of selected studies
214. In this section, studies will be compared that provided a quantitative estimate of cancer risk per unit dose of environmental radiation for general population. Table 19 summarizes the main features of radiation exposure and its sources in those studies. Associations between environmental radiation and cancer risk observed in those studies vary in degree but they are not inconsistent because of large confidence intervals. They have the potential to provide new knowledge on the magnitude of excess risk from low-dose-rate radiation exposure and to some extent too on modifiers of such risk and risk related to specific cancer sites. Tables 20–23 summarize methodological features of those studies.
215. The Karunagappally study and the Yangjiang study are prospective cohort studies. The TRC was established mainly in the late 1960s through 1980 (the majority of subjects were identified in the late 1960s), and follow-up was conducted partly retrospectively, partly prospectively. Case ascertainment for cancer incidence and mortality is a major factor in epidemiological studies, and comprehensive and high-quality case ascertainment is particularly important for the interpretation of low-dose/low-dose-rate studies. Ascertainment in the studies of high-background radiation areas may not be adequate for addressing the effects of low-dose radiation, particularly in the early follow-up period.
216. In the TRC study, the follow-up of cancer was started for mortality in the 1950s and for cancer incidence in 1956 and is still continued up to now. There was no national cancer registry in the Soviet Union and follow-up of cancer incidence in TRC members started only from 1956. In the TRC study, the proportion of cases identified solely through death certificate notification decreased throughout the follow-up period from 35% for 1956–1969 to 9% for 1990–2007, while the proportion of cases with morphological or radiological confirmation (e.g. based on X-rays, ultrasound) increased from 33% to 82% between the above time periods. The investigators of the TRC cancer incidence study [D5] concluded that for the studied period “the ascertainment of solid cancers is thought to be largely complete for cohort members residing in the study regions”.
217. In the early follow-up of the study, the cancer registry in Karunagappally had approximately 10% of cases based on death certificate only, which is higher than desirable, particularly in a low-dose study. In the Yangjiang study, with only mortality follow-up, the ascertainment of deceased cases was virtually complete except for subjects who moved out of the study area permanently. That is particularly so for old residents, who tend not to migrate. However, the accuracy of cause-of-death data can be a problem and it will be discussed later.
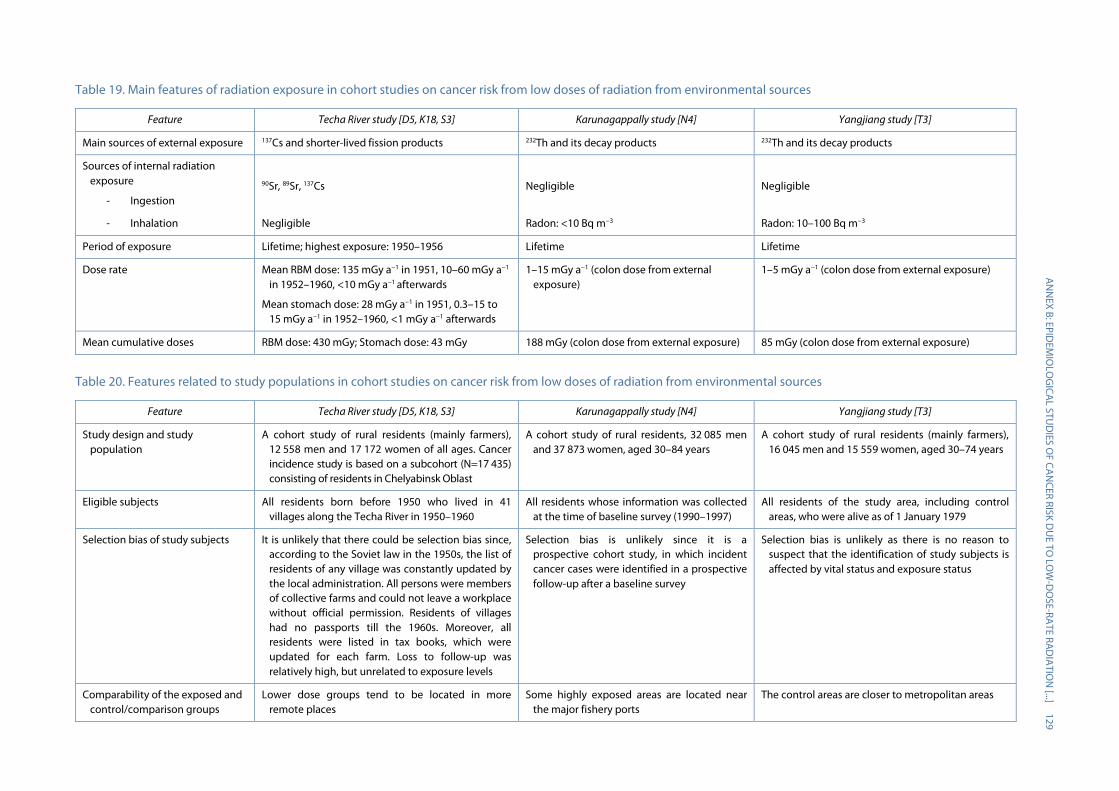
A
NN
EX B: EPIDEM
IOLO
GICA
L STUD
IES OF CA
NCER RISK D
UE TO
LOW
-DO
SE-RATE RAD
IATIO
N [...]
129
Table 19. Main features of radiation exposure in cohort studies on cancer risk from low doses of radiation from environmental sources
Feature Techa River study [D5, K18, S3] Karunagappally study [N4] Yangjiang study [T3]
Main sources of external exposure 137Cs and shorter-lived fission products 232Th and its decay products 232Th and its decay products
Sources of internal radiation exposure
- Ingestion
90Sr, 89Sr, 137Cs
Negligible
Negligible
- Inhalation Negligible Radon: <10 Bq m−3 Radon: 10–100 Bq m−3
Period of exposure Lifetime; highest exposure: 1950–1956 Lifetime Lifetime
Dose rate Mean RBM dose: 135 mGy a−1 in 1951, 10–60 mGy a−1 in 1952–1960, <10 mGy a−1 afterwards
Mean stomach dose: 28 mGy a−1 in 1951, 0.3–15 to 15 mGy a−1 in 1952–1960, <1 mGy a−1 afterwards
1–15 mGy a−1 (colon dose from external exposure)
1–5 mGy a−1 (colon dose from external exposure)
Mean cumulative doses RBM dose: 430 mGy; Stomach dose: 43 mGy 188 mGy (colon dose from external exposure) 85 mGy (colon dose from external exposure)
Table 20. Features related to study populations in cohort studies on cancer risk from low doses of radiation from environmental sources
Feature Techa River study [D5, K18, S3] Karunagappally study [N4] Yangjiang study [T3]
Study design and study population
A cohort study of rural residents (mainly farmers), 12 558 men and 17 172 women of all ages. Cancer incidence study is based on a subcohort (N=17 435) consisting of residents in Chelyabinsk Oblast
A cohort study of rural residents, 32 085 men and 37 873 women, aged 30–84 years
A cohort study of rural residents (mainly farmers), 16 045 men and 15 559 women, aged 30–74 years
Eligible subjects All residents born before 1950 who lived in 41 villages along the Techa River in 1950–1960
All residents whose information was collected at the time of baseline survey (1990–1997)
All residents of the study area, including control areas, who were alive as of 1 January 1979
Selection bias of study subjects It is unlikely that there could be selection bias since, according to the Soviet law in the 1950s, the list of residents of any village was constantly updated by the local administration. All persons were members of collective farms and could not leave a workplace without official permission. Residents of villages had no passports till the 1960s. Moreover, all residents were listed in tax books, which were updated for each farm. Loss to follow-up was relatively high, but unrelated to exposure levels
Selection bias is unlikely since it is a prospective cohort study, in which incident cancer cases were identified in a prospective follow-up after a baseline survey
Selection bias is unlikely as there is no reason to suspect that the identification of study subjects is affected by vital status and exposure status
Comparability of the exposed and control/comparison groups
Lower dose groups tend to be located in more remote places
Some highly exposed areas are located near the major fishery ports
The control areas are closer to metropolitan areas
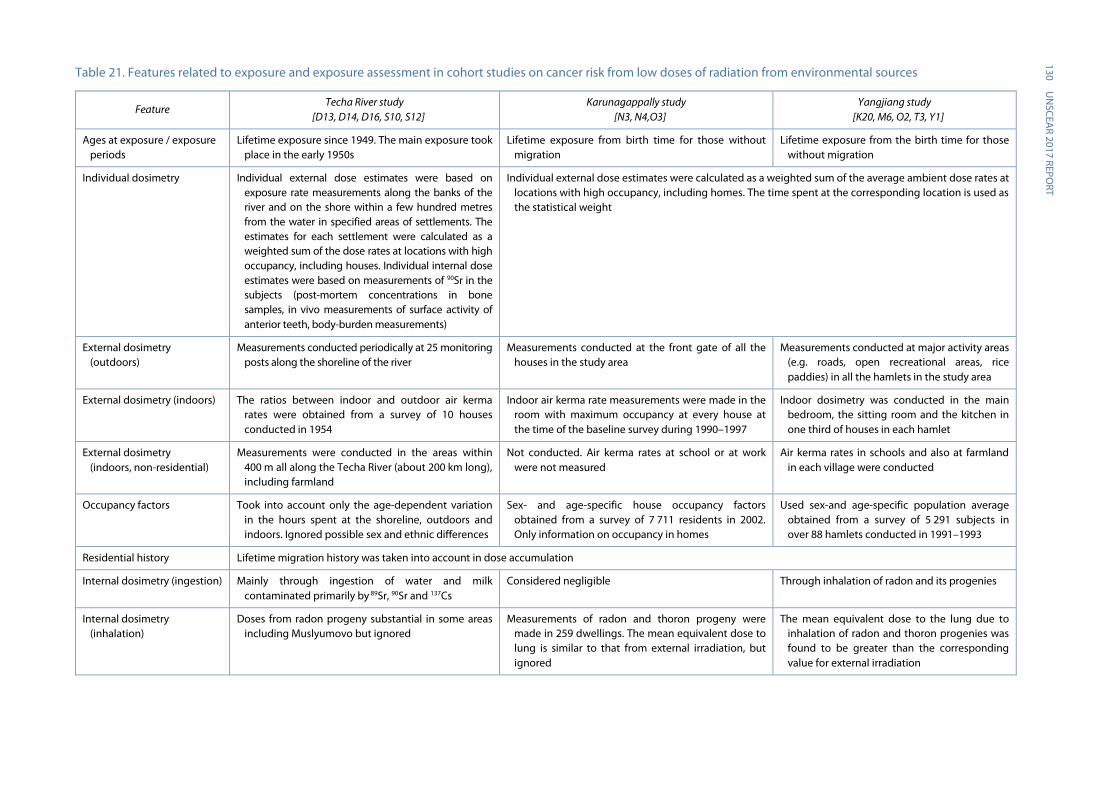
130 U
NSCEA
R 2017 REPORT
Table 21. Features related to exposure and exposure assessment in cohort studies on cancer risk from low doses of radiation from environmental sources
Feature Techa River study
[D13, D14, D16, S10, S12] Karunagappally study
[N3, N4,O3] Yangjiang study
[K20, M6, O2, T3, Y1]
Ages at exposure / exposure periods
Lifetime exposure since 1949. The main exposure took place in the early 1950s
Lifetime exposure from birth time for those without migration
Lifetime exposure from the birth time for those without migration
Individual dosimetry Individual external dose estimates were based on exposure rate measurements along the banks of the river and on the shore within a few hundred metres from the water in specified areas of settlements. The estimates for each settlement were calculated as a weighted sum of the dose rates at locations with high occupancy, including houses. Individual internal dose estimates were based on measurements of 90Sr in the subjects (post-mortem concentrations in bone samples, in vivo measurements of surface activity of anterior teeth, body-burden measurements)
Individual external dose estimates were calculated as a weighted sum of the average ambient dose rates at locations with high occupancy, including homes. The time spent at the corresponding location is used as the statistical weight
External dosimetry (outdoors)
Measurements conducted periodically at 25 monitoring posts along the shoreline of the river
Measurements conducted at the front gate of all the houses in the study area
Measurements conducted at major activity areas (e.g. roads, open recreational areas, rice paddies) in all the hamlets in the study area
External dosimetry (indoors) The ratios between indoor and outdoor air kerma rates were obtained from a survey of 10 houses conducted in 1954
Indoor air kerma rate measurements were made in the room with maximum occupancy at every house at the time of the baseline survey during 1990–1997
Indoor dosimetry was conducted in the main bedroom, the sitting room and the kitchen in one third of houses in each hamlet
External dosimetry (indoors, non-residential)
Measurements were conducted in the areas within 400 m all along the Techa River (about 200 km long), including farmland
Not conducted. Air kerma rates at school or at work were not measured
Air kerma rates in schools and also at farmland in each village were conducted
Occupancy factors Took into account only the age-dependent variation in the hours spent at the shoreline, outdoors and indoors. Ignored possible sex and ethnic differences
Sex- and age-specific house occupancy factors obtained from a survey of 7 711 residents in 2002. Only information on occupancy in homes
Used sex-and age-specific population average obtained from a survey of 5 291 subjects in over 88 hamlets conducted in 1991–1993
Residential history Lifetime migration history was taken into account in dose accumulation
Internal dosimetry (ingestion) Mainly through ingestion of water and milk contaminated primarily by 89Sr, 90Sr and 137Cs
Considered negligible Through inhalation of radon and its progenies
Internal dosimetry (inhalation)
Doses from radon progeny substantial in some areas including Muslyumovo but ignored
Measurements of radon and thoron progeny were made in 259 dwellings. The mean equivalent dose to lung is similar to that from external irradiation, but ignored
The mean equivalent dose to the lung due to inhalation of radon and thoron progenies was found to be greater than the corresponding value for external irradiation

A
NN
EX B: EPIDEM
IOLO
GICA
L STUD
IES OF CA
NCER RISK D
UE TO
LOW
-DO
SE-RATE RAD
IATIO
N [...]
131 Feature
Techa River study [D13, D14, D16, S10, S12]
Karunagappally study [N3, N4,O3]
Yangjiang study [K20, M6, O2, T3, Y1]
Medical radiation exposure and others
Individual medical doses received at the URCRM clinic for special surveys were reconstructed. Medical doses deemed not to be large enough to affect cancer risk estimate
Medical exposure is considered infrequent Medical exposure is considered infrequent
Organs considered in dose calculation
Twenty-three organs and tissues, including RBM and stomach wall, are considered in the dose calculation. Air kerma rates, occupancy factors and age-dependent conversion factors were used to calculate external dose. Age-dependent radionuclide intake and dose coefficients per unit intake were used to calculate internal dose
Colon dose for solid cancer, calculated using air kerma and ICRP 74 organ dose conversion coefficient [I5]
Colon dose from external radiation for solid cancer, calculated using air kerma rate and ICRP 74 organ dose conversion coefficient. Effective dose (instead of lung equivalent dose) for intakes of radon and thoron progenies
Dose validation EPR- and FISH-based dose estimates, carried out on a limited number of subjects, agreed well with the dose estimates derived from the use of the TRDS. Luminescence measurements of anthropogenic dose in bricks from old buildings located on the Techa River banks were also found to be consistent with calculations performed using the TRDS parameters
TLD measurements and scintillometer spot readings were conducted for one year in 800 houses, randomly selected. The estimated annual doses derived from the spot readings correlated well with the TLD-measured annual doses. Also, the frequency of chromosomal aberrations was found to increase in proportion to the cumulative dose in adult females
Individual dose estimates obtained from measured indoor and outdoor air kerma rates (indirect method) were compared with individual dose estimates measured using pocket dosimeters and TLDs (direct method) (N<100). There was a good correlation between the results obtained with the two methods
Dose uncertainties Substantial efforts have been made to evaluate the uncertainties in the individual dose estimates. Preliminary results, dating back to 2000, indicated that the uncertainties in external doses ranged in about a factor of 4 to 5 and that the ratios of the 97.5 and 2.5 percentiles for the internal dose estimates were in the range of 20–30 and could reach 100 or more. Since 2000, major work has been performed to reduce these uncertainties and to separate the shared and the unshared uncertainties. The first results for internal dose to the RBM showed that the uncertainties in the individual dose estimates appeared to be log-normally distributed with a geometric standard deviation of about 2 to 2.5. The complete results of this thorough uncertainty analysis have yet to be published
Uncertainties in the individual dose estimates were not quantified. It is likely that the contribution of the unshared errors is larger than that of the shared errors because the individual dose estimates are based on measured indoor and outdoor dose rates in each dwelling
Uncertainties in the individual dose estimates were not quantified. It is likely that the contribution of the shared errors is larger than that of the unshared errors because most of the individual dose estimates are based on village-averaged parameter values
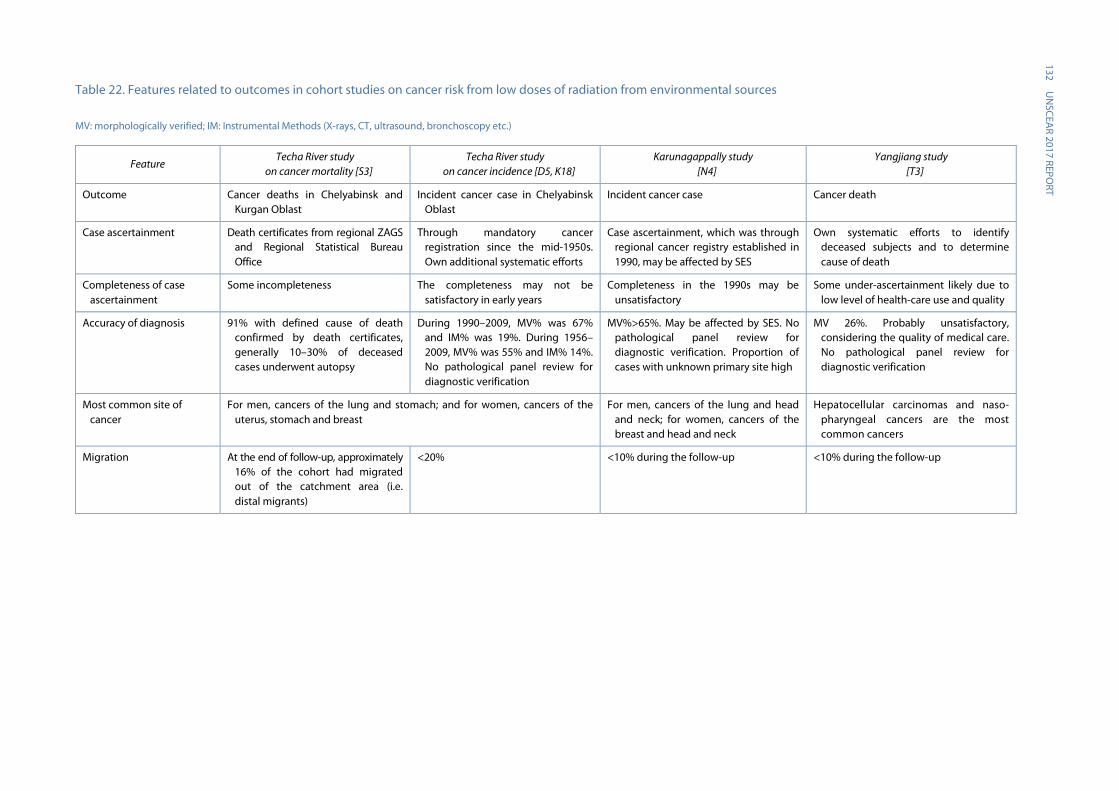
132 U
NSCEA
R 2017 REPORT
Table 22. Features related to outcomes in cohort studies on cancer risk from low doses of radiation from environmental sources
MV: morphologically verified; IM: Instrumental Methods (X-rays, CT, ultrasound, bronchoscopy etc.)
Feature Techa River study
on cancer mortality [S3] Techa River study
on cancer incidence [D5, K18] Karunagappally study
[N4] Yangjiang study
[T3]
Outcome Cancer deaths in Chelyabinsk and Kurgan Oblast
Incident cancer case in Chelyabinsk Oblast
Incident cancer case Cancer death
Case ascertainment Death certificates from regional ZAGS and Regional Statistical Bureau Office
Through mandatory cancer registration since the mid-1950s. Own additional systematic efforts
Case ascertainment, which was through regional cancer registry established in 1990, may be affected by SES
Own systematic efforts to identify deceased subjects and to determine cause of death
Completeness of case ascertainment
Some incompleteness The completeness may not be satisfactory in early years
Completeness in the 1990s may be unsatisfactory
Some under-ascertainment likely due to low level of health-care use and quality
Accuracy of diagnosis 91% with defined cause of death confirmed by death certificates, generally 10–30% of deceased cases underwent autopsy
During 1990–2009, MV% was 67% and IM% was 19%. During 1956–2009, MV% was 55% and IM% 14%. No pathological panel review for diagnostic verification
MV%>65%. May be affected by SES. No pathological panel review for diagnostic verification. Proportion of cases with unknown primary site high
MV 26%. Probably unsatisfactory, considering the quality of medical care. No pathological panel review for diagnostic verification
Most common site of cancer
For men, cancers of the lung and stomach; and for women, cancers of the uterus, stomach and breast
For men, cancers of the lung and head and neck; for women, cancers of the breast and head and neck
Hepatocellular carcinomas and naso-pharyngeal cancers are the most common cancers
Migration At the end of follow-up, approximately 16% of the cohort had migrated out of the catchment area (i.e. distal migrants)
<20% <10% during the follow-up <10% during the follow-up
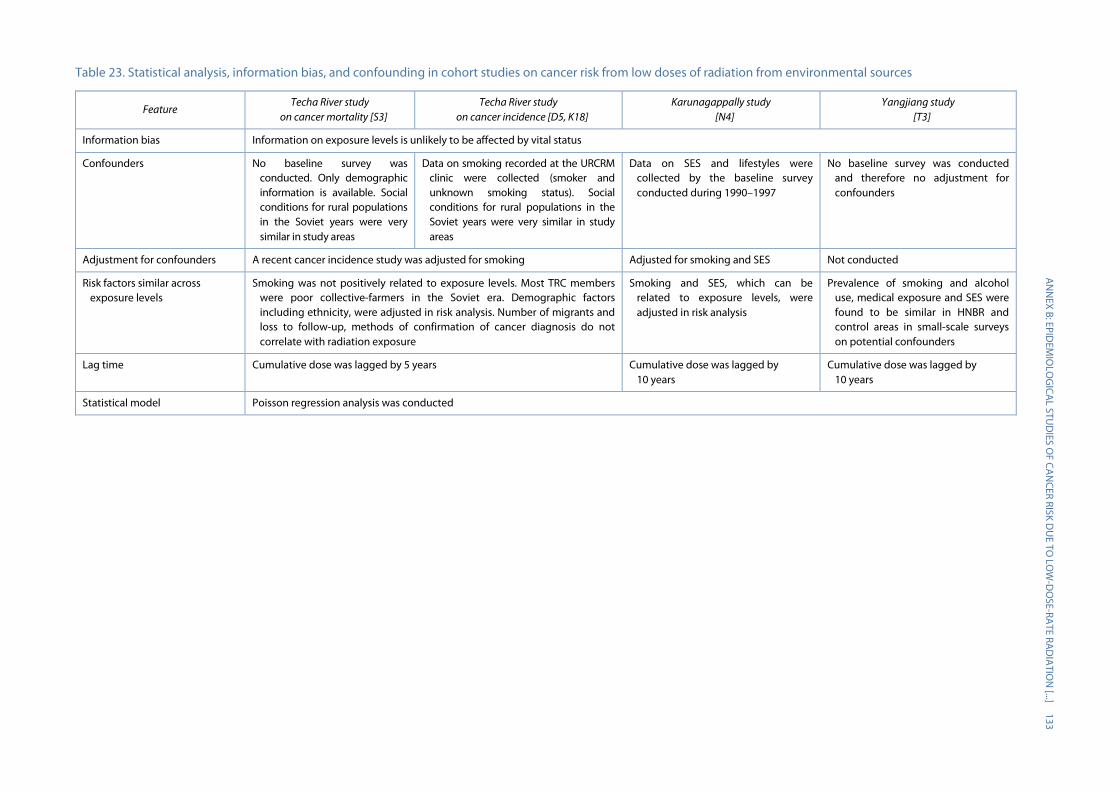
A
NN
EX B: EPIDEM
IOLO
GICA
L STUD
IES OF CA
NCER RISK D
UE TO
LOW
-DO
SE-RATE RAD
IATIO
N [...]
133 Table 23. Statistical analysis, information bias, and confounding in cohort studies on cancer risk from low doses of radiation from environmental sources
Feature Techa River study
on cancer mortality [S3] Techa River study
on cancer incidence [D5, K18] Karunagappally study
[N4] Yangjiang study
[T3]
Information bias Information on exposure levels is unlikely to be affected by vital status
Confounders No baseline survey was conducted. Only demographic information is available. Social conditions for rural populations in the Soviet years were very similar in study areas
Data on smoking recorded at the URCRM clinic were collected (smoker and unknown smoking status). Social conditions for rural populations in the Soviet years were very similar in study areas
Data on SES and lifestyles were collected by the baseline survey conducted during 1990–1997
No baseline survey was conducted and therefore no adjustment for confounders
Adjustment for confounders A recent cancer incidence study was adjusted for smoking Adjusted for smoking and SES Not conducted
Risk factors similar across exposure levels
Smoking was not positively related to exposure levels. Most TRC members were poor collective-farmers in the Soviet era. Demographic factors including ethnicity, were adjusted in risk analysis. Number of migrants and loss to follow-up, methods of confirmation of cancer diagnosis do not correlate with radiation exposure
Smoking and SES, which can be related to exposure levels, were adjusted in risk analysis
Prevalence of smoking and alcohol use, medical exposure and SES were found to be similar in HNBR and control areas in small-scale surveys on potential confounders
Lag time Cumulative dose was lagged by 5 years Cumulative dose was lagged by 10 years
Cumulative dose was lagged by 10 years
Statistical model Poisson regression analysis was conducted
134 UNSCEAR 2017 REPORT
218. In the Yangjiang study, extensive surveys were conducted periodically to identify deceased cohort members. Although no effort was made to evaluate the completeness of cancer death ascertainment, it was not difficult to enumerate deceased cases in the countryside, where residents knew each other well, and permanent migration was infrequent. However, the accuracy of cause of death could be far from ideal since farmers could not afford expensive treatment for cancer or other serious diseases. In the mortality study [T3], of the 941 deaths of cancer, excluding leukaemia, the underlying causes of death were determined on the basis of pathological information for 26% of the deaths, and on radiological or ultrasonographic diagnosis for 62%. Particularly of concern is the diagnosis of liver cancer, which is difficult to diagnose accurately due to difficulties in distinction between liver cancer, liver cirrhosis and hepatic metastases of other cancers.
219. The TRC study examined not only cancer incidence but also cancer mortality. The catchment area of cancer mortality follow-up was larger than that of cancer incidence, covering the entire territories of the Chelyabinsk and Kurgan Oblasts. The mortality follow-up was virtually complete. However, it is difficult to evaluate the accuracy of cause of death, particularly those that occurred at home.
220. It is often easier to obtain data on cancer mortality than on cancer incidence, because death certification tends to be more widely available and more complete than cancer registration. In addition, cancer incidence studies are more likely to be affected by loss to follow-up because of migration, unless there is a high-quality nationwide cancer registry. Nevertheless, cancer is often more accurately reported than most other causes of death [R5]. However, cancer deaths are fewer than incident cases, though depending on prognosis.
221. Since the ratio between cancer incidence and mortality rates is usually in the range 1.5–2, a mortality study cannot identify the 33−50% of cancer cases that are non-fatal, even if the data are complete and the information on the death certificates is accurate. As mortality depends on both incidence and prognosis, variation between populations also reflects availability and effectiveness of treatment. Inclusion of contributing causes of death improves the coverage, but not substantially [S4].
222. In the TRC study, almost 25% of the cohort members are known to have left the study area during 1949–1989. Roughly 80% of the cohort members who left the area moved to nearby cities and towns in Chelyabinsk, Yekaterinburg (formerly Sverdlovsk) and Kurgan Oblasts. Therefore, the proportion of emigrants who were lost to follow-up is not exceedingly large. Furthermore, emigration was unrelated to exposure level. Generally speaking, permanent migration is infrequent in rural areas of India and China. The cohort members of the Karunagappally study were mainly farmers, fishermen and blue-collar workers [N4]. The survey conducted in 2001 showed that migration outside Karunagappally was 6% in the 13-year survey period. The populations in the Yangjiang study were mainly farmers working on collective farms in rural areas. Their families had lived in the area for generations [H5]. Although Yangjiang is close to areas that have witnessed rapid economic development, it is difficult for local farmers to change their family registration to city areas and settle there.
223. In all the studies reviewed in this chapter, individual dose estimates from external exposure were calculated as a weighted sum of the average ambient dose rates at locations with high occupancy, including homes. The time spent at the corresponding location is used as the statistical weight. This approach requires information on indoor and outdoor air kerma in the places—such as residences, schools and workplaces—where a subject spent a significant amount of time. In addition, it is necessary to collect information on time spent in those places.
224. Collection of exposure information throughout lifetime is challenging. Exposure to natural background radiation already starts before birth. Data on possible changes over time in indoor and

ANNEX B: EPIDEMIOLOGICAL STUDIES OF CANCER RISK DUE TO LOW-DOSE-RATE RADIATION [...] 135
outdoor air kerma and occupancy factors is difficult to obtain. In the TRC study, residents had shorter periods of exposure than residents in HNBR areas, but more variability in exposure over time. Their occupancy during the early years was also reported retrospectively, relying on recall, which adds uncertainty. Even so, it is practically impossible to measure radiation doses comprehensively that were received by residents throughout the study period.
225. In the TRC study, external exposure was the main contributor to organ doses other than RBM dose. For RBM dose, internal exposure from ingestion is a major component of exposure. Dose estimation in the TRC has been improved over the years [D7]. Few measurements were made in 1951, when the highest release levels occurred and, thus, short-lived fission products that contributed to organ dose had to be estimated on the basis of surveys conducted later. Uncertainties are related to mixing data on internal and external doses and to measurements made years after the intake of internal doses. Biokinetic models also contain uncertainty with regard to key assumptions related to isotope depositions and detection decay after intake.
226. In the Karunagappally and the Yangjiang studies, the evaluation of internal exposure has not been conducted systematically. In Karunagappally, the radionuclide concentration in local food was not high. The results from a meal survey suggest that internal exposure from radium intake in meals is negligible in comparison with that of 40K. The activity concentration of radium in meals did not show any difference between HNBR and other areas as only a minor proportion of the food commonly consumed by the residents was grown locally. Therefore, it is unlikely that lifetime radiation dose from internal exposure was significantly different in the high and low exposure areas within Karunagappally [T12]. In the Yangjiang study, local foods did not have high concentrations of radionuclides [Y3].
227. In the two natural HNBR areas, thorium can be a possible source of internal exposure. The thorium burden of 87 residents in Karunagappally was determined by a thoron-in-breath analysis, indicating ingested level of thorium [N3, N5]. These results showed that the subjects from high and medium indoor radiation level areas had a significantly elevated thorium body burden compared to those from low indoor radiation level areas. No such evaluation has been conducted in the Yangjiang study.
228. Internal exposure from inhalation is another potential problem. In the TRC study, doses from radon and its daughters in the Techa River region were reported to be 1.7–6.2 mSv a−1 [Z8], and were ignored in risk analysis. Exposure to radon and its progenies in the Karunagappally study can be ignored because their indoor concentrations were low [T11]. In the Yangjiang study, indoor radon levels were higher (close to 50 Bq m−3) but still too small to substantially increase lung cancer risk [T10]. Further, lung cancer risk in the HNBR area of Yangjiang is similar to that in the control area [T2]. Both the Karunagappally and Yangjiang studies ignored internal exposure from ingestion.
229. It is possible to measure individual doses from HNBR during a short period (e.g. a few months). In all the studies reviewed in this annex, individual dosimetry using selected subjects was conducted for a short period and the measured doses were compared with estimated doses. However, the correlation between such a dose and the “real” cumulative dose up to the time of measurement is practically impossible to evaluate. Moreover, the accuracy of the dosimetry is sometimes questionable because it is not possible to tell whether the dosimeters were properly worn by residents.
230. Another possible approach to evaluating HNBR doses received by residents is to examine chromosomal aberrations. However, unstable aberrations, which are almost exclusively induced by ionizing radiation, do not reflect long-term cumulative doses as cells with such aberrations are eliminated relatively quickly. Stable chromosomal aberrations are related to cumulative radiation doses. Yet, because they are also caused by factors other than radiation [S17], their association with cumulative doses is weak at best, and require relatively large cumulative doses for an increase to be
136 UNSCEAR 2017 REPORT
detectable. There is evidence that chronic exposure produces increased chromosomal aberrations in radiation workers at a lower rate than acute exposure [T7, T17]. Given that the half-life of human lymphocytes is considered to be about three years [I1], frequencies of unstable chromosomal aberrations induced by chronic irradiation could be expected to reach a plateau after several years [S2]. However, unstable chromosomal aberrations accumulate over the periods of half-lives of lymphocytes in mice, according to dose rate in the range of one to hundreds mGy d−1 [T1]. Even in humans, there is a report suggesting that unstable-type aberrations could accumulate during longer periods than the half-life of lymphocytes [B3]. The kinetics of turnover of lymphocytes could become slower at low dose [R2] and low dose rate [A15]. In most studies in HNBR areas, an increased frequency of chromosomal aberrations has been found, despite some inconsistencies. The dose response is comparable with studies of higher dose levels, but one has to keep in mind that the precision of chromosomal aberration studies in the low dose range is poor, in particular, when the number of metaphases scored is low.
231. All the studies have limitations in dose assessment despite extensive efforts. The uncertainties are related to use of area-based measurements instead of individual data, and assumptions on occupancy and exposure outside home over long periods. Even if the uncertainties cause non-differential misclassifications, in the comparison between the exposed and unexposed groups, non-differential misclassifications typically bias ERRs and RRs toward the null value (0 and 1, respectively). However, if the exposure categories are divided into three or more groups, non-differential misclassification may bias the dose response away from the null value [D19]. Dosimetric uncertainties shared among subgroups of a study population can bias dose response, either masking or exaggerating a true effect [G2, L1]. It is desirable to evaluate dosimetric uncertainties shared by subgroups, as is being done in the TRC study, and to conduct dose–response analysis to account for those uncertainties [S19].
232. Since women in the HNBR study areas tend to stay at home, annual dose is more easily estimated for women. However, residential stability is lower for women, as a considerable number of women moved into their current residence after marriage. Doses at the houses before marriage are more likely to be missed in the dosimetry survey, which was conducted at the time of the baseline survey during the period 1990–1997 in the Karunagappally study. This problem can be more serious if women moved from high-dose areas to low-dose areas before the baseline survey.
233. Medical exposure was infrequent in Karunagappally and Yangjiang, because the areas are mainly rural and access to medical facilities was neither easy nor affordable. On the other hand, in the TRC study, subjects underwent X-ray diagnostic procedures as part of their medical examinations. No attempt was made to examine the correlation between cumulative doses from medical exposure and HNBR in the Indian and Chinese studies. However, the contribution of medical exposure was small compared to the environmental doses, with the average doses to major organs ranging between 11 and 33 mGy [D15].
234. Several risk factors have a stronger effect on solid cancer risk than low-dose radiation. As a result, even a weak association of radiation exposure with such a factor can confound the relationship between radiation exposure and cancer risk. In HNBR and Techa River areas, radiation levels are determined mainly by geography, which can be associated with lifestyle factors related to cancer risk and indicators of such factors including SES, religion, ethnicity and occupation.
235. Information on several lifestyle factors such as smoking and alcohol use and also SES was more comprehensive in the Karunagappally study than in the TRC study or Yangjiang study. The lack of detailed information on confounders is a major drawback. The TRC study could not collect information on lifestyles and socioeconomic factors from the entire cohort. However, because the TRC study populations consist mainly of farmers working in collective farms in rural areas, their lifestyles were
ANNEX B: EPIDEMIOLOGICAL STUDIES OF CANCER RISK DUE TO LOW-DOSE-RATE RADIATION [...] 137
relatively homogeneous, particularly during the Soviet era. Differences in smoking habits and alcohol use are, however, very likely. On the other hand, lifestyle can be correlated with sex and ethnicity. Adjustment for these proxy indicators of behavioural risk factors in risk analysis should diminish confounding to some degree.
236. The TRC cancer incidence study [D5] used data on smoking that were recorded during interviews for TRC members of the cohort who visited the URCRM clinic. Individual information on smoking intensity and duration were not available for risk analysis.
237. The Karunagappally study collected information on lifestyle and SES in the baseline survey, and the collected information was used in the cancer risk analysis. However, the study reported by Nair et al. [N4] was, for unclear reasons, not adjusted for tobacco chewing, which is a major cancer risk factor in the study area for cancers of the upper digestive tract organs, even if the information were available.
238. One of the main concerns in the Yangjiang study is the comparability of lifestyles and other potential confounders in HNBR and control areas. It has been criticized that a slightly low cancer mortality rate in the HNBR area reported by the first international publication [H5] might be due to differences in living standards and lifestyles in HNBR and control areas. The Yangjiang study collected information on those factors for only a small portion of the cohort members. On the basis of those surveys on the selected residents, it has been concluded that the distributions of several potential confounding factors – including diet and nutrition, drinking water, pesticide residue and aflatoxin B1 in food, medical exposure, tobacco smoking and alcohol consumption in HNBR areas – were not substantially different from those in the control area [T4, Z4]. Differences were noted, however, for infections such as tuberculosis.
239. The cumulative dose was lagged by five years in the TRC study, and was lagged by 10 years in the Karunagappally and the Yangjiang studies, assuming that cancer risk is not increased during the lag time, i.e. before a minimum latency* has elapsed. If cancer risk is already increased during the excluded lag time, absolute risk due to radiation, such as lifetime risk, will be underestimated though the ERR estimates may be either underestimated or unaffected [R6].
240. Statistical power is calculated before a study is conducted to assess whether there is sufficient likelihood of finding an effect of a given size, provided that it exists. The number of cases attributable to exposure is a good indicator of the amount of information from a study, as it reflects both effect size and number of cases. Effect magnitude depends on exposure level (and potential modifiers of risk), and the number of cases on baseline risk. After a study is conducted, confidence intervals indicate the range of risks consistent with the observed results. Of the studies on environmental radiation exposure resulting from human activities, the TRC study has a statistical power higher than 80% for showing a risk estimate similar to the LSS, while the Taiwanese study does not. Of the HNBR studies, the Yangjiang study had fewer cases and lower average doses in the exposed group than the Karunagappally study and, therefore, also lower statistical power.
241. Even studies of low statistical power, such as several of the natural background radiation studies presented here, are informative if they can indicate levels of risk that are unlikely, given the observations. If an expected estimate of ERR per unit dose and its standard errors are available, the statistical power of a given study to find this expected ERR per unit dose can be calculated in retrospect. In the Karunagappally study, the ERR estimate per 100 mGy for solid cancer was −0.013 per 100 mGy (95% CI: −0.058, 0.046). After adjustment for attained age, the LSS estimate was 0.062 at 100 mGy (95% CI: 0.053, 0.071). The statistical power to detect an ERR per unit dose similar to the LSS with an alpha of 10% is >80% for the Karunagappally study. The lack of overlap in the confidence interval in the risk estimates per unit dose,

138 UNSCEAR 2017 REPORT
suggest influence by some of numerous differences between the two studies in exposure (e.g. dose rate and distribution of cancer sites and age at exposure) and/or conduct of the studies.
242. In the evaluation of results from individual studies, consistency of results with previous epidemiological literature is needed for proper interpretation. Validity* requires solid study design and appropriate data analysis, and credibility can be assessed also by comparing reported patterns of risk with earlier studies. In the TRC study, the reported excess risk was largely driven by two cancer sites, cancer of the cervix and uterus and the oesophagus. Uterine and cervical cancer have not been convincingly linked to ionizing radiation, and the association with oesophageal cancer in the TRC was found only in women and not in men. Further, the oesophageal cancer risk was concentrated only in one ethnic group. Moreover, in the TRC study the ERR tends to increase with age at exposure, whereas in the LSS and other studies, relative risk has decreased with age at exposure. Likewise, the TRC indicated a tendency of relative risk increasing with attained age, whereas in other studies it decreased with attained age. The differences between age groups in the TRC were, however, not significant. The differences between the TRC study and the LSS should not be overemphasized since they can be due to statistical imprecision. The number of excess cancer cases in the TRC study [S3] is around 50 and, therefore, its statistical power to evaluate risk modification or risk by cancer site is much lower than that of the LSS. Variability* in risk within the study population also tends to decrease the statistical power (precision) [L6].
2. Summary
243. The epidemiological cancer studies reviewed here have advantages and drawbacks in various aspects. Dosimetry is always a challenge in studies of environmental exposure, as it is practically always based on retrospective reconstruction of spatial distribution of dose rates, with efforts to account for factors such as shielding and occupancy. For internal exposure, information is also needed for past intake and sources of food and water. The case ascertainment is suboptimal, especially in comparison with other cancer incidence studies such as the LSS, and studies of workers and patients. The risk estimates in studies of environmental exposure can be distorted by biases and confounding. However, the magnitude of those biases and confounding are difficult to evaluate without extensive sensitivity analysis. Fewer major risk factors are known for leukaemia than for various solid cancers and, therefore, the findings on leukaemia are less likely to be influenced by confounding. Some heterogeneity in solid cancer risk may also stem from the fact that even if all studies excluded leukaemia from analyses of other cancers, exclusion of other lympho-haematological malignancies was not entirely consistent in various studies. The limitations need to be considered when drawing inference about radiation-induced risks from the observed rates reported in the studies evaluated here (see also annex A and the glossary).
244. The LSS reported for solid cancer mortality an ERR of 0.042 per 100 mGy for those with attained age 70 and exposed at age 30 (the male-female ratio is assumed to be 1:1). In the TRC study, the ERR for mortality from all solid cancers was 0.061 per 100 mGy (95% CI: 0.004, 0.127), which is close to, though slightly higher, the reported value in the LSS.
245. Using the solid cancer risk model given in the recent analysis of cancer incidence in the LSS, the sex-averaged estimate of ERR per Gy at age 65 for a person exposed at age 25 (which corresponds roughly to the mean age at initial exposure and age at diagnosis in the current TRC data) is about 0.06 per 100 mGy, which is very close to the LSS results. The direction of the estimated sex, age and age at initial exposure effects on the ERR in the TRC are different from those in the Japanese survivors of the atomic bombings [G7, H9]. However, these effect modification parameters are imprecise, and their confidence intervals are wide and therefore, cautious interpretation is needed, as it is unclear

ANNEX B: EPIDEMIOLOGICAL STUDIES OF CANCER RISK DUE TO LOW-DOSE-RATE RADIATION [...] 139
whether they reflect methodological shortcomings or differences between the effects of protracted low-dose-rate exposure compared with acute radiation exposure.
246. The mean RBM dose in the TRC was 0.42 Gy and there were 99 incident leukaemia cases in the cohort (82% microscopically verified diagnoses). The ERR per 100 mGy was 0.22 (95% CI: 0.08, 0.54) for non-CLL leukaemia. This is higher than reported from the LSS, with more than 300 non-CLL cases (ERR 0.08 at 100 mGy based on the linear component which predominated at doses <1 Gy), but comparable to, for example, the recent results from the INWORKS study of radiation workers (with >500 non-CLL cases but very low average doses) showing ERR 0.3 at 100 mGy [L4]. Of leukaemia subtypes, the combined group of acute leukaemias and chronic myelocytic leukaemias showed a dose response, while CLL and lymphomas were not associated with radiation exposure. Attrition due to emigration and loss to follow-up, as well as unknown causes of death and possible under-ascertainment of cases in the early follow-up reduced the precision of the results as for other analyses, but nevertheless the leukaemia findings are the most robust results from the TRC study.
247. The ERR of solid cancer obtained from the TRC cancer mortality study was 0.061 (95% CI: 0.004, 0.127) [S3] and the TRC cancer incidence study gave 0.077 (95% CI: 0.013, 0.150) [D5]. The corresponding estimate from the Karunagappally study [N4] was −0.013 (95% CI: −0.058, 0.046) and from the Yangjiang study [T3] was 0.019 (95% CI: −0.187, 0.304, excluding liver cancer). The study of the residents of 60Co-contaminated buildings from Taiwan, China, showed an ERR 0.03 (90% CI: −0.04, 0.09) but it is substantially smaller than the other studies and has some unresolved methodological issues. In the TRC incidence study, the ERR per 100 mGy became 0.063 (95% CI: 0.00, 0.14) after the exclusion of oesophageal cancer. The ERR estimates obtained from those studies have wide confidence intervals and overlap each other. Continued follow-up of these relatively low-dose cohorts, in particular the Karunagappally study, can potentially improve the precision, better characterize the uncertainties in these risk estimates, and provide some insight into effect modification and dose-rate effects on the magnitude of the risk.
248. When making comparisons between those ERRs per unit dose in those studies, it should be noted that cancer patterns differ. In the TRC, the most common cancers are cancers of the stomach and lung. On the other hand, in the Yangjiang study, hepatocellular carcinoma and nasopharyngeal cancers accounts for nearly 50% of all cancers, known to be aetiologically associated with HBV and Epstein-Barr virus. In the Karunagappally study, lung cancer was the most common site, as was the case in the TRC. However, the second most common cancer in men is head and neck cancers. These different cancer patterns may be an explanation for differences in ERR estimates per unit dose, as the risk coefficients are likely to vary by site. Ideally, assessment of radiation-induced risk should be evaluated by specific cancer site, but this is limited by low statistical power.
249. Further improvement in the quality of HNBR studies would make them more valuable. This could be done by improving cancer registries in that they provide long-term follow-up of residents, enhancing cause of death assignment and data on non-radiation risk factors, and refining risk estimates for subgroups of the population. Additional follow-up is likely to enhance the power of the Karunagappally study more quickly than that of the Yangjiang study, because the cancer incidence rate in the former is higher than the cancer mortality rate in the latter. In the interpretation of the findings from the HNBR studies, there is also the fact that the study populations have resided and received the constant exposure levels often for several generations. Hence, if the adaptive responses shown in laboratory studies have relevance for cancer risk in human populations, such potential adaptive responses may reduce the effect magnitude.
250. An alternative source of information for risks from protracted exposure to low doses of radiation is through studies of occupationally exposed groups. Large studies have been conducted, a three-country analysis of nuclear workers (INWORKS) as a recent example [L4, R3]. Occupational studies

140 UNSCEAR 2017 REPORT
also have strengths and weaknesses (e.g. lack of data on confounders, and study populations restricted to working-age population, mostly men). Studies of anthropogenic radiation in the environment, including those on the effects of the Chernobyl and Fukushima accidents, will also provide important information about cancer risk from low doses of radiation. A third opportunity for studying low-dose risks is from diagnostic uses of radiation. The exposed subjects are, however, examined for a disease or suspicion of disease, which makes it difficult to disentangle the effect of the indication for the examination from that of the radiation exposure from the examination, unless similar patients can be identified who were not examined radiologically.
B. Childhood leukaemia studies
1. Review of selected studies
251. The association between leukaemia and environmental radiation exposure observed in the studies is not consistent. However, all studies reported childhood leukaemia risk in relation to unit RBM dose or dose estimate have the potential to provide new knowledge on the dose response, the magnitude of excess risk and modifiers of the relationship between childhood leukaemia risk and low-dose-rate radiation exposure. Based on the quality criteria for the Committee’s reviews on epidemiological studies elaborated in annex A, the main quality features of studies presented here (Finland, France Switzerland and the United Kingdom as well as the Chernobyl study conducted in Belarus, the Russian Federation and Ukraine) are summarized in tables 24 and 25.
252. In a population-based control study, controls are so selected from the population that they represent distribution of the exposure of interest and relevant co-variables, including potential confounders, of the base population (usually, they are randomly selected from a comprehensive population registry or a representative population roster). In the Chernobyl childhood leukaemia study, two controls were selected from hospital records in each study raion, matching to each case on sex, birth year and residence. In this case, it is difficult to tell whether the catchment population of cases is the same as the population that controls are supposed to represent and from which the cases arise. In the other studies the base population or the control series was more clearly defined. The controls were selected from the census record or family and birth registers.
253. Dependence of case ascertainment rate on exposure results can distort the association between risk and exposure. The studies conducted in Finland, France, Switzerland and the United Kingdom identified leukaemia cases through nationwide cancer registries. The quality of those registries was shown to be good [B7, D1, T8] and therefore, such a concern is not warranted.
254. There are several subtypes of leukaemia, outlined in detail by the WHO classifications [V1]. In epidemiological studies, however, classification as detailed as for selection of treatment is not used and the emphasis is not on the prognosis. The main types include acute myeloid leukaemia (AML), chronic myeloid leukaemia (CML), acute lymphocytic leukaemia (ALL) and chronic lymphocytic leukaemia (CLL) [B5]. CLL is considered aetiologically unrelated to ionizing radiation exposure even though some recent studies have suggested otherwise [G6]. The possible differences between leukaemia subtypes in terms of radiation-induced risk are not entirely clear, i.e. it is not well established which subtypes are more strongly related to radiation. ALL has an incidence peak at age 3–5 years [B5]. In myelocytic leukaemia, the peak incidence is already at age one year and in infant leukaemia the predominance of ALL is not as clear as in childhood leukaemia at older ages [B5].
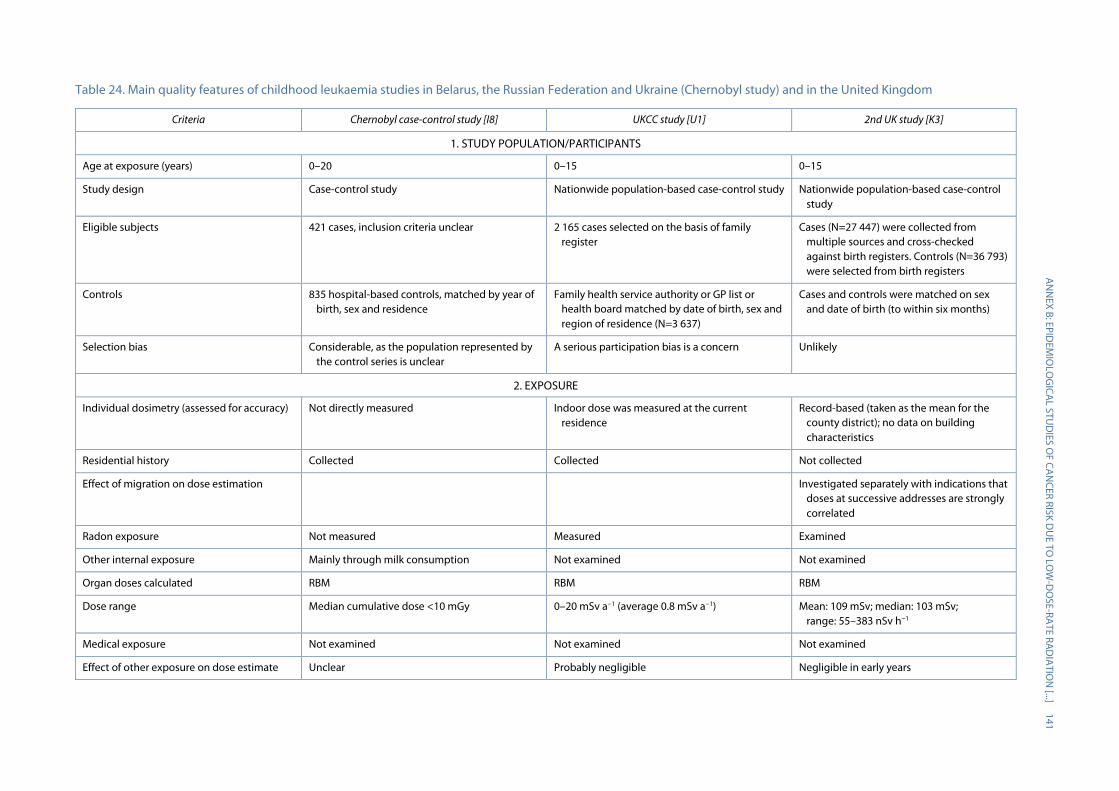
A
NN
EX B: EPIDEM
IOLO
GICA
L STUD
IES OF CA
NCER RISK D
UE TO
LOW
-DO
SE-RATE RAD
IATIO
N [...]
141
Table 24. Main quality features of childhood leukaemia studies in Belarus, the Russian Federation and Ukraine (Chernobyl study) and in the United Kingdom
Criteria Chernobyl case-control study [I8] UKCC study [U1] 2nd UK study [K3]
1. STUDY POPULATION/PARTICIPANTS
Age at exposure (years) 0–20 0–15 0–15
Study design Case-control study Nationwide population-based case-control study Nationwide population-based case-control study
Eligible subjects 421 cases, inclusion criteria unclear 2 165 cases selected on the basis of family register
Cases (N=27 447) were collected from multiple sources and cross-checked against birth registers. Controls (N=36 793) were selected from birth registers
Controls 835 hospital-based controls, matched by year of birth, sex and residence
Family health service authority or GP list or health board matched by date of birth, sex and region of residence (N=3 637)
Cases and controls were matched on sex and date of birth (to within six months)
Selection bias Considerable, as the population represented by the control series is unclear
A serious participation bias is a concern Unlikely
2. EXPOSURE
Individual dosimetry (assessed for accuracy) Not directly measured Indoor dose was measured at the current residence
Record-based (taken as the mean for the county district); no data on building characteristics
Residential history Collected Collected Not collected
Effect of migration on dose estimation Investigated separately with indications that doses at successive addresses are strongly correlated
Radon exposure Not measured Measured Examined
Other internal exposure Mainly through milk consumption Not examined Not examined
Organ doses calculated RBM RBM RBM
Dose range Median cumulative dose <10 mGy 0–20 mSv a−1 (average 0.8 mSv a−1) Mean: 109 mSv; median: 103 mSv; range: 55–383 nSv h−1
Medical exposure Not examined Not examined Not examined
Effect of other exposure on dose estimate Unclear Probably negligible Negligible in early years

142 U
NSCEA
R 2017 REPORT
Criteria Chernobyl case-control study [I8] UKCC study [U1] 2nd UK study [K3]
3. OUTCOME
Number of leukaemia cases 421 Not reported (total number of all childhood cancers 2 165)
9 058
Leukaemia subtypes Acute leukaemia was the end point ALL is distinguished from the others Leukaemia subtypes available
Case identification Hospital records and cancer registry Hospital records and cancer registry Through the nationwide cancer registry
Complete case ascertainment Unclear Considered almost complete for leukaemia Considered to be very high
Pathological review of cases for diagnostic verification
A review was conducted for most cases A central review was performed No re-evaluation
Years of diagnosis 1986–2000 1992–1996 (1991–1994 in Scotland) 1980–2006
4. BIAS AND 5. CONFOUNDING
Information on confounders Collected, but not on SES Collected Sex, age, county and SES (both individual measures of SES and averages for Census wards with a mean population of ~5 000)
Risk factors similar across exposure levels SES is related to exposure SES is related to exposure
6. STATISTICAL METHODS/ANALYSIS
Adjustment for confounders Statistical analysis was adjusted for matching factors. SES not considered
SES (area-based level of deprivation) Adjustment for SES (county-level deprivation index) did not affect the results
Statistical analysis Conditional logistic analysis (matched factors taken into account)
Conditional logistic analysis (matched factors taken into account)
Conditional logistic analysis (matched factors taken into account)
Latency period No latency period was assumed No latency period was assumed 9 or 12 months
Sensitivity analyses Done Done
7. REPORTING
ERR or equivalent (95% CI) for all leukaemias Not reported Not reported 12 (3, 22) per 100 mGy
ERR or equivalent (95% CI) for leukaemia subtypes
ERR: 3(1, 8) per 100 mGy for acute leukaemia No estimate per unit dose (or dose rate) reported. For ALL, in the highest exposure category OR=0.95 (95% CI: 0.66, 1.37); trend p=0.11
10 (2, 19) per 100 mGy for lymphoid leukaemia
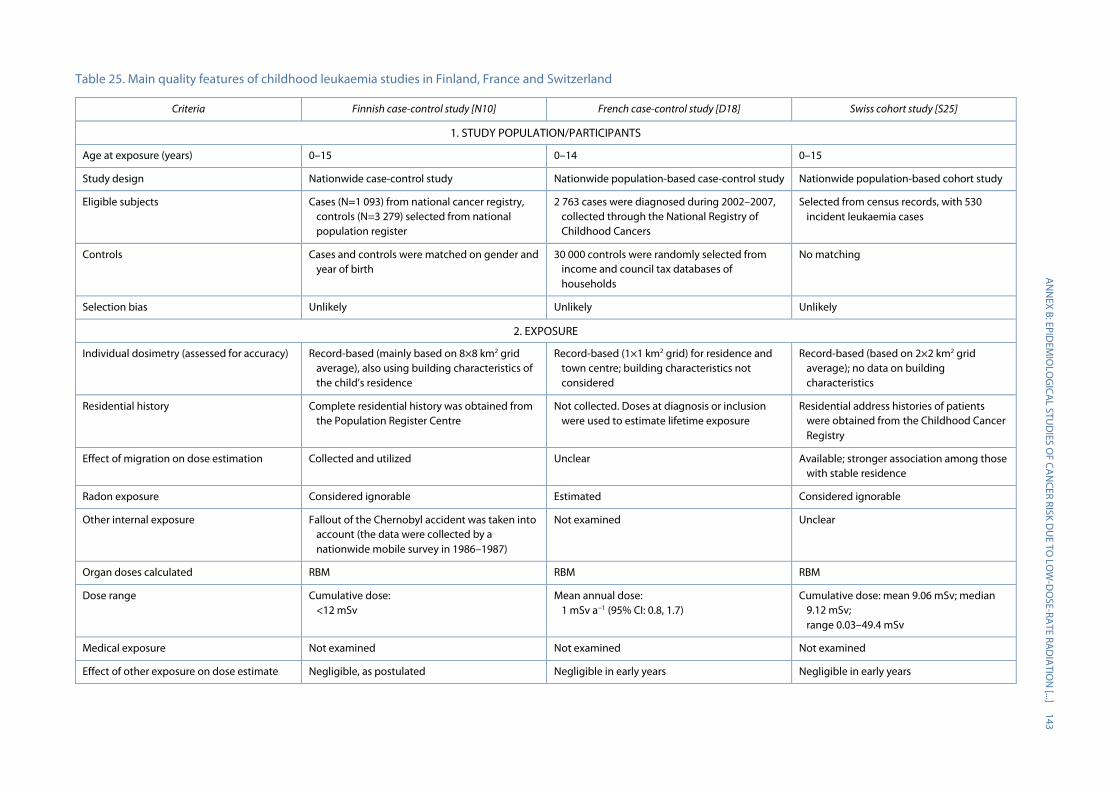
A
NN
EX B: EPIDEM
IOLO
GICA
L STUD
IES OF CA
NCER RISK D
UE TO
LOW
-DO
SE-RATE RAD
IATIO
N [...]
143 Table 25. Main quality features of childhood leukaemia studies in Finland, France and Switzerland
Criteria Finnish case-control study [N10] French case-control study [D18] Swiss cohort study [S25]
1. STUDY POPULATION/PARTICIPANTS
Age at exposure (years) 0–15 0–14 0–15
Study design Nationwide case-control study Nationwide population-based case-control study Nationwide population-based cohort study
Eligible subjects Cases (N=1 093) from national cancer registry, controls (N=3 279) selected from national population register
2 763 cases were diagnosed during 2002–2007, collected through the National Registry of Childhood Cancers
Selected from census records, with 530 incident leukaemia cases
Controls Cases and controls were matched on gender and year of birth
30 000 controls were randomly selected from income and council tax databases of households
No matching
Selection bias Unlikely Unlikely Unlikely
2. EXPOSURE
Individual dosimetry (assessed for accuracy) Record-based (mainly based on 8×8 km2 grid average), also using building characteristics of the child’s residence
Record-based (1×1 km2 grid) for residence and town centre; building characteristics not considered
Record-based (based on 2×2 km2 grid average); no data on building characteristics
Residential history Complete residential history was obtained from the Population Register Centre
Not collected. Doses at diagnosis or inclusion were used to estimate lifetime exposure
Residential address histories of patients were obtained from the Childhood Cancer Registry
Effect of migration on dose estimation Collected and utilized Unclear Available; stronger association among those with stable residence
Radon exposure Considered ignorable Estimated Considered ignorable
Other internal exposure Fallout of the Chernobyl accident was taken into account (the data were collected by a nationwide mobile survey in 1986–1987)
Not examined Unclear
Organ doses calculated RBM RBM RBM
Dose range Cumulative dose: <12 mSv
Mean annual dose: 1 mSv a−1 (95% CI: 0.8, 1.7)
Cumulative dose: mean 9.06 mSv; median 9.12 mSv; range 0.03–49.4 mSv
Medical exposure Not examined Not examined Not examined
Effect of other exposure on dose estimate Negligible, as postulated Negligible in early years Negligible in early years
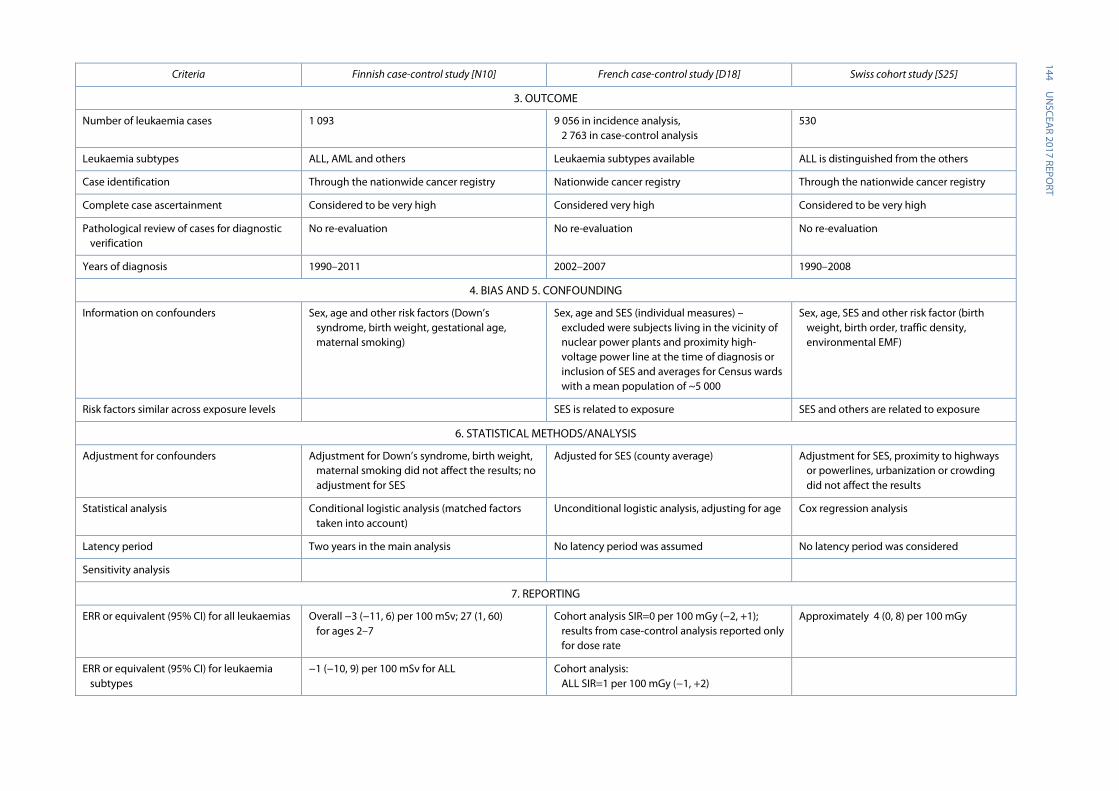
144 U
NSCEA
R 2017 REPORT
Criteria Finnish case-control study [N10] French case-control study [D18] Swiss cohort study [S25]
3. OUTCOME
Number of leukaemia cases 1 093 9 056 in incidence analysis, 2 763 in case-control analysis
530
Leukaemia subtypes ALL, AML and others Leukaemia subtypes available ALL is distinguished from the others
Case identification Through the nationwide cancer registry Nationwide cancer registry Through the nationwide cancer registry
Complete case ascertainment Considered to be very high Considered very high Considered to be very high
Pathological review of cases for diagnostic verification
No re-evaluation No re-evaluation No re-evaluation
Years of diagnosis 1990–2011 2002–2007 1990–2008
4. BIAS AND 5. CONFOUNDING
Information on confounders Sex, age and other risk factors (Down’s syndrome, birth weight, gestational age, maternal smoking)
Sex, age and SES (individual measures) – excluded were subjects living in the vicinity of nuclear power plants and proximity high-voltage power line at the time of diagnosis or inclusion of SES and averages for Census wards with a mean population of ~5 000
Sex, age, SES and other risk factor (birth weight, birth order, traffic density, environmental EMF)
Risk factors similar across exposure levels SES is related to exposure SES and others are related to exposure
6. STATISTICAL METHODS/ANALYSIS
Adjustment for confounders Adjustment for Down’s syndrome, birth weight, maternal smoking did not affect the results; no adjustment for SES
Adjusted for SES (county average) Adjustment for SES, proximity to highways or powerlines, urbanization or crowding did not affect the results
Statistical analysis Conditional logistic analysis (matched factors taken into account)
Unconditional logistic analysis, adjusting for age Cox regression analysis
Latency period Two years in the main analysis No latency period was assumed No latency period was considered
Sensitivity analysis
7. REPORTING
ERR or equivalent (95% CI) for all leukaemias Overall −3 (−11, 6) per 100 mSv; 27 (1, 60) for ages 2–7
Cohort analysis SIR=0 per 100 mGy (−2, +1); results from case-control analysis reported only for dose rate
Approximately 4 (0, 8) per 100 mGy
ERR or equivalent (95% CI) for leukaemia subtypes
−1 (−10, 9) per 100 mSv for ALL Cohort analysis: ALL SIR=1 per 100 mGy (−1, +2)
ANNEX B: EPIDEMIOLOGICAL STUDIES OF CANCER RISK DUE TO LOW-DOSE-RATE RADIATION [...] 145
255. A problem in case-control studies with interview/dosimetry is the collection of information on the exposure of interest (radiation) and other co-variables after the development of the disease of interest. Even for indoor dosimetry that does not involve interview, it is too naive to assume that behaviour and conditions, including occupancy, did not change after detection of symptoms and diagnosis. However, in the case of gamma-radiation measurements, such a problem is unlikely to be serious. If an interview is involved, the impact of the disease may be more pronounced. If case subjects are too ill to be interviewed or deceased, surrogates, including family members, will be interviewed for information on occupancy, lifestyle and other factors. However, this kind of retrospective approach may introduce inaccuracy and bias to the information, and may distort the relationship between leukaemia risk and radiation exposure.
256. Children commonly spend most of their time in the home in their early childhood. However, as they get older, they tend to spend a relatively longer time outside home, for instance in day care. Therefore, a study to estimate individual dose would ideally need to measure not only exposure at home, but also cover exposure at nurseries and schools, playgrounds, shopping centres, parks, greenspaces and so on. However, comprehensive dosimetry including exposure outside the home is difficult and unlikely to be feasible in a large-scale epidemiological study. In recent years, increased unwillingness to participate in research for various reasons, including increased awareness of privacy issues, has decreased coverage for population studies in many countries. Generally, participation is higher among those concerned about the exposure/disease of interest.
257. In record-based studies, radiation dose estimates are not based on information obtained from each study subject, but on area-based or other group-level dose estimates. The validity of such estimates hinges on the homogeneity of dose distribution within the child’s everyday sphere, including occupancy and variability of exposure within an area. Exposure can vary substantially in a child’s environment. Systematic differences due not only to residential location, but also to other features such as shielding by building structures/material as a source of background radiation should also be considered for accurate exposure assessment. A key problem with area-based dose estimates is that they cannot take account of inter-house variation in the way that direct measurements do. Unfortunately, the feasibility of individual measurements in thousands of houses is limited by prohibitive cost and, furthermore, incomplete participation tends to introduce bias.
258. In the United Kingdom record-based study, if dose distribution is fairly uniform within a county district (a county consists of up to seven county districts), and the child’s sphere of daily life corresponds to that of the district, individual dose represented by county-district-specific average doses can be reasonably accurate. In the Swiss study, investigators used 2 km × 2 km grids to represent the sphere of children’s everyday life. Although a smaller area is more likely to have more homogeneous dose distribution, the actual sphere of everyday life is likely to extend beyond the specified area.
259. Theoretically, if the frequency of medical exposure such as CT imaging is associated with natural background gamma-radiation exposure, medical exposure would cause exposure misclassification. However, such associations seem unlikely, and medical exposure of RBM is unlikely to be large enough to affect risk per dose unit in the studies reviewed here.
260. Studies of childhood leukaemia relied largely on area-based measurements for exposure assessment. The size of the area varied (mapped grid data with 2 km × 2 km in the Swiss study and 8 km ×8 km in the Finnish study to administrative units of varying sizes in the United Kingdom and French studies), with presumably larger errors for larger area units. The measurement data included outdoor dose-rate measurements (Swiss and Finnish studies) and surveys of residential (UKCCS, N=2,283) or other buildings (France, N>17,000). The coverage of residential history also ranged from
146 UNSCEAR 2017 REPORT
only the place of residence at diagnosis (France) or birth (UKCCS) to the entire residential history (Finland). In several studies, approximately half of the children had lived in more than one dwelling. The details of the type of building affecting shielding and also building material as a source of radiation were incorporated only in the Finnish study. The directly ionizing component of cosmic radiation was incorporated in the measurements, but only terrestrial radiation was used in the analyses in some studies. In addition, fallout from Chernobyl was taken into account in the Swiss and Finnish studies (the exposure levels from Chernobyl were lower in France and in the UKCCS). All studies with area-based measures assumed a similar occupancy for all subjects and ignored exposure at other places such as kindergartens and schools. No data on medical exposure were obtained in these studies though, overall, the dose from CT and other diagnostic procedures is likely to be substantially lower than that from environmental gamma radiation. Radon causes also some dose to the RBM but it was evaluated only in the UKCCS and the Swiss study. Other sources of radiation exposure (missed doses) are likely to result in some non-differential exposure misclassification with possibly minor bias toward the null, assuming that other exposure is uncorrelated with background gamma radiation. For radon, this is, however, questionable, as radon tends to be correlated with other geogenic radionuclides but RBM doses are substantially lower than those from background gamma radiation. Only one study (UKCCS) was able to obtain direct measurements of natural background gamma radiation at individual level (with only one residence measured per subject, the residence at diagnosis or equivalent for controls), but participation was incomplete and compliance was lower among controls than cases, which raised concerns of possible selection bias.
261. Potential confounding factors include the well-established risk factors for childhood leukaemia such as some congenital conditions, including Down’s syndrome (21 trisomy) and some rare hereditary diseases (ataxia telangiectasia, Fanconi anaemia, Bloom syndrome) [B10, M2]. Boys have slightly higher rates than girls, heavy birth weight is associated with a slightly increased risk for Caucasian than children of other ethnicities [M3, R4]. In addition, older parental age is associated with higher risk [S7]. Parental benzene and insecticide exposure and child’s exposure to pesticides are also suspected risk factors [B1, C2, Z7]. Extremely low frequency electromagnetic fields have also been consistently associated with elevated risk in epidemiological studies [A2, K6]. Higher SES has been associated with higher childhood leukaemia risk in several studies, though the results have not been consistent across countries and study types [P9]. Furthermore, the effects of several risk factors differ between lymphocytic and myelocytic leukaemia.
262. The Finnish and Swiss record-based studies obtained individual information from birth registries, population census, and other sources, enabling them to adjust for potential confounders such as birth order and maternal smoking. Several studies had area-based measures of SES and the Swiss and French studies included data on some environmental exposure, such as residential proximity to major traffic arteries, power lines and nuclear installations However, none of the studies had information on parental occupational exposures or children’s day breast feeding, allergies or care attendance or pesticide exposure. Lack of comprehensive adjustment for potential confounders indicates possibility of confounding, assuming that other exposure sources are correlated with natural background radiation.
263. The importance of adjustment for deprivation as an area-based measure of SES is frequently pointed out. In the UKCCS, similar to the Swiss study [R8, R9], mean dose rates were higher in children classified in lower socioeconomic categories [K4, K5]. In the UKCCS, deprivation was also positively related to annual dose [U1].
264. The direction of bias is difficult to predict in a particular study, as it depends on the correlation between the confounder and radiation exposure. Nevertheless, it is important to collect information on confounding factors and adjust for them in the risk analysis if needed. Other key issues in evaluation of confounding are the effect magnitude of the confounder and its frequency of occurrence (or
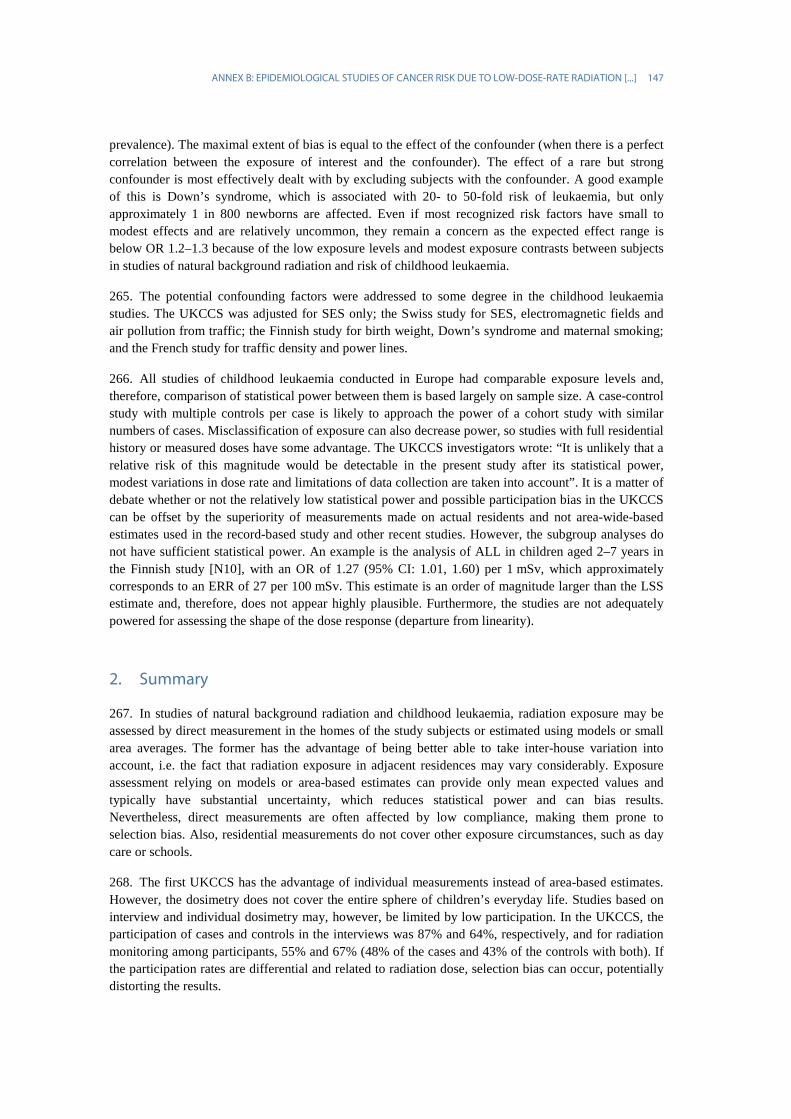
ANNEX B: EPIDEMIOLOGICAL STUDIES OF CANCER RISK DUE TO LOW-DOSE-RATE RADIATION [...] 147
prevalence). The maximal extent of bias is equal to the effect of the confounder (when there is a perfect correlation between the exposure of interest and the confounder). The effect of a rare but strong confounder is most effectively dealt with by excluding subjects with the confounder. A good example of this is Down’s syndrome, which is associated with 20- to 50-fold risk of leukaemia, but only approximately 1 in 800 newborns are affected. Even if most recognized risk factors have small to modest effects and are relatively uncommon, they remain a concern as the expected effect range is below OR 1.2–1.3 because of the low exposure levels and modest exposure contrasts between subjects in studies of natural background radiation and risk of childhood leukaemia.
265. The potential confounding factors were addressed to some degree in the childhood leukaemia studies. The UKCCS was adjusted for SES only; the Swiss study for SES, electromagnetic fields and air pollution from traffic; the Finnish study for birth weight, Down’s syndrome and maternal smoking; and the French study for traffic density and power lines.
266. All studies of childhood leukaemia conducted in Europe had comparable exposure levels and, therefore, comparison of statistical power between them is based largely on sample size. A case-control study with multiple controls per case is likely to approach the power of a cohort study with similar numbers of cases. Misclassification of exposure can also decrease power, so studies with full residential history or measured doses have some advantage. The UKCCS investigators wrote: “It is unlikely that a relative risk of this magnitude would be detectable in the present study after its statistical power, modest variations in dose rate and limitations of data collection are taken into account”. It is a matter of debate whether or not the relatively low statistical power and possible participation bias in the UKCCS can be offset by the superiority of measurements made on actual residents and not area-wide-based estimates used in the record-based study and other recent studies. However, the subgroup analyses do not have sufficient statistical power. An example is the analysis of ALL in children aged 2–7 years in the Finnish study [N10], with an OR of 1.27 (95% CI: 1.01, 1.60) per 1 mSv, which approximately corresponds to an ERR of 27 per 100 mSv. This estimate is an order of magnitude larger than the LSS estimate and, therefore, does not appear highly plausible. Furthermore, the studies are not adequately powered for assessing the shape of the dose response (departure from linearity).
2. Summary
267. In studies of natural background radiation and childhood leukaemia, radiation exposure may be assessed by direct measurement in the homes of the study subjects or estimated using models or small area averages. The former has the advantage of being better able to take inter-house variation into account, i.e. the fact that radiation exposure in adjacent residences may vary considerably. Exposure assessment relying on models or area-based estimates can provide only mean expected values and typically have substantial uncertainty, which reduces statistical power and can bias results. Nevertheless, direct measurements are often affected by low compliance, making them prone to selection bias. Also, residential measurements do not cover other exposure circumstances, such as day care or schools.
268. The first UKCCS has the advantage of individual measurements instead of area-based estimates. However, the dosimetry does not cover the entire sphere of children’s everyday life. Studies based on interview and individual dosimetry may, however, be limited by low participation. In the UKCCS, the participation of cases and controls in the interviews was 87% and 64%, respectively, and for radiation monitoring among participants, 55% and 67% (48% of the cases and 43% of the controls with both). If the participation rates are differential and related to radiation dose, selection bias can occur, potentially distorting the results.
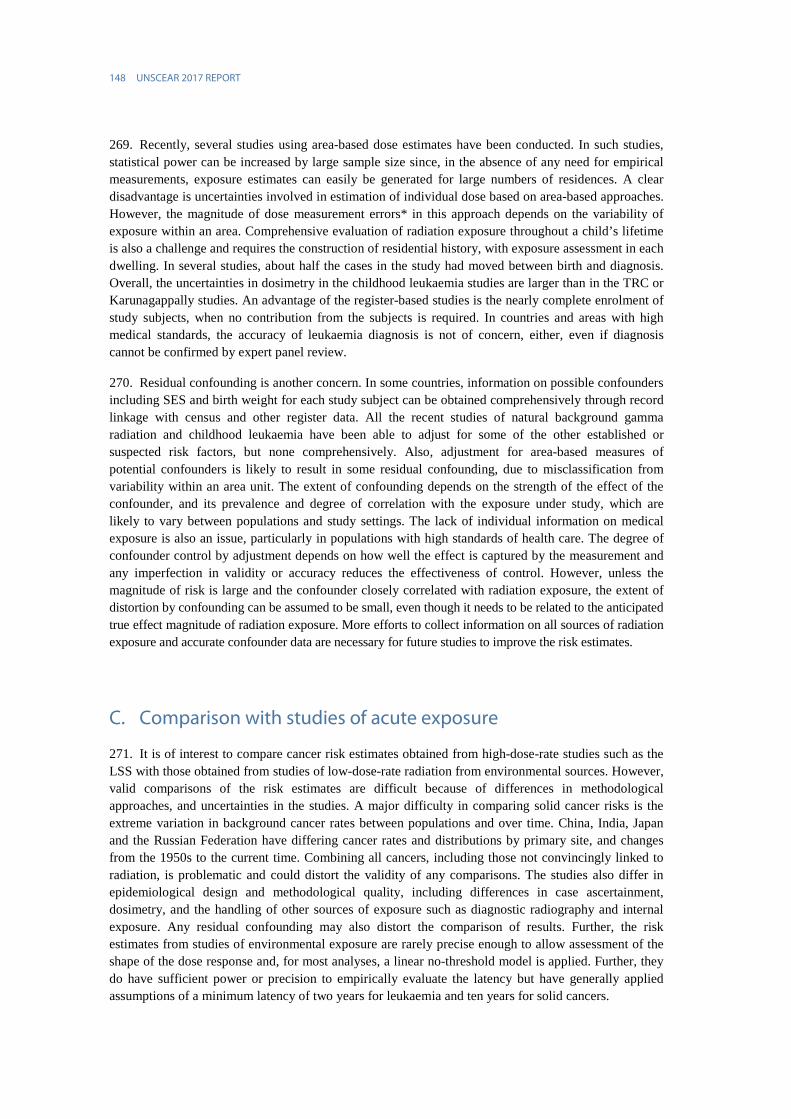
148 UNSCEAR 2017 REPORT
269. Recently, several studies using area-based dose estimates have been conducted. In such studies, statistical power can be increased by large sample size since, in the absence of any need for empirical measurements, exposure estimates can easily be generated for large numbers of residences. A clear disadvantage is uncertainties involved in estimation of individual dose based on area-based approaches. However, the magnitude of dose measurement errors* in this approach depends on the variability of exposure within an area. Comprehensive evaluation of radiation exposure throughout a child’s lifetime is also a challenge and requires the construction of residential history, with exposure assessment in each dwelling. In several studies, about half the cases in the study had moved between birth and diagnosis. Overall, the uncertainties in dosimetry in the childhood leukaemia studies are larger than in the TRC or Karunagappally studies. An advantage of the register-based studies is the nearly complete enrolment of study subjects, when no contribution from the subjects is required. In countries and areas with high medical standards, the accuracy of leukaemia diagnosis is not of concern, either, even if diagnosis cannot be confirmed by expert panel review.
270. Residual confounding is another concern. In some countries, information on possible confounders including SES and birth weight for each study subject can be obtained comprehensively through record linkage with census and other register data. All the recent studies of natural background gamma radiation and childhood leukaemia have been able to adjust for some of the other established or suspected risk factors, but none comprehensively. Also, adjustment for area-based measures of potential confounders is likely to result in some residual confounding, due to misclassification from variability within an area unit. The extent of confounding depends on the strength of the effect of the confounder, and its prevalence and degree of correlation with the exposure under study, which are likely to vary between populations and study settings. The lack of individual information on medical exposure is also an issue, particularly in populations with high standards of health care. The degree of confounder control by adjustment depends on how well the effect is captured by the measurement and any imperfection in validity or accuracy reduces the effectiveness of control. However, unless the magnitude of risk is large and the confounder closely correlated with radiation exposure, the extent of distortion by confounding can be assumed to be small, even though it needs to be related to the anticipated true effect magnitude of radiation exposure. More efforts to collect information on all sources of radiation exposure and accurate confounder data are necessary for future studies to improve the risk estimates.
C. Comparison with studies of acute exposure
271. It is of interest to compare cancer risk estimates obtained from high-dose-rate studies such as the LSS with those obtained from studies of low-dose-rate radiation from environmental sources. However, valid comparisons of the risk estimates are difficult because of differences in methodological approaches, and uncertainties in the studies. A major difficulty in comparing solid cancer risks is the extreme variation in background cancer rates between populations and over time. China, India, Japan and the Russian Federation have differing cancer rates and distributions by primary site, and changes from the 1950s to the current time. Combining all cancers, including those not convincingly linked to radiation, is problematic and could distort the validity of any comparisons. The studies also differ in epidemiological design and methodological quality, including differences in case ascertainment, dosimetry, and the handling of other sources of exposure such as diagnostic radiography and internal exposure. Any residual confounding may also distort the comparison of results. Further, the risk estimates from studies of environmental exposure are rarely precise enough to allow assessment of the shape of the dose response and, for most analyses, a linear no-threshold model is applied. Further, they do have sufficient power or precision to empirically evaluate the latency but have generally applied assumptions of a minimum latency of two years for leukaemia and ten years for solid cancers.

ANNEX B: EPIDEMIOLOGICAL STUDIES OF CANCER RISK DUE TO LOW-DOSE-RATE RADIATION [...] 149
272. Cancer risk from radiation is not consistent across population subgroups, but depends on sex, age at exposure and other factors. Such patterns of variation (effect modification) provide an opportunity to examine the consistency of findings across studies and this is particularly important for studies of low doses, where the extent of effects is small and results can be unstable due to statistical uncertainty reflecting small numbers of radiation-induced cancers. However, expecting complete consistency may not be justified, because risk patterns may depend on dose or dose rate (differences may reflect real variation of effect). The complexity is further increased by the fact that such patterns of variation in risk may differ across cancer sites and types. Even if the cancer types most easily induced by radiation may be consistent across populations, differences in the underlying risk and demographic features may affect the sites for which an excess can be observed. Results based on different cancer types combined into a single category such as solid cancers are not always comparable because, in different studies, the aggregate risk estimate is composed of different proportions of specific cancer sites (reflecting variation in baseline risks). As pointed out earlier in the Committee’s UNSCEAR 2000 Report [U6], comparison across studies can be difficult if background rates and modifying factors such as demographic factors differ between studies.
273. Studies on residents in HNBR areas provide opportunities to examine health risks in relation to low-dose-rate exposure to low-LET radiation. For example, despite lack of significant excess risk, the risk estimates from the Karunagappally in Kerala, India and the Yangjiang, China studies are compatible with the LSS results, although they can exclude only very high risks or strong protective effects due to their wide margin of uncertainty (figure VIII).
Figure VIII. Relative risks comparison of the LSS [P16] with the Karunagappally [N4] and the Yangjiang [T3] studies
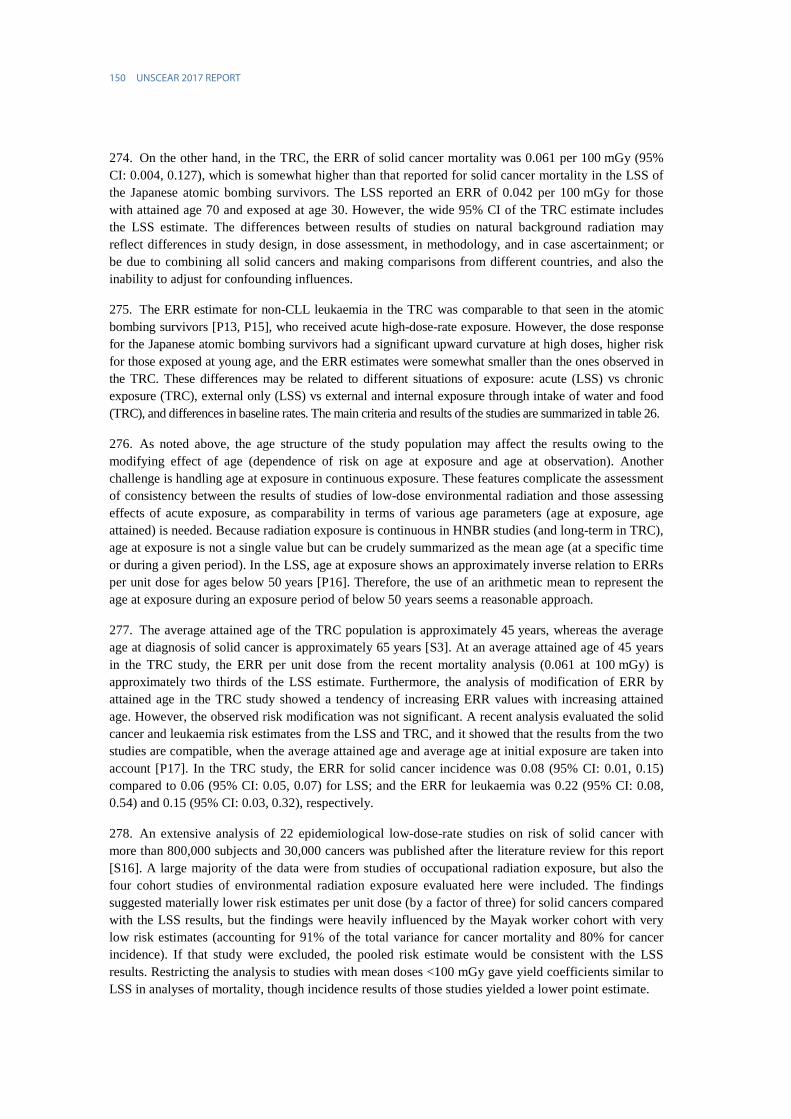
150 UNSCEAR 2017 REPORT
274. On the other hand, in the TRC, the ERR of solid cancer mortality was 0.061 per 100 mGy (95% CI: 0.004, 0.127), which is somewhat higher than that reported for solid cancer mortality in the LSS of the Japanese atomic bombing survivors. The LSS reported an ERR of 0.042 per 100 mGy for those with attained age 70 and exposed at age 30. However, the wide 95% CI of the TRC estimate includes the LSS estimate. The differences between results of studies on natural background radiation may reflect differences in study design, in dose assessment, in methodology, and in case ascertainment; or be due to combining all solid cancers and making comparisons from different countries, and also the inability to adjust for confounding influences.
275. The ERR estimate for non-CLL leukaemia in the TRC was comparable to that seen in the atomic bombing survivors [P13, P15], who received acute high-dose-rate exposure. However, the dose response for the Japanese atomic bombing survivors had a significant upward curvature at high doses, higher risk for those exposed at young age, and the ERR estimates were somewhat smaller than the ones observed in the TRC. These differences may be related to different situations of exposure: acute (LSS) vs chronic exposure (TRC), external only (LSS) vs external and internal exposure through intake of water and food (TRC), and differences in baseline rates. The main criteria and results of the studies are summarized in table 26.
276. As noted above, the age structure of the study population may affect the results owing to the modifying effect of age (dependence of risk on age at exposure and age at observation). Another challenge is handling age at exposure in continuous exposure. These features complicate the assessment of consistency between the results of studies of low-dose environmental radiation and those assessing effects of acute exposure, as comparability in terms of various age parameters (age at exposure, age attained) is needed. Because radiation exposure is continuous in HNBR studies (and long-term in TRC), age at exposure is not a single value but can be crudely summarized as the mean age (at a specific time or during a given period). In the LSS, age at exposure shows an approximately inverse relation to ERRs per unit dose for ages below 50 years [P16]. Therefore, the use of an arithmetic mean to represent the age at exposure during an exposure period of below 50 years seems a reasonable approach.
277. The average attained age of the TRC population is approximately 45 years, whereas the average age at diagnosis of solid cancer is approximately 65 years [S3]. At an average attained age of 45 years in the TRC study, the ERR per unit dose from the recent mortality analysis (0.061 at 100 mGy) is approximately two thirds of the LSS estimate. Furthermore, the analysis of modification of ERR by attained age in the TRC study showed a tendency of increasing ERR values with increasing attained age. However, the observed risk modification was not significant. A recent analysis evaluated the solid cancer and leukaemia risk estimates from the LSS and TRC, and it showed that the results from the two studies are compatible, when the average attained age and average age at initial exposure are taken into account [P17]. In the TRC study, the ERR for solid cancer incidence was 0.08 (95% CI: 0.01, 0.15) compared to 0.06 (95% CI: 0.05, 0.07) for LSS; and the ERR for leukaemia was 0.22 (95% CI: 0.08, 0.54) and 0.15 (95% CI: 0.03, 0.32), respectively.
278. An extensive analysis of 22 epidemiological low-dose-rate studies on risk of solid cancer with more than 800,000 subjects and 30,000 cancers was published after the literature review for this report [S16]. A large majority of the data were from studies of occupational radiation exposure, but also the four cohort studies of environmental radiation exposure evaluated here were included. The findings suggested materially lower risk estimates per unit dose (by a factor of three) for solid cancers compared with the LSS results, but the findings were heavily influenced by the Mayak worker cohort with very low risk estimates (accounting for 91% of the total variance for cancer mortality and 80% for cancer incidence). If that study were excluded, the pooled risk estimate would be consistent with the LSS results. Restricting the analysis to studies with mean doses <100 mGy gave yield coefficients similar to LSS in analyses of mortality, though incidence results of those studies yielded a lower point estimate.

A
NN
EX B: EPIDEM
IOLO
GICA
L STUD
IES OF CA
NCER RISK D
UE TO
LOW
-DO
SE-RATE RAD
IATIO
N [...]
151
Table 26. Summary of the main criteria of studies on cancer risk from low dose and dose rate from environmental sources in comparison with the LSS
Criteria Techa River Cohort
[D5, K18, S3]
Taiwan, China 60Co-contaminated buildings
[H8, H10, H11]
Yangjiang, China [T3]
Karunagappally, India [N4]
Atomic bombing survivors study, LSS [G7, H9]
Size of study population 29 730 (mortality),
17 435 (incidence)
6 242 31 604 69 958 80 205 (incidence)
Median dose, mGy 43 (stomach) 6.3 85 (colon) 161 (colon) 230 (colon)
Typical annual dose Peak 10–20 mGy a−1,
<10 mGy a−1 after 1955 (stomach)
<5 mGy a−1 ~2 mGy a−1 external 2–5 mGy a−1 Instantaneous exposure
Solid cancer cases 1 933 incident cases, 2 303 deaths 106 incident cases 956 deaths 1 349 incident cases 22 538 incident cases
Solid cancer ERR/100 mGy (95% CI)
Incidence 0.08 (0.01, 0.15)
Mortality 0.06 (0.004, 0.12)
0.03 (−0.04, 0.09) −0.10 (−0.25, 0.10) −0.01 (−0.06, 0.05) Incidence 0.047 (0.039, 0.055)
Leukaemia cases (non-CLL) 99 (72) incident cases 6 incident cases 15 deaths 30 (20) incident cases 416 incident cases (other than CLL or adult T-cell leukaemia)
Mean RBM dose, mGy 420 48 (whole-body dose, not RBM) 107 163 100
Leukaemia ERR/100 mGy 0.12 (0.04, 0.25) all leukaemias,
0.22 (0.08, 0.54) non-CLL
0.19 (0.01, 0.31) 1.1 (<0, ∞) 0.6 (not defined, 34) 0.08 (0.003, 0.18) linear component,
0.01 (0.03, 0.18) quadratic component, incidence
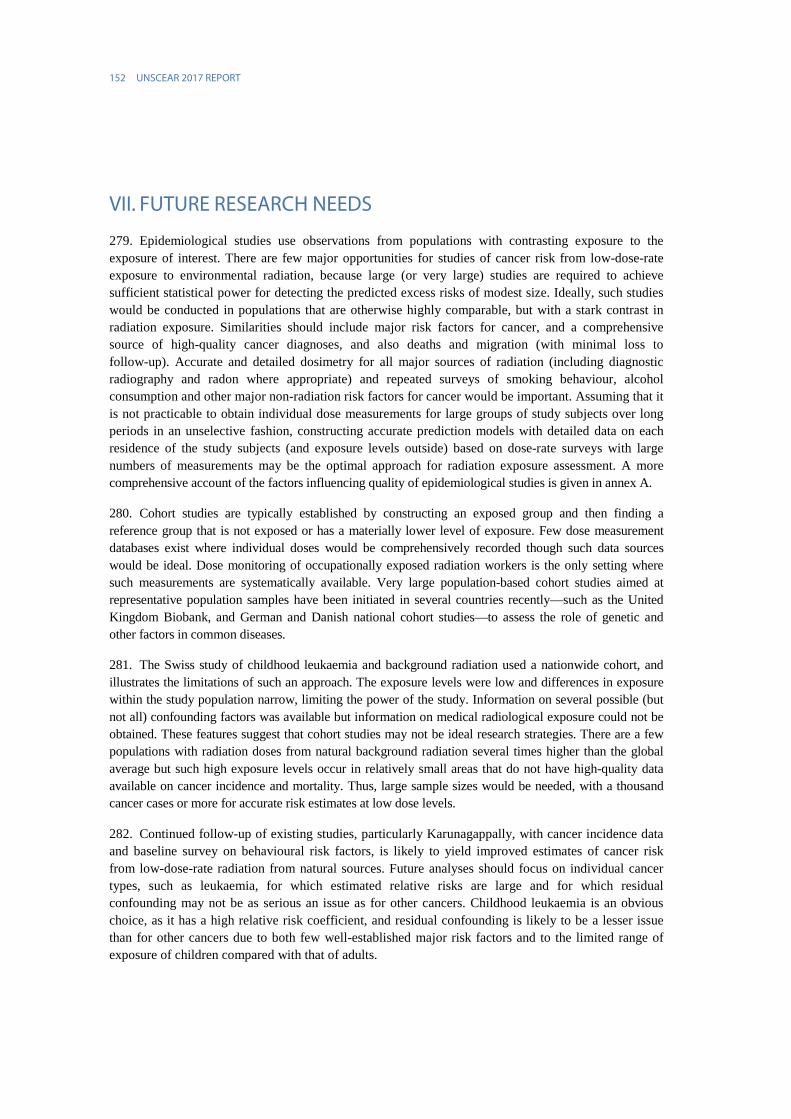
152 UNSCEAR 2017 REPORT
VII. FUTURE RESEARCH NEEDS
279. Epidemiological studies use observations from populations with contrasting exposure to the exposure of interest. There are few major opportunities for studies of cancer risk from low-dose-rate exposure to environmental radiation, because large (or very large) studies are required to achieve sufficient statistical power for detecting the predicted excess risks of modest size. Ideally, such studies would be conducted in populations that are otherwise highly comparable, but with a stark contrast in radiation exposure. Similarities should include major risk factors for cancer, and a comprehensive source of high-quality cancer diagnoses, and also deaths and migration (with minimal loss to follow-up). Accurate and detailed dosimetry for all major sources of radiation (including diagnostic radiography and radon where appropriate) and repeated surveys of smoking behaviour, alcohol consumption and other major non-radiation risk factors for cancer would be important. Assuming that it is not practicable to obtain individual dose measurements for large groups of study subjects over long periods in an unselective fashion, constructing accurate prediction models with detailed data on each residence of the study subjects (and exposure levels outside) based on dose-rate surveys with large numbers of measurements may be the optimal approach for radiation exposure assessment. A more comprehensive account of the factors influencing quality of epidemiological studies is given in annex A.
280. Cohort studies are typically established by constructing an exposed group and then finding a reference group that is not exposed or has a materially lower level of exposure. Few dose measurement databases exist where individual doses would be comprehensively recorded though such data sources would be ideal. Dose monitoring of occupationally exposed radiation workers is the only setting where such measurements are systematically available. Very large population-based cohort studies aimed at representative population samples have been initiated in several countries recently—such as the United Kingdom Biobank, and German and Danish national cohort studies—to assess the role of genetic and other factors in common diseases.
281. The Swiss study of childhood leukaemia and background radiation used a nationwide cohort, and illustrates the limitations of such an approach. The exposure levels were low and differences in exposure within the study population narrow, limiting the power of the study. Information on several possible (but not all) confounding factors was available but information on medical radiological exposure could not be obtained. These features suggest that cohort studies may not be ideal research strategies. There are a few populations with radiation doses from natural background radiation several times higher than the global average but such high exposure levels occur in relatively small areas that do not have high-quality data available on cancer incidence and mortality. Thus, large sample sizes would be needed, with a thousand cancer cases or more for accurate risk estimates at low dose levels.
282. Continued follow-up of existing studies, particularly Karunagappally, with cancer incidence data and baseline survey on behavioural risk factors, is likely to yield improved estimates of cancer risk from low-dose-rate radiation from natural sources. Future analyses should focus on individual cancer types, such as leukaemia, for which estimated relative risks are large and for which residual confounding may not be as serious an issue as for other cancers. Childhood leukaemia is an obvious choice, as it has a high relative risk coefficient, and residual confounding is likely to be a lesser issue than for other cancers due to both few well-established major risk factors and to the limited range of exposure of children compared with that of adults.
ANNEX B: EPIDEMIOLOGICAL STUDIES OF CANCER RISK DUE TO LOW-DOSE-RATE RADIATION [...] 153
283. Pooling data from several studies conducted using comparable methods and data sources provides one possibility of improving the precision of risk estimates. As stated in annex A, pooling data in a meta-analysis requires compatibility of the studies, which is best ensured by using a joint protocol or, at the very least, being able to construct a minimum set of key data that are comparable across studies. Pooled analysis* of individual-level data often provides the best comparability and, hence, most uniform synthesis of study results with evaluation of dose response, which is a key objective in any study aimed at radiation risk estimation.
284. Taking this information into account, the Committee concluded that key challenges for future research could be summarized as:
− Improving individual dose estimates from all sources of exposure;
− Ensuring comprehensive and high-quality cancer registration;
− Enhancing tracing of loss to follow-up through death or migration in cohort studies;
− Improving control of confounding by key non-radiation risk factors;
− Developing and implementing improved methods (with user-friendly software) for accommodating the impact of non-sampling errors, such as dosimetric uncertainties and residual confounding, in risk estimates and hypothesis testing results.
VIII. CONCLUSIONS
285. This annex evaluated epidemiological studies reporting cancer risk per unit dose on the basis of individual cumulative doses from exposure to low-LET radiation from environmental sources. Inherent limitations of epidemiological studies impede the precision of direct estimates in the very low dose range. Nonetheless, studies of populations exposed to low-dose-rate radiation accumulating to levels, where observable effects are anticipated, are highly valuable. The TRC study has demonstrated dose-dependent increases in occurrence of solid cancer and leukaemia, though associations with radiation exposure were also found for cancer types that have not been commonly increased following radiation exposure in other studies. No discernible increases were reported for solid cancer or leukaemia in the Karunagappally or Yangjiang HNBR studies, though the low precision of the risk estimates does not rule out either absence of an excess risk of cancer or substantially higher risks per dose unit than those reported in high-dose and dose-rate studies.
286. The five childhood leukaemia studies, except for the French GEOCAP-study, give largely consistent, though not highly precise estimates of ERR per unit dose in the low dose range. However, since the confidence intervals are wide, it is difficult to confirm whether the ERR per unit dose is similar to estimates obtained from studies of acute exposure such as the LSS.
287. Overall, the results of the studies of cancer risk due to radiation exposure at low dose rates from environmental radiation do not provide strong evidence for materially lower risks per unit exposure than in studies of high radiation doses and dose rates, though the findings are consistent with a range of risk estimates. The current results warrant a cautious interpretation of the magnitude of cancer risk per unit radiation exposure at low dose rates from environmental sources. The studies reviewed here have shortcomings, such as small sample size and methodological weaknesses that limit the conjectures/ conclusions that can be drawn from their results. In the future, nested case-control studies within these

154 UNSCEAR 2017 REPORT
cohorts may be able to overcome some of the limitations. Longer follow-up with larger numbers of cases can be expected to improve the precision of the results.
288. For solid cancer, the risk estimates from the three major studies in China, India and the Russian Federation can be regarded as consistent with each other due to large uncertainty partly related to statistical imprecision, even if no increases in cancer rates could be demonstrated in HNBR studies, unlike the TRC study. Dose estimation is always a major challenge in studies of environmental radiation exposure, because it often requires retrospective reconstruction of residential history, occupancy, and for internal exposure, amounts and sources of food and water intake. This is particularly demanding when exposure levels have changed markedly over time, as in the Techa River region. Hence, in addition to low statistical power due to the limited sample size relative to the anticipated magnitude of effect, further uncertainty stems from exposure measurement error that is often not accounted for in the analysis. This can distort the results and, therefore, realistic estimation of the amount of measurement error is important, particularly when it can be assumed to be substantial. The TRC study is the only one that has yielded a precise estimate also for adult leukaemia and incorporated information on the health effects from internal exposure. It should be noted that the nature of exposure in the TRC study is different from that of the Karunagappally and Yangjiang studies. In the TRC study, maximum internal and external exposure took place over one to two decades and decreased materially with time, while the exposure in the two other studies was mainly external and lifelong.
289. Previous studies—including those on the Japanese survivors of the atomic bombings, and also medical and occupational exposures—show that some cancer types are more strongly associated with radiation exposure than others. In the LSS, for example, the ERR per unit dose after childhood exposure is materially higher for leukaemia than for solid cancers. Similarly, the ERR per unit dose for thyroid cancer in those exposed in childhood is materially higher than for other solid cancers. Although the differences in risk estimates between solid cancer types are less striking in those exposed in adulthood, there is major uncertainty in using a single estimates for all solid cancers combined for comparisons across studies, because the background rates of various cancer types differ strongly across populations (for instance China, India and the Russian Federation) and the proportion of a cancer site of all cancers affects the weight it has in the risk estimate for all cancers combined. Therefore, combining all cancer types could result in mixing differing dose responses for various cancer types, with dissimilar composition of the combined category of all cancer types between the study populations. All solid cancers combined comprise malignancies with different aetiology and risk coefficients per unit radiation dose (including some that are not consistently linked to radiation) and, therefore, the estimates obtained for risk coefficients of all solid cancers can differ between studies for these reasons alone. Differences in radiation-related risk estimates across studies may also be due to the variations in risk modifiers such as age, sex, and behavioural (e.g. tobacco and alcohol use) and genetic factors. Focusing on specific cancer types would result in better comparability between studies and should be pursued, although small numbers are likely to pose problems of interpretation.
290. Radiation exposure at low dose rates typically, although not necessarily, results in low doses and, therefore, risk estimation can be readily affected by confounding from other cancer risk factors. This is an essential challenge in trying to detect a very small radiation effect from low doses against a sizable background rate. This may add to the differences between study results, because the prevalence of confounders and their association with radiation exposure can vary. Also, inaccuracy in assessing confounders leads to poorer ability to control for their effects. An analysis accounting for the effects of confounders also sets requirements for sample size in a study, which in itself might be constrained when the entire exposed population is studied and cannot be increased. Precise and valid risk estimates require sufficient follow-up, case ascertainment through high-quality cancer registry systems, and accurate information on risk factors other than radiation exposure. This emphasizes the need for prospective long-term follow-up studies with high-quality dosimetry and accurate outcome data.
ANNEX B: EPIDEMIOLOGICAL STUDIES OF CANCER RISK DUE TO LOW-DOSE-RATE RADIATION [...] 155
291. In conclusion, the Committee recognizes that studies of low-dose-rate exposure from environmental sources have potential to make a contribution to understanding radiation-induced cancer risk. Direct evidence from such studies would be valuable because most radiation exposure in the general population is obtained from low doses received over extended periods. However, improvements would be needed to overcome the key limitations of these studies including low statistical power, dosimetric uncertainties, imperfections in control of confounding, and any other biases. Studies of low-dose-rate exposure are more susceptible to such limitations than studies of high dose exposure. Differences in results of environmental radiation exposure studies may be due to problems in study quality, including bias from under-ascertainment of cases (deaths or diagnoses), inaccurate cancer diagnosis, imprecise dose assessment, and residual confounding. Further improvement in the quality of such epidemiological studies could be achieved by improving the quality of clinical cancer diagnoses and cancer registries, collecting accurate data on risk factors for specific cancer types and causes of death, and improving dose estimation, to obtain reliable ERR estimates for specific cancer types and population subgroups.
ACKNOWLEDGEMENTS
The Committee wishes to acknowledge with gratitude the work of the consultants and the Expert Group on Epidemiological Quality involved in preparing this annex and especially J. Boice (United States) for critically reviewing the manuscript. In particular, the Committee would like to thank A. Auvinen and H. Zeeb (consultants), who elaborated this annex based on a draft prepared by S. Akiba (Japan). The views expressed in the annex remain those of the Committee and do not necessarily represent the views of individual experts, the United Nations or its Member States.
Members of the Expert Group on Epidemiological Quality
P. Smeesters (Belgium); Q. Sun (China); A. Auvinen and S. Salomaa (Finland); W.-U. Müller, R. Michel and H. Zeeb (Germany); S. Akiba, K. Kodama and S. Saigusa (Japan); M. Tirmarche (France), A. Akleyev and V. Ivanov (Russian Federation); R. Wakeford (United Kingdom); and J. Boice, A. Bouville, B. Napier, D. Pawel and R. Shore (United States).


ANNEX B: EPIDEMIOLOGICAL STUDIES OF CANCER RISK DUE TO LOW-DOSE-RATE RADIATION [...] 157
REFERENCES
A1 Abylkassimova, Z., B. Gusev, B. Grosche et al. Nested case-control study of leukemia among a cohort of persons exposed to ionizing radiation from nuclear weapon tests in Kazakhstan (1949-1963). Ann Epidemiol 10(7): 479 (2000).
A2 Ahlbom, A., N. Day, M. Feychting et al. A pooled analysis of magnetic fields and childhood leukaemia. Br J Cancer 83(5): 692-698 (2000).
A3 Ainsbury, E.A., J. Moquet, K. Rothkamm et al. What radiation dose does the FISH translocation assay measure in cases of incorporated radionuclides for the Southern Urals populations? Radiat Prot Dosim 159(1-4): 26-33 (2014).
A4 Akhmad, Y.R. and Y. Nakashima. The absorbed dose in air of photons generated from secondary cosmic-rays at sea-level at Nagoya, Japan. Radiat Prot Dosim 58(1): 47-51 (1995).
A5 Akleyev, A.V., M.M. Kossenko, L.A. Silkina et al. Health-effects of radiation incidents in the Southern Urals. Stem Cells 13: 58-68 (1995).
A6 Akleyev, A.V. Ecological and Health Effects of the Radiation Accident of 1957 at the Mayak PA. Medbioextrem, Moscow, 2001. (Russian).
A7 Akleyev, A.V. Medical-Biological and Ecological Impacts of Radioactive Contamination of the Techa River. Medbioextrem, Moscow, 2001. (Russian).
A8 Akleyev, A.V. and M.F. Kisselyov. Medical-Biological and Ecological Impacts of Radioactive Contamination of the Techa River. FREGAT, Chelyabinsk, 2002.
A9 Akleyev, A.V., G.A. Veremeeva and A.V. Vozilova. [Remote effects at cell and subcell level in the hemopoietic system after chronic radiation exposure in man]. Radiats Biol Radioecol 46(5): 519-526 (2006). (Russian).
A10 Akleyev, A.V., L.Y. Krestinina, D.L. Preston et al. Radiogenic risk of malignant neoplasms for Techa riverside residents. Medical Radiology and Radiation Safety (Meditsinskaya Radiologiia I Radiatsionnaia Bezopasnost) 53(6): 5-26 (2008). (Russian).
A11 Alexandrov, A.P., G.V. Mishenkov, N.Y. Tarasenko et al. Report of the First Central Directorate Committee under the guidance of Alexandrov, A.P. concerning contamination of the territory adjacent to Mendeleyev Plant (1951). Radiation Safety Problems (Mayak Production Association Scientific Journal) (3): 60-74 (2006). (Russian).
A12 Alexandrov, A.P., G.V. Mishenkov, N.Y. Tarasenko et al. Report of the First Central Directorate Committee under the guidance of Alexandrov, A.P. concerning contamination of the territory adjacent to Mendeleyev Plant (1951). Radiation Safety Problems (Mayak Production Association Scientific Journal) (1): 50-62 (2007). (Russian).
A13 Allwright, S.P., P.A. Colgan, I.R. McAulay et al. Natural background radiation and cancer mortality in the Republic of Ireland. Int J Epidemiol 12(4): 414-418 (1983).
A14 Amaral, E.C.S., E.R.R. Rochedo, H.G. Paretzke et al. The radiological impact of agricultural activities in an area of high natural radioactivity. Radiat Prot Dosim 45(1-4): 289-292 (1992).
158 UNSCEAR 2017 REPORT
A15 Anjaria, K.B. and B.S. Rao. Chromosomal aberration analysis in chronically exposed radiation workers. J Environ Pathol Toxicol Oncol 23(3): 207-213 (2004).
A16 Arvela, H., H. Hyvönen, H. Lemmelä et al. Indoor and outdoor gamma radiation in Finland. Radiat Prot Dosim 59(1): 25-32 (1995).
A17 Atomic Energy Council. Contaminated rebars incident report. AEC-083-010201. Atomic Energy Council, Taipei, Republic of China, 1994.
A18 Auvinen, A., M. Hakama, H. Arvela et al. Fallout from Chernobyl and incidence of childhood leukaemia in Finland, 1976-92. Br Med J 309(6948): 151-154 (1994).
A19 Avramenko, M.I., A.N. Averin, E.G. Drozhko et al. Accident of 1957. The assessment of the explosion parameters and the analysis of the characteristics of the radioactive contamination of the territory. Radiation Safety Problems (Mayak Production Association Scientific Journal) 3: 18-28 (1997). (Russian).
A20 Axelson, O., M. Fredrikson, G. Akerblom et al. Leukemia in childhood and adolescence and exposure to ionizing radiation in homes built from uranium-containing alum shale concrete. Epidemiology 13(2): 146-150 (2002).
B1 Bailey, H.D., L. Fritschi, C. Infante-Rivard et al. Parental occupational pesticide exposure and the risk of childhood leukemia in the offspring: findings from the childhood leukemia international consortium. Int J Cancer 135(9): 2157-2172 (2014).
B2 Bakurov, A.S., G.N. Romanov and G.P. Shejn. Dynamics of radiation situation on East-Urals radioactive trace. Radiation Safety Problems (Mayak Production Association Scientific Journal) 4: 68-74 (1997). (Russian).
B3 Balakrishnan, S. and S.B. Rao. Cytogenetic analysis of peripheral blood lymphocytes of occupational workers exposed to low levels of ionising radiation. Mutat Res 442(1): 37-42 (1999).
B4 Balonov, M.I., G.Y. Bruk, V.Y. Golikov et al. Assessment of current exposure of the population living in the Techa River basin from radioactive releases of the Mayak facility. Health Phys 92(2): 134-147 (2007).
B5 Barbui, T., J. Thiele, A.M. Vannucchi et al. Rethinking the diagnostic criteria of polycythemia vera. Leukemia 28(6): 1191-1195 (2014).
B6 Barcinski, M.A., M. Do Ceu Abreu, J.C. De Almeida et al. Cytogenetic investigation in a Brazilian population living in an area of high natural radioactivity. Am J Hum Genet 27(6): 802-806 (1975).
B7 Barlow, L., K. Westergren, L. Holmberg et al. The completeness of the Swedish Cancer Register: a sample survey for year 1998. Acta Oncol 48(1): 27-33 (2009).
B8 Bauchinger, M., K. Salassidis, H. Braselmann et al. FISH-based analysis of stable translocations in a Techa River population. Int J Radiat Biol 73(6): 605-612 (1998).
B9 Bauer, S., B.I. Gusev, L.M. Pivina et al. Radiation exposure due to local fallout from Soviet atmospheric nuclear weapons testing in Kazakhstan: solid cancer mortality in the Semipalatinsk historical cohort, 1960-1999. Radiat Res 164(4 Pt 1): 409-419 (2005).
B10 Belson, M., B. Kingsley and A. Holmes. Risk factors for acute leukemia in children: a review. Environ Health Perspect 115(1): 138-145 (2007).
ANNEX B: EPIDEMIOLOGICAL STUDIES OF CANCER RISK DUE TO LOW-DOSE-RATE RADIATION [...] 159
B11 Bharatwal, D.S. and G.H. Vaze. Radiation dose measurements in the monazite areas of Kerala state in India, Volume 23. Proceedings of the Second International Conference on the Peaceful Uses of Atomic Energy. United Nations, NewYork, 1959.
B12 Bhatti, P., D.L. Preston, M.M. Doody et al. Retrospective biodosimetry among United States radiologic technologists. Radiat Res 167(6): 727-734 (2007).
B13 Billon, S., A. Morin, S. Caer et al. French population exposure to radon, terrestrial gamma and cosmic rays. Radiat Prot Dosim 113(3): 314-320 (2005).
B14 Boffetta, P., O. van der Hel, H. Norppa et al. Chromosomal aberrations and cancer risk: results of a cohort study from Central Europe. Am J Epidemiol 165(1): 36-43 (2007).
B15 Boice, J.D., Jr., J.H. Hendry, N. Nakamura et al. Low-dose-rate epidemiology of high background radiation areas. Radiat Res 173(6): 849-854 (2010).
B16 Bonassi, S., L. Hagmar, U. Stromberg et al. Chromosomal aberrations in lymphocytes predict human cancer independently of exposure to carcinogens. European Study Group on Cytogenetic Biomarkers and Health. Cancer Res 60(6): 1619-1625 (2000).
B17 Bougrov, N.G., H.Y. Goksu, E. Haskell et al. Issues in the reconstruction of environmental doses on the basis of thermoluminescence measurements in the Techa riverside. Health Phys 75(6): 574-583 (1998).
B18 Breithaupt, A. Neue krystallographische Bestimmung und mineralogische Charakteristik verschiedener Mineralspecien. II. Ueber den Monazit, eine neue Specie des Mineral-Reichs. Journal fuer Chemie und Physik 55: 301-303 (1829). (German).
B19 Breslow, N.E. and N.E. Day. Statistical methods in cancer research. Volume II--The design and analysis of cohort studies. IARC Sci Publ (82): 1-406 (1987).
B20 Brown, J.C. and A.K. Dey. India's Mineral Wealth. Oxford University Press, London, 1955.
C1 Campos, M.P., B.R. Pecequilo and B.P. Mazzilli. 222Rn and 212Pb exposures at a Brazilian spa. Radiat Prot Dosim 141(2): 210-214 (2010).
C2 Carlos-Wallace, F.M., L. Zhang, M.T. Smith et al. Parental, in utero, and early-life exposure to Benzene and the risk of childhood leukemia: a meta-analysis. Am J Epidemiol 183(1): 1-14 (2016).
C3 Chen, W.L., C.L. Taur, J.J. Tai et al. Chromosomal study in lymphocytes from subjects living or working in buildings constructed with radioactively contaminated rebar. Mutat Res 377(2): 247-254 (1997).
C4 Chen, W.L. Radiation surveys and dose equivalent assessments for 60Co-contaminated rebar buildings. Appl Radiat Isot 56(6): 901-906 (2002).
C5 Cheriyan, V.D., C.J. Kurien, B. Das et al. Genetic monitoring of the human population from high-level natural radiation areas of Kerala on the southwest coast of India. II. Incidence of numerical and structural chromosomal aberrations in the lymphocytes of newborns. Radiat Res 152(6 Suppl): S154-158 (1999).
C6 Cullen, T.L. A review of Brazilian investigations in areas of high natural radioactivity, Part I: Radiometric and dosimetric studies. pp.49-64 in: International Symposium on Areas of High Natural Radioactivity (T.L. Cullen and E. Penna Franca, eds.). Academia Brasileria de Ciencias, Rio de Janeiro, 1975.

160 UNSCEAR 2017 REPORT
D1 Danish Cancer Registry. Survey of Nordic Cancer Registries. Danish Cancer Society, Department of Cancer Prevention and Documentation, Copenhagen, 2000.
D2 Das, B. and C.V. Karuppasamy. Spontaneous frequency of micronuclei among the newborns from high level natural radiation areas of Kerala in the southwest coast of India. Int J Radiat Biol 85(3): 272-280 (2009).
D3 Das, B., D. Saini and M. Seshadri. Telomere length in human adults and high level natural background radiation. PLoS One 4(12): e8440 (2009).
D4 Das, B., D. Saini and M. Seshadri. No evidence of telomere length attrition in newborns from high level natural background radiation areas in Kerala coast, south west India. Int J Radiat Biol 88(9): 642-647 (2012).
D5 Davis, F.G., L.Y. Krestinina, D. Preston et al. Solid cancer incidence in the Techa river incident cohort: 1956-2007. Radiat Res 184(1): 56-65 (2015).
D6 Davis, S., K.J. Kopecky, T.E. Hamilton et al. Thyroid neoplasia, autoimmune thyroiditis, and hypothyroidism in persons exposed to iodine 131 from the Hanford nuclear site. J Am Med Assoc 292(21): 2600-2613 (2004).
D7 Degteva, M., N. Shagina, E. Tolstykh et al. Individual dose calculations with use of the revised Techa River Dosimetry System TRDS-2009D. Final report for milestone 22. Urals Research Center for Radiation Medicine and University of Utah, Chelyabinsk and Salt Lake City, 2009.
D8 Degteva, M.O., V.P. Kozheurov and M.I. Vorobiova. General approach to dose reconstruction in the population exposed as a result of the release of radioactive wastes into the Techa River. Sci Total Environ 142(1-2): 49-61 (1994).
D9 Degteva, M.O., V.P. Kozheurov, E.I. Tolstykh et al. The Techa River dosimetry system: methods for the reconstruction of internal dose. Health Phys 79(1): 24-35 (2000).
D10 Degteva, M.O., M.I. Vorobiova, V.P. Kozheurov et al. Dose reconstruction system for the exposed population living along the Techa River. Health Phys 78(5): 542-554 (2000).
D11 Degteva, M.O., L.R. Anspaugh, A.V. Akleyev et al. Electron paramagnetic resonance and fluorescence in situ hybridization-based investigations of individual doses for persons living at Metlino in the upper reaches of the Techa River. Health Phys 88(2): 139-153 (2005).
D12 Degteva, M.O., E.I. Tolstykh and M.I. Vorobiova. Techa River Dosimetry System: Current status and future. Radiation Safety Problems (Mayak Production Association Scientific Journal) 1: 66-80 (2006). (Russian).
D13 Degteva, M.O., M.I. Vorobiova, E.I. Tolstykh et al. Development of an improved dose reconstruction system for the Techa River population affected by the operation of the Mayak Production Association. Radiat Res 166(1 Pt 2): 255-270 (2006).
D14 Degteva, M.O., N.B. Shagina, E.I. Tolstykh et al. An approach to reduction of uncertainties in internal doses reconstructed for the Techa River population. Radiat Prot Dosim 127(1-4): 480-485 (2007).
D15 Degteva, M.O., N.B. Shagina, M.I. Vorobiova et al. Reconstruction of individual medical doses for members of the extended Techa River Cohort; final report for milestone 19. Urals Research Center for Radiation Medicine and University of Utah, Chelyabinsk and Salt Lake City, 2007.

ANNEX B: EPIDEMIOLOGICAL STUDIES OF CANCER RISK DUE TO LOW-DOSE-RATE RADIATION [...] 161
D16 Degteva, M.O., N.B. Shagina, M.I. Vorobiova et al. Reevaluation of waterborne releases of radioactive materials from the Mayak Production Association into the Techa River in 1949-1951. Health Phys 102(1): 25-38 (2012).
D17 Degteva, M.O., N.B. Shagina, E.A. Shishkina et al. Analysis of EPR and FISH studies of radiation doses in persons who lived in the upper reaches of the Techa River. Radiat Environ Biophys 54(4): 433-444 (2015).
D18 Demoury, C., F. Marquant, G. Ielsch et al. Residential exposure to natural background radiation and risk of childhood acute leukemia in France, 1990-2009. Environ Health Perspect 125(4): 714-720 (2017).
D19 Dosemeci, M., S. Wacholder and J.H. Lubin. Does nondifferential misclassification of exposure always bias a true effect toward the null value? Am J Epidemiol 132(4): 746-748 (1990).
E1 Eckerman, K.F. and J.C. Ryman. External exposure to radionuclides in air, water, and soil. EPA-402-R-93-081. Federal Guidance Report No. 12. U.S. Environmental Protection Agency, Washington, D.C., 1993.
E2 Eidemuller, M., E. Ostroumova, L. Krestinina et al. Analysis of solid cancer mortality in the Techa river cohort using the two-step clonal expansion model. Radiat Res 169(2): 138-148 (2008).
E3 Eidemüller, M., E. Ostroumova, L. Krestinina et al. Comparison of mortality and incidence solid cancer risk after radiation exposure in the Techa River Cohort. Radiat Environ Biophys 49(3): 477-490 (2010).
F1 Fornalski, K.W. and L. Dobrzynski. The cancer mortality in high natural radiation areas in Poland. Dose Response 10(4): 541-561 (2012).
G1 Ghiassi-Nejad, M., F. Zakeri, R.G. Assaei et al. Long-term immune and cytogenetic effects of high level natural radiation on Ramsar inhabitants in Iran. J Environ Radioact 74(1-3): 107-116 (2004).
G2 Gilbert, E.S. The impact of dosimetry uncertainties on dose-response analyses. Health Phys 97(5): 487-492 (2009).
G3 Gilbert, E.S., L. Huang, A. Bouville et al. Thyroid cancer rates and 131I doses from Nevada atmospheric nuclear bomb tests: an update. Radiat Res 173(5): 659-664 (2010).
G4 Glagolenko, Y., E. Drozhko, Y. Mokrov et al. Reconstruction of I-131 releases from stacks of the radiochemical plant of the Mayak Production Association for the period from 1948 to 1967. Radiation Safety Problems (Mayak Production Association Scientific Journal) (Special Issue): 52-61 (2008). (Russian).
G5 Glagolenko, Y., E. Drozhko, Y. Mokrov et al. Reconstruction of parameters of the source of liquid radioactive waste discharges from the radiochemical plant into the Techa River. Report 1: Development of methods, main results. Radiation Safety Problems (Mayak Production Association Scientific Journal) (Special Issue): 76–91 (2008). (Russian).
G6 Gluzman, D.F., L.M. Sklyarenko, M.P. Zavelevich et al. Overview on association of different types of leukemias with radiation exposure. Exp Oncol 37(2): 89-93 (2015).
G7 Grant, E.J., A. Brenner, H. Sugiyama et al. Solid cancer incidence among the Life Span Study of atomic bomb survivors: 1958-2009. Radiat Res 187(5): 513-537 (2017).

162 UNSCEAR 2017 REPORT
G8 Grosche, B., M. Kreuzer, M. Kreisheimer et al. Lung cancer risk among German male uranium miners: a cohort study, 1946-1998. Br J Cancer 95(9): 1280-1287 (2006).
H1 Hagmar, L., S. Bonassi, U. Stromberg et al. Chromosomal aberrations in lymphocytes predict human cancer: a report from the European Study Group on Cytogenetic Biomarkers and Health (ESCH). Cancer Res 58(18): 4117-4121 (1998).
H2 Hariharan, S., S. Santhi, V. Sangeetha et al. Dose effect relationship of dicentrics and ring chromosomes in the lymphocytes of individual living in the high background radiation areas in Karunagappally, Kerala. pp.183-184 in: 7HLNRRA - Proceedings of the Seventh International Conference on High Levels of Natural Radiation and Radon Areas. Bhabha Atomic Research Centre, Navi Mumbai, 2010.
H3 Helasvuo, T. Number of radiological examinations in Finland in 2011. STUK-B 161. Radiation and Nuclear Safety Authority, Helsinki, 2013. (Finnish).
H4 Hendry, J.H., S.L. Simon, A. Wojcik et al. Human exposure to high natural background radiation: what can it teach us about radiation risks? J Radiol Prot 29(2A): A29-42 (2009).
H5 High Background Radiation Research Group. Health survey in high background radiation areas in China. Science 209(4459): 877-880 (1980).
H6 Hjalmars, U., M. Kulldorff and G. Gustafsson. Risk of acute childhood leukaemia in Sweden after the Chernobyl reactor accident. Swedish Child Leukaemia Group. Br Med J 309(6948): 154-157 (1994).
H7 Hsieh, W.A., C. Ni, J.J. Hwang et al. Evaluation of the frequencies of chromosomal aberrations in a population exposed to prolonged low dose-rate 60Co gamma-irradiation. Int J Radiat Biol 78(7): 625-633 (2002).
H8 Hsieh, W.H., I.F. Lin, J.C. Ho et al. 30 years follow-up and increased risks of breast cancer and leukaemia after long-term low-dose-rate radiation exposure. Br J Cancer 117(12): 1883-1887 (2017).
H9 Hsu, W.L., D.L. Preston, M. Soda et al. The incidence of leukemia, lymphoma and multiple myeloma among atomic bomb survivors: 1950-2001. Radiat Res 179(3): 361-382 (2013).
H10 Hwang, S.L., H.R. Guo, W.A. Hsieh et al. Cancer risks in a population with prolonged low dose-rate gamma-radiation exposure in radiocontaminated buildings, 1983-2002. Int J Radiat Biol 82(12): 849-858 (2006).
H11 Hwang, S.L., J.S. Hwang, Y.T. Yang et al. Estimates of relative risks for cancers in a population after prolonged low-dose-rate radiation exposure: a follow-up assessment from 1983 to 2005. Radiat Res 170(2): 143-148 (2008).
I1 IAEA. Cytogenetic analysis for radiation dose assessment: A manual. Technical Reports Series No. 405. International Atomic Energy Agency, Vienna, 2001.
I2 IARC. Cancer incidence in five continents, Vol. X. IARC Scientific Publications No. 164 (D. Forman et al., eds.). International Agency for Research on Cancer, Lyon, 2013.
I3 ICRP. 1990 Recommendations of the International Commission on Radiological Protection. ICRP Publication 60. Annals of the ICRP 21(1-3). International Commission on Radiological Protection, Pergamon Press, Oxford, 1991.
ANNEX B: EPIDEMIOLOGICAL STUDIES OF CANCER RISK DUE TO LOW-DOSE-RATE RADIATION [...] 163
I4 ICRP. Age-dependent doses to members of the public from intake of radionuclides: Part 2. Ingestion dose coefficients. ICRP Publication 67. Annals of the ICRP 23(3-4). International Commission on Radiological Protection, Pergamon Press, Oxford, 1993.
I5 ICRP. Conversion coefficients for use in radiological protection against external radiation. ICRP Publication 74. Annals of the ICRP 26(3-4). International Commission on Radiological Protection, Pergamon Press, Oxford, 1996.
I6 Ilyin, D.I. Migration of radioactive materials from open reservoirs. Archive document of 1956. Radiation Safety Problems (Mayak Production Association Scientific Journal) 4: 46-61 (2004). (Russian).
I7 Imperial Institute (London). Monazite sand from Travancore, India. Imp Inst (London) Bull 9(2): 103-105 (1911).
I8 International Consortium for Research on the Health Effects of Radiation Writing Committee and Study Team, S. Davis, R.W. Day et al. Childhood leukaemia in Belarus, Russia, and Ukraine following the Chernobyl power station accident: results from an international collaborative population-based case-control study. Int J Epidemiol 35(2): 386-396 (2006).
I9 Iwasaki, T., Y. Takashima, T. Suzuki et al. The dose response of chromosome aberrations in human lymphocytes induced in vitro by very low-dose gamma rays. Radiat Res 175(2): 208-213 (2011).
J1 Jacob, P., Y. Goksu, V. Taranenko et al. On an evaluation of external dose values in the Techa River Dosimetry System (TRDS) 2000. Radiat Environ Biophys 42(3): 169-174 (2003).
J2 Jain, V., P.R. Kumar, P.K. Koya et al. Lack of increased DNA double-strand breaks in peripheral blood mononuclear cells of individuals from high level natural radiation areas of Kerala coast in India. Mutat Res 788: 50-57 (2016).
J3 Jayalekshmi, P. and B. Rajan. Cancer incidence in Karunagappally 1998-2002, Kerala, India. pp.225-226 in: Cancer Incidence in Five Continents, Vol. IX. IARC Scientific Publications No. 160 (M.P. Cuardo et al., eds.). International Agency for Research on Cancer, Lyon, 2007.
J4 Jayalekshmi, P.A., P. Gangadharan, S. Akiba et al. Tobacco chewing and female oral cavity cancer risk in Karunagappally cohort, India. Br J Cancer 100(5): 848-852 (2009).
J5 Jayalekshmi, P.A., S. Hassani, A. Nandakumar et al. Gastric cancer risk in relation to tobacco use and alcohol drinking in Kerala, India--Karunagappally cohort study. World J Gastroenterol 21(44): 12676-12685 (2015).
J6 Jayalekshmy, P.A., S. Akiba, M.K. Nair et al. Bidi smoking and lung cancer incidence among males in Karunagappally cohort in Kerala, India. Int J Cancer 123(6): 1390-1397 (2008).
J7 Jiang, T., I. Hayata, C. Wang et al. Dose-effect relationship of dicentric and ring chromosomes in lymphocytes of individuals living in the high background radiation areas in China. J Radiat Res 41 (Suppl): 63-68 (2000).
J8 JNREG. Sources contributing to radioactive contamination of the Techa River and areas surrounding the “Mayak” Production Association, Urals, Russia. Joint Norwegian-Russian Expert Group for Investigation of Radioactive Contamination in the Northern Areas, Norwegian Radiation Protection Authority, Østerås, 1997.
K1 Kartha, K.N. Studies on monazite. Travancore Univ Central Research Inst Bull Ser A 4(1): 53-62 (1955).
164 UNSCEAR 2017 REPORT
K2 Karuppasamy, C.V., E.N. Ramachandran, V.A. Kumar et al. Peripheral blood lymphocyte micronucleus frequencies in men from areas of Kerala, India, with high vs normal levels of natural background ionizing radiation. Mutat Res Genet Toxicol Environ Mutagen 800-801: 40-45 (2016).
K3 Kendall, G.M., M.P. Little, R. Wakeford et al. A record-based case-control study of natural background radiation and the incidence of childhood leukaemia and other cancers in Great Britain during 1980-2006. Leukemia 27(1): 3-9 (2013).
K4 Kendall, G.M., R. Wakeford, K.J. Bunch et al. Residential mobility and associated factors in relation to the assessment of exposure to naturally occurring radiation in studies of childhood cancer. J Radiol Prot 35(4): 835-868 (2015).
K5 Kendall, G.M., R. Wakeford, M. Athanson et al. Levels of naturally occurring gamma radiation measured in British homes and their prediction in particular residences. Radiat Environ Biophys 55(1): 103-124 (2016).
K6 Kheifets, L., A. Ahlbom, C.M. Crespi et al. Pooled analysis of recent studies on magnetic fields and childhood leukaemia. Br J Cancer 103(7): 1128-1135 (2010).
K7 Korblein, A. and W. Hoffmann. Background radiation and cancer mortality in Bavaria: an ecological analysis. Arch Environ Occup Health 61(3): 109-114 (2006).
K8 Kossenko, M.M. and M.O. Degteva. Cancer mortality and radiation risk evaluation for the Techa River population. Sci Total Environ 142(1-2): 73-89 (1994).
K9 Kossenko, M.M., M.O. Degteva, O.V. Vyushkova et al. Issues in the comparison of risk estimates for the population in the Techa River region and atomic bomb survivors. Radiat Res 148(1): 54-63 (1997).
K10 Kossenko, M.M., D.L. Preston, L.Y. Krestinina et al. Studies on the extended Techa river cohort: cancer risk estimation. Radiat Environ Biophys 41(1): 45-48 (2002).
K11 Kossenko, M.M., T.L. Thomas, A.V. Akleyev et al. The Techa River Cohort: study design and follow-up methods. Radiat Res 164(5): 591-601 (2005).
K12 Kozheurov, V.P. SICH-9.1 -- A unique whole-body counting system for measuring Sr-90 via bremsstrahlung. The main results from a long-term investigation of the Techa River population. Sci Total Environ 142(1-2): 37-48 (1994).
K13 Kozheurov, V.P. and M. Degteva. Dietary intake evaluation and dosimetric modelling for the Techa River residents based on in vivo measurements of strontium-90 in teeth and skeleton. Sci Total Environ 142(1-2): 63-72 (1994).
K14 Kozheurov, V.P., V.I. Zalyapin, N.B. Shagina et al. Evaluation of uncertainties in Sr-90-body-burdens obtained by whole-body count: application of Bayes' rule to derive detection limits by analysis of a posteriori data. Appl Radiat Isot 57(4): 525-535 (2002).
K15 Krestinina, L., D.L. Preston, F.G. Davis et al. Leukemia incidence among people exposed to chronic radiation from the contaminated Techa River, 1953-2005. Radiat Environ Biophys 49(2): 195-201 (2010).
K16 Krestinina, L.Y., D.L. Preston, E.V. Ostroumova et al. Protracted radiation exposure and cancer mortality in the Techa River Cohort. Radiat Res 164(5): 602-611 (2005).

ANNEX B: EPIDEMIOLOGICAL STUDIES OF CANCER RISK DUE TO LOW-DOSE-RATE RADIATION [...] 165
K17 Krestinina, L.Y., F. Davis, E. Ostroumova et al. Solid cancer incidence and low-dose-rate radiation exposures in the Techa River cohort: 1956-2002. Int J Epidemiol 36(5): 1038-1046 (2007).
K18 Krestinina, L.Y., F.G. Davis, S. Schonfeld et al. Leukaemia incidence in the Techa River Cohort: 1953-2007. Br J Cancer 109(11): 2886-2893 (2013).
K19 Krishnan, M.S. Mineral Resources of Madras. Memoirs of the Geological Survey of India, Volume 80. Geological Survey of India, Calcutta, 1951.
K20 Kudo, H., S. Tokonami, Y. Omori et al. Comparative dosimetry for radon and thoron in high background radiation areas in China. Radiat Prot Dosim 167(1-3): 155-159 (2015).
L1 Land, C.E., D. Kwon, F.O. Hoffman et al. Accounting for shared and unshared dosimetric uncertainties in the dose response for ultrasound-detected thyroid nodules after exposure to radioactive fallout. Radiat Res 183(2): 159-173 (2015).
L2 Lee, J.S., S.L. Dong, W.P. Chang et al. Evaluation of external dose equivalent with thermoluminescent dosimeters from residents living in radiation-contaminated buildings. Appl Radiat Isot 48: 1237-1243 (1997).
L3 Leggett, R.W. A generic age-specific biokinetic model for calcium-like elements. Radiat Prot Dosim 41(2-4): 183-198 (1992).
L4 Leuraud, K., D.B. Richardson, E. Cardis et al. Ionising radiation and risk of death from leukaemia and lymphoma in radiation-monitored workers (INWORKS): an International cohort study. Lancet Haematol 2(7): e276-281 (2015).
L5 Li, M., H.I.U. Liu, Z. Lin et al. HBsAg tests in Yangjiang high-background radiation area, Guangdong. Chin J Radiol Med Prev 8(2): 87 (1988).
L6 Little, M.P., R. Wakeford, J.H. Lubin et al. The statistical power of epidemiological studies analyzing the relationship between exposure to ionizing radiation and cancer, with special reference to childhood leukemia and natural background radiation. Radiat Res 174(3): 387-402 (2010).
L7 Liu, R.S., W.L. Chen and F.D. Chen. Health examination and chromosome aberration analysis of residents living in 60Co-contaminated rebar buildings. Int J Radiat Biol 78(7): 635-639 (2002).
L8 Lloyd, D.C., A.A. Edwards and M. Szłuińska. The minimum detectable dose by biodosimetry in a radiation overexposure. pp.253–258 in: Radiation Risk Estimates in Normal and Emergency Situations (A.A. Cigna and M. Durante, eds.). Springer, Berlin, 2006.
L9 Lubin, J.H., J.D. Boice, Jr., C. Edling et al. Lung cancer in radon-exposed miners and estimation of risk from indoor exposure. J Natl Cancer Inst 87(11): 817-827 (1995).
L10 Luo, R.H., Z.X. Zhao, X.Y. Zhou et al. Risk factors for primary liver carcinoma in Chinese population. World J Gastroenterol 11(28): 4431-4434 (2005).
M1 Mäkeläinen, I., S. Moisio, H. Reisbacka et al. Indoor occupancy and radon exposure in Finland. pp.687-693 in: Radioactivity in the Environment, Volume 7. Elsevier Ltd, 2005.
M2 Mezei, G., M. Sudan, S. Izraeli et al. Epidemiology of childhood leukemia in the presence and absence of Down syndrome. Cancer Epidemiol 38(5): 479-489 (2014).
166 UNSCEAR 2017 REPORT
M3 Milne, E., K.R. Greenop, C. Metayer et al. Fetal growth and childhood acute lymphoblastic leukemia: findings from the childhood leukemia international consortium. Int J Cancer 133(12): 2968-2979 (2013).
M4 Mokrov, Y., Y. Glagolenko and B. Napier. Reconstruction of radionuclide contamination of the Techa River caused by liquid waste discharge from radiochemical production at the Mayak Production Association. Health Phys 79(1): 15-23 (2000).
M5 Mokrov, Y.G. Radioactive contamination in the upper part of the Techa river: stirring-up of bottom sediments and precipitation of suspended particles. Analysis of the data obtained in 1949-1951. Radiat Environ Biophys 42(4): 285-293 (2004).
M6 Morishima, H., T. Koga, K. Tatsumi et al. Dose measurement, its distribution and individual external dose assessments of inhabitants in the high background radiation areas in China. J Radiat Res 41(Suppl): 9-23 (2000).
M7 Mosavi-Jarrahi, A., M. Mohagheghi, S. Akiba et al. Mortality and morbidity from cancer in the population exposed to high level of natural radiation area of Ramsar, Iran. International Congress Series 1276: 106-109 (2005).
M8 Muikku, M., R. Bly, P. Kurttio et al. The mean effective dose for Finns. Radiation and Nuclear Safety Authority, Helsinki, 2014. (Finnish).
N1 Nair, M.K., S. Amma and K.S. Mani. Cancer incidence in Karunagapally 1990-1994, Kerala, India. pp.350-353 in: Cancer Incidence in Five Continents, Vol. VII. IARC Scientific Publications No. 143 (D.M. Parkin et al., eds.). International Agency for Research on Cancer, Lyon, 1997.
N2 Nair, M.K., P. Gangadharan, P. Jayalakshmi et al. Cancer incidence in Karunagappally 1993-1997, Kerala, India. pp.240-241 in: Cancer Incidence in Five Continents, Volume VIII. IARC Scientific Publications No. 155 (D. Parkin et al., eds.). International Agency for Research on Cancer, Lyon, 2002.
N3 Nair, M.K., P. Gangadharan, P. Jayalakshmi et al. Natural background radiation cancer registry. Technical Report 1990-1999. Regional Cancer Center, Trivandrum, Kerala, India, 2004.
N4 Nair, R.R., B. Rajan, S. Akiba et al. Background radiation and cancer incidence in Kerala, India-Karanagappally cohort study. Health Phys 96(1): 55-66 (2009).
N5 Nair, R.R.K., S. Akiba, V.S. Binu et al. Individual dose estimation – our experience with the Karunagappally study in Kerala, India. International Congress Series 1276: 41-45 (2005).
N6 Napier, B.A., N.B. Shagina, M.O. Degteva et al. Preliminary uncertainty analysis for the doses estimated using the Techa River dosimetry system--2000. Health Phys 81(4): 395-405 (2001).
N7 Napier, B.A., M.O. Degteva, N.B. Shagina et al. Uncertainty analysis for the Techa River dosimetry system. Medical Radiology and Radiation Safety (Meditsinskaya Radiologiia I Radiatsionnaia Bezopasnost) 58(1): 5-28 (2013). (Russian).
N8 NCRP. Uncertainties in the measurement and dosimetry of external radiation. NCRP Report No. 158. National Council on Radiation Protection and Measurements, Bethesda, 2007.
N9 NCRP. Uncertainties in internal radiation dose assessment. NCRP Report No. 164. National Council on Radiation Protection and Measurements, Bethesda, 2010.

ANNEX B: EPIDEMIOLOGICAL STUDIES OF CANCER RISK DUE TO LOW-DOSE-RATE RADIATION [...] 167
N10 Nikkila, A., S. Erme, H. Arvela et al. Background radiation and childhood leukemia: A nationwide register-based case-control study. Int J Cancer 139(9): 1975-1982 (2016).
O1 Office of the Registrar General & Census Commissioner. Chapter 4: Estimates of mortality indicators. Census of India 2011. Vital Statistics Division, Ministry of Home Affairs, Government of India. [Internet] Available from (http://www.censusindia.gov.in/vital_ statistics/SRS_Report/11Chap%204%20-%202011.pdf) on 8 May 2016.
O2 Omori, Y., S. Tokonami, T. Ishikawa et al. A pilot study for dose evaluation in high-level natural radiation areas of Yangjiang, China. J Radioanal Nucl Chem 306(1): 317-323 (2015).
O3 Omori, Y., S. Tokonami, S.K. Sahoo et al. Radiation dose due to radon and thoron progeny inhalation in high-level natural radiation areas of Kerala, India. J Radiol Prot 37(1): 111-126 (2017).
O4 Ostroumova, E., B. Gagniere, D. Laurier et al. Risk analysis of leukaemia incidence among people living along the Techa River: a nested case-control study. J Radiol Prot 26(1): 17-32 (2006).
O5 Overstreet, W.C. The geologic occurrence of monazite. A review of the distribution of monazite and of the geologic controls affecting the amount of thorium in monazite. United States Government Printing Office, Washington, 1967.
P1 Panczak, R., B. Galobardes, M. Voorpostel et al. A Swiss neighbourhood index of socioeconomic position: development and association with mortality. J Epidemiol Community Health 66(12): 1129-1136 (2012).
P2 Pandey, U.K. and S. Chandrasekaran. Geochronological studies (207Pb/206Pb radiogenic and Sm-Nd) on monazites and zircons from beach placers of Tamil Nadu and Kerala: Evidences on Pan-African event and their provenances. Int J Earth Sci Eng 3(3): 323-331 (2010).
P3 Parkin, D.M., D. Clayton, R.J. Black et al. Childhood leukaemia in Europe after Chernobyl: 5 year follow-up. Br J Cancer 73(8): 1006-1012 (1996).
P4 Petoussi, N., P. Jacob, M. Zankl et al. Organ doses for foetuses, babies, children and adults from environmental gamma rays. Radiat Prot Dosim 37(1): 31-41 (1991).
P5 Petridou, E., C. Proukakis, D. Tong et al. Trends and geographical distribution of childhood leukemia in Greece in relation to the Chernobyl accident. Scand J Soc Med 22(2): 127-131 (1994).
P6 Petrushova, N.A., G.I. Zvereva, M.M. Kosenko et al. Cytologic screening of the population because of radioactive waste products disposal in the Techa River. Medical Radiology and Radiation Safety (Meditsinskaya Radiologiia I Radiatsionnaia Bezopasnost) 38(2): 35-38 (1993). (Russian).
P7 Pfeiffer, W.C., E. Penna-Franca, C.C. Ribeiro et al. Measurements of environmental radiation exposure dose rates at selected sites in Brazil. An Acad Bras Cienc 53(4): 683-691 (1981).
P8 Pochinsky, A.G., A.M. Skryabin and L.M. Peremyslova. Exposure doses of the population of Chelyabinsk Oblast due to X-ray diagnostic examinations. Gig Sanit (10): 62-63 (1984). (Russian).
P9 Poole, C., S. Greenland, C. Luetters et al. Socioeconomic status and childhood leukaemia: a review. Int J Epidemiol 35(2): 370-384 (2006).
168 UNSCEAR 2017 REPORT
P10 Prakash, T.N., G.K. Raju and M. Prithviraj. Radioelement distribution in river, beach, and offshore areas and their significance to Chavara placer deposit, Southern Kerala Coast of India. Geo-Marine Letters 11(1): 32-38 (1991).
P11 Preston, D. Techa River studies. J Radiol Prot 26(1): 11-13 (2006).
P12 Preston, D., L. Krestinina, E. Ron et al. The impact of the new dosimetry system on solid cancer risk estimates for the Techa River Cohort. Urals Research Center for Radiation Medicine, Chelyabinsk, 2010.
P13 Preston, D.L., S. Kusumi, M. Tomonaga et al. Cancer incidence in atomic bomb survivors. Part III. Leukemia, lymphoma and multiple myeloma, 1950-1987. Radiat Res 137(2 Suppl): S68-97 (1994).
P14 Preston, D.L., Y. Shimizu, D.A. Pierce et al. Studies of mortality of atomic bomb survivors. Report 13: Solid cancer and noncancer disease mortality: 1950-1997. Radiat Res 160(4): 381-407 (2003).
P15 Preston, D.L., D.A. Pierce, Y. Shimizu et al. Effect of recent changes in atomic bomb survivor dosimetry on cancer mortality risk estimates. Radiat Res 162(4): 377-389 (2004).
P16 Preston, D.L., E. Ron, S. Tokuoka et al. Solid cancer incidence in atomic bomb survivors: 1958-1998. Radiat Res 168(1): 1-64 (2007).
P17 Preston, D.L., M.E. Sokolnikov, L.Y. Krestinina et al. Estimates of radiation effects on cancer risks in the Mayak worker, Techa River and atomic bomb survivor studies. Radiat Prot Dosim 173(1-3): 26-31 (2017).
R1 Ramachandran, E.N., C.V. Karuppasamy, V.D. Cheriyan et al. Cytogenetic studies on newborns from high and normal level natural radiation areas of Kerala in southwest coast of India. Int J Radiat Biol 89(4): 259-267 (2013).
R2 Ramalho, A.T., M.P. Curado and A.T. Natarajan. Lifespan of human lymphocytes estimated during a six year cytogenetic follow-up of individuals accidentally exposed in the 1987 radiological accident in Brazil. Mutat Res 331(1): 47-54 (1995).
R3 Richardson, D.B., E. Cardis, R.D. Daniels et al. Risk of cancer from occupational exposure to ionising radiation: retrospective cohort study of workers in France, the United Kingdom, and the United States (INWORKS). Br Med J 351: h5359 (2015).
R4 Roman, E., T. Lightfoot, A.G. Smith et al. Childhood acute lymphoblastic leukaemia and birthweight: insights from a pooled analysis of case-control data from Germany, the United Kingdom and the United States. Eur J Cancer 49(6): 1437-1447 (2013).
R5 Ron, E., R. Carter, S. Jablon et al. Agreement between death certificate and autopsy diagnoses among atomic bomb survivors. Epidemiology 5(1): 48-56 (1994).
R6 Rothman, K.J. Epidemiology: An Introduction. Oxford University Press, 2012.
R7 Rudant, J., F. Menegaux, G. Leverger et al. Household exposure to pesticides and risk of childhood hematopoietic malignancies: The ESCALE study (SFCE). Environ Health Perspect 115(12): 1787-1793 (2007).
R8 Rybach, L., F. Medici and G.F. Schwarz. Construction of radioelement and dose rate baseline maps by combining ground and airborne radiometric data. pp.33-44 in: Uranium Exploration Data and Techniques Applied to the Preparation of Radioelement Maps. IAEA-TECDOC-980. International Atomic Energy Agency, Vienna, 1996.
ANNEX B: EPIDEMIOLOGICAL STUDIES OF CANCER RISK DUE TO LOW-DOSE-RATE RADIATION [...] 169
R9 Rybach, L., D. Bachler, B. Bucher et al. Radiation doses of Swiss population from external sources. J Environ Radioact 62(3): 277-286 (2002).
S1 Sachett, I.A. Caracterização da Radiação Gama Ambiental em Áreas Urbanas Utilizando uma Unidade Móvel de Rastreamento. Doctoral Thesis, Instituto de Biologia Roberto Alcântara Gomes, Universidade do Estado do Rio de Janeiro (2002). (Portuguese).
S2 Sasaki, M.S. Use of lymphocyte chromosome aberrations in biological dosimetry: possibilities and limitations. pp.585-604 in: Radiation-Induced Chromosome Damage in Man (T. Ishihara and M.S. Sasaki, eds.). Alan R. Liss, Inc., New York, 1983.
S3 Schonfeld, S.J., L.Y. Krestinina, S. Epifanova et al. Solid cancer mortality in the Techa river cohort (1950-2007). Radiat Res 179(2): 183-189 (2013).
S4 Schubauer-Berigan, M.K., G.V. Macievic, D.F. Utterback et al. An epidemiologic study of mortality and radiation-related risk of cancer among workers at the Idaho National Engineering and Environmental Laboratory, a U.S. Department of Energy Facility. HHS (NIOSH) Publication No. 2005-131. National Institute for Occupational Safety and Health, Cincinnati, OH, 2005.
S5 Schwarz, B.C. and W.E. Bolch. Re‐evaluation of organ dose coefficients for UF/ICRP reference computational phantoms resulting from external exposures at the Techa River due to ground contamination. Milestone 9, Part 1. Urals Research Center for Radiation Medicine and University of Florida, 2014.
S6 Scott, B.R. and E.J. Ainsworth. State-vector model for life shortening in mice after brief exposures to low doses of ionizing radiation. Math Biosci 49(3-4): 185-205 (1980).
S7 Sergentanis, T.N., T.P. Thomopoulos, S.P. Gialamas et al. Risk for childhood leukemia associated with maternal and paternal age. Eur J Epidemiol 30(12): 1229-1261 (2015).
S8 Shagina, N.B., E.I. Tolstykh and M.O. Degteva. Improvements in the biokinetic model for strontium with allowance for age and gender differences in bone mineral metabolism. Radiat Prot Dosim 105(1-4): 619-622 (2003).
S9 Shagina, N.B., M.O. Degteva, E.I. Tolstykh et al. Reduction of the uncertainties of the internal doses due to strontium-90 for the extended Techa river cohort. Radiation Safety Problems (Mayak Production Association Scientific Journal) (Special issue 1): 5-25 (2006). (Russian).
S10 Shagina, N.B., M.O. Degteva, M.I. Vorobiova et al. Evaluation of parameters for external dose calculation in the Techa River Dosimetry System TRDS-2012. Urals Research Center for Radiation Medicine and University of Utah, Chelyabinsk and Salt Lake City, 2012.
S11 Shagina, N.B., V.Y. Golikov, M.O. Degteva et al. Reconstruction of individual doses due to medical exposures for members of the Techa River Cohort. Medical Radiology and Radiation Safety (Meditsinskaya Radiologiia I Radiatsionnaia Bezopasnost) 57(3): 13-25 (2012). (Russian).
S12 Shagina, N.B., M.I. Vorobiova, M.O. Degteva et al. Reconstruction of the contamination of the Techa River in 1949-1951 as a result of releases from the “Mayak” Production Association. Radiat Environ Biophys 51: 349-366 (2012).
S13 Shagina, N.B., E.I. Tolstykh, M.O. Degteva et al. Age and gender specific biokinetic model for strontium in humans. J Radiol Prot 35(1): 87-127 (2015).

170 UNSCEAR 2017 REPORT
S14 Shishkina, E.A., M.O. Degteva, E.I. Tolstykh et al. Results of tooth dosimetric investigations for residents of the Techa Riverside region. Radiation Safety Problems (Mayak Production Association Scientific Journal) (Special issue 1): 26-44 (2006). (Russian).
S15 Shishkina, E.A., A.Y. Volchkova, M.O. Degteva et al. Evaluation of dose rates in the air at non‐uniform vertical distribution of gamma‐emitting radionuclides in different types of soil. Radiation Safety Problems (Mayak Production Association Scientific Journal) 3: 43-52 (2016). (Russian).
S16 Shore, R., L. Walsh, T. Azizova et al. Risk of solid cancer in low dose-rate radiation epidemiological studies and the dose-rate effectiveness factor. Int J Radiat Biol 93(10): 1064-1078 (2017).
S17 Sigurdson, A.J., M. Ha, M. Hauptmann et al. International study of factors affecting human chromosome translocations. Mutat Res 652(2): 112-121 (2008).
S18 Simon, S.L., A. Bouville, C.E. Land et al. Radiation doses and cancer risks in the Marshall Islands associated with exposure to radioactive fallout from Bikini and Enewetak nuclear weapons tests: summary. Health Phys 99(2): 105-123 (2010).
S19 Simon, S.L., F.O. Hoffman and E. Hofer. The two-dimensional Monte Carlo: a new methodologic paradigm for dose reconstruction for epidemiological studies. Radiat Res 183(1): 27-41 (2015).
S20 Skryabin, A.M. and A.G. Pochinsky. Exposure doses of the residents of Chelyabinsk Oblast due to natural-gamma background of areas and buildings. Gig Sanit 1: 78-80 (1985). (Russian).
S21 Sohrabi, M. Recent radiological studies of high level natural radiation areas of Ramsar. pp.39-47 in: High Levels of Natural Radiation. Proceedings of an International Conference, Ramsar, 3-7 November 1990 (M. Sohrabi et al., eds.). International Atomic Energy Agency, Vienna, 1993.
S22 Sohrabi, M. High radon levels in nature and in dwellings: remedial actions. pp.225-242 in: Radon Measurements by Etched Track Detectors. Applications in Radiation Protection, Earth Sciences and the Environment (S.A. Durrani and R. Ilic, eds.). World Scientific Publishing, Singapore, 1997.
S23 Sohrabi, M. The state-of-the-art on worldwide studies in some environments with elevated naturally occurring radioactive materials (NORM). Appl Radiat Isot 49(3): 169-188 (1998).
S24 Spiers, F.W., A.H. Beddoe and J.R. Whitwell. Mean skeletal dose factors for beta-particle emitters in human bone. Part I: volume-seeking radionuclides. Br J Radiol 51(608): 622-627 (1978).
S25 Spycher, B.D., J.E. Lupatsch, M. Zwahlen et al. Background ionizing radiation and the risk of childhood cancer: a census-based nationwide cohort study. Environ Health Perspect 123(6): 622-628 (2015).
S26 Srinath Reddy, K. and P.C. Gupta. Report on tobacco control in India. Ministry of Health and Family Welfare, Government of India, New Delhi, 2004.
S27 Stevens, W., D.C. Thomas, J.L. Lyon et al. Leukemia in Utah and radioactive fallout from the Nevada test site. A case-control study. J Am Med Assoc 264(5): 585-591 (1990).

ANNEX B: EPIDEMIOLOGICAL STUDIES OF CANCER RISK DUE TO LOW-DOSE-RATE RADIATION [...] 171
S28 Sun, Q., S. Akiba, Z. Tao et al. Excess relative risk of solid cancer mortality after prolonged exposure to naturally occurring high background radiation in Yangjiang, China. J Radiat Res 41 (Suppl): 43-52 (2000).
S29 Sunta, C.M. A review of the studies of high background areas of the S–W coast of India. pp.71-87 in: High Levels of Natural Radiation. Proceedings of an International Conference, Ramsar, 3-7 November 1990 (M. Sohrabi et al., eds.). International Atomic Energy Agency, Vienna, 1993.
S30 Suresh Babu, D.S. and K.P. Thrivikramaji. Palaeogeographic interpretation of Kerala beach placers, southwest coast of India. Indian J Mar Sci 22(3): 203-208 (1993).
S31 Szluinska, M., A. Edwards and D. Lloyd. Presenting statistical uncertainty on cytogenetic dose estimates. Radiat Prot Dosim 123(4): 443-449 (2007).
T1 Tanaka, K., A. Kohda, K. Satoh et al. Dose-rate effectiveness for unstable-type chromosome aberrations detected in mice after continuous irradiation with low-dose-rate gamma rays. Radiat Res 171(3): 290-301 (2009).
T2 Tao, Z., Y. Zha, S. Akiba et al. Cancer mortality in the high background radiation areas of Yangjiang, China during the period between 1979 and 1995. J Radiat Res 41 (Suppl): 31-41 (2000).
T3 Tao, Z., S. Akiba, Y. Zha et al. Cancer and non-cancer mortality among inhabitants in the high background radiation area of Yangjiang, China (1979-1998). Health Phys 102(2): 173-181 (2012).
T4 Tao, Z.F. Comparative studies on mutation-related factors. pp.127-133 in: High Background Radiation Research in Yangjiang, China. Atomic Energy Press, Beijing, China, 1996.
T5 Taranenko, V., R. Meckbach, M.O. Degteva et al. Verification of external exposure assessment for the upper Techa riverside by luminescence measurements and Monte Carlo photon transport modeling. Radiat Environ Biophys 42(1): 17-26 (2003).
T6 Taranenko, V.A., M.I. Vorobiova, M.O. Degteva et al. Verification of the external exposure levels in the upper streams of Techa River (Metlino) by luminescence measurements. Medical Radiology and Radiation Safety (Meditsinskaya Radiologiia I Radiatsionnaia Bezopasnost) 58(1): 29-35 (2013). (Russian).
T7 Tawn, E.J., G.B. Curwen, P. Jonas et al. Chromosome aberrations determined by FISH in radiation workers from the Sellafield nuclear facility. Radiat Res 184(3): 296-303 (2015).
T8 Teppo, L., E. Pukkala and M. Lehtonen. Data quality and quality control of a population-based cancer registry. Experience in Finland. Acta Oncol 33(4): 365-369 (1994).
T9 Tirmarche, M., J. Harrison, D. Laurier et al. Risk of lung cancer from radon exposure: contribution of recently published studies of uranium miners. Ann ICRP 41(3-4): 368-377 (2012).
T10 Tokonami, S. Why is 220Rn (thoron) measurement important? Radiat Prot Dosim 141(4): 335-339 (2010).
T11 Tokonami, S., M. Hosoda, A. Sorimachi et al. Comprehensive dose assessment for residents in high background radiation areas in India and China. IV. Terrestrial Radioisotopes in Environment. International Conference on Environmental Protection, 21-23 May 2014, Veszprém, Hungary. 2014.

172 UNSCEAR 2017 REPORT
T12 Tokonami, S., T. Ishikawa, A. Sorimachi et al. Dosimetric studies of residents in high natural background radiation areas in India and China. Report to Ministry of Environment, China, 2015.
T13 Tolstykh, E.I., M.O. Degteva, M.I. Vorobiova et al. Dietary intake and 90Sr body contents in the residents of the Eastern Urals radioactive trace. Experience in the forty-year monitoring. Intl J Radiat Med 4: 127-133 (2002).
T14 Tolstykh, E.I., M.O. Degteva, M.I. Vorobiova et al. Reconstruction of long-lived radionuclide intakes for Techa riverside residents. Part 2: Cesium-137. Radiation Safety Problems (Mayak Production Association Scientific Journal) (Special issue 1): 68-79 (2006). (Russian).
T15 Tolstykh, E.I., M.O. Degteva, L.M. Peremyslova et al. Reconstruction of long-lived radionuclide intakes for Techa riverside residents: strontium-90. Health Phys 101(1): 28-47 (2011).
T16 Tonomura, A., K. Kishi and F. Saito. Types and frequencies of chromosome aberrations in peripheral lymphocytes of general populations. pp.605-616 in: Radiation-Induced Chromosome Damage in Man (T. Ishihara and M.S. Sasaki, eds.). Alan R. Liss, Inc., New York, 1983.
T17 Tucker, J.D., E.J. Tawn, D. Holdsworth et al. Biological dosimetry of radiation workers at the Sellafield nuclear facility. Radiat Res 148(3): 216-226 (1997).
T18 Tung, C.J., T.C. Chao, T.R. Chen et al. Dose reconstruction for residents living in 60Co-contaminated rebar buildings. Health Phys 74(6): 707-713 (1998).
U1 U.K. Childhood Cancer Study Investigators. The United Kingdom Childhood Cancer Study of exposure to domestic sources of ionising radiation: 1: radon gas. Br J Cancer 86(11): 1721-1726 (2002).
U2 Ulanovsky, A., C. Woda, P. Jacob et al. Advanced validation of population external exposures in radioactively contaminated Techa River valley. Late Health Effects of Ionizing Radiation: Bridging the Experimental and Epidemiologic Divide. Georgetown University, Washington, D.C., May 4-6, 2009.
U3 UNSCEAR. Ionizing Radiation: Levels and Effects. Volume II: Effects. UNSCEAR 1972 Report. United Nations Scientific Committee on the Effects of Atomic Radiation, 1972 Report to the General Assembly, with annexes. United Nations sales publication E.72.IX.18. United Nations, New York, 1972.
U4 UNSCEAR. Sources and Effects of Ionizing Radiation. UNSCEAR 1993 Report. United Nations Scientific Committee on the Effects of Atomic Radiation, 1993 Report to the General Assembly, with scientific annexes. United Nations sales publication E.94.IX.2. United Nations, New York, 1993.
U5 UNSCEAR. Sources and Effects of Ionizing Radiation. UNSCEAR 1994 Report. United Nations Scientific Committee on the Effects of Atomic Radiation, 1994 Report to the General Assembly, with scientific annexes. United Nations sales publication E.94.IX.11. United Nations, New York, 1994.
U6 UNSCEAR. Sources and Effects of Ionizing Radiation. Volume II: Effects. UNSCEAR 2000 Report. United Nations Scientific Committee on the Effects of Atomic Radiation, 2000 Report to the General Assembly, with scientific annexes. United Nations sales publication E.00.IX.4. United Nations, New York, 2000.

ANNEX B: EPIDEMIOLOGICAL STUDIES OF CANCER RISK DUE TO LOW-DOSE-RATE RADIATION [...] 173
U7 UNSCEAR. Sources and Effects of Ionizing Radiation. Volume I: Sources. UNSCEAR 2000 Report. United Nations Scientific Committee on the Effects of Atomic Radiation, 2000 Report to the General Assembly, with scientific annexes. United Nations sales publication E.00.IX.3. United Nations, New York, 2000.
U8 UNSCEAR. Effects of Ionizing Radiation. Volume I: Report to the General Assembly, Scientific Annexes A and B. UNSCEAR 2006 Report. United Nations Scientific Committee on the Effects of Atomic Radiation. United Nations sales publication E.08.IX.6. United Nations, New York, 2008.
U9 UNSCEAR. Effects of Ionizing Radiation. Volume II: Scientific Annexes C, D and E. UNSCEAR 2006 Report. United Nations Scientific Committee on the Effects of Atomic Radiation. United Nations sales publication E.09.IX.5. United Nations, New York, 2009.
U10 UNSCEAR. Sources and Effects of Ionizing Radiation. Volume I: Sources: Report to the General Assembly, Scientific Annexes A and B. UNSCEAR 2008 Report. United Nations Scientific Committee on the Effects of Atomic Radiation. United Nations sales publication E.10.XI.3. United Nations, New York, 2010.
U11 UNSCEAR. Sources and Effects of Ionizing Radiation. Volume II: Effects: Scientific Annexes C, D and E. UNSCEAR 2008 Report. United Nations Scientific Committee on the Effects of Atomic Radiation. United Nations sales publication E.11.IX.3. United Nations, New York, 2011.
U12 UNSCEAR. Report of the United Nations Scientific Committee on the Effects of Atomic Radiation. UNSCEAR 2010 Report. United Nations Scientific Committee on the Effects of Atomic Radiation. United Nations sales publication M.11.IX.4. United Nations, New York, 2011.
U13 UNSCEAR. Sources, Effects and Risks of Ionizing Radiation. Report to the General Assembly and Scientific Annexes A and B. UNSCEAR 2012 Report. United Nations Scientific Committee on the Effects of Atomic Radiation. United Nations sales publication E.16.IX.1. United Nations, New York, 2015.
V1 Vardiman, J.W., N.L. Harris and R.D. Brunning. The World Health Organization (WHO) classification of the myeloid neoplasms. Blood 100(7): 2292-2302 (2002).
V2 Veiga, L.H., S. Koifman, V.P. Melo et al. Preliminary indoor radon risk assessment at the Pocos de Caldas Plateau, MG-Brazil. J Environ Radioact 70(3): 161-176 (2003).
V3 Veiga, L.H.S. and S. Koifman. Pattern of cancer mortality in some Brazilian HBRAs. International Congress Series 1276: 110-113 (2005).
V4 Veremeyeva, G., I. Akushevich, T. Pochukhailova et al. Long-term cellular effects in humans chronically exposed to ionizing radiation. Health Phys 99(3): 337-346 (2010).
V5 Vinnikov, V.A., E.A. Ainsbury, N.A. Maznyk et al. Limitations associated with analysis of cytogenetic data for biological dosimetry. Radiat Res 174(4): 403-414 (2010).
V6 Vorobiova, M.I. and M.O. Degteva. Simple model for the reconstruction of radionuclide concentrations and radiation exposures along the Techa River. Health Phys 77(2): 142-149 (1999).
V7 Vorobiova, M.I., M.O. Degteva, D.S. Burmistrov et al. Review of historical monitoring data on Techa River contamination. Health Phys 76(6): 605-618 (1999).
174 UNSCEAR 2017 REPORT
V8 Vozilova, A.V., A.V. Akleev, N.P. Bochkov et al. Remote cytogenetics effects of chronical irradiation of South Ural population. Radiats Biol Radioecol 38(4): 586-590 (1998). (Russian).
V9 Vozilova, A.V., N.B. Shagina, M.O. Degteva et al. Preliminary FISH-based assessment of external dose for residents exposed on the Techa River. Radiat Res 177(1): 84-91 (2012).
W1 Wadia, D.N. Natural occurrence of uranium and thorium in India, Volume 6. pp.163-166 in: Proceedings of the International Conference on the Peaceful Uses Atomic Energy. Geneva, 1955.
W2 Wakeford, R. And now, Fukushima. J Radiol Prot 31(2): 167-176 (2011).
W3 Walsh, L., A. Tschense, M. Schnelzer et al. The influence of radon exposures on lung cancer mortality in German uranium miners, 1946-2003. Radiat Res 173(1): 79-90 (2010).
W4 Wang-Wuu, S., J.J. Tai, J. Wuu et al. Chromosome aberrations in lymphocytes of residents living in buildings constructed with radioactively contaminated rebars. J Biomed Sci 8(5): 411-415 (2001).
W5 Wang, Z.Y., J.D. Boice, Jr., L.X. Wei et al. Thyroid nodularity and chromosome aberrations among women in areas of high background radiation in China. J Natl Cancer Inst 82(6): 478-485 (1990).
W6 Wei, L.X., Y.R. Zha, Z.F. Tao et al. Epidemiological investigation in high background radiation areas of Yangjiang, China (1972-1986). pp.17-36 in: High Background Radiation Research in Yangjiang, China (L.X. Wei, ed.) Atomic Energy Press, Beijing, 1996.
W7 WHO. Effect of radiation on human heredity: Investigations of areas of high natural radiation. Technical Report Series No. 166. World Health Organization. [Internet] Available from (http://apps.who.int/iris/bitstream/10665/40433/1/WHO_TRS_166.pdf) on 2 May 2015.
W8 WHO. WHO Handbook on indoor radon: A public health perspective (H. Zeeb and F. Shannoun, eds.). World Health Organization, Geneva, 2009.
W9 Woda, C., A. Ulanovsky, N.G. Bougrov et al. Luminescence dosimetry in a contaminated settlement of the Techa River valley, Southern Urals, Russia. Radiat Meas 46(3): 277-285 (2011).
W10 Wrixon, A.D., B.M.R. Green, P.R. Lomas et al. Natural radiation exposure in UK dwellings. NRPB-R190. National Radiological Protection Board, United Kingdom, 1998.
Y1 Yuan, Y., H. Shen, Q. Sun et al. Estimation of individual doses from external exposures and dose-group classification of cohort members in high background radiation area in Yangjiang, China. Chin J Radiol Med Prot 19: 99-103 (1999).
Y2 Yuan, Y.L., H. Morishima, H. Shen et al. Recent advances in dosimetry investigation in the high background radiation area in Yangjiang, China. pp.223–233 in: High Levels of Natural Radiation 1996. Radiation Dose and Health Effects (L. Wei et al., eds.). Elsevier, Amsterdam, 1997.
Y3 Yukawa, M., Y. Watanabe, Y. Nishimura et al. Determination of U and Th in soil and plants obtained from a high natural radiation area in China using ICP-MS and γ-counting. Fresenius J Anal Chem 363(8): 760-766 (1999).
Z1 Zakeri, F., M.R. Rajabpour, S.A. Haeri et al. Chromosome aberrations in peripheral blood lymphocytes of individuals living in high background radiation areas of Ramsar, Iran. Radiat Environ Biophys 50(4): 571-578 (2011).
ANNEX B: EPIDEMIOLOGICAL STUDIES OF CANCER RISK DUE TO LOW-DOSE-RATE RADIATION [...] 175
Z2 Zalyapin, V.I., V.A. Krivoschapov and M.O. Degteva. Numerical solution of an applied biophysics inverse problem. Inverse Probl Sci Eng 12(4): 379-392 (2004).
Z3 Zaridze, D., D. Maximovitch, A. Lazarev et al. Alcohol poisoning is a main determinant of recent mortality trends in Russia: evidence from a detailed analysis of mortality statistics and autopsies. Int J Epidemiol 38(1): 143-153 (2009).
Z4 Zha, Y.R., J.M. Zou, Z.X. Lin et al. Confounding factors in radiation epidemiology and their comparability between the high background radiation areas and control areas in Guangdong, China. pp.263-269 in: High Levels of Natural Radiation 1996. Radiation Dose and Health Effects (L. Wei et al., eds.). Elsevier, Amsterdam, 1997.
Z5 Zhang, W., C. Wang, D. Chen et al. Imperceptible effect of radiation based on stable type chromosome aberrations accumulated in the lymphocytes of residents in the high background radiation area in China. J Radiat Res 44(1): 69-74 (2003).
Z6 Zhang, W., C. Wang, D. Chen et al. Effect of smoking on chromosomes compared with that of radiation in the residents of a high-background radiation area in China. J Radiat Res 45(3): 441-446 (2004).
Z7 Zhou, Y., S. Zhang, Z. Li et al. Maternal benzene exposure during pregnancy and risk of childhood acute lymphoblastic leukemia: a meta-analysis of epidemiologic studies. PLoS One 9(10): e110466 (2014).
Z8 Zhukovsky, M. and I. Yarmoshenko. Radon: Measurements, Doses and Risk Assessment. Publishing House of the Ural Branch of the Russian Academy of Sciences, Yekaterinburg, 1997.