Massachusetts Office of the Comptroller -- Single Audit-FY00

Volume 4: Longitudinal Trends in Sociodemographics, Utilization, Health Profile, and Geographic Distribution
Sourcebook: Women Veterans in the Veterans Health Administration
Women’s Health Evaluation Initiative (WHEI)Center for Innovation to Implementation (Ci2i)VA Palo Alto Health Care SystemPalo Alto, CA
Women’s Health ServicesOffice of Patient Care ServicesVeterans Health AdministrationDepartment of Veterans AffairsWashington, DC
February 2018
★Sourcebook Vol. 4
175%Increase in Women Veterans using
VA Health Care from 2000-2015


Sourcebook: Women Veterans in the Veterans Health Administration
Volume 4: Longitudinal Trends in Sociodemographics, Utilization, Health Profile, and Geographic Distribution
Prepared for:Women’s Health Services
Office of Patient Care Services, Veterans Health AdministrationDepartment of Veterans Affairs
810 Vermont Ave., NWWashington, DC 20420
Prepared by:Women’s Health Evaluation Initiative (WHEI)Center for Innovation to Implementation (Ci2i)
VA Palo Alto Health Care System3801 Miranda Ave. (152-MPD)
Palo Alto, CA 94304Susan M. Frayne, MD, MPH, WHEI Director
Ciaran S. Phibbs, PhD, WHEI Associate Director Fay Saechao, MPH, Program Manager and Lead Technical Writer
Sarah A. Friedman, PhD, MSPH, Technical Writer Jonathan G. Shaw, MD, MS, Technical Writer
Yasmin Romodan, MPH, Technical WriterEric Berg, MS, Senior Data Analyst
Jimmy Lee, MS, Data AnalystLakshmi Ananth, MS, Data Analyst
Samina Iqbal, MD, Senior Clinical Consultant
Women’s Health ServicesPatricia M. Hayes, PhD, Chief Consultant
Sally Haskell, MD, Deputy Chief Consultant for Clinical Operations and Director of Comprehensive Women’s Health
Recommended citation: Frayne SM, Phibbs CS, Saechao F, Friedman SA, Shaw JG, Romodan Y, Berg E, Lee J, Ananth L, Iqbal S, Hayes PM, Haskell S. Sourcebook: Women Veterans in the Veterans Health Administration. Volume 4: Longitudinal Trends in Sociodemographics, Utilization, Health Profile, and Geographic Distribution. Women’s Health Evaluation Initiative, Women’s Health Services, Veterans Health Administration, Department of Veterans Affairs, Washington DC. February 2018.

Acknowledgements: We express appreciation to our reviewers, who made substantive contributions to this Sourcebook: Donna L. Washington, MD, MPH and Katherine Hoggatt, PhD, MPH. In addition to our appreciation to the groups acknowledged in prior volumes of the Sourcebook who contributed to the development of variable algorithms that continue to be used herein, the current Sourcebook also benefited from refinements to the race/ethnicity variable algorithm that were developed by VHA’s Office of Health Equity through the Office of Health Equity-Quality Enhancement Research Initiative (QUERI) Partnered Evaluation Center. Last, we express our appreciation to other contributors who helped in the development of the Sourcebook, including Sirisha Veldanda, MPH; Alyssa Pomernacki, MPH; Diane Carney, MA; Rachel Golden, DrPH, MPH; Rashmi Risbud, MA; Jessica Y. Breland, PhD; Eleanor T. Lewis, PhD; Ann S. Combs, MHA, MPHc ; and Meenadchi Chelvakumar, MD, MPH.
Our deepest gratitude goes to the women Veterans who have served our country across the generations.
This report is based on program evaluation analyses conducted by the Women’s Health Evaluation Initiative at the VA Palo Alto Health Care System in Palo Alto, California. This work was funded by Women’s Health Services, Veterans Health Administration, Department of Veterans Affairs. The findings and conclusions in this document are those of the authors who are responsible for its contents and do not necessarily represent the views of the Department of Veterans Affairs or the United States government. Therefore, no statement in this document should be construed as an official position of the Department of Veterans Affairs.

Sourcebook Vol. 4 - Table of Contents
i
Table of Contents
EXECUTIVE SUMMARY Key Findings and Implications ................................................................................................................................................ 1 Sociodemographics .......................................................................................................................................................... 1 Utilization ............................................................................................................................................................................ 3 Health Profile ...................................................................................................................................................................... 7 Geographic Distribution ................................................................................................................................................10
INTRODUCTION Background ...............................................................................................................................................................................13 Methods .....................................................................................................................................................................................14
PART 1: SOCIODEMOGRAPHICS Overview ....................................................................................................................................................................................17 Cohort Size ................................................................................................................................................................................18 Age .............................................................................................................................................................................................20 Race/Ethnicity ...........................................................................................................................................................................25 Urban/Rural Status ..................................................................................................................................................................30 Service-Connected Disability Rating Status .......................................................................................................................34
PART 2: UTILIZATION Overview ....................................................................................................................................................................................41 Outpatient Utilization, Overall ..............................................................................................................................................43 Outpatient Utilization, VHA ...........................................................................................................................................43 Outpatient Utilization, Purchased Care ......................................................................................................................47 Primary Care ..............................................................................................................................................................................51 Total Primary Care (General Primary Care and Women’s Health Clinic Combined) Encounters .....................52 Primary Care Encounters by Setting (Women’s Health Clinic/General Primary Care) .......................................57 Mental Health/ Substance Use Disorder (SUD) Specialty Care .......................................................................................61 Mental Health/SUD Specialty Care Encounters .........................................................................................................62 Reproductive Health Care ......................................................................................................................................................67 Obstetrics/Gynecology Specialty Care, in VHA and Through Purchased Care ....................................................67 Obstetric Deliveries .........................................................................................................................................................71

Sourcebook Vol. 4 - Table of Contents
ii
PART 3: HEALTH PROFILE Overview ...................................................................................................................................................................................81 Domain Frequencies ...............................................................................................................................................................85 Domain Frequencies Among Women Veteran VHA Patients ..................................................................................85 Domain Frequencies Among Women Veteran VHA Patients by Age ....................................................................87 Top Five Domains in Women and Men Veteran VHA Patients by Age ..................................................................89 Age-Adjusted Odds Ratio (AOR) of Domains for Women Versus Men Veteran VHA Patients ..........................91 Condition Frequencies ............................................................................................................................................................92 Overview ...........................................................................................................................................................................92 Top 20 Conditions for Women Veteran VHA Patients Overall and by Age .........................................................100 Differences in Condition Frequencies Among Women Veteran VHA Patients by Age ....................................108 Condition Frequencies for Women and Men Veteran VHA Patients ...................................................................112
PART 4: GEOGRAPHIC DISTRIBUTION Overview ..................................................................................................................................................................................123 VISN-Level Growth .................................................................................................................................................................124 Health Care System-Level Growth ......................................................................................................................................126
Online Appendix available at http://www.womenshealth.va.gov/WOMENSHEALTH/sourcebookvol4onlineappendix.asp• Technical Appendix• Supplemental Materials
Sourcebook Vol. 4 - List of Exhibits
iii
List of Exhibits
PART 1: SOCIODEMOGRAPHICSExhibit 1.A. Number of Women and Men Veteran VHA Patients, FY00-FY15 ...............................................................18Exhibit 1.B. Number of Women and Men Veteran VHA Patients, as Compared with the Estimated Total Veteran Population in the United States, FY00-FY15......................................................19Exhibit 1.C. Timeline: War Eras and Their Potential Relationship to Age Cohorts .......................................................20Exhibit 1.D. Age Distribution of Women Veteran VHA Patients, FY00-FY15 .................................................................21Exhibit 1.E. Age Distribution of Men Veteran VHA Patients, FY00-FY15 .......................................................................21Exhibit 1.F. Age Group Distribution of Women Veteran VHA Patients, FY00-FY15 .....................................................22Exhibit 1.G. Age Group Distribution of Women and Men Veteran VHA Patients, FY00-FY15 ....................................23Exhibit 1.H. Race/Ethnicity Distribution of Women Veteran VHA Patients, FY00-FY15 ..............................................25Exhibit 1.I. Race/Ethnicity Distribution of Women Veteran VHA Patients by Age, FY00-FY15 ................................26Exhibit 1.J. Race/Ethnicity Distribution of Women and Men Veteran VHA Patients by Age, FY00-FY15 ...............28Exhibit 1.K. Urban/Rural Status of Women Veteran VHA Patients, FY00-FY15 .............................................................30Exhibit 1.L. Urban/Rural Status of Women Veteran VHA Patients by Age, FY00-FY15 ...............................................31Exhibit 1.M. Urban/Rural Status of Women and Men Veteran VHA Patients by Age, FY00-FY15 ..............................32Exhibit 1.N. Service-Connected (SC) Disability Rating of Women Veteran VHA Patients, FY00-FY15 .....................34Exhibit 1.O. Service-Connected (SC) Disability Rating of Women Veteran VHA Patients by Age, FY00-FY15 .......35Exhibit 1.P. Service-Connected (SC) Disability Rating of Women and Men Veteran VHA Patients by Age, FY00-FY15 ..............................................................................................................................................36
PART 2: UTILIZATIONExhibit 2.A. VHA Outpatient Encounters Among Women Veteran VHA Patients, FY00-FY15 ...................................43Exhibit 2.B. VHA Outpatient Encounters Among Women Veteran VHA Patients by Age, FY00-FY15 .....................44Exhibit 2.C. VHA Outpatient Encounters Among Women and Men Veteran VHA Patients by Age, FY00-FY15 ....45Exhibit 2.D. Purchased Care Use Among Women Veteran VHA Patients, FY00-FY15 ..................................................47Exhibit 2.E. Purchased Care Use Among Women Veteran VHA Patients by Age, FY00-FY15 ....................................48Exhibit 2.F. Purchased Care Use Among Women and Men Veteran VHA Patients by Age, FY00-FY15 ...................49Exhibit 2.G. VHA Primary Care Encounters Among Women Veteran VHA Patients, FY00-FY15 ................................52Exhibit 2.H. VHA Primary Care Encounters Among Women Veteran VHA Patients by Age, FY00-FY15 ..................53Exhibit 2.I. VHA Primary Care Encounters Among Women and Men Veteran VHA Patients by Age, FY00-FY15 ..............................................................................................................................................55Exhibit 2.J. Setting of VHA Primary Care Clinic Encounters for Women Veteran VHA Patients, FY00-FY15 ..........58Exhibit 2.K. Setting of VHA Primary Care Clinic Encounters for Women Veteran VHA Patients by Age, FY00-FY15 ..............................................................................................................................................59Exhibit 2.L. VHA Mental Health/SUD Encounters Among Women Veteran VHA Patients, FY00-FY15 ....................62Exhibit 2.M. VHA Mental Health/SUD Encounters Among Women Veteran VHA Patients by Age, FY00-FY15 ..............................................................................................................................................63Exhibit 2.N. VHA Mental Health/SUD Encounters Among Women and Men Veteran VHA Patients by Age, FY00-FY15 ..............................................................................................................................................65

Sourcebook Vol. 4 - List of Exhibits
iv
Exhibit 2.O. Obstetrics/Gynecology Specialty Care by Setting (VHA and/or Purchased Care) Among Women Veteran VHA Patients, FY00-FY15 .......................................................................................68Exhibit 2.P. Obstetrics/Gynecology Specialty Care by Setting (VHA and/or Purchased Care) Among Women Veteran VHA Patients by Age, FY00-FY15 .........................................................................69Exhibit 2.Q. VHA-Covered Obstetric Deliveries Among Women Veteran VHA Patients, FY00-FY15 ........................71Exhibit 2.R. VHA-Covered Obstetric Deliveries Among Women Veteran VHA Patients by Age, FY00-FY15 ...........72
PART 3: HEALTH PROFILEExhibit 3.A. Age Distribution of Women Veteran VHA Patients within Age Groups, FY00 and FY15 .......................84Exhibit 3.B. Domain Frequencies Among Women Veteran VHA Patients, FY00 and FY15 ........................................86Exhibit 3.C. Domain Frequencies Among Women Veteran VHA Patients by Age, FY00 and FY15 ...........................88Exhibit 3.D. Top Five Domain Frequencies Among Women and Men Veteran VHA Patients by Age, FY00 and FY15 Panel A: Women and Men Veteran VHA Patients, Age 18-44 .....................................................................89 Panel B: Women and Men Veteran VHA Patients, Age 45-64 .....................................................................90 Panel C: Women and Men Veteran VHA Patients, Age 65+ ........................................................................90Exhibit 3.E. Age-Adjusted Odds Ratio (AOR) of Each Domain for Women Versus Men Veteran VHA Patients, FY00 and FY15 .....................................................................................................................................................91Exhibit 3.F. Condition Frequencies Among Women Veteran VHA Patients Overall and by Age, and Age-Adjusted Odds Ratio (AOR) of Each Condition for Women Versus Men, FY00 and FY15 .......................................92Exhibit 3.G. Top 20 Conditions in Women Veteran VHA Patients, FY00 and FY15 .....................................................101Exhibit 3.H. Top 20 Conditions in Women Veteran VHA Patients by Age, FY00 and FY15 Panel A: Women Veteran VHA Patients, Age 18-44 ....................................................................................104 Panel B: Women Veteran VHA Patients, Age 45-64 .....................................................................................105 Panel C: Women Veteran VHA Patients, Age 65+ ........................................................................................107Exhibit 3.I. Conditions with at Least 5% Increase in Frequency from FY00 to FY15 Among Women Veteran VHA Patients, by Age ..........................................................................................................110Exhibit 3.J. Conditions with at Least 5% Decrease in Frequency from FY00 to FY15 Among Women Veteran VHA Patients, by Age ..........................................................................................................111Exhibit 3.K. Age-Adjusted Odds Ratio (AOR) of 1.5 or Greater in Women Versus Men Veteran VHA Patients in FY15, with FY00 AOR Shown for Comparison ........................................................................................113
PART 4: GEOGRAPHIC DISTRIBUTIONExhibit 4.A. VHA Veterans Integrated Service Networks (VISN) Map, as of FY15.......................................................124Exhibit 4.B. Number of Women Veteran VHA Outpatients by VISN, FY00 and FY15 .................................................125Exhibit 4.C. Number of Women Veteran VHA Outpatients by Health Care System Panel A: FY00 ......................................................................................................................................................130 Panel B: FY15 ......................................................................................................................................................130

Sourcebook Vol. 4 - List of Acronyms
v
List of Acronyms
ADUSH Assistant Deputy Under Secretary for HealthAHRQ Agency for Healthcare Research & QualityAOR Adjusted Odds RatioASCUS Atypical Squamous Cells of Uncertain SignificanceCBOC Community-Based Outpatient ClinicCCS Clinical Classifications SoftwareCi2i Center for Innovation to ImplementationCLC Community Living CenterCMS Centers for Medicare and Medicaid ServicesCPT Current Procedural TerminologyDMDC Department of Defense Manpower Data CenterDOD Department of DefenseDRG Diagnostic Related GroupDSS Decision Support SystemFY Fiscal Year (October 1 to September 30)GAO Government Accountability OfficeHCUP Healthcare Cost and Utilization ProjectHERC Health Economics Resource CenterHIV/AIDS Human Immunodeficiency Virus/Acquired Immunodeficiency SyndromeHSR&D Health Services Research and DevelopmentICD-9-CM International Classification of Diseases, Ninth Revision, Clinical ModificationICD-10-CM International Classification of Diseases, Tenth Revision, Clinical ModificationMCA Managerial Cost AccountingNDEs National Data ExtractsNEPEC Northeast Program Evaluation Center, VA Office of Mental Health and Suicide PreventionOB/GYN Obstetrics/GynecologyOEF Operation Enduring FreedomOIF Operation Iraqi FreedomOMB Office of Management and BudgetOND Operation New DawnOPAT MCA Outpatient Costs FileORH Office of Rural HealthPACT Patient Aligned Care TeamPC Primary CarePCP Primary Care ProviderPERC Program Evaluation Resource Center, VA Office of Mental Health and Suicide PreventionPSSG Planning Systems Support Group

Sourcebook Vol. 4 - List of Acronyms
vi
PTSD Posttraumatic Stress DisorderQUERI VHA Quality Enhancement Research InitiativeRUCA Rural-Urban Commuting AreasSC Service-ConnectedSE/SF VHA Outpatient Encounter and Visit FilesSUD Substance Use DisorderTBI Traumatic Brain InjuryURH Urban Rural Highly Rural, one of VHA’s rural-urban classification systemsVBA Veterans Benefits AdministrationVA Department of Veterans AffairsVAMC Department of Veterans Affairs Medical CenterVAST VHA Site Tracking DatabaseVHA Veterans Health AdministrationVISN Veterans Integrated Service NetworksVSSC VHA Support Service CenterVSF Vital Status FileWATCH Women’s Assessment Tool for Comprehensive HealthWH-PCP Women’s Health Primary Care ProviderWHEI Women’s Health Evaluation InitiativeWHC Women’s Health ClinicWHS Women’s Health Services Program Office

Sourcebook Vol. 4 - Executive Summary
1
Executive Summary
The past two decades have seen unprecedented growth of the population of women Veterans coming to the Veterans Health Administration (VHA) for their care. Over this same period, VHA has rolled out numerous initiatives designed to improve access and quality of care for women Veterans. Since 2008, these efforts have been overseen nationally by the Women’s Health Services (WHS) program office.
WHS’s Women’s Health Evaluation Initiative (WHEI) analyzes centralized, national VHA databases to inform WHS strategic policy and program planning objectives. Among WHEI’s products have been a series of Sourcebooks. Like Sourcebook Volumes 1,1 2,2 and 3,3 the current Sourcebook—Volume 4—describes sociodemographic characteristics, health care utilization patterns, and medical conditions of women Veteran patients in VHA. However, Sourcebook Volume 4 includes more recent data and, for the first time, portrays longitudinal trends across a 16-year time horizon, focusing on cohorts of women Veterans using VHA at four Fiscal Year (FY) timepoints: FY00, FY05, FY10, and FY15.4 Sourcebook Volume 4 also provides information about cross-facility variability in the number of women Veteran patients over time. It examines women Veterans overall and by age group and compares women to men.5 Sourcebook Volume 4 thus provides a view of how the population of women Veterans using VHA has been evolving across a 16-year period coinciding with rapid VHA women’s health care delivery system advances, and points to directions for readying the system for future expansion of the number of women Veterans using VHA. Key findings and their implications follow.
Key Findings and ImplicationsSociodemographicsCohort Size
• An increasing share of all U.S. women Veterans have been using VHA: in FY00, 10% of U.S. women Veterans used VHA, whereas by FY15, 22% of U.S. women Veterans used VHA.
• The number of women Veterans in VHA nearly tripled between FY00 and FY15 (FY00: 159,810; FY15: 439,791); the number of men Veterans grew more slowly.
• Although continuing to be a numerical minority group in VHA, women represent an increasing share of VHA patients: in FY00, 4.7% of VHA patients were women, but by FY15, 7.5% were women.
ImplicationsIf growth continues at this pace and especially if market penetration increases among the large group of women Veterans who currently do not use VHA, accelerating demands on VHA delivery systems for women are anticipated.

Sourcebook Vol. 4 - Executive Summary
2
Age• In FY15, approximately 43% of women Veteran VHA patients were 18-44 years old, 46% were 45-64 years old,
and 12% were 65+ years old. Over the time period examined (FY00-FY15), the number of women in these age groups increased 2.3-fold, 4.3-fold, and 1.7-fold, respectively. The 55-64 year-old subgroup grew more than 7-fold over the 16-year period.
• Across this 16-year period, women were consistently younger on average than were men, although the age gap narrowed over time. By FY15, almost 90% of women were younger than 65 years old, whereas the majority of men were 65+ years old.
ImplicationsThe rapidly growing number of young women Veterans using VHA highlights the need to ensure ample capacity for clinical services necessary for women in their childbearing years, including reproductive health services. If the large 55-64 year-old cohort of women Veterans continues to use VHA, the already growing number of women Veterans reaching age 65 or older can be expected to dramatically increase over the coming decade; these women may require more intensive chronic disease care as they age.
Race/Ethnicity• The proportion of women Veteran VHA patients belonging to a racial/ethnic minority group increased from
FY00 to FY15 (FY00: 30%; FY15: 42%). • Among Veteran VHA patients under 65 years old, women were consistently more heterogeneous than their
male counterparts on race/ethnicity in every year examined, and this difference between women and men grew wider over time.
ImplicationsConsistent with VHA’s commitment to health equity, women’s growing racial/ethnic diversity in all age groups over time supports the importance of VHA providers’ efforts to ensure that services are sensitive to gender as well as to culture and to intersectionality (i.e., interactions) among gender, age, and race/ethnicity.

Sourcebook Vol. 4 - Executive Summary
3
Urban/Rural Status• The absolute number of women Veteran VHA patients with a rural residence increased over time.
ImplicationsThis highlights the challenge of ensuring high-quality, equitable, gender-specific VHA primary care services in areas remote from the main VHA facility, where low numbers of women reside. It also suggests a possible niche for programs that extend access to women’s primary care and specialty care, such as telemedicine or mobile clinics.
Service-Connected Disability Rating• The proportion of women Veteran VHA patients with a service-connected (SC) disability rating increased from
48% in FY00 to 63% in FY15. • A higher proportion of women than men had SC disability ratings in both FY00 and FY15 among 18-44 year-
olds and among 45-64 year-olds, but not among 65+ year-olds.
ImplicationsMore than half of women Veteran patients, some of whom are very young, now carry an SC disability rating. These women are eligible for lifelong VHA care for their SC conditions.
UtilizationOutpatient Utilization, VHA
• The number of women Veterans using VHA outpatient services was 155,430 in FY00 and 425,982 in FY15, nearly a 3-fold increase.
• In all years examined, higher proportions of women than men Veteran VHA patients had 12+ VHA outpatient encounters; by FY15, the majority of women Veterans had 12+ encounters during the year.
ImplicationsThe progressively increasing number of women Veterans choosing to use outpatient care in VHA highlights how crucial it is to ensure sufficient health care delivery system capacity to address their needs. As VHA projects resources needed for the future care of expanding numbers of women Veterans, the fact that women use VHA outpatient care more heavily than do men needs to be taken into account.

Sourcebook Vol. 4 - Executive Summary
4
Outpatient Utilization, Purchased Care• The proportion of women Veteran VHA patients with Purchased Care use increased over time (FY00: 26%;
FY15: 37%). • The absolute number of women who used Purchased Care services increased nearly 4-fold (FY00: 41,733;
FY15: 162,512).• In all age groups and all years, higher proportions of women than men Veteran VHA patients received some
services through Purchased Care. For example, in FY15, 37% of women versus 23% of men used Purchased Care.
ImplicationsOngoing efforts to examine the quality of outsourced care and to identify optimal approaches to coordination between VHA and Purchased Care providers are of great relevance for women as they navigate among distinct sources of care, particularly since reliance on Purchased Care is escalating following passage of the Veterans Access, Choice, and Accountability Act.
Total Primary Care Encounters• The absolute number of women Veteran VHA primary care patients more than tripled between FY00 and FY15,
from 123,156 in FY00 to 379,283 in FY15.• In every age group and in every year, a higher proportion of women than men had at least three primary care
encounters.
ImplicationsThe more than 300% growth in women Veteran VHA primary care users compares to less than 30% growth of the U.S. women Veteran population during the same period. More research is needed to understand whether women’s increased use of VHA primary care reflects greater satisfaction with VHA services; heightened need for treatment for conditions for which VHA has special expertise (e.g., mental health care, polytrauma); or other factors. With such rapid growth of the women Veteran primary care population, the VHA Women’s Health Primary Care Provider (WH-PCP) workforce must keep pace.
Primary care delivery systems in VHA evolved substantially over the 16-year time period examined. VHA implemented its medical home model (Patient Aligned Care Teams or PACT) in FY10. Also over the time period examined, VHA rolled out its Comprehensive Women’s Health Care policy, which included creation of a workforce of WH-PCPs primed for the care of women. Growth in the proportions of women Veterans using VHA primary care services between FY00 and FY15 is consistent with the success of such efforts to enhance primary care access for women Veterans.
The finding that women consistently use primary care more heavily than men, despite women’s younger average age, supports the concept that clinicians with a large number of women in their patient panels require adjustments in panel size and scheduling profiles to ensure sufficient access for women.

Sourcebook Vol. 4 - Executive Summary
5
Primary Care Encounters by Setting• The proportion of women Veteran VHA patients splitting their care between a women’s health clinic and a
general primary care clinic increased over the initial part of the period examined (FY00 to FY10), but then decreased between FY10 (when comprehensive women’s health care policy was established) and FY15.
ImplicationsTo reduce fragmentation of care, VHA policy (Handbook 1330.01) now sets the expectation that women Veterans will receive Comprehensive Women’s Health Care, i.e., both gender-neutral and gender-specific primary care services from a single Women’s Health Primary Care Provider (WH-PCP). Although this policy was only established in FY10, by FY15 there were 2,413 WH-PCPs VHA-wide; in FY15, 70% of women Veteran VHA patients were assigned to a WH-PCP.6 Sourcebook Volume 4 cannot assess temporal trends in women Veterans’ receipt of comprehensive care because this Sourcebook only examines settings of care (general primary care clinics versus women’s health clinics) and not provider type (WH-PCPs versus other PCPs). However, it is promising that the proportion receiving care in dual settings (gender-neutral primary care in one setting and gender-specific care in another) was lower in FY15 than it was in FY10 when the Comprehensive Women’s Health Care policy rolled out.
Mental Health/Substance Use Disorder (SUD) Specialty Care Encounters• Between FY00 and FY15, the number of women Veteran VHA patients using mental health/SUD specialty care
increased nearly 5-fold, reaching 176,526 women by FY15. During the same period, the number of men using mental health/SUD specialty care increased 2-fold.
• The proportion of women Veteran VHA patients with any mental health/SUD encounters increased between FY00 and FY15 (FY00: 23%; FY15: 40%).
ImplicationsIt is not known whether women’s increasing use of VHA mental health/SUD specialty services—which is occurring despite U.S. health care reform that has increased women’s options for alternatives to VHA care—reflects improvements in connecting Veterans with VHA services post-deployment, increased prevalence of mental health/SUD conditions, improved patient perceptions of VHA mental health/SUD specialty care, or other factors.
VHA is recognized for its longstanding expertise and leadership in mental health/SUD specialty care. It appears that such services may be of importance for the substantial subset of women Veterans who require this type of care. Since women Veterans with mental health/SUD conditions may have an excess burden of comorbid medical illness, coordination with primary care and medical specialty services is also important for women who use VHA mental health/SUD clinics.

Sourcebook Vol. 4 - Executive Summary
6
Obstetrics/Gynecology Specialty Care Encounters• Between FY00 and FY15, the absolute number of women Veteran VHA patients with a VHA and/or Purchased
Care obstetrics/gynecology specialty visit more than doubled (FY00: 21,789; FY15: 52,386).
ImplicationsThese findings support the importance of VHA’s efforts to expand its obstetrics/gynecology provider workforce and to expand the geographic distribution of obstetrics/gynecology providers in VHA facilities nationwide.
Obstetric Deliveries • The number of women Veteran VHA patients with obstetric deliveries paid for by VHA increased more than
14-fold between FY00 and FY15 (FY00: 260; FY15: 3,756). The number of women age 35 years or older with deliveries increased 16-fold from FY00 to FY15.
ImplicationsThe precipitous rise in deliveries has outpaced growth in the number of women Veterans of childbearing age. This suggests that women Veterans increasingly are relying on VHA for this service, perhaps in part because the benefits package has improved over time or because of improved patient experiences: for example, VHA-based Maternity Care Coordinators are now available to assist women during their pregnancies. If deliveries continue to increase at their current pace, such coordination services will become even more crucial. This is especially true, given that many women Veterans with obstetric deliveries have risk factors for adverse pregnancy outcomes, including advanced maternal age (35+ years old) or serious comorbidities like posttraumatic stress disorder (PTSD).

Sourcebook Vol. 4 - Executive Summary
7
Health ProfileDomains
• In some respects, there has been consistency over time in women Veteran VHA patients’ health profile: four broad “domains” of medical conditions (Musculoskeletal, Endocrine/Metabolic/Nutritional, Mental Health/SUD, and Cardiovascular) were in the top five domains for women in both FY00 and FY15. For women 18-44 years old, the Reproductive Health domain likewise was consistently in the top five in both years, and for women 65+ years old, the Sense Organ and Gastrointestinal domains were also consistently in the top five.
• However, there also have been substantial changes over time in women Veteran VHA patients’ health profile. Between FY00 and FY15, each of the top domains has shown a marked expansion in absolute numbers of the population of women with these conditions. Domains for which frequency increased by at least 15% among women from FY00 to FY15 were Mental Health/SUD, Endocrine/Metabolic/Nutritional, and Musculoskeletal.
ImplicationsAlthough there has been stability in a large segment of the menu of core services that VHA needs to offer to women, there has been a huge increase in the number of women requiring such services, with a corresponding need for sufficient primary care and specialty care capacity to meet that demand.
Conditions Across the Age Spectrum: 18-44 Year-Olds• Among the youngest cohort of women Veteran VHA patients (18-44 years old), several mental health
conditions (depression, anxiety disorders, PTSD) were among the top 10 conditions in FY15; indeed, half of 18-44 year-old women in FY15 had a mental health condition. From FY00 to FY15, the number of 18-44 year-old women with a diagnosed condition in the Mental Health/SUD domain increased 4-fold, driven in part by a 7-fold increase in the number of women with PTSD and a 7-fold increase in the number with anxiety disorders.
• Many other conditions were also prevalent in the youngest age group; for example, their top 10 conditions in FY15 also included pain-related conditions (headache, spine disorders, joint disorders); cardiovascular risk factors (overweight/obesity); and reproductive health issues (contraceptive care management).
• Although Traumatic Brain Injury (TBI) did not fall within the top conditions for the 18-44 year-old age group, its prevalence increased 5-fold from FY00 to FY15, from 0.4% to 2.0%.
ImplicationsWith the shifting age distribution of women Veteran VHA patients over time, VHA must also be alert to the fact that the health profile of women differs across the age spectrum.
In the 18-44 year-old cohort, mental health and musculoskeletal conditions are common. Because the FY00 cohort served prior to the 9/11 attacks, the higher rate of PTSD and anxiety diagnoses in the FY15 cohort could be related in part to military deployment to war, as well as to improved screening or more women seeking treatment. It is not known what proportion of the musculoskeletal conditions for which women seek VHA care is related to their military service, but polytrauma and focal injuries that can lead to chronic pain are common in deployed populations. The five-fold

Sourcebook Vol. 4 - Executive Summary
8
increase in Traumatic Brain Injury diagnoses over time could reflect injuries sustained in Operation Enduring Freedom/Operation Iraqi Freedom/Operation New Dawn (OEF/OIF/ OND) and other conflicts or enhanced detection due to universal screening of Veterans returning from deployment.
Addressing the reproductive health needs of this age cohort, such as contraceptive care and treatment of other gender-specific conditions, requires clinicians who are knowledgeable about modern approaches to treatment; VHA’s workforce of Women’s Health Primary Care Providers receives training through Women’s Health Mini-Residencies. Given the high rates of PTSD in this reproductive-age population, skills in trauma-sensitive pelvic examinations represent core competencies for clinicians caring for this population.
Conditions Across the Age Spectrum: 45-64 Year-Olds• The middle age group (45-64 years old) represents the largest group of women Veteran VHA patients. Among
them, the top 10 conditions in FY15 included cardiovascular risk factors (hypertension, lipid disorders, overweight/obesity); mental health conditions (depression); painful conditions (joint and spine disorders); and other conditions (eye and dermatologic disorders).
• The number of women in the 45-64 year-old age group with a diagnosed Musculoskeletal condition increased 6-fold from FY00 to FY15.
• Cancers tend to be lower prevalence conditions, but are associated with high morbidity and mortality. Therefore, it is notable that in the 45-64 year-old group, the number of women with a breast cancer diagnosis increased 5-fold over this time period; by FY15, 3% of 45-64 year-old women Veteran VHA patients carried a breast cancer diagnosis.
ImplicationsThe high rate of cardiovascular risk factors among women Veterans 45-64 years old presents an opportunity for population health interventions aimed at reducing risk. Intervening at this stage is key, before women enter older age and face potentially irreversible end-organ damage like myocardial infarction, among the leading causes of death in women.
Musculoskeletal conditions can impact quality of life and the number of women in this age group with these conditions has increased 6-fold. It is therefore important for VHA’s numerous services—including rheumatology, orthopedics and pain clinics, complementary and integrative health programs, rehabilitative care and prosthetics services, among others—to take the needs of women Veterans into account.
Mental health symptoms such as depression likewise attenuate quality of life. VHA facilities should ensure that women feel welcome and safe at all mental health points of care, from waiting rooms to group therapy visits to inpatient wards. Across all primary care and specialty care settings, treatment of mental health conditions must account for gendered issues, such as the fact that depression, PTSD, anxiety disorders, and substance use disorders are common sequelae of military sexual trauma, which is far more common in women Veterans than in men.

Sourcebook Vol. 4 - Executive Summary
9
The jump in breast cancer diagnoses in this age group could reflect a true increase in prevalence or improvements in screening and documentation, especially of care received outside VHA. In 2016, VHA rolled out a national mammography tracking system to support screening and to facilitate timely follow-up of abnormal studies. Despite such advances, breast cancer care is complex: coordination across services and disciplines needs to be seamless, including for women who receive part of their breast cancer care through Purchased Care.
Conditions Across the Age Spectrum: 65+ Year-Olds• For women Veteran VHA patients in the oldest age group (65+ years old), the top 10 conditions in FY15
included cardiovascular risk factors (hypertension, lipid disorders, diabetes mellitus); painful conditions (joint disorders); and other conditions (eye, thyroid, esophageal, and dermatologic disorders). By FY15, 6% of women in the 65+ year-old group carried a breast cancer diagnosis, representing a 2-fold numeric increase compared to FY00.
• Diabetes mellitus afflicted nearly 1 in 4 women Veterans in the 65+ year-old age group by FY15. • Although mental health conditions were less prevalent among the 65+ age group, there was a notable
increase in the mental health/SUD domain in this age group (from 19% in FY00 to 31% in FY15), driven in large part by increases in depression, PTSD, and anxiety disorders.
ImplicationsThe upward shift in mental health condition prevalence in the 65+ year-old group of women could reflect in part the aging of the Vietnam era population, in whom high rates of PTSD have been documented. Comorbid mental health conditions will add to case complexity for women Veterans as they age; this is of particular importance given the high rates of serious medical conditions like diabetes in this population.
Maintaining independence can be another priority for older women. Treating musculoskeletal conditions can help reduce pain, in turn improving sleep, functional status, deconditioning, falls risk, mobility, and mental health status. Rehabilitative services, home-based care, and treatment of sense organ conditions (such as vision or hearing services) may prevent or delay the need for transitions to long-term care settings in this age group.

Sourcebook Vol. 4 - Executive Summary
10
Conditions by Sex• Across years, condition frequency varied by gender. In FY15, women Veteran VHA patients had marked
(at least three times) higher age-adjusted odds than men of having a number of conditions exclusively or predominantly seen in women (reproductive health issues, breast conditions), but also the following gender-neutral conditions: urinary conditions (urinary tract infection, incontinence); mental health conditions (eating disorders, dissociative disorders); malignancy (thyroid cancer); endocrine conditions (thyroid disorders, osteoporosis); and musculoskeletal conditions (connective tissue disease, myalgia/myositis).
ImplicationsEven conditions that are less common in women than in men Veteran patients, such as coronary artery disease, may have different clinical presentations or management issues in women compared to men, potentially posing challenges for some VHA providers who have historically cared for a male-predominant patient population. To mitigate these gaps, VHA has trained over 3,700 primary care providers through Women’s Health Mini-Residency programs.
Geographic Distribution
VHA care delivery occurs in Health Care Systems, which are most often composed of a flagship VA Medical Center and a cluster of surrounding Community-Based Outpatient Clinics (CBOCs). Health Care Systems are organized into Veterans Integrated Service Networks (VISNs), with each VISN representing a broad geographic area of the United States.
VISNs• Between FY00 and FY15, the number of women Veteran VHA outpatients grew at least 3-fold in VISNs 5, 6, 7,
17, and 19. • Over the same period, the absolute number of women Veteran VHA outpatients grew by at least 15,000 in
VISNs 6, 7, 8, 16, 17, and 22.
Health Care Systems• Between FY00 and FY15, the number of women Veteran VHA outpatients grew at least 4-fold in eight facilities:
Ann Arbor MI, Salt Lake City UT, Dublin GA, Atlanta-Decatur GA, Salisbury NC, Hampton VA, St. Cloud MN, and Fayetteville NC.
• Over the same period, the absolute number of women Veteran VHA outpatients grew by at least 5,000 women at 15 Health Care Systems.

Sourcebook Vol. 4 - Executive Summary
11
ImplicationsThe rapid growth between FY00 and FY15 in the number of women Veterans using VHA touched every VISN and every Health Care System, highlighting the importance of delivering augmented women’s health services at every point of care in VHA.
At some facilities, the proportional and/or numeric growth of the women Veteran population has been particularly dramatic, potentially straining sites’ capacity to provide timely access to women. Given the continued growth of women in military service, combined with increasing market penetration (i.e., a greater proportion of eligible women Veterans electing to enroll in VHA), expansion is projected to continue. At all sites, long-range strategic planning must address the capacity to provide for the growing population of women Veterans, including staffing with designated Women’s Health Primary Care Providers, initiatives to reduce risk of burnout of the women’s health workforce, and access to gender-tailored services, as well as measures to ensure an environment of care and VHA culture that welcomes women Veterans and acknowledges their military service.

Sourcebook Vol. 4 - Executive Summary
12
Endnotes1 Frayne SM, Phibbs CS, Friedman SA, Berg E, Ananth L, Iqbal S, Hayes PM, Herrera L. Sourcebook: Women Veterans in the Veterans Health
Administration. Volume 1. Sociodemographic characteristics and use of VHA care. Women Veterans Health Strategic Health Care Group, Veterans Health Administration, Department of Veterans Affairs, Washington DC. December 2010. Available at http://www.va.gov/vhapublications/ViewPublication.asp?pub_ID=2455.
2 Frayne SM, Phibbs CS, Friedman SA, Saechao F, Berg E, Balasubramanian V, Bi X, Iqbal S, Mattocks K, Haskell S, Zephyrin L, Torgal A, Whitehead A, Hayes PM. Sourcebook: Women Veterans in the Veterans Health Administration. Volume 2. Sociodemographics and use of VHA and Non-VA Care (Fee). Women’s Health Services, Veterans Health Administration, Department of Veterans Affairs, Washington DC. October 2012. Available at www.womenshealth.va.gov/WOMENSHEALTH/docs/SourcebookVol2_508c_FINAL.pdf.
3 Frayne SM, Phibbs CS, Saechao F, Maisel NC, Friedman SA, Finlay A, Berg E, Balasubramanian V, Dally SK, Ananth L, Romodan Y, Lee J, Iqbal S, Hayes PM, Zephyrin L, Whitehead A, Torgal A, Katon JG, Haskell S. Sourcebook: Women Veterans in the Veterans Health Administration. Volume 3. Sociodemographics, utilization, costs of care, and health profile. Women’s Health Evaluation Initiative, Women’s Health Services, Veterans Health Administration, Department of Veterans Affairs, Washington DC. February 2014. Available at https://www.womenshealth.va.gov/womenshealth/docs/sourcebook_vol_3_final.pdf.
4 Many patients use VHA on an ongoing basis, and so an individual patient may appear in more than one year’s cohort.5 Data in Sourcebook Volume 4 must be interpreted subject to several caveats: (1) The data represent only Veterans who used VHA care in the
years examined (FY00, FY05, FY10, FY15), rather than all Veterans. The characteristics of Veterans who did not choose to use VHA could differ from the characteristics of those who did. (2) This report does not examine non-Veteran women who used VHA services. (3) Utilization data include outpatient VHA care and Purchased Care but do not include all care provided by VHA through contracts outside VHA, nor care received privately by women who use VHA. (4) Description of the health profile of women Veteran VHA patients is based upon International Classification of Diseases, Ninth Revision, Clinical Modification (ICD-9-CM) diagnosis codes, aggregated into 202 “conditions”; these conditions are in turn aggregated into 17 broad “domains.” This report describes the rate at which these ICD-9-CM codes appear in patients’ VHA or Purchased Care outpatient or inpatient administrative records; this should not be interpreted as indicating the “prevalence” of these conditions in an epidemiologic sense. (5) Other than age-adjusted odds ratios presented for sex differences in frequency of medical conditions, all data in Sourcebook Volume 4 are descriptive; no other statistical significance testing is presented for the differences described here.
6 United States Department of Veterans Affairs, Veterans Health Administration, VHA Support Service Center. (2016) Women’s Assessment Tool for Comprehensive Health (WATCH). Retrieved from organization’s secure Intranet. Accessed June 21, 2017.

Sourcebook Vol. 4 - Introduction
13
Introduction
BackgroundDespite women serving in every United States military conflict since the American Revolution, historically their specific needs received little attention in the Veterans Health Administration (VHA). When the congressional Government Accountability Office (GAO) released its first comprehensive report addressing VHA care for women Veterans in 1982, women represented an extreme numeric minority group within an organization originally designed to meet the health care needs of men. Reports by the GAO and the VA Office of Inspector General in the late 1980s and early 1990s documented quality gaps in VHA women’s health care delivery.
By the mid-1990s, major change had begun. Over the ensuing years, VHA began rolling out numerous initiatives designed to improve access and quality of care for women Veterans. Among these were Comprehensive Women Veterans Health Centers, Continuing Medical Education offerings in women’s health, postdoctoral fellowship training programs in women’s health, the Women’s Health Sciences Division of the National Center for PTSD, women’s mental health specialty programs, a national Military Sexual Trauma Support team, and active solicitation of women’s health services research projects.
Building on these earlier achievements, in late 2008 VA’s Women’s Health Services (WHS) launched a plan to redesign the women’s health care delivery system within VHA; the plan was detailed in VHA Handbook 1330.01 in 2010.1 A fundamental component of this new vision was to ensure that women Veterans receive comprehensive primary care from Women’s Health Primary Care Providers (WH-PCPs)2 proficient in women’s health care. Every VHA Health Care System in the United States now has a full-time Women Veterans Program Manager tasked with advocating for the health care needs of women using that facility. Mini-residencies in women’s health with didactic and practicum components have been disseminated system-wide to enhance clinician proficiency; over 3,700 health care providers have been trained to date in this national program. Under a new collaboration with the VHA Office of Rural Health, a pathway for accelerating access to women’s health training for rurally based primary care providers recently has been established. Meanwhile, VHA is actively recruiting additional providers with experience in women’s health care. Numerous initiatives have been launched to improve access to state-of-the-art reproductive health care, mental health services, and emergency services for women Veterans; still others have focused on enhancing care coordination through technological innovations such as registries and mobile applications. With the tagline, “You Served, You Deserve the Best Care Anywhere,” communications initiatives have raised awareness about the top-notch health care services women Veterans should expect at every VHA facility. WHS oversees these efforts nationally.
As part of this dynamic systems redesign, WHS identified the need for data to inform policy and program planning. Although highly informative data on women Veterans are available from the research literature3,4,5 and from various VHA reports (e.g., VHA Office of Policy and Planning and the searchable VHA Support Service Center (VSSC) Data Cube), WHS identified the need for detailed data specifically tailored to its strategic planning objectives.

Sourcebook Vol. 4 - Introduction
14
To address this need, WHS approached women’s health investigators with expertise in large database research at the VA Health Services Research and Development (HSR&D) Center for Innovation to Implementation (Ci2i)6 and the VA Health Economics Resource Center (HERC)7 at VA Palo Alto Health Care System. The resulting partnership was called the Women’s Health Evaluation Initiative, or WHEI. Since 2009, WHEI has been conducting analyses in response to queries by WHS. The analyses that WHEI produces are relevant to groups beyond WHS, including policymakers, clinicians, researchers, advocates, and women Veterans. To facilitate dissemination of information to a broader audience, a series of Sourcebooks present major findings regarding key characteristics of women Veterans.
Sourcebook Volume 4 builds on the prior Sourcebook Volumes 1-3. Volume 18 described sociodemographic characteristics and VHA health care utilization of women Veterans in fiscal year 2009 (FY09). Volume 29 provided updated information for FY10 and described urban/rural status, as well as women Veterans’ use of Purchased Care.10 Volume 311 provided updates through FY12 and also included information about women Veterans’ race/ethnicity; service in Operation Enduring Freedom/Operation Iraqi Freedom/Operation New Dawn (OEF/OIF/OND); costs of care; and medical conditions. The current report, Volume 4, characterizes longitudinal trends in sociodemographic characteristics, health care utilization, and health conditions of women Veterans who used VHA in FY00, FY05, FY10, and/or FY15; it also provides information about trends in cross-facility variability in the number of women Veteran patients over time.
MethodsOverview. For women Veterans who received medical care in VHA in FY00, FY05, FY10, or FY15, this volume presents the number of women VHA patients and their age, race/ethnicity, urban/rural status, and service-connected (SC) disability rating status (Part 1); their utilization of outpatient VHA services and Purchased Care services (Part 2); their health profile (Part 3); and their geographic distribution (Part 4) at each of the four time points examined. Analyses in this volume reflect patient sex; self-identified gender identity data were not available for the years examined.
Data for this volume were derived from the following centralized VHA administrative files: Office of the Assistant Under Secretary for Health (ADUSH) Monthly Enrollment File, VHA Medical SAS Datasets, Non-VA Inpatient Stays files, Purchased Care outpatient and inpatient files, VHA Vital Status File, VA OEF/OIF/OND Roster, VHA Site Tracking Database, and the Managerial Cost Accounting (MCA)12 National Data Extracts (NDEs), all described in the Online Appendix (Technical Appendix), available at http://www.womenshealth.va.gov/WOMENSHEALTH/sourcebookvol4onlineappendix.asp. Data sources for variable creation span a 16-year period from fiscal year 2000 through fiscal year 2015 (FY00–FY15).
Cohorts of VHA patients examined. This volume examines the characteristics of four separate cohorts of patients: women Veterans who used VHA services at least once in FY00, in FY05, in FY10, or in FY15. For benchmarking purposes, men Veteran VHA patients are also examined in each of these years. Note that many patients use VHA on an ongoing basis, and so an individual patient may appear in more than one year’s cohort. Veterans enrolled in VHA who did not use VHA services in any of the years examined are not included in this volume. Non-Veterans who used VHA services (e.g., with eligibility through CHAMPVA or TriCare) also are not included in this volume. For all analyses in Parts 1-3 of Sourcebook Volume 4, percentages presented include Veteran VHA “patients” in the denominator; “patients” are those who used any type of outpatient or inpatient care through VHA and/or through Purchased Care during the fiscal year being examined.13,14,15 For analyses in Part 4, percentages presented include Veteran VHA “outpatients” in the denominator.

Sourcebook Vol. 4 - Introduction
15
The number of women Veteran VHA patients in the denominator, by year, was:• FY00: 159,810• FY05: 231,907• FY10: 317,122• FY15: 439,791
The number of men Veteran VHA patients in the denominator, by year, was:• FY00: 3,226,313• FY05: 4,569,951• FY10: 5,034,458• FY15: 5,450,283
Note that for some of the analyses reported in Sourcebook Volume 4, a slightly smaller denominator is used. This is because of missing data for some variables. For example, a slightly smaller denominator is used for analyses reporting results by age, due to missing date of birth data for a small number of Veterans.
Patient characteristics examined. Sociodemographic characteristics examined in this volume are age, race/ethnicity, urban/rural status, and service-connected disability rating. This volume examines several specific types of outpatient utilization: total outpatient utilization through VHA or Purchased Care,16 primary care, mental health/substance use disorder care, and reproductive health care. Women Veterans’ health profiles—individual medical conditions and broad condition domains—are also characterized. The geographic distribution of women Veteran patients across the United States is also presented. See Online Appendix for details of the algorithms used to create these variables and other supplemental materials.17
Analyses. All data in this volume are descriptive, other than age-adjusted odds ratios presented for sex differences in frequency of medical conditions or condition domains. All analyses are stratified by cohort year (FY00, FY05, FY10, FY15).
Part 1 (Sociodemographics) first examines the number of Veteran VHA patients by sex, benchmarked against the number of Veterans in the United States and also examines women as a proportion of all VHA patients. It then describes key sociodemographic characteristics, first among women Veterans and then by sex and age group.
The analyses in Part 2 (Utilization) describe overall and specific types of outpatient service utilization in VHA and through Purchased Care overall and by sex and age group, as well as inpatient obstetric deliveries among women Veterans.
The analyses in Part 3 (Health Profile) describe specific medical conditions and broad condition domains based on the presence of International Classification of Diseases 9th Revision–Clinical Modification (ICD-9-CM) diagnosis codes in the VHA administrative files (i.e., VHA Outpatient Event files, VHA Inpatient Main and Bed Section files, and Purchased Care outpatient and inpatient files). Related diagnoses are grouped into mutually exclusive “conditions,” and related conditions are then aggregated into broader “domains.” Part 3 reports domain and condition frequencies overall and by age group for women Veterans, as well as age-adjusted odds ratios for women compared to men Veteran patients.
Part 4 (Geographic Distribution) describes how women Veteran outpatients are geographically distributed at VHA facilities around the country and across Veterans Integrated Service Networks (VISNs).

Sourcebook Vol. 4 - Introduction
16
Endnotes1 Veterans Health Administration. Health care services for women Veterans. (VHA Handbook 1330.01). Washington, DC: US Department of Veterans
Affairs, 2010. Available at https://www.va.gov/vhapublications/ViewPublication.asp?pub_ID=5332.2 Earlier versions of VHA Handbook 1330.01 referred to WH-PCPs as “designated women’s health providers.”3 Danan E, Ensrud K, Krebs E, Koeller E, Greer N, Velasquez T, MacDonald R, Wilt, TJ. An evidence map of the women Veterans’ health research
literature (2008 – 2015). VA ESP Project #09-009; 2016.4 Bean-Mayberry B, Yano EM, Washington DL, et al. Systematic review of women Veterans’ health: Update on successes and gaps. Women’s Health
Issues. 2011;21(4 Suppl), S84-97. 5 Yano EM, Frayne SM. Health and health care of women Veterans and women in the military: Research informing evidence-based practice and
policy. Women’s Health Issues. 2011;21(4 Suppl):S64-66.6 https://www.ci2i.research.va.gov/CI2IRESEARCH/index.asp7 https://www.herc.research.va.gov/include/page.asp?id=home 8 Frayne SM, Phibbs CS, Friedman SA, Berg E, Ananth L, Iqbal S, Hayes PM, Herrera L. Sourcebook: Women Veterans in the Veterans Health
Administration. Volume 1. Sociodemographic characteristics and use of VHA care. Women Veterans Health Strategic Health Care Group, Veterans Health Administration, Department of Veterans Affairs, Washington DC. December 2010. Available at www.va.gov/vhapublications/ViewPublication.asp?pub_ID=2455.
9 Frayne SM, Phibbs CS, Friedman SA, Saechao F, Berg E, Balasubramanian V, Bi X, Iqbal S, Mattocks K, Haskell S, Zephyrin L, Torgal A, Whitehead A, Hayes PM. Sourcebook: Women Veterans in the Veterans Health Administration. Volume 2. Sociodemographics and use of VHA and Non-VA Care (Fee). Women’s Health Services, Veterans Health Administration, Department of Veterans Affairs, Washington DC. October 2012. Available at http://www.womenshealth.va.gov/WOMENSHEALTH/docs/SourcebookVol2_508c_FINAL.pdf.
10 Note that the official term for care that VHA purchases for its patients has evolved over the 16-year time period covered by Sourcebook Volume 4; terms have included “Fee Basis Care,” “Non-VA Medical Care,” and, more recently, “Care in the Community.” Information about the VHA Office of Community Care is available at https://www.va.gov/communitycare/ (accessed June 2017). For parsimony of cross-year terminology, this Sourcebook uses the term “Purchased Care” across all years (even in FY15, when VHA provided purchased care not only through fee basis care but also through the Veterans Choice program), to distinguish this type of non-VA care from other types of care that VHA patients might receive outside of VHA (e.g., care funded through Medicare, private insurance, etc.).
11 Frayne SM, Phibbs CS, Saechao F, Maisel NC, Friedman SA, Finlay A, Berg E, Balasubramanian V, Dally SK, Ananth L, Romodan Y, Lee J, Iqbal S, Hayes PM, Zephyrin L, Whitehead A, Torgal A, Katon JG, Haskell S. Sourcebook: Women Veterans in the Veterans Health Administration: Volume 3. Sociodemographics, utilization, costs of care, and health profile. Women’s Health Evaluation Initiative, Women’s Health Services, Veterans Health Administration, Department of Veterans Affairs, Washington DC. February 2014. Available at https://www.womenshealth.va.gov/womenshealth/docs/sourcebook_vol_3_final.pdf.
12 Formerly Decision Support System, or DSS13 Specifically, “patients” are those identified as having used any VHA care (i.e., outpatient VHA care, outpatient Purchased Care, inpatient VHA care,
inpatient Purchased Care, or one of several other categories of care) in the fiscal year being examined, based on the ADUSH Enrollment File. See Online Appendix (Technical Appendix) at http://www.womenshealth.va.gov/WOMENSHEALTH/sourcebookvol4onlineappendix.asp.
14 For cross-analysis consistency, Sourcebook Volume 4 uses the “patients” denominator for all analyses, with the exception of Part 4, Geographic Distribution. This represents a slight modification from the prior Sourcebook (Volume 3). For analyses related to utilization of specific types of outpatient care, Sourcebook Volume 3 used an “outpatients” denominator. However, the difference between the “patients” denominator and the “outpatients” denominator is small, and so this change of approach in Sourcebook Volume 4 would have only a small impact on proportions reported. For example, in FY15, there were 439,791 women Veteran patients, of whom only 6,266 received no outpatient care.
15 In each year there was also a small group of patients for whom sex data were missing, for whom sex could not be categorized (see Online Appendix (Technical Appendix) at http://www.womenshealth.va.gov/WOMENSHEALTH/sourcebookvol4onlineappendix.asp); they are not included in any of the denominators.
16 Inpatient utilization and costs of VHA care are not characterized in this volume; however, data on inpatient utilization are available in Sourcebook Volume 1, and data on cost are available in Sourcebook Volume 3.
17 Available at http://www.womenshealth.va.gov/WOMENSHEALTH/sourcebookvol4onlineappendix.asp.

Sourcebook Vol. 4 - Part 1: Sociodemographics
17
Part 1. Sociodemographics
Overview Part 1 reports on the sociodemographic characteristics of Veteran VHA patients. New in Volume 4, compared with prior volumes, is an extended time horizon for the data provided (16 years).
Part 1 is organized into five sections, each reporting the following characteristics of women and men Veterans who used VHA in FY00, FY05, FY10, and/or FY15:
• Cohort size• Age • Race/ethnicity • Urban/rural status • Service-connected disability rating status
Implications for policy and practice, derived from the findings, appear at the end of each section.

Sourcebook Vol. 4 - Part 1: Sociodemographics
18
Exhibit 1.A. Number of Women and Men Veteran VHA Patients, FY00-FY15
Key: FY - Fiscal Year; VHA – Veterans Health AdministrationNotes: Findings portray Veteran VHA patients, not the entire Veteran population. See Technical Appendix.Cohort: Women and men Veteran VHA patients. Women: FY00: N=159,810; FY05: N=231,907; FY10: N=317,122; FY15: N=439,791. Men: FY00: N=3,226,313;
FY05: N=4,569,951; FY10: N=5,034,458; FY15: N=5,450,283.Source: WHEI Master Database, FY00-FY15
3,226,313
4,569,951 5,034,458
5,450,283
0
1,000,000
2,000,000
3,000,000
4,000,000
5,000,000
6,000,000
FY00 FY05 FY10 FY15
# Men
Vet
eran
Pat
ients
159,810
231,907
317,122
439,791
0 50,000
100,000 150,000 200,000 250,000 300,000 350,000 400,000 450,000 500,000
FY00 FY05 FY10 FY15
# Wom
en V
eter
an P
atien
ts
Cohort SizeWomen and men Veterans using VHA. The number of women Veterans using VHA services grew from 159,810 in FY00 to 439,791 in FY15, representing a 2.8-fold increase over 16 years. In contrast, the number of men Veterans in VHA grew more slowly, from 3,226,313 to 5,450,283, only a 1.7-fold increase (Exhibit 1.A).
Although women Veterans continued to be a numerical minority group in VHA, women increased as a proportion of all VHA patients during this period (FY00: 4.7%; FY05: 4.8%; FY10: 5.9%; FY15: 7.5%) (data not represented graphically in Exhibit 1.A).
Women and men in VHA compared with all U.S. Veterans. During the FY00-FY15 time period, an increasing proportion of the entire U.S. population of women Veterans used VHA. Exhibit 1.B (left panel) shows that the estimated number of women Veterans in the United States1,2,3,4 increased across this period (FY00: 1,593,254; FY15: 2,035,213). In parallel, the number of women Veterans using VHA has increased at an even faster pace (FY00: 159,810; FY15: 439,791). Therefore, the proportion of women Veterans in the United States using VHA increased over this period (FY00: 10% of U.S. women Veterans; FY15: 22% of U.S. women Veterans).
A different pattern emerged for men during this same period (right panel, Exhibit 1.B). The estimated number of men Veterans in the United States dropped from FY00 to FY15 (FY00: 24,810,449; FY15: 19,645,321). Despite the more modest rate of growth of the men Veteran population in VHA (compared with women), men using VHA did increase numerically (FY00: 3,226,313; FY15: 5,450,283) and as a proportion of all men Veterans in the United States (FY00: 13% of U.S. men Veterans; FY15: 28% of U.S. men Veterans).

Sourcebook Vol. 4 - Part 1: Sociodemographics
19
Exhibit 1.B. Number of Women and Men Veteran VHA Patients, as Compared with the Estimated Total Veteran Population in the United States, FY00-FY15
Key: FY - Fiscal Year; VHA – Veterans Health AdministrationNotes: Findings portray Veteran VHA patients (colored bars) and the estimated number of Veterans in the United States (colored lines). See Technical Appendix.Cohort: Women and men Veterans in the United States and in VHA in each year. Sources: U.S. Census Bureau, VetPop, and WHEI Master Database, FY00-FY15
159,810 231,907 317,122 439,791
1,593,254 1,695,000
1,840,000 2,035,213
0 200,000 400,000 600,000 800,000
1,000,000 1,200,000 1,400,000 1,600,000 1,800,000 2,000,000 2,200,000
FY00 FY05 FY10 FY15
3,226,313 4,569,951 5,034,458 5,450,283
24,810,449 22,434,000
20,818,000 19,645,321
0
5,000,000
10,000,000
15,000,000
20,000,000
25,000,000
30,000,000
FY00 FY05 FY10 FY15
# Wom
en V
eter
ans
# Men
Vet
eran
sNOTES TO INTERPRETATION: These longitudinal data reflect dynamic cohorts. The number of Veteran VHA patients in a particular fiscal year reflects the aggregate number who used VHA at least once during that fiscal year; an individual Veteran might have used VHA in only one year or might have used VHA (continuously or intermittently) across more than one year. The same is true for estimates of the number of Veterans in the United States in any particular fiscal year. The same individual might be a Veteran in more than one fiscal year, but in any given year new Veterans join the cohort (e.g., when they are discharged from active duty) and other Veterans leave the cohort (e.g., due to death or because they re-enlist or change to active duty status).
These data reflect the VHA system at a national level. Specific geographic regions or individual VHA facilities may have experienced greater or lesser increases in the women Veteran patient population (see Part 4).
This section presents the estimated proportion of the U.S. Veteran population who used VHA in each year examined. The focus here is on Veterans who used VHA in a particular year, not on all Veterans who were enrolled in VHA in a particular year.
Implications
The number of women Veterans using VHA services nearly tripled in the past 16 years. During the same period, the share of the U.S. women Veteran population choosing to use VHA surged, so that by FY15, more than one in five U.S. women Veterans were coming to VHA for services. If growth continues at this pace, and especially if market penetration increases among the large group of women Veterans who currently do not use VHA, accelerating demands on VHA delivery systems for women are anticipated.

Sourcebook Vol. 4 - Part 1: Sociodemographics
20
Exhibit 1.C. Timeline: War Eras and Their Potential Relationship to Age Cohorts
Key: FY - Fiscal Year; OEF/OIF/OND–Operation Enduring Freedom/Operation Iraqi Freedom/Operation New Dawn Sources: WHEI synthesis of dates extracted from the Office of the Federal Register and U.S. Congressional Research Service
1930 2010200520001995199019851980197519701965196019551950194519401935 2015
World War II12/07/194112/31/1946
Korean Conflict10/07/195010/20/1954
Vietnam Era02/28/196105/07/1975
Persian Gulf War08/02/199004/06/1991
OEF/OIF/OND10/07/2001
Ongoing
84 65 64 45 44 18Age in FY15
84 65 64 45 44 18Age in FY10
Age in FY05
Age in FY00
84 65 64 45 44 18
84 65 64 45 44 18
Year attained age 18
AgeWomen Veteran VHA patients span the full adult lifespan, from the late teen years to over 100 years of age. Many joined the military in their late teens or early 20s, although some joined at an older age. Therefore, the age distribution of women, in part, reflects war era cohort effects. Exhibit 1.C illustrates how a Veteran’s age at the time of the VHA patient cohort year being examined (FY00, FY05, FY10, or FY15) could relate to a war era or eras during which the Veteran might have served in the military, depending on the Veteran’s age on joining and leaving the military.5,6 For example, within the FY00 cohort (top row), a Veteran who was 45 years old in FY00 (age shown in the middle segment of the top row) would have been 18 years old in 1973; if she/he was in the military at age 18, then she/he would have served during the Vietnam War Era (which lasted from 1961-1975).7,8
Women and men, age distribution. Exhibit 1.D shows the number of women Veteran VHA patients at each age in FY00 (the red line) and in FY15 (the dark blue line), as well as at two intervening time points (FY05, FY10). In FY00, the distribution had two main peaks. The tallest peak had a maximum at age 44, and the second peak had a maximum at age 76. By FY15, those peaks had shifted forward. The peak that had been tallest in FY00 was even taller and was bifurcate, with its maximum at age 53 and with a secondary maximum at age 58. The second FY15 peak had its maximum at age 91. This peak had shifted to the right and decreased in height since FY00, perhaps, in part, due to death or transfer to long-term care facilities among the oldest group of women. Further, by FY15 a substantial new third peak had appeared, with its maximum at age 32; as Exhibit 1.C illustrates, those ages 32 years or younger in FY15 are among the most recent cohort of Veterans, those who joined the military after the 9/11/2001 attack on the United States. Of note, the total area under the curve in Exhibit 1.D is much greater for the FY15 cohort than for the FY00 cohort, again showing that the total number of women Veteran VHA patients grew substantially over this period (also see Exhibit 1.A, which demonstrates the same effect).

Sourcebook Vol. 4 - Part 1: Sociodemographics
21
Exhibit 1.D. Age Distribution of Women Veteran VHA Patients, FY00-FY15
Key: FY - Fiscal Year; VHA – Veterans Health AdministrationNotes: Findings portray Veteran VHA patients, not the entire Veteran population. See Technical Appendix.Cohort: Women Veteran VHA patients with non-missing ages 18-110 years (inclusive). FY00: N=159,728; FY05: N=231,885; FY10: N=317,087; FY15: N=439,615.Source: WHEI Master Database, FY00-FY15
0
2,000
4,000
6,000
8,000
10,000
12,000
14,000
15 25 35 45 55 65 75 85 95 105
# Wom
en V
eter
an P
atien
ts
FY00 FY05 FY10 FY15
Exhibit 1.E. Age Distribution of Men Veteran VHA Patients, FY00-FY15
Key: FY - Fiscal Year; VHA – Veterans Health AdministrationNotes: Findings portray Veteran VHA patients, not the entire Veteran population. See Technical Appendix.Cohort: Men Veteran VHA patients with non-missing ages 18-110 years (inclusive). FY00: N=3,226,162; FY05: N=4,569,901; FY10: N=5,034,379; FY15: N=5,450,014.Source: WHEI Master Database, FY00-FY15
0
50,000
100,000
150,000
200,000
250,000
300,000
15 25 35 45 55 65 75 85 95 105
# Men
Vet
eran
Pat
ients
FY00 FY05 FY10 FY15
Exhibit 1.E shows a very different age distribution pattern over the years for men Veteran VHA patients.9 The age distribution for men in FY00 (the red line) also had two main peaks, the tallest with a maximum age at 52 and a bifurcate peak with maximums at ages 67 and 75. Although both of these peaks had shifted forward by FY15 (the dark blue line), the taller peak from FY00 had grown so much that the age distribution for men in FY15 appeared to have one primary peak, with a maximum at age 67. Also, by FY15, the youngest cohort of men could be seen as a visible bump in the left side of the distribution, with a maximum age at 31 years.

Sourcebook Vol. 4 - Part 1: Sociodemographics
22
Exhibit 1.F. Age Group Distribution of Women Veteran VHA Patients, FY00-FY15
Key: FY - Fiscal Year; VHA – Veterans Health AdministrationNotes: Findings portray Veteran VHA patients, not the entire Veteran population. See Technical Appendix. Due to rounding, the aggregated percentage
of women younger than age 65 in FY15 does not equal the sum of the component values reported in this exhibit.Cohort: Women Veteran VHA patients with non-missing ages 18-110 years (inclusive). FY00: N=159,728; FY05: N=231,885; FY10: N=317,087; FY15: N=439,615.Source: WHEI Master Database, FY00-FY15
51% 43% 42% 43%
30% 39% 45% 46%
19% 18% 13% 12%
0
20
40
60
80
100
FY00 FY05 FY10 FY15
% W
omen
Vet
eran
Pat
ients
81%
65+ 45-64 18-44
Age (Years)
82% 87% 88%
Women, age categories. The total number of women Veteran VHA patients 18-44 years old increased over time (FY00: 81,832; FY15: 187,137, a 2.3-fold increase). However, because there was even faster growth in the middle age group (see next paragraph), the proportion of women who were 18-44 years old actually decreased (FY00: 51%; FY15: 43%) (Exhibit 1.F). Among those who were younger than 45 years old, the subgroup of women who were 18-34 years old represent a population that has recently served in the military. This specific age subgroup increased both numerically (FY00: 36,407; FY15: 103,789, a 2.9-fold increase) and as a proportion of all women Veteran VHA patients (FY00: 23%; FY15: 24%) (age subgroup not represented graphically in Exhibit 1.F).
Over this same period, the number of women Veteran VHA patients who were 45-64 years old grew substantially. This age group grew both numerically (FY00: 47,387; FY15: 201,688, a 4.3-fold increase) and as a proportion of all women in VHA (FY00: 30%; FY15: 46%) (Exhibit 1.F). In particular, among those 45-64 years old, substantial growth occurred in the 55-64 age subgroup. This subgroup grew both numerically (FY00: 13,229; FY15: 96,377, a 7.3-fold increase) and as a proportion of all women Veteran VHA patients (FY00: 8%; FY15: 22%) (age subgroup not represented graphically in Exhibit 1.F). In aggregate, the majority of women were 18-64 years old. The proportion of women 18-64 years old increased over this period (FY00: 81%; FY15: 88%).
Compared with the numbers of women Veteran VHA patients in the 18-44 and 45-64 year-old age groups, relatively fewer women were 65+ years old. Between FY00 and FY15, the number of women in this age cohort grew (FY00: 30,509; FY15: 50,790, a 1.7-fold increase), but this group decreased as a proportion of all women (FY00: 19%; FY15: 12%) (Exhibit 1.F). Notably, among those 65+ years old, the specific age subgroup representing the oldest women (85+ years old) grew both numerically (FY00: 1,660; FY15: 9,351, a 5.6-fold increase) and as a proportion of all women Veteran VHA patients (FY00: 1%; FY15: 2%) (age subgroup not represented graphically in Exhibit 1.F).

Sourcebook Vol. 4 - Part 1: Sociodemographics
23
Exhibit 1.G. Age Group Distribution of Women and Men Veteran VHA Patients, FY00-FY15
Key: FY - Fiscal Year; VHA – Veterans Health AdministrationNotes: Findings portray Veteran VHA patients, not the entire Veteran population. See Technical Appendix.Cohort: Women and Men Veteran VHA patients with non-missing ages 18-110 years (inclusive). Women: FY00: N=159,728; FY05: N=231,885; FY10: N=317,087;
FY15: N=439,615; Men: FY00: N=3,226,162; FY05: N=4,569,901; FY10: N=5,034,379; FY15: N=5,450,014.Source: WHEI Master Database, FY00-FY15
51%
14%
43%
10%
42%
12%
43%
15%
30%
40%
39%
40%
45%
43%
46%
32%
19%
47%
18%
50%
13%
45%
12%
53%
0
20
40
60
80
100
Women Men Women Men Women Men Women Men FY00 FY05 FY10 FY15
% V
eter
an P
atien
ts
65+ 45-64 18-44
Age (Years)
Age categories, women versus men. Exhibit 1.G indicates that, in every year examined, the population of women Veteran VHA patients was substantially younger than the population of men Veteran VHA patients. Although the gap has been narrowing, far higher proportions of women than men were ages 18-44 years old (FY00: 51% vs. 14%; FY15: 43% vs. 15%). Looking at the 18-44 and 45-64 year-old age groups cumulatively, far higher proportions of women than men Veterans were younger than age 65 (FY00: 81% vs. 54%; FY15: 88%10 vs. 47%). Further, the proportion of women in the 45-64 year-old age group increased from FY00 through FY15; by FY15 the proportion of women in this age group surpassed the proportion of men in this age group (FY00: 30% vs. 40%; FY15: 46% vs. 32%). Meanwhile, lower proportions of women than men Veterans were 65+ years old, and the gap has widened over time (FY00: 19% vs. 47%; FY15: 12% vs. 53%). The average age of women increased slightly (FY00: 48.0 years; FY15: 48.4 years), as did the average age of men (FY00: 61.3 years; FY15: 63.0 years) (averages are not shown graphically in Exhibit 1.G).
NOTES TO INTERPRETATION: Cross-year changes in age distribution can occur for two reasons. First, the changes reflect the aging of women receiving ongoing care in VHA. Second, the changes reflect the age characteristics of dynamic cohorts of women who use VHA services over time. Annual cohorts change because of new women VHA users,11 women ceasing to use VHA (through death or attrition),12, 13 or women using VHA infrequently (and thus not being counted in some years).
Within each age cohort, age distribution varies across the years examined (FY00, FY05, FY10, FY15). This is described in Part 3, Notes to Interpretation of Findings.

Sourcebook Vol. 4 - Part 1: Sociodemographics
24
Implications
The number of young women Veterans using VHA has been growing rapidly in recent years; indeed, the number of women Veteran patients younger than 35 years old has increased nearly 3-fold over the past 16 years. This increase may reflect, in part, successful efforts to enroll women Veterans in VHA at military discharge or increasing awareness of and availability of specific services for women throughout VHA. This rapid demographic shift highlights the need to ensure ample capacity for clinical services for women in their childbearing years, including reproductive health services.14
The 55-64 year-old subgroup grew more than 7-fold over the 16-year period. If this cohort of women Veterans continues to use VHA, the already growing number of women Veterans reaching age 65 or older can be expected to dramatically increase over the coming decade. These women may require more intensive health care services as they age, including care for chronic conditions,15,16,17 geriatric and extended care services, and, where applicable, support for their role as caregivers. Also, as these women become Medicare-eligible, coordination of care across health care systems for dual users of VHA and Medicare services may become increasingly important.18,19 Such services likely are already relevant to the cohort of World War II-era women in the 85+ year-old age group.

Sourcebook Vol. 4 - Part 1: Sociodemographics
25
Exhibit 1.H. Race/Ethnicity Distribution of Women Veteran VHA Patients, FY00-FY15
Key: FY - Fiscal Year; VHA – Veterans Health AdministrationNotes: Findings portray Veteran VHA patients, not the entire Veteran population. For all race groups, results refer to non-Hispanic/non-Latina Veterans with the
specified race. Percentage not displayed on exhibit for groups representing ≤ 1% of women Veteran patients. See Technical Appendix.Cohort: Women Veteran VHA patients with non-missing race/ethnicity. FY00: N=146,845; FY05: N=219,737; FY10: N=303,754; FY15: N=417,896.Source: WHEI Master Database, FY00-FY15
3% 4% 6% 7%
24% 25% 28%
30%
70% 67% 63% 58%
0
20
40
60
80
100
FY00 FY05 FY10 FY15
% W
omen
Vet
eran
Pat
ients
White American Indian/ Alaska Native Asian
Black/African American Hispanic/Latina Multi-race Native Hawaiian/ Other Pacific Islander
Race/Ethnicity
30% 33% 37% 42%
Race/EthnicityThe five race categories (American Indian/Alaska Native; Asian; Black/African American; Native Hawaiian/Other Pacific Islander; and White) and one ethnicity category (Hispanic/Latino) presented in this Sourcebook follow the Office of Management and Budget’s (OMB) Revisions to the Standards for the Classification of Federal Data on Race and Ethnicity.20 Consistent with the VHA Office of Health Equity classification approach,21 a Multi-race category is also included, to represent individuals with two or more race values on a single record. For data reported herein, race/ethnicity is presented as a composite.22 A patient’s race/ethnicity is considered to be “Hispanic/Latino” if ethnicity is Hispanic or Latino (independent of the patient’s race). See Online Appendix (Technical Appendix), for further details.
Women, race/ethnicity categories. As seen in Exhibit 1.H, the proportion of women Veteran VHA patients who belonged to a racial/ethnic minority group23 increased between FY00 and FY15 (FY00: 30%; FY15: 42%). Primarily driving this increase were increased proportions of Black/African American women (FY00: 24%; FY15: 30%) and Hispanic/Latina women (FY00: 3%; FY15: 7%); the proportion of women in the American Indian/Alaska Native, Asian, Multi-race, and Native Hawaiian/Other Pacific Islander groups did not exceed 1% over time.24 Although the proportion of women who were White decreased substantially between FY00 and FY15, White women still comprised a majority in both years (FY00: 70%; FY15: 58%).

Sourcebook Vol. 4 - Part 1: Sociodemographics
26
Exhibit 1.I. Race/Ethnicity Distribution of Women Veteran VHA Patients by Age, FY00-FY15
Key: FY - Fiscal Year; VHA – Veterans Health AdministrationNotes: Findings portray Veteran VHA patients, not the entire Veteran population. For all race groups, results refer to non-Hispanic/non-Latina Veterans with the
specified race. See Technical Appendix.Cohort: Women Veteran VHA patients with non-missing race/ethnicity and non-missing ages 18-110 years (inclusive). FY00: N=146,815; FY05: N=219,720;
FY10: N=303,746; FY15: N=417,890. Source: WHEI Master Database, FY00-FY15
0
20
40
60
80
100
FY00 FY05 FY10 FY15 FY00 FY05 FY10 FY15 FY00 FY05 FY10 FY15 18-44 45-64 65+
% W
omen
Vet
eran
Pat
ients
White American Indian/ Alaska Native Asian
Black/African American Hispanic/Latina Multi-race Native Hawaiian/ Other Pacific Islander
Race/Ethnicity
Women, race/ethnicity categories, by age. Exhibit 1.I shows the proportion of women Veteran VHA patients by race/ethnicity in each year by age category. Among the youngest cohort (18-44 year-olds), the proportion of women belonging to a racial/ethnic minority group increased between FY00 and FY15 (FY00: 42%; FY15: 48%). This increase was driven by greater proportions of Hispanic/Latina women seeking VHA care (FY00: 4%; FY15: 11%), although the proportions of Asian women (FY00: 1%; FY15: 2%) and Multi-race women (FY00: 1%; FY15: 2%) also increased. Although Black/African American women continued to be the largest racial/ethnic minority group, the proportion of women in this age group who were Black/African American decreased over time (FY00: 34%; FY15: 31%). The proportions of American Indian/Alaska Native and Native Hawaiian/Other Pacific Islander women remained constant (FY00: 1%; FY15: 1%). Among the specific age subgroup who were 18-34 years old, the proportion of women belonging to a racial/ethnic minority group likewise increased (FY00: 42%; FY15: 47%) (age subgroup not represented graphically in Exhibit 1.I).
Exhibit 1.I also shows that the proportion of 45-64 year-old women Veteran VHA patients belonging to racial/ethnic minority groups increased substantially between FY00 and FY15 (FY00: 28%; FY15: 42%). This was caused primarily by increases in the proportion of Black/African American women (FY00: 22%; FY15: 34%), but also by increases in the proportion of Hispanic/Latina women (FY00: 3%; FY15: 5%). The proportions of women in the other racial/ethnic minority groups remained constant: American Indian/Alaska Native (FY00: 1%; FY15: 1%); Asian (FY00: 1%; FY15: 1%); Multi-race (FY00: 1%; FY15: 1%); Native Hawaiian/Other Pacific Islander (FY00: 1%; FY15: 1%). Among the specific age subgroup who were 55-64 years old, the proportion of women belonging to a racial/ethnic minority group likewise increased (FY00: 16%; FY15: 37%) (age subgroup not represented graphically in Exhibit 1.I).

Sourcebook Vol. 4 - Part 1: Sociodemographics
27
The substantial overall increase in racial/ethnic minority representation among the 65+ year-old cohort (FY00: 7%; FY15: 18%) was driven by the increased proportion of Black/African American women (FY00: 5%; FY15: 12%) (Exhibit 1.I). The proportion of Hispanic/Latina women also increased (FY00: 1%; FY15: 3%). In addition, between FY00 and FY15 the proportion of women in each of the other racial/ethnic minority groups25 also increased in the oldest age group (American Indian/Alaska Native FY00: <1%; FY15: 1%; Asian FY00: <1%; FY15: 1%; Multi-race FY00: <1%; FY15: 1%; Native Hawaiian/Other Pacific Islander FY00: <1%; FY15: 1%). Among the subgroup who were 65-74 years old, the proportion of women belonging to a racial/ethnic minority group likewise increased (FY00: 11%; FY15: 23%) (age subgroup not represented graphically in Exhibit 1.I).
Race/ethnicity categories, women versus men, by age. Exhibit 1.J shows the difference in racial/ethnic group composition between women and men Veteran VHA patients in each year, within each age group. Among 18-44 year-olds, higher proportions of women than men belonged to a racial/ethnic minority group in each year; this difference between women and men widened over time (FY00: 42% vs. 41%, ∆ = +1%; FY15: 48% vs. 34%, ∆ = +14%). (The delta symbol (∆) in Sourcebook Volume 4 denotes “difference.”) Driving this pattern of a widening difference between women and men was a smaller decline over time in the proportion of women who were Black/African American compared to men, combined with slightly larger increases over time in the proportion of women who were Hispanic/Latina, Multi-race, and American Indian/Alaska Native compared to men.
Also seen in Exhibit 1.J, among 45-64 year-olds, a higher proportion of women than men belonged to racial/ethnic minority groups in each year, with this difference widening over time (FY00: 28% vs. 25%, ∆ = +3%; FY15: 42% vs. 35%, ∆ = +7%). The main factor behind this widening difference was a greater increase in the proportion of women than men who were Black/African American.
A different pattern occurred among the 65+ year-old cohort. In FY00, a lower proportion of women than men belonged to racial/ethnic minority groups, but by FY15, a slightly higher proportion of women than men belonged to racial/ethnic minority groups (FY00: 7% vs. 14%, ∆ = -7%; FY15: 18% vs. 16%, ∆ = +2%). The main factor behind this flip in the direction of difference over time was that, in FY00, a lower proportion of women than men in this age group were Black/African American, but by FY15, a higher proportion of women than men were Black/African American.

Sourcebook Vol. 4 - Part 1: Sociodemographics
28
Exhibit 1.J. Race/Ethnicity Distribution of Women and Men Veteran VHA Patients by Age, FY00-FY15
Key: FY - Fiscal Year; VHA – Veterans Health AdministrationNotes: Findings portray Veteran VHA patients, not the entire Veteran population. For all race groups, results refer to non-Hispanic/non-Latino Veterans with
the specified race. See Technical Appendix.Cohort: Women and men Veteran VHA patients with non-missing race/ethnicity and non-missing ages 18-110 years (inclusive). Women: FY00: N=146,815;
FY05: N=219,720; FY10: N=303,746; FY15: N=417,890; Men: FY00: N=3,130,025; FY05: N=4,481,972; FY10: N=4,942,156; FY15: N=5,297,553. Source: WHEI Master Database, FY00-FY15
Race/Ethnicity
0
20
40
60
80
100
Women Men Women Men Women Men Women Men FY00 FY05 FY10 FY15
% V
eter
an P
atien
ts, A
ge 18
-44
0
20
40
60
80
100
Women Men Women Men Women Men Women Men FY00 FY05 FY10 FY15
% V
eter
an P
atien
ts, A
ge 45
-64
0
20
40
60
80
100
Women Men Women Men Women Men Women Men FY00 FY05 FY10 FY15
% V
eter
an P
atien
ts, A
ge 65
+
White American Indian/ Alaska Native Asian
Black/African American Hispanic/Latino Multi-race Native Hawaiian/ Other Pacific Islander
NOTES TO INTERPRETATION: The race/ethnicity categories reported in this Sourcebook are mutually exclusive. All individuals with indication of Hispanic/Latino ethnicity are included in the “Hispanic/Latino” race/ethnicity group regardless of their race. The remaining race/ethnicity categories contain Veteran patients who have identified as “non-Hispanic/non-Latino,” but, for simplicity, the label identifies only the race. For example, “White” is used as shorthand for non-Hispanic/non-Latino White, and “Black/African American” is used as shorthand for non-Hispanic/non-Latino Black or African American. Also, note that individuals with a single record indicating two or more race categories (e.g., Black/African American and White, etc.) are reported as “Multi-race.”

Sourcebook Vol. 4 - Part 1: Sociodemographics
29
Implications
Women Veterans in VHA have been consistently more heterogeneous than men with regard to race/ethnicity, a pattern that has become more pronounced over time. Although the youngest women Veterans are the most diverse (nearly half of women 18-45 years old belonged to a racial/ethnic minority group in FY15), older women have also become more heterogeneous on race/ethnicity as diverse young cohorts of women begin to age. Consistent with VHA’s commitment to health equity,26,27,28 women’s growing racial/ethnic diversity in all age groups over time supports the importance of VHA providers’ efforts to ensure that services are sensitive to gender as well as to culture and to intersectionality (i.e., interactions) among gender, age, and race/ethnicity.29

Sourcebook Vol. 4 - Part 1: Sociodemographics
30
Exhibit 1.K. Urban/Rural Status of Women Veteran VHA Patients, FY00-FY15
Key: FY - Fiscal Year; VHA – Veterans Health AdministrationNotes: Findings portray Veteran VHA patients, not the entire Veteran population. Percentage not displayed on exhibit for groups representing ≤ 1% of women
Veteran patients. See Technical Appendix.Cohort: Women Veteran VHA patients with non-missing urban/rural status. FY00: N=155,178; FY05: N=228,155; FY10: N=311,773; FY15: N=431,496.Source: WHEI Master Database, FY00-FY15
26% 28% 25% 24%
72% 71% 74% 75%
0
20
40
60
80
100
FY00 FY05 FY10 FY15
% W
omen
Vet
eran
Pat
ients
Urban RuralHighly Rural
Urban/Rural Status
28% 26% 29% 25%
Urban/Rural StatusFor initiatives aimed at optimizing access to care for special subgroups of Veterans, VHA classifies geographic areas where Veterans reside according to the area’s urban/rural status. Sourcebook Volume 4 uses a modified version of the Rural-Urban Commuting Areas (RUCA) system for classification of urban/rural status into three categories: urban, rural, and highly rural.30
Women, urban/rural status. Although the proportion of women Veteran VHA patients living in highly rural areas remained stable over time (FY00: 1%; FY15: 1%) (Exhibit 1.K), the absolute number increased from 2,181 to 3,402, a 1.6- fold increase. In contrast, there was a decrease in the proportion of women living in any rural area (i.e., highly rural or rural) (FY00: 28%; FY15: 25%), although the absolute number of women living in any rural area increased (FY00: 43,104; FY15: 107,689, a 2.5-fold increase). The majority of women lived in urban areas (FY00: 72%; FY15: 75%).

Sourcebook Vol. 4 - Part 1: Sociodemographics
31
Exhibit 1.L. Urban/Rural Status of Women Veteran VHA Patients by Age, FY00-FY15
Key: FY - Fiscal Year; VHA – Veterans Health AdministrationNotes: Findings portray Veteran VHA patients, not the entire Veteran population. See Technical Appendix.Cohort: Women Veteran VHA patients with non-missing urban/rural status and non-missing ages 18-110 years (inclusive). Women: FY00: N=155,121;
FY05: N=228,135; FY10: N=311,762; FY15: N=431,347. Source: WHEI Master Database, FY00-FY15
0
20
40
60
80
100
FY00 FY05 FY10 FY15 FY00 FY05 FY10 FY15 FY00 FY05 FY10 FY15 18-44 45-64 65+
% W
omen
Vet
eran
Pat
ients
Urban RuralHighly Rural
Urban/Rural Status
Women, urban/rural status, by age. As Exhibit 1.L shows, the proportion of women Veterans living in any rural areas (i.e., highly rural or rural) decreased from FY00 to FY15 in women 18-44 years old (FY00: 24%; FY15: 22%); 45-64 years old (FY00: 31%; FY15: 27%); and 65+ years old (FY00: 32%; FY15: 31%). Conversely, the proportion of women residing in urban areas increased from FY00 to FY15 in women 18-44 years old (FY00: 76%; FY15: 78%); 45-64 years old (FY00: 69%; FY15: 73%); and 65+ years old (FY00: 68%; FY15: 69%).

Sourcebook Vol. 4 - Part 1: Sociodemographics
32
Exhibit 1.M. Urban/Rural Status of Women and Men Veteran VHA Patients by Age, FY00-FY15
Key: FY - Fiscal Year; VHA – Veterans Health AdministrationNotes: Findings portray Veteran VHA patients, not the entire Veteran population. See Technical Appendix.Cohort: Women and men Veteran VHA patients with non-missing urban/rural status and non-missing ages 18-110 years (inclusive). Women: FY00: N=155,121;
FY05: N=228,135; FY10: N=311,762; FY15: N=431,347. Men: FY00: 3,098,806; FY05: 4,455,827; FY10: 4,905,236; FY15: 5,309,910.Source: WHEI Master Database, FY00-FY15
0
20
40
60
80
100
Women Men Women Men Women Men Women Men FY00 FY05 FY10 FY15
% V
eter
an P
atien
ts, A
ge 18
-44
0
20
40
60
80
100
Women Men Women Men Women Men Women Men FY00 FY05 FY10 FY15
% V
eter
an P
atien
ts, A
ge 45
-64
0
20
40
60
80
100
Women Men Women Men Women Men Women Men FY00 FY05 FY10 FY15
% V
eter
an P
atien
ts, A
ge 65
+
Urban RuralHighly Rural
Urban/Rural Status
Urban/rural status, women versus men, by age. As Exhibit 1.M shows, a lower proportion of women than men Veteran patients had any rural residence across all years and age groups. This was true for 18-44 year-olds (FY00: 24% vs.26%; FY15: 22% vs. 26%); for 45-64 year-olds (FY00: 31% vs.37%; FY15: 27% vs. 32%); and for 65+ year-olds (FY00: 32% vs.40%; FY15: 31% vs. 37%). The proportion with highly rural residence was consistently lowest in women and men in the 18-44 year old age group (FY00: 1% vs. 1%; FY15: 1% vs. 1%) and in some cases higher among 45-64 year-olds (FY00: 2% vs. 2%; FY15: 1% vs. 1%) and 65+ year-olds (FY00: 2% vs. 3%; FY15: 1% vs. 2%).
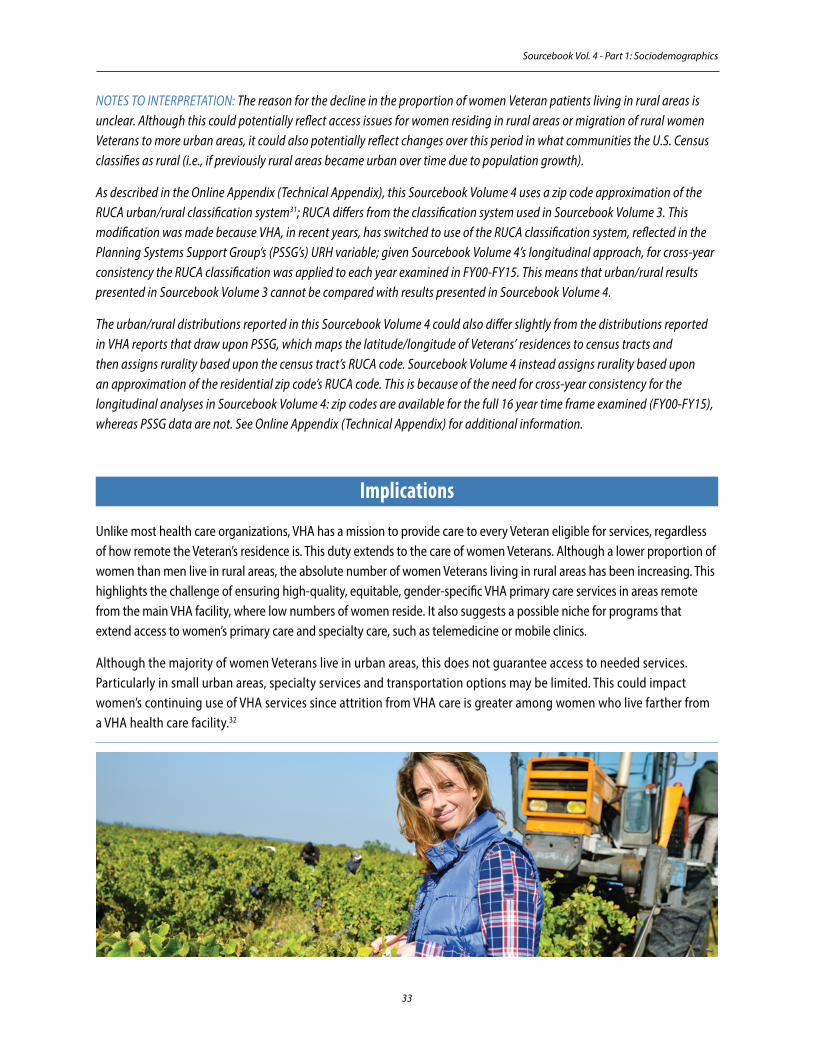
Sourcebook Vol. 4 - Part 1: Sociodemographics
33
NOTES TO INTERPRETATION: The reason for the decline in the proportion of women Veteran patients living in rural areas is unclear. Although this could potentially reflect access issues for women residing in rural areas or migration of rural women Veterans to more urban areas, it could also potentially reflect changes over this period in what communities the U.S. Census classifies as rural (i.e., if previously rural areas became urban over time due to population growth).
As described in the Online Appendix (Technical Appendix), this Sourcebook Volume 4 uses a zip code approximation of the RUCA urban/rural classification system31; RUCA differs from the classification system used in Sourcebook Volume 3. This modification was made because VHA, in recent years, has switched to use of the RUCA classification system, reflected in the Planning Systems Support Group’s (PSSG’s) URH variable; given Sourcebook Volume 4’s longitudinal approach, for cross-year consistency the RUCA classification was applied to each year examined in FY00-FY15. This means that urban/rural results presented in Sourcebook Volume 3 cannot be compared with results presented in Sourcebook Volume 4.
The urban/rural distributions reported in this Sourcebook Volume 4 could also differ slightly from the distributions reported in VHA reports that draw upon PSSG, which maps the latitude/longitude of Veterans’ residences to census tracts and then assigns rurality based upon the census tract’s RUCA code. Sourcebook Volume 4 instead assigns rurality based upon an approximation of the residential zip code’s RUCA code. This is because of the need for cross-year consistency for the longitudinal analyses in Sourcebook Volume 4: zip codes are available for the full 16 year time frame examined (FY00-FY15), whereas PSSG data are not. See Online Appendix (Technical Appendix) for additional information.
Implications
Unlike most health care organizations, VHA has a mission to provide care to every Veteran eligible for services, regardless of how remote the Veteran’s residence is. This duty extends to the care of women Veterans. Although a lower proportion of women than men live in rural areas, the absolute number of women Veterans living in rural areas has been increasing. This highlights the challenge of ensuring high-quality, equitable, gender-specific VHA primary care services in areas remote from the main VHA facility, where low numbers of women reside. It also suggests a possible niche for programs that extend access to women’s primary care and specialty care, such as telemedicine or mobile clinics.
Although the majority of women Veterans live in urban areas, this does not guarantee access to needed services. Particularly in small urban areas, specialty services and transportation options may be limited. This could impact women’s continuing use of VHA services since attrition from VHA care is greater among women who live farther from a VHA health care facility.32

Sourcebook Vol. 4 - Part 1: Sociodemographics
34
Exhibit 1.N. Service-Connected (SC) Disability Rating of Women Veteran VHA Patients, FY00-FY15
Key: FY - Fiscal Year; SC - Service-connected; VHA – Veterans Health AdministrationNotes: Findings portray Veteran VHA patients, not the entire Veteran population. See Technical Appendix. Due to rounding, the aggregated percentages
may not equal the sum of the component values reported in this exhibit.Cohort: Women Veteran VHA patients with non-missing SC disability rating. FY00: N=158,325; FY05: N=227,919; FY10: N=316,344; FY15: N=439,392.Source: WHEI Master Database, FY00-FY15
4% 4% 5% 8% 12% 16%
22% 30%
32% 27% 29%
25%
0
20
40
60
80
100
FY00 FY05 FY10 FY15
% W
omen
Vet
eran
Pat
ients
No SC
SC: 0-49
SC: 50-99
SC: 100
SC Disability Rating (Percent)
16%
48%
21% 27%
56%
38%
63% 48%
Service-Connected Disability Rating StatusA Service-Connected (SC) disability rating indicates an injury or illness deemed to have been incurred or aggravated while serving in the armed forces. The Veterans Benefits Administration (VBA) reviews disability compensation claims using a multi-step process. VBA first determines whether the disability was incurred or aggravated during active military service—if so, the Veteran receives an “SC” disability rating status. The Veteran’s SC disability is then assessed and rated for severity from 0 to 100 percent.33
Women, SC disability rating. Exhibit 1.N shows the proportion of women Veteran VHA patients with an SC disability rating in each year. It indicates that the proportion of women with an SC disability rating increased substantially between FY00 and FY15 (FY00: 48%; FY15: 63%). Much of this increase was driven by greater proportions of women with an SC disability rating of 50-99 percent (FY00: 12%; FY15: 30%), as well as by greater proportions of women with an SC disability rating of 100 percent (FY00: 4%; FY15: 8%). The cumulative proportion of women with an SC disability rating of 50 percent or more also increased (FY00: 16%; FY15: 38%).

Sourcebook Vol. 4 - Part 1: Sociodemographics
35
Exhibit 1.O. Service-Connected (SC) Disability Rating of Women Veteran VHA Patients by Age, FY00-FY15
Key: FY - Fiscal Year; SC - Service-connected; VHA – Veterans Health AdministrationNotes: Findings portray Veteran VHA patients, not the entire Veteran population. See Technical Appendix.Cohort: Women Veteran VHA patients with non-missing SC disability rating and non-missing ages 18-110 years (inclusive). FY00: N=158,243; FY05: N=227,898;
FY10: N=316,309; FY15: N=439,216.Source: WHEI Master Database, FY00-FY15
0
20
40
60
80
100
FY00 FY05 FY10 FY15 FY00 FY05 FY10 FY15 FY00 FY05 FY10 FY15 18-44 45-64 65+
% W
omen
Vet
eran
Pat
ients
No SC
SC: 0-49
SC: 50-99
SC: 100
SC Disability Rating (Percent)
Women, SC disability rating, by age. Exhibit 1.O reports the proportion of women Veteran VHA patients with an SC disability rating in each year by age categories. It indicates that this proportion increased steadily between FY00 and FY15 among 18-44 year-olds (FY00: 59%; FY15: 73%) and among 45-64 year-olds (FY00: 47%; FY15: 62%). The proportion of women with an SC disability rating also increased between FY00 and FY15 among 65+ year-olds, although the proportion dipped in FY05 and FY10 (FY00: 23%; FY15: 31%).
The proportion of women with an SC disability rating of 50-99 percent increased among 18-44 year-olds (FY00: 13%; FY15: 36%); among 45-64 year-olds (FY00: 16%; FY15: 29%); and among 65+ year-olds (FY00: 6%; FY15: 13%). The proportion of women with an SC disability rating of 100 percent also increased among all three age groups: 18-44 year-olds (FY00: 4%; FY15: 7%); 45-64 year-olds (FY00: 5%; FY15: 10%); and 65+ year-olds (FY00: 3%; FY15: 5%). Cumulatively, the proportion of women with an SC disability rating of ≥ 50 percent increased among 18-44 year-olds (FY00: 17%; FY15: 43%); 45-64 year-olds (FY00: 21%; FY15: 39%); and 65+ year-olds (FY00: 8%; FY15: 18%).

Sourcebook Vol. 4 - Part 1: Sociodemographics
36
Exhibit 1.P. Service-Connected (SC) Disability Rating of Women and Men Veteran VHA Patients by Age, FY00-FY15
Key: FY - Fiscal Year; SC - Service-connected; VHA – Veterans Health AdministrationNotes: Findings portray Veteran VHA patients, not the entire Veteran population. See Technical Appendix.Cohort: Women and men Veteran VHA patients with non-missing SC disability rating and non-missing ages 18-110 years (inclusive). Women: FY00: N=158,243;
FY05: N=227,898; FY10: N=316,309; FY15: N=439,216; Men: FY00: N=3,196,504; FY05: N= 4,514,859; FY10: N= 5,027,100; FY15: N= 5,447,455.Source: WHEI Master Database, FY00-FY15
0
20
40
60
80
100
Women Men Women Men Women Men Women Men FY00 FY05 FY10 FY15
% V
eter
an P
atien
ts, A
ge 18
-44
0
20
40
60
80
100
Women Men Women Men Women Men Women Men FY00 FY05 FY10 FY15
% V
eter
an P
atien
ts, A
ge 45
-64
0
20
40
60
80
100
Women Men Women Men Women Men Women Men FY00 FY05 FY10 FY15
% V
eter
an P
atien
ts, A
ge 65
+
No SC
SC: 0-49
SC: 50-99
SC: 100
SC Disability Rating (Percent)
SC disability rating, women versus men, by age. Exhibit 1.P reports the proportions of women and men with an SC disability rating in each year, within each age group. The proportion of women with an SC disability rating was higher than the proportion of men with an SC disability rating in both FY00 and FY15 among 18-44 year-olds (FY00: 59% vs. 48%; FY15: 73% vs. 70%) and among 45-64 year-olds (FY00: 47% vs. 41%; FY15: 62% vs. 53%). However, in both FY00 and FY15, among 65+ year-olds, a lower proportion of women than men had an SC disability rating (FY00: 23% vs. 34%; FY15: 31% vs. 46%).

Sourcebook Vol. 4 - Part 1: Sociodemographics
37
NOTES TO INTERPRETATION: First, an SC disability rating can result from a variety of exposures including, but not limited to, combat. The administrative data used for this report do not indicate the diagnoses associated with an individual’s SC disability rating. Thus no conclusions can be drawn from these data regarding potential gender-related differences in the causes of SC disability.
Second, these data show the proportion of women and men Veteran VHA patients who carry SC disability rating status. These data do not show the total number of Veterans nationally who carry SC disability rating status: Veterans who do not use VHA care are not examined here. Therefore, no conclusions can be drawn about what proportion of all women and men Veterans in the U.S. population carry SC disability rating status.
Third, these data identify only Veterans who have been formally granted an SC disability rating status; VHA patients who have a military service-related illness or disability, but who have not applied for an SC disability rating, are not identified in these data as having an SC disability rating. Likewise, Veterans who have only recently applied for an SC disability rating will appear in the database as “non-SC” until the time, if any, that they are granted an SC disability rating and VHA is updated regarding this change.
Fourth, higher proportions of VHA patients with SC disability ratings in one group compared with another group (e.g., women versus men) could imply either that the proportion of Veterans applying for and being granted an SC disability rating is greater in that group or that Veterans in that group who have an SC disability rating are more likely to be using VHA services. Similarly, higher proportions of VHA patients in one group compared with another group carrying higher SC disability ratings could imply either that the proportion of Veterans applying for and being granted higher SC disability ratings is greater in that group or that Veterans in that group who have higher SC disability ratings are more likely to be using VHA services.
Fifth, cross-year differences in the proportion of Veterans who have an SC disability rating could reflect differences in the prevalence of injuries or illnesses incurred or aggravated while serving in the armed forces, differences in the proportion of Veterans with a potentially qualifying injury or illness who decide to apply for an SC disability rating, differences in the criteria that the Veterans Benefits Administration uses to rule on the SC disability rating, and/or differences in use of VHA by Veterans with an SC disability rating.
Implications
The proportion of women Veteran patients with any SC disability rating, as well as the proportion with SC disability ratings of 50 percent or more, has increased substantially over time. More than half of women Veteran patients, some of whom are very young, now carry an SC disability rating. These women are eligible for lifelong VHA care for their SC conditions.

Sourcebook Vol. 4 - Part 1: Sociodemographics
38
Endnotes1 Source of estimates of U.S. Veteran population for 2000: US Census Bureau. P039 – Sex by age by Armed Forces status by Veteran status for the
population 18 years and over. Census 2000 Summary File 3 (SF 3) - Sample Data. Accessed May 15, 2017 at https://factfinder.census.gov/faces/tableservices/jsf/pages/productview.xhtml?pid=DEC_00_SF3_P039&prodType=table.
2 Source of estimates of U.S. Veteran population for 2005: U.S. Dept. of Veterans Affairs, Management Sciences Service (008B2), Annual Report of the Secretary of Veterans, Table 507. Veterans by sex, period of service, and by state: 2005. Section 10. National Security and Veterans Affairs. In: Report Number: Statistical Abstract of the United States: 2002 (122nd Edition).
3 Source of estimates of U.S. Veteran population for 2010: U.S. Dept. of Veterans Affairs, VetPop 2007, VA Office of the Actuary, Table 521. Veterans living by period of service, age, and sex: 2010. Section 10. National Security and Veterans Affairs. In: Report Number: Statistical Abstract of the United States: 2012 (131st Edition).
4 Source of estimates of U.S. Veteran population for 2015: U.S. Dept. of Veterans Affairs, VetPop 2014. Accessed May 15, 2017 at https://www.va.gov/vetdata/veteran_population.asp.
5 Some women serve for a few years, whereas others continue military service into their 50s or beyond. Military service sometimes spans more than one war era and/or peacetime period.
6 Also see Veterans Health Administration Office of Health Equity. Timeline of U.S. period of service eras. 2016. Accessed October 28, 2016 at http://www.va.gov/HEALTHEQUITY/docs/Period_of_Service_Timeline_OHE10212016.pdf.
7 Source for Dates: Office of the Federal Register. Code of Federal Regulations. Title 38: Pensions, bonuses, and Veterans’ relief. Chapter 1. Part 3. Subpart A. §3.2. Accessed May 15, 2017 at https://www.gpo.gov/fdsys/pkg/CFR-2012-title38-vol1/pdf/CFR-2012-title38-vol1-chapI.pdf; U.S. Congressional Research Service. U.S. periods of war and dates of current conflicts, by Barbara Salazar Torreon. CRS Report RS21405. Washington, DC: Office of Congressional Information and Publishing, February 27, 2015.
8 Although age 18 is highlighted here for illustrative purposes, note that individuals join the military at various ages. Some join earlier than age 18. Others enlist later, especially if they obtained professional training (such as a nursing degree) prior to joining the military. For example, see Magruder K, Serpi T, Kimerling R, Kilbourne AM, Collins JF, Cypel Y, Frayne SM, Furey J, Huang GD, Gleason T, Reinhard MJ, Spiro A, Kang H. Prevalence of post-traumatic stress disorder in Vietnam-era women Veterans: The Health of Vietnam Women’s Study (HealthViEWS). JAMA Psychiatry. 2015; 72(11):1127-34.
9 Note that the vertical axis scales on Exhibit 1.D and Exhibit 1.E differ because there are fewer women than men Veteran VHA patients.10 Due to rounding, this aggregated percentage does not equal the sum of the component values shown in Exhibit 1.G.11 Friedman SA, Phibbs CS, Schmitt SK, et al. New women Veterans in the VHA: A longitudinal profile. Women’s Health Issues. 2011; 21 (4
Suppl):S103-S111.12 Friedman SA, Frayne SM, Berg E, Hamilton AB, Washington DL, Saechao F, Maisel NC, Lin JY, Hoggatt KJ, Phibbs CS. Travel time and attrition from
VHA care among women Veterans: How far is too far? Medical Care. 2015; 53(4 Suppl 1):S15-22.13 Hamilton AB, Frayne SM, Cordasco KM, Washington DL. Factors related to attrition from VA healthcare use: Findings from the National Survey of
Women Veterans. J Gen Intern Med. 2013; 28 (Suppl 2):S510-516.14 Zephyrin LC, Katon J, Hoggatt KJ, Balasubramanian V, Saechao F, Frayne SM, Mattocks KM, Feibus K, Galvan I, Hickman R, Hayes PM, Haskell
SG, Yano E. State of reproductive health in women Veterans: VA reproductive health diagnoses and organization of care. Women’s Health Services, Veterans Health Administration, Department of Veterans Affairs, February 2014.
15 Reiber GE, LaCroix AZ. Older women Veterans in the Women’s Health Initiative. Gerontologist. 2016; 56(Suppl_1): S1-S5.16 LaCroix AZ, Rillamas-Sun E, Woods, NF, Weitlauf J, Zaslavsky O, Shih R, LaMonte MJ, Bird C, Yano EM, LeBoff M, Washington D, Reiber G. Aging well
among women Veterans compared with non-Veterans in the Women’s Health Initiative. Gerontologist. 2016; 56 (Suppl_1): S14-S26.17 Bastian LA, Hayes PM, Haskell SG, Atkins D, Reiber GE, LaCroix AZ, Yano EM. Improving our understanding of health issues in older women
Veterans. Gerontologist. 2016; 56(Suppl_1): S10-S13.18 Hynes DM, Koelling K, Stroupe K, Arnold N, Mallin K, Sohn MW, Weaver FM, Manheim L, Kok L. Veterans’ access to and use of Medicare and
Veterans Affairs health care. Medical Care. 2007;45(3):214-23.19 Petersen LA, Byrne MM, Daw CN, Hasche J, Reis B, Pietz K. Relationship between clinical conditions and use of Veterans Affairs health care among
Medicare‐enrolled Veterans. Health Services Research. 2010 Jun 1;45(3):762-91.20 Revisions to the Standards for the Classification of Federal Data on Race and Ethnicity. 62 Fed. Reg. 58782 (October 30, 1997). Accessed May 2017
at https://www.gpo.gov/fdsys/pkg/FR-1997-10-30/pdf/97-28653.pdf.21 VA Office of Health Equity. 2016. National Veteran Health Equity Report–FY2013. US Department of Veterans Affairs, Washington, DC. Available
online at http://www.va.gov/healthequity/NVHER.asp.

Sourcebook Vol. 4 - Part 1: Sociodemographics
39
22 Revisions to the Standards for the Classification of Federal Data on Race and Ethnicity. 62 Fed. Reg. 58782 (October 30, 1997). Accessed May 2017 at https://www.gpo.gov/fdsys/pkg/FR-1997-10-30/pdf/97-28653.pdf.
23 This term is used to represent any race/ethnicity group other than White.24 This Sourcebook rounds to the nearest whole percentage. For details of the number of women belonging to smaller racial/ethnic groups, please
see the Online Appendix available at http://www.womenshealth.va.gov/WOMENSHEALTH/sourcebookvol4onlineappendix.asp.25 Proportions below 0.5% are presented as “<1%.”26 VA Office of Health Equity. 2016. National Veteran Health Equity Report–FY2013. US Department of Veterans Affairs, Washington, DC. Accessed
June 8, 2017 at http://www.va.gov/healthequity/NVHER.asp.27 Veterans Health Administration. Blueprint for Excellence. September 2014. Washington, DC; US Department of Veterans Affairs. 28 Commission on Care. Final Report of the Commission on Care. Washington, DC. Accessed June 8, 2017 at https://s3.amazonaws.com/sitesusa/wp-
content/uploads/sites/912/2016/07/Commission-on-Care_Final-Report_063016_FOR-WEB.pdf. 29 Bowleg L. The problem with the phrase women and minorities: Intersectionality–an important theoretical framework for public health. Am J
Public Health. 2012; 102(7):1267-1273.30 Sourcebook Volume 4 uses an urban/rural classification system that differs from the classification system used in Sourcebook Volume 3 and that
differs from the system used in some other VHA reports. See Notes to Interpretation section. Also see Online Appendix (Technical Appendix) for details available at http://www.womenshealth.va.gov/WOMENSHEALTH/sourcebookvol4onlineappendix.asp.
31 Office of Rural Health Policy and the Economic Research Service. Temporary ZIP RUCA 3.10 File Access Page. Accessed May 24, 2017 at https://ruralhealth.und.edu/ruca; WWAMI Rural Health Research Center (RHRC). RUCA Data. 2006 ZIP Version 2.0 Codes. Accessed May 24, 2017 at http://depts.washington.edu/uwruca/ruca-download.php.
32 Friedman SA, Frayne SM, Berg E, Hamilton AB, Washington DL, Saechao F, Maisel NC, Lin JY, Hoggatt KJ, Phibbs CS. Travel time and attrition from VHA care among women Veterans: How far is too far? Medical Care. 2015; 53(4 Suppl 1):S15-22.
33 To enhance the clarity and readability of this report, an editorial decision has been made to spell out “percent” in reference to SC disability ratings, e.g., “SC disability rating of 100 percent.” In all other measures of percentage, the percent symbol (%) is used. Also note that “0 percent” refers to a patient who does have SC disability status, but whose severity rating is 0 (zero) percent; this is distinct from a patient who has no SC disability rating status.

Sourcebook Vol. 4 - Part 1: Sociodemographics
40

Sourcebook Vol. 4 - Part 2: Utilization
41
Part 2. Utilization
Overview Sourcebook Volume 4 documents health care utilization at VHA facilities, as well as utilization paid for by VHA but delivered by non-VHA providers through Purchased Care.1 Unlike Sourcebook Volume 3,2 which provided FY12 utilization data,3,4 Sourcebook Volume 4 includes more recent utilization data (FY15). It also reports historical data back to FY00, in five-year increments, thereby providing the longest time horizon yet published in any of the Sourcebook volumes.
For each of the four years examined (FY00, FY05, FY10, FY15), Part 2 describes utilization of outpatient care delivered within VHA facilities (VHA encounters), as well as utilization of services through Purchased Care (representing care delivered by non-VHA providers but reimbursed through VHA). Part 2 is organized into four sections that describe Veteran VHA patients’ use of outpatient care (general outpatient care and specific types of outpatient care) and inpatient obstetric deliveries:
• Outpatient Care – Outpatient utilization in VHA (number of encounters) – Outpatient utilization through Purchased Care (any services rendered)5
• Primary Care – Primary Care utilization in VHA (number of encounters) – Women’s Health Clinic/General Primary Care utilization in VHA (any encounters)
• Mental Health/Substance Use Disorder (SUD) Specialty6 Care – Mental Health/SUD utilization in VHA (number of encounters)
• Reproductive Health Care – Obstetrics/Gynecology specialty care outpatient utilization in VHA and through Purchased Care (any services rendered) – Obstetric deliveries through inpatient Purchased Care (number of women)
Main analyses are presented by age and by sex (except in the case of gender-specific services, which are presented only by age).7
NOTES TO INTERPRETATION: Several general points should be kept in mind when interpreting utilization data throughout Sourcebook Volume 4.
First, it is important to understand how to interpret the year-to-year changes in utilization described in this Sourcebook; these changes are at a cohort level rather than at an individual level. In other words, there was one cohort of Veterans who used VHA in FY00, and Sourcebook Volume 4 presents what proportion of them used various types of services in FY00. There was another cohort of Veterans who used VHA in FY15, and Sourcebook Volume 4 presents what proportion of them used

Sourcebook Vol. 4 - Part 2: Utilization
42
various types of services in FY15. In some cases, the same individual Veteran was a member of both the FY00 cohort and the FY15 cohort, but Sourcebook Volume 4 does not examine whether there were changes over time in individual Veterans’ use of various types of services.
Similarly, when Sourcebook Volume 4 reports a change in utilization of a particular type of service from FY00 to FY15 within a particular age group of Veterans, this again refers to utilization during FY00 among the cohort of Veterans who used VHA in FY00 and who fell into that age group in FY00, compared to utilization during FY15 among the cohort of Veterans who used VHA in FY15 and who fell into that age group in FY15. Individual Veterans who used VHA in FY00 may or may not have used VHA in FY15 and may or may not have fallen into the same age group in FY00 as in FY15.
Second, when interpreting differences in utilization based on sex, age, etc., it is important to recognize that these analyses present raw comparisons of proportions, without comment on the statistical significance of those differences. Differences also are provided without adjustment for patient characteristics, such as number of medical conditions, which can influence conclusions regarding between-group differences in the use of VHA services.8 For example, the fact that women Veteran VHA patients are, on average, younger than men Veteran VHA patients could be one of the factors driving some observed gender differences in utilization.
Third, it is important to recognize that some Veterans who use VHA also use health care services outside of VHA (e.g., reimbursed through Medicare, Medicaid, private insurance, etc.). The utilization presented in this Sourcebook may underestimate the total aggregated amount of care women Veteran patients receive from all the health care sources they use, combined.
Fourth, inpatient care (other than obstetric deliveries), long-term nursing home care, and VHA pharmacy prescription services are not included in any counts of utilization.9
Fifth, note that the overall outpatient utilization section and the reproductive health care utilization section describe services provided through Purchased Care, whereas the primary care utilization and mental health/SUD specialty care utilization sections do not, even though Purchased Care can include a full range of services.10 The reason for the particular focus on reproductive health-related Purchased Care is because some facilities may rely more heavily on non-VHA providers for gender-specific services not available on site. This can happen, for example, if local VHA facilities lack the necessary volume to support a program (e.g., highly specialized gynecologic oncology services) or because VHA does not routinely provide the service on site (e.g., obstetric services).11

Sourcebook Vol. 4 - Part 2: Utilization
43
Exhibit 2.A. VHA Outpatient Encounters Among Women Veteran VHA Patients, FY00-FY15
Key: FY – Fiscal Year; VHA – Veterans Health Administration Notes: Findings portray Veteran VHA patients, not the entire Veteran population. See Technical Appendix. Due to rounding, the aggregated percentages may not
equal the sum of the component values reported in this exhibit.Cohort: Women Veteran VHA patients in each year. FY00: N=159,810; FY05: N=231,907; FY10: N=317,122; FY15: N=439,791.Source: WHEI Master Database, FY00-FY15
40% 43% 48% 51%
22% 23%
22% 21%
18% 18%
16% 15% 8%
7% 6% 5% 10% 7% 6% 5%
0
20
40
60
80
100
FY00 FY05 FY10 FY15
% W
omen
Vet
eran
Pat
ients
None
1
2
3-5
6-11
12+
Number of Encounters
62%
97%
73%
98% 98%
66% 70%
97%
Outpatient Utilization, OverallOutpatient Utilization, VHA
This section examines utilization of health care that occurs at VHA facilities, primarily in VA Medical Centers (VAMCs) and Community-Based Outpatient Clinics (CBOCs).12 For each fiscal year examined, this section presents a count of encounters during which a Veteran patient received any kind of outpatient service at a VHA facility.13,14,15
Women. The number of women Veterans using VHA outpatient services increased 2.7-fold from FY00 to FY15 (FY00: 155,430; FY15: 425,982). Among women Veterans who were VHA patients in FY00, 97% had at least one VHA outpatient encounter in FY00. Similarly, among women Veterans who were VHA patients in FY15, 97% had at least one VHA outpatient encounter in FY15 (Exhibit 2.A). Thus, among women Veterans who used VHA services in a particular year, only a very small proportion used no outpatient services at all during that year.16 The proportions with 6 or more (6+) encounters grew over this period (FY00: 62%; FY15: 73%), as did the proportions with 12+ encounters (FY00: 40%; FY15: 51%).17

Sourcebook Vol. 4 - Part 2: Utilization
44
Exhibit 2.B. VHA Outpatient Encounters Among Women Veteran VHA Patients, by Age, FY00-FY15
Key: FY – Fiscal Year; VHA – Veterans Health Administration Notes: Findings portray Veteran VHA patients, not the entire Veteran population. See Technical Appendix.Cohort: Women Veteran VHA patients with non-missing ages 18-110 years (inclusive). Women: FY00: N=159,718; FY05: N=231,884; FY10: N=317,087; FY15:
N=439,615. Source: WHEI Master Database, FY00-FY15
0
20
40
60
80
100
FY00 FY05 FY10 FY15 FY00 FY05 FY10 FY15 FY00 FY05 FY10 FY15 18-44 45-64 65+
% W
omen
Vet
eran
Pat
ients
None
1
2
3-5
6-11
12+
Number of Encounters
Women, by age. Exhibit 2.B compares VHA outpatient encounters by women Veteran VHA patients over time within each age group. Across age groups, nearly all women Veteran VHA patients had at least one VHA outpatient encounter in each year. There was consistent growth over time in the proportions of women Veterans with 12+ VHA encounters for 18-44 year-olds (FY00: 34%; FY15: 46%) and for 45-64 year-olds (FY00: 48%; FY15: 57%), and also growth (although less consistent) for those 65+ years old (FY00: 42%; FY15: 49%).18
In addition to changes over time, there were notable differences among age groups. Across all years, higher proportions of women who were 45-64 years old than women in other age groups had 12+ VHA outpatient encounters.

Sourcebook Vol. 4 - Part 2: Utilization
45
Exhibit 2.C. VHA Outpatient Encounters Among Women and Men Veteran VHA Patients by Age, FY00-FY15
Key: FY – Fiscal Year; VHA – Veterans Health Administration Notes: Findings portray Veteran VHA patients, not the entire Veteran population. See Technical Appendix.Cohort: Women and men Veteran VHA patients with non-missing ages 18-110 years (inclusive). Women: FY00: N=159,718; FY05: N=231,884; FY10: N=317,087;
FY15: N=439,615. Men: FY00: N=3,225,797; FY05: N=4,569,868; FY10: N=5,034,379; FY15: N=5,450,014.Source: WHEI Master Database, FY00-FY15
0
20
40
60
80
100
Women Men Women Men Women Men Women Men FY00 FY05 FY10 FY15
% V
eter
an P
atien
ts, A
ge 18
-44
0
20
40
60
80
100
Women Men Women Men Women Men Women Men FY00 FY05 FY10 FY15
% V
eter
an P
atien
ts, A
ge 45
-64
0
20
40
60
80
100
Women Men Women Men Women Men Women Men FY00 FY05 FY10 FY15
% V
eter
an P
atien
ts, A
ge 65
+
None
1
2
3-5
6-11
12+
Number of Encounters
Women versus men. Exhibit 2.C shows that, consistently over time, almost all women and men Veteran VHA patients in each age group had at least one VHA outpatient encounter. Across all years, higher proportions of women than men had 12+ VHA outpatient encounters. This was true for women versus men Veterans ages 18-44 years old (FY00: 34% vs. 28%, ∆ =+6%; FY15: 46% vs. 35%, ∆ =+11%); 45-64 years old (FY00: 48% vs. 42%, ∆ =+7%19: FY15: 57% vs. 50%, ∆ =+7%); and 65+ years old (FY00: 42% vs. 39%, ∆ =+3%; FY15: 49% vs. 42%; ∆ =+7%). (The delta symbol (∆) in Sourcebook Volume 4 denotes “difference.”)
Focusing on the subgroup of VHA patients who used VHA outpatient care in FY00 (VHA outpatients),20 women had a higher average number of VHA outpatient encounters than men. This was true overall (16.1 vs. 15.5 encounters) and by age group (18-44 year-olds: 14.2 vs. 13.7 encounters; 45-64 year-olds: 19.6 vs. 17.4 encounters; 65+ year-olds: 16.0 vs. 14.4 encounters). This trend continued in FY15, although the differences in average encounters by sex grew larger. Among Veteran VHA outpatients in FY15, women had a higher average number of VHA outpatient encounters than men overall (20.9 vs. 18.2 encounters) and by age group (18-44 year-olds: 17.6 vs. 14.5 encounters; 45-64 year-olds: 24.1 vs. 21.4 encounters; 65+ year-olds: 20.5 vs. 17.4 encounters) (data not represented graphically).

Sourcebook Vol. 4 - Part 2: Utilization
46
Implications
The progressively increasing number of women Veterans choosing to use outpatient care in VHA highlights how crucial it is to ensure an outpatient environment of care that is welcoming to women21 and sufficient health care delivery system capacity to address their needs.22 This may have special relevance to the large number of women Veterans who are new VHA patients: research conducted prior to implementation of Comprehensive Women’s Health Care23 showed a higher rate of attrition from VHA care for new than for established women Veteran VHA patients.24,25
As VHA projects resources needed for the future care of expanding numbers of women Veterans, the fact that, across the age spectrum, women use VHA outpatient care more heavily than do men needs to be taken into account.

Sourcebook Vol. 4 - Part 2: Utilization
47
Exhibit 2.D. Purchased Care Use Among Women Veteran VHA Patients, FY00-FY15
Key: FY – Fiscal Year; VHA – Veterans Health Administration Notes: Findings portray Veteran VHA patients, not the entire Veteran population. See Technical Appendix.Cohort: Women Veteran VHA patients in each year. FY00: N=159,810; FY05: N=231,907; FY10: N=317,122; FY15: N=439,791.Source: WHEI Master Database, FY00-FY15
26% 29% 32% 37%
0
20
40
60
80
100
FY00 FY05 FY10 FY15
% W
omen
Vet
eran
Pat
ients
None Any
PurchasedCare Use
Outpatient Utilization, Purchased Care
This section examines the use of outpatient services delivered by Purchased Care26 providers. For each fiscal year examined, this section presents the proportion of Veteran VHA patients who received at least one outpatient service of any kind through Purchased Care.27,28
NOTES TO INTERPRETATION: Sourcebook Volume 4 does not attempt to capture the totality of care that women Veteran patients receive, such as care that women arrange privately outside of VHA through Medicare, Medicaid, or private insurance.29
In the specific case of FY15 Purchased Care records, these include services reimbursed through Non-VA (Fee) Medical Care as well as through the Veterans Choice Program. Because the latter had only recently been rolled out (in FY15), there may have been lags in record processing leading to delays in payments being recorded in VHA files; if so, the proportions of patients receiving Purchased Care in FY15 reported herein could be underestimates.
Women. Exhibit 2.D shows that the proportions of women Veteran VHA patients who used any outpatient Purchased Care services increased between FY00 and FY15 (FY00: 26%; FY15: 37%).30 The absolute number of women who used these services increased 3.9-fold (FY00: 41,733; FY15: 162,512).

Sourcebook Vol. 4 - Part 2: Utilization
48
Exhibit 2.E. Purchased Care Use Among Women Veteran VHA Patients by Age, FY00-FY15
Key: FY – Fiscal Year; VHA – Veterans Health Administration Notes: Findings portray Veteran VHA patients, not the entire Veteran population. See Technical Appendix.Cohort: Women Veteran VHA patients with non-missing ages 18-110 years (inclusive). Women: FY00: N=159,728; FY05: N=231,885; FY10: N=317,087; FY15:
N=439,615. Source: WHEI Master Database, FY00-FY15
0
20
40
60
80
100
FY00 FY05 FY10 FY15 FY00 FY05 FY10 FY15 FY00 FY05 FY10 FY15 18-44 45-64 65+
% W
omen
Vet
eran
Pat
ients
None Any
PurchasedCare Use
Women, by age. Exhibit 2.E shows that, in each age group, outpatient Purchased Care use increased between FY00 and FY15, although the magnitude of increase varied by age group. The proportions of women with any outpatient Purchased Care use increased slightly among women ages 18-44 years (FY00: 31%; FY15: 33%) (with a small dip in FY10); increased substantially among women ages 45-64 years (FY00: 30%; FY15: 42%); and increased substantially among women ages 65+ years (FY00: 6%; FY15: 34%).31

Sourcebook Vol. 4 - Part 2: Utilization
49
Exhibit 2.F. Purchased Care Use among Women and Men Veteran VHA Patients by Age, FY00-FY15
Key: FY – Fiscal Year; VHA – Veterans Health Administration Notes: Findings portray Veteran VHA patients, not the entire Veteran population. See Technical Appendix.Cohort: Women and men Veteran VHA patients with non-missing ages 18-110 years (inclusive). Women: FY00: N=159,728; FY05: N=231,885; FY10: N=317,087;
FY15: N=439,615. Men: FY00: N=3,226,162; FY05: N=4,569,901; FY10: N=5,034,379; FY15: N=5,450,014.Source: WHEI Master Database, FY00-FY15
0
20
40
60
80
100
Women Men Women Men Women Men Women Men FY00 FY05 FY10 FY15
% V
eter
an P
atien
ts, A
ge 18
-44
0
20
40
60
80
100
Women Men Women Men Women Men Women Men FY00 FY05 FY10 FY15
% V
eter
an P
atien
ts, A
ge 45
-64
0
20
40
60
80
100
Women Men Women Men Women Men Women Men FY00 FY05 FY10 FY15
% V
eter
an P
atien
ts, A
ge 65
+
None Any
PurchasedCare Use
Women versus men. Across years, the proportions of Veteran VHA patients who used any outpatient Purchased Care services was consistently higher for women than for men (FY00: 26% vs. 11%; FY15: 37% vs. 23%). The absolute number of women who used these services increased 3.9-fold over this period, whereas the absolute number of men using these services increased 3.5-fold (data not represented graphically).
Exhibit 2.F compares outpatient Purchased Care use for women with that of men Veteran VHA patients in each year by age group. In both FY00 and FY15, higher proportions of women than men used Purchased Care among 18-44 year-olds (FY00: 31% vs. 18%; FY15: 33% vs. 23%); among 45-64 year-olds (FY00: 30% vs. 16%; FY15: 42% vs. 26%); and among 65+ year-olds (FY00: 6% vs. 5%; FY15: 34% vs. 21%). However, the difference between women and men narrowed between FY00 and FY15 among 18-44 year-olds (FY00: ∆ = +14%32; FY15: ∆ = +9%33), whereas the difference widened over time among 45-64 year-olds (FY00: ∆ = +14%; FY15: ∆ = +16%) and 65+ year-olds (FY00: ∆ = +1%; FY15: ∆ = +13%).

Sourcebook Vol. 4 - Part 2: Utilization
50
Implications
Across all age groups and years, women have consistently been more likely than men to receive outpatient Purchased Care services; for women ages 45 years or older, this difference between women and men has been growing more pronounced. VHA innovations around design of Purchased Care arrangements34 need to take into consideration that women disproportionately are users of these services.
Women Veteran VHA patients’ use of the Purchased Care system has increased over the last 16 years; by FY15, well over one of every three women received some services through Purchased Care. Passage of the Veterans Access, Choice, and Accountability Act in 201435,36 may have contributed to the growth in the number of women using Purchased Care services. Ongoing efforts to examine the quality of such outsourced care and to identify optimal approaches to coordination between VHA and Purchased Care providers are of great relevance for women as they navigate among distinct sources of care.37,38,39

Sourcebook Vol. 4 - Part 2: Utilization
51
Primary CareDefinition of TermsThis report uses the term total primary care encounters (or simply primary care encounters) to refer to care received in either of the following two settings40 in which women may receive VHA primary care services:
• General primary care encounters refer to primary care provided in a general medical clinic, i.e., a clinic setting where both women and men receive services. Care in these clinics may be provided by a general primary care provider (PCP), or, since the rollout of the Comprehensive Women’s Health Care policy in FY10,41 it may be provided by a Women’s Health Primary Care Provider (WH-PCP).42 WH-PCPs are expected, according to this policy, to be trained and proficient in the delivery of comprehensive primary care for women, providing to their patients both gender-neutral services (such as diabetes care and vaccinations) and gender-specific services (such as cervical cancer screening and contraceptive services).
• Women’s health clinic encounters refer to primary care services provided in a clinic setting designed specifically for women. Women’s health clinics typically provide comprehensive primary care services to women (i.e., care for both gender-neutral and gender-specific conditions)43 and may, on occasion, provide routine gender-specific services for women who receive their primary care in a general primary care clinic. Women’s health clinics may also offer services other than primary care via an interdisciplinary team representing different specialties (such as gynecology, psychology, psychiatry, social work, etc.), but such specialty care is not a focus of this section.
NOTE ABOUT THE DISTINCTION BETWEEN “WOMEN’S HEALTH CLINICS AND “WOMEN’S HEALTH PRIMARY CARE PROVIDERS”: Sourcebook Volume 4 describes utilization of primary care in two settings: general primary care clinics and women’s health clinics. In other words, the focus of this Sourcebook is only on the setting (general primary care clinic versus women’s health clinic) and not on the provider type (WH-PCP versus other PCP). Although Sourcebook Volume 4 does not include information about provider type, it is important to recognize that in FY10 and FY15—i.e., after implementation of the Comprehensive Women’s Health Care policy44—many of the primary care visits occurring in general primary care clinic settings (as well as in women’s health clinic settings) were provided by WH-PCPs.45 For example, by FY15 there were 2,413 Women’s Health Primary Care Providers VHA-wide, spread across 154 VHA medical centers and 876 community-based outpatient clinics; in FY15, 70% of women Veteran VHA patients were assigned to a Women’s Health Primary Care Provider.46
NOTE ABOUT PRIMARY CARE BY TELEPHONE OR EMAIL: Over the time period examined, VHA increasingly provided some primary care services by telephone or via secure email (through MyHealtheVet) as a mechanism for improving access and convenience for Veteran patients. However, in this report, counts of general primary care and women’s health clinic encounters do not include telephone services or email encounters.47
NOTE ABOUT THE DENOMINATOR: As described in the Methods section, the denominator for analyses of primary care utilization is all Veteran patients.48

Sourcebook Vol. 4 - Part 2: Utilization
52
Exhibit 2.G. VHA Primary Care Encounters Among Women Veteran VHA Patients, FY00-FY15
Key: FY – Fiscal Year; VHA – Veterans Health Administration Notes: Findings portray Veteran VHA patients, not the entire Veteran population. See Technical Appendix. Due to rounding, the aggregated percentages
may not equal the sum of the component values reported in this exhibit.Cohort: Women Veteran VHA patients in each year. FY00: N=159,810; FY05: N=231,907; FY10: N=317,122; FY15: N=439,791.Source: WHEI Master Database, FY00-FY15
2% 2% 2% 2%
11% 11% 12% 10%
27% 30% 31% 29%
16% 19% 19%
20%
21%
23% 23% 25%
0
20
40
60
80
100
FY00 FY05 FY10 FY15
% W
omen
Vet
eran
Pat
ients
None
1
2
3-5
6-11
12+
Number of Encounters
77% 86% 88% 86%
40% 44% 46% 41%
Total Primary Care (General Primary Care and Women’s Health Clinic Combined) Encounters
Women. Exhibit 2.G shows that the proportions of women Veteran VHA patients seen in primary care (i.e., in a general primary care clinic and/or in a women’s health clinic) increased between FY00 and FY15 (FY00: 77%; FY15: 86%).49 The absolute number of women Veteran primary care patients increased markedly over time, from 123,156 in FY00 to 379,283 in FY15, a 3.1-fold increase.
Although there was little change in the proportions of women with three or more primary care encounters (FY00: 40%; FY15: 41%), the absolute number of women with three or more primary care encounters increased 2.8-fold (FY00: 64,520; FY15: 178,418).

Sourcebook Vol. 4 - Part 2: Utilization
53
0
20
40
60
80
100
FY00 FY05 FY10 FY15 FY00 FY05 FY10 FY15 FY00 FY05 FY10 FY15 18-44 45-64 65+
% W
omen
Vet
eran
Pat
ients
None
1
2
3-5
6-11
12+
Number of Encounters
Exhibit 2.H. VHA Primary Care Encounters Among Women Veteran VHA Patients by Age, FY00-FY15
Key: FY – Fiscal Year; VHA – Veterans Health Administration Notes: Findings portray Veteran VHA patients, not the entire Veteran population. See Technical Appendix.Cohort: Women Veteran VHA patients with non-missing ages 18-110 years (inclusive). Women: FY00: N=159,728; FY05: N=231,885; FY10: N=317,087; FY15:
N=439,615.Source: WHEI Master Database, FY00-FY15
Women, by age. The proportions of women Veteran VHA patients with any primary care encounters in each year are reported by age in Exhibit 2.H. The proportions of women with any primary care encounters increased between FY00 and FY15 among 18-44 year-olds (FY00: 74%; FY15: 83%); 45-64 year-olds (FY00: 80%; FY15: 88%); and 65+ year-olds (FY00: 82%; FY15: 88%).50 Comparing FY00 to FY15, the proportions of women with at least three primary care encounters increased among 18-44 year-olds (FY00: 33%; FY15: 36%) and decreased among 45-64 year-olds (FY00: 48%; FY15: 45%) and 65+ year-olds (FY00: 48%; FY15: 42%). Comparing FY00 to FY15, the proportions of women with at least six primary care encounters decreased among 18-44 year-olds (FY00: 10%; FY15: 9%); 45-64 year-olds (FY00: 17%; FY15: 13%); and 65+ year-olds (FY00: 17%; FY15: 14%).51

Sourcebook Vol. 4 - Part 2: Utilization
54
Women versus men. Exhibit 2.I compares women versus men Veteran VHA patients with any primary care encounters in each year by age. Among the youngest cohort (18-44 year-olds), higher proportions of women than men had at least one primary care encounter in each year (FY00: 74% vs. 62%, Δ=+12%; FY15: 83% vs. 79%, Δ=+4%). Among 45-64 year-olds, higher proportions of women than men had any primary care encounters in FY00, but in each of the subsequent years, the proportions of women versus men with any primary care use were nearly equal (FY00: 80% vs. 76%, Δ=+5%52; FY15: 88% vs. 88%, Δ=+1%53). Among 65+ year-olds, the same proportions of women and men had any primary care encounters in each year (FY00: 82% vs. 82%, Δ=0%; FY15: 88% vs. 88%, Δ=0%).
In every age group and in every year, higher proportions of women than men had at least three primary care encounters. This was true among 18-44 year-olds (FY00: 33% vs. 22%, Δ=+12%54; FY15: 36% vs. 23%, Δ=+12%55); 45-64 year-olds (FY00: 48% vs. 39%, Δ=+9%; FY15: 45% vs. 38%, Δ=+7%); and 65+ year-olds (FY00: 48% vs. 44%, Δ=+4%; FY15: 42% vs. 36%, Δ=+6%).
Focusing on the subgroup of VHA patients who used primary care (i.e., primary care patients),56 in both FY00 and FY15 the average number of primary care encounters was higher for women than for men overall (FY00: 3.6 vs. 3.4 encounters; FY15: 3.2 vs. 2.9 encounters). This was also true by age group, i.e., among 18-44 year-olds (FY00: 3.2 vs. 2.6 encounters; FY15: 2.9 vs. 2.3 encounters); 45-64 year-olds (FY00: 4.0 vs. 3.4 encounters; FY15: 3.4 vs. 3.0 encounters); and 65+ year-olds (FY00: 4.1 vs. 3.6 encounters; FY15: 3.5 vs. 3.0 encounters) (data not represented graphically).

Sourcebook Vol. 4 - Part 2: Utilization
55
0
20
40
60
80
100
Women Men Women Men Women Men Women Men FY00 FY05 FY10 FY15
% V
eter
an P
atien
ts, A
ge 18
-44
0
20
40
60
80
100
Women Men Women Men Women Men Women Men FY00 FY05 FY10 FY15
% V
eter
an P
atien
ts, A
ge 45
-64
0
20
40
60
80
100
Women Men Women Men Women Men Women Men FY00 FY05 FY10 FY15
% V
eter
an P
atien
ts, A
ge 65
+
None
1
2
3-5
6-11
12+
Number of Encounters
Exhibit 2.I. VHA Primary Care Encounters Among Women and Men Veteran VHA Patients by Age, FY00-FY15
Key: FY – Fiscal Year; VHA – Veterans Health Administration Notes: Findings portray Veteran VHA patients, not the entire Veteran population. See Technical Appendix.Cohort: Women and men Veteran VHA patients with non-missing ages 18-110 years (inclusive). Women: FY00: N=159,728; FY05: N=231,885; FY10: N=317,087;
FY15: N=439,615. Men: FY00: N=3,226,162; FY05: N=4,569,901; FY10: N=5,034,379; FY15: N=5,450,014.Source: WHEI Master Database, FY00-FY15
NOTES TO INTERPRETATION: As noted earlier, the proportions presented in Part 2 of Sourcebook Volume 4 are descriptive. Because they do not control for numerous patient characteristics (e.g., health status, alternative sources of care, etc.) that may influence utilization, these analyses cannot be used to support conclusions about disparities in care either across ages or between women and men.
Further, this Sourcebook presents the proportions of women with primary care visits in VHA; it does not examine primary care received outside VHA, e.g., through private insurance, through Medicare or Medicaid, or out of pocket.57, 58, 59, 60 Therefore, it is not possible to comment on the extent to which individual women rely on VHA exclusively for their primary care.

Sourcebook Vol. 4 - Part 2: Utilization
56
Implications
The number of women Veterans choosing to receive primary care through VHA has more than tripled over the past 16 years, despite the fact that by FY15 some women had alternative options for private sector care under the Affordable Care Act. The more than 300% growth in women Veteran VHA primary care users compares to less than 30% growth of the U.S. women Veteran population during the same period.61 Although there has been some attention in the literature to women Veterans’ experiences with VHA care,62,63,64,65 more research is needed to understand whether women’s increased use of VHA primary care reflects greater satisfaction with VHA services,66 heightened need for treatment for conditions for which VHA has special expertise (e.g., mental health care, polytrauma),67 or other factors. With such rapid growth of the women Veteran primary care population, the VHA Women’s Health Primary Care Provider workforce must keep pace.
Primary care delivery systems in VHA evolved substantially over the 16-year time period examined. Through implementation of its medical home model (Patient Aligned Care Teams or PACT) in FY10,68,69,70 VHA has sought to ensure that all patients are connected with a primary care provider and a patient-centered primary care team. Also over the time period examined, VHA rolled out its Comprehensive Women’s Health Care policy, which included creation of a workforce of Women’s Health Primary Care Providers primed for the care of women.71,72,73,74,75 Growth in the proportions of women Veterans using VHA primary care services between FY00 and FY15 is consistent with the success of such efforts to enhance primary care access for women Veterans. However, the small group of women Veterans not receiving primary care merits further scrutiny to determine whether they have unmet primary care needs, have elected to receive primary care outside VHA, or are relatively healthy and require fewer visits.
In all years examined, women have tended to use primary care more heavily than men, despite women’s younger average age. This suggests increased case complexity, especially among women in the middle age group (45-64 years old), who consistently have been heavy users of primary care over the years. These findings support the concept that clinicians with a large number of women in their patient panels require adjustments in panel size and scheduling profiles to ensure sufficient access for women. This finding also supports the importance of recent research that is examining how VHA’s PACT initiative should be adapted to account for women Veterans’ needs, customizing care arrangements and services where appropriate.76,77,78,79,80

Sourcebook Vol. 4 - Part 2: Utilization
57
Primary Care Encounters by Setting (Women’s Health Clinic/General Primary Care)
Unlike the prior section, which examines the number of primary care encounters, this section focuses on the settings in which women receive primary care: general primary care clinic settings, women’s health clinic settings, or both. As discussed above, this section does not provide information about provider type, i.e., it does not address whether women receive their primary care from a Women’s Health Primary Care Provider (WH-PCP); note that WH-PCPs are found both in general primary care clinics and in women’s health clinics.
NOTES TO INTERPRETATION: There is variability in how different VHA facilities code primary care for women, and coding practices at different VHA facilities have evolved over the time period examined in this Sourcebook. For example, in some years at some facilities, women’s health clinic encounters inadvertently have been coded as general primary care encounters; this would tend to lead to underestimation of utilization of women’s health clinics. Conversely, some primary care by WH-PCPs in mixed gender clinics inadvertently has been coded as women’s health clinic encounters. Also, in some years at some facilities, consultative gender-specific services (such as cervical cancer screening) or services provided by a specialist (such as a psychologist) embedded within the women’s health clinic have been attributed to women’s health primary care, inflating estimates of comprehensive primary care provided in women’s health clinic settings. Therefore, although estimates of “total primary care” (the sum of general primary care and women’s health clinic care) presented in the prior section are considered reliable, the proportion of that care occurring in general primary care settings versus women’s health clinic settings cannot be estimated with the same level of confidence. Results concerning settings of care presented in this section should be interpreted with this caveat in mind.

Sourcebook Vol. 4 - Part 2: Utilization
58
Exhibit 2.J. Setting of VHA Primary Care Clinic Encounters for Women Veteran VHA Patients, FY00-FY15
Key: General PC – general primary care; FY – Fiscal Year; PC – primary care; VHA – Veterans Health Administration; WHC – women’s health clinicNotes: Findings portray Veteran VHA patients, not the entire Veteran population. Categories refer to clinic setting and not provider type; women Veterans
may see Women’s Health Primary Care Providers in general PC clinic settings. See Technical Appendix. Due to rounding, the aggregated percentages may not equal the sum of the component values reported in this exhibit.
Cohort: Women Veteran VHA patients in each year. FY00: N=159,810; FY05: N=231,907; FY10: N=317,122; FY15: N=439,791.Source: WHEI Master Database, FY00-FY15
11% 12% 12% 16%
18% 22% 22% 17%
48% 52% 53% 54%
0
20
40
60
80
100
FY00 FY05 FY10 FY15
% W
omen
Vet
eran
Pat
ients
No Primary Care General PC only WHC and General PC WHC only
Primary Care Setting
66% 74% 76% 71%
29% 34% 34% 32%
Women. The proportions of women Veteran VHA patients with a women’s health clinic encounter (i.e., the sum of the “WHC only” and the “WHC and General PC” categories) increased over time (FY00: 29%; FY15: 32%),81 peaking in FY05 and FY10 (Exhibit 2.J). The absolute number of women Veterans using a women’s health clinic increased 3.1-fold (FY00: 45,804; FY15: 142,181). During this time, the proportions of women with a women’s health clinic as their exclusive setting for primary care increased (FY00: 11%; FY15: 16%). The proportions of women splitting their care between a women’s health clinic and a general primary care clinic increased over the initial part of this period, but then decreased between FY10 (when comprehensive women’s health care policy was established82) and FY15 (FY00: 18%; FY05: 22%; FY10: 22%; FY15: 17%). In parallel, the proportions of women receiving care in a general primary care clinic (i.e., the sum of “General PC only” and “WHC and General PC”) also increased (FY00: 66%; FY15: 71%).

Sourcebook Vol. 4 - Part 2: Utilization
59
0
20
40
60
80
100
FY00 FY05 FY10 FY15 FY00 FY05 FY10 FY15 FY00 FY05 FY10 FY15 18-44 45-64 65+
% W
omen
Vet
eran
Pat
ients
No Primary Care General PC only WHC and General PC WHC only
Primary Care Setting
Exhibit 2.K. Setting of VHA Primary Care Clinic Encounters for Women Veteran VHA Patients by Age, FY00-FY15
Key: General PC – general primary care; FY – Fiscal Year; PC – primary care; VHA – Veterans Health Administration; WHC – women’s health clinicNotes: Findings portray Veteran VHA patients, not the entire Veteran population. Categories refer to clinic setting and not provider type;
women Veterans may see Women’s Health Primary Care Providers in general PC clinic settings. See Technical Appendix.Cohort: Women Veteran VHA patients with non-missing ages 18-110 years (inclusive). Women: FY00: N=159,728; FY05: N=231,885; FY10: N=317,087;
FY15: N=439,615. Source: WHEI Master Database, FY00-FY15
Women, by age. As Exhibit 2.K shows, the proportions of women receiving primary care in a women’s health clinic (i.e., the sum of the “WHC only” and the “WHC and General PC” categories) was higher by FY15 for women 18-44 years old (FY00: 28%; FY15: 33%) and for women 45-64 years old (FY00: 32%; FY15: 34%), but slightly lower for women 65+ years old (FY00: 25%; FY15: 24%).83 The proportions with women’s health clinic as their exclusive primary care setting increased among women 18-44 years old (FY00: 12%; FY15: 16%); 45-64 years old (FY00: 11%; FY15: 16%); and 65+ years old (FY00: 9%; FY15: 12%). In each age group, the proportions of women splitting their primary care between a women’s health clinic setting and a general primary care setting decreased after implementation of Comprehensive Women’s Health Care policy in FY10; this was true for women 18-44 years old (FY00: 17%; FY05: 22%; FY10: 23%; FY15: 17%); 45-64 years old (FY00: 21%; FY05: 26%; FY10: 25%; FY15: 18%); and 65+ years old (FY00: 16%; FY05: 14%; FY10: 13%; FY15: 12%).

Sourcebook Vol. 4 - Part 2: Utilization
60
Implications
To reduce fragmentation of care, VHA policy now sets the expectation that women Veterans will receive Comprehensive Women’s Health Care, i.e., both gender-neutral and gender-specific primary care services from a single Women’s Health Primary Care Provider (WH-PCP).84 Although this policy was only established in FY10, by FY15 there were 2,413 Women’s Health Primary Care Providers VHA-wide, spread across 154 VHA medical centers and 876 community-based outpatient clinics; in FY15, 70% of women Veteran VHA patients were assigned to a WH-PCP.85 These WH-PCPs may practice in either general primary care settings or in women’s health clinics. Sourcebook Volume 4 cannot assess temporal trends in women Veterans’ receipt of comprehensive care because this Sourcebook only examines settings of care (general primary care clinics versus women’s health clinics86,87) and not provider type (WH-PCPs versus other PCPs) and because technical issues with the coding of women’s health clinic care preclude precise estimation of how many women receive care in that setting. However, it is promising that the proportion receiving care in dual settings was lower in FY15 than it was in FY10, when the Comprehensive Women’s Health Care policy rolled out. Despite these apparent gains, 17% of women received care in both general primary care and women’s health clinic settings in FY15. Further work is needed to assess whether this finding reflects fragmentation of care for that subgroup (e.g., care arrangements that split elements of primary care across providers or receipt of urgent care in general primary care clinics by women whose women’s health clinic is not open full time), or whether it represents a patient seeing the same PCP in two different settings (a general primary care clinic and a women’s health clinic), or whether it represents patient preference (e.g., a woman’s preference to continue receiving primary care from the PCP who has followed her for years and to visit the women’s health clinic only for gender-specific services).
The number of women receiving care in women’s health clinics has increased more than 3-fold over the past 16 years, reaching 142,181 women by FY15. If growth continues at this pace, VHA facilities that have chosen to deliver primary care in separate women’s health clinics will have to plan for expanding space needs and for a sufficiently staffed interdisciplinary workforce. Innovations in the design of women’s health clinic delivery systems have the potential to spread across sites via pathways that VHA has established in recent years, such as the Diffusion of Excellence initiative and the VHA Women’s Health Research Network’s support of VHA as a learning health care system.88,89,90,91,92

Sourcebook Vol. 4 - Part 2: Utilization
61
Mental Health/Substance Use Disorder (SUD) Specialty CareDefinition of TermsMental health/substance use disorder (SUD) care encounters refer to visits to clinics staffed by mental health professionals (e.g., psychiatrists or psychologists) with expertise in evaluating and treating patients with mental health conditions and/or SUDs.93, 94
NOTE ABOUT DEFINITIONS: The definitions for both mental health care encounters and SUD care encounters are based solely on clinic stop codes and do not consider diagnosis. This leads to several important caveats.
First, the proportions of Veterans who had a visit in one of these settings should not be interpreted as specifying mental health/SUD condition prevalence. Some patients who visit a mental health/SUD clinic do not have a mental health/SUD condition. For example, some patients are referred to a mental health clinic (such as a mental health clinic embedded in the primary care setting) to assess for possible mental health conditions but prove not to meet criteria for a diagnosis. Likewise, some patients without mental health/SUD conditions receive behavioral health care (such as help with smoking cessation or with sleep hygiene) or outreach services (such as social services for homelessness) in mental health clinic settings.
Second, receipt of mental health/SUD treatments in other clinical settings are not counted here as mental health utilization. For example, primary care providers may manage uncomplicated depression with antidepressants and brief interventions that do not require referral to a mental health clinic; such mental health treatment provided by primary care providers does not count toward the total estimate of mental health/SUD specialty care in VHA.
Third, the frequency of use of mental health/SUD specialty care reported here could potentially underestimate the actual need for services. For example, some patients receiving care in primary care settings may have undetected mental health/SUD conditions or may have recognized mental health/SUD conditions but decline a referral to mental health/SUD specialty care. Also, because mental health/SUD conditions are dynamic (remitting in some patients and recurring or appearing for the first time in others), some individual patients might have needed mental health/SUD specialty services in one year, but not in another of the years examined.

Sourcebook Vol. 4 - Part 2: Utilization
62
Exhibit 2.L. VHA Mental Health/SUD Encounters Among Women Veteran VHA Patients, FY00-FY15
Key: FY – Fiscal Year; SUD – Substance Use Disorder; VHA – Veterans Health AdministrationNotes: Findings portray Veteran VHA patients, not the entire Veteran population. See Technical Appendix. Due to rounding, the aggregated percentages
may not equal the sum of the component values reported in this exhibit.Cohort: Women Veteran VHA patients in each year. FY00: N=159,810; FY05: N=231,907; FY10: N=317,122; FY15: N=439,791.Source: WHEI Master Database, FY00-FY15
5% 5% 7% 8% 4% 5%
7% 8% 6% 7% 9%
10% 3%
4%
5% 6%
6% 6%
7% 8%
0
20
40
60
80
100
FY00 FY05 FY10 FY15
% W
omen
Vet
eran
Pat
ients
None
1
2
3-5
6-11
12+
Number of Encounters
9%
23% 27% 35% 40% 9%
10%
11%
14%
14%
16%
16%
Mental Health/SUD Specialty Care Encounters
Women. The proportions of women Veteran VHA patients with mental health/SUD encounters increased between FY00 and FY15 (FY00: 23%95; FY15: 40%) (Exhibit 2.L).96 Over this period, the absolute number of women using mental health/SUD services increased 4.8-fold (FY00: 37,152; FY15: 176,526). Between FY00 and FY15, the proportions with 2-5 encounters increased (FY00: 9%; FY15: 16%), as did frequent use (6+ encounters) (FY00: 9%; FY15: 16%). The number of women with frequent use (6+ encounters) increased 4.9-fold (FY00: 14,456; FY15: 71,416).

Sourcebook Vol. 4 - Part 2: Utilization
63
0
20
40
60
80
100
FY00 FY05 FY10 FY15 FY00 FY05 FY10 FY15 FY00 FY05 FY10 FY15 18-44 45-64 65+
% W
omen
Vet
eran
Pat
ients
None
1
2
3-5
6-11
12+
Number of Encounters
Exhibit 2.M. VHA Mental Health/SUD Encounters Among Women Veteran VHA Patients by Age, FY00-FY15
Key: FY – Fiscal Year; SUD – Substance Use Disorder; VHA – Veterans Health AdministrationNotes: Findings portray Veteran VHA patients, not the entire Veteran population. See Technical Appendix.Cohort: Women Veteran VHA patients with non-missing ages 18-110 years (inclusive). Women: FY00: N=159,728; FY05: N=231,885; FY10: N=317,087; FY15:
N=439,615. Source: WHEI Master Database, FY00-FY15
Women, by age. As seen in Exhibit 2.M, the proportions of women Veteran VHA patients using mental health/SUD care increased substantially between FY00 and FY15 among 18-44 year-olds (FY00: 26%; FY15: 45%); among 45-64 year-olds (FY00: 27%; FY15: 40%); and among 65+ year-olds (FY00: 11%; FY15: 20%).97
Between FY00 and FY15, higher proportions of women in each age cohort appeared in each level of mental health/SUD care use. The proportions with one encounter increased among women 18-44 years old (FY00: 7%; FY15: 10%); 45-64 years old (FY00: 5%; FY15: 7%); and 65+ years old (FY00: 3%; FY15: 4%). The proportions with 2-5 encounters increased among women 18-44 years old (FY00: 9%; FY15: 18%); 45-64 years old (FY00: 10%; FY15: 16%); and 65+ years old (FY00: 5%; FY15: 9%). Finally, frequent use (6+ encounters) increased among women 18-44 years old (FY00: 10%; FY15: 18%); 45-64 years old (FY00: 12%; FY15: 18%); and 65+ years old (FY00: 3%; FY15: 7%).

Sourcebook Vol. 4 - Part 2: Utilization
64
Women versus men. Over the period examined, the proportions of Veteran VHA patients with mental health/SUD care encounters increased for both women and men, but consistently higher proportions of women than men used mental health/SUD care (FY00: 23% vs. 17%; FY15: 40% vs. 25%). The increase in number of mental health/SUD patients was greater in women (FY00: 37,152; FY15: 176,526, a 4.8-fold increase) than in men (FY00: 562,115; FY15: 1,371,848, a 2.4-fold increase) (data not represented graphically).
Exhibit 2.N compares the proportions of women and men Veteran VHA patients with mental health/SUD encounters in each year, within each age group. Among 18-44 year-olds, similar proportions of women and men had any mental health/SUD encounters in both FY00 and FY15 (FY00: 26% vs. 27%, ∆ = -1%; FY15: 45% vs. 44%, ∆ = +1%). In contrast, higher proportions of women than men had any mental health/SUD care encounters among 45-64 year-olds (FY00: 27% vs. 24%, ∆ = +3%; FY15: 40% vs. 32%, ∆ = +9%98) and among 65+ year-olds (FY00: 11% vs. 9%, ∆ = +2%; FY15: 20% vs. 16%, ∆ = +5%99).
Among 18-44 year-olds, lower proportions of women than men had frequent (6+ encounters) mental health/SUD use in FY00, but by FY15, higher proportions of women than men did (FY00: 10% vs. 11%, ∆ = -1%; FY15: 18% vs. 16%, ∆ = +2%). Among 45-64 year-olds, higher proportions of women than men had frequent use in each year, and the difference between women and men widened over time (FY00: 12% vs. 10%, ∆ = +2%; FY15: 18% vs. 12%, ∆ = +5%100). The same was true for 65+ year-olds (FY00: 3% vs. 2%, ∆ = +1%; FY15: 7% vs. 5%, ∆ = +2%).
Focusing on only the subgroup of Veteran VHA patients with any use of mental health/SUD specialty care in the year being examined,101 the average number of mental health/SUD encounters was high in both FY00 and FY15, for both women and men overall (FY00: 11.6 vs. 13.5 encounters; FY15: 9.4 vs. 9.1 encounters). This was also true for both women and men who were 18-44 years old (FY00: 11.4 vs. 15.5 encounters; FY15: 8.4 vs. 8.9 encounters); 45-64 years old (FY00: 12.9 vs. 15.3 encounters; FY15: 10.6 vs. 11.0 encounters); and 65+ years old (FY00: 8.0 vs. 7.4 encounters; FY15: 7.6 vs. 6.9 encounters) (data not represented graphically).

Sourcebook Vol. 4 - Part 2: Utilization
65
0
20
40
60
80
100
Women Men Women Men Women Men Women Men FY00 FY05 FY10 FY15
% V
eter
an P
atien
ts, A
ge 18
-44
0
20
40
60
80
100
Women Men Women Men Women Men Women Men FY00 FY05 FY10 FY15
% V
eter
an P
atien
ts, A
ge 45
-64
0
20
40
60
80
100
Women Men Women Men Women Men Women Men FY00 FY05 FY10 FY15
% V
eter
an P
atien
ts, A
ge 65
+
None
1
2
3-5
6-11
12+
Number of Encounters
Exhibit 2.N. VHA Mental Health/SUD Encounters Among Women and Men Veteran VHA Patients by Age, FY00-FY15
Key: FY – Fiscal Year; SUD – Substance Use Disorder; VHA – Veterans Health AdministrationNotes: Findings portray Veteran VHA patients, not the entire Veteran population. See Technical Appendix.Cohort: Women and men Veteran VHA patients with non-missing ages 18-110 years (inclusive). Women: FY00: N=159,728; FY05: N=231,885; FY10: N=317,087;
FY15: N=439,615. Men: FY00: N=3,226,162; FY05: N=4,569,901; FY10: N=5,034,379; FY15: N=5,450,014.Source: WHEI Master Database, FY00-FY15
NOTES TO INTERPRETATION: The extent to which factors such as condition prevalence, disease severity, cultural differences, or personal preferences contribute to observed differences across subgroups (e.g., differences in utilization by age and differences between women and men) is not assessed by these analyses. Also note that within each age group examined, the age distribution has been changing over time, which could likewise influence observed between-group differences. The age distribution within each age group, by year, is presented in Exhibit 3.A and in Part 3, Notes to Interpretation of Findings. Information about gender differences in medical and mental health conditions (in FY00 and FY15) is also presented in Part 3.

Sourcebook Vol. 4 - Part 2: Utilization
66
Implications
A large and growing segment of women Veteran VHA patients have been using VHA mental health/SUD specialty care during the time period FY00-FY15; among those using such care, multiple visits are becoming more common. It is not known whether women’s increasing use of mental health/SUD specialty services—which is occurring despite U.S. health care reform that has increased women’s options for alternatives to VHA care—reflects improvements in connecting Veterans with VHA services post deployment, increased prevalence of mental health/SUD conditions, improved patient perceptions of VHA mental health/SUD specialty care, or other factors.
VHA is recognized for its longstanding expertise and leadership in mental health/SUD care (e.g., through integration of mental health providers into primary care settings, increases in mental health specialty care capacity, research investment, provider training, etc.). It appears that such services may be of particular importance for the substantial subset of women Veterans who require this type of care.
Although a greater proportion of women than men use any mental health/SUD specialty care, mental health/SUD service arrangements for women vary across VHA.102,103 Recent research assesses potential relevance of mental health/SUD care delivery system adaptations designed to meet women Veterans’ treatment needs;104,105,106 given the large number of women using these services, such inquiry is timely. Since women Veterans with mental health/SUD conditions may have an excess burden of medical illness,107,108,109 coordination with primary care and medical specialty services is also important for women who use VHA mental health/SUD clinics.

Sourcebook Vol. 4 - Part 2: Utilization
67
Reproductive Health Care The text and exhibits in this section describe the proportions and/or numbers of women Veteran VHA patients receiving reproductive health services. Information about two types of reproductive health care can be found in this section: (a) obstetrics/gynecology specialty outpatient care provided within VHA and/or through Purchased Care, and (b) obstetric deliveries provided through inpatient Purchased Care.110
Obstetrics/Gynecology Specialty Care, in VHA and Through Purchased Care
Definition of TermsObstetrics/gynecology specialty care outpatient visits could occur in VHA settings or in Purchased Care settings.111
• VHA obstetrics/gynecology specialty care refers to the presence of at least one encounter during the year occurring in VHA gynecology clinics (clinic “stop codes” 404 and 426) and/or (starting in FY15) in VHA obstetrics clinics (clinic “stop code” 339). Although these clinics are intended to provide specialty care, in some cases obstetrics/gynecology providers may also perform common primary care services, such as cervical cancer screening or prescribing of oral contraceptives. One of the goals of the 2010 Comprehensive Women’s Health Care policy112 was to realign service delivery systems so that Women’s Health Primary Care Providers could perform routine gender-specific care, thereby freeing obstetrics/gynecology providers to focus on specialized care. Such policy changes, implemented during the time period examined by this Sourcebook, therefore may have influenced the relative frequency with which such services were provided in obstetrics/gynecology specialty clinics versus primary care clinics. However, Sourcebook Volume 4 examines only whether there was use of VHA obstetrics/gynecology specialty care clinics and not the specific types of services delivered in those clinics.
• Purchased Care obstetrics/gynecology specialty care refers to the presence of at least one outpatient record—during the year being examined—in the Purchased Care system, with a diagnosis code in the “pregnancy” or other “reproductive health” category.113

Sourcebook Vol. 4 - Part 2: Utilization
68
Exhibit 2.O. Obstetrics/Gynecology Specialty Care by Setting (VHA and/or Purchased Care) Among Women Veteran VHA Patients, FY00-FY15
Key: FY – Fiscal Year; OB/GYN – obstetrics/gynecology; VHA – Veterans Health AdministrationNotes: Findings portray Veteran VHA patients, not the entire Veteran population. See Technical Appendix.Cohort: Women Veteran VHA patients in each year. FY00: N=159,810; FY05: N=231,907; FY10: N=317,122; FY15: N=439,791.Source: WHEI Master Database, FY00-FY15
0
20
40
60
80
100
FY00 FY05 FY10 FY15
% W
omen
Vet
eran
Pat
ients
No OB/GYN Care
OB/GYN Care in Purchased Care Only
OB/GYN Care in Both VHAand Purchased Care
OB/GYN Care in VHA Only
Obstetrics/Gynecology Specialty Care
14% 1% 2%
13% 3% 3%
14% 12%
Women. For each year examined, the proportions of women Veteran VHA patients receiving obstetrics/gynecology specialty care in VHA, through Purchased Care or both, can be seen in Exhibit 2.O.114
First considering obstetrics/gynecology specialty care provided in a VHA setting, the proportions of women with at least one such encounter in VHA was similar across years, dropping modestly in FY15 (FY00: 14%; FY15: 12%).115 Although the proportions decreased over time, the absolute number of women who received obstetrics/gynecology specialty care increased 2.4-fold over the 16-year period (FY00: 21,789; FY15: 52,386). The proportions of women with at least two VHA obstetrics/gynecology clinic encounters remained fairly stable over this period (FY00: 5%; FY15: 4%) (data not represented graphically in Exhibit 2.O).
In contrast, far lower proportions of women received obstetrics/gynecology specialty care in a Purchased Care setting, although there was an increase over time (FY00: 1%; FY15: 3%). There was a 7.7-fold increase in the absolute number of women receiving obstetrics/gynecology specialty care through Purchased Care over time (FY00: 1,867; FY15: 14,447).
Very low proportions of women received obstetrics/gynecology specialty care in both a VHA setting and a Purchased Care setting in a single year, although this pattern also increased over time (FY00: <1%116; FY15: 1%). Although absolute numbers were small, there was a 7.2-fold increase in the number of women who received both VHA-based and Purchased Care-based obstetrics/gynecology specialty care over the period examined (FY00: 529; FY15: 3,801).

Sourcebook Vol. 4 - Part 2: Utilization
69
0
20
40
60
80
100
FY00 FY05 FY10 FY15 FY00 FY05 FY10 FY15 FY00 FY05 FY10 FY15 18-44 45-64 65+
% W
omen
Vet
eran
Pat
ients
No OB/GYN Care
OB/GYN Care in Purchased Care Only
OB/GYN Care in Both VHAand Purchased Care
OB/GYN Care in VHA Only
Obstetrics/Gynecology Specialty Care
Exhibit 2.P. Obstetrics/Gynecology Specialty Care by Setting (VHA and/or Purchased Care) Among Women Veteran VHA Patients by Age, FY00-FY15
Key: FY – Fiscal Year; OB/GYN – obstetrics/gynecology; VHA – Veterans Health AdministrationNotes: Findings portray Veteran VHA patients, not the entire Veteran population. See Technical Appendix.Cohort: Women Veteran VHA patients with non-missing ages 18-110 (inclusive). Women: FY00: N=159,728; FY05: N=231,885; FY10: N=317,087; FY15: N=439,615. Source: WHEI Master Database, FY00-FY15
Women, by age. Exhibit 2.P shows trends over time in the proportions of women Veteran VHA patients with obstetrics/gynecology specialty care in VHA, through Purchased Care, or both, within each age group.117, 118
First considering VHA-based obstetrics/gynecology specialty care encounters, among the youngest cohort (18-44 year-olds), the proportions with any VHA obstetrics/gynecology specialty care (i.e., the sum of “OB/GYN Care in VHA Only” plus “OB/GYN Care in Both VHA and Purchased Care”) increased between FY00 and FY10, but by FY15, the proportion had nearly returned to the FY00 level (FY00: 15%; FY05: 16%; FY10: 18%; FY15: 16%). Among 45-64 year-olds, the proportions with any VHA obstetrics/gynecology specialty care decreased throughout the period (FY00: 15%; FY15: 10%). Among 65+ year-olds, the proportions with any VHA obstetrics/gynecology specialty care decreased between FY00 and FY10 and then remained constant in FY15 (FY00: 8%; FY05: 5%; FY10: 4%; FY15: 4%).
Over the period examined, the absolute number of women receiving VHA-based obstetrics/gynecology care increased 2.5-fold among 18-44 year-olds (FY00: 12,240; FY15: 30,858) and 2.8-fold among 45-64 year-olds (FY00: 6,990; FY15: 19,573), but decreased among 65+ year-olds (FY00: 2,558; FY15: 1,955).
Although involving far fewer women than VHA-based obstetrics/gynecology care, the proportions of women using obstetrics/gynecology specialty care through Purchased Care increased consistently over this period for 18-44 year-olds (FY00: 2%; FY15: 6%), but applied to only very small proportions of women in the 45-64 year-old group (FY00: 1%; FY15: 1%) and 65+ year-old group (FY00: <1%119; FY15: 1%).
Across all years and all age groups, only small proportions of women received obstetrics/gynecology specialty care through both VHA and Purchased Care. However, among women in the 18-44 year-old age group, there was a 7.4-fold increase over time in this pattern (FY00: <1%; FY15: 2%). For other age groups, across years, this pattern represented <1% of women.

Sourcebook Vol. 4 - Part 2: Utilization
70
Implications
The reason for the slight decrease over time in the proportions of women Veteran VHA patients with a VHA-based obstetrics/gynecology specialty care outpatient visit merits evaluation; possible reasons include improvements in provision of routine gender-specific care (such as cervical cancer screening, contraception, etc.) in primary care settings (sparing women obstetrics/gynecology referrals for such services); improvements in Emergency Department providers’ training in gynecologic emergencies (likewise reducing the need for referral); a change in cervical cancer screening guidelines, which now recommend longer screening intervals;120, 121 or an increase in VHA referrals to community-based Purchased Care providers for specialty services. With the progressively increasing reach of VHA’s effort to ensure that women can access a Women’s Health Primary Care Provider at every point of care, women have growing opportunities to receive routine gender-specific services as part of a “one-stop shopping” primary care visit, thereby freeing capacity of VHA obstetrics/gynecology specialists for specialized services and better aligning services with needs. For women who do receive specialty obstetrics/gynecology care within VHA or through Purchased Care, coordination with other elements of their care is essential.122,123
Although the proportion of women receiving VHA-based obstetrics/gynecology specialty care decreased modestly, the absolute number has more than doubled from FY00 to FY15. This supports the importance of VHA’s efforts in recent years to expand its obstetrics/gynecology provider workforce and to expand the geographic distribution of obstetrics/gynecology providers in VHA facilities nationwide.124,125,126

Sourcebook Vol. 4 - Part 2: Utilization
71
260
946
1,902
3,756
0
500
1,000
1,500
2,000
2,500
3,000
3,500
4,000
FY00 FY05 FY10 FY15
# Wom
en V
eter
an P
atien
ts
Exhibit 2.Q. VHA-Covered Obstetric Deliveries Among Women Veteran VHA Patients, FY00-FY15
Key: FY – Fiscal Year; VHA – Veterans Health AdministrationNotes: This Exhibit displays the number of women Veterans with at least one delivery through Purchased Care during the year being examined.
Findings portray Veteran VHA patients, not the entire Veteran population. See Technical Appendix.Cohort: Women Veteran VHA patients in each year. FY00: N=159,810; FY05: N=231,907; FY10: N=317,122; FY15: N=439,791.Source: WHEI Master Database, FY00-FY15
Obstetric Deliveries
Definition of TermsObstetric deliveries for women Veteran VHA patients are predominantly hospital-based, and thus are identified via an algorithm127 that draws on inpatient Purchased Care records.128,129 Women with at least one such record in the year being examined are considered to have had a delivery.130
Women. Exhibit 2.Q reports the number131 of women Veteran VHA patients who had deliveries through the Purchased Care system by year. The number of women with deliveries increased dramatically (14.4-fold) between FY00 and FY15 (FY00: 260; FY15: 3,756). This increase occurred in parallel with the growing number of women of childbearing age receiving VHA care during this period (see Part 1).

Sourcebook Vol. 4 - Part 2: Utilization
72
62 203
294 343
96
320
805
1,299
60
250
495
1,433
35 138
251
572
<11 35 57 109
0
250
500
750
1,000
1,250
1,500
1,750
2,000
FY00 FY05 FY10 FY15 FY00 FY05 FY10 FY15 FY00 FY05 FY10 FY15 FY00 FY05 FY10 FY15 FY00 FY05 FY10 FY15 18-24 25-29 30-34 35-39 40+
# Wom
en V
eter
an P
atien
ts
Exhibit 2.R. VHA-Covered Obstetric Deliveries Among Women Veteran VHA Patients by Age, FY00-FY15
Key: FY – Fiscal Year; VHA – Veterans Health AdministrationNotes: This Exhibit displays the number of women Veterans with at least one inpatient delivery through Purchased Care during the year being examined.
Findings portray Veteran VHA patients, not the entire Veteran population. See Technical Appendix.Cohort: Women Veteran VHA patients with non-missing ages 18-110 (inclusive). Women: FY00: N=159,728; FY05: N=231,885; FY10: N=317,087; FY15: N=439,615. Source: WHEI Master Database, FY00-FY15
Women, by age (fine age groups). Exhibit 2.R shows the number of women Veteran VHA patients with deliveries through the Purchased Care system, among five age groups of women, applying finer age groups than are examined in other sections of Sourcebook Volume 4. The exhibit indicates that the number of deliveries increased among all age cohorts examined. Among the youngest women (18-24 year-olds), the number of women with deliveries increased 5.5-fold (FY00: 62; FY15: 343). Among women 25 years or older, these increases were even more striking. The number of women with deliveries increased 13.5-fold among 25-29 year-olds (FY00: 96; FY15: 1,299); 23.9-fold among 30-34 year-olds (FY00: 60; FY15: 1,433); 16.3-fold among 35-39 year-olds (FY00: 35; FY15: 572); and 15.6-fold among women age 40+ years old (FY00: <11; FY15: 109). Cumulatively, among all women age 35 years or older, the number with deliveries increased 16.2-fold from FY00 to FY15 (data not represented graphically in Exhibit 2.R).
Sourcebook Vol. 4 - Part 2: Utilization
73
Implications
Although this Sourcebook does not examine what conditions drive the observed increase over time in receipt of obstetrics/gynecology specialty care through Purchased Care among women of childbearing age, the large increase in obstetric deliveries through Purchased Care over the same period—consistent with the findings of others132—suggests that pregnancy-related care could explain at least part of the increase. The precipitous rise in deliveries has outpaced growth in the number of women Veterans of childbearing age. This suggests that, despite emerging evidence that many women who use VHA may turn to other payors (e.g., Medicaid) for their obstetric care,133 women Veterans increasingly are relying on VHA for this service. This could perhaps be in part because the benefits package has improved over time: since FY10, VHA benefits cover not only the mother but also the first week of life of the newborn.134 It also could be related to improved patient experiences. For example, VHA-based Maternity Care Coordinators are now available to assist women during their pregnancies. If deliveries continue to increase at their current pace, such coordination services will become even more crucial. This is especially true, given that many women Veterans with obstetric deliveries have risk factors for adverse pregnancy outcomes, including advanced maternal age (35+ years old) or serious comorbidities like posttraumatic stress disorder (PTSD).135,136,137

Sourcebook Vol. 4 - Part 2: Utilization
74
Endnotes1 Note that the official term for care that VHA purchases for its patients has evolved over the 16-year time period covered by Sourcebook Volume 4;
terms have included “Fee Basis Care,” “Non-VA Medical Care,” and, more recently, “Community Care” or “Care in the Community.” Information about the VHA Office of Community Care is available at http://vaww.va.gov/CBO/ (accessed June 13, 2017). This Sourcebook uses the term “Purchased Care” across all years (even in FY15, when VHA provided Purchased Care not only through fee basis care but also through the Veterans Choice program). This convention is used, in part, for parsimony of cross-year terminology and also to distinguish this type of non-VHA care from other types of care that VHA patients might receive outside of VHA (e.g., care funded through Medicare, private insurance, etc.).
2 Frayne SM, Phibbs CS, Saechao F, et al. Sourcebook: Women Veterans in the Veterans Health Administration. Volume 3. Sociodemographics: Utilization, costs of care, and health profile. Women’s Health Evaluation Initiative, Women’s Health Services, Veterans Health Administration, Department of Veterans Affairs, Washington DC. February 2014. Available from http://www.womenshealth.va.gov/WOMENSHEALTH/docs/Sourcebook_Vol%203_FINAL.pdf.
3 Sourcebook Volume 1 reports FY09 data, Sourcebook Volume 2 reports FY10 data, and Sourcebook Volume 3 reports FY12 data. Sourcebook Volume 4 focuses on trends over time, reporting FY00, FY05, FY10, and FY15 data.
4 Also note that the FY10 data presented in Sourcebook Volume 2 may not match exactly the FY10 data presented in Sourcebook Volume 4 because of updates to the algorithms used to define Veteran patients, sex, and date of birth. See Online Appendix (Technical Appendix) available at http://www.womenshealth.va.gov/WOMENSHEALTH/sourcebookvol4onlineappendix.asp.
5 Although counts of VHA outpatient visits are provided in this Sourcebook, counts of Purchased Care outpatient visits are not included here. This is because the Purchased Care source databases are structured differently from the VHA databases and do not provide information about discrete Purchased Care visits. Instead, the source databases provide information about individual services. For example, in VHA utilization data, a patient’s visit to a Gynecology Clinic (where she sees the gynecologist who performs an office procedure) would count as a single “encounter.” In contrast, a comparable visit in the Purchased Care system could be recorded as multiple “services.” These might include the gynecologist’s service to evaluate the patient, the office procedure performed during the visit, and the supplies used during the procedure. Additional details about Purchased Care utilization are available in Sourcebook Volumes 2 and 3.
6 Mental Health/Substance Use Disorder (SUD) Specialty Care includes any care by mental health/SUD specialists, whether that care is provided in an individual or group setting and whether the mental health/SUD specialist is embedded in a primary care setting or practicing in a separate mental health/SUD specialty clinic setting.
7 Tables showing details of the values used to generate the Exhibits appear in the Online Appendix, available for download at: https://www.womenshealth.va.gov/WOMENSHEALTH/sourcebookvol4onlineappendix.asp.
8 Frayne SM, Yu W, Yano EM, et al. Gender and use of care: Planning for tomorrow’s Veterans Health Administration. J Women’s Health (Larchmt). Oct 2007;16(8):1188-1199.
9 Services provided in Vet Centers, which offer readjustment counseling services, are also not included. For more information, see https://www.vetcenter.va.gov/index.asp (accessed June 13, 2017).
10 Sourcebook Volume 2 includes additional information about specific types of Purchased Care services. Historically, the use of Purchased Care for primary care and mental health care services has been low.
11 Also note that, unlike Sourcebook Volumes 2 and 3, Sourcebook Volume 4 does not examine mammography services provided through Purchased Care.
12 Veterans Health Administration. VHA site classification and definitions. (VHA Handbook 1006.02). Washington, DC: Department of Veterans Affairs, 2013.
13 VHA outpatient services include the full spectrum of in-person and telephone or telehealth visits that a patient might have with a health care provider (including but not limited to physicians, nurse practitioners, psychologists, physical therapists, etc.) as well as laboratory testing, radiology studies, and other medical procedures. Outpatient care may occur at a VHA medical center, at a VHA CBOC, in the patient’s home, by telephone, or in other settings.
14 Counts of VHA outpatient encounters do not include inpatient stays, contracted long-term care, and VHA pharmacy prescribing services; they also do not include Purchased Care.
15 If a patient visits two or more clinics on a single day (e.g., the patient has encounters in primary care, physical therapy, and laboratory on the same day), each counts as a separate encounter (See Online Appendix (Technical Appendix) available at http://www.womenshealth.va.gov/WOMENSHEALTH/sourcebookvol4onlineappendix.asp).
16 This could happen, for example, if a woman received inpatient VHA care during the year being examined, but received no outpatient care during the year being examined.

Sourcebook Vol. 4 - Part 2: Utilization
75
17 As discussed in the Notes to Interpretation of the Overview to Part 2, when Sourcebook Volume 4 reports a change in utilization of a particular type of service from FY00 to FY15, this refers to utilization during FY00 among the cohort of Veterans who used VHA in FY00, compared to utilization during FY15 among the cohort of Veterans who used VHA in FY15. Individual Veterans who used VHA in FY00 may or may not have used VHA in FY15.
18 As discussed in the Notes to Interpretation of the Overview to Part 2, when Sourcebook Volume 4 reports a change in utilization of a particular type of service from FY00 to FY15 within a particular age group of Veterans, this refers to utilization during FY00 among the cohort of Veterans who used VHA in FY00 and who fell into that age group in FY00, compared to utilization during FY15 among the cohort of Veterans who used VHA in FY15 and who fell into that age group in FY15. Individual Veterans who used VHA in FY00 may or may not have used VHA in FY15 and may or may not have fallen into the same age group in FY00 as in FY15.
19 Due to rounding, this number may not equal the difference of the component values reported in the text.20 Note that this paragraph focuses only on the subset of Veteran VHA patients who were users of VHA outpatient care, unlike the previous
paragraph that included all Veteran VHA patients in the denominator.21 See, for example, information about VHA’s culture change campaign: https://www.womenshealth.va.gov/WOMENSHEALTH/outreachmaterials/
culturechange/campaigns.asp (accessed June 19, 2017).22 Washington DL, Farmer MM, Mor SS, Canning M, Yano EM. Assessment of the healthcare needs and barriers to VA use experienced by women
Veterans: Findings from the National Survey of Women Veterans. Med Care. Apr 2015;53(4 Suppl 1):S23-S31. 23 Veterans Health Administration. Health care services for women Veterans (VHA Handbook 1330.01). Washington, DC: US Department of Veterans
Affairs;2010.24 Friedman SA, Phibbs CS, Schmitt SK, Hayes PM, Herrera L, Frayne SM. New women Veterans in the VHA: A longitudinal profile. Women’s Health
Issues. 2011;21(Suppl 4):S103-S111.25 Friedman SA, Frayne SM, Berg E, et al. Travel time and attrition from VHA care among women Veterans: How far is too far? Med Care. Apr 2015;
53(4 Suppl 1):S15-S22.26 Note that the official term for care that VHA purchases for its patients has evolved over the 16-year time period covered by Sourcebook Volume 4;
terms have included “Fee Basis Care,” “Non-VA Medical Care,” and, more recently, “Community Care” or “Care in the Community.” Information about the VHA Office of Community Care is available at http://vaww.va.gov/CBO/ (accessed June 13, 2017). This Sourcebook uses the term “Purchased Care” across all years (even in FY15, when VHA provided Purchased Care not only through fee basis care but also through the Veterans Choice program). This convention is used, in part, for parsimony of cross-year terminology and also to distinguish this type of non-VHA care from other types of care that VHA patients might receive outside of VHA (e.g., care funded through Medicare, private insurance, etc.).
27 That is, all service types appearing in the outpatient Purchased Care files for the year being examined.28 For each fiscal year examined, this Sourcebook reports the proportion of Veterans who had at least one outpatient service reimbursed through
Purchased Care in that fiscal year. In some cases, a service reimbursed in a particular year actually reflects care received in a previous year. Because of ongoing growth in numbers of Veterans seeking VHA care, the volume of services in later years consistently tends to exceed the volume in prior years. Thus, the net effect is that WHEI’s approach to counting Purchased Care, which draws on only current year Purchased Care files, provides a conservative (low) estimate of Purchased Care actually provided in the fiscal year being examined. This is explained further in the Online Appendix (Technical Appendix) available at http://www.womenshealth.va.gov/WOMENSHEALTH/sourcebookvol4onlineappendix.asp.
29 Care that women receive from VHA under global contracts also may not be captured.30 As discussed in the Notes to Interpretation of the Overview to Part 2, when Sourcebook Volume 4 reports a change in utilization of a particular
type of service from FY00 to FY15, this refers to utilization during FY00 among the cohort of Veterans who used VHA in FY00, compared to utilization during FY15 among the cohort of Veterans who used VHA in FY15. Individual Veterans who used VHA in FY00 may or may not have used VHA in FY15.
31 As discussed in the Notes to Interpretation of the Overview to Part 2, when Sourcebook Volume 4 reports a change in utilization of a particular type of service from FY00 to FY15 within a particular age group of Veterans, this refers to utilization during FY00 among the cohort of Veterans who used VHA in FY00 and who fell into that age group in FY00, compared to utilization during FY15 among the cohort of Veterans who used VHA in FY15 and who fell into that age group in FY15. Individual Veterans who used VHA in FY00 may or may not have used VHA in FY15 and may or may not have fallen into the same age group in FY00 as in FY15.
32 Due to rounding, this number may not equal the difference of the component values reported in the text.33 Due to rounding, this number may not equal the difference of the component values reported in the text.34 Information about the VHA Office of Community Care is available at http://vaww.va.gov/CBO/ (accessed June 13, 2017). 35 Veterans Access, Choice, and Accountability Act of 2014, Pub. L. No: 113-146, 113th Congress (2013-2014). 36 Information about the Veterans Choice Program is available at https://www.va.gov/opa/choiceact/index.asp.37 Mattocks KM. Care coordination for women Veterans: Bridging the gap between systems of care. Med Care. Apr 2015;53(4 Suppl 1):S8-S9.

Sourcebook Vol. 4 - Part 2: Utilization
76
38 Mattocks KM, Mengeling M, Sadler A, et al. The Veterans Choice Act: A qualitative examination of rapid policy implementation in the Department of Veterans Affairs. Med Care. Jul 2017;55 (7 Suppl 1):S71-S75.
39 Zuchowski JL, Chrystal JG, Hamilton AB, et al. Coordinating care across health care systems for Veterans with gynecologic malignancies: A qualitative analysis. Med Care. Jul 2017;55 (7 Suppl 1):S53-S60.
40 This section describes only primary care services delivered in VHA settings and not primary care services delivered through Purchased Care providers; receipt of primary care through Purchased Care providers is expected to be relatively uncommon during the period examined.
41 Veterans Health Administration. Health care services for women Veterans (VHA Handbook 1330.01). Washington, DC: Department of Veterans Affairs, 2010.
42 WH-PCPs were previously referred to by the term, “Designated Women’s Health Primary Care Providers” (DWHPs).43 A limited number of encounters with non-primary care providers (such as a social worker or psychologist embedded in the women’s health clinic
primary care team) may be captured with the women’s health clinic “stop code” 322, and thus are included in the count of women’s health clinic encounters. In FY15, the “secondary stop code” field indicated a provider other than a primary care provider/nurse in only 3% of records.
44 Veterans Health Administration. Health care services for women Veterans (VHA Handbook 1330.01). Washington, DC: Department of Veterans Affairs, 2010.
45 Maisel NC, Haskell S, Hayes PM, et al. Readying the workforce: Evaluation of VHA’s comprehensive women’s health primary care provider initiative. Med Care. Apr 2015; 53(4 Suppl 1): S39-S46.
46 United States. Department of Veterans Affairs. Veterans Health Administration. VHA Support Service Center. (2016) Women’s Assessment Tool for Comprehensive Health (WATCH). Retrieved from Organization’s Secure Intranet. Accessed June 21, 2017.
47 Sourcebook Volume 3 does include information about telephone services in FY12.48 Note that in Sourcebook Volume 3, the denominator for primary care utilization analyses was “outpatients” rather than “patients.” This means
that the FY12 utilization data presented in Sourcebook Volume 3 cannot be directly compared to the utilization data in Sourcebook Volume 4, as the latter draw on a larger denominator. Sourcebook Volume 4 reports that 86% of women Veteran VHA patients used primary care in FY15, as displayed in the following section. Not reported in Sourcebook Volume 4’s exhibits (but to assist with comparability to prior Sourcebook volumes), 87% of women Veteran outpatients used primary care in FY15.
49 As discussed in the Notes to Interpretation of the Overview to Part 2, when Sourcebook Volume 4 reports a change in utilization of a particular type of service from FY00 to FY15, this refers to utilization during FY00 among the cohort of Veterans who used VHA in FY00, compared to utilization during FY15 among the cohort of Veterans who used VHA in FY15. Individual Veterans who used VHA in FY00 may or may not have used VHA in FY15.
50 As discussed in the Notes to Interpretation of the Overview to Part 2, when Sourcebook Volume 4 reports a change in utilization of a particular type of service from FY00 to FY15 within a particular age group of Veterans, this refers to utilization during FY00 among the cohort of Veterans who used VHA in FY00 and who fell into that age group in FY00, compared to utilization during FY15 among the cohort of Veterans who used VHA in FY15 and who fell into that age group in FY15. Individual Veterans who used VHA in FY00 may or may not have used VHA in FY15 and may or may not have fallen into the same age group in FY00 as in FY15.
51 Note that counts of primary care encounters do not capture telephone visits or secure messaging encounters. Since the implementation of Patient Aligned Care Teams (PACT) in FY10, Veterans have had enhanced access to their primary care providers through these alternate modalities, potentially obviating the need for some in-person visits.
52 Due to rounding, this number may not equal the difference of the component values reported in the text.53 Due to rounding, this number may not equal the difference of the component values reported in the text.54 Due to rounding, this number may not equal the difference of the component values reported in the text.55 Due to rounding, this number may not equal the difference of the component values reported in the text.56 Note that this paragraph focuses on only the subset of Veteran VHA patients who were users of VHA primary care, unlike the prior paragraphs that
included all Veteran VHA patients in the denominator.57 Shen Y, Hendricks A, Zhang S, Kazis LE. VHA enrollees’ health care coverage and use of care. Med Care Res Rev. Jun 2003;60(2):253-267.58 Humensky J, Carretta H, De Groot K, Brown MM, Tarlov E, Hynes D. Service utilization of Veterans dually eligible for VA and Medicare
fee-for-service: 1999-2004. Medicare & Medicaid Research Review. 2012;2(3):E1-E22.59 Hynes DM, Koelling K, Stroupe K, et al. Veterans’ access to and use of Medicare and Veterans Affairs health care. Med Care. Mar 2007;45(3):
214-223.60 Petersen LA, Byrne MM, Daw CN, Hasche J, Reis B, Pietz K. Relationship between clinical conditions and use of Veterans Affairs health care among
Medicare-enrolled Veterans. Health Serv Res. Jun 2010;45(3):762-791.

Sourcebook Vol. 4 - Part 2: Utilization
77
61 See Sociodemographics section for the estimated total number of women Veterans in the U.S. over time (FY00: 1,593,254; FY15: 2,035,213 women Veterans in the U.S., total).
62 Washington DL, Bean-Mayberry B, Hamilton AB, Cordasco KM, Yano EM. Women Veterans’ healthcare delivery preferences and use by military service era: Findings from the National Survey of Women Veterans. J Gen Intern Med. Jul 2013;28 Suppl 2:S571-S576.
63 Kimerling R, Bastian LA, Bean-Mayberry BA, et al. Patient-centered mental health care for female Veterans. Psychiatr Serv. Feb 1 2015;66(2): 155-162.
64 Kehle-Forbes SM, Harwood EM, Spoont MR, Sayer NA, Gerould H, Murdoch M. Experiences with VHA care: A qualitative study of U.S. women Veterans with self-reported trauma histories. BMC Women’s Health. May 30 2017;17(1):38-46.
65 Mattocks KM, Nikolajski C, Haskell S, et al. Women Veterans’ reproductive health preferences and experiences: A focus group analysis. Women’s Health Issues. Mar-Apr 2011;21(2):124-129.
66 Bastian LA, Trentalange M, Murphy TE, et al. Association between women Veterans’ experiences with VA outpatient health care and designation as a women’s health provider in primary care clinics. Women’s Health Issues. Nov-Dec 2014;24(6):605-612.
67 See Part 3 of Sourcebook Volume 4 for information about time trends in prevalence of medical and mental health conditions.68 Veterans Health Administration. Patient Aligned Care Team (PACT) Handbook. (VHA Handbook 1101.10(1)). Washington, DC: Department of
Veterans Affairs, 2014.69 Rosland AM, Nelson K, Sun H, et al. The patient-centered medical home in the Veterans Health Administration. Am J Manag Care. Jul
2013;19(7):e263-e272.70 Yano EM, Bair MJ, Carrasquillo O, Krein SL, Rubenstein LV. Patient Aligned Care Teams (PACT): VA’s journey to implement patient-centered medical
homes. J Gen Intern Med. Jul 2014;29 Suppl 2:S547-S549.71 Veterans Health Administration. Health care services for women Veterans (VHA Handbook 1330.01). Washington, DC: Department of Veterans
Affairs, 2010.72 Maisel NC, Haskell S, Hayes PM, et al. Readying the workforce: Evaluation of VHA’s comprehensive women’s health primary care provider initiative.
Med Care. Apr 2015;53(4 Suppl 1):S39-S46.73 Bean-Mayberry B, Bastian L, Trentalange M, et al. Associations between provider designation and female-specific cancer screening in women
Veterans. Med Care. Apr 2015;53(4 Suppl 1):S47-S54.74 Bastian LA, Trentalange M, Murphy TE, et al. Association between women Veterans’ experiences with VA outpatient health care and designation as
a women’s health provider in primary care clinics. Women’s Health Issues. Nov-Dec 2014;24(6):605-612.75 Yano EM, Haskell S, Hayes P. Delivery of gender-sensitive comprehensive primary care to women Veterans: Implications for VA Patient Aligned
Care Teams. J Gen Intern Med. Jul 2014;29 Suppl 2:S703-S707.76 Yano EM. A partnered research initiative to accelerate implementation of comprehensive care for women Veterans: The VA Women’s Health
CREATE. Med Care. Apr 2015;53(4 Suppl 1):S10-S14.77 Yano EM, Darling JE, Hamilton AB, et al. Cluster randomized trial of a multilevel evidence-based quality improvement approach to tailoring VA
Patient Aligned Care Teams to the needs of women Veterans. Implement Sci. Jul 19 2016;11(1):101.78 Meredith LS, Wang Y, Okunogbe A, et al. Attitudes, practices, and experiences with implementing a Patient-Centered Medical Home for women
Veterans. Women’s Health Issues. Mar-Apr 2017;27(2):221-227.79 Chuang E, Brunner J, Mak S, et al. Challenges with implementing a Patient-Centered Medical Home model for women Veterans. Women’s Health
Issues. Mar-Apr 2017;27(2):214-220.80 deKleijn M, Lagro-Janssen AL, Canelo I, Yano EM. Creating a roadmap for delivering gender-sensitive comprehensive care for women Veterans:
Results of a national expert panel. Med Care. Apr 2015;53(4 Suppl 1):S156-S164.81 As discussed in the Notes to Interpretation of the Overview to Part 2, when Sourcebook Volume 4 reports a change in utilization of a particular
type of service from FY00 to FY15, this refers to utilization during FY00 among the cohort of Veterans who used VHA in FY00, compared to utilization during FY15 among the cohort of Veterans who used VHA in FY15. Individual Veterans who used VHA in FY00 may or may not have used VHA in FY15.
82 Veterans Health Administration. Health care services for women Veterans (VHA Handbook 1330.01). Washington, DC: Department of Veterans Affairs, 2010.
83 As discussed in the Notes to Interpretation of the Overview to Part 2, when Sourcebook Volume 4 reports a change in utilization of a particular type of service from FY00 to FY15 within a particular age group of Veterans, this refers to utilization during FY00 among the cohort of Veterans who used VHA in FY00 and who fell into that age group in FY00, compared to utilization during FY15 among the cohort of Veterans who used VHA in FY15 and who fell into that age group in FY15. Individual Veterans who used VHA in FY00 may or may not have used VHA in FY15 and may or may not have fallen into the same age group in FY00 as in FY15.

Sourcebook Vol. 4 - Part 2: Utilization
78
84 Veterans Health Administration. Health care services for women Veterans (VHA Handbook 1330.01). Washington, DC: Department of Veterans Affairs, 2010.
85 United States. Department of Veterans Affairs. Veterans Health Administration. VHA Support Service Center. (2016) Women’s Assessment Tool for Comprehensive Health (WATCH). Retrieved from Organization’s Secure Intranet. Accessed June 21, 2017.
86 Reddy SM, Rose DE, Burgess JF, Jr., Charns MP, Yano EM. The role of organizational factors in the provision of comprehensive women’s health in the Veterans Health Administration. Women’s Health Issues. Nov - Dec 2016;26(6):648-655.
87 Bean-Mayberry BA, Chang CC, McNeil MA, Whittle J, Hayes PM, Scholle SH. Patient satisfaction in women’s clinics versus traditional primary care clinics in the Veterans Administration. J Gen Intern Med. Mar 2003;18(3):175-181.
88 Atkins D, Kilbourne AM, Shulkin D. Moving from discovery to system-wide change: The role of research in a learning health care system: Experience from three decades of health systems research in the Veterans Health Administration. Annu Rev Public Health. Mar 20 2017;38: 467-487.
89 Frayne S, Carney D, Bastian L, et al. The VA Women’s Health Practice-Based Research Network: Amplifying women Veterans’ voices in VA research. J Gen Intern Med. 2013;28(2):504-509.
90 Yano EM, Frayne SM. Health and health care of women Veterans and women in the military: Research informing evidence-based practice and policy. Women’s Health Issues. Jul-Aug 2011;21(4 Suppl):S64-S66.
91 Yano EM, Bastian LA, Bean-Mayberry B, et al. Using research to transform care for women Veterans: Advancing the research agenda and enhancing research-clinical partnerships. Women’s Health Issues. Jul-Aug 2011;21(4 Suppl):S73-S83.
92 Institute of Medicine. Engineering a learning healthcare system: A look at the future. Washington, DC: National Academies Press; 2011. 93 Mental Health/SUD Specialty Care includes any care by mental health/SUD specialists, whether that care is provided in an individual or a group
setting and whether the mental health/SUD specialist is embedded in a primary care setting or practicing in a separate mental health/SUD specialty clinic setting.
94 Estimates of mental health encounters may differ between this Sourcebook and Northeast Program Evaluation Center (NEPEC, VA Office of Mental Health and Suicide Prevention) reports, due to differences in variable specifications.
95 Due to rounding, this number may not equal the sum of the component values reported in the Exhibit.96 As discussed in the Notes to Interpretation of the Overview to Part 2, when Sourcebook Volume 4 reports a change in utilization of a particular
type of service from FY00 to FY15, this refers to utilization during FY00 among the cohort of Veterans who used VHA in FY00, compared to utilization during FY15 among the cohort of Veterans who used VHA in FY15. Individual Veterans who used VHA in FY00 may or may not have used VHA in FY15.
97 As discussed in the Notes to Interpretation of the Overview to Part 2, when Sourcebook Volume 4 reports a change in utilization of a particular type of service from FY00 to FY15 within a particular age group of Veterans, this refers to utilization during FY00 among the cohort of Veterans who used VHA in FY00 and who fell into that age group in FY00, compared to utilization during FY15 among the cohort of Veterans who used VHA in FY15 and who fell into that age group in FY15. Individual Veterans who used VHA in FY00 may or may not have used VHA in FY15 and may or may not have fallen into the same age group in FY00 as in FY15.
98 Due to rounding, this number may not equal the difference of the component values reported in the text.99 Due to rounding, this number may not equal the difference of the component values reported in the text. 100 Due to rounding, this number may not equal the difference of the component values reported in the text.101 Note that this paragraph focuses on only the subset of Veteran VHA patients who were users of mental health/SUD care, unlike the prior
paragraphs that included all Veteran VHA patients in the denominator.102 Oishi SM, Rose DE, Washington DL, Macgregor C, Bean-Mayberry B, Yano EM. National variations in VA mental health care for women Veterans.
Womens Health Issues. Jul-Aug 2011;21(4 Suppl):S130-S137.103 MacGregor C, Hamilton AB, Oishi SM, Yano EM. Description, development, and philosophies of mental health service delivery for female Veterans
in the VA: A qualitative study. Womens Health Issues. Jul-Aug 2011;21(4 Suppl):S138-S144.104 Kimerling R, Bastian LA, Bean-Mayberry BA, et al. Patient-centered mental health care for female Veterans. Psychiatr Serv. Feb 1 2015;66(2):
155-162.105 Davis TD, Campbell DG, Bonner LM, et al. Women Veterans with depression in Veterans Health Administration primary care: An assessment of
needs and preferences. Womens Health Issues. Nov - Dec 2016;26(6):656-666.106 Lewis ET, Jamison AL, Ghaus S, et al. Receptivity to alcohol-related care among U.S. women Veterans with alcohol misuse. J Addict Dis. Oct-Dec
2016;35(4):226-237.

Sourcebook Vol. 4 - Part 2: Utilization
79
107 Frayne SM, Seaver MR, Loveland S, et al. Burden of medical illness in women with depression and posttraumatic stress disorder. Arch Intern Med. Jun 28 2004;164(12):1306-1312.
108 Cohen BE, Gima K, Bertenthal D, Kim S, Marmar CR, Seal KH. Mental health diagnoses and utilization of VA non-mental health medical services among returning Iraq and Afghanistan Veterans. J Gen Intern Med. Jan 2010;25(1):18-24.
109 Sadler AG, Booth BM, Nielson D, Doebbeling BN. Health-related consequences of physical and sexual violence: Women in the military. Obstet Gynecol. Sep 2000;96(3):473-480.
110 This is the only section of Part 2 that describes inpatient utilization.111 For each fiscal year examined, this Sourcebook reports the proportion of Veterans who had at least one outpatient service reimbursed through
Purchased Care in that fiscal year; the same approach is taken for Purchased Care obstetrics/gynecology services and obstetric deliveries. In some cases, a service reimbursed in a particular year actually reflects care received in a previous year. Because of ongoing growth in numbers of Veterans seeking VHA care, the volume of services in later years consistently tends to exceed the volume in prior years. Thus, the net effect is that WHEI’s approach to counting Purchased Care, which draws on only current year Purchased Care files, provides a conservative (low) estimate of Purchased Care actually provided in the fiscal year being examined. This is explained further in the Online Appendix (Technical Appendix) available at http://www.womenshealth.va.gov/WOMENSHEALTH/sourcebookvol4onlineappendix.asp.
112 Veterans Health Administration. Health care services for women Veterans (VHA Handbook 1330.01). Washington, DC: US Department of Veterans Affairs; 2010.
113 Although the term used in Sourcebook Volume 4 is “Purchased Care obstetrics/gynecology specialty care,” this type of care could potentially include some instances of care provided by a provider who is not an obstetrics/gynecology specialist but who records an ICD-9-CM code in the pregnancy or other reproductive health category as the reason for the visit. Given the low rate of Purchased Care obstetrics/gynecology specialty care reported herein, this is expected to be an infrequent occurrence.
114 Among women who receive no obstetrics/gynecology care through VHA or Purchased Care, some may have received obstetrics/gynecology care privately (e.g., through Medicare, Medicaid, or private insurance).
115 As discussed in the Notes to Interpretation of the Overview to Part 2, when Sourcebook Volume 4 reports a change in utilization of a particular type of service from FY00 to FY15, this refers to utilization during FY00 among the cohort of Veterans who used VHA in FY00, compared to utilization during FY15 among the cohort of Veterans who used VHA in FY15. Individual Veterans who used VHA in FY00 may or may not have used VHA in FY15.
116 Proportions below 0.5% are presented as “<1%.”117 Among women who receive no obstetrics/gynecology care through VHA or Purchased Care, some may have received obstetrics/gynecology care
privately (e.g., through Medicare, Medicaid, or private insurance).118 As discussed in the Notes to Interpretation of the Overview to Part 2, when Sourcebook Volume 4 reports a change in utilization of a particular
type of service from FY00 to FY15 within a particular age group of Veterans, this refers to utilization during FY00 among the cohort of Veterans who used VHA in FY00 and who fell into that age group in FY00, compared to utilization during FY15 among the cohort of Veterans who used VHA in FY15 and who fell into that age group in FY15. Individual Veterans who used VHA in FY00 may or may not have used VHA in FY15 and may or may not have fallen into the same age group in FY00 as in FY15.
119 Proportions below 0.5% are presented as “<1%.”120 For more information, see https://www.hrsa.gov/womensguidelines2016/ (accessed June 25, 2017).121 National Center for Health Promotion and Disease Prevention. Get Recommended Screening Tests and Immunizations for Women. U.S.
Department of Veterans Affairs. https://www.prevention.va.gov/Healthy_Living/Get_Recommended_Screening_Tests_and_Immunizations_for_Women.asp. Updated June 6, 2018. Accessed August 13, 2018.
122 Zephyrin LC, Katon JG, Yano EM. Strategies for transforming reproductive healthcare delivery in an integrated healthcare system: A national model with system-wide implications. Curr Opin Obstet Gynecol. Dec 2014;26(6):503-510.
123 Mattocks KM, Mengeling M, Sadler A, Baldor R, Bastian L. The Veterans Choice Act: A qualitative examination of rapid policy implementation in the Department of Veterans Affairs. Med Care. Jul 2017;55(7 Suppl 1):S71-S75.
124 Cordasco KM, Huynh AK, Zephyrin L, et al. Building capacity in VA to provide emergency gynecology services for women. Med Care. Apr 2015;53(4 Suppl 1):S81-S87.
125 Zuchowski JL, Chrystal JG, Hamilton AB, et al. Coordinating care across health care systems for Veterans with gynecologic malignancies: A qualitative analysis. Med Care. Jul 2017;55(7 Suppl 1):S53-S60.
126 Seelig MD, Yano EM, Bean-Mayberry B, Lanto AB, Washington DL. Availability of gynecologic services in the Department of Veterans Affairs. Women’s Health Issues. May-Jun 2008;18(3):167-173.
127 Kuklina EV, Whiteman MK, Hillis SD, et al. An enhanced method for identifying obstetric deliveries: Implications for estimating maternal morbidity. Matern Child Health J. Jul 2008;12(4):469-477.

Sourcebook Vol. 4 - Part 2: Utilization
80
128 A small number of U.S. births occur out of hospital (e.g., see https://www.cdc.gov/nchs/products/databriefs/db144.htm). These can occur at home, in birthing centers, in Emergency Departments, or in other outpatient settings. However, since most Current Procedural Terminology (CPT) codes for obstetric deliveries appearing in outpatient Purchased Care records are expected to reflect the clinician’s bill for services provided in an inpatient setting, only inpatient deliveries are reported in this Sourcebook. This could result in a small underestimation of deliveries. For example, in FY15 there were 366 women Veterans who did not have an obstetric delivery appearing in inpatient Purchased Care records, but who did have an obstetric delivery CPT code appearing in outpatient Purchased Care records. Also see the Online Appendix (Technical Appendix) available at http://www.womenshealth.va.gov/WOMENSHEALTH/sourcebookvol4onlineappendix.asp.
129 Deliveries are generally not provided in VHA facilities, which is why deliveries data focus on the Purchased Care system. 130 Although uncommon, it is medically possible to deliver twice in a year. Were this to happen, the woman would be counted only once for
that year.131 While the exhibits in other sections of Sourcebook Volume 4 generally present proportions of women, the obstetrics deliveries section presents
the absolute number of unique women with deliveries in each year examined.132 Mattocks KM, Frayne S, Phibbs CS, et al. Five-year trends in women Veterans’ use of VA maternity benefits, 2008-2012. Women’s Health Issues.
Jan-Feb 2014;24(1):e37-42.133 Shaw JG, Schmitt SK, Frayne SM, et al., Are mothers who rely on VA coverage for maternity care a higher risk obstetric population? Presented at
the 2017 VA HSR&D/QUERI National Meeting. https://www.hsrd.research.va.gov/meetings/2017/abstractdisplay.cfm?RecordID=1845, Accessed June 25, 2017. Also see: Shaw JG, Joyce VR, Schmitt SK, Frayne SM, Shaw KA, Danielsen B, Kimerling R, Asch SM, Phibbs CS. Selection of Higher Risk Pregnancies into Veterans Health Administration Programs: Discoveries from Linked Department of Veterans Affairs and California Birth Data. Health Services Research (in press, 2018). DOI: 10.1111/1475-6773.13041.
134 Caregivers and Veterans Omnibus Health Services Act of 2010. Section 206. Pub. L. No: 111-163, 111th Congress (2009-2010). Note that there has been more recent legislation related to Purchased Care: See House Committee on Veterans Affairs. THE VA MISSION ACT OF 2018. June 2018; Available at: https://veterans.house.gov/uploadedfiles/va_mission_act_summary.pdf.
135 Shaw JG, Asch SM, Kimerling R, Frayne SM, Shaw KA, Phibbs CS. Posttraumatic stress disorder and risk of spontaneous preterm birth. Obstet Gynecol. Dec 2014;124(6):1111-1119.
136 Shaw JG, Asch SM, Katon JG, et al. Post-traumatic stress disorder and antepartum complications: A novel risk factor for gestational diabetes and preeclampsia. Paediatr Perinat Epidemiol. May 2017;31(3):185-194.
137 Katon JG, Washington DL, Cordasco KM, Reiber GE, Yano EM, Zephyrin LC. Prenatal care for women Veterans who use Department of Veterans Affairs health care. Womens Health Issues. Jul-Aug 2015;25(4):377-381.

Sourcebook Vol. 4 - Part 3: Health Profile
81
Part 3. Health Profile
OverviewPart 3 focuses on the health profile of women Veterans, based on diagnoses recorded during outpatient visits and inpatient stays at VHA facilities or through Purchased Care. We created “conditions” from clinically coherent aggregates of International Classification of Diseases, Ninth Revision, Clinical Modification (ICD-9-CM) diagnosis codes, and then grouped conditions into broad “domains” (e.g., Musculoskeletal, Cardiovascular, Reproductive Health, Mental Health, etc.). Part 3 examines domains and conditions in women Veteran VHA patients overall, by age group, in women versus men, and by rank order of frequency. It examines changes over time by characterizing the health profile of women Veterans who used VHA in FY15, compared to the health profile of women Veterans who used VHA in FY00.1
Definition of Terms• Conditions. Clinically coherent aggregates of ICD-9-CM diagnosis codes appearing in VHA outpatient/inpatient
files and in Purchased Care outpatient/inpatient files were grouped into “conditions.”2 The nosology used in Sourcebook Volume 43 drew on multiple sources, including Agency for Healthcare Research & Quality’s Clinical Classifications Software (CCS),4 the ICD-9-CM classification system,5,6 and approaches used by other VHA offices. The Online Appendix (Technical Appendix) explains how over 15,000 ICD-9-CM diagnosis codes were mapped to 202 conditions, which were then grouped into 17 major condition domains.
• Domains. Conditions were grouped into broad, higher-order “domains.” In the primary mapping process, each condition was mapped uniquely to a single domain. The primary domain is used for sorting conditions by domain for purposes of display, such as in Exhibit 3.F. In a secondary mapping process, some conditions were mapped to an additional domain. The secondary domain mapping is used for calculating domain frequencies (as in Exhibit 3.B) when a single condition is mapped to two domains. For example, Cancer – Breast was mapped primarily to the Cancer domain and secondarily to the Breast domain. In such cases, the condition was counted toward the frequency of the primary domain (in this case, Cancer) and toward the frequency of the secondary domain (in this case, Breast).7
NOTES TO INTERPRETATION OF FINDINGS IN PART 3: It is important to keep several caveats in mind while reviewing the results below.
First, the rates of medical conditions reported here refer to Veterans who use VHA and/or Purchased Care, and not to all Veterans. Veterans who seek care through VHA may have a different health profile than Veterans who receive all their care outside VHA.8
Second, even among Veterans who use VHA, these data do not represent true “prevalence” of disease in a strict epidemiologic sense. Instead, they reflect the proportion of Veteran VHA patients who have had diagnosed conditions recorded in VHA and/or Purchased Care administrative databases during a one-year period of observed utilization. The administrative databases are populated with ICD-9-CM diagnosis codes entered by clinical staff on encounter forms in outpatient VHA or Purchased

Sourcebook Vol. 4 - Part 3: Health Profile
82
Care settings or by abstractors pulling hospital discharge diagnoses in inpatient VHA or Purchased Care settings. Therefore, these diagnoses have the advantage of reflecting clinical assessments on the complete universe of VHA patients. However, they may underestimate true condition prevalence among VHA patients.9 For example:
• Underestimation of condition prevalence could occur via under-identification of diseases. If a clinician does not recognize the presence of a condition, he/she will not include it in the medical record. Some diseases/symptoms may be more prone to underdiagnosis and underdetection than others.
• Even if a clinician identifies a condition, it may not be recorded in the administrative data, again leading to underestimation of prevalence. This could happen if the condition was not treated at that visit or during that inpatient stay;10 if the condition was in fact treated at a visit, but some other condition(s) was/were recorded as the reason(s) for the visit;11 or if a definitive diagnosis was made after the clinical encounter was complete (e.g., based on the results of a diagnostic test that was performed after the clinical encounter). Discussion of the results of a diagnostic test might occur in a telephone encounter with the patient, but diagnoses associated with telephone encounters are not included in Sourcebook Volume 4.
• Similarly, since conditions are recorded in the context of a clinical encounter, patients making fewer visits to the clinic (or with fewer hospital stays) will have less opportunity to have a diagnosis recorded. Therefore, underestimation of condition prevalence may be an issue of greater magnitude for infrequent users of health care, for patients who have only recently begun to use VHA services, or for patients who left VHA care (through attrition or death) partway through the year.
• Some Veterans use VHA care (in some cases supplemented with Purchased Care) for part of their health care needs and other health care delivery systems for other needs. Conditions identified in other health care settings and reimbursed by other payors (e.g., funded through Medicare, Medicaid, or private insurance) are not captured in the available administrative databases. Underestimation of condition prevalence could be an issue for some Veterans with such dual health care system utilization.
Although underestimation of rates of various conditions is expected to be a more important issue, overestimation of condition prevalence could also occur. This could happen, for example, if a “rule-out” diagnosis was coded to indicate presence of a suspected condition (e.g., if “rule-out myocardial infarction” was coded as “myocardial infarction”). It could also happen if a provider recorded an ICD-9-CM code for a condition when performing a screening test (e.g., by recording a diagnosis of “hyperlipidemia” when ordering a hyperlipidemia screening panel). Further, occasional inaccuracies in ICD-9-CM data are also inevitable, due to data entry errors.12
Third, there are limitations to the specificity of the source data from which conditions were derived. A clinician coding a treated condition could describe it with a very specific ICD-9-CM code or with a very general ICD-9-CM code.13 Similarly, the clinician might pick an ICD-9-CM code describing the patient’s symptom or an ICD-9-CM code reflecting the underlying disease that caused that symptom.14 Clinicians may also have different thresholds for what they consider an acceptable level of certainty about the etiology of symptoms before being willing to assign a “working diagnosis.” Such differences in clinicians’ coding practices could in some cases affect conclusions about patients’ conditions. However, this is expected to be much less of an issue for domains, which were intentionally developed to be much less granular than conditions.15 For this reason, data regarding both broad domains and specific conditions are presented in this Sourcebook.
Fourth, decisions made about how to map ICD-9-CM codes to particular conditions can affect the observed rates of conditions and the rank order of conditions. Algorithms that lump broad groups of ICD-9-CM codes into a relatively small number of conditions will tend to yield relatively high rates of those conditions, whereas more granular algorithms that map

Sourcebook Vol. 4 - Part 3: Health Profile
83
finer groups of ICD-9-CM codes to a larger set of more specific conditions will tend to yield relatively low rates of conditions.16 As has been demonstrated in prior work,17 distinct algorithms can yield different conclusions about the rank order of conditions.18 However, in general, no matter how broadly or finely conditions are defined, all of the corresponding ICD-9-CM codes are subsumed under the broad domain.19 In other words, in general, although frequency estimates for particular conditions may be more dependent on algorithm choice, frequency estimates for broad domains should be relatively independent of algorithm choice. Regardless of what algorithm is used, consistency in algorithm use over time is key and permits evaluation of changes in rates of conditions and domains present in the cohort of Veterans that VHA treats in different years; this provides insight into the health profile of the patient population and clarifies the burden of health issues for which the system is providing care.
Fifth, this report presents age-adjusted odds ratios as an estimate of differences in rates of diagnosed conditions between women and men. Beyond adjusting for age, these odds ratios do not adjust for other characteristics (such as race/ethnicity) that vary by sex and that can also influence risk for some conditions. Other factors could also bias odds ratio estimates, such as gender differences in utilization (since patients who use VHA more heavily or who rely on VHA as their main source of care will have more opportunities to have their diagnoses recorded) or gender differences in rates of screening for disease. Further, for high-frequency domains or conditions, odds ratios overestimate relative differences between women and men; relative risk ratios for domains/conditions in women versus men provide a more conservative estimate.20
Sixth, Sourcebook Volume 4 reports the types of diagnosed conditions in Veteran patients, not the types of care they received for those conditions. Veterans may or may not have received specialty care or testing related to a particular condition.21
Seventh, Sourcebook Volume 4 treats as “conditions” some symptoms (such as “headache” or “malaise and fatigue”) that are coded as diagnoses by providers, if the ICD-9-CM can be reasonably mapped to a condition. Similarly, it treats some health risk factors (such as Tobacco Use Disorder or Housing Insufficiency) as conditions. However, a symptom was counted only if a clinician noted the symptom with an ICD-9-CM diagnosis code within an encounter record; diagnoses, symptoms, and psychosocial issues appearing in other locations, such as in clinical progress notes or on problem lists, are not captured with this approach. Further, the available data sources used for this Sourcebook do not capture other patient-centered measures of health status, such as functional status or health-related quality of life.

Sourcebook Vol. 4 - Part 3: Health Profile
84
0
20
40
60
80
100
FY00 FY15 Age 18-44
% W
omen
Vet
eran
Pat
ients
18-24 25-29 30-34 35-39 40-44
0
20
40
60
80
100
FY00 FY15 Age 45-64
% W
omen
Vet
eran
Pat
ients
45-49 50-54 55-59 60-64
0
20
40
60
80
100
FY00 FY15 Age 65+
% W
omen
Vet
eran
Pat
ients
65-69 70-74 75-79 80-84 85+
Exhibit 3.A. Age Distribution of Women Veteran VHA Patients within Age Groups, FY00 and FY15
Key: FY - Fiscal Year; VHA – Veterans Health Administration Notes: Findings portray Veteran VHA patients, not the entire Veteran population. See Technical Appendix. Cohort: Women Veteran VHA patients with non-missing ages 18-110 years (inclusive). FY00: N=159,728 (Age 18-44 N=81,832; Age 45-64 N=47,387; Age 65+
N=30,509); FY15: N=439,615 (Age 18-44 N=187,137; Age 45-64 N=201,688; Age 65+ N=50,790). Source: WHEI Master Database, FY00-FY15
Eighth, the prevalence of health conditions varies substantially by age. Sourcebook Volume 4 addresses this by presenting the frequencies of conditions separately for each age group (18-44, 45-64, and 65+ years old). These broad age groups were chosen for simplicity of presentation and to approximate clinically relevant life cycle phases (reproductive age group, post-reproductive age group, and older Veterans who are in a Medicare-eligible age group). However, even within each age group, women fall across an age spectrum; for example, within the 18-44 year-old group, the health conditions of those 18-24 years old are likely to differ from the health conditions of those 40-44 years old. When comparing condition frequency across years, it is important to recognize that the age distribution within each age group also varies across years; see Exhibit 3.A for an illustration of this phenomenon. Therefore, cross-year changes in the frequency of a specific domain or condition reported in Sourcebook Volume 4 may reflect, in part, demographic shifts as age distribution changes over time.

Sourcebook Vol. 4 - Part 3: Health Profile
85
Domain Frequencies This section examines 17 broad groups of conditions, referred to as “domains.” The “Other” domain contains conditions that do not map well to another domain; while included in Exhibits for completeness, the Other domain is not discussed in the text and is not included in rankings of domains.
Domain Frequencies Among Women Veteran VHA Patients
Women. Exhibit 3.B shows the frequency of each domain in FY00 and in FY15 for women Veteran VHA patients. Note that Exhibit 3.B presents domains in their FY15 rank order for women Veteran VHA patients; the rank order numbering of domains shown in Exhibit 3.B is carried forward throughout the rest of Part 3.
In FY00, the top domains (in rank order) were:#1: Musculoskeletal (N= 68,653 women)#2: Endocrine/Metabolic/Nutritional (N=54,562 women)#3: Cardiovascular (N=50,191 women)#4: Infectious Disease (N=48,215 women)#5: Mental Health/SUD (N=47,747 women)
In FY15, the top domains (in rank order) were:#1: Musculoskeletal (N=257,971 women)#2: Endocrine/Metabolic/Nutritional (N=225,352 women)#3: Mental Health/SUD (N=212,711 women)#4: Cardiovascular (N=158,916 women)#5: Sense Organ (N=146,244 women)
The most pronounced change in rank within these top 5 conditions was that the Mental Health/SUD domain had rank #5 in FY00 and moved up to rank #3 in FY15. The Musculoskeletal domain and the Endocrine/Metabolic/Nutritional domain remained the top domains over time. The Cardiovascular domain decreased slightly in rank over time (from #3 to #4) but continued to be among the top 5 domains for women. By FY15, the Sense Organ domain had also achieved a rank in the top 5.
Domains for which there was an absolute increase in frequency of 5% or more among women from FY00 to FY1522,23 were:
• Mental Health/SUD (∆24 = +18.5%)• Endocrine/Metabolic/Nutritional (∆ = +17.1%)• Musculoskeletal (∆ = +15.7%)• Sense Organ (∆ = +10.0%)• Neurologic (∆ = +9.5%)• Gastrointestinal (∆ = +8.8%)
In addition, the Cardiovascular domain nearly met this threshold, increasing among women by 4.7% from FY00 to FY15.
No domains decreased by 5% or more over time.

Sourcebook Vol. 4 - Part 3: Health Profile
86
Exhibit 3.B. Domain Frequencies Among Women Veteran VHA Patients, FY00 and FY15
Domain
Women Veterans
Δ (FY15-FY00)FY00
N=159,810FY15
N=439,791
% % Δ %
1. Musculoskeletal 43.0 58.7 +15.7
2. Endocrine/Metabolic/Nutritional 34.1 51.2 +17.1
3. Mental Health/SUD 29.9 48.4 +18.5
4. Cardiovascular 31.4 36.1 +4.7
5. Sense Organ 23.3 33.3 +10.0
6. Respiratory 29.1 32.3 +3.2
7. Neurologic 22.3 31.8 +9.5
8. Gastrointestinal 22.8 31.6 +8.8
9. Reproductive Health 28.9 31.2 +2.3
10. Infectious Disease 30.2 27.5 -2.7
11. Dermatologic 19.0 22.6 +3.5
12. Urinary 12.1 15.0 +2.8
13. Dental 9.1 10.5 +1.3
14. Hematologic/Immunologic 6.0 9.6 +3.6
15. Breast 7.2 6.8 -0.4
16. Cancer 4.5 5.1 +0.6
17. Other 32.7 52.1 +19.5
Key: FY - Fiscal Year; SUD - Substance Use Disorder; VHA – Veterans Health Administration Notes: Findings portray Veteran VHA patients, not the entire Veteran population. See Technical Appendix. The difference is shown in bold face text if the
percentage of women Veterans in FY15 with the condition is at least five percentage points (rounded) higher than the percentage of women Veterans in FY00 with the condition. Domain numbering reflects FY15 domain rank order (except for “Other,” which is presented last).
Cohort: Women Veteran VHA patients. Women in FY00: N=159,810; FY15: N=439,791. Source: WHEI Master Database, FY00-FY15

Sourcebook Vol. 4 - Part 3: Health Profile
87
Domain Frequencies Among Women Veteran VHA Patients by Age
Women, by age. Exhibit 3.C shows the frequency of each domain in FY00 and in FY15 for women Veteran VHA patients, by age group and rank order.
Among women 18-44 years old, in FY15, the top domains (in rank order) were:#1: Musculoskeletal (Rank #1 FY00)#2: Mental Health/SUD (Rank #3 FY00)#3: Reproductive Health (Rank #2 FY00)#4: Endocrine/Metabolic/Nutritional (Rank #7 FY00)#5: Neurologic (Rank #6 FY00)
Among women 45-64 years old, in FY15, the top domains (in rank order) were:#1: Musculoskeletal (Rank #1 FY00)#2: Endocrine/Metabolic/Nutritional (Rank #2 FY00)#3: Mental Health/SUD (Rank #4 FY00)#4: Cardiovascular (Rank #3 FY00)#5: Sense Organ (Rank #8 FY00)
Among women 65+ years old, in FY15, the top domains (in rank order) were:
#1: Endocrine/Metabolic/Nutritional (Rank #2 FY00)#2: Cardiovascular (Rank #1 FY00)#3: Musculoskeletal (Rank #3 FY00)#4: Sense Organ (Rank #4 FY00)#5: Gastrointestinal (Rank #5 FY00)
Across age groups, frequency of various domains25 increased over time, as also seen in Exhibit 3.C.
Among women 18-44 years old, domains for which the absolute increase in frequency from FY00 to FY15 was 5% or more were:
• Mental Health/SUD (∆ = +21.0%)• Endocrine/Metabolic/Nutritional (∆ = +13.5%)• Musculoskeletal (∆ = +13.2%)• Reproductive Health (∆ = +11.4%)• Neurologic (∆ = +9.3%)• Gastrointestinal (∆ = +5.2%)
Among women 45-64 years old, domains for which the absolute increase in frequency from FY00 to FY15 was 5% or more were:
• Endocrine/Metabolic/Nutritional (∆ = +18.5%)• Musculoskeletal (∆ = +16.2%)• Mental Health/SUD (∆ = +14.1%)• Sense Organ (∆ = +12.2%)• Gastrointestinal (∆ = +9.8%)• Neurologic (∆ = +9.1%)• Cardiovascular (∆ = +7.3%)

Sourcebook Vol. 4 - Part 3: Health Profile
88
Among women 65+ years old, domains for which the absolute increase in frequency from FY00 to FY15 was 5% or more were:• Endocrine/Metabolic/Nutritional (∆ = +16.7%)• Sense Organ (∆ = +16.6%)• Musculoskeletal (∆ = +14.3%)• Mental Health/SUD (∆ = +12.3%)• Gastrointestinal (∆ = +10.7%)• Neurologic (∆ = +9.6%)• Urinary (∆ = +7.5%)• Respiratory (∆ = +6.5%)
The only domain that decreased by 5% or more over time was Reproductive Health among women 45-64 years old (∆ = -7.1%) and among women 65+ years old (∆ = -5.8%).
Exhibit 3.C. Domain Frequencies Among Women Veteran VHA Patients by Age, FY00 and FY15
Key: FY - Fiscal Year; SUD - Substance Use Disorder; VHA – Veterans Health Administration Notes: Findings portray Veteran VHA patients, not the entire Veteran population. See Technical Appendix. Due to rounding, the change in percent from FY00 to
FY15 may not equal the difference of the component values reported in the year-specific percent columns. The difference is shown in bold face text if the percentage of women Veterans in FY15 with the condition is at least five percentage points (rounded) higher than the percentage of women Veterans in FY00 with the condition. Domain numbering (See Exhibit 3.B) reflects the FY15 domain rank order for women Veteran VHA patients overall (except for “Other,” which is presented last).
Cohort: Women Veteran VHA patients with non-missing ages 18-110 years (inclusive). FY00: N=159,728; FY15: N=439,615. Source: WHEI Master Database, FY00-FY15
Domain
Women Veterans, Age 18-44 Women Veterans, Age 45-64 Women Veterans, Age 65+
Year
Δ (FY15-FY00)
Year
Δ (FY15-FY00)
Year
Δ (FY15-FY00)
FY00
N=81,832
FY15
N=187,137
FY00
N=47,387
FY15
N=201,688
FY00
N=30,509
FY15
N=50,790
% % Δ % % % Δ % % % Δ %
1. Musculoskeletal 39.5 52.7 +13.2 48.0 64.2 +16.2 44.5 58.8 +14.32. Endocrine/Metabolic/Nutritional 20.2 33.6 +13.5 43.4 61.9 +18.5 57.4 74.1 +16.73. Mental Health/SUD 30.6 51.6 +21.0 35.6 49.7 +14.1 19.0 31.3 +12.34. Cardiovascular 14.7 16.4 +1.7 39.0 46.3 +7.3 64.4 68.4 +4.0
5. Sense Organ 16.5 21.1 +4.6 27.9 40.1 +12.2 34.2 50.7 +16.66. Respiratory 27.2 27.8 +0.6 33.3 36.0 +2.7 27.9 34.5 +6.57. Neurologic 21.2 30.5 +9.3 23.5 32.6 +9.1 23.5 33.1 +9.68. Gastrointestinal 17.8 23.1 +5.2 27.8 37.7 +9.8 28.5 39.3 +10.79. Reproductive Health 30.7 42.2 +11.4 32.9 25.8 -7.1 18.0 12.2 -5.8
10. Infectious Disease 30.4 27.1 -3.3 32.0 28.4 -3.6 26.8 25.4 -1.4
11. Dermatologic 15.9 19.4 +3.5 21.7 24.8 +3.1 23.3 25.7 +2.4
12. Urinary 9.3 10.5 +1.2 13.4 16.5 +3.1 17.8 25.3 +7.513. Dental 10.6 8.6 -2.0 10.0 13.1 +3.1 3.8 6.9 +3.1
14. Hematologic/Immunologic 4.6 7.8 +3.2 6.0 10.2 +4.2 9.5 13.4 +3.9
15. Breast 5.6 5.0 -0.6 9.1 8.2 -1.0 8.6 8.4 -0.2
16. Cancer 2.1 1.8 -0.3 5.2 6.5 +1.3 10.0 12.2 +2.2
17. Other 31.1 48.6 +17.6 37.3 56.5 +19.3 29.9 47.9 +18.0

Sourcebook Vol. 4 - Part 3: Health Profile
89
Top Five Domains in Women and Men Veteran VHA Patients by Age
For each age group, Exhibit 3.D shows the top 5 domains among women versus men Veteran VHA patients in FY00 and in FY15.
Among Veterans 18-44 years old, the Musculoskeletal and Mental Health/SUD domains appeared in the top 5 for both women and men, in both years. The Endocrine/Metabolic/Nutritional and Neurologic domains newly appeared in the top 5 for both women and men in FY15, but were not in the top 5 for either in FY00. In both years, the Reproductive Health domain appeared in the top 5 for women, but not for men (Panel A).
Among Veterans 45-64 years old, four domains (Musculoskeletal, Endocrine/Metabolic/Nutritional, Mental Health/SUD, and Cardiovascular) were in the top 5 for both women and men, in both years. The Sense Organ domain was new to the top 5 for both women and men in FY15; it did not appear in the top 5 for either sex in FY00 (Panel B).
Among Veterans 65+ years old, the same 5 domains (Endocrine/Metabolic/Nutritional, Cardiovascular, Musculoskeletal, Sense Organ, Gastrointestinal) appeared in the top 5 for both women and men in both years, although rank order varied by sex and by year (Panel C).
Exhibit 3.D. Top Five Domain Frequencies Among Women and Men Veteran VHA Patients by Age, FY00 and FY15
Panel A: Women and Men Veteran VHA Patients, Age 18-44
Top Five Domains for Veteran Patients, Age 18-44Women Veterans, FY00
N=81,832Women Veterans, FY15
N=187,137
Rank Condition % Rank Condition %
1 Musculoskeletal 39.5 1 Musculoskeletal 52.7
2 Reproductive Health 30.7 2 Mental Health/SUD 51.6
3 Mental Health/SUD 30.6 3 Reproductive Health 42.24 Infectious Disease 30.4 4 Endocrine/Metabolic/Nutritional 33.6
5 Respiratory 27.2 5 Neurologic 30.5
Men Veterans, FY00 N=448,712
Men Veterans, FY15 N=826,374
Rank Condition % Rank Condition %
1 Musculoskeletal 39.5 1 Musculoskeletal 54.2
2 Mental Health/SUD 30.7 2 Mental Health/SUD 50.1
3 Infectious Disease 23.4 3 Endocrine/Metabolic/Nutritional 32.8
4 Cardiovascular 20.9 4 Gastrointestinal 23.0
5 Respiratory 20.8 5 Neurologic 22.5

Sourcebook Vol. 4 - Part 3: Health Profile
90
Key: FY - Fiscal Year; SUD - Substance Use Disorder; VHA – Veterans Health Administration Notes: Findings portray Veteran VHA patients, not the entire Veteran population. See Technical Appendix. Cohort: Women and men Veteran VHA patients with non-missing ages 18-110 years (inclusive). Women: FY00: N=159,728 (Age 18-44 N=81,832; Age 45-64
N=47,387; Age 65+ N=30,509); FY15: N=439,615 (Age 18-44 N=187,137; Age 45-64 N=201,688; Age 65+ N=50,790). Men: FY00: N=3,226,162 (Age 18-44 N=448,712; Age 45-64 N=1,276,200; Age 65+ N=1,501,250); FY15: N=5,450,014 (Age 18-44 N=826,374; Age 45-64 N=1,739,639; Age 65+ N=2,884,001).
Source: WHEI Master Database, FY00-FY15
Panel C: Women and Men Veteran VHA Patients, Age 65+
Top Five Domains for Veteran Patients, Age 65+Women Veterans, FY00
N=30,509Women Veterans, FY15
N=50,790
Rank Condition % Rank Condition %
1 Cardiovascular 64.4 1 Endocrine/Metabolic/Nutritional 74.1
2 Endocrine/Metabolic/Nutritional 57.4 2 Cardiovascular 68.4
3 Musculoskeletal 44.5 3 Musculoskeletal 58.8
4 Sense Organ 34.2 4 Sense Organ 50.7
5 Gastrointestinal 28.5 5 Gastrointestinal 39.3
Men Veterans, FY00 N=1,501,250
Men Veterans, FY15 N=2,884,001
Rank Condition % Rank Condition %
1 Cardiovascular 69.8 1 Cardiovascular 73.4
2 Endocrine/Metabolic/Nutritional 50.5 2 Endocrine/Metabolic/Nutritional 72.0
3 Sense Organ 37.4 3 Sense Organ 55.0
4 Musculoskeletal 36.8 4 Musculoskeletal 46.3
5 Gastrointestinal 29.0 5 Gastrointestinal 36.6
Panel B: Women and Men Veteran VHA Patients, Age 45-64
Top Five Domains for Veteran Patients, Age 45-64Women Veterans, FY00
N=47,387Women Veterans, FY15
N=201,688
Rank Condition % Rank Condition %
1 Musculoskeletal 48.0 1 Musculoskeletal 64.2
2 Endocrine/Metabolic/Nutritional 43.4 2 Endocrine/Metabolic/Nutritional 61.9
3 Cardiovascular 39.0 3 Mental Health/SUD 49.7
4 Mental Health/SUD 35.6 4 Cardiovascular 46.3
5 Respiratory 33.3 5 Sense Organ 40.1
Men Veterans, FY00 N=1,276,200
Men Veterans, FY15 N=1,739,639
Rank Condition % Rank Condition %
1 Cardiovascular 50.3 1 Endocrine/Metabolic/Nutritional 64.0
2 Endocrine/Metabolic/Nutritional 43.4 2 Musculoskeletal 58.7
3 Musculoskeletal 41.3 3 Cardiovascular 58.6
4 Mental Health/SUD 31.6 4 Mental Health/SUD 42.2
5 Gastrointestinal 28.9 5 Sense Organ 41.3

Sourcebook Vol. 4 - Part 3: Health Profile
91
Age-Adjusted Odds Ratio (AOR) of Domains for Women Versus Men Veteran VHA Patients Exhibit 3.E shows the age-adjusted odds ratio of each domain for women versus men in FY00 and in FY15. In both FY00 and FY15, the odds ratio exceeded 1.5 for two domains: Breast (FY00: AOR = 32.46; FY15: AOR = 21.26) and Reproductive Health (FY00: AOR 3.23; FY15: AOR =2.44). In FY00 but not in FY15, the odds ratio exceeded 1.5 for one additional domain, Urinary (FY00: AOR = 1.58; FY15: AOR = 1.41).
Exhibit 3.E. Age-Adjusted Odds Ratio (AOR) of Each Domain for Women Versus Men Veteran VHA Patients, FY00 and FY15
DomainWomen vs. Men
AOR
FY00 FY151. Musculoskeletal 1.20 1.17
2. Endocrine/Metabolic/Nutritional 1.26 1.05
3. Mental Health/SUD 1.13 1.22
4. Cardiovascular 0.75 0.73
5. Sense Organ 1.02 1.00
6. Respiratory 1.37 1.42
7. Neurologic 1.43 1.47
8. Gastrointestinal 0.97 1.01
9. Reproductive Health 3.23 2.44
10. Infectious Disease 1.43 1.47
11. Dermatologic 1.17 1.22
12. Urinary 1.58 1.41
13. Dental 1.05 1.24
14. Hematologic/Immunologic 1.29 1.46
15. Breast 32.46 21.26
16. Cancer 0.96 1.06
17. Other 1.06 0.94
Key: AOR - Age-Adjusted Odds Ratio; FY - Fiscal Year; SUD - Substance Use Disorder; VHA – Veterans Health AdministrationNotes: Findings portray Veteran VHA patients, not the entire Veteran population. See Technical Appendix. Domain numbering (See Exhibit 3.B) reflects the FY15
domain rank order for women Veteran VHA patients overall (except for “Other,” which is presented last). Each AOR represents a logistic regression for a single condition in women versus men, controlling for age. Because of the large sample size, even very small differences by sex tend to be statistically significant; the focus here is on clinically meaningful differences, rather than statistically significant differences. All AORs presented in this Exhibit are statistically significant (p < 0.05), except for the one that appears in italics.
Cohort: Women and men Veteran VHA patients with non-missing ages 18-110 years (inclusive). Women: FY00: N=159,728; FY15: N=439,615. Men: FY00: N=3,226,162; FY15: N=5,450,014.
Source: WHEI Master Database, FY00-FY15

Sourcebook Vol. 4 - Part 3: Health Profile
92
Condition FrequenciesOverview
Exhibit 3.F provides a comprehensive overview of all 202 health conditions examined. The exhibit provides the frequency of the condition among women Veteran VHA patients in FY00 and FY15, first overall and then by age group. It also shows the age-adjusted odds ratio (AOR) of each condition for women versus men Veteran patients in FY00 and FY15. Additional details are available in the Online Appendix, available at http://www.womenshealth.va.gov/WOMENSHEALTH/sourcebookvol4onlineappendix.asp.26
Note that the exhibits that follow Exhibit 3.F highlight selected elements of Exhibit 3.F: • Top 20 conditions among women overall, FY00 and FY15 (Exhibit 3.G)• Top 20 conditions among women by age group, FY00 and FY15 (Exhibit 3.H, Panels A, B, and C)• Conditions for which the frequency increased by at least 5 percentage points (Exhibit 3.I) or decreased by at
least 5 percentage points (Exhibit 3.J) between FY00 and FY15• Conditions that were substantially more common among women than men in FY15 (i.e., conditions with AOR
≥ 1.5 in FY15), benchmarked against FY00 (Exhibit 3.K)
Exhibit 3.F. Condition Frequencies Among Women Veteran VHA Patients Overall and by Age, and Age-Adjusted Odds Ratio (AOR) of Each Condition for Women Versus Men, FY00 and FY15
Condition
Women Veterans Women vs. Men AOR
Overall Age 18-44 Age 45-64 Age 65+
FY00 FY15FY00 N=159,810
FY15 N=439,791
FY00 N=81,832
FY15 N=187,137
FY00 N=47,387
FY15 N=201,688
FY00 N=30,509
FY15 N=50,790
% % % % % % % % AOR AOR
1. Musculoskeletal(a)
Connective Tissue Disease 1.0 1.3 1.0 0.9 1.3 1.6 0.7 1.2 4.77 5.89
Rheumatoid Arthritis and Related Disease 1.7 1.3 0.9 0.6 2.1 1.8 2.9 2.3 2.12 2.55
Inflammatory Spondyloarthropathies 0.2 0.6 0.2 0.5 0.3 0.7 0.1 0.4 0.86 1.44
Polymyalgia Rheumatica 0.1 0.1 0.0 0.0 0.1 0.1 0.5 0.4 2.61 1.72
Vasculitis 0.1 0.1 0.0 0.1 0.1 0.1 0.2 0.2 1.89 2.17
Gout/Crystal Arthropathies 0.5 0.5 0.2 0.1 0.5 0.6 1.3 1.9 0.26 0.20
Spine Disorders - Cervical 3.9 10.0 3.8 9.3 5.0 11.8 2.3 5.9 1.37 1.37
Spine Disorders - Lumbosacral 11.6 22.8 11.8 21.5 13.6 25.2 8.3 18.0 1.07 0.98
Spine Disorders - Other/Unspecified 7.7 12.6 7.5 12.3 9.1 13.7 6.3 9.7 1.11 1.15
Joint Disorders - Upper Extremity 6.3 12.2 5.6 9.7 7.9 14.9 5.6 10.5 1.12 0.94
Joint Disorders - Lower Extremity 12.3 23.8 11.8 21.5 13.5 26.8 11.7 20.9 1.32 1.23
Joint Disorders - Unspecified or Multiple Joints 19.3 13.8 14.7 7.5 23.2 17.6 25.7 22.2 1.27 1.28
Foot Deformities 2.6 4.3 2.2 3.1 3.1 5.3 3.1 4.5 1.85 1.46
Fracture - Hip 0.2 0.1 0.0 0.0 0.1 0.1 0.7 0.7 1.50 1.55
Fracture - Other 2.0 2.6 1.6 1.7 2.2 3.1 2.7 4.1 0.99 1.15
Osteomyelitis/Infectious Arthritis 0.3 0.2 0.2 0.1 0.4 0.2 0.5 0.3 0.79 0.53
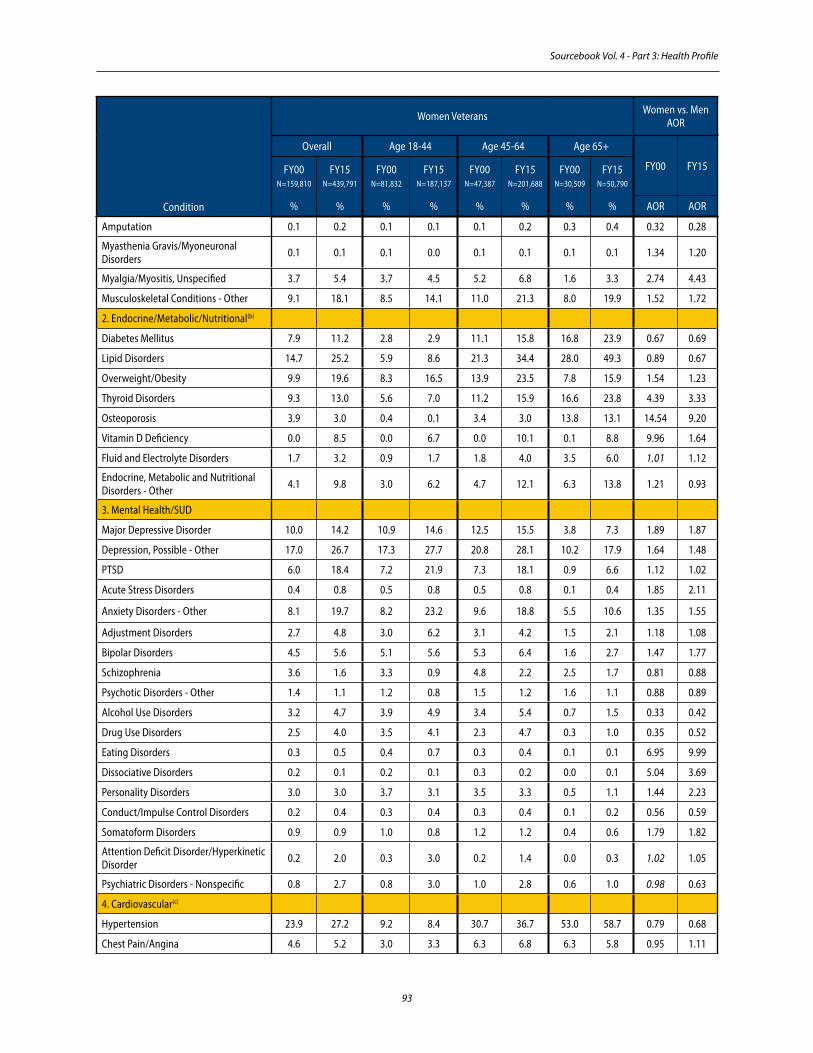
Sourcebook Vol. 4 - Part 3: Health Profile
93
Amputation 0.1 0.2 0.1 0.1 0.1 0.2 0.3 0.4 0.32 0.28
Myasthenia Gravis/Myoneuronal Disorders 0.1 0.1 0.1 0.0 0.1 0.1 0.1 0.1 1.34 1.20
Myalgia/Myositis, Unspecified 3.7 5.4 3.7 4.5 5.2 6.8 1.6 3.3 2.74 4.43
Musculoskeletal Conditions - Other 9.1 18.1 8.5 14.1 11.0 21.3 8.0 19.9 1.52 1.72
2. Endocrine/Metabolic/Nutritional(b)
Diabetes Mellitus 7.9 11.2 2.8 2.9 11.1 15.8 16.8 23.9 0.67 0.69
Lipid Disorders 14.7 25.2 5.9 8.6 21.3 34.4 28.0 49.3 0.89 0.67
Overweight/Obesity 9.9 19.6 8.3 16.5 13.9 23.5 7.8 15.9 1.54 1.23
Thyroid Disorders 9.3 13.0 5.6 7.0 11.2 15.9 16.6 23.8 4.39 3.33
Osteoporosis 3.9 3.0 0.4 0.1 3.4 3.0 13.8 13.1 14.54 9.20
Vitamin D Deficiency 0.0 8.5 0.0 6.7 0.0 10.1 0.1 8.8 9.96 1.64
Fluid and Electrolyte Disorders 1.7 3.2 0.9 1.7 1.8 4.0 3.5 6.0 1.01 1.12
Endocrine, Metabolic and Nutritional Disorders - Other 4.1 9.8 3.0 6.2 4.7 12.1 6.3 13.8 1.21 0.93
3. Mental Health/SUD
Major Depressive Disorder 10.0 14.2 10.9 14.6 12.5 15.5 3.8 7.3 1.89 1.87
Depression, Possible - Other 17.0 26.7 17.3 27.7 20.8 28.1 10.2 17.9 1.64 1.48
PTSD 6.0 18.4 7.2 21.9 7.3 18.1 0.9 6.6 1.12 1.02
Acute Stress Disorders 0.4 0.8 0.5 0.8 0.5 0.8 0.1 0.4 1.85 2.11
Anxiety Disorders - Other 8.1 19.7 8.2 23.2 9.6 18.8 5.5 10.6 1.35 1.55
Adjustment Disorders 2.7 4.8 3.0 6.2 3.1 4.2 1.5 2.1 1.18 1.08
Bipolar Disorders 4.5 5.6 5.1 5.6 5.3 6.4 1.6 2.7 1.47 1.77
Schizophrenia 3.6 1.6 3.3 0.9 4.8 2.2 2.5 1.7 0.81 0.88
Psychotic Disorders - Other 1.4 1.1 1.2 0.8 1.5 1.2 1.6 1.1 0.88 0.89
Alcohol Use Disorders 3.2 4.7 3.9 4.9 3.4 5.4 0.7 1.5 0.33 0.42
Drug Use Disorders 2.5 4.0 3.5 4.1 2.3 4.7 0.3 1.0 0.35 0.52
Eating Disorders 0.3 0.5 0.4 0.7 0.3 0.4 0.1 0.1 6.95 9.99
Dissociative Disorders 0.2 0.1 0.2 0.1 0.3 0.2 0.0 0.1 5.04 3.69
Personality Disorders 3.0 3.0 3.7 3.1 3.5 3.3 0.5 1.1 1.44 2.23
Conduct/Impulse Control Disorders 0.2 0.4 0.3 0.4 0.3 0.4 0.1 0.2 0.56 0.59
Somatoform Disorders 0.9 0.9 1.0 0.8 1.2 1.2 0.4 0.6 1.79 1.82
Attention Deficit Disorder/Hyperkinetic Disorder 0.2 2.0 0.3 3.0 0.2 1.4 0.0 0.3 1.02 1.05
Psychiatric Disorders - Nonspecific 0.8 2.7 0.8 3.0 1.0 2.8 0.6 1.0 0.98 0.63
4. Cardiovascular(c)
Hypertension 23.9 27.2 9.2 8.4 30.7 36.7 53.0 58.7 0.79 0.68
Chest Pain/Angina 4.6 5.2 3.0 3.3 6.3 6.8 6.3 5.8 0.95 1.11
Condition
Women Veterans Women vs. Men AOR
Overall Age 18-44 Age 45-64 Age 65+
FY00 FY15FY00 N=159,810
FY15 N=439,791
FY00 N=81,832
FY15 N=187,137
FY00 N=47,387
FY15 N=201,688
FY00 N=30,509
FY15 N=50,790
% % % % % % % % AOR AOR

Sourcebook Vol. 4 - Part 3: Health Profile
94
Acute Myocardial Infarction 0.3 0.2 0.1 0.0 0.3 0.3 0.8 0.7 0.58 0.51
Coronary Artery Disease - Other 4.8 2.7 0.6 0.2 4.6 2.9 16.4 11.1 0.45 0.37
Heart Failure 2.1 1.8 0.3 0.3 1.8 1.9 7.3 6.6 0.67 0.67
Valvular Disease 1.7 1.5 0.9 0.6 1.8 1.7 3.6 4.5 1.30 1.17
Atrial Fibrillation/Flutter 1.3 1.2 0.1 0.1 0.7 0.8 5.7 7.2 0.65 0.55
Arrhythmia/Conduction Disorder - Other 2.5 4.0 1.4 2.9 2.6 4.4 5.3 6.7 1.03 1.09
Cardiac Conditions - Other 0.7 1.2 0.3 0.7 0.9 1.5 1.4 2.0 0.89 1.04
Cerebrovascular Accident/Transient Ischemic Attack 1.5 1.6 0.4 0.3 1.4 1.8 4.5 5.4 0.82 0.82
Cerebrovascular Disease - Other 1.1 1.0 0.3 0.2 1.0 1.1 3.6 3.4 0.80 0.96
Aortic Aneurysm 0.1 0.2 0.0 0.0 0.1 0.1 0.6 0.8 0.44 0.30
Pulmonary Embolism or Deep Vein Thrombosis 0.2 1.0 0.1 0.5 0.3 1.2 0.5 2.2 1.13 0.93
Vascular Disease - Other 3.1 2.6 1.1 0.9 3.3 3.1 7.9 6.9 0.79 0.80
Circulatory System Conditions - Other 1.3 3.3 0.6 2.2 1.5 3.9 2.9 4.9 0.87 0.90
5. Sense Organ
Blindness/Low Vision 0.8 1.2 0.4 0.6 0.7 1.2 2.2 3.6 1.00 1.01
Refraction Disorders 10.3 18.5 7.6 10.9 14.7 24.3 10.6 22.9 1.18 1.19
Glaucoma 3.2 5.1 1.2 1.3 4.0 6.9 7.5 11.5 1.00 1.03
Cataract 4.6 9.3 0.5 0.5 4.1 13.2 16.5 26.5 1.02 1.07
Eye Disorders - Other 8.7 16.3 5.6 8.9 10.0 20.3 14.7 27.6 1.17 1.33
Hearing Problems 4.0 6.8 2.5 4.2 3.8 6.8 8.5 16.9 0.60 0.52
Ear Disorders - Other 4.2 4.4 3.6 3.7 4.6 4.8 4.8 5.7 1.10 1.16
6. Respiratory(d)
Chronic Obstructive Pulmonary Disease 4.9 4.1 1.7 0.5 6.0 5.4 11.7 11.7 0.77 0.79
Asthma 5.6 7.5 5.6 6.6 6.8 8.6 3.8 6.6 2.15 2.24
Sarcoidosis 0.3 0.4 0.4 0.2 0.4 0.6 0.1 0.3 1.78 1.69
Pneumonia 1.0 1.0 0.5 0.4 1.1 1.2 2.1 2.3 0.76 0.93
Respiratory System Infections - Other 14.6 11.6 15.4 11.7 16.9 12.5 9.1 7.6 1.55 1.68
Allergic and Other Chronic Sinusitis/Rhinitis 10.2 12.7 10.7 11.9 12.1 14.3 5.9 9.9 1.84 1.62
Dyspnea, Cough, and Other Respiratory Symptoms 3.5 7.4 2.6 5.4 4.3 8.8 4.9 9.7 1.20 1.18
Respiratory Conditions - Other 2.9 4.7 2.2 3.0 3.5 5.5 3.8 7.6 0.93 0.98
7. Neurologic(e)
Multiple Sclerosis 0.8 0.8 0.8 0.5 1.2 1.1 0.4 0.6 2.48 2.94
Epilepsy/Convulsions 1.7 1.5 1.6 1.3 2.1 1.7 1.5 1.5 0.77 0.94
Condition
Women Veterans Women vs. Men AOR
Overall Age 18-44 Age 45-64 Age 65+
FY00 FY15FY00 N=159,810
FY15 N=439,791
FY00 N=81,832
FY15 N=187,137
FY00 N=47,387
FY15 N=201,688
FY00 N=30,509
FY15 N=50,790
% % % % % % % % AOR AOR

Sourcebook Vol. 4 - Part 3: Health Profile
95
Parkinson’s Disease 0.3 0.2 0.0 0.0 0.2 0.1 1.2 0.9 0.61 0.57
Intracranial Hemorrhage 0.1 0.1 0.0 0.0 0.1 0.2 0.1 0.2 0.82 0.85
Traumatic Brain Injury 0.4 1.6 0.4 2.0 0.4 1.3 0.3 1.0 0.70 0.45
Dementia 1.4 0.9 0.3 0.1 0.7 0.4 5.6 5.9 0.95 1.07
Cognitive Disorders - Other 0.9 2.4 0.6 1.6 0.9 2.5 1.6 5.3 0.86 0.86
Spinal Cord Injury 0.3 0.2 0.3 0.1 0.4 0.3 0.3 0.3 0.49 0.59
Paralysis - Other 0.3 0.3 0.2 0.2 0.3 0.4 0.4 0.5 0.80 0.92
Headache 10.3 17.3 13.1 22.1 10.3 15.8 2.7 5.6 2.58 2.38
Dizziness/Vertigo 2.4 3.2 1.7 2.4 2.6 3.7 3.8 4.6 1.43 1.52
Peripheral Nerve Disorders 3.5 5.2 2.9 3.3 4.4 6.6 3.5 6.4 1.13 1.00
Carpal Tunnel Syndrome 2.1 2.8 2.2 2.3 2.7 3.6 0.9 1.7 1.95 1.66
Nervous System Symptoms/Disorders - Other 3.8 7.1 2.7 5.0 4.4 8.3 5.7 10.5 1.15 1.27
8. Gastrointestinal(f )
Esophageal Disorders 9.6 16.0 6.6 9.9 12.8 19.9 12.8 23.0 1.10 1.05
Nausea and Vomiting 1.4 2.7 1.4 2.9 1.6 2.7 1.3 2.1 1.89 2.05
Gastroduodenal Ulcer 1.2 0.6 0.8 0.3 1.5 0.7 1.8 1.0 0.73 0.97
Gastric/Duodenal Disorders - Other 2.7 2.4 2.3 1.9 3.3 2.9 2.7 2.5 1.00 1.28
Gastrointestinal Hemorrhage 1.3 1.5 0.9 1.2 1.5 1.7 1.9 1.7 0.73 0.80
Polyp, Colorectal 1.1 3.2 0.3 0.5 1.6 5.3 2.2 5.2 0.73 0.73
Diverticulosis and Diverticulitis 1.2 1.6 0.3 0.3 1.4 2.4 3.2 3.3 1.02 0.90
Inflammatory Bowel Disease 0.5 0.6 0.6 0.5 0.6 0.7 0.4 0.7 1.03 1.05
Diarrhea, Constipation, and Functional Bowel Disorders 5.2 8.4 4.4 7.5 5.8 9.0 6.5 9.1 1.83 2.02
Hernia 1.3 1.8 0.8 1.1 1.7 2.2 2.2 2.6 0.65 0.71
Hemorrhoids 1.9 2.5 1.4 1.8 2.4 3.2 2.1 2.1 0.93 0.98
Hepatitis C 0.9 1.1 1.0 0.3 1.3 1.9 0.3 0.7 0.39 0.40
Liver Disease - Other 1.6 2.3 1.3 1.3 2.3 3.3 1.2 2.4 0.49 0.54
Biliary Tract Disease 0.7 1.0 0.5 0.8 1.0 1.1 0.7 1.0 1.65 1.49
Pancreatic Disorders 0.3 0.4 0.2 0.2 0.4 0.6 0.3 0.6 0.57 0.82
Gastrointestinal System Disorders - Other 4.7 6.2 3.9 4.8 5.6 7.4 5.3 6.9 1.15 1.26
9. Reproductive Health(g)
Sexually Transmitted Infections 1.1 2.0 1.6 3.0 0.8 1.5 0.2 0.4 1.67 1.63
Vaginitis and Other Pelvic Inflammatory Conditions 5.8 4.4 7.8 6.6 4.8 3.1 1.9 1.1 - -
Cervical Dysplasia/Atypical Squamous Cells of Uncertain Significance (ASCUS) 0.9 1.9 1.4 3.2 0.6 1.1 0.2 0.3 - -
Condition
Women Veterans Women vs. Men AOR
Overall Age 18-44 Age 45-64 Age 65+
FY00 FY15FY00 N=159,810
FY15 N=439,791
FY00 N=81,832
FY15 N=187,137
FY00 N=47,387
FY15 N=201,688
FY00 N=30,509
FY15 N=50,790
% % % % % % % % AOR AOR

Sourcebook Vol. 4 - Part 3: Health Profile
96
Condition
Women Veterans Women vs. Men AOR
Overall Age 18-44 Age 45-64 Age 65+
FY00 FY15FY00 N=159,810
FY15 N=439,791
FY00 N=81,832
FY15 N=187,137
FY00 N=47,387
FY15 N=201,688
FY00 N=30,509
FY15 N=50,790
% % % % % % % % AOR AOR
Endometriosis 0.9 0.9 1.4 1.7 0.4 0.4 0.1 0.0 - -
Menstrual Disorders 5.6 6.2 8.4 10.9 4.1 3.4 0.5 0.1 - -
Fibroids 1.5 2.1 1.9 2.2 1.7 2.4 0.2 0.3 - -
Ovarian Cyst 0.9 1.1 1.3 1.8 0.6 0.8 0.2 0.2 - -
Polycystic Ovaries 0.2 0.9 0.3 1.8 0.0 0.2 0.0 0.0 - -
Benign Gynecologic Neoplasms - Other 0.5 0.7 0.5 0.6 0.8 0.8 0.3 0.3 - -
Prolapse of Female Genital Organs 0.8 0.7 0.4 0.3 1.1 1.0 1.6 1.4 - -
Reproductive Organ Disorders - Other 6.1 8.2 8.0 10.1 5.4 7.7 2.2 3.7 - -
Sexual Dysfunction 0.4 1.0 0.5 1.2 0.4 1.0 0.1 0.2 0.15 0.15
Contraceptive Care Management(h) 3.5 6.9 6.4 14.9 0.6 1.3 0.0 0.0 31.27 19.17
Infertility 0.3 0.9 0.6 1.9 0.1 0.1 0.0 0.0 34.03 30.71
Menopausal Disorders 11.5 6.5 4.6 1.5 22.3 11.4 13.3 5.8 - -
Miscarriage 0.1 0.2 0.2 0.6 0.0 0.0 0.0 0.0 - -
Ectopic Pregnancy 0.1 0.2 0.2 0.6 0.0 0.0 0.0 0.0 - -
Pregnancy or Delivery - Normal(i) 0.7 2.4 1.4 5.6 0.0 0.0 0.0 0.0 - -
Pregnancy with Obstetrical Complications or Prolonged 0.6 2.0 1.0 4.5 0.2 0.1 0.1 0.0 - -
Pregnancy Complicated by Diabetes Mellitus 0.0 0.2 0.1 0.5 0.0 0.0 0.0 0.0 - -
Pregnancy Complicated by Hypertension 0.0 0.2 0.1 0.5 0.0 0.0 0.0 0.0 - -
Pregnancy Complicated by Other Medical Conditions 0.1 0.9 0.2 2.2 0.0 0.0 0.0 0.0 - -
10. Infectious Disease(j)
HIV/AIDS 0.3 0.2 0.4 0.1 0.2 0.3 0.0 0.1 0.23 0.26
Tuberculosis 0.2 0.1 0.1 0.1 0.2 0.1 0.2 0.1 0.77 1.16
Mycoses 4.9 4.1 3.2 2.5 5.4 4.8 8.9 7.5 0.86 0.80
Infections - Other 3.8 5.0 3.8 5.0 3.8 4.9 3.7 4.9 1.15 1.49
11. Dermatologic(k)
Skin Cancer (Non-Melanoma) 0.9 1.0 0.3 0.2 0.9 1.2 2.5 3.2 0.78 0.74
Skin Ulcer, Chronic 0.7 0.5 0.2 0.1 0.7 0.6 1.8 1.8 0.62 0.58
Skin Infection 2.4 2.7 1.9 2.3 2.9 3.1 3.0 3.1 0.85 0.87
Psoriasis 0.6 0.8 0.4 0.6 0.8 1.0 0.9 1.1 0.77 0.85
Dermatologic Disorders - Other 16.9 20.3 14.3 17.6 19.4 22.2 20.0 22.2 1.27 1.32
12. Urinary(l)
Renal Failure or Nephropathy 0.9 2.3 0.4 0.5 1.0 2.6 1.9 8.3 0.53 0.59
Calculus of Urinary Tract 0.5 1.2 0.5 1.1 0.6 1.4 0.5 1.1 0.61 0.71
Hematuria 1.0 1.2 0.8 0.7 1.4 1.6 1.2 1.6 0.82 0.87

Sourcebook Vol. 4 - Part 3: Health Profile
97
Kidney/Ureter Diseases - Other 0.7 0.8 0.3 0.3 0.7 1.0 1.7 1.7 0.56 0.76
Urinary Tract Infection (Cystitis/Urethritis/Pyelonephritis) 6.1 5.3 5.6 4.9 6.0 5.1 7.8 7.9 2.71 3.79
Urinary Incontinence 3.9 4.6 2.0 2.3 5.1 5.7 7.2 9.1 4.29 4.13
Urinary Symptoms - Other 1.2 2.3 1.0 2.0 1.3 2.5 1.6 2.8 1.34 1.24
Urinary Conditions - Other 1.6 2.3 1.2 1.6 1.8 2.7 2.4 3.3 0.97 0.99
13. Dental
Dental Caries 4.9 6.6 5.8 5.3 5.3 8.4 1.8 4.0 1.01 1.22
Gingivitis/Periodontitis 4.2 4.9 4.8 3.6 5.0 6.5 1.6 3.4 0.99 1.18
Loss of Teeth 0.0 2.8 0.0 1.5 0.1 4.0 0.0 2.6 0.64 1.27
Dental Disorders - Other 6.6 8.2 7.5 6.9 7.3 10.3 3.0 5.2 1.12 1.32
14. Hematologic/Immunologic(m)
Anemia 4.6 7.2 3.7 6.2 4.5 7.5 7.2 10.0 1.50 1.77
Thrombocytopenia 0.2 0.4 0.1 0.2 0.3 0.5 0.4 0.8 0.65 0.57
Coagulation and Hemorrhagic Disorders 0.5 0.6 0.3 0.4 0.5 0.6 1.0 0.8 0.89 1.21
Hematologic/Immunologic Conditions - Other 0.8 2.1 0.5 1.5 1.0 2.5 1.3 3.0 0.97 1.06
15. Breast(n)
Breast Conditions, Benign or Unknown 5.6 4.6 5.1 4.5 7.2 5.1 4.4 3.0 24.83 12.56
Breast Conditions, Abnormal Radiologic Findings 0.5 1.0 0.3 0.5 0.8 1.5 0.5 0.8 133.94 274.26
16. Cancer
Cancer - Cervical 0.2 0.2 0.2 0.1 0.3 0.3 0.2 0.2 - -
Cancer - Uterine 0.1 0.2 0.1 0.0 0.2 0.3 0.3 0.6 - -
Cancer - Ovarian 0.1 0.2 0.1 0.1 0.2 0.2 0.2 0.2 - -
Cancer - Female Reproductive - Other 0.1 0.1 0.0 0.0 0.1 0.1 0.2 0.2 - -
Carcinoma in Situ - Cervical(o) 0.1 0.2 0.1 0.3 0.1 0.2 0.1 0.1 - -
Carcinoma in Situ - Female Reproductive - Other(o) 0.0 0.1 0.0 0.0 0.1 0.1 0.0 0.1 - -
Cancer - Breast 1.9 2.1 0.5 0.4 2.3 2.8 4.8 5.6 94.02 147.51
Carcinoma in Situ – Breast, Ductal or Lobular(o) 0.1 0.2 0.1 0.0 0.2 0.4 0.3 0.3 103.21 299.14
Lymphomas 0.3 0.2 0.2 0.1 0.3 0.3 0.4 0.5 0.85 0.79
Leukemias 0.1 0.1 0.1 0.0 0.1 0.1 0.3 0.4 0.74 0.59
Multiple Myeloma 0.0 0.0 0.0 0.0 0.0 0.1 0.1 0.1 0.62 0.63
Cancer - Brain/Nervous System 0.1 0.1 0.1 0.0 0.1 0.1 0.1 0.1 1.00 0.85
Cancer - Head and Neck 0.2 0.2 0.1 0.0 0.3 0.2 0.4 0.5 0.51 0.42
Cancer - Thyroid 0.2 0.3 0.1 0.2 0.2 0.4 0.1 0.4 3.03 3.27
Condition
Women Veterans Women vs. Men AOR
Overall Age 18-44 Age 45-64 Age 65+
FY00 FY15FY00 N=159,810
FY15 N=439,791
FY00 N=81,832
FY15 N=187,137
FY00 N=47,387
FY15 N=201,688
FY00 N=30,509
FY15 N=50,790
% % % % % % % % AOR AOR

Sourcebook Vol. 4 - Part 3: Health Profile
98
Condition
Women Veterans Women vs. Men AOR
Overall Age 18-44 Age 45-64 Age 65+
FY00 FY15FY00 N=159,810
FY15 N=439,791
FY00 N=81,832
FY15 N=187,137
FY00 N=47,387
FY15 N=201,688
FY00 N=30,509
FY15 N=50,790
% % % % % % % % AOR AOR
Cancer - Bronchopulmonary 0.3 0.3 0.1 0.0 0.4 0.4 1.0 1.1 0.66 0.87
Cancer - Esophagus 0.0 0.0 0.0 0.0 0.0 0.0 0.1 0.1 0.46 0.34
Cancer - Gastric 0.0 0.0 0.0 0.0 0.0 0.0 0.1 0.0 0.39 0.50
Cancer - Colorectal 0.4 0.3 0.1 0.1 0.3 0.4 1.3 1.2 0.78 0.83
Cancer - Anal 0.0 0.0 0.0 0.0 0.0 0.0 0.0 0.0 1.14 1.79
Cancer - Hepatobiliary 0.0 0.0 0.0 0.0 0.0 0.1 0.0 0.1 0.56 0.31
Cancer - Pancreatic 0.0 0.0 0.0 0.0 0.0 0.1 0.1 0.1 0.61 0.89
Cancer - Renal 0.1 0.1 0.0 0.0 0.1 0.1 0.1 0.3 0.48 0.46
Cancer - Bladder 0.1 0.1 0.0 0.0 0.1 0.1 0.4 0.4 0.37 0.28
Cancer - Bone/Connective Tissue 0.1 0.1 0.1 0.0 0.1 0.1 0.1 0.1 0.93 1.04
Melanoma 0.2 0.3 0.1 0.1 0.3 0.3 0.4 0.7 1.01 0.89
Carcinoma in Situ - Other(o) 0.1 0.0 0.0 0.0 0.1 0.1 0.3 0.1 0.42 0.56
Cancer - Other and Unspecified Primary 0.7 0.9 0.3 0.3 0.9 1.3 1.5 2.1 0.88 0.99
17. Other
Sleep Apnea 0.7 7.5 0.6 4.7 1.2 10.1 0.6 7.1 0.54 0.54
Sleep Disturbance - Other 1.7 10.0 1.5 10.7 2.0 10.3 1.7 6.8 1.12 1.09
Malaise and Fatigue 2.0 3.2 1.7 2.8 2.2 3.3 2.2 4.1 1.85 1.63
Syncope 0.6 1.1 0.4 0.9 0.6 1.1 1.2 1.5 1.04 1.10
Abdominal Pain 5.4 7.7 6.0 8.6 5.6 7.7 3.5 4.7 1.80 1.94
Chronic Pain Syndromes 0.3 6.3 0.4 4.7 0.4 8.0 0.2 5.4 2.08 1.26
Allergies and Urticaria 1.7 3.3 1.8 3.4 2.0 3.4 0.9 2.2 2.06 2.15
Edema 1.5 2.2 0.7 0.9 1.8 2.7 3.2 5.2 1.55 1.44
Symptoms - Other 4.1 3.2 3.6 2.2 4.7 3.6 4.6 5.2 1.22 1.20
Tobacco Use Disorder 6.9 13.1 6.6 10.7 9.5 16.7 3.6 8.3 0.80 0.67
Tobacco Use History 1.0 1.4 0.7 1.0 1.3 1.8 1.3 1.9 1.08 0.82
Poisoning 0.4 0.6 0.5 0.6 0.4 0.7 0.3 0.4 1.12 1.19
Injuries and Conditions Due to External Causes - Other 6.4 8.5 6.4 7.3 7.2 9.3 5.3 9.7 1.07 1.15
Effects of Surgical Procedures or Medical Care 1.5 1.9 1.2 1.3 1.9 2.3 1.7 2.2 1.15 1.26
Housing Insufficiency(p) 1.8 4.4 2.0 5.1 1.9 4.5 1.0 1.3 0.46 0.83
Psychosocial Factors - Other 5.4 9.3 5.1 9.6 6.1 9.4 4.9 7.6 0.93 1.07
Residual Codes 7.8 13.8 7.1 11.2 9.5 15.6 7.3 16.4 1.03 1.00

Sourcebook Vol. 4 - Part 3: Health Profile
99
(a) All Musculoskeletal domain conditions are listed in this section, except for Cancer – Bone/Connective Tissue (listed under Cancer, the domain to which it is primarily mapped).
(b) All Endocrine/Metabolic/Nutritional domain conditions are listed in this section, except for Pregnancy Complicated by Diabetes Mellitus (listed under Reproductive Health, the domain to which it is primarily mapped) and Cancer – Thyroid (listed under Cancer, the domain to which it is primarily mapped).
(c) All Cardiovascular domain conditions are listed in this section, except for Pregnancy Complicated by Hypertension (listed under Reproductive Health, the domain to which it is primarily mapped).
(d) All Respiratory domain conditions are listed in this section, except for Cancer – Bronchopulmonary (listed under Cancer, the domain to which it is primarily mapped).
(e) All Neurologic domain conditions are listed in this section, except for Cerebrovascular Accident/Transient Ischemic Attack (listed under Cardiovascular, the domain to which it is primarily mapped) and Cancer – Brain/Nervous System (listed under Cancer, the domain to which it is primarily mapped).
(f ) All Gastrointestinal domain conditions are listed in this section, except for Cancer – Esophagus; Cancer – Gastric; Cancer – Colorectal; Cancer – Anal; Cancer – Hepatobiliary; and Cancer – Pancreatic (all listed under Cancer, the domain to which they are primarily mapped).
(g) All Reproductive Health domain conditions are listed in this section, except for Cancer – Cervical; Cancer – Uterine; Cancer – Ovarian; Cancer – Female Reproductive - Other; Carcinoma in Situ – Cervical; Carcinoma in Situ – Female Reproductive – Other; Cancer – Prostate; and Cancer – Testicular (all listed under Cancer, the domain to which they are primarily mapped).
(h) Contraceptive Care Management is treated as a “condition” because it is such a common and important health issue for women. This is the only medical preventive/counseling diagnosis that is treated as a condition in this Sourcebook.
(i) There are some women with “Pregnancy or Delivery – Normal” who additionally have received a diagnosis for one of the other pregnancy conditions; the pregnancy conditions are not mutually exclusive.
(j) Infectious Disease domain conditions representing systemic infections (such as HIV disease) or infection of an unspecified organ system are listed in this section. Other infectious diseases secondarily mapping to the Infectious Disease domain (but listed under the organ system to which they primarily map) are Pneumonia (Respiratory domain); Respiratory System Infections – Other (Respiratory domain); Hepatitis C (Gastrointestinal domain); Urinary Tract Infection (Cystitis/Urethritis/Pyelonephritis) (Urinary domain); Sexually Transmitted Infections (Reproductive Health domain); Vaginitis and Other Pelvic Inflammatory Conditions (Reproductive Health domain); Osteomyelitis/Infectious Arthritis (Musculoskeletal domain); and Skin Infection (Dermatologic domain).
(k) All Dermatologic domain conditions are listed in this section, except for Melanoma (listed under Cancer, the domain to which it is primarily mapped).
(l) All Urinary domain conditions are listed in this section, except for Cancer – Renal, and Cancer – Bladder, which are listed under Cancer, the domain to which they are primarily mapped.
(m) All Hematologic/Immunologic domain conditions are listed in this section, except for Lymphomas; Leukemias; and Multiple Myeloma (all listed under Cancer, the domain to which they are primarily mapped).
(n) All Breast domain conditions are listed in this section, except for Cancer – Breast, and Carcinoma in Situ – Breast, Ductal or Lobular, which are listed under Cancer, the domain to which they are primarily mapped.
(o) Carcinoma in Situ is included in the Cancer domain for purposes of this report.
(p) Based on ICD-9-CM diagnosis codes that indicate “homelessness,” “inadequate housing,” or “other housing/economic circumstances;” when coded by a clinician, presence of one of these ICD-9-CM codes is taken to indicate that this health risk factor is relevant to the current clinical/health situation being addressed.
Key: AOR - Age-Adjusted Odds Ratio; FY - Fiscal Year; HIV/AIDS - Human Immunodeficiency Virus/Acquired Immune Deficiency Syndrome; PTSD - Posttraumatic Stress Disorder; SUD - Substance Use Disorder; VHA – Veterans Health Administration
Notes: Findings portray Veteran VHA patients, not the entire Veteran population. See Technical Appendix. Domain numbering (See Exhibit 3.B) reflects the FY15 domain rank order for women Veteran VHA patients overall (except for “Other,” which is presented last). Frequencies for male-specific conditions (i.e., Male Genital Disorders, Cancer – Prostate, and Cancer – Testicular) do not appear in this Exhibit. For condition frequencies for all 202 conditions, including frequencies among men Veteran VHA patients, see the Online Appendix. Each AOR represents a logistic regression for a single condition in women versus men, controlling for age in 5-year increments; therefore, AORs for female-specific conditions appear with a dash (-). Because of the large sample size, even very small differences by sex tend to be statistically significant; the focus here is on clinically meaningful differences, rather than statistically significant differences. All AORs presented in Exhibit 3.F are statistically significant (p < 0.05), except for those that appear in italics.
Cohort: Women Veteran VHA patients with non-missing ages 18-110 years (inclusive). FY00: N=159,728; FY15: N=439,615.Source: WHEI Master Database, FY00-FY15

Sourcebook Vol. 4 - Part 3: Health Profile
100
Top 20 Conditions for Women Veteran VHA Patients Overall and by Age Women. Exhibit 3.G highlights the top 20 most frequent conditions among women Veteran VHA patients overall in FY00 and in FY15, in rank order for each year. The top 5 conditions in FY15 were:
#1: Hypertension (Rank #1 FY00)#2: Depression, Possible – Other (Rank #3 FY00)#3: Lipid Disorders (Rank #5 FY00)#4: Joint Disorders – Lower Extremity (Rank #7 FY00)#5: Spine Disorders – Lumbosacral (Rank #8 FY00)
The last column on the right displays how much the rank increased (positive ∆ values) or decreased (negative ∆ values) from FY00 to FY15. Although rank order changed between FY00 and FY15 for most of the top 20 conditions, the changes in rank order for the top 5 conditions were relatively small. Rank order increased by 5 or more from FY00 to FY15 for PTSD (∆ Rank = +18); Anxiety Disorders – Other (∆ Rank = +12); Overweight/Obesity (∆ Rank = +6); Musculoskeletal Conditions – Other (∆ Rank = +6); Eye Disorders – Other (∆ Rank = +5); and Tobacco Use Disorder (∆ Rank = +5). Among conditions in the top 20 in FY15, rank order decreased by 5 or more from FY00 to FY15 for Joint Disorders – Unspecified or Multiple Joints (∆ Rank = -14) and for Allergic and Other Chronic Sinusitis/Rhinitis (∆ Rank = -7).

Sourcebook Vol. 4 - Part 3: Health Profile
101
Exhibit 3.G. Top 20 Conditions in Women Veteran VHA Patients, FY00 and FY15
Key: FY - Fiscal Year; PTSD - Posttraumatic Stress Disorder; VHA – Veterans Health AdministrationNotes: Findings portray Veteran VHA patients, not the entire Veteran population. See Technical Appendix. Bold face text indicates an increase of 5 or more in rank
order from FY00 to FY15. Cohort: Women Veteran VHA patients. FY00: N=159,810; FY15: N=439,791. Source: WHEI Master Database, FY00-FY15
FY00 N=159,810
FY15 N=439,791
Change in Rank
Rank Condition % Rank Condition % Δ
1 Hypertension 23.9 1 Hypertension 27.2 0
2Joint Disorders - Unspecified or Multiple Joints
19.3 2 Depression, Possible - Other 26.7 +1
3 Depression, Possible - Other 17.0 3 Lipid Disorders 25.2 +2
4 Dermatologic Disorders - Other 16.9 4 Joint Disorders - Lower Extremity 23.8 +3
5 Lipid Disorders 14.7 5 Spine Disorders - Lumbosacral 22.8 +3
6 Respiratory System Infections - Other 14.6 6 Dermatologic Disorders - Other 20.3 -2
7 Joint Disorders - Lower Extremity 12.3 7 Anxiety Disorders - Other 19.7 +128 Spine Disorders - Lumbosacral 11.6 8 Overweight/Obesity 19.6 +69 Menopausal Disorders 11.5 9 Refraction Disorders 18.5 +2
10 Headache 10.3 10 PTSD 18.4 +1811 Refraction Disorders 10.3 11 Musculoskeletal Conditions - Other 18.1 +612 Allergic and Other Chronic Sinusitis/Rhinitis 10.2 12 Headache 17.3 -2
13 Major Depressive Disorder 10.0 13 Eye Disorders - Other 16.3 +514 Overweight/Obesity 9.9 14 Esophageal Disorders 16.0 +1
15 Esophageal Disorders 9.6 15 Major Depressive Disorder 14.2 -2
16 Thyroid Disorders 9.3 16Joint Disorders - Unspecified or Multiple Joints
13.8 -14
17 Musculoskeletal Conditions - Other 9.1 17 Tobacco Use Disorder 13.1 +518 Eye Disorders - Other 8.7 18 Thyroid Disorders 13.0 -2
19 Anxiety Disorders - Other 8.1 19Allergic and Other Chronic Sinusitis/Rhinitis
12.7 -7
20 Diabetes Mellitus 7.9 20 Spine Disorders - Other/Unspecified 12.6 +1

Sourcebook Vol. 4 - Part 3: Health Profile
102
NOTES TO INTERPRETATION: When interpreting rank order, it is important to recognize that rank is sensitive to decisions made about granularity of grouping conditions and that the algorithm used for mapping ICD-9-CM diagnosis codes to conditions influences rank. For example, the mapping algorithm used in Sourcebook Volume 4 treats “Major Depressive Disorder” and “Depression, Possible – Other” as two separate conditions; if both had been mapped to a broader “depression” condition, that broader condition might have ranked more highly than did either of these two separate conditions.
When interpreting changes in rank order over time, it is important to recognize that various factors could be driving these changes. Changes in a condition’s rank may reflect true changes over time in the prevalence of that condition relative to other conditions. However, it could also reflect changes over time in ICD-9-CM coding practices, in the extent to which VHA screening programs have been implemented, in the extent to which clinicians recognize and diagnose the condition, or in the extent to which Veterans opt to use VHA for specific types of care services (e.g., vision or dental). Further, even though the following subsection displays rank by broad age group, residual age effects could influence condition prevalence. This is because, as Exhibit 3.A shows, the age distribution within each age group changed between FY00 and FY15. Because some conditions are more common among younger women and others are more common among older women, such within-age-group variation could contribute to observed changes in rank over time.
Also, note that it is possible for the rank of a condition to decrease over time, even though the proportion of women with that condition has increased. This is because the rank of one condition is relative to the rank of other conditions. For example, suppose that Condition A was higher ranked in FY00 than Condition B. If the frequency of both Condition A and Condition B had increased by FY15, but the magnitude of the increase in frequency was greater for Condition B than for Condition A, then it is possible for Condition B to overtake Condition A in rank by FY15.

Sourcebook Vol. 4 - Part 3: Health Profile
103
Women, by age. Exhibit 3.H highlights the top 20 most frequent conditions among women Veteran VHA patients in FY00 and FY15 by age group (Panel A: 18-44 years old, Panel B: 45-64 years old, Panel C: 65+ years old), in rank order. The last column on the right displays changes in rank order.
As Exhibit 3.H Panel A shows, among women 18-44 years old, the top 10 conditions in FY15 were Depression, Possible – Other (FY00: Rank #1; FY15: Rank #1); Anxiety Disorders – Other (FY00: Rank #14; FY15: Rank #2); Headache (FY00: Rank #5; FY15: Rank #3); PTSD (FY00: Rank #20; FY15: Rank #4); Spine Disorders – Lumbosacral (FY00: Rank #7; FY15: Rank #5); Joint Disorders – Lower Extremity (FY00: Rank #6; FY15: Rank #6); Dermatologic Disorders – Other (FY00: Rank #4; FY15: Rank #7); Overweight/Obesity (FY00: Rank #13; FY15: Rank #8); Contraceptive Care Management (FY00: Rank #24; FY15: Rank #9); and Major Depressive Disorder (FY00: Rank #8; FY15: Rank #10).
Among women age 18-44, rank changed substantially between FY00 and FY15 for a number of the top 20 conditions. Rank order increased by more than 5 from FY00 to FY15 for two of the top 5 conditions: PTSD (∆ Rank = +16) and Anxiety Disorders – Other (∆ Rank = +12). Rank order also increased by 5 or more from FY00 to FY15 for Sleep Disturbance – Other (∆ Rank = +57); Contraceptive Care Management (∆ Rank = +15); Spine Disorders – Other/Unspecified (∆ Rank = +7); and Overweight/Obesity (∆ Rank = +5). Among the top 20 conditions in FY15, no conditions decreased in rank order by 5 or more from FY00 to FY15.

Sourcebook Vol. 4 - Part 3: Health Profile
104
Exhibit 3.H. Top 20 Conditions in Women Veteran VHA Patients by Age, FY00 and FY15
Panel A: Women Veteran VHA Patients, Age 18-44
Key: FY - Fiscal Year; PTSD - Posttraumatic Stress Disorder; VHA – Veterans Health AdministrationNotes: Findings portray Veteran VHA patients, not the entire Veteran population. See Technical Appendix. Bold face text indicates an increase of 5 or more in rank
order from FY00 to FY15. Cohort: Women Veteran VHA patients with non-missing ages 18-44 years (inclusive). FY00: N=81,832; FY15: N=187,137.Source: WHEI Master Database, FY00-FY15
As Exhibit 3.H Panel B shows, among women 45-64 years old, the top 10 conditions in FY15 were Hypertension (FY00: Rank #1; FY15: Rank #1); Lipid Disorders (FY00: Rank #4; FY15: Rank #2); Depression, Possible – Other (FY00: Rank #5; FY15: Rank #3); Joint Disorders – Lower Extremity (FY00: Rank #11; FY15: Rank #4); Spine Disorders – Lumbosacral (FY00: Rank #10; FY15: Rank #5); Refraction Disorders (FY00: Rank #8; FY15: Rank #6); Overweight/Obesity (FY00: Rank #9; FY15: Rank #7); Dermatologic Disorders – Other (FY00: Rank #6; FY15: Rank #8); Musculoskeletal Conditions – Other (FY00: Rank #17; FY15: Rank #9); and Eye Disorders – Other (FY00: Rank #19; FY15: Rank #10).
FY00 N=81,832
FY15 N=187,137
Change in Rank
Rank Condition % Rank Condition % Δ
1 Depression, Possible - Other 17.3 1 Depression, Possible - Other 27.7 02 Respiratory System Infections -
Other15.4 2 Anxiety Disorders - Other 23.2 +12
3 Joint Disorders - Unspecified or Multiple Joints
14.7 3 Headache 22.1 +2
4 Dermatologic Disorders - Other 14.3 4 PTSD 21.9 +165 Headache 13.1 5 Spine Disorders - Lumbosacral 21.5 +2
6 Joint Disorders - Lower Extremity 11.8 6 Joint Disorders - Lower Extremity 21.5 0
7 Spine Disorders - Lumbosacral 11.8 7 Dermatologic Disorders - Other 17.6 -3
8 Major Depressive Disorder 10.9 8 Overweight/Obesity 16.5 +59 Allergic and Other Chronic Sinusitis/
Rhinitis10.7 9 Contraceptive Care Management 14.9 +15
10 Hypertension 9.2 10 Major Depressive Disorder 14.6 -2
11 Musculoskeletal Conditions - Other 8.5 11 Musculoskeletal Conditions - Other 14.1 0
12 Menstrual Disorders 8.4 12 Spine Disorders - Other/Unspecified 12.3 +713 Overweight/Obesity 8.3 13 Allergic and Other Chronic Sinusitis/
Rhinitis11.9 -4
14 Anxiety Disorders - Other 8.2 14 Respiratory System Infections - Other 11.7 -1215 Reproductive Organ Disorders -
Other8.0 15 Refraction Disorders 10.9 +2
16 Vaginitis and Other Pelvic Inflammatory Conditions
7.8 16 Menstrual Disorders 10.9 -4
17 Refraction Disorders 7.6 17 Sleep Disturbance - Other 10.7 +5718 Dental Disorders - Other 7.5 18 Tobacco Use Disorder 10.7 +4
19 Spine Disorders - Other/Unspecified 7.5 19 Reproductive Organ Disorders - Other 10.1 -4
20 PTSD 7.2 20 Esophageal Disorders 9.9 +1

Sourcebook Vol. 4 - Part 3: Health Profile
105
Among women age 45-64, rank changed substantially between FY00 and FY15 for a number of the top 20 conditions. Rank order increased by 5 or more from FY00 to FY15 for PTSD (∆ Rank = +11); Eye Disorders – Other (∆ Rank = +9); Musculoskeletal Conditions – Other (∆ Rank = +8); Anxiety Disorders – Other (∆ Rank = +8); Joint Disorders – Lower Extremity (∆ Rank = +7); Tobacco Use Disorder (∆ Rank = +6); and Spine Disorders – Lumbosacral (∆ Rank = +5). Rank order decreased by 5 or more from FY00 to FY15 for Joint Disorders – Unspecified or Multiple Joints (∆ Rank = -12) and Major Depressive Disorder (∆ Rank = -6).
Exhibit 3.H. Top 20 Conditions in Women Veteran VHA Patients by Age, FY00 and FY15
Panel B: Women Veteran VHA Patients, Age 45-64
Key: FY - Fiscal Year; PTSD - Posttraumatic Stress Disorder; VHA – Veterans Health AdministrationNotes: Findings portray Veteran VHA patients, not the entire Veteran population. See Technical Appendix. Bold face text indicates an increase of 5 or more in rank
order from FY00 to FY15. Cohort: Women Veteran VHA patients with non-missing ages 45-64 years (inclusive). FY00: N=47,387; FY15: N=201,688.Source: WHEI Master Database, FY00-FY15
FY00 N=47,387
FY15 N=201,688
Change in Rank
Rank Condition % Rank Condition % Δ
1 Hypertension 30.7 1 Hypertension 36.7 02 Joint Disorders - Unspecified or
Multiple Joints23.2 2 Lipid Disorders 34.4 +2
3 Menopausal Disorders 22.3 3 Depression, Possible - Other 28.1 +2
4 Lipid Disorders 21.3 4 Joint Disorders - Lower Extremity 26.8 +75 Depression, Possible - Other 20.8 5 Spine Disorders - Lumbosacral 25.2 +56 Dermatologic Disorders - Other 19.4 6 Refraction Disorders 24.3 +2
7Respiratory System Infections - Other 16.9 7 Overweight/Obesity 23.5 +2
8 Refraction Disorders 14.7 8 Dermatologic Disorders - Other 22.2 -2
9 Overweight/Obesity 13.9 9 Musculoskeletal Conditions - Other 21.3 +810 Spine Disorders - Lumbosacral 13.6 10 Eye Disorders - Other 20.3 +911 Joint Disorders - Lower Extremity 13.5 11 Esophageal Disorders 19.9 +1
12 Esophageal Disorders 12.8 12 Anxiety Disorders - Other 18.8 +813 Major Depressive Disorder 12.5 13 PTSD 18.1 +1114 Allergic and Other Chronic
Sinusitis/Rhinitis12.1 14 Joint Disorders - Unspecified or
Multiple Joints17.6 -12
15 Thyroid Disorders 11.2 15 Tobacco Use Disorder 16.7 +616 Diabetes Mellitus 11.1 16 Thyroid Disorders 15.9 -1
17 Musculoskeletal Conditions - Other 11.0 17 Headache 15.8 +1
18 Headache 10.3 18 Diabetes Mellitus 15.8 -2
19 Eye Disorders - Other 10.0 19 Major Depressive Disorder 15.5 -6
20 Anxiety Disorders - Other 9.6 20 Joint Disorders - Upper Extremity 14.9 +3

Sourcebook Vol. 4 - Part 3: Health Profile
106
As Exhibit 3.H Panel C shows, among women 65+ years old, the top 10 conditions in FY15 were Hypertension (FY00: Rank #1; FY15: Rank #1); Lipid Disorders (FY00: Rank #2; FY15: Rank #2); Eye Disorders – Other (FY00: Rank #9; FY15: Rank #3); Cataract (FY00: Rank #7; FY15: Rank #4); Diabetes Mellitus (FY00: Rank #5; FY15: Rank #5); Thyroid Disorders (FY00: Rank #6; FY15: Rank #6); Esophageal Disorders (FY00: Rank #12; FY15: Rank #7); Refraction Disorders (FY00: Rank #15; FY15: Rank #8); Dermatologic Disorders – Other (FY00: Rank #4; FY15: Rank #9); and Joint Disorders – Unspecified or Multiple Joints (FY00: Rank #3; FY15: Rank #10).
Among women age 65+, rank changed substantially between FY00 and FY15 for a number of the top 20 conditions. Rank order increased by 5 or more from FY00 to FY15 for Endocrine, Metabolic, and Nutritional Disorders – Other (∆ Rank = +14); Musculoskeletal Conditions – Other (∆ Rank = +9); Overweight/Obesity (∆ Rank = +8); Refraction Disorders (∆ Rank = +7); Spine Disorders – Lumbosacral (∆ Rank = +7); Eye Disorders – Other (∆ Rank = +6); Esophageal Disorders (∆ Rank = +5); and Glaucoma (∆ Rank = +5). Rank order decreased by 5 or more from FY00 to FY15 for Osteoporosis (∆ Rank = -8); Joint Disorders – Unspecified or Multiple Joints (∆ Rank = -7); Chronic Obstructive Pulmonary Disease (∆ Rank = -6); and Dermatologic Disorders – Other (∆ Rank = -5).

Sourcebook Vol. 4 - Part 3: Health Profile
107
Exhibit 3.H. Top 20 Conditions in Women Veteran VHA Patients by Age, FY00 and FY15
Panel C: Women Veteran VHA Patients, Age 65+
Key: FY - Fiscal Year; VHA – Veterans Health Administration Notes: Findings portray Veteran VHA patients, not the entire Veteran population. See Technical Appendix. Bold face text indicates an increase of 5 or more in rank
order from FY00 to FY15. Cohort: Women Veteran VHA patients with non-missing ages 65-110 years (inclusive). FY00: N=30,509; FY15: N=50,790.Source: WHEI Master Database, FY00-FY15
FY00 N=30,509
FY15 N=50,790
Change in Rank
Rank Condition % Rank Condition % Δ
1 Hypertension 53.0 1 Hypertension 58.7 0
2 Lipid Disorders 28.0 2 Lipid Disorders 49.3 03 Joint Disorders - Unspecified or
Multiple Joints25.7 3 Eye Disorders - Other 27.6 +6
4 Dermatologic Disorders - Other 20.0 4 Cataract 26.5 +3
5 Diabetes Mellitus 16.8 5 Diabetes Mellitus 23.9 0
6 Thyroid Disorders 16.6 6 Thyroid Disorders 23.8 0
7 Cataract 16.5 7 Esophageal Disorders 23.0 +58 Coronary Artery Disease - Other 16.4 8 Refraction Disorders 22.9 +79 Eye Disorders - Other 14.7 9 Dermatologic Disorders - Other 22.2 -5
10 Osteoporosis 13.8 10Joint Disorders - Unspecified or Multiple Joints 22.2 -7
11 Menopausal Disorders 13.3 11 Joint Disorders - Lower Extremity 20.9 +3
12 Esophageal Disorders 12.8 12 Musculoskeletal Conditions - Other 19.9 +913 Chronic Obstructive Pulmonary
Disease11.7 13 Spine Disorders - Lumbosacral 18.0 +7
14 Joint Disorders - Lower Extremity 11.7 14 Depression, Possible - Other 17.9 +2
15 Refraction Disorders 10.6 15 Hearing Problems 16.9 +4
16 Depression, Possible - Other 10.2 16 Overweight/Obesity 15.9 +817 Respiratory System Infections -
Other9.1 17 Endocrine, Metabolic and Nutritional
Disorders - Other13.8 +14
18 Mycoses 8.9 18 Osteoporosis 13.1 -8
19 Hearing Problems 8.5 19 Chronic Obstructive Pulmonary Disease 11.7 -6
20 Spine Disorders - Lumbosacral 8.3 20 Glaucoma 11.5 +5

Sourcebook Vol. 4 - Part 3: Health Profile
108
Differences in Condition Frequencies Among Women Veteran VHA Patients by AgeWomen, by age. As Exhibit 3.I shows, conditions that markedly increased in frequency often cluster together, being clinically related and within the same domain. Specifically, several conditions within the Musculoskeletal, Endocrine/Metabolic/Nutritional, Mental Health/SUD, and Sense Organ domains increased by at least 5 percentage points from FY00 to FY15 in at least one age group. It is noteworthy that, looking across multiple domains, a number of the conditions that increased are also cardiovascular risk factors: Diabetes Mellitus, Lipid Disorders, Overweight/Obesity, Hypertension, Renal Failure or Nephropathy, and Tobacco Use Disorder. As expected given reproductive age, contraceptive care management increased notably only in the younger age group. The following list highlights those conditions for which the absolute increase in frequency from FY00 to FY15, represented by “∆,“ was 5% or more in at least one of the age groups:
Musculoskeletal:• Spine Disorders – Cervical (18-44: ∆=+6%, 45-64: ∆=+7%)• Spine Disorders – Lumbosacral (18-44: ∆=+10%, 45-64: ∆=+12%, 65+: ∆=+10%)• Joint Disorders – Upper Extremity (45-64: ∆=+7%)• Joint Disorders – Lower Extremity (18-44: ∆=+10%, 45-64: ∆=+13%, 65+: ∆=+9%)• Musculoskeletal Conditions – Other (18-44: ∆=+6%, 45-64: ∆=+10%, 65+: ∆=+12%)
Endocrine/Metabolic/Nutritional:• Diabetes Mellitus (65+: ∆=+7%)• Lipid Disorders (45-64: ∆=+13%, 65+: ∆=+21%)• Overweight/Obesity (18-44: ∆=+8%, 45-64: ∆=+10%, 65+: ∆=+8%)• Thyroid Disorders (65+: ∆=+7%)• Vitamin D Deficiency (18-44: ∆=+7%, 45-64: ∆=+10%, 65+: ∆=+9%)• Endocrine, Metabolic, and Nutritional Disorders – Other (45-64: ∆=+7%, 65+: ∆=+7%)
Mental Health:• Depression, Possible – Other (18-44: Δ=+10%, 45-64: Δ=+7%, 65+: Δ=+8%) • PTSD (18-44: ∆=+15%, 45-64: ∆=+11%, 65+: ∆=+6%)• Anxiety Disorders – Other (18-44: ∆=+15%, 45-64: ∆=+9%, 65+: ∆=+5%)
Cardiovascular:• Hypertension (45-64: ∆=+6%, 65+: ∆=+6%)
Sense Organ:• Refraction Disorders (45-64: ∆=+10%, 65+: ∆=+12%)• Cataract (45-64: ∆=+9%, 65+: ∆=+10%)• Eye Disorders – Other (45-64: ∆=+10%, 65+: ∆=+13%)• Hearing Problems (65+: ∆=+8%)
Neurologic:• Headache (18-44: ∆=+9%, 45-64: ∆=+5%)
Gastrointestinal:• Esophageal Disorders (45-64: ∆=+7%, 65+: ∆=+10%)

Sourcebook Vol. 4 - Part 3: Health Profile
109
Reproductive Health:• Contraceptive Care Management (18-44: ∆=+8%)
Urinary:• Renal Failure or Nephropathy (65+: ∆=+6%)
Other:• Sleep Apnea (45-64: ∆=+9%, 65+: ∆=+6%)• Sleep Disturbance – Other (18-44: ∆=+9%, 45-64: ∆=+8%, 65+: ∆=+5%)• Chronic Pain Syndromes (45-64: ∆=+8%, 65+: ∆=+5%)• Tobacco Use Disorder (45-64: ∆=+7%)
As cancer diagnoses are relatively rare by comparison, using a more conservative threshold of a +0.5% change to identify clinically important change, the following malignant conditions increased by at least 0.5% from FY00 to FY15 in at least one age group.
Cancer:• Cancer – Breast (45-64: ∆=+0.5%, 65+: ∆=+0.8%)• Cancer – Other and Unspecified Primary (65+: ∆=+0.6%)

Sourcebook Vol. 4 - Part 3: Health Profile
110
Exhibit 3.I. Conditions with at Least 5% Increase in Frequency from FY00 to FY15 Among Women Veteran VHA Patients by Age
Condition
% Women Veterans, Age 18-44
% Women Veterans, Age 45-64
% Women Veterans, Age 65+
Δ (FY15-FY00) Δ (FY15-FY00) Δ (FY15-FY00)1. Musculoskeletal Spine Disorders - Cervical +5.5 +6.8 +3.6Spine Disorders - Lumbosacral +9.7 +11.6 +9.7Joint Disorders - Upper Extremity +4.1 +7.0 +4.9Joint Disorders - Lower Extremity +9.6 +13.3 +9.2Musculoskeletal Conditions - Other +5.7 +10.2 +11.92. Endocrine/Metabolic/Nutritional Diabetes Mellitus +0.1 +4.7 +7.1Lipid Disorders +2.7 +13.2 +21.3Overweight/Obesity +8.2 +9.6 +8.1Thyroid Disorders +1.5 +4.7 +7.3Vitamin D Deficiency +6.7 +10.1 +8.7Endocrine, Metabolic, and Nutritional Disorders - Other +3.2 +7.4 +7.53. Mental Health/Substance Use Disorder Depression, Possible - Other +10.4 +7.2 +7.6PTSD +14.7 +10.7 +5.7Anxiety Disorders - Other +15.1 +9.2 +5.14. Cardiovascular Hypertension -0.8 +6.0 +5.85. Sense Organ Refraction Disorders +3.3 +9.6 +12.4Cataract +0.1 +9.0 +10.0Eye Disorders - Other +3.2 +10.3 +12.9Hearing Problems +1.7 +3.0 +8.47. Neurologic Headache +9.0 +5.5 +2.88. Gastrointestinal Esophageal Disorders +3.3 +7.1 +10.29. Reproductive Health Contraceptive Care Management +8.5 +0.7 0.012. Urinary Renal Failure or Nephropathy +0.1 +1.6 +6.416. Cancer Cancer - Breast* -0.1 +0.5 +0.8Cancer - Other and Unspecified Primary* -0.1 +0.3 +0.6

Sourcebook Vol. 4 - Part 3: Health Profile
111
* Malignant conditions are included in this Exhibit if the differences in condition frequencies among women Veteran VHA patients (FY15-FY00) are greater than 0.5% (rounded) in magnitude. Key: FY - Fiscal Year; VHA – Veterans Health Administration Notes: Findings portray Veteran VHA patients, not the entire Veteran population. See Technical Appendix. Domain numbering (see Exhibit 3.B) reflects the FY15
domain rank order for women Veteran VHA patients overall (except for “Other,” which is presented last). The difference is shown in bold face text if the percentage of women Veterans in FY15 with the condition is at least five percentage points (rounded) higher than the percentage of women Veterans in FY00 with the condition.
Cohort: Women Veteran VHA patients with non-missing ages 18-110 years (inclusive). FY00: N=159,728; FY15: N=439,615. Source: WHEI Master Database, FY00-FY15
Conversely, as Exhibit 3.J shows, a number of conditions had an absolute decrease in frequency of at least 5% from FY00 to FY15 in at least one age group. These included Musculoskeletal, Cardiovascular, and Reproductive Health conditions:
Musculoskeletal:• Joint Disorders – Unspecified or Multiple Joints (18-44: ∆=-7%, 45-64: ∆=-6%)
Cardiovascular:• Coronary Artery Disease – Other (65+: ∆=-5%)
Reproductive Health:• Menopausal Disorders (45-64: ∆=-11%, 65+: ∆=-7%)
Exhibit 3.J. Conditions with at Least 5% Decrease in Frequency from FY00 to FY15 Among Women Veteran VHA Patients by Age
Key: FY - Fiscal Year; VHA – Veterans Health Administration Notes: Findings portray Veteran VHA patients, not the entire Veteran population. See Technical Appendix. Domain numbering (see Exhibit 3.B) reflects the FY15
domain rank order for women Veteran VHA patients overall (except for “Other,” which is presented last). The difference is shown in bold face text if the percentage of women Veterans in FY15 with the condition is at least five percentage points (rounded) higher than the percentage of women Veterans in FY00 with the condition.
Cohort: Women Veteran VHA patients with non-missing ages 18-110 years (inclusive). FY00: N=159,728; FY15: N=439,615. Source: WHEI Master Database, FY00-FY15
17. Other Sleep Apnea +4.2 +8.9 +6.5Sleep Disturbance - Other +9.2 +8.3 +5.1Chronic Pain Syndromes +4.3 +7.6 +5.2Tobacco Use Disorder +4.0 +7.2 +4.6
Condition% Women Veterans,
Age 18-44% Women Veterans,
Age 45-64% Women Veterans,
Age 65+
Δ (FY15-FY00) Δ (FY15-FY00) Δ (FY15-FY00)1. Musculoskeletal Joint Disorders - Unspecified or Multiple Joints -7.2 -5.6 -3.54. Cardiovascular Coronary Artery Disease - Other -0.4 -1.7 -5.39. Reproductive Health Menopausal Disorders -3.1 -10.9 -7.5
Condition
% Women Veterans, Age 18-44
% Women Veterans, Age 45-64
% Women Veterans, Age 65+
Δ (FY15-FY00) Δ (FY15-FY00) Δ (FY15-FY00)

Sourcebook Vol. 4 - Part 3: Health Profile
112
Condition Frequencies for Women and Men Veteran VHA Patients Women versus men. Exhibit 3.K includes only those rows from Exhibit 3.F in which the age-adjusted odds ratio was 1.5 or higher in FY15 (in other words, the odds of having the condition was at least 1.5 times higher for women than for men in FY15, after controlling for age); the corresponding age-adjusted odds ratio for FY00 is also presented, for comparison. Some differences were particularly marked. For example, in FY15, odds were 2.0-2.9 times higher for women than men for the following conditions: (Conditions with an age-adjusted odds ratio below the 2.0-2.9 range in FY00 are marked with an asterisk [*].)
• Asthma• Nausea and vomiting*• Diarrhea, Constipation, and Functional Bowel Disorders*• Rheumatoid Arthritis and Related Disease• Vasculitis*• Multiple Sclerosis• Headache• Acute Stress Disorders*• Personality Disorders*• Allergies and Urticaria
Even more striking, in FY15, odds were at least 3.0 times higher for women than men for the following conditions:(Conditions with an age-adjusted odds ratio below 3.0 in FY00 are marked with a dagger [†].)
• Thyroid Disorders• Osteoporosis• Urinary Tract Infection (Cystitis/Urethritis/Pyelonephritis)†• Urinary Incontinence• Contraceptive Care Management• Infertility• Breast Conditions, Benign or Unknown• Breast Conditions, Abnormal Radiologic Findings• Cancer – Breast• Carcinoma in Situ – Breast, Ductal or Lobular• Cancer – Thyroid• Connective Tissue Disease• Myalgia/Myositis, Unspecified†• Eating Disorders• Dissociative Disorders

Sourcebook Vol. 4 - Part 3: Health Profile
113
Exhibit 3.K. Age-Adjusted Odds Ratio (AOR) of 1.5 or Greater in Women Versus Men Veteran VHA Patients in FY15, with FY00 AOR Shown for Comparison
ConditionWomen vs. Men
AORFY00 FY15
1. Musculoskeletal Connective Tissue Disease 4.77 5.89Rheumatoid Arthritis and Related Disease 2.12 2.55Polymyalgia Rheumatica 2.61 1.72Vasculitis 1.89 2.17Fracture - Hip 1.50 1.55Myalgia/Myositis, Unspecified 2.74 4.43Musculoskeletal Conditions - Other 1.52 1.722. Endocrine/Metabolic/Nutritional Thyroid Disorders 4.39 3.33Osteoporosis 14.54 9.20Vitamin D Deficiency 9.96 1.643. Mental Health/Substance Use Disorder Major Depressive Disorder 1.89 1.87Acute Stress Disorders 1.85 2.11Anxiety Disorders - Other 1.35 1.55Bipolar Disorders 1.47 1.77Eating Disorders 6.95 9.99Dissociative Disorders 5.04 3.69Personality Disorders 1.44 2.23Somatoform Disorders 1.79 1.826. Respiratory Asthma 2.15 2.24Sarcoidosis 1.78 1.69Respiratory System Infections - Other 1.55 1.68Allergic and Other Chronic Sinusitis/Rhinitis 1.84 1.627. Neurologic Multiple Sclerosis 2.48 2.94Headache 2.58 2.38Dizziness/Vertigo 1.43 1.52Carpal Tunnel Syndrome 1.95 1.668. Gastrointestinal Nausea and Vomiting 1.89 2.05Diarrhea, Constipation, and Functional Bowel Disorders 1.83 2.029. Reproductive Health Sexually Transmitted Infections 1.67 1.63Contraceptive Care Management 31.27 19.17Infertility 34.03 30.71

Sourcebook Vol. 4 - Part 3: Health Profile
114
12. Urinary Urinary Tract Infection (Cystitis/Urethritis/Pyelonephritis) 2.71 3.79Urinary Incontinence 4.29 4.1314. Hematologic/Immunologic Anemia 1.50 1.7715. Breast Breast Conditions, Benign or Unknown 24.83 12.56Breast Conditions, Abnormal Radiologic Findings 133.94 274.2616. Cancer Cancer - Breast 94.02 147.51Carcinoma in Situ - Breast, Ductal or Lobular 103.21 299.14Cancer - Thyroid 3.03 3.27Cancer - Anal 1.14 1.7917. Other Malaise and Fatigue 1.85 1.63Abdominal Pain 1.80 1.94Allergies and Urticaria 2.06 2.15
Key: AOR - Age-adjusted Odds Ratio; FY - Fiscal Year; VHA – Veterans Health Administration Notes: Findings portray Veteran VHA patients, not the entire Veteran population. See Technical Appendix. Domain numbering (see Exhibit 3.B) reflects the FY15
domain rank order for women Veteran VHA patients overall (except for “Other,” which is presented last). Each AOR represents a logistic regression for a single condition in women versus men, controlling for age. Because of the large sample size, even very small differences by sex tend to be statistically significant; the focus here is on clinically meaningful differences, rather than statistically significant differences. All AORs presented in this Exhibit are statistically significant (p < 0.05), except for the one that appears in italics.
Cohort: Women and men Veteran VHA patients with non-missing ages 18-110 years (inclusive). Women: FY00: N=159,728; FY15: N=439,615. Men: FY00: N=3,226,162; FY15: N=5,450,014.
Source: WHEI Master Database, FY00-FY15
ConditionWomen vs. Men
AORFY00 FY15

Sourcebook Vol. 4 - Part 3: Health Profile
115
Implications
Changes in Health Profile over Time
In some respects, there has been consistency over time in women Veteran VHA patients’ health profile: four broad domains of medical conditions (Musculoskeletal, Endocrine/Metabolic/Nutritional, Mental Health/SUD, Cardiovascular) were in the top five domains for women in both FY00 and FY15. For women 18-44 years old, the Reproductive Health domain likewise was consistently in the top five in both years, and for women 65+ years old, the Sense Organ and Gastrointestinal domains were also consistently in the top five.
However, there also have been substantial changes over time in women Veteran VHA patients’ health profile. Between FY00 and FY15, in each of the top domains there has been the marked expansion in absolute numbers of the population of women with these conditions. By FY15, VHA was caring for 258,000 women with a Musculoskeletal condition (a 4-fold increase from FY00); 225,000 women with an Endocrine/Metabolic/Nutritional condition (a 4-fold increase); 213,000 women with a Mental Health/SUD condition (a 4-fold increase); 159,000 women with a Cardiovascular condition (a 3-fold increase); and 146,000 women with a Sense Organ condition (a 4-fold increase). Therefore, although there has been stability in a large segment of the menu of core services that VHA needs to offer to women, there has been a huge increase in the number of women requiring such services, with a corresponding need for sufficient primary care and specialty care capacity to meet that demand.
Women Veterans Across the Age Spectrum
With the shifting age distribution of women Veteran VHA patients over time, VHA must also be alert to the fact that the health profile of women differs across the age spectrum.
Among the youngest cohort (18-44 years old), several mental health conditions (depression, anxiety disorders, PTSD) were among the top 10 conditions in FY15; indeed, half of 18-44 year-old women in FY15 had a mental health condition. From FY00 to FY15, the absolute number of 18-44 year-old women with a diagnosed condition in the Mental Health/SUD domain increased 4-fold, driven in part by a 7-fold increase in the number of women with PTSD and a 7-fold increase in the number of women with anxiety disorders. Because the FY00 cohort served prior to the 9/11 attacks, the higher rate of these disorders in the FY15 cohort could be related in part to military deployment to war in Iraq or Afghanistan; military deployment is a known risk factor for mental health conditions.27,28,29,30,31 Another potential contributor to these observed increases could be greater numbers of women with mental health-related service-connected disability who are electing to receive their care in VHA. The observed increases could also be related in part to better recognition of these conditions due to VHA initiatives aimed at increasing identification of mental health conditions through routine screening in primary care settings (e.g., screening for PTSD, depression, and substance use disorders) and through enhanced pathways for referral to specialists for diagnosis and treatment (e.g., via mental health professionals embedded in primary care settings, via telemental health initiatives, via information technology approaches, and via augmented specialty mental health services).32,33,34,35
Although these increases in mental health conditions in the youngest age group are striking, it is also crucial to note that many other important conditions were prevalent in this population; for example, for women 18-44 years old, the top 10 conditions in FY15 also included several pain-related conditions (headache, spine disorders, joint disorders); a key cardiovascular risk factor (overweight/obesity); and reproductive health issues (contraceptive care management). It is not known what proportion of the musculoskeletal conditions for which women seek VHA care is related to their military service, but polytrauma as well as focal injuries that can lead to chronic pain are common in deployed populations.36,37,38,39

Sourcebook Vol. 4 - Part 3: Health Profile
116
In addition to helping alleviate suffering from low back pain and lower extremity joint disorders, treatment for overweight/obesity (e.g., through referral to VHA’s MOVE! program,40 selection of less obesogenic psychiatric medications and contraceptive agents when possible, or consideration of weight loss medications or bariatric surgery) can help avert long-term consequences like cardiovascular disease over the life span of the women in this young cohort.41 Contraceptive care requires clinicians who are knowledgeable about modern approaches to treatment;42,43,44 VHA’s workforce of Women’s Health Primary Care Providers receives relevant training through Women’s Health Mini-Residencies and other training modalities.45,46 Given the high rates of PTSD in this reproductive-age population, awareness of PTSD as a risk factor for obstetrical complications47,48 and skills in trauma-sensitive pelvic examination49,50 represent core competencies for clinicians caring for this population.
Although Traumatic Brain Injury did not fall within the top conditions for the 18-44 year-old age group, it is noteworthy that its prevalence increased 5-fold from FY00 to FY15, from 0.4% to 2.0%. This could reflect injuries sustained in OEF/OIF/OND and other conflicts, as well as enhanced detection due to universal screening of Veterans returning from war.
The middle age group (45-64 years old) represents the largest group of women Veteran VHA patients. Among them, the top 10 conditions in FY15 included cardiovascular risk factors (hypertension, lipid disorders, overweight/obesity); mental health conditions (depression); painful conditions (joint and spine disorders); and other conditions (eye and dermatologic disorders).
As has been documented elsewhere,51,52 many women Veterans 45-64 years old have cardiovascular risk factors. This presents an opportunity for population health interventions aimed at reducing cardiovascular risk. Intervening at this stage is key, before women enter older age and face potentially irreversible end-organ damage like myocardial infarction, which is among the leading causes of death in women.53 VHA information technology infrastructure includes tools like reminder systems and dashboards that support clinicians’ efforts to identify and manage populations at risk.54
Although it is crucial to address future risk, the symptoms women are experiencing today also require attention, to maximize function and quality of life. This is consistent with VHA’s emphasis on patient-centered care.55,56 In this regard, it is noteworthy that the number of women in the 45-64 year-old age group with a Musculoskeletal condition increased 6-fold from FY00 to FY15. It is therefore important for VHA’s numerous services—including rheumatology and pain clinics, complementary and integrative health programs, rehabilitative care and prosthetics services, among others—to take the needs of women Veterans into account. For example, some VHA facilities have developed pain management and integrative health programs tailored specifically to women Veterans, and there has been increased attention to ensuring availability of prosthetics properly sized for women.57
Mental health symptoms likewise attenuate quality of life. Although PTSD appropriately receives attention as a sequela of war (and is itself common in this age group), the particularly high rates of depression in 45-64 year-old women serves as a reminder that depression, too, requires attention. This supports the value of VHA’s mandated universal screening for depression in primary care settings. It also supports the importance of co-located mental health providers within women’s health primary care teams, depression collaborative care initiatives, and mental health training programs targeted at primary care providers,58,59 especially since uncomplicated depression is often managed in primary care settings. Some VHA facilities have developed mental health specialty services specifically for women;60,61 those that have not can still ensure that women feel welcome and safe at all points of care, from waiting rooms to group therapy visits to inpatient wards. Across all primary care and specialty care settings, treatment of mental health conditions must account for gendered issues, such as the fact that depression, PTSD, anxiety disorders, and substance use disorders are common sequelae of military sexual trauma,62 which is far more common in women Veterans than in men.63

Sourcebook Vol. 4 - Part 3: Health Profile
117
Cancers tend to be low prevalence conditions, but are associated with high morbidity and mortality. Therefore it is notable that in the 45-64 year-old group, the number of women with a breast cancer diagnosis increased 5-fold over this time period; by FY15, 3% of 45-64 year-old women Veteran VHA patients carried a breast cancer diagnosis. This may represent increased prevalence or improved screening or improved documentation of diagnosis and treatment that, in many cases, takes place outside VHA through Purchased Care. To address the high-intensity service needs of patients with breast cancer, multiple VHA facilities have developed innovative local programs that may include, for example, mammography services (on site or through Purchased Care); interdisciplinary breast health teams for care management; and tracking systems that follow patients through phases of care. In 2016, VHA also rolled out a national mammography tracking system to support screening and to facilitate timely follow-up of abnormal studies. Despite such advances, breast cancer care is complex and presents numerous challenges both within and outside VHA.64,65 Coordination of care across services and disciplines needs to be seamless, including for women who receive part of their breast cancer care through Purchased Care.66 VHA cares for women in every corner of the country, including rural areas where tertiary care specialty services may not be available even for purchase in the local community;67 rural women need streamlined referral systems, and their primary care providers need access to experts for consultative input. VHA telehealth and Electronic Consultation programs are increasingly providing improved access for patients and providers in remote settings.
For women in the oldest age group (65+ years old), the top 10 conditions in FY15 included cardiovascular risk factors (hypertension, lipid disorders, diabetes mellitus); painful conditions (joint disorders); and other conditions (eye, thyroid, esophageal, and dermatologic disorders). By FY15, 6% of women in the 65+ year-old group carried a breast cancer diagnosis, representing a 2-fold numeric increase compared to FY00.
Diabetes mellitus afflicted nearly 1 in 4 women Veterans in the 65+ year-old age group by FY15. Established in FY10, VHA’s patient-centered medical home initiative (Patient Aligned Care Teams or PACT) has key design characteristics highly relevant to effective diabetes management, including team-based care (with patient education by team nurses); systems for tracking health indicators in a panel of patients; and embedded behavioral health providers.68 The rising proportion of women Veterans 65+ years old with diabetes mellitus over the past 16 years tracks with the contemporaneous progression of the national obesity epidemic.69 Obesity disproportionately affects some subgroups of women Veterans, such as Black/African-American women.70 Even modest weight loss can yield clinically meaningful health benefits,71,72,73 so supporting women with diabetes who are overweight or obese with weight loss interventions can complement other elements of diabetes management aimed at protection from cardiovascular disease and microvascular end organ damage.
Although mental health conditions are less prevalent among the 65+ age group, there was a notable increase in the mental health/substance use disorders domain in this age group (from 19% in FY00 to 31% in FY15), driven in large part by increases in depression, PTSD, and anxiety disorders. This shift could reflect in part the aging of the Vietnam era population, in whom high rates of PTSD have been documented.74 Co-morbid mental health conditions will add to case complexity for women Veterans as they age.
Maintaining independence takes on particular importance for older women. Treating musculoskeletal conditions can help to reduce pain, in turn improving sleep, functional status, deconditioning, falls risk, mobility, and mental health status. Rehabilitative services, home-based care, and treatment of sense organ conditions (such as vision or hearing services) may prevent or delay the need for transitions to long-term care settings in this age group.75

Sourcebook Vol. 4 - Part 3: Health Profile
118
Women Versus Men
In addition to age cohort effects, differences between the health profiles of women versus men likewise have important implications. In FY15, women Veteran patients had marked (more than three times) higher age-adjusted odds than men of having a number of specific conditions. These included conditions exclusively or predominantly seen in women: reproductive health issues (Contraceptive Care Management, Infertility) and breast conditions (Breast Conditions, Benign or Unknown; Breast Conditions, Abnormal Radiologic Findings; Cancer – Breast; Carcinoma in Situ – Breast, Ductal or Lobular). However, it is important to recognize that also among these conditions were gender-neutral conditions: urinary conditions (Urinary Tract Infection, Urinary Incontinence); mental health conditions (Eating Disorders, Dissociative Disorders); malignancy (Cancer-Thyroid); endocrine conditions (Thyroid Disorders, Osteoporosis); and musculoskeletal conditions (Connective Tissue Disease, Myalgia/Myositis).
Even conditions that are less common in women than in men Veteran patients, such as coronary artery disease, may have different clinical presentations or management issues in women compared to men,76,77 potentially posing challenges for some VHA providers who have historically cared for a male-predominant patient population. To mitigate these gaps, VHA has trained over 3,700 primary care providers through Women’s Health Mini-Residency programs. In addition to the Women’s Health Primary Care Providers available at every VHA health care system,78,79,80 some VHA facilities have developed Women’s Health Clinics to serve as a center of women’s health expertise for their colleagues facility-wide.81,82 To generate an evidence base suitable for informing clinical decision making in the care of women Veterans, VHA research increasingly represents women Veterans; initiatives like the VA Women’s Health Research Network support such progress.83,84,85,86,87,88

Sourcebook Vol. 4 - Part 3: Health Profile
119
Endnotes1 Health profile data for FY05 and FY10 are not presented in the text of Part 3; however, data for FY05 and FY10 are included in the Online
Appendix, available at http://www.womenshealth.va.gov/WOMENSHEALTH/sourcebookvol4onlineappendix.asp.2 In outpatient files, only diagnoses associated with a face-to-face visit with a clinician were counted; diagnoses associated with other types of
visits, such as telephone encounters, were not counted. See the Online Appendix (Technical Appendix) available at http://www.womenshealth.va.gov/WOMENSHEALTH/sourcebookvol4onlineappendix.asp, for details.
3 The same nosology was used in Sourcebook Volume 3.4 Healthcare Cost and Utilization Project (HCUP) Clinical Classification Software (CCS). Agency for Healthcare Research and Quality. Rockville, MD,
2012.5 Hart AC, Stegman MS, Ford B. (Eds.). ICD-9-CM for Hospitals-Volumes 1, 2, & 3. (6th ed.). INGENIX, 2010.6 In the time period examined in Sourcebook Volume 4 (FY00-FY15), administrative records used the ICD-9-CM coding system. Starting in FY16, the
ICD-10-CM coding system was used instead.7 See the Online Appendix (Technical Appendix) available at http://www.womenshealth.va.gov/WOMENSHEALTH/sourcebookvol4onlineappendix.
asp, for further explanation of the condition mapping process and the domain mapping process. In addition, the footnote to Exhibit 3.F specifies which conditions are secondarily mapped to another domain.
8 Washington DL, Farmer MM, Mor SS, Canning M, Yano EM. Assessment of the healthcare needs and barriers to VA use experienced by women Veterans: Findings from the National Survey of Women Veterans. Med Care. 2015 Apr;53(4 Suppl 1):S23-31.
9 In Sourcebook Volume 3, the effect of applying a “high sensitivity” algorithm for identification of conditions was explored in an online appendix, available on the Women’s Health Services website, http://www.womenshealth.va.gov/WOMENSHEALTH/sourcebookvol3onlineappendix.asp.
10 For example, a primary care clinician might note on the patient’s medical history or in her problem list that she has a specific chronic condition, but the clinician might not record the condition on the encounter form for a particular visit because that condition was not a focus of the visit.
11 The VHA outpatient encounter form is embedded in the electronic medical record and provides a pick-list of conditions previously entered on the patient’s problem list. The clinician has the option to select one (or more) of these conditions as the reason(s) for the visit or to enter a text search for an ICD-9-CM diagnosis not appearing on the patient’s problem list. If more than one condition was addressed at a particular visit, a clinician might potentially be inclined to select a condition that was treated at the visit from the pick-list of the patient’s known conditions or to do a text search for a familiar ICD-9-CM code that the clinician diagnoses frequently. Therefore, it is possible that common or chronic conditions might have a somewhat greater opportunity to appear in the administrative data. Further, while the VHA outpatient encounter form has fields for multiple diagnoses, only a single diagnosis is needed to close the form. For example, a busy primary care provider who addressed several issues during a single visit (e.g., diabetes management, hypertension monitoring, treatment of chronic low back pain, and counseling regarding abnormal vaginal bleeding) might potentially streamline the effort by entering only one or two of these conditions on the encounter form.
12 In Sourcebook Volume 3, the effect of applying a “high specificity” algorithm for identification of conditions was explored in an online appendix, available on the Women’s Health Services website, http://www.womenshealth.va.gov/WOMENSHEALTH/sourcebookvol3onlineappendix.asp.
13 For example, a clinician seeing a patient for hematemesis caused by a gastric ulcer could use a specific ICD-9-CM code (e.g., “gastric ulcer,” which we would map to the condition “Gastroduodenal Ulcer”) or a general ICD-9-CM code (e.g., “gastric disease not otherwise specified” which we would map to the condition “Gastrointestinal System Disorders – Other”).
14 For example, a clinician seeing a patient for hematemesis caused by a gastric ulcer could code the visit with an ICD-9-CM code for the symptom, hematemesis (which we would map to the condition “Gastrointestinal Hemorrhage”), or with an ICD-9-CM code for gastric ulcer (which we would map to the condition “Gastroduodenal Ulcer”), or both (which we would map to both). The Gastrointestinal domain would capture comprehensively each of these approaches to coding.
15 For example, in the case of a patient with hematemesis caused by a gastric ulcer, the ICD-9-CM codes for “gastric ulcer,” “hematemesis,” or “gastric disease not otherwise specified” would all map to the domain, “Gastrointestinal.”
16 For example, one approach would be to create a single composite “joint disorders” condition, whereas another (used in this Sourcebook) would be to create three separate, more descriptive conditions: “Joint Disorders – Upper Extremity,” “Joint Disorders – Lower Extremity,” and “Joint Disorders – Unspecified or Multiple Joints.” The former approach would identify a rate of “joint disorders” higher than the rate of any of our three finer-granularity conditions.
17 Balasubramanian V, Saechao F, Finlay AK, Phibbs CS, Haskell SG, Zephyrin L, Frayne SM. Condition taxonomies: Implications for women Veterans’ health research. Poster presented at Gender and Health Interest Group Meeting, Annual Meeting of AcademyHealth, Baltimore, MD, June 22 2013.
18 For example, joint disorders would be more likely to appear as one of the most common conditions if all three types of joint disorder were collapsed into a single “joint disorders” condition than if the three types of joint disorder (“Joint Disorders – Upper Extremity,” “Joint Disorders – Lower Extremity,” and “Joint Disorders – Unspecified or Multiple Joints”) were presented separately.
19 For example, all three types of joint disorders would fall under the “Musculoskeletal” domain.

Sourcebook Vol. 4 - Part 3: Health Profile
120
20 The effect of using Relative Risk instead of Odds Ratio is explored in Sourcebook Volume 3’s Online Appendix available at https://www.womenshealth.va.gov/WOMENSHEALTH/sourcebookvol3onlineappendix.asp.
21 For example, Veterans with a Substance Use Disorder (SUD) condition may or may not have received care in a SUD specialty care clinic, and women Veterans with a reproductive organ condition may or may not have received care in a Gynecology clinic.
22 Excluding the “Other” domain, which contains conditions that do not map well to one of the other domains. (See Exhibit 3.F for a listing of conditions that appear under “Other.”)
23 Differences of at least +5% (rounded) are shown in bold face text in Exhibit 3.B. For example, a difference of +4.97 is rounded up to +5.0, whereas a difference of +4.87 is rounded up to +4.9.
24 The delta symbol (∆) is used in Sourcebook Volume 4 to denote “difference.”25 Excluding the “Other” domain, which contains conditions that do not map well to another domain.26 For parsimony, Sourcebook Volume 4 Part 3 does not include FY05 and FY10 data on conditions, but the Online Appendix (Supplemental
Materials) does include those data.27 Seelig AD, Jacobson IG, Smith B, et al. Prospective evaluation of mental health and deployment experience among women in the US military.
Am J Epidemiol. 2012;176(2):135-145.28 Magruder K, Serpi T, Kimerling R, et al. Prevalence of posttraumatic stress disorder in Vietnam-era women veterans: The health of Vietnam-Era
Women’s Study (HealthVIEWS). JAMA Psychiatry. 2015;72(11):1127-1134.29 Friedman MJ, Schnurr PP, McDonagh-Coyle A. Post-traumatic stress disorder in the military veteran. Psychiatr Clin North Am. 1994;17(2):
265-277.30 Hoge CW, Castro CA, Messer SC, McGurk D, Cotting DI, Koffman RL. Combat duty in Iraq and Afghanistan, mental health problems, and barriers to
care. N Engl J Med. 2004;351(1):13-22.31 Kang HK, Hyams KC. Mental health care needs among recent war veterans. N Engl J Med. Mar 31 2005;352(13):1289.32 Godleski L, Darkins A, Peters J. Outcomes of 98,609 U.S. Department of Veterans Affairs patients enrolled in telemental health services, 2006-2010.
Psychiatr Serv. 2012;63(4):383-385.33 Pomerantz AS, Kearney LK, Wray LO, Post EP, McCarthy JF. Mental health services in the medical home in the Department of Veterans Affairs:
Factors for successful integration. Psychol Serv. 2014;11(3):243-253.34 Trafton JA, Greenberg G, Harris AH, et al. VHA mental health information system: Applying health information technology to monitor and facilitate
implementation of VHA Uniform Mental Health Services Handbook requirements. Med Care. 2013;51(3 Suppl 1):S29-36.35 Seal KH, Bertenthal D, Miner CR, Sen S, Marmar C. Bringing the war back home: Mental health disorders among 103,788 U.S. veterans returning
from Iraq and Afghanistan seen at Department of Veterans Affairs facilities. Arch Intern Med. 2007;167(5):476-482.36 Haskell SG, Ning Y, Krebs E, et al. Prevalence of painful musculoskeletal conditions in female and male Veterans in 7 years after return from
deployment in Operation Enduring Freedom/Operation Iraqi Freedom. Clin J Pain. 2011.37 Riddle MS, Tribble DR, Putnam SD, et al. Past trends and current status of self-reported incidence and impact of disease and nonbattle injury in
military operations in Southwest Asia and the Middle East. Am J Public Health. 2008;98(12):2199-2206.38 Lew HL, Otis JD, Tun C, Kerns RD, Clark ME, Cifu, DX. Prevalence of chronic pain, posttraumatic stress disorder, and persistent postconcussive
symptoms in OIF/OEF veterans: Polytrauma clinical triad. J Rehabil Res Dev. 2009;46(6):697-702.39 Granado NS, Pietrucha A, Ryan M, et al. Longitudinal assessment of self-reported recent back pain and combat deployment in the Millennium
Cohort Study. Spine (Philadelphia, PA, 1976). 2016;41(22):1754-1763.40 U.S. Department of Veterans Affairs. MOVE! Weight Management Program. https://www.move.va.gov/. Updated July 18, 2017.
Accessed August 2, 2017.41 Breland JY, Phibbs CS, Hoggatt KJ, et al. The obesity epidemic in the Veterans Health Administration: Prevalence among key populations of
women and men Veterans. J Gen Intern Med. 2017;32(1):11-17.42 Recommended curriculum guidelines for family medicine residents: Women’s health and gynecologic care. American Academy of Family
Physicians. AAFP Reprint No 282. http://www.aafp.org/dam/AAFP/documents/medical_education_residency/program_directors/Reprint282_Women.pdf. Updated August 2016. Accessed August 3, 2017.
43 Dehlendorf C, Levy K, Ruskin R, Steinauer J. Health care providers’ knowledge about contraceptive evidence: A barrier to quality family planning care? Contraception. Apr 2010;81(4):292-298.
44 Biggs MA, Harper CC, Malvin J, Brindis CD. Factors influencing the provision of long-acting reversible contraception in California. Obstet Gynecol. 2014;123(3):593-602.

Sourcebook Vol. 4 - Part 3: Health Profile
121
45 Maisel NC, Haskell S, Hayes PM, et al. Readying the workforce: Evaluation of VHA’s comprehensive women’s health primary care provider initiative. Med Care. 2015;53(4 Suppl 1):S39-46.
46 Bergman AA, Frankel RM, Hamilton AB, Yano EM. Challenges with delivering gender-specific and comprehensive primary care to women veterans. Women’s Health Issues. 2015;25(1):28-34.
47 Shaw JG, Asch SM, Kimerling R, et al. Posttraumatic stress disorder and risk of spontaneous preterm birth. Obstet Gynecol. 2014;124(6): 1111-1119.
48 Shaw JG, Asch SM, Katon JG, et al. Post-traumatic stress disorder and antepartum complications: A novel risk factor for gestational diabetes and preeclampsia. Paediatr Perinat Epidemiol. 2017;31(3):185-194.
49 Weitlauf JC, Finney JW, Ruzek JI, et al. Distress and pain during pelvic examinations: Effect of sexual violence. Obstet Gynecol. 2008;112(6): 1343-1350.
50 Weitlauf JC, Frayne SM, Finney JW, et al. Sexual violence, posttraumatic stress disorder, and the pelvic examination: How do beliefs about the safety, necessity, and utility of the examination influence patient experiences? J Women’s Health (Larchmt). 2010;19(7):1271-1280.
51 Vimalananda VG, Miller DR, Christiansen CL, Wang W, Tremblay P, Fincke BG. Cardiovascular disease risk factors among women veterans at VA medical facilities. J Gen Intern Med. 2013;28 Suppl 2:517-523.
52 Whitehead AM, Davis MB, Duvernoy C, Safdar B, Nkonde-Price C, Iqbal S, Balasubramanian V, Frayne SM, Friedman SA, Hayes, PM, Haskell, SG. The state of cardiovascular health in women veterans. Volume 1: VA outpatient diagnoses and procedures in fiscal year (FY) 2010. Women’s Health Evaluation Initiative, Women’s Health Services, Veterans Health Administration, Department of Veterans Affairs, October, 2013.
53 Pathak EB. Is heart disease or cancer the leading cause of death in United States women? Women’s Health Issues. 2016;26(6):589-594.54 Whitehead AM, Czarnogorski M, Wright SM, Hayes PM, Haskell SG. Improving trends in gender disparities in the Department of Veterans Affairs:
2008-2013. Am J Public Health. 2014;104 Suppl 4:S529-531.55 U.S. Department of Veterans Affairs. VA Patient Centered Care. https://www.va.gov/patientcenteredcare/. Updated July 24, 2017.
Accessed August 3, 2017.56 Veterans Health Administration. Blueprint for Excellence. September 2014. Washington, DC; US Department of Veterans Affairs. 57 U.S. Department of Veterans Affairs. VA prosthetic and sensory aids services for women Veterans. https://www.prosthetics.va.gov/factsheet/PSAS-
FactSheet-WomenVets.pdf. July 2016. Accessed August 3, 2017. 58 Chang ET, Magnabosco JL, Chaney E, et al. Predictors of primary care management of depression in the Veterans Affairs healthcare system.
J Gen Intern Med. 2014;29(7):1017-1025.59 Chaney EF, Rubenstein LV, Liu CF, et al. Implementing collaborative care for depression treatment in primary care: A cluster randomized evaluation
of a quality improvement practice redesign. Implement Sci. 2011;6:121.60 Oishi SM, Rose DE, Washington DL, Macgregor C, Bean-Mayberry B, Yano EM. National variations in VA mental health care for women veterans.
Women’s Health Issues. 2011;21(4 Suppl):S130-137.61 Macgregor C, Hamilton AB, Oishi SM, Yano EM. Description, development, and philosophies of mental health service delivery for female Veterans
in the VA: A qualitative study. Women’s Health Issues. 2011;21(4 Suppl):S138-144.62 Kimerling R, Gima K, Smith MW, Street A, Frayne S. The Veterans Health Administration and military sexual trauma. Am J Public Health. Dec
2007;97(12):2160-2166.63 Kimerling R, Street AE, Pavao J, et al. Military-related sexual trauma among Veterans Health Administration patients returning from Afghanistan
and Iraq. Am J Public Health. Aug 2010;100(8):1409-1412.64 Bickell NA, Young GJ. Coordination of care for early-stage breast cancer patients. J Gen Intern Med. Nov 2001;16(11):737-742.65 Walsh J, Young JM, Harrison JD, Butow PN, Solomon MJ, Masya L, White K. What is important in cancer care coordination? A qualitative
investigation. European Journal of Cancer Care. Mar 2011;20(2):220-227.66 Mattocks KM. Care coordination for women veterans: Bridging the gap between systems of care. Med Care. 2015;53(4 Suppl 1):S8-9.67 Mattocks KM, Mengeling M, Sadler A, Baldor R, Bastian L. The Veterans Choice Act: A qualitative examination of rapid policy implementation in
the Department of Veterans Affairs. Med Care. 2017;55 Suppl 7 Suppl 1:S71-S75.68 Yano EM, Bair MJ, Carrasquillo O, Krein SL, Rubenstein LV. Patient Aligned Care Teams (PACT): VA’s journey to implement patient-centered medical
homes. J Gen Intern Med. 2014;29 Suppl 2:S547-549.69 Flegal KM, Kruszon-Moran D, Carroll MD, Fryar CD, Ogden CL. Trends in obesity among adults in the United States, 2005 to 2014. JAMA.
2016;315(21):2284-2291.70 Breland JY, Phibbs CS, Hoggatt KJ, et al. The obesity epidemic in the Veterans Health Administration: Prevalence among key populations of
women and men veterans. J Gen Intern Med. 2017;32(1):11-17.

Sourcebook Vol. 4 - Part 3: Health Profile
122
71 American College of Cardiology/American Heart Association Task Force on Practice Guidelines. Executive Summary: Guidelines (2013) for the management of overweight and obesity in adults. Based on a systematic review from the Obesity Expert Panel, 2013. Obesity (Silver Spring). 2014;22 Suppl 2:S5-39.
72 Wing RR, Lang W, Wadden TA, et al. Benefits of modest weight loss in improving cardiovascular risk factors in overweight and obese individuals with type 2 diabetes. Diabetes Care. 2011;34(7):1481-1486.
73 Jensen MD, Ryan DH, Apovian CM, et al. 2013 AHA/ACC/TOS guideline for the management of overweight and obesity in adults: A report of the American College of Cardiology/American Heart Association Task Force on Practice Guidelines and the Obesity Society. J Am Coll Cardiol. 2014;63(25 Pt B):2985-3023.
74 Magruder K, Serpi T, Kimerling R, et al. Prevalence of posttraumatic stress disorder in Vietnam-era women Veterans: The Health of Vietnam-Era Women’s Study (HealthVIEWS). JAMA Psychiatry. 2015;72(11):1127-1134.
75 VA Office of Health Equity. National Veteran Health Equity Report—FY2013. Washington, DC: U.S. Department of Veterans Affairs;2016.76 Institute of Medicine (US) Committee on Understanding the Biology of Sex and Gender Differences; Wizemann TM, Pardue ML, editors. Exploring
the Biological Contributions to Human Health: Does Sex Matter? Washington (DC): National Academies Press (US); 2001. Available from: https://www.ncbi.nlm.nih.gov/books/NBK222288/ doi: 10.17226/10028.
77 Institute of Medicine (US) Board on Population Health and Public Health Practice. Sex-Specific Reporting of Scientific Research: A Workshop Summary. Washington (DC): National Academies Press (US); 2012. Available from: https://www.ncbi.nlm.nih.gov/books/NBK84192/ doi: 10.17226/13307.
78 Maisel NC, Haskell S, Hayes PM, et al. Readying the workforce: Evaluation of VHA’s comprehensive women’s health primary care provider initiative. Med Care. 2015;53(4 Suppl 1):S39-46.
79 Bastian LA, Trentalange M, Murphy TE, et al. Association between women Veterans’ experiences with VA outpatient health care and designation as a women’s health provider in primary care clinics. Women’s Health Issues. 2014;24(6):605-612.
80 Bean-Mayberry B, Bastian L, Trentalange M, et al. Associations between provider designation and female-specific cancer screening in women Veterans. Med Care. 2015;53(4 Suppl 1):S47-54.
81 Bean-Mayberry BA, Chang CC, McNeil MA, Whittle J, Hayes PM, Scholle SH. Patient satisfaction in women’s clinics versus traditional primary care clinics in the Veterans Administration. J Gen Intern Med. 2003;18(3):175-181.
82 Bean-Mayberry BA, Yano EM, Caffrey CD, Altman L, Washington DL. Organizational characteristics associated with the availability of women’s health clinics for primary care in the Veterans Health Administration. Mil Med. Aug 2007;172(8):824-828.
83 Yano EM, Bastian LA, Frayne SM, et al. Toward a VA women’s health research agenda: Setting evidence-based priorities to improve the health and health care of women Veterans. J Gen Intern Med. 2006;21(s3):S93-S101.
84 Yano EM, Frayne SM. Health and health care of women veterans and women in the military: Research informing evidence-based practice and policy. Women’s Health Issues. 2011;21(4 Suppl):S64-66.
85 Yano EM, Bastian LA, Bean-Mayberry B, et al. Using research to transform care for women veterans: Advancing the research agenda and enhancing research-clinical partnerships. Women’s Health Issues. 2011;21(4 Suppl):S73-83.
86 Frayne S, Carney D, Bastian L, et al. The VA women’s health practice-based research network: Amplifying women veterans’ voices in VA research. J Gen Intern Med. 2013;28(2):504-509.
87 Bean-Mayberry B, Yano EM, Washington DL, et al. Systematic review of women veterans’ health: Update on successes and gaps. Women’s Health Issues. 2011;21(4 Suppl):S84-97.
88 Danan E, Ensrud K, Krebs E, et al. An evidence map of the women veterans’ health research literature (2008-2015). VA ESP Project #09-009; 2016.

Sourcebook Vol. 4 - Part 4: Geographic Distribution
123
Part 4. Geographic Distribution
OverviewPart 4 provides information about the geographic distribution of women Veteran VHA outpatients in FY00 and FY15. Although previous Sourcebooks have examined urban/rural status, Sourcebook Volume 4 is the first one to include such geographic distribution data, providing information about the number of women Veteran VHA outpatients in each Veterans Integrated Service Network (VISN) and the number of women Veteran VHA outpatients in each individual VHA Health Care System.
Definition of Terms• Veterans Integrated Service Networks (VISNs) represent broad geographic areas of the United States.• Health Care Systems most often are composed of a flagship VA Medical Center (VAMC) (typically offering both
inpatient and outpatient services) and a cluster of surrounding Community-Based Outpatient Clinics (CBOCs) (which provide primary care and sometimes other services as well, for enhanced access to care in Veterans’ local communities). Each VISN contains multiple Health Care Systems.1
NOTE ABOUT THE DENOMINATOR: Unlike Parts 1-3 of Sourcebook Volume 4, which reported on VHA patients, Part 4 reports on women Veteran VHA outpatients only.

Sourcebook Vol. 4 - Part 4: Geographic Distribution
124
VISN-Level GrowthExhibit 4.A shows the 21 VISNs in the United States as of Fiscal Year 2015. The map illustrates how VHA health care services stretch from Puerto Rico, the Virgin Islands, Florida, and Maine to the east all the way to Alaska, Hawaii, Guam, American Samoa, and the Philippines to the west.
NOTE ABOUT VISNs: VISN 13 merged with VISN 14 to create a new VISN called VISN 23 in FY12. For comparability between FY00 and FY15, Sourcebook Volume 4 combines VISN 13 and VISN 14 data when reporting the number of women Veterans per VISN in FY00.
Exhibit 4.A. VHA Veterans Integrated Service Networks (VISN) Map, as of FY15
Key: VHA - Veterans Health AdministrationSource: https://www.va.gov/oaa/VAPoC/default.asp

Sourcebook Vol. 4 - Part 4: Geographic Distribution
125
Exhibit 4.B. ber of Women Veteran VHA Outpatients by VISN, FY00 and FY15
Key: FY - Fiscal Year; VHA – Veterans Health Administration; VISN - Veterans Integrated Service Network Notes: Findings portray Veteran VHA outpatients, not the entire Veteran population. See Technical Appendix. Cohort: Women Veteran VHA outpatients in each year. FY00: N=155,430; FY15: N=425,982. Source: WHEI Master Database, FY00-FY15
0 5,000
10,000 15,000 20,000 25,000 30,000 35,000 40,000 45,000 50,000
1 2 3 4 5 6 7 8 9 10 11 12 15 16 17 18 19 20 21 22 13+14/ 23
FY00 FY15
# Wom
en V
eter
an O
utpa
tient
sAs Exhibit 4.B shows, the number of women Veterans in each VISN grew between FY00 and FY15, but the magnitude of growth varied by VISN. The largest growth from FY00 to FY15 (at least 3-fold growth) in the number of women Veteran VHA outpatients occurred in:
• VISN 7 (Alabama, Georgia, South Carolina) (FY00: 11,722; FY15: 43,288 women; 3.7-fold increase); • VISN 6 (North Carolina, Virginia2) (FY00: 9,899; FY15: 36,148 women; 3.7-fold increase), • VISN 17 (Texas) (FY00: 8,959; FY15: 31,681 women; 3.5-fold increase);• VISN 19 (Colorado, Montana, Utah, Wyoming3) (FY00: 5,380; FY15: 16,933 women; 3.1-fold increase); and • VISN 5 (Maryland, Washington DC4) (FY00: 5,278; FY15: 15,765 women; 3.0-fold increase).
No VISN showed less than a 1.8-fold increase in the number of women Veterans from FY00 to FY15.
In terms of increases in absolute numbers of women Veterans, the VISNs with the largest magnitude growth (increasing by at least 15,000 women Veteran VHA outpatients) were:
• VISN 7 (Alabama, Georgia, South Carolina) (FY00: 11,722; FY15: 43,288 women; an increase of 31,566 women); • VISN 6 (North Carolina, Virginia5) (FY00: 9,899; FY15: 36,148 women; an increase of 26,249 women); • VISN 8 (Florida, Puerto Rico, Virgin Islands6) (FY00: 14,287; FY15: 40,393 women; an increase of 26,106 women); • VISN 16 (Arkansas, Louisiana, Mississippi, Oklahoma7) (FY00: 14,038; FY15: 39,845 women; an increase of
25,807 women);• VISN 17 (Texas) (FY00: 8,959; FY15: 31,681 women; an increase of 22,722 women); and• VISN 22 (Southern California, Southern Nevada) (FY00: 9,427; FY15: 25,177; an increase of 15,750 women).
Every VISN increased by at least 3,600 women between FY00 and FY15 (Exhibit 4.B).

Sourcebook Vol. 4 - Part 4: Geographic Distribution
126
Health Care System-Level GrowthNOTES ABOUT HEALTH CARE SYSTEMS: The VHA Site Tracking Database (VAST) maintains an official list of all VHA sites of care. The VAST FY15Q4 report lists 141 unique health care systems (or parent stations) in FY15; WHEI adapted this list, making one modification to split the New York Harbor Health Care System into two separate health care systems: Manhattan Division and Brooklyn Division. This change, which yielded a total of 142 Health Care Systems, was made to be consistent with the facility listing for the Women’s Health Assessment Tool for Comprehensive Health (WATCH) survey.
There is no VAST list for FY00. Therefore, for the FY00 count of health care systems, WHEI applied the health care system mapping approach developed for FY15. Three Health Care Systems that were present in FY00 were no longer present in FY15: Lincoln NE, Fort Lyon CO, and Murfreesboro, TN. For cross-year comparability, when reporting the number of women Veterans per Health Care System in FY00, Sourcebook Volume 4 maps all women who attended one of these three sites to the corresponding FY15 Health Care System.8 Conversely, two new facilities that were not present in FY00 had opened by FY15: East Central Florida Health Care System (Lake Nona, Orlando VA Medical Center) and VA Texas Valley Coastal Bend Health Care System (Harlingen, Harlingen VA Clinic). These two Health Care Systems are included on the FY15 list but not on the FY00 list of Health Care Systems. As a result, at Health Care Systems proximate to these two sites, there could be less growth in the number of women Veterans than anticipated because some patients may have been reassigned to the newly opened site. The Sourcebook Volume 4 Online Appendix (Technical Appendix) provides additional details about facility mapping algorithms. With these caveats, the following describes how the number of women Veterans changed over time at the Health Care System level.

Sourcebook Vol. 4 - Part 4: Geographic Distribution
127
Exhibit 4.C shows the number of women Veteran VHA outpatients in each of the 140 Health Care Systems in the United States in FY00 (Panel A) and in each of the 142 Health Care Systems in FY15 (Panel B).9 There was dramatic growth at multiple Health Care Systems.
Those with at least 4-fold growth in the number of women Veteran outpatients were:10, 11
• Michigan: Ann Arbor (FY00: 1,043; FY15: 4,569 women; 4.4-fold increase)• Utah: Salt Lake City (FY00: 991; FY15: 4,300 women; 4.3-fold increase)• Georgia: Dublin (FY00: 764; FY15: 3,302 women; 4.3-fold increase)• Georgia: Atlanta-Decatur (FY00: 2,906; FY15: 12,462 women; 4.3-fold increase)• North Carolina: Salisbury (FY00: 1,578; FY15: 6,599 women; 4.2-fold increase)• Virginia: Hampton (FY00: 1,980; FY15: 8,096 women; 4.1-fold increase)• Minnesota: St. Cloud (FY00: 355; FY15 1,435 women; 4.0-fold increase)• North Carolina: Fayetteville (FY00: 2,021; FY15: 8,060 women; 4.0-fold increase)
Close behind in terms of proportional growth, the number of women Veterans using the Health Care System grew by at least 3-fold (but less than 4-fold) at the following health care systems:
• Texas: Temple (FY00: 2,793; FY15: 10,919 women; 3.9-fold increase)• South Carolina: Charleston (FY00: 1,808; FY15: 7,047 women; 3.9-fold increase)• South Carolina: Columbia (FY00: 1,920; FY15: 7,216 women; 3.8-fold increase)• Tennessee: Mountain Home (FY00: 728; FY15: 2,680 women; 3.7-fold increase)• Texas: Houston (FY00: 2,500; FY15: 9,148 women; 3.7-fold increase)• Georgia: Augusta Downtown (FY00: 1,364; FY15: 4,819 women; 3.5-fold increase)• Alabama: Montgomery (FY00: 1,496; FY15: 5,209 women; 3.5-fold increase)• Arkansas: Fayetteville (FY00: 853; FY15: 2,958 women; 3.5-fold increase)• Texas: Dallas (FY00: 2,975; FY15: 10,140 women; 3.4-fold increase)• New York: Brooklyn (FY00: 757; FY15: 2,538 women; 3.4-fold increase)• Ohio: Columbus (FY00: 818; FY15: 2,739 women; 3.3-fold increase)• Virginia: Richmond (FY00: 1,687; FY15: 5,621 women; 3.3-fold increase)• District of Columbia: Washington (FY00: 2.676; FY15: 8,823 women; 3.3-fold increase)• Indiana: Marion (FY00: 649; FY15: 2,078 women; 3.2-fold increase)• Idaho: Boise (FY00: 734; FY15: 2,330 women; 3.2-fold increase)• Michigan: Battle Creek (FY00: 751; FY15: 2,376 women; 3.2-fold increase)• California: San Diego (FY00: 2,534; FY15: 8,012 women; 3.2-fold increase)• West Virginia: Martinsburg (FY00: 710; FY15: 2,239 women; 3.2-fold increase)• Oregon: Portland (FY00: 2,110; FY15: 6,641 women; 3.1-fold increase)• Tennessee: Memphis (FY00: 1,364; FY15: 4,291 women; 3.1-fold increase)• Pennsylvania: Lebanon (FY00: 840; FY15: 2,641 women; 3.1-fold increase)• Wisconsin: Madison (FY00: 786; FY15: 2,450 women; 3.1-fold increase)• Massachusetts: Central Western Massachusetts (FY00: 428; FY15: 1,330 women; 3.1-fold increase)• Alabama: Birmingham (FY00: 1,803; FY15: 5,541 women; 3.1-fold increase)• Colorado: Denver (FY00: 2,543; FY15: 7,758 women; 3.1-fold increase)• Hawaii: Honolulu (FY00: 843; FY15: 2,549 women; 3.0-fold increase)• Wisconsin: Tomah (FY00: 416; FY15: 1,244 women; 3.0-fold increase)• Wyoming: Cheyenne (FY00: 565; FY15: 1,685 women; 3.0-fold increase)

Sourcebook Vol. 4 - Part 4: Geographic Distribution
128
• Iowa: Iowa City (FY00: 927; FY15: 2,749 women; 3.0-fold increase)• Indiana: Indianapolis (FY00: 1,441; FY15: 4,255 women; 3.0-fold increase)
At another 90 Health Care Systems, the number of women Veteran outpatients grew by 2.0- to 2.9-fold, and 11 Health Care Systems grew by 1.6- to 1.9-fold. In no Health Care System did the number of women Veteran outpatients grow by less than 1.6-fold over this period.
There was also striking growth in the absolute number of women Veteran outpatients at many facilities. The number of women Veteran outpatients using a particular Health Care System increased by at least 5,000 women (shown as red dots in Exhibit 4.C) at the following Health Care Systems:12
• Georgia: Atlanta-Decatur (FY00: 2,906; FY15: 12,462 women; an increase of 9,556 women)• Texas: Temple (FY00: 2,793; FY15: 10,919 women; an increase of 8,126 women)• Texas: Dallas (FY00: 2,975; FY15: 10,140 women; an increase of 7,165 women)• Florida: Gainesville (FY00: 3,676; FY15: 10,612 women; an increase of 6,936 women)• Texas: Houston (FY00: 2,500; FY15: 9,148 women; an increase of 6,648 women)• Texas: San Antonio (FY00: 3,397; FY15: 9,970 women; an increase of 6,573 women)• District of Columbia: Washington (FY00: 2,676; FY15: 8,823 women; an increase of 6,147 women)• Virginia: Hampton (FY00: 1,980; FY15: 8,096 women; an increase of 6,116 women)• North Carolina: Fayetteville (FY00: 2,201; FY15: 8,060 women; an increase of 6,039 women)• Washington: Seattle (FY00: 3,551; FY15: 9,092 women; an increase of 5,541 women)• California: San Diego (FY00: 2,534; FY15: 8,012 women; an increase of 5,478 women)• South Carolina: Columbia (FY00: 1,920; FY15: 7,216 women; an increase of 5,296 women)• South Carolina: Charleston (FY00: 1,808; FY15: 7,047 women; an increase of 5,239 women)• Colorado: Denver (FY00: 2,543; FY15: 7,758 women; an increase of 5,215 women)• North Carolina: Salisbury (FY00: 1,578; FY15: 6,599; an increase of 5,021 women)
In addition, the following sites, presented in descending order of growth, grew by at least 2,500 women Veterans (but by less than 5,000 women Veterans):
• Oregon: Portland (FY00: 2,110; FY15: 6,641 women; an increase of 4,531 women)• Mississippi: Biloxi (FY00: 2,316; FY15: 6,622 women; an increase of 4,306 women)• Tennessee: Nashville (FY00: 2,654; FY15: 6,925 women; an increase of 4,271 women)• Florida: Bay Pines (FY00: 2,594; FY15: 6,727 women; an increase of 4,133 women)• California: Martinez Community Living Center (FY00: 2,464; FY15: 6,596 women; an increase of 4,132 women)• North Carolina: Durham (FY00: 2,088; FY15: 6,084 women; an increase of 3,996 women)• Arizona: Phoenix (FY00: 2,430; FY15: 6,409 women; an increase of 3,979 women)• Virginia: Richmond (FY00: 1,687; FY15: 5,621 women; an increase of 3,934 women)• Alabama: Birmingham (FY00: 1,803; FY15: 5,541 women; an increase of 3,738 women)• Alabama: Montgomery (FY00: 1,496; FY15: 5,209 women; an increase of 3,713 women)• Ohio: Cleveland (FY00: 2,174; FY15: 5,724 women; an increase of 3,550 women)• Michigan: Ann Arbor (FY00: 1,043; FY15: 4,569 women; an increase of 3,526 women)• Georgia: Augusta-Downtown (FY00: 1,364; FY15: 4,819 women; an increase of 3,455 women)• Maryland: Baltimore (FY00: 2,109; FY15: 5,512 women; an increase of 3,403 women)• Arkansas: Little Rock (FY00: 1,862; FY15: 5,184 women; an increase of 3,322 women)• Utah: Salt Lake City (FY00: 991; FY15: 4,300 women; an increase of 3,309 women)

Sourcebook Vol. 4 - Part 4: Geographic Distribution
129
• Minnesota: Minneapolis (FY00: 2,013; FY15: 5,159 women; an increase of 3,146 women)• California: West Los Angeles (FY00: 2,765; FY15: 5,873 women; an increase of 3,108 women)• California: Loma Linda (FY00: 1,646; FY15: 4,638 women; an increase of 2,992 women)• Oklahoma: Oklahoma City (FY00: 1,772; FY15: 4,758 women; an increase of 2,986 women)• Tennessee: Memphis (FY00: 1,364; FY15: 4,291 women; an increase of 2,927 women)• Nevada: Las Vegas (FY00: 1,709; FY15: 4,622 women; an increase of 2,913 women)• Indiana: Indianapolis (FY00: 1,441; FY15: 4,255 women; an increase of 2,814 women)• Florida: Tampa (FY00: 4,580; FY15: 7,371 women; an increase of 2,791 women)• Arizona: Tucson (FY00: 1,836; FY15: 4,572 women; an increase of 2,736 women)• Missouri: St Louis-John Cochran (FY00: 1,560; FY15: 4,244 women; an increase of 2,684 women)• Florida: Miami (FY00: 1,700; FY15: 4,336 women; an increase of 2,636 women)• Pennsylvania: Pittsburgh -University Drive (FY00: 1,556; FY15: 4,123 women; an increase of 2,567 women)• Georgia: Dublin (FY00: 764; FY15: 3,302 women; an increase of 2,538 women)
Another 62 Health Care Systems grew by at least 1,000 women Veterans (but by less than 2,500),13 and 27 grew by 500 women Veterans (but by less than 1,000); the remaining 7 grew by less than 500 women Veterans.

Sourcebook Vol. 4 - Part 4: Geographic Distribution
130
Exhibit 4.C. Number of Women Veteran VHA Outpatients by Health Care System
Panel A: FY00
Panel B: FY15
Key: FY - Fiscal Year; VHA – Veterans Health Administration Notes: VA Texas Valley Coastal Bend Health Care System (Harlingen, Harlingen VA Clinic) and East Central Florida Health Care System (Lake Nona,
Orlando VA Medical Center) appear as gray dots in Panel B. These facilities did not appear as a Health Care System in FY00. The Health Care Systems shown in red dots indicate a growth by at least 5,000 women Veterans between FY00 and FY15. Findings portray Veteran VHA outpatients, not the entire Veteran population. See Technical Appendix.
Cohort: Women Veteran VHA outpatients in FY00: N=155,430 (Panel A) and in FY15: N=425,982 (Panel B). Source: WHEI Master Database, FY00-FY15

Sourcebook Vol. 4 - Part 4: Geographic Distribution
131
Implications
The rapid growth between FY00 and FY15 in the number of women Veterans using VHA touched every VISN and every Health Care System, highlighting the importance of delivering augmented women’s health services at every point of care in VHA.
At some facilities, the proportional and/or numeric growth of the women Veteran population has been particularly dramatic, potentially straining sites’ capacity to provide timely access to women. Given the continued growth of women in military service, combined with increasing market penetration (i.e., a greater proportion of eligible women Veterans electing to enroll in VHA), expansion is projected to continue. At all sites, long-range strategic planning must address capacity to provide for the growing population of women Veterans, including privacy and environment of care, as well as staffing with designated Women’s Health Primary Care Providers. Particularly at those sites with extremely rapid growth, there may be heavy space and workforce demands. This will require an investment of resources to meet the influx of women and comprehensively address their foundational health care needs, while at the same time avoiding burnout and attrition of their skilled women’s health care providers. VHA’s long-term women’s health care strategic planning efforts need to account for geographic factors.
Some of the rapid-growth facilities are in locations close to military bases, raising the possibility that some of the growth may be attributable to women who have recently left military service. If that is the case, then post-deployment services may also be especially relevant at these sites to ensure women’s smooth transition into VHA care.

Sourcebook Vol. 4 - Part 4: Geographic Distribution
132
Endnotes1 Although “health care system” appears in the name of VISNs 1, 10, and 12, for the purposes of Sourcebook Volume 4, the term “Health Care
System” is reserved for health care units that fall within VISNs. 2 In addition to North Carolina and Virginia, VISN 6 also includes a small part of West Virginia.3 In addition to Colorado, Montana, Utah, and Wyoming, VISN 19 also includes small parts of Idaho, Kansas, Nebraska, and Nevada.4 In addition to Maryland and Washington DC, VISN 5 also includes small parts of Virginia and West Virginia.5 In addition to North Carolina and Virginia, VISN 6 also includes a small part of West Virginia.6 In addition to Florida, Puerto Rico, and the Virgin Islands, VISN 8 also includes a small part of Georgia.7 In addition to Arkansas, Louisiana, Mississippi, and Oklahoma, VISN 16 also includes small parts of Alabama, Florida, Missouri, and Texas.8 Lincoln was mapped to Omaha (station 636), Fort Lyon was mapped to Denver (station 554), and Murfreesboro was mapped to Nashville
(station 626). 9 See “Notes about Health Care Systems,” above, regarding how Health Care Systems were mapped for purposes of Sourcebook Volume 4. 10 In addition, the number of women Veterans at the Manila VA Clinic in the Philippines grew from 26 in FY00 to 111 in FY15. 11 The “Location Descriptive Name (Common Name)” from VAST is used herein as the Health Care System label. 12 In addition, East Central Florida Health Care System (Lake Nona, Orlando VA Medical Center) did not exist in FY00; by FY15, there were 8,482
women Veterans using this Health Care System. 13 This does not include VA Texas Valley Coastal Bend Health Care System (Harlingen, Harlingen VA Clinic), which did not exist as a Health Care
System in FY00; by FY15, there were 1,653 women Veterans at this Health Care System.