
Source Water Assessment For Marinette Water Utility...
20
Source Water Assessment For Marinette Water Utility Marinette, Wisconsin March 27, 2003 A report by the Wisconsin Department of Natural Resources Bureau of Drinking Water and Groundwater Shore of Green Bay in Marinette’s source water area Photograph courtesy of E.J. Judziewicz
Transcript of Source Water Assessment For Marinette Water Utility...
Source Water AssessmentFor Marinette Water Utility
Marinette, Wisconsin
March 27, 2003
A report by theWisconsin Department of Natural ResourcesBureau of Drinking Water and Groundwater
Shore of Green Bay in Marinette’s source water areaPhotograph courtesy of E.J. Judziewicz
1
Table of Contents
Executive Summary.......................................................................................................................................2
Introduction ...................................................................................................................................................3
Purpose of this Assessment ...........................................................................................................................3
Source Water Contaminant Categories.......................................................................................................3
Hydrologic Setting .........................................................................................................................................4
Description of the Source Water Area.........................................................................................................4
Description of Green Bay............................................................................................................................8
Susceptibility Assessment ...........................................................................................................................10
Methodology .............................................................................................................................................10
Sensitivity Analysis ...................................................................................................................................10
Critical Assessment Zone ..........................................................................................................................10
Introduction to the Potential Contaminant Source Inventory ....................................................................11
US EPA Potential Contaminant Source Inventory ....................................................................................12
WDNR Potential Contaminant Source Inventory......................................................................................13
WDNR Groundwater Potential Contaminant Source Inventory................................................................16
Description of the Marinette Water Utility Drinking Water Treatment System...................................18
Susceptibility Determination ......................................................................................................................18
Recommendations........................................................................................................................................18
Selected References .....................................................................................................................................18

2
Executive Summary
The 1996 amendments to the Safe Drinking Water Act require that States complete source waterassessments for all public drinking water systems. The primary purpose of this assessment is to determinethe relative susceptibility of Marinette’s source water to contamination. For this assessment, susceptibilityis defined as the likelihood that a contaminant of concern will enter a public water supply at a level thatmay result in adversely impacting human health. Source water is untreated water from streams, rivers,lakes, and groundwater aquifers. A susceptibility determination is based on a stepwise synthesis ofinformation regarding the well or surface water intake vulnerability and the source water’s sensitivity to apotential source of a contaminant of concern. Due to the vulnerable nature of surface water, most drinkingwater systems utilizing surface water are determined to have high levels of susceptibility to source watercontamination.
Affordable, safe drinking water is essential to the health, development and stability of all communities.Conventionally, treatment has been the only step in maintaining safe drinking water for surface watersystems. The quality of treated drinking water is a function of the pretreatment water quality. Littleconcern has been paid to a preventive approach of protecting the source water. One of the best ways toensure safe drinking water is to develop a local program designed to protect the source of drinking wateragainst potential contamination. Not only does this add a margin of safety, but it also raises the awarenessof consumers and/or the community of the risks of drinking water contamination. It is expected that sourcewater assessment results will provide a basis for developing a source water protection program.
The City of Marinette is located in northeastern Wisconsin at the Menominee River’s discharge into GreenBay. Marinette Water Utility relies solely upon source water from Green Bay to provide drinking water toits more than 12,000 consumers.
A source water area is the area that contributes source water to the public drinking water system. LakeMichigan drains approximately 45,600 square miles of which, 15,625 drain into Green Bay. Due to its sizeand diverse land uses, assessing the entire Lake Michigan source water area is not a practical method fordetermining the individual susceptibility of Marinette’s source water. In an attempt to improve sourcewater quality at a practical scale, the WDNR delineated source water areas based on local watersheds thatmay specifically impact source water entering Marinette’s intake. It is important to note that a source waterarea is only one potential factor in the quality and susceptibility of source water. Other factors may includeunmanageable, lake-wide episodic events that have little to do with human activities.
Marinette’s source water area includes land drained by the Menominee River and Hay Creek. Thisencompasses over 4,000 square miles of land in Northeastern Wisconsin and Southern Michigan’s UpperPeninsula.
The source water area drains from northwest to southeast across relatively poorly drained sand and gravelglacial soils before discharging into Western Green Bay at the cities of Menominee and Marinette. Withthe exception of the southeastern portion of the source water area, forests and wetlands are the dominantland covers. In the southeastern portion of the source water area land cover becomes a mixture ofagriculture and natural vegetation with a concentrated urban area near the mouth of the Menominee River.
Treatment of source water at the Marinette water filtration plant includes flocculation, sedimentation,filtration, chlorination, fluoridation and phosphate addition.
As with most surface water systems, Marinette’s source water is significantly impacted by the source waterarea and highly susceptible to contamination. This is due to a high concentration of potential contaminantsources in the source water area near the drinking water intakes and the intakes’ distance and relativedirection from the discharge of a major stream. Green Bay water quality is frequently poor and windscoupled with discharge from the Menominee River and nearby intermittent streams allow contaminatedsource water to enter the drinking water intakes.
Source water protection for Marinette should begin with the formation of a source water protection teamcomposed of delegates from local, regional, state and federal organizations. This group would plan andimplement best management practices in the source water area to prevent source water contamination.Initial source water protection projects should focus on remediation of historical contamination sites and

3
managing runoff from agricultural, industrial and urban areas in the southeastern portion of the sourcewater area.
A paper copy of the detailed assessment is available at the Marinette Public Library. An electronic versionof the detailed assessment is accessible on the Wisconsin Department of Natural Resources website athttp://www.dnr.state.wi.us/org/water/dwg/gw/SWP.HTM.
Introduction
In 1996, the U.S. Congress amended the Safe Drinking Water Act to provide resources for states to conductSource Water Assessments. Information about Wisconsin’s Source Water Assessment Program can befound on the Wisconsin Department of Natural Resources (WDNR) website mentioned in the ExecutiveSummary. In cooperation with other Great Lakes states, WDNR has developed a method--Wisconsin’sSource Water Assessment Program, Appendix R (Assessment Protocol for Great Lake Sources)--forconducting Source Water Assessments for water supplies that use the Great Lakes as their water source. Asource water assessment involves identifying a source water area, analyzing the sensitivity of the source tonatural conditions, conducting potential contaminant source inventories and determining the susceptibilityof the source to contamination.
The requirements for public water supplies in Wisconsin to meet U.S. Environmental Protection Agencymaximum contaminant levels (MCLs) provide a base level of assurance of safe drinking water. However,all systems are vulnerable to some degree to potential contamination. With this in mind, susceptibilitydeterminations were made qualitatively relative to other systems.
Purpose of this Assessment
The purpose of this source water assessment is to determine the susceptibility of Marinette’s source ofdrinking water to contamination and to make recommendations on how to help protect this valuableresource.
Safe, affordable drinking water in ample supply is essential to the health, development and stability of allcommunities. Conventionally, treatment has been the only step in maintaining safe drinking water forsurface water systems and little concern has been paid to a preventive approach of protecting the sourcewater. The quality and cost of treated drinking water is often a function of pretreatment source waterquality.
Source water quality can be improved through the implementation of a source water protection program. Asource water protection program is composed of four steps: assessment, planning, implementation and longterm management. By assessing localized impacts on source water quality, this assessment completes thefirst step in a source water protection program. For more information on completing a source waterprotection program please visit http://www.epa.gov/safewater/protect/protect.html on the World WideWeb.
Source Water Contaminant Categories
Source water can be contaminated by microbial, inorganic, synthetic organic, volatile organic, precursors ofdisinfection by-products and radioactive contaminants. These contaminants can enter source water throughvarious means. Pathways of contamination can be split into two major categories, point source pollutionand nonpoint source pollution. Point source pollution includes specific, identifiable dischargers ofcontaminants. Examples of these include industrial and municipal wastewater outfalls. Point sourcedischargers are more easily regulated and held accountable for contaminating source water. Nonpointsource pollution comes from no specific source and diffusely enters source water. Examples of nonpointsource pollution include runoff from land cover and atmospheric deposition.
This assessment describes these general contaminant categories associated with potential contaminantsources. For a more detailed description of contaminants associated with potential contaminant sourcesplease visit http://www.epa.gov/OGWDW/swp/sources1.html on the World Wide Web. For information onhealth effects and methods of protection from particular chemical contaminants please visithttp://www.epa.gov/safewater/hfacts.html on the World Wide Web.
• Microbial contaminants, such as viruses and bacteria, which may come from sewage treatment plants,septic systems, agricultural livestock operations, and wildlife. Microbial contaminants can lead to
4
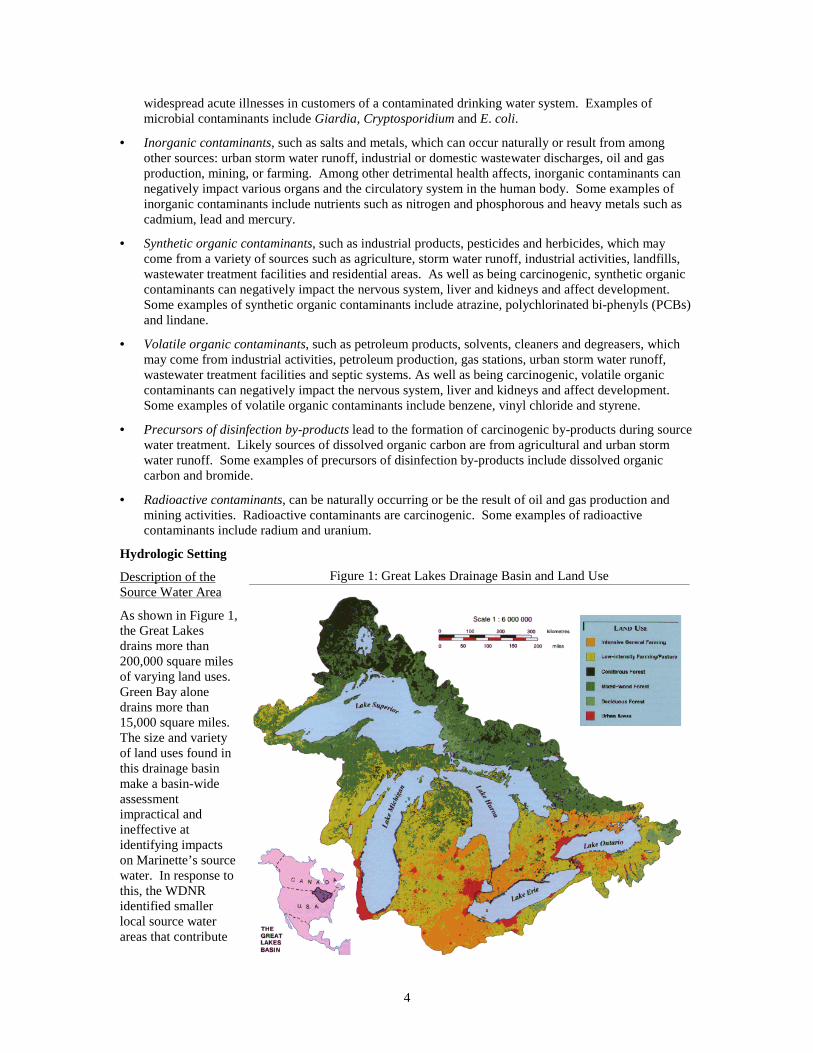
Figure 1: Great Lakes Drainage Basin and Land Use
widespread acute illnesses in customers of a contaminated drinking water system. Examples ofmicrobial contaminants include Giardia, Cryptosporidium and E. coli.
• Inorganic contaminants, such as salts and metals, which can occur naturally or result from amongother sources: urban storm water runoff, industrial or domestic wastewater discharges, oil and gasproduction, mining, or farming. Among other detrimental health affects, inorganic contaminants cannegatively impact various organs and the circulatory system in the human body. Some examples ofinorganic contaminants include nutrients such as nitrogen and phosphorous and heavy metals such ascadmium, lead and mercury.
• Synthetic organic contaminants, such as industrial products, pesticides and herbicides, which maycome from a variety of sources such as agriculture, storm water runoff, industrial activities, landfills,wastewater treatment facilities and residential areas. As well as being carcinogenic, synthetic organiccontaminants can negatively impact the nervous system, liver and kidneys and affect development.Some examples of synthetic organic contaminants include atrazine, polychlorinated bi-phenyls (PCBs)and lindane.
• Volatile organic contaminants, such as petroleum products, solvents, cleaners and degreasers, whichmay come from industrial activities, petroleum production, gas stations, urban storm water runoff,wastewater treatment facilities and septic systems. As well as being carcinogenic, volatile organiccontaminants can negatively impact the nervous system, liver and kidneys and affect development.Some examples of volatile organic contaminants include benzene, vinyl chloride and styrene.
• Precursors of disinfection by-products lead to the formation of carcinogenic by-products during sourcewater treatment. Likely sources of dissolved organic carbon are from agricultural and urban stormwater runoff. Some examples of precursors of disinfection by-products include dissolved organiccarbon and bromide.
• Radioactive contaminants, can be naturally occurring or be the result of oil and gas production andmining activities. Radioactive contaminants are carcinogenic. Some examples of radioactivecontaminants include radium and uranium.
Hydrologic Setting
Description of theSource Water Area
As shown in Figure 1,the Great Lakesdrains more than200,000 square milesof varying land uses.Green Bay alonedrains more than15,000 square miles.The size and varietyof land uses found inthis drainage basinmake a basin-wideassessmentimpractical andineffective atidentifying impactson Marinette’s sourcewater. In response tothis, the WDNRidentified smallerlocal source waterareas that contribute

5
source water to Lake Michigan in close proximity to the drinking water intakes. Source water areas arecomposed of one or more established watersheds that discharge near the surface water intakes. Sourcewater areas for this assessment were delineated based on WDNR surface watersheds, not groundwaterbasins. Generally, groundwater basin boundaries are similar to their surface water counterparts but mayvary due to geology.
As shown in Figure 2, Marinette’s source water area is located in Northeastern Wisconsin and the Southern
Figure 2: Source Water Area

6
tip of Michigan’s Upper Peninsula. It includes portions of Michigan’s Baraga, Iron, Gogebic, Marquette,Dickinson and Menominee counties and Wisconsin’s Marinette, Florence, Northern Forest andNortheastern Vilas counties. It includes portions of the Wisconsin communities of Marinette, Wausaukeeand Niagra and the Michigan communities of Menominee and Iron Mountain.
Hydrology
As shown in Figure 2, the source water area is the Menominee River Drainage Basin, which extends northinto the Upper Peninsula of Michigan. The headwaters of the Menominee River are the Michigamme,Paint and Brule Rivers, which flow southeast joining together to form the Menominee River northwest ofthe city of Iron Mountain. Flowing southeast the Menominee River gains flow from the Pine, Sturgeon,Pemebonwon, Pike, Wausuakee and Little Cedar Rivers. The Menominee River enters into western GreenBay at the cities of Menominee, Michigan and Marinette, Wisconsin. In 1989 the average flow of theMenominee River at the city of Marinette was 2,577 cubic feet per second. As expected highest waterflows occur during the spring months of March and April.
Soils in the headwaters are generally well drained sand and gravel outwash soils. In the lower portions ofthe source water area, less permeable clayey and organic soils inhibit infiltration of water into the ground.Overall drainage of the source water area is slow due in part to end moraines running across the basinsnatural southeasterly flow and the basin’s low amount of elevation change.
Land cover
Land cover can play a major role in source water quality. Spatial data in Figure 3 was generated frominterpretations of aerial photographs taken from 1971 to 1982.
• Urban
Urban areas depicted in Figure 3 include residential, industrial and commercial activities.Contaminants associated with residential land cover include synthetic organic, volatile organic,inorganic, precursors of disinfection by-products and microbial contaminants. Due to highconcentrations of impermeable surfaces, such as streets, driveways, parking lots, sidewalks and roofs,urban areas have increased potential to create large quantities of runoff during and followingprecipitation events. Runoff from residential areas transports contaminants associated with this landcover into source water. These contaminants can also enter source water from residential areasthrough point source discharges and atmospheric deposition.
As shown in Figure 3, small urban areas are located throughout the source water area. The cities ofMenominee, Michigan and Marinette, Wisconsin are the largest, most concentrated urban areas in thesource water area. The size, industrial economies and proximity of these cities to the surface waterintakes make them areas of particular concern to source water quality.
• Agricultural
For this assessment agricultural land cover includes cropland, pasture, orchards and nurseries.Agricultural practices generally cause the land to be more susceptible to erosion and runoff thannaturally vegetated land. Due to common practices and activities, agricultural land cover can be amajor source of inorganic, treatment by-product precursors, microbial and synthetic organiccontaminants for the source water.
Land cover in the lower portions of the source water area includes a mixture of agricultural activities.These are predominantly corn, oats, hay and livestock production. Land used for agriculture in thesource water area has been decreased from 1987 to 1997.
• Natural vegetation
For this assessment, natural vegetation includes wetlands, woodlands and some unused lands.Generally, natural vegetation has positive impacts on source water. These impacts include increasedinfiltration of precipitation into the ground, decreased quantity of storm water runoff, removal ofcontaminants from source water, reduced potential for erosion and less drastic fluctuations ofstreamflow.

7
Much of the original natural vegetation still exists in the source water area. This includes largeforested and wetland regions. Timber harvesting occurs in portions of the source water area
Water quality
Water quality varies throughout the source water area. Many of the smaller tributaries to the MenomineeRiver are classified as outstanding and exceptional resource waters. Outstanding resource waters aredefined as a lake or stream having excellent water quality, high recreational and aesthetic value, highquality fishing and is free from point and nonpoint source pollution. Exceptional resource waters aredefined as a stream exhibiting the same high quality resource values as outstanding waters but may beimpacted by point source or have the potential for future discharge from a small sewer community.
Figure 3: Land Cover

8
Water quality generally deteriorates downstream. The WDNR has delineated the lower 15 miles of theMenominee River as impaired due to contaminated sediments, atmospheric deposition and othercontaminant sources. The EPA has designated the lower 3 miles of the Menominee River as on of 43 GreatLakes Areas of Concern. This includes approximately 3 miles of nearshore water north and south of themouth. The major sources of contamination in this area include historical contamination sites and presentday industry and urbanization. High concentrations of inorganic, volatile organic, synthetic organic andmicrobial contaminants have resulted in use impairments of this area. The Menominee Area of Concernencompasses the Marinette drinking water intakes.
Description of Green Bay
While attached to and occasionally impacted by Lake Michigan, Green Bay behaves as a relativelyindependent body of water. It drains over 15,000 square miles, which are divided into 7 major drainagebasins. The primary tributary to Green Bay is the Fox River, which enters into Green Bay from the south.The Menominee River is the second largest tributary to Green Bay.
Bathymetry
As shown in Figure 4,southern Green Bay is arelatively long shallow baywith a muddy bottom.Farther to the north GreenBay becomes deeper and thebottom changes to rock.This plays a major role in thedifference in water qualityfound in northern andsouthern Green Bay. Theshoreline of Green Bay nearthe drinking water intakesmay play a major role insource water quality.
Winds
Wind regularly affects bothGreen Bay and LakeMichigan circulation patternsand water quality in near-shore areas. Calm westerlybreezes generally coincidewith good water quality, andstrong easterly windscoincide with the worstsource water quality at theintakes. In a matter of hoursstrong easterly winds cancause a drop in source waterquality by churning up lakebottom sediments andpushing discharge from theMenominee River towardsthe intakes.
Figure 4: Bathymetry of Green Bay

9
Currents
As shown in Figure 5, the typical circulationpattern of Green Bay is typified by separatenorthern and southern counterclockwiserotations. These rotations meet along a lineextending from Marinette across the Bay to thesoutheast. Along this line, water can mix intothe opposing rotation or continue in theoriginal rotation. Water mixing from thesouthern rotation into the northern rotationpasses along the Eastern Shore of the Baycreating a southerly nearshore current along theDoor Peninsula. Water mixing from thenorthern rotation into the southern rotationpasses across the drinking water intakes andthe mouth of the Menominee River beforeentering the southern rotation. This rotationand mixing is important to source water qualityat the drinking water intakes for three reasons.First, this brings cleaner water from thenorthern rotation over the drinking waterintakes. Secondly, the mixing creates anortherly nearshore current that pushesdischarge from the Menominee River to thesouth, away from the drinking water intakes.Thirdly, discharge from the Fox River at thesouthern tip of the bay stays along the easternside of the Bay, away from the drinking waterintakes.
Water quality
Water quality in Green Bay varies withdistance from shore and location. Due to lessinputs of contaminants, increased mixing withcleaner water from Lake Michigan, limitedmixing with the southern portion of the Bayand a higher factor of dilution the northernportion of the Bay has much better waterquality than the southern portion of the Bay.The shallow, confined nature of the southernportion of the Bay results in increased watertemperatures, more easily suspended lakebottom sediments and lack of dilution of contaminants entering from the heavily industrial and agriculturalareas draining into southern Green Bay.
It is important to note that water quality of source water at the intakes is based almost entirely onmonitoring that occurs at the drinking water intakes. Few contaminants have been comprehensivelymonitored in source water at the intakes. Conventional water quality indicators such as color, taste andclarity indicate water quality fluctuations throughout the year. An indicator of microbial contaminants,total coliform is detected in the majority of samples of source water entering the drinking water intakes.High concentrations of the group of treatment by-products, total trihalomethanes are indicative of highlevels of dissolved organic carbon in the source water. A synthetic organic contaminant typicallyassociated with waste sites, industry and pesticides have been detected in the source water at the intakes.
Figure 5: Green Bay Circulation Patterns

10
Volatile organic contaminants typically associated with hazardous waste sites and industrial activitiesamong other sources have also been detected in the source water the drinking water intakes.
Susceptibility Assessment
For the purposes of Wisconsin’s source water assessments, susceptibility is defined as the likelihood that acontaminant of concern will enter a public water supply at a level that may result in adversely impactinghuman health. A susceptibility determination is based on a stepwise synthesis of information regarding thesurface water intake’s vulnerability and the source water’s sensitivity to a potential source of a contaminantof concern.
Methodology
For a detailed explanation of the protocol for Great Lake source water assessments please see Appendix Rof Wisconsin’s Source Water Assessment Program Plan Appendices.
An initial survey was performed on the Marinette source water area to assess local impacts to the sourcewater. The initial survey included interviewing Marinette Water Utility employees, conducting asensitivity analysis, delineation of a critical assessment zone and reviewing existing data. The initialsurvey revealed that source water quality was frequently susceptible to contamination.
A more in-depth study of the source water area was carried out to determine what activities and areaswithin the source water area affect the source water’s susceptibility to particular types of contaminants.This more in-depth study reviewed the distribution of potential contaminant sources in the source waterarea, historical data, localized water quality of tributaries and background water quality levels andcharacteristics of Green Bay.
Sensitivity Analysis
Sensitivity is defined as the likelihood that source water will be impacted by contaminants due to theintrinsic physical attributes of the source water area. Sensitivity is determined from the natural setting ofthe source water and indicates the natural protection afforded the source water. Factors in sensitivityinclude hydrologic characteristics of the source water area, proximity, direction and quantity of dischargerelative to the intake and degree of dilution afforded by distance from shore and depth of intake. Based onthe Great Lakes Protocol for conducting a sensitivity analysis, calculated sensitivity is the product of theintake’s distance from shore and the depth of water at the intake. It is important to keep in mind that thisdoes not take into account numerous site-specific variables. Relative levels of calculated sensitivity includemoderate, high and very high. Marinette Water Utility has 2 surface water intakes located in Green Baynorth of the Menominee River. The calculated sensitivities of the intakes are both high. The physicalcharacteristics of Green Bay and proximity of the Menominee River discharge would make the actualsensitivity higher.
Critical Assessment Zone
In keeping with the Great Lakes protocol, a critical assessment zone was delineated based upon the intakescalculated sensitivity. Any land, particularly shoreline, which is within the delineated critical assessmentzone, must be part of an in-depth assessment. The zone is circle centered on the intake. The size of thecircle depends on the calculated sensitivity rating. The critical assessment zones for the drinking waterintakes do not encompass any land or shoreline.

11
Introduction to the Potential Contaminant Source Inventory
A major component of the susceptibility determination is based on the distribution of potential contaminantsources in the source water area. A high density of potential contaminant sources in the source water areaindicates a higher probabilityof contaminating source water.Source water from a sourcewater area with a low densityof potential contaminantsources is less likely to becomecontaminated.
It is important to understandthat a potential contaminantsource is not necessarily asource of contaminants. It hasthe potential to become asource of contaminants but ifmanaged properly should notimpact the source water.
In an attempt to identify allknown potential contaminantsources, all locational dataavailable was used for thisassessment. However, basedon the level of inventory,locational data is not currentlyavailable equally throughoutthe entire source water areaand the sources of locationaldata vary. Unfortunately, thiscreates the appearance of animbalance in the distribution ofpotential contaminant sources.For instance, an area that wasrigorously inventoried becauseit is encompassed by a wellhead protection area mayappear to have more potentialcontaminant sources thanoutside the well headprotection area because allpotential contaminant sourceswere not inventoried outsidethe well head protection area.Obviously this creates a visualbias of the distribution ofpotential contaminant sourcesin the source water area. In aneffort to compensate for this,Figure 6 depicts the sourcewater area broken down intotypes of inventories and thefollowing potential
Figure 6: Identification of Potential Contaminant Source Inventories

12
contaminant source maps do not combine data from different types of inventories. This will be importantto keep in mind when planning source water protection so that resources are not biased based on thisimbalance.
US EPA Potential Contaminant Source Inventory
Industrial Facility Discharge
These sites are industrial or municipal point sources discharging to surface waters. The facilities areextracted from the U.S. EPA’s Industrial Facilities Discharge (IFD) database, which is contributed to by anumber of organizations including federal, state, and interstate agencies. For more information on thisprogram please visit http://www.epa.gov/OST/BASINS/metadata/ifd.htm on the World Wide Web. Asshown on Figure 7, IFD sites are concentrated in populated areas such as Marinette and Iron Mountain.
Figure 7: US EPA Potential Contaminant Source Inventory

13
Permit Compliance Discharge
Permit Compliance Dischargers shown on Figure 7 are tracked by National Pollutant DischargeElimination System (NPDES) data and tracks permit issuance, permit limits and monitoring data, and otherdata pertaining to facilities regulated under NPDES. The NPDES permit program regulates directdischarges from municipal and industrial wastewater treatment facilities that discharge into the navigablewaters of the United States. Wastewater treatment facilities (also called "point sources") are issued NPDESpermits regulating their discharge. For more information concerning Permit Compliance Dischargersplease visit http://www.epa.gov/waterscience/basins/metadata/pcs3.htm on the World Wide Web.
Toxic Release Inventory site
Shown on Figure 7, this database contains data on annual estimated releases of over 300 toxic chemicals toair, water, and land by the manufacturing industry. Industrial facilities provide the information, whichincludes: the location of the facility where chemicals are manufactured, processed, or otherwise used;amounts of chemicals stored on- site; estimated quantities of chemicals released; on-site source reductionand recycling practices; and estimated amounts of chemicals transferred to treatment, recycling, or wastefacilities. For more information concerning this data source please visithttp://www.epa.gov/OST/BASINS/metadata/tri.htm on the World Wide Web.
Resource Conservation and Recovery Information System sites
Resource Conservation and Recovery Information System sites (RCRIS) shown on Figure 7 are generators,transporters, treaters, storers, and disposers of hazardous waste. For more information concerning RCRISplease visit http://www.epa.gov/OST/BASINS/metadata/rcris.htm on the World Wide Web.
WDNR Potential Contaminant Source Inventory
Animal feeding operations
Animal feeding operations are agricultural operations where animals are kept and raised in confinedsituations. Animal feeding operations generally congregate animals, feed, manure, dead animals, andproduction operations on a relatively small area of land. Feed is brought to the animals rather than theanimals grazing or otherwise seeking feed in pastures. Animal waste and wastewater can enter waterbodies from spills or breaks of waste storage structures (due to accidents or excessive rain), and manurespreading practices. Animal feeding operations have the potential to contribute pollutants such asinorganic, synthetic organic, microbial contaminants as well as hormones and antibiotics to the sourcewater.
Animal feeding operations shown on Figure 8 include only the larger animal feeding operations (over 1,000animal units), which are regulated for wastewater discharge. This does not provide an accurate distributionof the more common smaller animal feeding operations. A limited distribution of smaller animal feedingoperations in the source water area is depicted in Figure 9.
Landfills
In the past landfills were unregulated and were common sources of contaminants. Some of these are nowclassified as Bureau of Remediation and Repair Tracking System sites, which are discussed below.Licensed landfills are now strictly regulated and monitored. Closed and active landfills are frequentlysources for inorganic, synthetic organic and volatile organic contaminants in source water.
Landfills shown in Figures 8 include currently licensed landfills and sites listed on the Registry of WasteDisposal sites. Of the 10 licensed landfills in the source water area within Wisconsin, 9 are classified asEnvironmental Repair Program sites, which are discussed below. This does not take into account the morenumerous abandoned small dumps that historically operated with no regulation.
Wastewater treatment facilities
Wastewater treatment facilities (WWTFs) include municipal and industrial operations. Municipal facilitiescan be sources of inorganic, microbial, synthetic organic and volatile organic contaminants as well ashormones, pharmaceuticals and other organic contaminants that have been linked to developmental andreproductive defects in animals. Following treatment, effluent is frequently discharged through an outfalldirectly into surface water. Typical treated and disinfected sewage contains low concentrations of

14
contaminants. A municipal WWTF may be inundated with more raw sewage than it can process. In theevent of this a bypass or sanitary sewer overflow occurs. This allows untreated sewage to enter directlyinto surface water. A typical bypass may contain high concentrations of contaminants associated withurban runoff and WWTFs. Contaminants associated with industrial WWTFs are dependent upon thespecific industry but may include microbial, volatile organic, inorganic and synthetic organic contaminants.
See Figures 8 and 9 for WWTF locations. There are several municipal and industrial wastewaterdischargers located in the source water area. Industrial wastewater discharges have been identified by theWDNR as negatively impacting source water in the Menominee River and Twin Creek.
WDNR’s Bureau of Remediation and Redevelopment Tracking System
The WDNR Remediation and Redevelopment Program keeps track of sites where chemical contaminationof soil, surface water and/or groundwater has occurred. The Bureau of Remediation and RedevelopmentTracking System (BRRTS) is the Department’s database for tracking the status of investigation and cleanupactivities at these sites. There are several types of sites that are tracked by BRRTS, including leakingunderground storage tank sites, Environmental Repair Program sites, spill sites and Superfund sites. For
Figure 8: WDNR Potential Contaminant Source Inventory

15
information on specific contamination sites in Wisconsin please visit BRRTS at,http://www.dnr.state.wi.us/org/aw/rr/brrts/index.htm on the World Wide Web.
• Leaking Underground Storage Tank sites
A Leaking Underground Storage Tank (LUST) site is defined as a leaking underground storage tankthat has contaminated soil and/or groundwater with petroleum.
As of 8/12/02 there are 41 LUST sites in the municipal area of Marinette, Wisconsin.
• Environmental Repair Program sites
Environmental Repair Program (ERP) sites are sites other than LUSTs that have contaminated soiland/or groundwater. Often, these are old historic contaminant releases to the environment.
As of 8/12/02 there have been 19 ERP sites identified within the municipal area of Marinette,Wisconsin. Historical contamination sites in the lower Menominee River and Harbor have resulted inuse impairments and the listing of this area as an EPA Great Lakes Area of Concern.
• Spill sites
Spills are defined as a discharge of hazardous substances that may adversely impact, or threaten toadversely impact public health, welfare or the environment. It is important to note that the number ofunreported spills is unknown, but is probably well beyond those spills that are reported. FromSeptember of 1978 to August 2002, there have been 186 spills reported in the municipality ofMarinette, Wisconsin. Of these, at least 17 entered into storm sewers and 35 entered directly intosurface water. For information on particular spills in Wisconsin please visit the previously mentionedBRRTS Internet site.
Figure 9: Wisconsin DNR Potential Contaminant Source Inventory in the City of Marinette

16
Hazardous Waste Generators
Hazardous waste generators are defined as facilities, which handle materials classified as hazardous waste.Hazardous waste is defined as any substance that is toxic to humans. Contaminants associated withhazardous waste generators are site specific. Hazardous waste generators include a wide array of facilitiesranging from hospitals and schools to manufacturing and industrial operations.
As shown in Figure 9, there are 5 large quantity hazardous waste generators in the city of Marinette, all ofwhich are listed on BRRTS as either spill sites or LUSTs. This does not account for the more numeroussmaller quantity hazardous waste generators.
Boating Related Activities
Boating related activities are potential sources of volatile organic, synthetic organic, inorganic andmicrobial contaminants to the source water. Contaminants can enter directly into the source water throughspills or indirectly through runoff from marinas and shipyards where many cleaning agents, paints,petroleum products and other chemicals are commonly stored and used. For more information on theeffects of and preventive measures for boating related activities please visithttp://www.epa.gov/owow/nps/mmsp/index.html
Recreational boating and fishing are both popular on Lake Michigan near the city of Marinette andMenominee. The marina located to the northwest of the intakes is a point of concern due to its proximity tothe intakes.
Transportation Related Activities
Transportation related activities have the potential to contaminate source water both through contaminantsfrom maintenance and operation or from cargo spills. Examples of transportation related activities includehighways, railroads, rail yards, harbors, shipping lanes and airports. These can all be sources of inorganic,volatile organic and synthetic organic contaminants. Contaminants from cargo spills are dependent uponparticular cargoes, but generalizations can be made based on local economies.
As shown in Figures 7 and 9, Menominee and Marinette serve as major hubs for transportation andshipping. There is a major Great Lakes harbor and shipping lane located just south of the intakes.Railroads that experience a high volume of traffic parallel and cross the Menominee River at severallocations. Based on the local industrial economy, cargoes of concern to source water transported throughthis area include volatile organic, synthetic organic and inorganic contaminants.
WDNR Groundwater Potential Contaminant Source Inventory
Localized Agricultural and Bulk Storage Potential Contaminant Sources
Localized agricultural and bulk storage activity locations for this assessment are shown in Figure 10.Agricultural activities include active farming operations, animal feedlots, agricultural irrigation and linedand unlined manure storage facilities. These activities are potential sources of synthetic organic, inorganicand microbial contaminants. Bulk storage activities include feed mills, agricultural co-ops, 500 gallon andlarger petroleum and chemical storage sites and road salt storage sites. Contaminants associated withstorage facilities are largely site-specific, but generally they are potential sources of inorganic, syntheticorganic and volatile organic contaminants.
Localized Commercial Potential Contaminant Sources
Localized commercial activities locations for this assessment are shown in Figure 10. Commercialactivities include airports, auto body shops, boat yards, car washes and Laundromats in unsewered areas,cemeteries, dry cleaners, gas service stations, machine/metal working shops, motor vehicle repair shops,paint shops, photo processing facilities, jewelry and metal plating facilities, printing facilities, rail yards,rail road tracks, scrap/junk yards and seed production plants. These activities are frequently associatedwith inorganic and volatile organic contaminants.

17
Localized General and Industrial Potential Contaminant Sources
Localized general and industrial activities for this assessment are shown in Figure 10. General activitiesinclude above-ground and below-ground storage tanks, municipal and non-municipal sewer lines, sewageholding tanks, septic tanks, sumps, drainfields, mounds and dry wells. These activities are potentialsources for synthetic organic, volatile organic, inorganic and microbial contaminants. Industrial activitiesinclude asphalt plants, industrial chemical production facilities, electronic product manufacturers,electroplating / metal finishing facilities, furniture or wood manufacturing / refinishing / stripping facilities,foundries / smelting plants, mining operations / mine waste sites, paper mills, petroleum and chemicalpipelines, plastics manufacturer / molding facilities, wood preserving facilities. These activities arepotential sources of volatile organic, synthetic organic and inorganic contaminants.
Localized Waste Management and Miscellaneous Potential Contaminant Sources
Localized waste management and miscellaneous activities and contaminant conduits are shown in Figure10. Waste management activities include municipal incinerators, injection wells, sludge spreading sites,solid waste transfer stations and wastewater lagoons. These activities are potential sources of inorganic,synthetic organic, microbial and volatile organic contaminants. Miscellaneous sources include fire trainingfacilities, golf courses, gasification plants, laboratories and military installations. These sources areassociated with microbial, synthetic organic and volatile organic contaminants.
Figure 10: Localized Wisconsin Potential Contaminant Source Inventory

18
Description of the Marinette Water Utility Drinking Water Treatment System
Marinette Water Utility reliably provides high quality drinking water for its 12,000 consumers. Theaverage year-round water demand for the Marinette Water Utility is 2.9 million gallons per day (mgd).
Source water enters the treatment plant through 2 intakes located in western Green Bay. Permanganate isapplied at the intakes for taste and odor control and to control zebra mussel growth. Upon entering thetreatment plant source water undergoes flocculation and sedimentation to remove the majority ofcontaminants. Following sedimentation, source water is filtered to remove remaining contaminants. Thefinal step of treatment is chlorination to disinfect source water prior to distribution. In addition, fluoride isadded to reduce dental caries in children and phosphates are added to reduce elevated levels of copper inthe distribution system.
Susceptibility Determination
As with most surface water systems, Marinette’s source water quality is significantly impacted by localfactors and highly susceptible to contamination. This is due to land usage in the lower portions of thesource water area, proximity of the intakes to the discharge of the Menominee River and Hay Creek and thephysical characteristics of Green Bay. Marinette’s source water is particularly susceptible to syntheticorganic, volatile organic, precursors of treatment by-products and microbial contamination. This is basedon historical occurrences of contaminants in the source water, the high concentration of urban andagricultural areas in the lower portions of the source water area and sites of historical contamination.
Recommendations
Source water protection should begin with the formation of a team composed of local, regional, state andinterstate members to more completely assess impacts to source water and implement best managementpractices to prevent source water contamination. The following is a preliminary list of negative impacts onsource water that could be dealt with in a source water protection program.
• Historic contamination sites as well as spill sites in the lower portions of the source water area.
• Industrial and municipal wastewater dischargers in the source water area.
• Runoff from urban, agricultural and industrial areas in the lower portions of the source water area.
As mentioned previously a comprehensive source water protection plan is beyond the scope of thisassessment. The source water protection team may consider using resources provided by the USEPA athttp://www.epa.gov/safewater/protect/sources.html on the World Wide Web for overall source waterprotection planning. This website offers general source water information, financial assistance contacts,source water protection case studies, contaminant source inventories and contingency planning amongother subjects. For specific information concerning best management practices and dealing with potentialcontaminant sources please visit http://www.epa.gov/ogwdw/protect/swpbull.html on the World WideWeb.
Selected References
- Beletsky, D.; Saylor, J. H.; Schwab, D. J., 1999, Mean Circulation in the Great Lakes, Journal ofGreat Lakes Research.
- Bertrand, G.; Lang, J.; Ross, J., 1976, The Green Bay Watershed: Past/Present/Future.
- The Government of Canada; US Environmental Protection Agency, 1995, The Great Lakes: AnEnvironmental Atlas and Resource Book.
- Hole, F.D., 1980, Soil Guide for Wisconsin Land Lookers, University of Wisconsin-Extension.
- Knuth, D.; Jankowski, S., 1980, Municipal Water Supply Lake Michigan Water Quality Inventory.
- Mason, R.P.; Sullivan, K.A. 1997. Mercury in Lake Michigan. Environmental Science andTechnology.
- Marinette Water Utility employees, 2002, Personal interviews.
- Menominee Water Utility employees, 2002, Personal interviews.

19
- National Oceanic and Atmospheric Agency, Bathymetry of Lake Michigan, available on theWorld Wide Web at http://www.ngdc.noaa.gov/mgg/greatlakes/lakemich_cdrom/start.htm visitedon 8/7/02.
- Skinner, E.L.; Borman, R.G., University of Wisconsin-Extension. Geological and Natural HistorySurvey. 1973. Water Resources of Wisconsin-Lake Michigan Basin. US Geological Survey.
- US Environmental Protection Agency (USEPA), Great Lakes Areas of Concern available on theWorld Wide Web at http://www.epa.gov/grtlakes/aoc/ visited on 8/13/02.
- USEPA, Better Assessment Science Integrating Point and Nonpoint Sources, accessed on theWorld Wide Web at http://www.epa.gov/OST/BASINS/ on 3/13/03.
- WDNR, 2001,The State of the Upper Green Bay River Basin.
- WDNR, 1999, Wisconsin’s Source Water Assessment Program Plan.
- WDNR, 1999, Wisconsin’s Source Water Assessment Program Plan Appendices.


