Source processes of the 2009 Irian Jaya, Indonesia ... Planets Space, 62, 475–481, 2010 Source...
7
Earth Planets Space, 62, 475–481, 2010 Source processes of the 2009 Irian Jaya, Indonesia, earthquake doublet Natalia Poiata, Kazuki Koketsu, and Hiroe Miyake Earthquake Research Institute, University of Tokyo, 1-1-1 Yayoi, Bunkyo-ku, Tokyo 113-0032, Japan (Received April 14, 2009; Revised February 8, 2010; Accepted February 22, 2010; Online published July 9, 2010) On January 3, 2009 UT, an earthquake doublet with moment magnitudes of 7.6 and 7.4 occurred along the New Guinea trench near the northern coast of Irian Jaya, Indonesia. The events were separated by three hours in time and 60 km in space, having similar thrust faulting mechanisms. The Solomon and New Britain Islands regions located east of the source area are well known for the occurrence of earthquake doublets due to the complex tectonic settings. To investigate the source processes of the earthquake doublet, we have performed teleseismic waveform inversions using P-wave displacement records from the IRIS-DMC database. The results of the inversions are consistent with the direction of the subduction along the New Guinea trench for both of the earthquakes. Significant slips exceeding 5.0 m appear near the hypocenters, and the slip distributions look to be complementary to each other. The rupture starting point of the second event is close to the edge of the slip distribution of the first event. Our source models support the triggering mechanism of doublet events suggested by Lay and Kanamori (1980). The results also suggest the state of stress in the Irian Jaya region and the mechanism of earthquakes in this subduction zone. Key words: Earthquake doublet, New Guinea trench, waveform inversion, source process, triggering. 1. Introduction An earthquake doublet occurred on January 3, 2009 UT along the northern coast of Irian Jaya, eastern Indonesia. As the result of this earthquake doublet, five people were killed, several hundred were injured, and around 800 buildings were damaged in the cities located close to the epicentral area (USGS Earthquake Summary Poster, 2009). Accord- ing to the Global Disaster Alert and Coordination System (GDACS), the tsunami generated by this earthquake dou- blet reached a height of 1.8 m in the coast region of Irian Jaya, though no tsunami warning was issued. As reported by USGS, the first event of moment magnitude ( M w ) 7.6, occurred at 19:43:54 UT. Three hours later at 22:33:42 UT, the second event of M w 7.4 took place 60 km east of the first one. The USGS located the epicenters of the events close to the northern coastline of Irian Jaya, which is the western part of the New Guinea Island, and the western- most part of the New Guinea trench (Fig. 1). They are about 400 km west of the M w 8.2 earthquake on February 17, 1996. Around 100 people were killed by this large off- shore earthquake and associated tsunamis. Eastern Indonesia is located inside the region of complex tectonics controlled by the motions of the Eurasia, Aus- tralia, Pacific, Philippine Sea, and numerous small plates (Fig. 1). This area is also known for its high seismic activity with frequent events of magnitude 7 to 8. Within the Irian Jaya region, the Australia plate collides with the oceanic Pacific and Philippine Sea plates at a rate of 110 mm/yr and Copyright c The Society of Geomagnetism and Earth, Planetary and Space Sci- ences (SGEPSS); The Seismological Society of Japan; The Volcanological Society of Japan; The Geodetic Society of Japan; The Japanese Society for Planetary Sci- ences; TERRAPUB. doi:10.5047/eps.2010.02.008 an azimuth of 245 degree (DeMets et al., 1990). GPS mea- surements of crustal deformation (Puntodewo et al., 1994; Bock et al., 2003) and seismic profiling studies (Milsom et al., 1992) show that the convergence between the Australia and Pacific plates in the Irian Jaya region is partially accom- modated by crustal thickening in the onland regions of the Bird’s Head plate. The rest of the convergence between the two plates is accommodated by the southward subduction of the oceanic plate beneath the Bird’s Head plate along the New Guinea and Manokwari trenches (Puntodewo et al., 1994; Bird, 2003). According to the Global CMT Project, the earthquake doublet of January 3, 2009 UT had similar seismic mo- ments and thrust faulting mechanisms that corresponds to the faulting on the plate boundary along the New Guinea trench. These focal mechanisms are consistent with the di- rection of subduction of the oceanic slab beneath the Bird’s Head plate. The New Britain and Solomon Islands regions located east of the Irian Jaya region are also well known for large shallow thrust events ( M w > 7.0) that have ten- dency to occur in closely related pairs (Table 1). These earthquake doublets are represented by the similarly sized events that occur at nearly the same time and location (Lay and Kanamori, 1980; Schwartz et al., 1989; Park and Mori, 2007). Lay and Kanamori (1980) reported that such a dou- blet behavior is a true characteristic of the regions due to the complex tectonic settings. They explained the doublet events as a result of the mechanism of seismic triggering that reflects the state of stress on the fault plane and litho- spheric coupling between the Pacific and Australia plates. The 2009 Irian Jaya earthquake doublet may correspond to the shallow thrust doublets in the New Britain and Solomon Islands regions (Fig. 1). Detailed knowledge of 475
Transcript of Source processes of the 2009 Irian Jaya, Indonesia ... Planets Space, 62, 475–481, 2010 Source...

Earth Planets Space, 62, 475–481, 2010
Source processes of the 2009 Irian Jaya, Indonesia, earthquake doublet
Natalia Poiata, Kazuki Koketsu, and Hiroe Miyake
Earthquake Research Institute, University of Tokyo, 1-1-1 Yayoi, Bunkyo-ku, Tokyo 113-0032, Japan
(Received April 14, 2009; Revised February 8, 2010; Accepted February 22, 2010; Online published July 9, 2010)
On January 3, 2009 UT, an earthquake doublet with moment magnitudes of 7.6 and 7.4 occurred along theNew Guinea trench near the northern coast of Irian Jaya, Indonesia. The events were separated by three hoursin time and 60 km in space, having similar thrust faulting mechanisms. The Solomon and New Britain Islandsregions located east of the source area are well known for the occurrence of earthquake doublets due to thecomplex tectonic settings. To investigate the source processes of the earthquake doublet, we have performedteleseismic waveform inversions using P-wave displacement records from the IRIS-DMC database. The resultsof the inversions are consistent with the direction of the subduction along the New Guinea trench for both of theearthquakes. Significant slips exceeding 5.0 m appear near the hypocenters, and the slip distributions look tobe complementary to each other. The rupture starting point of the second event is close to the edge of the slipdistribution of the first event. Our source models support the triggering mechanism of doublet events suggested byLay and Kanamori (1980). The results also suggest the state of stress in the Irian Jaya region and the mechanismof earthquakes in this subduction zone.Key words: Earthquake doublet, New Guinea trench, waveform inversion, source process, triggering.
1. IntroductionAn earthquake doublet occurred on January 3, 2009 UT
along the northern coast of Irian Jaya, eastern Indonesia. Asthe result of this earthquake doublet, five people were killed,several hundred were injured, and around 800 buildingswere damaged in the cities located close to the epicentralarea (USGS Earthquake Summary Poster, 2009). Accord-ing to the Global Disaster Alert and Coordination System(GDACS), the tsunami generated by this earthquake dou-blet reached a height of 1.8 m in the coast region of IrianJaya, though no tsunami warning was issued. As reportedby USGS, the first event of moment magnitude (Mw) 7.6,occurred at 19:43:54 UT. Three hours later at 22:33:42 UT,the second event of Mw 7.4 took place 60 km east of thefirst one. The USGS located the epicenters of the eventsclose to the northern coastline of Irian Jaya, which is thewestern part of the New Guinea Island, and the western-most part of the New Guinea trench (Fig. 1). They areabout 400 km west of the Mw 8.2 earthquake on February17, 1996. Around 100 people were killed by this large off-shore earthquake and associated tsunamis.
Eastern Indonesia is located inside the region of complextectonics controlled by the motions of the Eurasia, Aus-tralia, Pacific, Philippine Sea, and numerous small plates(Fig. 1). This area is also known for its high seismic activitywith frequent events of magnitude 7 to 8. Within the IrianJaya region, the Australia plate collides with the oceanicPacific and Philippine Sea plates at a rate of 110 mm/yr and
Copyright c© The Society of Geomagnetism and Earth, Planetary and Space Sci-ences (SGEPSS); The Seismological Society of Japan; The Volcanological Societyof Japan; The Geodetic Society of Japan; The Japanese Society for Planetary Sci-ences; TERRAPUB.
doi:10.5047/eps.2010.02.008
an azimuth of 245 degree (DeMets et al., 1990). GPS mea-surements of crustal deformation (Puntodewo et al., 1994;Bock et al., 2003) and seismic profiling studies (Milsom etal., 1992) show that the convergence between the Australiaand Pacific plates in the Irian Jaya region is partially accom-modated by crustal thickening in the onland regions of theBird’s Head plate. The rest of the convergence between thetwo plates is accommodated by the southward subductionof the oceanic plate beneath the Bird’s Head plate along theNew Guinea and Manokwari trenches (Puntodewo et al.,1994; Bird, 2003).
According to the Global CMT Project, the earthquakedoublet of January 3, 2009 UT had similar seismic mo-ments and thrust faulting mechanisms that corresponds tothe faulting on the plate boundary along the New Guineatrench. These focal mechanisms are consistent with the di-rection of subduction of the oceanic slab beneath the Bird’sHead plate. The New Britain and Solomon Islands regionslocated east of the Irian Jaya region are also well knownfor large shallow thrust events (Mw > 7.0) that have ten-dency to occur in closely related pairs (Table 1). Theseearthquake doublets are represented by the similarly sizedevents that occur at nearly the same time and location (Layand Kanamori, 1980; Schwartz et al., 1989; Park and Mori,2007). Lay and Kanamori (1980) reported that such a dou-blet behavior is a true characteristic of the regions due tothe complex tectonic settings. They explained the doubletevents as a result of the mechanism of seismic triggeringthat reflects the state of stress on the fault plane and litho-spheric coupling between the Pacific and Australia plates.
The 2009 Irian Jaya earthquake doublet may correspondto the shallow thrust doublets in the New Britain andSolomon Islands regions (Fig. 1). Detailed knowledge of
475

476 N. POIATA et al.: SOURCE PROCESSES OF THE 2009 IRIAN JAYA EARTHQUAKE DOUBLET
500 km
120˚E 130˚E 140˚E 150˚E
10˚S
0˚
10˚N
PPAAAAPPPCCCCLL
AU
PSPS
AUSTRALIA
A
PAPUAA NEW GUINEA
New
PaacificOcceanea
omonon
Irian JayaaIrian Jaan JayaJaya
New Guinea Trench
MaMaanokw T
Fig. 1. Tectonic features of the Eastern Indonesia and Papua New Guinea after Bird (2003). The stars represent the epicenters of the doublet eventsdiscussed in this study (their detailed information is given in Table 1). Heavy black lines denote the boundaries of the Sunda (SU), Molucca Sea(MS), Banda Sea (BS), Timor (TI), Bird’s Head (BH), Maoke (MO), Australia (AU), Caroline (CL), Woodlark (WU), North Bismarck (NB), Manus(MN), South Bismarck (SB), Solomon Sea (SS), Philippine Sea (PS), and Pacific (PA) plates (after Bird, 2003).
Table 1. Parameters of earthquake doublets in the region. Doublet numbers correspond to Fig. 1. We define the earthquake doublet as being composedof two earthquakes with similar sizes: difference in moment magnitude of the events must be ≤ 0.3.
Doublet no. Event Origin time Latitude Longitude Depth Mw Reference
(UT) (deg) (deg) (km)
1 July 14, 1971 06:11:29 −5.52 153.86 43 8.0 Lay and Kanamori (1980)
July 26, 1971 01:23:21 −4.93 153.18 43 8.1
2 Jan. 31, 1974 23:30:05 −7.50 155.90 16 7.3
Feb. 01, 1974 03:12:33 −7.80 155.60 16 7.4
3 July 20, 1975 14:37:39 −6.60 155.10 43 7.6
July 20, 1975 19:54:27 −7.10 155.20 43 7.3
4 May 17, 1992 09:49:19 7.24 126.64 32 7.1 Global CMT Catalog
May 17, 1992 10:15:30 7.19 126.76 33 7.2
5 Nov. 16, 2000 07:42:16 −5.23 153.10 26 7.5 Park and Mori (2007)
Nov. 16, 2000 21:01:56 −5.49 151.78 36 7.4
6 Jan. 03, 2009 19:43:54 −0.51 132.78 15 7.6 This study
Jan. 03, 2009 22:33:42 −0.71 133.34 12 7.4
the source process and slip distribution of this earthquakedoublet is essential for understanding the state of stress inthe Irian Jaya region. It is also helpful for understandingthe triggering mechanism of earthquakes in a subductionzone. To study the source process and slip distribution, weperformed source inversions using teleseismic body-wavedata.
2. Data and MethodTeleseismic records collected by the Data Management
Center of the Incorporated Research Institute for Seismol-ogy (IRIS-DMC) were used to infer the source processesof the 2009 Irian Jaya earthquake doublet. We retrievedbroadband seismograms from IRIS-DMC for the stations atepicentral distances of 30 to 100 degrees, taking into con-sideration the quality of records and the azimuthal cover-age of the stations. 45 and 44 vertical P-wave components
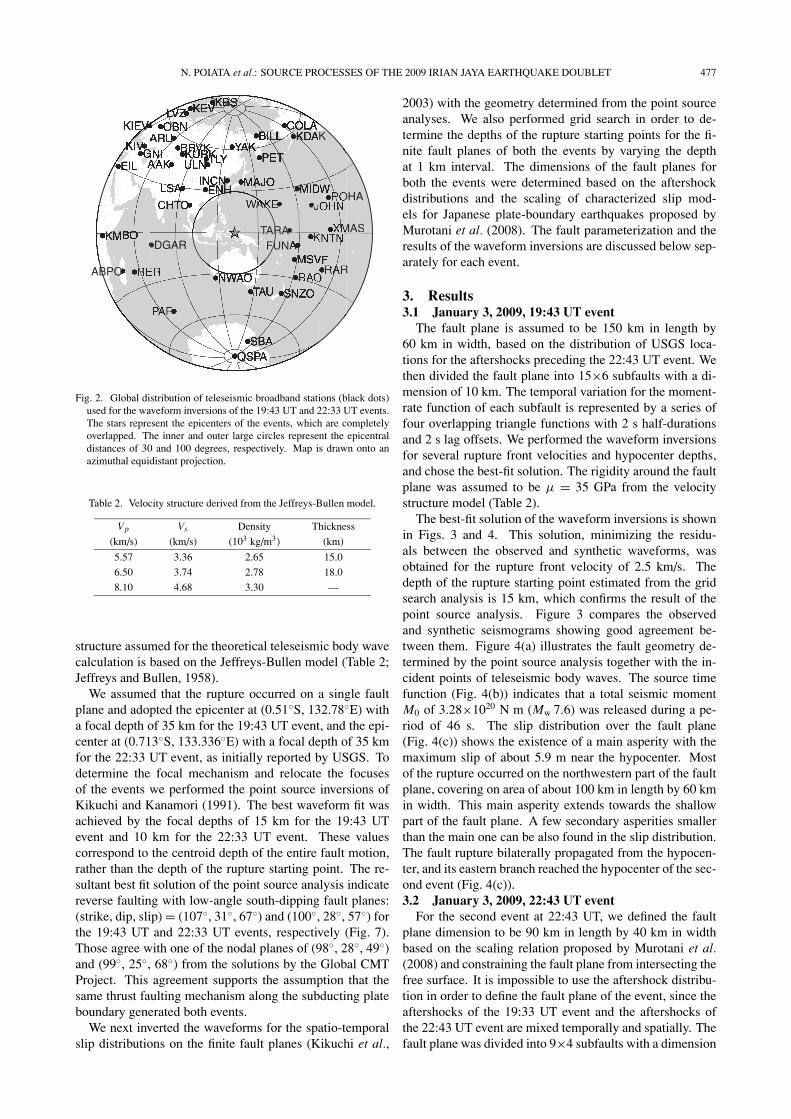
were selected for the 19:43 UT and 22:33 UT events, re-spectively. The global distribution of the selected teleseis-mic stations is shown in Fig. 2. In order to keep similarconditions of analysis, the same stations were used for boththe 19:43 UT and 22:33 UT events, as far as possible. Theonly exception is DGAR station, where no record was avail-able for the 22:33 UT event (Fig. 2). The original velocitywaveforms from the selected stations were windowed for 90or 80 s, starting 20 s before the P-wave arrival, band-passfiltered between 0.005 and 1 Hz, and then converted intoground displacements at a sampling interval of 0.5 s.
To obtain the source processes of the 2009 Irian Jayaearthquake doublet, we analyzed each of the events sepa-rately using the standard fault parameterization and wave-form inversion scheme by Kikuchi and Kanamori (1991)and Kikuchi et al. (2003) with the Green’s functions cal-culated after Kikuchi and Kanamori (1991). The velocity
N. POIATA et al.: SOURCE PROCESSES OF THE 2009 IRIAN JAYA EARTHQUAKE DOUBLET 477
J
R
WAKEAKEE
MAS
OHA
ABPO
DGARA
Fig. 2. Global distribution of teleseismic broadband stations (black dots)used for the waveform inversions of the 19:43 UT and 22:33 UT events.The stars represent the epicenters of the events, which are completelyoverlapped. The inner and outer large circles represent the epicentraldistances of 30 and 100 degrees, respectively. Map is drawn onto anazimuthal equidistant projection.
Table 2. Velocity structure derived from the Jeffreys-Bullen model.
Vp Vs Density Thickness
(km/s) (km/s) (103 kg/m3) (km)
5.57 3.36 2.65 15.0
6.50 3.74 2.78 18.0
8.10 4.68 3.30 —
structure assumed for the theoretical teleseismic body wavecalculation is based on the Jeffreys-Bullen model (Table 2;Jeffreys and Bullen, 1958).
We assumed that the rupture occurred on a single faultplane and adopted the epicenter at (0.51◦S, 132.78◦E) witha focal depth of 35 km for the 19:43 UT event, and the epi-center at (0.713◦S, 133.336◦E) with a focal depth of 35 kmfor the 22:33 UT event, as initially reported by USGS. Todetermine the focal mechanism and relocate the focusesof the events we performed the point source inversions ofKikuchi and Kanamori (1991). The best waveform fit wasachieved by the focal depths of 15 km for the 19:43 UTevent and 10 km for the 22:33 UT event. These valuescorrespond to the centroid depth of the entire fault motion,rather than the depth of the rupture starting point. The re-sultant best fit solution of the point source analysis indicatereverse faulting with low-angle south-dipping fault planes:(strike, dip, slip) = (107◦, 31◦, 67◦) and (100◦, 28◦, 57◦) forthe 19:43 UT and 22:33 UT events, respectively (Fig. 7).Those agree with one of the nodal planes of (98◦, 28◦, 49◦)and (99◦, 25◦, 68◦) from the solutions by the Global CMTProject. This agreement supports the assumption that thesame thrust faulting mechanism along the subducting plateboundary generated both events.
We next inverted the waveforms for the spatio-temporalslip distributions on the finite fault planes (Kikuchi et al.,
2003) with the geometry determined from the point sourceanalyses. We also performed grid search in order to de-termine the depths of the rupture starting points for the fi-nite fault planes of both the events by varying the depthat 1 km interval. The dimensions of the fault planes forboth the events were determined based on the aftershockdistributions and the scaling of characterized slip mod-els for Japanese plate-boundary earthquakes proposed byMurotani et al. (2008). The fault parameterization and theresults of the waveform inversions are discussed below sep-arately for each event.
3. Results3.1 January 3, 2009, 19:43 UT event
The fault plane is assumed to be 150 km in length by60 km in width, based on the distribution of USGS loca-tions for the aftershocks preceding the 22:43 UT event. Wethen divided the fault plane into 15×6 subfaults with a di-mension of 10 km. The temporal variation for the moment-rate function of each subfault is represented by a series offour overlapping triangle functions with 2 s half-durationsand 2 s lag offsets. We performed the waveform inversionsfor several rupture front velocities and hypocenter depths,and chose the best-fit solution. The rigidity around the faultplane was assumed to be µ = 35 GPa from the velocitystructure model (Table 2).
The best-fit solution of the waveform inversions is shownin Figs. 3 and 4. This solution, minimizing the residu-als between the observed and synthetic waveforms, wasobtained for the rupture front velocity of 2.5 km/s. Thedepth of the rupture starting point estimated from the gridsearch analysis is 15 km, which confirms the result of thepoint source analysis. Figure 3 compares the observedand synthetic seismograms showing good agreement be-tween them. Figure 4(a) illustrates the fault geometry de-termined by the point source analysis together with the in-cident points of teleseismic body waves. The source timefunction (Fig. 4(b)) indicates that a total seismic momentM0 of 3.28×10²⁰ N m (Mw 7.6) was released during a pe-riod of 46 s. The slip distribution over the fault plane(Fig. 4(c)) shows the existence of a main asperity with themaximum slip of about 5.9 m near the hypocenter. Mostof the rupture occurred on the northwestern part of the faultplane, covering on area of about 100 km in length by 60 kmin width. This main asperity extends towards the shallowpart of the fault plane. A few secondary asperities smallerthan the main one can be also found in the slip distribution.The fault rupture bilaterally propagated from the hypocen-ter, and its eastern branch reached the hypocenter of the sec-ond event (Fig. 4(c)).3.2 January 3, 2009, 22:43 UT event
For the second event at 22:43 UT, we defined the faultplane dimension to be 90 km in length by 40 km in widthbased on the scaling relation proposed by Murotani et al.(2008) and constraining the fault plane from intersecting thefree surface. It is impossible to use the aftershock distribu-tion in order to define the fault plane of the event, since theaftershocks of the 19:33 UT event and the aftershocks ofthe 22:43 UT event are mixed temporally and spatially. Thefault plane was divided into 9×4 subfaults with a dimension

478 N. POIATA et al.: SOURCE PROCESSES OF THE 2009 IRIAN JAYA EARTHQUAKE DOUBLET
SYNOBS
IU.MAJO. PZaz 7.2
171.34
IU.BILL. PZaz 12.6
94.43
IU.PET. PZaz 18.1
158.36
IU.COLA. PZaz 24.7
85.33
II.KDAK. PZaz 31.2
117.76
IU.MIDW. PZaz 54.7
141.21
IU.WAKE.PZaz 57.3
185.46
IU.POHA.PZaz 69.1
98.08
IU.JOHN. PZaz 70.1
162.39
IU.TARA. PZaz 87.3
187.53
IU.XMAS.PZaz 87.6
151.55
IU.KNTN. PZaz 93.0
168.45
IU.FUNA. PZaz 101.2
146.96
IU.RAR. PZaz 112.6
104.16
II.MSVF. PZaz 113.8
155.23
IU.RAO. PZaz 126.2
162.62
0 30 60 90
Time (s)
IU.SNZO. PZaz 142.6
169.56
II.TAU. PZaz 164.8
231.00
IU.SBA. PZaz 173.1
205.82
IU.QSPA. PZaz 180.0
144.70
IU.NWAO.PZaz 202.8
388.86
G.PAF. PZaz 217.4
316.66
G.RER. PZaz 248.4
241.74
II.ABPO. PZaz 251.0
177.88
II.DGAR. PZaz 261.8
294.73
IU.KMBO.PZaz 268.8
81.30
GE.EIL. PZaz 299.8
226.55
IU.CHTO. PZaz 302.0
240.67
IU.GNI. PZaz 310.2
121.26
IC.LSA. PZaz 311.0
220.19
II.KIV. PZaz 314.0
85.11
II.AAK. PZaz 317.4
173.37
IU.KIEV. PZaz 321.4
30.70
II.OBN. PZaz 325.2
49.75
IC.ENH. PZaz 326.3
144.89
II.BRVK. PZaz 326.4
175.58
II.KURK. PZaz 326.6
167.33
II.ARU. PZaz 327.5
149.85
II.LVZ. PZaz 338.1
47.88
IU.ULN. PZaz 338.7
169.22
0 30 60 90
Time (s)
0 30 60 90
Time (s)
0 30 60 90
Time (s)
II.TLY. PZaz 339.1
148.59
IU.KEV. PZaz 340.4
33.76
IU.KBS. PZaz 350.4
36.36
IU.INCN. PZaz 352.1
174.36
IU.YAK. PZaz 358.4
138.33
Fig. 3. Comparison of the observed (solid black lines) and synthetic (gray lines) displacement waveforms for the best-fit solution of the 19:43 UT event.The number above the station code indicates the maximum amplitude in micro-meter and the number below the station code is a source-to-stationazimuth.
Fig. 4. Result of the teleseismic waveform inversion for the 19:43 UT event. (a) focal mechanism solution, (b) moment-rate function, and (c) slipdistribution plotted at contour intervals of 0.5 m. The white and the black stars indicate the hypocenters (rupture starting points) of the 19:43 UT and22:33 UT events, respectively. The arrows denote slip vectors of the hanging wall relative to the footwall.
of 10 km. As for the 19:33 UT event, the moment-rate func-tion of each subfault was decomposed into a series of fourtriangle functions with 2 s half-durations and 2 s lag offsets.The inversion method and assumed rigidity were the sameas in the case of the 19:33 UT event.
The comparison of the observed and synthetic waveforms
is given in Fig. 5 and the best-fit model is shown in Fig. 6.The seismic moment M0 is estimated to be 1.53×10²⁰ N m(Mw 7.4). The source time function (Fig. 6(b)) suggests thetotal rupture time to be about 25 s. The depth of the rupturestarting point is found to be 12 km. The slip distributionover the fault plane (Fig. 6(c)) shows a single asperity with

N. POIATA et al.: SOURCE PROCESSES OF THE 2009 IRIAN JAYA EARTHQUAKE DOUBLET 479
SYNOBS
IU.MAJO. PZaz 6.5
137.12
IU.BILL. PZaz 12.4
114.06
IU.PET. PZaz 17.7
160.18
IU.COLA. PZaz 24.7
95.03
II.KDAK. PZaz 31.2
141.21
IU.MIDW. PZaz 54.3
181.71
IU.WAKE.PZaz 56.8
181.35
IU.POHA.PZaz 69.0
145.25
IU.JOHN. PZaz 69.9
192.11
IU.TARA. PZaz 87.0
212.00
IU.XMAS.PZaz 87.6
161.77
IU.KNTN. PZaz 92.9
194.96
IU.FUNA. PZaz 101.1
160.09
IU.RAR. PZaz 112.6
115.76
II.MSVF. PZaz 113.8
164.39
IU.RAO. PZaz 126.3
154.98
IU.SNZO. PZaz 142.7
148.95
II.TAU. PZaz 165.2
180.74
IU.SBA. PZaz 173.2
158.34
IU.QSPA. PZaz 180.0
112.93
IU.NWAO.PZaz 203.5
236.24
G.PAF. PZaz 217.6
184.22
G.RER. PZaz 248.5
138.04
II.ABPO. PZaz 251.0
104.21
IU.KMBO.PZaz 268.8
41.16
GE.EIL. PZaz 299.8
150.48
IU.CHTO. PZaz 301.9
130.91
IU.GNI. PZaz 310.2
64.47
IC.LSA. PZaz 310.8
141.94
II.KIV. PZaz 314.0
57.14
II.AAK. PZaz 317.3
126.39
IU.KIEV. PZaz 321.5
27.93
II.OBN. PZaz 325.3
45.21
IC.ENH. PZaz 325.9
108.15
II.BRVK. PZaz 326.3
127.07
II.KURK. PZaz 326.4
132.11
II.ARU. PZaz 327.4
103.13
II.LVZ. PZaz 338.1
32.87
IU.ULN. PZaz 338.4
148.06
II.TLY. PZaz 338.8
145.27
0 20 40 60 80
Time(sec)
0 20 40 60 80
Time(sec)
0 20 40 60 80
Time(sec)
0 20 40 60 80
Time(sec)
IU.KEV. PZaz 340.5
40.02
IU.KBS. PZaz 350.5
40.52
IU.INCN. PZaz 351.5
142.85
IU.YAK. PZaz 358.1
134.32
Fig. 5. Comparison of the observed (solid black lines) and synthetic (gray lines) displacement waveforms for the best-fit solution of the 22:33 UT event.The number above the station code indicates the maximum amplitude in micro-meter and the number below the station code is a source-to-stationazimuth.
Fig. 6. Result of the teleseismic waveform inversion for the 22:33 UT event. (a) focal mechanism solution, (b) moment-rate function, and (c) slipdistribution plotted at contour intervals of 0.5 m. The star indicates the hypocenter (rupture starting point), and the arrows denote slip vectors of thehanging wall relative to the footwall.
the maximum slip of 5.6 m near the hypocenter, and the rup-ture extended towards the shallow part of the fault, similarlyto the 19:33 UT event. The best solution for the rupture ve-locity was found to be 2.8 km/s. It can be observed that thetotal asperity area of this event is smaller than that for the19:33 UT event.
4. Discussion and ConclusionsFigure 7 shows the horizontal projections of the rupture
areas and slip distributions of the 2009 Irian Jaya earth-quake doublet determined by the teleseismic waveform in-
versions. The rupture areas are consistent with the after-shock distribution and the scaling relation by Murotani etal. (2008). The doublet events have almost the same focalmechanism and similar seismic moments of 3.28×10²⁰ N mand 1.53×10²⁰ N m. The focal mechanisms agree with thesouthward underthrusting of the Pacific Sea plate beneaththe Bird’s Head plate along the New Guinea trench, sug-gesting that the doublet occurred on the boundary of thesetwo plates. According to the slip distributions of both theevents (Figs. 4, 6, and 7), significant slips exceeding 5.0 moccurred near the hypocenters. The slip distributions of the

480 N. POIATA et al.: SOURCE PROCESSES OF THE 2009 IRIAN JAYA EARTHQUAKE DOUBLET
100 km
Mw 7.6 depth=15 km Mw 7.4 depth=12 km
BH
CL
PS
Fig. 7. Projections of the slip distributions for the 2009 Irian Jaya earthquake doublet onto the tectonic map (green: 19:43 UT event, blue: 22:33 UTevent). The contour interval is 1.0 m; the first contour given is 0.5 m. The red stars represent the USGS epicenter locations. The aftershocks of boththe events determined by USGS within a month after the events are plotted by gray open circles. The focal mechanisms obtained in the present studyare also shown with the moment magnitudes and focal depths.
earthquakes look to be complementary to each other. Therupture starting point (hypocenter) of the 22:43 UT event islocated close to the eastern margin of the slip distribution ofthe 19:33 UT event. If we define an asperity to be a zone ofslip larger than half of the maximum slip (Yamanaka andKikuchi, 2004), it can be seen that both the events havecompact asperities around the hypocenters. The asperitiesare well separated one from the other and much smaller thanthe whole rupture areas. The teleseismic waveforms gen-erated by such asperities are rather simple and impulsive(Figs. 3 and 5).
The source characteristics of the 2009 Irian Jaya earth-quake doublet are very similar to the Solomon Islandsdoublets (Fig. 1 and Table 1), as described by Lay andKanamori (1980) and Park and Mori (2007). Lay andKanamori (1980) first noted that large shallow earthquakesin the Solomon Islands and New Britain Islands regionstend to occur in closely related pairs. Events are typi-cally separated by a few hours or several days in time and50∼100 km in space. This behavior has been attributed toa specific pattern of plate boundary heterogeneity consist-ing of small strong asperities spaced close together. Therupture of one asperity induces high, rapidly accumulatedstress concentration in adjacent areas and can generate thesecond similar event. We expect the same triggering mech-anism to be responsible for the doublet events of the Jan-uary 3, 2009 in Irian Jaya. The distinct nature of this be-havior can be attributed to the complex tectonic configu-ration of the area and implies the existence of localizedstrong coupling between the lithospheric plates along theNew Guinea trench. However, it has to be noticed that eventhough the asperities of the doublet events of the January 3,2009 from Irian Jaya are well separated one from the other,there exist a significant overlap in the rupture areas of thefirst and second events. This may indicate that the actualmechanism of doublet triggering for these events is more
complex than the one for the well separated earthquakesin the Solomon Islands and New Britain Islands (Lay andKanamori, 1980). We would also point out that the numberof large earthquake doublets (Mw > 7.0) in the Irian Jayaregion is much smaller than in the Solomon Islands region.This can be explained by lower seismicity along the NewGuinea trench. The result of the GPS studies (Puntodewo etal., 1994; Bock et al., 2003) also explain the small numberof large earthquake doublets by suggesting that the subduc-tion along the New Guinea trench only partially accommo-dates the oblique convergence between the Pacific and Aus-tralia plates. The rest of the convergence is accommodatedby crustal thickening in the inland part of the Bird’s Headplate. This fact represents a significant difference betweenthe Solomon Sea plate and the Bird’s Head plate.
Acknowledgments. We acknowledge two anonymous reviewersfor improvement of the manuscript, and Satoshi Kaneshima forediting. We thank the Data Management Center of the Incorpo-rated Research Institute for Seismology and the United States Ge-ological Survey for the teleseismic body wave data, and the GlobalCMT Project for their information on the events. Some figureswere made using the Generic Mapping Tools software (Wessel andSmith, 1995). This research was partly supported by SATREPSfrom JST and JICA.
ReferencesBird, P., An updated digital model of plate boundaries, Geochem. Geophys.
Geosyst., 4, 1027–1080, 2003.Bock, Y., L. Prawirodirdjo, J. F. Genrich, C. W. Stevens, R. McCaffrey, C.
Subarya, S. S. O. Puntodewo, and E. Calais, Crustal motion in Indone-sia from Global Positioning System measurements, J. Geophys. Res.,108(B8), 2367, doi:10.1029/2001JB000324, 2003.
DeMets, C., R. G. Gordon, D. F. Agrus, and S. Stein, Current plate motion,Geophys. J. Int., 101, 425–478, 1990.
Global Centroid Moment Tensor Catalog, http://www.globalcmt.org/,2009.
Global Disaster and Coordination System (GDACS), Tsunami report,http://gdacs.org, 2009.
Jeffreys, H. and K. E. Bullen, Seismological Tables, 50 pp., British Asso-

N. POIATA et al.: SOURCE PROCESSES OF THE 2009 IRIAN JAYA EARTHQUAKE DOUBLET 481
ciation for the Advancement of Science, London, 1958.Kikuchi, M. and H. Kanamori, Inversion of complex body wave—III, Bull.
Seismol. Soc. Am., 81, 2335–2350, 1991.Kikuchi, M., M. Nakamura, and K. Yoshikawa, Source rupture process of
the 1944 Tonankai earthquake and the 1945 Mikawa earthquake derivedfrom low-gain seismograms, Earth Planets Space, 55, 159–172, 2003.
Lay, T. and H. Kanamori, Earthquake doublets in the Solomon Islands,Phys. Earth Planet. Inter., 21, 283–304, 1980.
Milsom, J., D. Masson, G. Nichols, N. Sikumbang, B. Dwiyanto, L. Par-son, and H. Kallagher, The Manokwari trough and the west end of theNew Guinea trench, Tectonics, 11, 145–153, 1992.
Murotani, S., H. Miyake, and K. Koketsu, Scaling of characterized slipmodels for plate-boundary earthquakes, Earth Planets Space, 60, 987–991, 2008.
Park, S.-C. and J. Mori, Are asperity patterns persistent? Implication fromlarge earthquakes in Papua New Guinea, J. Geophys. Res., 112, B03303,doi:10.1029/2006JB004481, 2007.
Puntodewo, S. S. O., R. McCaffrey, E. Calais, Y. Bock, J. Rais, C. Sub-
arya, R. Poewariardi, C. Stevens, J. Genrich, Fauzi, P. Zwick, andS. Wdowinski, GPS measurements of crustal deformation within thePacific-Australia plate boundary zone in Irian Jaya, Indonesia, Tectono-physics, 237, 141–153, 1994.
Schwartz, S. Y., T. Lay, and L. J. Ruff, Source process of the great 1971Solomon Islands doublet, Phys. Earth Planet. Inter., 56, 294–310, 1989.
United States Geological Survey, Earthquake SummaryPoster, http://earthquake.usgs.gov/eqcenter/eqarchives/poster/2009/20090103.php, 2009.
Wessel, P. and W. H. F. Smith, New version of the Generic Mapping Toolsreleased, EOS Trans. AGU, 76, 329, 1995.
Yamanaka, Y. and M. Kikuchi, Asperity map along the subduction zonein northeastern Japan inferred from regional seismic data, J. Geophys.Res., 109, B07307, doi:10.1029/2003JB002683, 2004.
N. Poiata (e-mail: [email protected]), K. Koketsu, and H.Miyake