Source: Placecast Harris Poll: The Alert, Shopper II, July 2010
15
03/22/22 1 Source: Placecast Harris Poll: The Alert, Shopper II, July 2010 It’s the economy Families with young children tend to have increased promotional usage most – digital usage as common as traditional. Base: Those who have done more of the following in the past year: Mobile Marketing Q2 Report Mobile Couponing 2011 HAS CHILD IN HOUSEHOLD TOTAL HAS CHILD UNDER SIX 40% 40% 38% 33% 36% 36% 16% 36% 35% 33% 28% 28% 26% 12% 30% 28% 28% 24% 28% 21% 8% Looked for promotion codes/discounts when shopping online Clipped and redeemed coupons from an insert in a newspaper Clipped and redeemed coupons that arrived at my home (via postal mail or fliers) Redeemed promotional/discount offers received via email from a retailer Subscribed to receive promotional/ discount offers via email froma retailer Signed up to receive coupons online (i.e., from Groupon, DealOn) Signed up to receive text alerts from retailers/merchants
-
Upload
pascale-frank -
Category
Documents
-
view
23 -
download
1
description
HAS CHILD IN HOUSEHOLD. TOTAL. HAS CHILD UNDER SIX. Looked for promotion codes/discounts when shopping online. Clipped and redeemed coupons from an insert in a newspaper. Clipped and redeemed coupons that arrived at my home (via postal mail or fliers). - PowerPoint PPT Presentation
Transcript of Source: Placecast Harris Poll: The Alert, Shopper II, July 2010

04/19/23 1Source: Placecast Harris Poll: The Alert, Shopper II, July 2010
It’s the economyFamilies with young children tend to have increased promotional usage most – digital usage as common as traditional. Base: Those who have done more of the following in the past year:
Mobile Marketing Q2 ReportMobile Couponing 2011
HAS CHILD IN HOUSEHOLD
TOTAL
HAS CHILD UNDER SIX
40%
40%
38%
33%
36%
36%
16%
36%
35%
33%
28%
28%
26%
12%
30%
28%
28%
24%
28%
21%
8%
Looked for promotion codes/discounts
when shopping onlineClipped and redeemed coupons from
an insert in a newspaperClipped and redeemed coupons that arrived at my home (via postal mail
or fliers)Redeemed promotional/discount offers received via email from a
retailerSubscribed to receive promotional/
discount offers via email froma retailer
Signed up to receive coupons online(i.e., from Groupon, DealOn)
Signed up to receive text alerts from retailers/merchants

04/19/23 2Based on survey data and projections. Source: Nielsen
Smartphones will be a majority in the U.S. by Q2 2012 Consumers are armed with in-store portable computers/potential coupon delivery devices. Projected smartphone penetration:
FEATURE PHONE
SMARTPHONE
Mobile Marketing Q2 ReportMobile Couponing 2011
Projected
34%
41%45%
50%55%
61%
69%66%
59%
50%45%
39%37%
28%25%
21%17%16%
10%
22%
14%13%
19%
31%
63%
72%
81%84%
87%90%
86%
75%
83%79% 78%
55%
Q22008
Q32008
Q42008
Q12009
Q22009
Q32009
Q42009
Q12010
Q22010
Q32010
Q42010
Q12011
Q22011
Q32011
Q42011
Q12012
Q22012
Q32012

04/19/23 3Note: Location based services here refers to using anything from GPS on a phone to weather and entertainment info that are plotted to location – not specifically a “check in” service. Source: Nielsen
Mobile media activities that relate to couponing have reached critical mass: SMS/MMS, email, apps, LBS
Mobile Marketing Q2 ReportMobile Couponing 2011
U.S. mobile media usage (past 30 days), Q4 2010; Yellow boxes note number of users for each activity.
66%
39%36%
31%
23% 22%18%20%
14%8%
15%
7%
61%
80%
62%
40%
50%
60%
32%
77%
86%
TextMessaging/SMS
Picture Messaging Mobile Internet Email App Downloads Text Alerts Location-BasedServices
FEATURE PHONE OWNERS
SMARTPHONE OWNERS
ALL SUBSCRIBERS
152.3 M 90.8 M 83.2 M 71.8 M 52.4 M 50.0 M 42.3 M

04/19/23 4
Smartphone owners are using apps for shopping and couponingApplications used on smartphones while shopping*:
Mobile Marketing Q2 ReportMobile Couponing 2011
*Base: those who have used a smartphone app/web browser while shopping. Q: Which of the following smartphone apps have you used in store when deciding to make a purchase or comparing products/services? Check all that apply.
Source: Chadwick Martin Bailey, Consumer Pulse, March 2011
44%
38%
31%
26%
22%
13%
Scanner apps (i.e., Scan & Shop, Red Laser, Barcode Scanner)
Discount apps (i.e., Groupon, LivingSocial)
Expert/customer reviews apps (i.e., Consumer Reports)
Store-branded apps
Product comparison apps
Geo-location apps (i.e., Foursquare, Shopkick, GeoPlum)

04/19/23 5Source: comScore Survey, January 2011
Nearly half of smartphone owners are finding store locations while 30% access Daily Deal apps Q: For which of the following have you used your smartphone? Percent of smartphone owners:
Mobile Marketing Q2 ReportMobile Couponing 2011
44%
40%
30%
30%
30%
28%
26%
21%
11%
4%
49%
46%
Finding nearby stores
Comparing prices before shopping for an item
Researching product detailsComparing prices while shopping for
an item in person at a store
Accessing deal of the day apps
Searching for product reviews/recommendations from a website
Mobile barcode scanning to compare prices
Purchasing an item online
Searching for product reviews/recommendations
via a social networking site or appSharing product recommendations via email
Sharing product recommendations via a social networking site or app
None of the above
29% of ‘deal of the day’ app users use their phones to access deals every day
70% of these consumers compare prices at least a couple times a month

04/19/23 6Source: Babycenter 21st Century Mobile Mom Report, March 2011
Mobile moms love those coupons…along with Groupon and retailer apps…she’s even barcode scanning in her spare timeTypes of apps used by moms when shopping with a smartphone:
Mobile Marketing Q2 ReportMobile Couponing 2011
52%
49%
42%
39%
37%
34%
22%
10%
Retailer apps (Walmart, Amazon, etc.)
Deal sites (Groupon, etc.)
Barcode scanners
Product reviews
Coupon apps
Price comparison
Location-based application for deals nearby
Photo recognition of products
Of those that shop with their smartphones, 37% are using coupon apps

04/19/23 7Source: Insight Express Digital Consumer Portrait, Q1 2011
Mobile users are starting to use mobile couponsNotice the increase in activity among smartphone users. Q: Which of these have you ever done?
Mobile Marketing Q2 ReportMobile Couponing 2011
Total Regular Phone Smartphone
Number of respondents 958 597 400
Shown an email coupon to a clerk using your mobile phone
12.0% 5.0% 26.0%
Used a coupon you received in a text message 14.0% 6.0% 28.0%
Used a coupon you found in a mobile application 11.0% 3.0% 23.0%
Put your store cards (loyalty or shopper cards) on your mobile phone so you don’t have to carry them
8.0% 3.0% 18.0%
Used an app that gave you loyalty points or rewards based on you entering or checking into retail locations
9.0% 3.0% 20.0%
Downloaded a coupon to print later 13.0% 6.0% 26.0%
Downloaded coupon to store loyalty card 8.0% 4.0% 15.0%
None of the above 72.0% 87.0% 47.0%
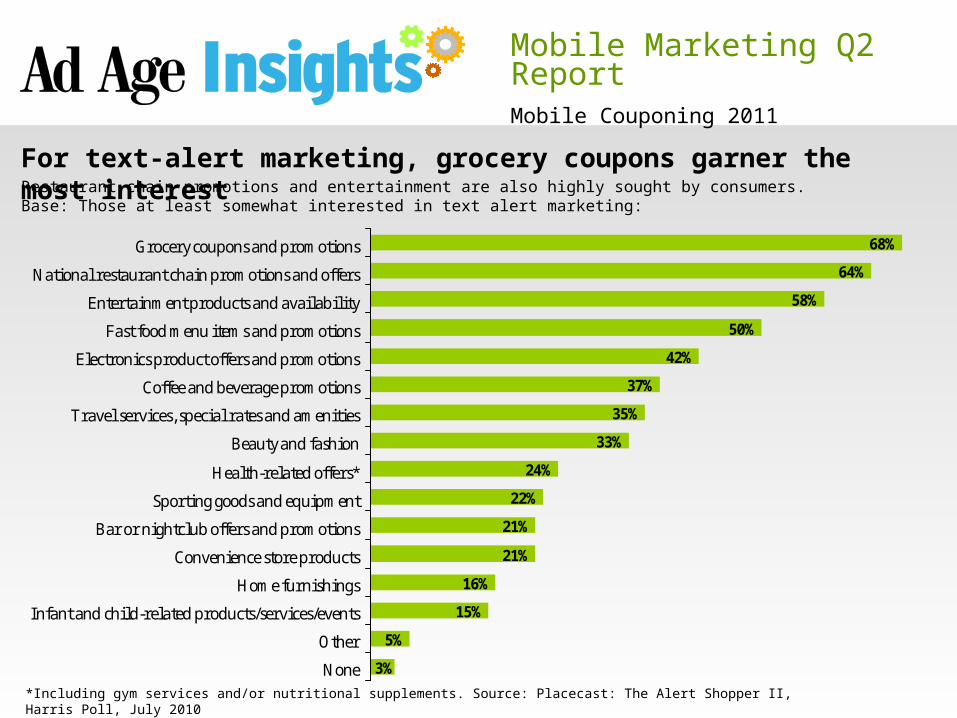
04/19/23 8*Including gym services and/or nutritional supplements. Source: Placecast: The Alert Shopper II, Harris Poll, July 2010
For text-alert marketing, grocery coupons garner the most interestRestaurant chain promotions and entertainment are also highly sought by consumers. Base: Those at least somewhat interested in text alert marketing:
Mobile Marketing Q2 ReportMobile Couponing 2011
68%
64%
58%
50%
42%
37%
35%
33%
24%
22%
21%
21%
16%
15%
5%
3%
Grocery coupons and promotions
National restaurant chain promotions and offers
Entertainment products and availability
Fast food menu items and promotions
Electronics product offers and promotions
Coffee and beverage promotions
Travel services, special rates and amenities
Beauty and fashion
Health-related offers*
Sporting goods and equipment
Bar or nightclub offers and promotions
Convenience store products
Home furnishings
Infant and child-related products/services/events
Other
None
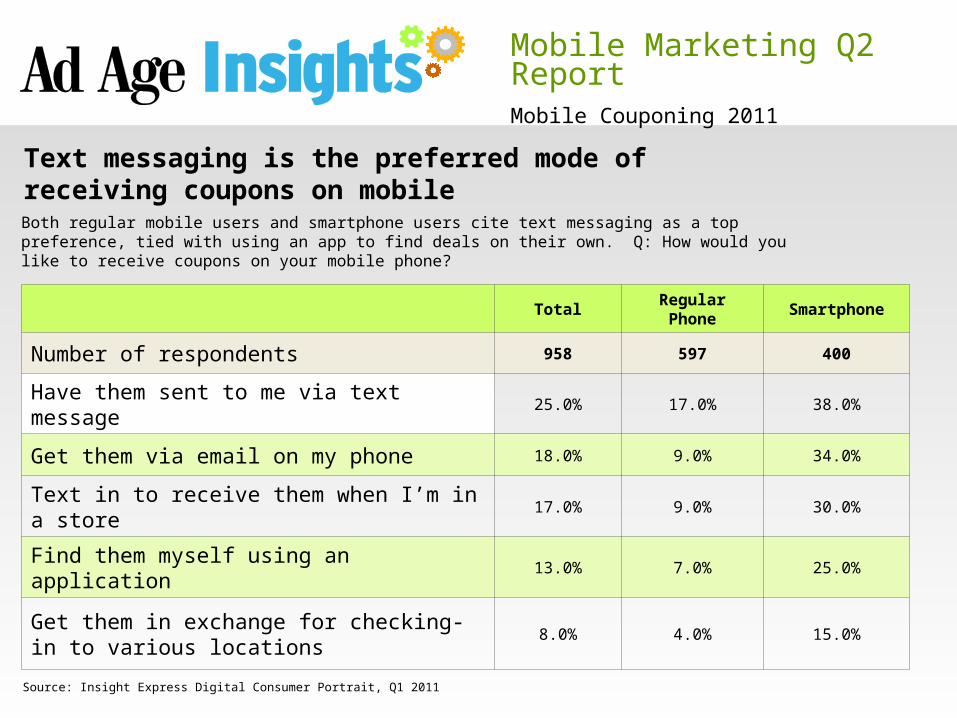
04/19/23 9Source: Insight Express Digital Consumer Portrait, Q1 2011
Text messaging is the preferred mode of receiving coupons on mobileBoth regular mobile users and smartphone users cite text messaging as a top preference, tied with using an app to find deals on their own. Q: How would you like to receive coupons on your mobile phone?
Total Regular Phone Smartphone
Number of respondents 958 597 400
Have them sent to me via text message 25.0% 17.0% 38.0%
Get them via email on my phone 18.0% 9.0% 34.0%
Text in to receive them when I’m in a store
17.0% 9.0% 30.0%
Find them myself using an application 13.0% 7.0% 25.0%
Get them in exchange for checking-in to various locations
8.0% 4.0% 15.0%
Mobile Marketing Q2 ReportMobile Couponing 2011

04/19/23 10Source: Cellfire/Market Dynamics survey of Cellfire users, February 2011
Cellfire mobile users are incremental couponersQ: How often do you use regular “paper” coupons (e.g. from the mail, newspaper, printable)?
26%
28%
30%
14%
3%
53%
28%
13%
5%
1%
5-Always
4-Usually
3-Sometimes
2-Rarely
1-Not at all
TRADITIONAL MEMBERS
MOBILE APP MEMBERS
Mobile Marketing Q2 ReportMobile Couponing 2011

04/19/23 11Source: Cellfire/Market Dynamics survey of Cellfire users, February 2011; No users ranked any responses as ‘1’
Cellfire mobile users cite convenience and environmental friendliness as top factors for usageQ: Compared to other grocery coupons (e.g., from the mail, newspaper, printable, etc.), how would you rate Cellfire coupons on the following factors from 1-5, with 5 being the highest*?
85%
78%
77%
72%
40%
32%
29%
20%
11%
17%
18%
15%
36%
25%
28%
4%
4%
6%
8%
36%
26%
31%
27%
18%
3%
6%
10%
18%
Friendly to the environment
Convenience
Ease of use
Time at checkout
Other
Savings
Trial of new brands
Selection of grocery offers
5-HIGHEST 4 3 2
Mobile Marketing Q2 ReportMobile Couponing 2011
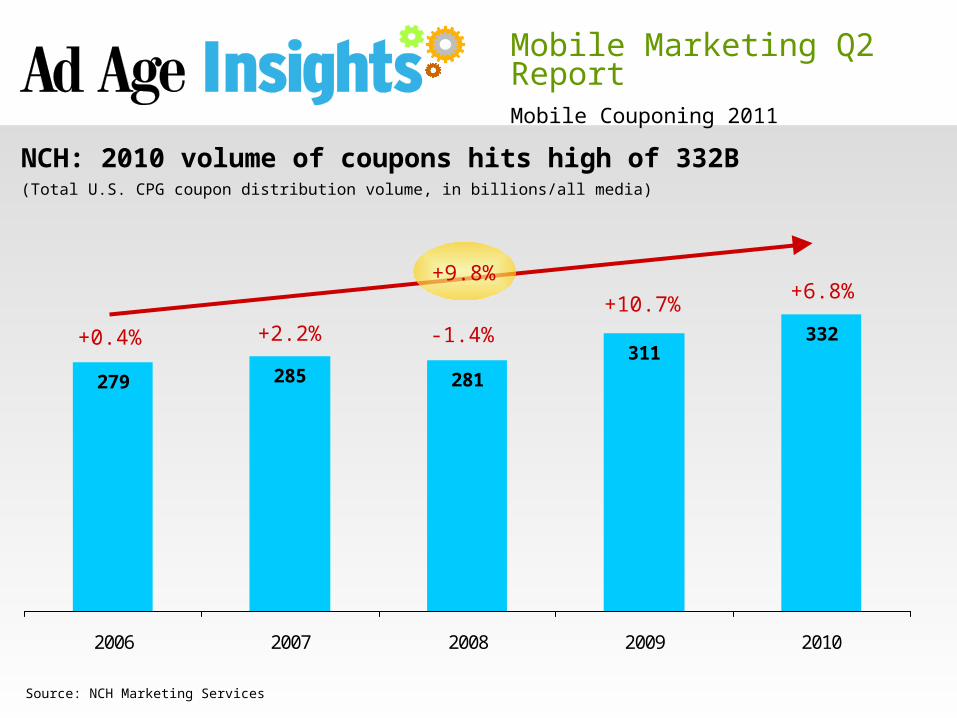
04/19/23 12Source: NCH Marketing Services
NCH: 2010 volume of coupons hits high of 332B(Total U.S. CPG coupon distribution volume, in billions/all media)
279 285 281
311332
2006 2007 2008 2009 2010
+0.4% +2.2% -1.4%+10.7%
+6.8%+9.8%
Mobile Marketing Q2 ReportMobile Couponing 2011
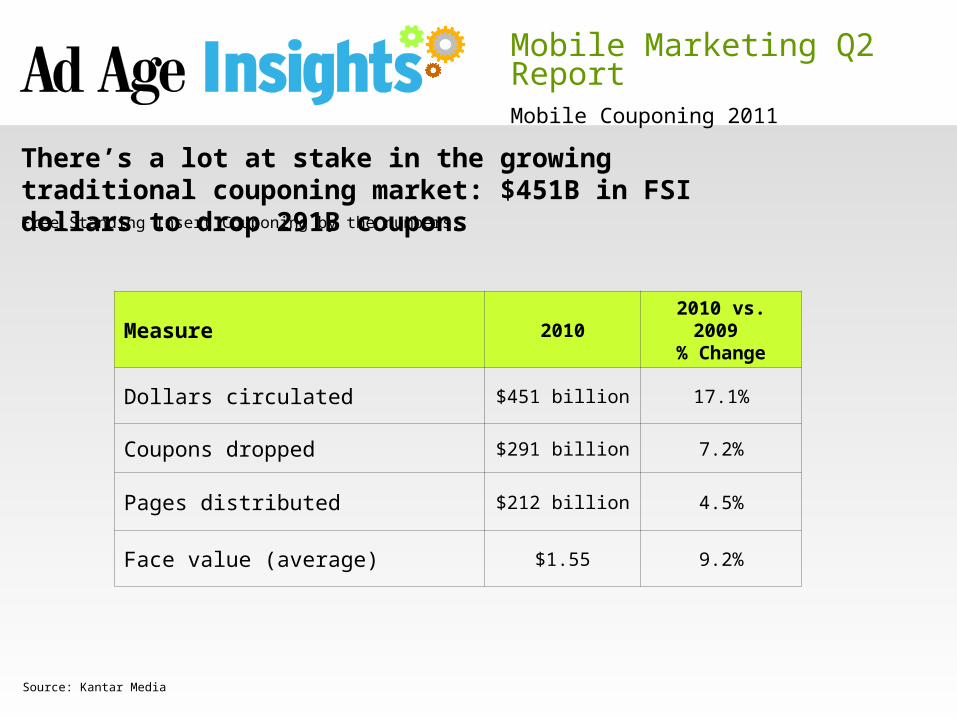
04/19/23 13Source: Kantar Media
There’s a lot at stake in the growing traditional couponing market: $451B in FSI dollars to drop 291B couponsFree Standing Insert Couponing by the numbers:
Measure 20102010 vs. 2009
% Change
Dollars circulated $451 billion 17.1%
Coupons dropped $291 billion 7.2%
Pages distributed $212 billion 4.5%
Face value (average) $1.55 9.2%
Mobile Marketing Q2 ReportMobile Couponing 2011
04/19/23 14
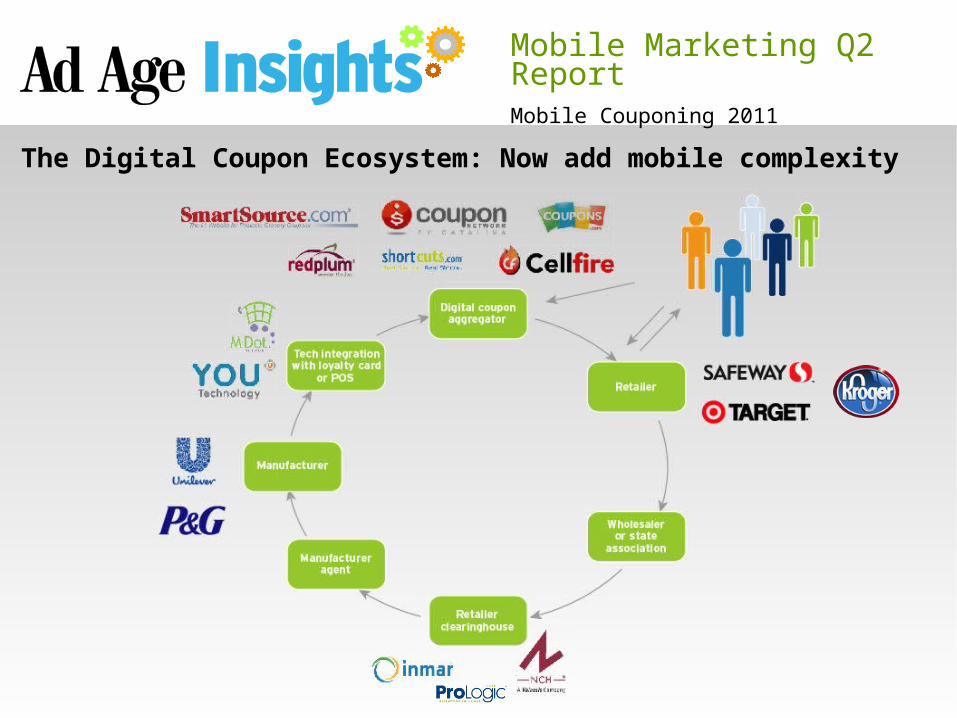
The Digital Coupon Ecosystem: Now add mobile complexity
Mobile Marketing Q2 ReportMobile Couponing 2011

04/19/23 15Source: Pew September 2010
For marketers looking to deploy coupons through LBS there are some reach challenges. When will they get to the crucial 40M user mark?% of U.S. population
Mobile Marketing Q2 ReportMobile Couponing 2011
4% Use LBS
24% use apps
35% have apps
71% use SMS
82% use cell phones Company Downloads
(Global)80/20 Rule (Active Users)
Foursquare 7,500,000 1,5000,000
Loopt 4,000,000 800,000
Booyah My Town
4,000,000 800,000
Waze 2,300,000 440,000
SCVGR 1,000,000 200,000
Gowalla 750,000 150,000
Source: Company reports as of 4/11;*Estimate based on typical active user base of any web-based media