SoundPro Quick Start Guide · PDF fileSoundPro Quick Start Guide. 11 ... Allow the measurement...
6
3M Personal Safety Division 3M TM SoundPro SE/DL Series Sound Level Meters SoundPro Quick Start Guide
Transcript of SoundPro Quick Start Guide · PDF fileSoundPro Quick Start Guide. 11 ... Allow the measurement...

3M Personal Safety Division3MTM SoundPro SE/DL Series Sound Level Meters
SoundPro Quick Start Guide

1. To turn on the SoundPro, press the key until the start screen appears.
2. To navigate, press the up/down arrows and left/right arrows for most of the navigational functions.
The key is used to move back one level (or escape from a menu/screen). Press repeatedly to return to the start screen. \
The key is used to open the selected menu/screen.
1. Format the card or delete the session files from the SoundPro (optional). To format, select the File softkey from the start screen. Press the down arrow continuously to select Format. Press key.
1. Adjust the settings to fit the specifications of your sound study. To open the Setup menu from the start screen, press the arrow keys and press key when selected. The setup
menu will appear. To change the parameters, navigate to the appropriate menus and make changes as needed. (See the user manual for specific details and term explanations for more information.)
1. Display
8. Softkeys
12. On/Off and Esc (Escape) key
2. Backlight key
9. AltF key
6. Run/Pause key
Indicators
Battery power:
Stop:
Run time: 00:00:00
<SLM> CAL FILE COMM
5. Up/Down arrow keys
7. “Softkey” Menu: Correspond with softkeys
3. Stop key
11. Right arrow key
4. Left arrow key 10. Enter key
Softkey menu
Measurement type
Repeatedly press 1st softkey
to toggle through to select 1/1, 1/3, SLM (if purchased)
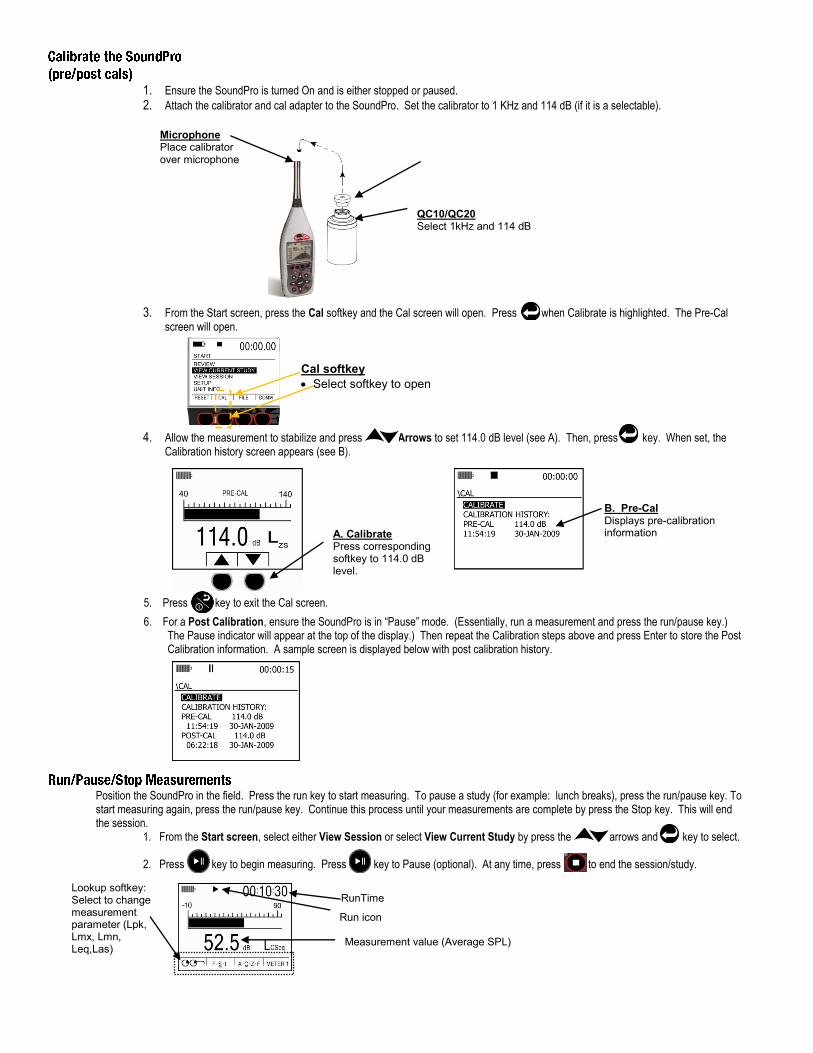
1. Ensure the SoundPro is turned On and is either stopped or paused.
2. Attach the calibrator and cal adapter to the SoundPro. Set the calibrator to 1 KHz and 114 dB (if it is a selectable).
3. From the Start screen, press the Cal softkey and the Cal screen will open. Press when Calibrate is highlighted. The Pre-Cal screen will open.
4. Allow the measurement to stabilize and press Arrows to set 114.0 dB level (see A). Then, press key. When set, the Calibration history screen appears (see B).
5. Press key to exit the Cal screen.
6. For a Post Calibration, ensure the SoundPro is in “Pause” mode. (Essentially, run a measurement and press the run/pause key.) The Pause indicator will appear at the top of the display.) Then repeat the Calibration steps above and press Enter to store the Post Calibration information. A sample screen is displayed below with post calibration history.
Position the SoundPro in the field. Press the run key to start measuring. To pause a study (for example: lunch breaks), press the run/pause key. To start measuring again, press the run/pause key. Continue this process until your measurements are complete by press the Stop key. This will end the session.
1. From the Start screen, select either View Session or select View Current Study by press the arrows and key to select. 2. Press key to begin measuring. Press key to Pause (optional). At any time, press to end the session/study.
QC10/QC20 Select 1kHz and 114 dB
Microphone Place calibrator over microphone
A. Calibrate Press corresponding softkey to 114.0 dB level.
Cal softkey
Select softkey to open
B. Pre-Cal Displays pre-calibration information
RunTime
Run icon
Lookup softkey: Select to change measurement parameter (Lpk, Lmx, Lmn, Leq,Las)
Measurement value (Average SPL)
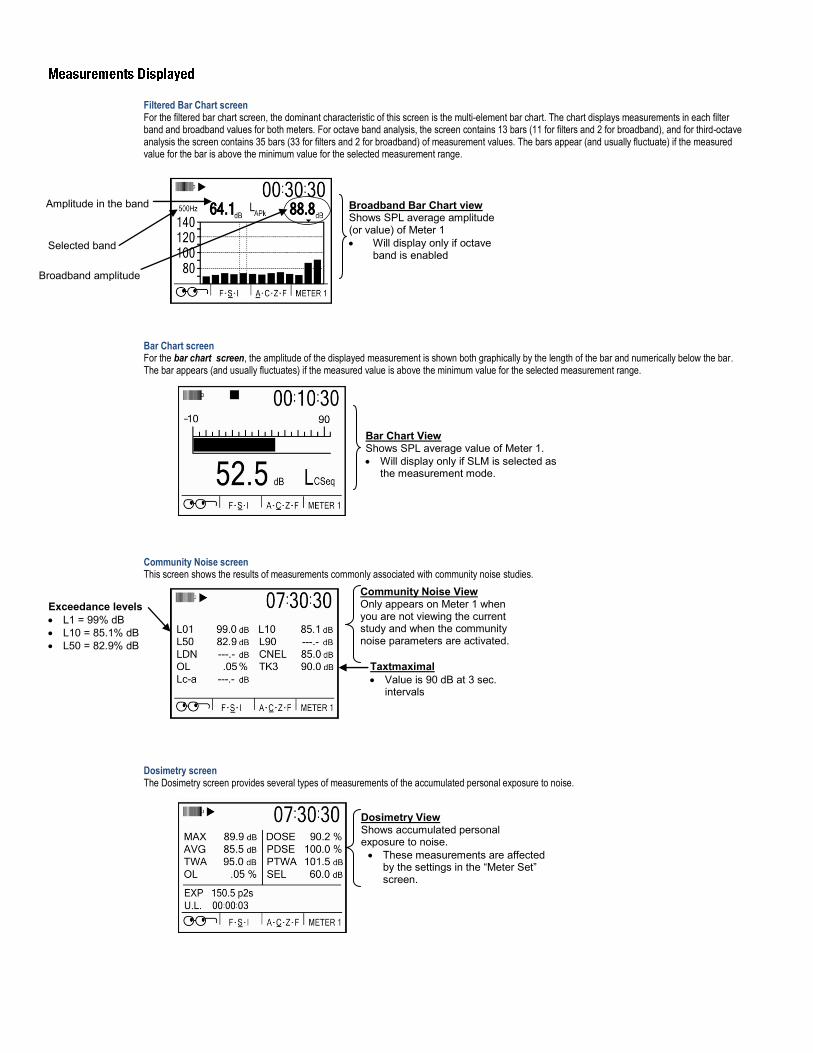
Filtered Bar Chart screen For the filtered bar chart screen, the dominant characteristic of this screen is the multi-element bar chart. The chart displays measurements in each filter band and broadband values for both meters. For octave band analysis, the screen contains 13 bars (11 for filters and 2 for broadband), and for third-octave analysis the screen contains 35 bars (33 for filters and 2 for broadband) of measurement values. The bars appear (and usually fluctuate) if the measured value for the bar is above the minimum value for the selected measurement range.
Bar Chart screen For the bar chart screen, the amplitude of the displayed measurement is shown both graphically by the length of the bar and numerically below the bar. The bar appears (and usually fluctuates) if the measured value is above the minimum value for the selected measurement range.
Community Noise screen This screen shows the results of measurements commonly associated with community noise studies.
Dosimetry screen The Dosimetry screen provides several types of measurements of the accumulated personal exposure to noise.
Broadband amplitude
Amplitude in the band
Selected band
Broadband Bar Chart view Shows SPL average amplitude (or value) of Meter 1
Will display only if octave band is enabled
Bar Chart View Shows SPL average value of Meter 1.
Will display only if SLM is selected as the measurement mode.
Community Noise View Only appears on Meter 1 when you are not viewing the current study and when the community noise parameters are activated.
Exceedance levels
L1 = 99% dB
L10 = 85.1% dB
L50 = 82.9% dB
Taxtmaximal
Value is 90 dB at 3 sec. intervals
Dosimetry View Shows accumulated personal exposure to noise.
These measurements are affected by the settings in the “Meter Set” screen.
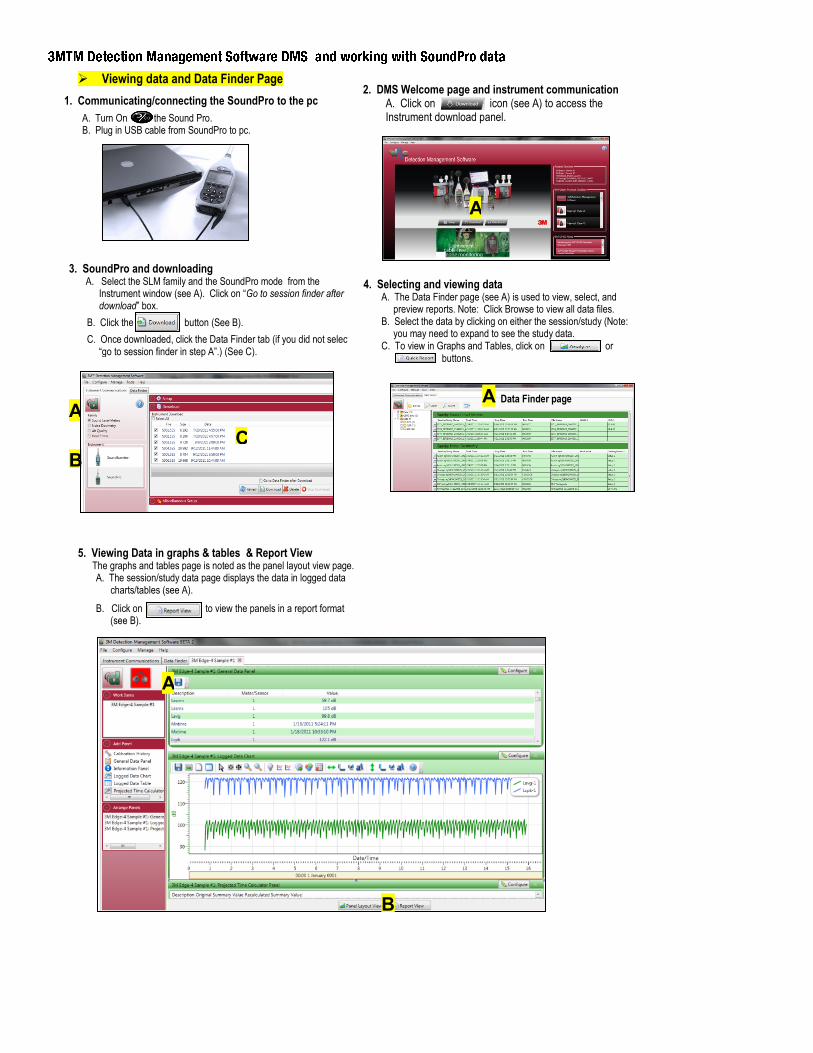
Viewing data and Data Finder Page
1. Communicating/connecting the SoundPro to the pc
A. Turn On the Sound Pro. B. Plug in USB cable from SoundPro to pc.
3. SoundPro and downloading A. Select the SLM family and the SoundPro mode from the
Instrument window (see A). Click on “Go to session finder after download” box.
B. Click the button (See B).
C. Once downloaded, click the Data Finder tab (if you did not select “go to session finder in step A”.) (See C).
A
2. DMS Welcome page and instrument communication A. Click on icon (see A) to access the Instrument download panel.
4. Selecting and viewing data A. The Data Finder page (see A) is used to view, select, and
preview reports. Note: Click Browse to view all data files. B. Select the data by clicking on either the session/study (Note:
you may need to expand to see the study data. C. To view in Graphs and Tables, click on or buttons.
B
A Data Finder page
A
5. Viewing Data in graphs & tables & Report View The graphs and tables page is noted as the panel layout view page.
A. The session/study data page displays the data in logged data charts/tables (see A).
B. Click on to view the panels in a report format (see B).
A
B
C
Personal Safety Division3M Detection SolutionsISO 9001 Registered CompanyISO 17025 Accredited Calibration Lab1060 Corporate Center DriveOconomowoc, WI 53066Customer Service: 262-567-9157Toll Free: 800-245-0779
3M and SoundPro are trademarks of 3M Company, used under license in Canada. Please recycle. Printed in USA.© 2013 3M CompanyAll rights reserved.053-776 Rev.A., 6/13
About Us 3M Detection Solutions is a world class manufacturer of rugged, reliable instrumentation and software systems that help monitor and evaluate occupational and environmental health and safety hazards, including noise dosimetry, sound level monitoring, heat stress, indoor air quality and select toxic/combustible gases. The 3M Detection brand of instrumentation is used by safety and industrial hygiene professionals to help comply with applicable occupational standards and regulations.
About 3M Personal Safety3M offers a comprehensive, diverse portfolio of Personal Safety solutions providing respiratory protection, hearing protection, fall protection, reflective materials for high visibility, protective clothing, protective eyewear, head and face protection, welding helmets, and other adjacent products and solutions such as tactical safety equipment, detection, monitoring equipment, active communications equipment and compliance management. In 2012, 3M celebrated 40 years of safety leadership – recognizing the company’s respiratory and hearing protection solutions introduced in 1972. Visit www.3M.com/PPESafety or http://m.3m.com/PPESafety