SOT ANNUAL REPORT FOR 2006 RSMC, EXETER MONITORING REPORTS · SOT ANNUAL REPORT FOR 2006 . RSMC,...
9
SOT ANNUAL REPORT FOR 2006 RSMC, EXETER MONITORING REPORTS (Submitted by Colin Parrett, UK MetOffice) This document provides information on the data quality monitoring conducted by the Regional Specialized Meteorological Centre (RSMC Exeter) operated by the United Kingdom MetOffice which has now been extended to include data timeliness information. 1. Monitoring the quality and timeliness of VOS observations 1.1 The Met Office (RSMC Exeter), as WMO-designated lead centre for monitoring the quality of surface marine meteorological data (observations from ships, buoys and other in situ marine platforms), compares observations from individual platforms with the Met Office’s global model background 6-hour forecast fields for each variable. Platforms for which the observed values differ from the background by a significant amount are flagged as suspect. 1.2 Monthly lists of suspect platforms are sent to the WMO Secretariat (a recent suspect list for ships, fixed buoys and platforms, dated December 2006, is attached at Annex A for information). These lists are also exchanged among the 4 lead monitoring centres (Met Office, JMA, NCEP and ECMWF), and other centres, for comparison. Generally there is considerable agreement between the different centres, both in terms of suspect platforms and mean and standard deviation of differences from the background field. Since SOT-III, these monthly lists have been made available via the Met Office web site at : http://www.metoffice.gov.uk/research/nwp/observations/monitoring/index.html Examples of the website content together with an extract from the suspect monitoring list for December 2006 are attached at Annex B. It will be noted that each suspect ship can now be linked to a QC plot covering the previous month, showing time-series of observation-background values. Two examples are shown: the first plot shows a temporary bias in pressure and the second shows a more persistent but variable bias in relative humidity. (N.B. The plots of pressure currently show the values after any corrections have been applied at the Met Office.) 1.3 Initially only mean sea level pressure was monitored, but wind speed, wind direction, sea surface temperature, air temperature and relative humidity have also been added to the information being exchanged on a monthly basis. The current monitoring criteria for the 6 variables are shown in Annex A. The meeting is invited to confirm that the monitoring criteria continue to be set at the correct levels. 1.4 The Met Office also produces monthly lists of monitoring statistics for the VOS fleets recruited by certain countries. To maintain up to date lists of the VOS fleets for each country concerned, the Met Office now uses WMO Pub 47, which should currently be updated quarterly. However, to ensure that recently recruited VOS vessels are also included, the Met Office also receives monthly fleet updates from a number of countries. These national lists would not be needed if the Pub 47 list could be updated monthly in the future. The Team is therefore invited to consider whether the frequency of Pub 47 procedures should be revised to allow countries to make monthly metadata submissions. This would help to ensure that observational problems can be dealt with in a more prompt manner. (N.B. At the time of writing, the Pub47 list has not been updated for 9 months, between June 2006 and March 2007.) 1.5 National focal points are now notified when the latest VOS monthly monitoring reports and suspect lists become available on the Met Office website by means of an email sent by the Met Office to the SOT, VOS and PMO mailing lists, which are maintained by JCOMMOPS. It is important therefore that focal points wishing to receive this monitoring information check that their JCOMMOPS mailing list information is kept up to date. However, the monthly monitoring statistics continue to be emailed directly to major VOS operating countries, and as mentioned in reports to previous SOT meetings, any other national focal points who may wish to receive directly emailed copies of the monthly monitoring lists or ‘suspect’ ship lists should advise the Met Office of their email address. 1.6 Every 6 months more detailed monitoring reports, for all platforms, are also produced and made
Transcript of SOT ANNUAL REPORT FOR 2006 RSMC, EXETER MONITORING REPORTS · SOT ANNUAL REPORT FOR 2006 . RSMC,...

SOT ANNUAL REPORT FOR 2006
RSMC, EXETER MONITORING REPORTS
(Submitted by Colin Parrett, UK MetOffice) This document provides information on the data quality monitoring conducted by the Regional Specialized Meteorological Centre (RSMC Exeter) operated by the United Kingdom MetOffice which has now been extended to include data timeliness information. 1. Monitoring the quality and timeliness of VOS observations 1.1 The Met Office (RSMC Exeter), as WMO-designated lead centre for monitoring the quality of surface marine meteorological data (observations from ships, buoys and other in situ marine platforms), compares observations from individual platforms with the Met Office’s global model background 6-hour forecast fields for each variable. Platforms for which the observed values differ from the background by a significant amount are flagged as suspect. 1.2 Monthly lists of suspect platforms are sent to the WMO Secretariat (a recent suspect list for ships, fixed buoys and platforms, dated December 2006, is attached at Annex A for information). These lists are also exchanged among the 4 lead monitoring centres (Met Office, JMA, NCEP and ECMWF), and other centres, for comparison. Generally there is considerable agreement between the different centres, both in terms of suspect platforms and mean and standard deviation of differences from the background field. Since SOT-III, these monthly lists have been made available via the Met Office web site at :
http://www.metoffice.gov.uk/research/nwp/observations/monitoring/index.html
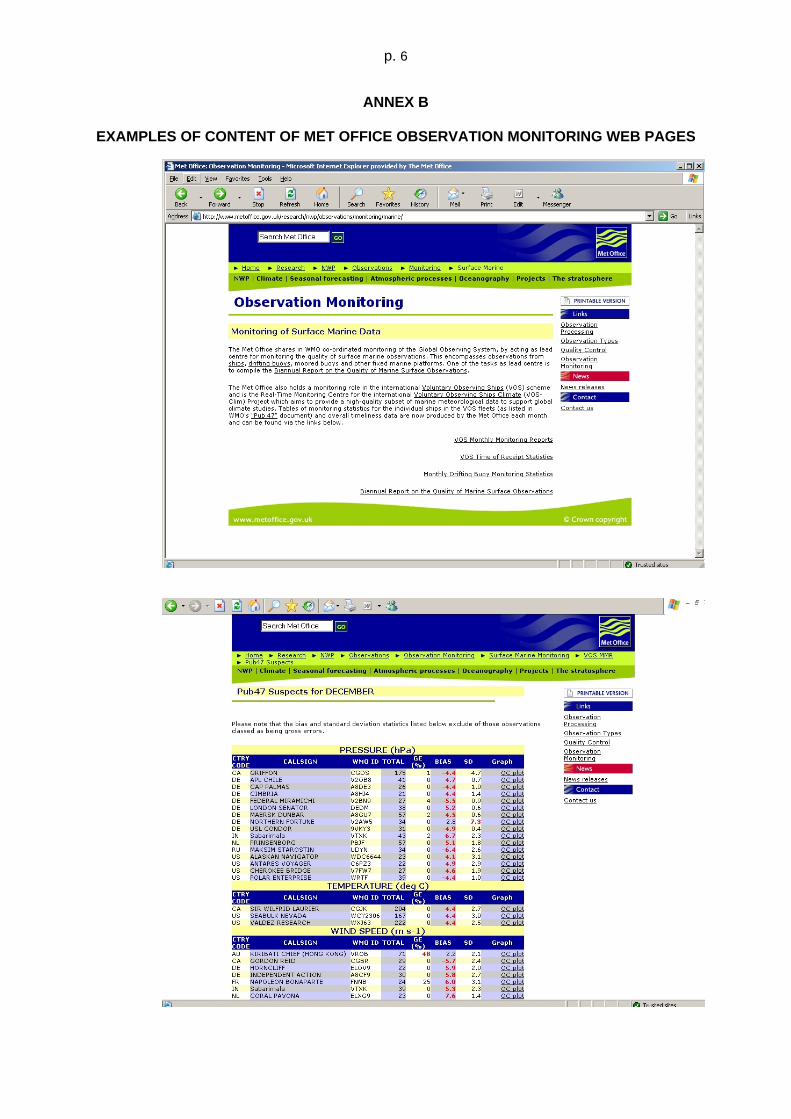
Examples of the website content together with an extract from the suspect monitoring list for December 2006 are attached at Annex B. It will be noted that each suspect ship can now be linked to a QC plot covering the previous month, showing time-series of observation-background values. Two examples are shown: the first plot shows a temporary bias in pressure and the second shows a more persistent but variable bias in relative humidity. (N.B. The plots of pressure currently show the values after any corrections have been applied at the Met Office.) 1.3 Initially only mean sea level pressure was monitored, but wind speed, wind direction, sea surface temperature, air temperature and relative humidity have also been added to the information being exchanged on a monthly basis. The current monitoring criteria for the 6 variables are shown in Annex A. The meeting is invited to confirm that the monitoring criteria continue to be set at the correct levels. 1.4 The Met Office also produces monthly lists of monitoring statistics for the VOS fleets recruited by certain countries. To maintain up to date lists of the VOS fleets for each country concerned, the Met Office now uses WMO Pub 47, which should currently be updated quarterly. However, to ensure that recently recruited VOS vessels are also included, the Met Office also receives monthly fleet updates from a number of countries. These national lists would not be needed if the Pub 47 list could be updated monthly in the future. The Team is therefore invited to consider whether the frequency of Pub 47 procedures should be revised to allow countries to make monthly metadata submissions. This would help to ensure that observational problems can be dealt with in a more prompt manner. (N.B. At the time of writing, the Pub47 list has not been updated for 9 months, between June 2006 and March 2007.) 1.5 National focal points are now notified when the latest VOS monthly monitoring reports and suspect lists become available on the Met Office website by means of an email sent by the Met Office to the SOT, VOS and PMO mailing lists, which are maintained by JCOMMOPS. It is important therefore that focal points wishing to receive this monitoring information check that their JCOMMOPS mailing list information is kept up to date. However, the monthly monitoring statistics continue to be emailed directly to major VOS operating countries, and as mentioned in reports to previous SOT meetings, any other national focal points who may wish to receive directly emailed copies of the monthly monitoring lists or ‘suspect’ ship lists should advise the Met Office of their email address. 1.6 Every 6 months more detailed monitoring reports, for all platforms, are also produced and made

p. 2
available to the WMO Secretariat via the Met Office web site. The statistics relating to suspect VOS operated by specific members are extracted from the report and distributed by the Secretariat to national focal points for the members concerned, under a covering letter requesting that remedial action be taken to correct the problems. Paper copies of the 6-month report are also circulated by the Met Office, but they no longer contain the individual time-series plots for each suspect platform, which made the report very bulky; the general overview and statistics are deemed to be more useful on this time-scale, although the time-series are still available from the Met Office web site. The most recent version of the biannual report on the quality of marine surface observations can be found at:
http://www.metoffice.gov.uk/research/nwp/observations/monitoring/marine/Biannual/index.html
1.7 Timeliness information for VOS reports received at the Met Office is now also being made available from our web site at
http://www.metoffice.gov.uk/research/nwp/observations/monitoring/marine/TOR/index.html,
where there is a table summarising the data timeliness for each country as well as graphs showing the timeliness of all VOS ships and for the main VOS operating countries. A graphical example for December 2006 data is shown in Annex C, where it can be seen from the upper graph that the majority of ship reports were received promptly, with over 40% received within 30 minutes and 90% within 90 minutes of the observation time. The cut-off time for operational NWP global data assimilation is typically 90-150 minutes after the analysis times of 00, 06, 12 and 18 UTC, so at least 90% of global VOS data should be received in time to be assimilated. Timeliness information for individual call-signs on the Pub47 list is also available from the website.
_____________

p. 3
ANNEX A
EXAMPLE OF MONTHLY SUSPECT LIST
MONITORING OF MARINE SURFACE OBSERVATIONS MONTHLY SUSPECT LIST - SHIPS, FIXED BUOYS AND PLATFORMS
MONITORING CENTRE: EXETER MONTH: DECEMBER 2006
Monitoring procedures Period :One calendar month. Data monitored :Reports from each unique identifier for ships, fixed buoys and platforms. Standard of comparison :Background field from Exeter global model. Observation times :All hours Elements monitored :Mean sea level pressure (hPa). :Wind speed (ms-1). :Wind direction (degrees). :Air temperature (oC). :Relative Humidity (%). :Sea surface temperature (oC). Parameters monitored NOBS :Number of observations received, excluding duplicates. %GE :Percentage of observations with gross errors. %REJ :Percentage of observations flagged, excluding those with gross errors. SD :SD of difference of observations from background values, excluding those with gross errors. BIAS :Mean difference of observations from background values, excluding those with gross errors (N.B. a positive bias indicates the wind observation is veered to the background). RMS :Root Mean Square difference of observations from background values, excluding those with gross errors. GROSS ERROR LIMIT :15 hPa (pressure) :25 ms-1 (vector wind) :15 oC (air temperature) :50% (relative humidity) :10 oC (sea surface temperature) SELECTION CRITERIA :NOBS >= 20 , and one or more of the following: 1.Bias >= 4 hPa (pressure) >= 5 ms-1 (wind speed) >= 30 degrees (direction) >= 4 oC (air temperature) >= 15% (relative humidity) >= 3 oC (SST) 2.SD >= 6 hPa (pressure) >= 80 degrees (direction) >= 6 oC (air temperature) >= 25% (relative humidity) >= 5 oC (SST) 3.PGE >= 25 N.B. Observations of wind direction are only included in the wind direction statistics if the observed OR background wind speed > 5 ms-1
IDENTIFIER ELEM NOBS %GE %REJ SD BIAS RMS 62147 P 60 0 93 1.7 -4.6 4.9 9VKY3 P 31 0 52 0.7 -5.1 5.2

p. 4
A8DE3 P 26 0 100 1.4 -4.5 4.7 A8GU7 P 58 2 2 0.7 4.4 4.4 A8HJ4 P 21 0 76 1.7 4.5 4.8 C6FZ6 P 33 0 0 1.2 8.6 8.7 C6PZ3 P 22 0 18 3.5 4.8 6.0 CGDS P 175 1 100 3.8 -5.1 6.3 DEDM P 38 0 66 0.6 4.9 4.9 KS049 P 219 0 0 1.1 -4.2 4.4 LADC2 P 28 36 86 7.2 -6.4 9.6 MLTH5 P 27 0 70 3.4 -4.7 5.8 PBJF P 57 0 65 2.1 4.9 5.3 TEST P 218 100 100 TESTCA7 P 131 0 100 0.7 -11.7 11.7 UCFT P 50 2 12 2.3 -4.3 4.9 UDYN P 34 0 85 2.7 -6.4 7.0 UGOU P 57 0 47 2.9 -4.7 5.5 UICO P 30 20 53 6.1 3.0 6.8 V2AW5 P 34 0 79 9.8 2.4 10.1 V2BN9 P 27 4 4 1.1 -5.7 5.8 V2OB8 P 41 0 41 0.9 4.3 4.4 V7BX3 P 20 0 20 2.2 4.2 4.7 V7FW7 P 27 0 44 2.7 4.3 5.0 VTXK P 43 2 84 2.7 6.6 7.1 WMLG P 28 0 100 6.0 3.1 6.8 WRTF P 39 0 49 1.1 -4.6 4.7 IDENTIFIER ELEM NOBS %GE %REJ SD BIAS RMS 4XGU SPEED 43 2 67 3.5 5.1 6.2 62108 SPEED 727 21 71 3.9 -9.6 10.3 A8CF9 SPEED 30 10 100 4.8 5.4 7.2 C6FN4 SPEED 28 0 4 2.7 5.1 5.8 ELOV9 SPEED 22 9 50 4.4 6.1 7.5 ELXG9 SPEED 23 0 17 3.3 8.5 9.1 FNNB SPEED 32 53 69 4.9 2.3 5.4 OUSE6 SPEED 22 0 14 2.9 5.2 6.0 OWFU2 SPEED 23 35 100 3.6 4.5 5.8 OXRA6 SPEED 33 3 9 2.3 5.1 5.6 PBHU SPEED 31 39 52 4.1 6.4 7.6 SCKM SPEED 21 0 43 3.7 6.8 7.7 VROB SPEED 110 40 62 4.8 2.9 5.6 VTXK SPEED 43 5 65 4.4 5.1 6.7 WQZ9670 SPEED 34 0 0 2.9 5.2 6.0 IDENTIFIER ELEM NOBS %GE %REJ SD BIAS RMS 23173 DIRN. 55 0 0 63.5 141.3 154.9 42362 DIRN. 1194 0 0 32.8 -37.0 49.5 53057 DIRN. 53 0 0 17.5 ***** 126.5 62108 DIRN. 235 66 0 103.6 -22.1 106.0 62116 DIRN. 477 0 0 12.1 35.3 37.3 DCUJ2 DIRN. 33 6 0 95.6 9.1 96.0 FNNB DIRN. 25 68 0 46.7 25.6 53.2 OWFU2 DIRN. 22 36 0 16.4 4.3 16.9 PBHU DIRN. 30 40 0 36.4 0.1 36.4 UCUC DIRN. 42 0 0 25.2 -31.7 40.5 UDYN DIRN. 22 0 0 17.7 -51.4 54.4 VROB DIRN. 68 65 0 68.6 1.8 68.6

p. 5
VRY09 DIRN. 52 0 0 83.1 -30.2 88.4 VRYO9 DIRN. 34 0 0 91.1 5.6 91.2 IDENTIFIER ELEM NOBS %GE %REJ SD BIAS RMS
44140 T 707 0 100 2.0 5.4 5.7 46088 T 1441 0 100 1.8 5.9 6.2 46131 T 672 0 100 1.4 6.2 6.3 46146 T 720 0 100 1.6 5.8 6.0 CGJK T 210 0 100 2.9 4.3 5.1 TEST T 218 100 100 UCFT T 50 0 100 1.7 -4.6 5.0 WCY2306 T 170 0 100 2.9 4.4 5.3 WXJ63 T 224 0 100 2.6 4.4 5.1 IDENTIFIER ELEM NOBS %GE %REJ SD BIAS RMS 62301 RH 709 13 100 18.2 -15.7 24.1 A8IF4 RH 32 0 100 10.4 19.1 21.7 A8IY9 RH 23 0 100 13.0 19.0 23.1 DACF RH 485 9 100 11.5 -25.0 27.5 ELWX5 RH 189 40 100 18.2 -25.8 31.6 ELXT8 RH 44 0 100 14.4 17.4 22.6 LADY5 RH 32 0 100 13.2 16.4 21.0 MSHE2 RH 57 0 100 8.3 18.2 20.1 OVOT2 RH 104 1 100 8.7 16.6 18.8 OVYA2 RH 44 9 100 10.2 -28.5 30.3 PHET RH 118 3 100 13.8 -17.0 21.9 PMSA RH 54 0 100 10.2 15.3 18.4 VQGQ4 RH 45 0 100 12.2 17.5 21.3 VRVN6 RH 26 0 100 8.8 20.2 22.0 IDENTIFIER ELEM NOBS %GE %REJ SD BIAS RMS 41035 SST 1086 0 89 0.9 -4.1 4.2 41112 SST 1096 0 90 0.6 -3.5 3.5 42007 SST 549 0 93 0.7 -4.0 4.1 44140 SST 523 0 88 1.1 -3.0 3.2 C6IO9 SST 34 0 97 2.6 -3.2 4.1 C6UG4 SST 31 0 100 2.0 -3.3 3.9 DGGV SST 40 0 5 0.7 3.0 3.1 DNDD SST 34 0 100 0.6 3.3 3.4 LADC2 SST 29 0 55 5.1 -1.3 5.2 TEST SST 216 100 100 V2AW5 SST 26 4 100 2.9 -5.8 6.4 V7BW8 SST 37 0 100 0.8 -4.4 4.4 V7IP9 SST 45 0 100 1.4 -7.0 7.1 VRBH8 SST 23 4 30 1.6 -3.0 3.4 WAAH SST 67 0 100 1.1 3.1 3.3 WCY2306 SST 115 0 84 0.6 -3.9 3.9 WDB9444 SST 29 0 45 2.4 3.3 4.1 WZJD SST 46 0 100 1.9 -4.0 4.4
p. 6
ANNEX B
EXAMPLES OF CONTENT OF MET OFFICE OBSERVATION MONITORING WEB PAGES

p. 7
Examples of QC Plots – for Pressure (top) and Humidity (below)

p. 8
ANNEX C
TIMELINESS OF VOS OBSERVATIONS RECEIVED AT THE MET OFFICE (UK) DEC 2006

p. 9